Abstract
With the increasingly prominent environmental problems in the world today, the development of an integrated energy system and the introduction of a carbon-trading mechanism have become important means to realize the low carbonization of the energy industry. Based on this, this paper introduces the carbon-trading mechanism into the research on the optimal dispatch of an integrated energy system. The mechanism of integrated energy demand response participating in low-carbon economic dispatch is analyzed. The relationship between carbon emissions and carbon-trading price in carbon-trading mechanism is described. On the basis of considering the commodity attributes of the electricity and gas load and the flexible supply characteristics of the thermal load, an incentive-type comprehensive energy demand response model is established. Finally, aiming at the lowest comprehensive operating cost, a comprehensive energy system model considering the power balance and equipment constraints of the electric–gas–heat system is established, using an improved particle swarm algorithm to solve it. Simulations verify the effectiveness of the proposed method in reducing the carbon emissions and operating costs of integrated energy systems.
1. Introduction
In recent years, with the development of society and the continuous exploitation of fossil fuels, global warming caused by carbon emissions has become the focus of global attention. Therefore, countries around the world have put forward higher green energy requirements for the energy industry [1]. In 2022, the carbon emissions of China’s power industry will account for more than 40% of the country’s carbon emissions. Reducing the carbon emissions of the power industry is an important part of achieving the dual carbon goals [2,3]. Therefore, it has become the consensus of all countries in the world to promote the tight coupling of multi-energy systems, reduce the consumption of fossil fuels, and increase the access ratio of clean energy [4].
An Integrated Energy System (IES) coordinates and optimizes energy generation, transmission, distribution, conversion, storage, and consumption. It integrates various energy sources, such as cold, thermal, electricity, natural gas, etc. The deep integration between different energy systems has promoted the large-scale utilization of renewable energy. It is one of the important technical means to achieve emission reduction targets [5,6,7]. At present, some progress has been made in the research of an IES scheduling operation and model method considering energy saving and emission reduction. The authors in [8,9] conducted a refined analysis of the user demand side, established a response model for the reducible load, transferable load, and replaceable load, and introduced the flexible characteristics of load into the integrated energy system dispatch strategy. Researchers [10,11] have also considered the schedulable characteristics of electrical thermal load, aimed at the minimum comprehensive operating cost and minimum load adjustment of the IES, respectively, which proves that a comprehensive demand response can more effectively reduce the amount of abandoned wind and light than a single demand response. In [12,13], a mathematical model of the natural gas time-of-use price and the thermal energy load response, by analogy to the peak-valley time-of-use price strategy of electricity load, was established. It was proved that considering the electrical thermal load demand response can achieve a better peak shaving and valley filling effect than considering the single load response. References [14,15] incorporated the user’s demand for cooling, heating, and electric power into the scope of the demand response on the basis of a traditional demand response, further tapping into the user’s demand response potential, changing the user’s energy consumption strategy and effectively alleviating the power shortage.
In terms of carbon emissions, [16,17,18] analyzed the principles of a ladder-type carbon trading and traditional carbon trading, and introduced them into the electricity–gas–heat integrated energy system. It proves the rationality of introducing a low-carbon economic dispatch of the integrated energy system into the carbon-trading mechanism. Reference [17] used energy storage and pumped hydro storage as composite energy storage components, used energy storage to smooth the output fluctuations of new energy sources, and introduced a carbon-trading mechanism to reduce the carbon emissions of the power system. The authors in [19,20] studied the energy flow between multi-energy hubs and the distribution of CO2 in the power grid and natural gas network. References [21,22] studied the dispatch strategy of the integrated energy system of electricity–heat–gas co-generation under the ladder carbon price. In [23,24], the transmission system of the power system to trace the source of the user-side power and evaluate its carbon emission intensity was combined. However, the current carbon emissions calculation for the integrated energy system mainly considers the carbon emissions of various types of generator sets, ignoring the beneficial effect of power-to-gas (P2G) equipment on reducing carbon emissions.
The main contributions of this paper are as follows:
- (1)
- A comprehensive energy demand response scheduling model based on carbon trading is established. The carbon-trading mechanism is introduced into the source side of the electricity–gas–heat integrated energy system for centralized dispatching, adjusting the generator output through an integrated energy demand response, economizing the carbon emissions of the generator sets through a carbon-trading mechanism, and realizing the low-carbon economic operation of the integrated energy system.
- (2)
- Further, we explore the dispatchable resources on the load side of the integrated energy system. A demand response model based on price incentives for electric load and gas load and a flexible adjustment model for thermal load are established. Using the energy conversion equipment in the IES, the three loads—electricity, gas, and thermal—are coupled and complementary, realizing the mutual replacement of the three loads in the longitudinal direction.
The remainder of this paper is organized as follows: Section 2 introduces the role and incentives of the integrated energy demand response to participate in the low-carbon economic dispatch of the integrated energy system; Section 3 introduces the role of carbon-trading mechanisms in the integrated energy system; Section 4 establishes an integrated energy demand response model; Section 5 establishes a comprehensive energy demand response scheduling model based on carbon trading; Section 6 carries out simulation verification to prove the validity of the proposed method; and Section 7 gives the final conclusion.
2. The Mechanism of Integrated Energy Demand Response Participating in Low-Carbon Economic Dispatch
This paper incorporates carbon trading into the integrated energy system, and the constructed energy hub model is shown in Figure 1. The purple, blue, and red lines represent the flow of electricity, natural gas, and thermal energy flows, respectively. On the energy supply side, there are natural gas networks, coal-fired units, and wind turbines. There are electrical, gas, and thermal loads on the load side. The coupling equipment between electricity and gas includes a gas turbine and P2G. The coupling equipment between electricity and thermal includes electric boilers and heat pumps. The coupling equipment between the gas and thermal has a gas boiler.
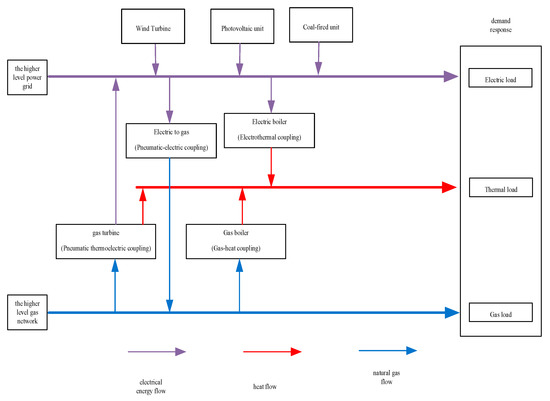
Figure 1.
Integrated energy hub model.
In this paper, the carbon-trading mechanism and integrated energy demand response are introduced into the integrated energy system, which is beneficial to reduce the carbon emission and energy cost of the system. First of all, the introduction of carbon trading makes the carbon cost factor added to the dispatch mode, allowing the system to realize the coordination between low carbon and economy. Secondly, a comprehensive energy response model is introduced under the carbon-trading model. On the one hand, it can promote users to actively adjust the load, so that the power system can reduce the power supply during the peak load period. The gas thermal load can be converted into electrical load when the wind power is large, and the amount of abandoned air in the system can be reduced. For the integrated energy system, it can reduce the overall energy demand and reduce carbon emissions. On the other hand, the carbon emissions of units can be fully considered when dispatching the load for a demand response. Support units with lower carbon emissions are given priority regarding output.
3. Carbon-Trading Mechanism
The essence of carbon trading is to establish a legal carbon trading market and allow enterprises with carbon emissions to participate in the market, trade carbon emission rights through the market, and use economic means to reduce carbon dioxide emissions. The comprehensive energy system established in this paper mainly includes three energy forms: electricity, gas, and heat. The power sources include conventional power sources dominated by coal power and gas turbines, and new energy sources dominated by wind power and photovoltaics.
3.1. Carbon Emissions and Carbon Emission Quotas
The following is an analysis of the carbon emissions and carbon emission quotas of each unit:
- (1)
- Coal-fired unit
The carbon emissions of coal-fired units are related to their output power:
where is the carbon emissions of the -th coal-fired unit, is the total number of periods in a day, is the generating power of the -th coal-fired unit at the time , and , , and are the carbon emission factors of coal-fired units.
The carbon emission allowances for the coal-fired units are
where is the carbon emission quota for the -th coal-fired unit, is the carbon emission allowance coefficient of the coal-fired units, and is the generating power of the -th coal-fired unit at the time gas turbine.
The carbon emissions of gas turbines can be calculated based on the total power supply. The total power supply is equal to the sum of the electricity converted from the heat supply and the original power supply:
where is the carbon emissions of the -th gas turbine at time , is the power generation of gas turbine at time , is the output heat of gas turbine at time , is the unit carbon emission intensity of the gas turbine, and is the conversion factor of heat.
Its carbon emission allowances are
where is the carbon emission allowance of gas unit , is the power supply of gas turbine at the time , is the conversion factor of heat, is the carbon emission quota coefficient of the gas-fired units, and is the output heat of gas turbine at time .
- (2)
- Gas boiler
For gas-fired boilers, the carbon emissions are calculated based on the heating power:
where is the carbon emission of the -th gas boiler, is the gas flow of the -th gas boiler at the time , and is the unit carbon emission intensity of gas boilers.
Its carbon emission allowances are
where is the carbon emission quota for the -th gas boiler, is the carbon emission quota coefficient of the gas-fired units, and is the gas flow of the -th gas boiler at the time .
- (3)
- P2G equipment
The carbon emissions of the P2G equipment are
where is the carbon emissions of the -th P2G device, is the input power of the -th P2G device at the time , is the unit carbon emission intensity of P2G equipment.
- (4)
- New energy unit
The carbon emission intensity of the wind turbines and photovoltaic units is 0, so their carbon emissions are 0, and they do not participate in carbon emissions market transactions.
In summary, the free carbon emission allowance in IES is
where is the carbon emission quota for the -th coal-fired unit, is the carbon emission allowance of gas unit , and is the carbon emission quota for the -th gas boiler.
The actual carbon emissions of IES are calculated by the following formula:
where is the actual carbon emissions of IES, is the carbon emission quota for the -th coal-fired unit, is the carbon emission allowance of gas unit , is the carbon emission quota for the -th gas boiler, and is the carbon emission of the -th P2G device.
3.2. Ladder-Type Carbon-Trading Mechanism
At present, the main carbon trading mechanisms include traditional carbon trading and ladder-type carbon trading. In order to better achieve the "dual carbon" goal, this paper adopts a tiered carbon transaction cost calculation model. First, the carbon emission quota of each generator set is calculated, and then the growth interval and growth rate of carbon transaction cost are specified based on this. The higher the carbon emission, the higher the corresponding carbon trading price. The formula for calculating the cost of ladder-type carbon trading is as follows:
where is the cost of carbon trading, is the carbon-trading price in the market, is the growth rate of the carbon-trading price of each tier, is the length of the carbon emission interval, is the free carbon emission quota in IES, and is the actual carbon emissions of IES.
4. Integrated Energy Demand Response Model
In the IES constructed in this paper, the load includes three forms of load: electrical load, gas load, and thermal load. Among them, electric load and gas load have market commodity attributes, and thermal load has adjustable characteristics. Therefore, the gas load and thermal load can also participate in the comprehensive energy demand response for optimal adjustment. Based on the adjustability of the electricity, gas, and thermal load, this paper establishes demand response models for electricity, gas, and thermal loads, respectively. The transfer of three loads in lateral time is realized. In addition, the energy conversion equipment in the IES is used to couple and complement the three loads of electricity, gas, and thermal, and realize the mutual substitution of the three loads in the longitudinal direction.
4.1. Electric Load Demand Response
In this paper, the load of electric power users is divided into the rigid electric load, translatable electric load, and reducible electric load, and the user is compensated according to the change in the electric load. The rigid electrical load is an unchangeable part of the electrical load and does not participate in the demand response. Translatable load can shift a portion of the load from one time period to another within a specific range, and reducible load is the load that can be directly reduced. Translatable electrical load and reducible electrical load can participate in demand response.
The electric load demand response model is as follows:
where , , , and are the rigid load, the translatable load, the reducible load, and the load after the demand response of the electrical load at time , respectively. is the power consumption of the electric heating at time . and are the minimum electrical load and the maximum electrical load that the power user can bear at time , respectively.
The translatable electrical load model is as follows:
where is the displacement of the electrical load at the time . is the upper limit of the electrical load shift in the t period. The upper limit of the shiftable load in this paper is set to 20% of the electrical load before the demand response.
The load reduction model is as follows:
where is the maximum value that can reduce the electrical load. One temporarily sets the maximum value of the electric load that can be reduced to 10% of the electric load before the demand response.
4.2. Gas Load Demand Response
Gas load demand response is similar to electrical load. In this paper, the load of natural gas users is also divided into rigid gas load, translatable gas load, and reducible gas load. The gas load demand response model is as follows:
where , , , and are the rigid gas load, the translatable gas load, the reducible gas load, and the load after demand response of the gas load in the t period, respectively. and are the minimum gas load and the maximum gas load that the power user can bear in the t period, respectively.
The translatable gas load model is as follows:
where is the displacement of the gas load at the time t. is the upper limit of the gas load translation in the t period. The upper limit of the shiftable load in this paper is set to 30% of the electrical load before the demand response.
The reduced gas load model is as follows:
where is the maximum value that can reduce the gas load. One temporarily sets the maximum gas load reduction possible to 10% of the electric load before the demand response.
4.3. Thermal Load Demand Response
The thermal load considered in this paper is mainly the residential load. Residential thermal load has perceptual ambiguity; that is, thermal load users are less sensitive to temperature. When the temperature is within a certain range, it does not affect the user’s comfort. Therefore, changing the heat supply during the comfort period does not have much effect on the user. Starting from this characteristic, this paper regards the thermal load as an adjustable load to participate in the dispatching of the regional comprehensive energy system [25].
The expression of the relationship between the indoor temperature change of the building, the heating power, and the ambient temperature is
where is the indoor temperature of the building at the time , is the outdoor temperature at the time , is the equivalent thermal resistance of the building, the unit being °C/Kw, is the indoor air heat capacity (kW·h)/°C, and is the heating power of the building at the time .
Referring to Equations (21) and (22), the relational formula for calculating the thermal power from indoor temperature change is
According to the temperature range of human comfort, the indoor temperature has the following constraints:
where and are the lowest indoor comfortable temperature and the highest temperature, and is the indoor temperature of the building at time , the unit being °C.
5. Optimal Dispatch Model of Integrated Energy Demand Response Based on Carbon Trading
In order to take into account the low-carbon performance and economy of the system’s power generation process, this paper takes the optimal comprehensive cost of the system as the objective function, and considers the constraints of each unit and component to construct a low-carbon economic dispatch model.
5.1. Objective Function
The goal of economic dispatch of the integrated energy system is to achieve the lowest operating cost while meeting the demand for electricity, gas, and heat in the system. The objective function of the model can be expressed as
where is the cost of generating electricity for conventional units, including the cost of generating electricity from coal-fired units and gas turbines, is the cost of generating electricity from wind turbines, is the demand response cost, is the cost of purchased natural gas, and is the cost of carbon trading.
The power generation cost of a conventional unit can be expressed as
where , , and are the cost coefficients of the coal-fired units, and is the generating power of the -th coal-fired unit at time .
The cost of wind turbine generation can be expressed as
where indicates that the output of the -th wind farm at the time is the operation and maintenance cost coefficient of wind power.
The demand response cost can be expressed as
where and are the demand response compensation coefficients of the electric load and gas load, respectively; and are the predicted values of the electric load and gas load; and and are the response values of the electrical load and gas load demand.
The cost of the purchased natural gas can be expressed as
where is the purchased natural gas volume at time , and is the price of natural gas.
5.2. Restrictions
Constraints include load balance constraints and integrated energy system component constraints.
5.2.1. Load Balance Constraint
The electrical load balance of the system can be expressed as
where , , , , and , respectively, represent the total number of wind power units, photovoltaic units, coal-fired units, gas-fired units, and P2G equipment; and , , , , and , respectively, represent the generation power of the -th unit of the wind turbine, photovoltaic unit, coal-fired unit, gas unit, and P2G equipment at time . The system gas load balance can be expressed as
where is the purchased natural gas volume at time , is the gas load of the P2G equipment at time , is the load after demand response of the gas load at time , is the conversion factor of heat, is the output heat of the gas boiler at time , is the power generation of gas turbine at time , HHV is the heating value efficiency of natural gas, and is the conversion efficiency of the gas turbine.
The system thermal load balance can be expressed as
where is the output heat of gas turbine at time , is the output heat of gas boiler at time , and is the power consumption of electric heating at time t.
5.2.2. Integrated Energy System Component Constraints
- (1)
- Coal-fired unit constraints
Coal-fired engines mainly meet the constraints of the upper and lower limits of output and the constraints of the ramp rate.
where and are the minimum and maximum output values of the -th coal-fired unit, respectively; and are the maximum down-climbing power and maximum up-climbing power of the -th coal-fired unit, respectively; is the generating power of the -th coal-fired unit at time ; and is the generating power of the -th coal-fired unit at time .
- (2)
- Gas turbine constraints
The gas turbine mainly satisfies the constraints of the upper and lower limits of output, the constraints of the ramp rate, and the constraints of the electric-to-heat ratio.
where and are the minimum and maximum output values of the -th gas turbine, respectively; is the electric–thermal ratio of the gas turbine; and are the maximum downhill power and maximum uphill power of the -th gas turbine, respectively; is the power generation of gas turbine at time ; is the power generation of gas turbine at time ; and is the output heat of gas turbine at time .
- (3)
- Wind turbine constraints
The constraints of the wind turbines mainly satisfy their maximum output constraints.
where is the power supply of wind turbine at time , and represents the predicted output value of the -th typhoon generator unit.
- (4)
- Photovoltaic unit constraints
The constraints of photovoltaic units mainly satisfy their maximum output constraints:
where is the generating power of the -th photovoltaic unit at time , and represents the predicted output value of the -th photovoltaic unit.
- (5)
- Gas boiler constraints
The gas boiler mainly meets the constraints of the upper and lower limits of the output and the constraints of the ramp rate:
where and are the minimum and maximum output values of the -th gas boiler, respectively; and and are the maximum down-climbing power and maximum up-climbing power of the -th gas boiler, respectively.
- (6)
- P2G device constraints
P2G equipment mainly meets its rated power constraints:
where is the input power of the -th P2G device at time , and is the rated power of the P2G device.
5.3. Model Solving
The comprehensive energy demand response scheduling model based on carbon trading proposed in this paper is a nonlinear programming model. Considering the global optimization ability of the improved particle swarm optimization algorithm [26,27], the particle swarm optimization algorithm was used to solve the carbon emission optimization model. The operational plan of the various units was obtained:
- (1)
- Assuming that the initial population number is 50, the position variables of the power generation of wind turbines, photovoltaic units, coal-fired units, and gas turbines at each time period are X11-X1T, X12-X2T···, the unit change amount at each time period is V, and the speed serial number is V11-V1T, V12-V2T···.
- (2)
- Calculate the objective function value, compare it with the value of the previous generation, and update the individual optimal value and the global optimal value .
- (3)
- Update the search speed and location according to the fitness of the objective function, as follows:where and are the position and velocity of the i-th particle in the -th dimension after low t iterations; represents the optimal value of particles in the -th dimension; and represent the learning factor; and and represent a random number that obeys a random distribution in the interval 0 to 1.
- (4)
- Determine whether the maximum number of iterations is reached; if so, end the calculation and output the global optimal value.
6. Case Analysis
6.1. Parameter Settings
In order to verify the effectiveness of the comprehensive energy demand response scheduling method based on carbon trading proposed in this paper, we conducted a simulation verification based on the comprehensive energy system data provided in [27,28]. The running conditions of the given scenario of the calculation example are as follows:
- (1)
- The names and installed capacity of the power plants in the integrated energy system used in this paper are shown in Table 1:
 Table 1. Power plant parameters.
See Appendix A for other parameters.
Among them, the minimum technical output of the coal-fired units is 50% of the rated capacity, and the ramp rate is the rated capacity of the unit that increases or decreases by 50% per hour. The minimum output of the gas turbine is 30% of the rated capacity, and the ramp rate is 100% of the rated capacity of the unit rising or falling every hour. The conversion efficiency of the electric boiler is 0.65.
- (2)
- The integrated energy system is connected to the external power grid and gas grid. The thermal system is not connected to the outside world. The predicted values of the electricity, gas, and thermal load of the system are shown in Figure 2—the forecasting curve of the electric thermal load of the integrated energy system.
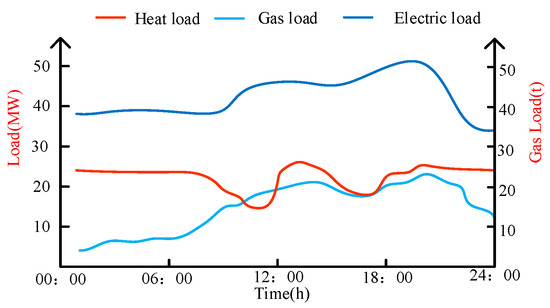 Figure 2. The forecasting curve of the electric thermal load of the integrated energy system.
The predicted output data of wind turbines and photovoltaic units is shown in Figure 3.
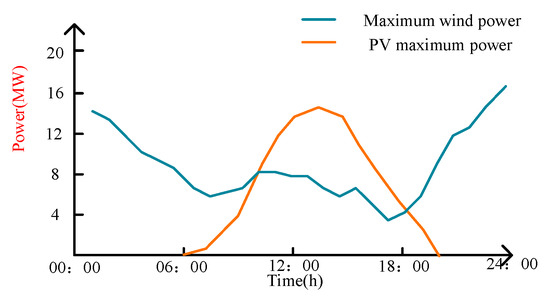
Figure 3.
Forecast value of maximum output of wind turbines and photovoltaic units.
- (3)
- The carbon emission parameters of each unit are shown in Table 2:
Table 2. Carbon emission parameters of each unit.
The basic cost of carbon emissions is set at 67 USD/t, the interval length is set at 80 t, and the carbon-trading price increase is set at 25% [28].
In order to study the effect of the comprehensive energy demand response scheduling method based on carbon trading proposed in this paper on reducing the operating cost of the system, this paper sets up the following three comparison scenarios:
Scenario 1: An integrated energy system economic dispatch model that does not consider carbon-trading mechanisms and demand response.
Scenario 2: The economic dispatch model of an integrated energy system that takes the lowest operating cost as the goal and considers the carbon-trading mechanism and does not consider the demand response.
Scenario 3: An integrated energy system economic dispatch model that takes into account carbon-trading mechanisms and demand response and aims at the lowest operating cost.
This paper takes 24 h as the cycle and 1 h as the step to simulate, and analyze, the carbon emissions and the operating cost of the integrated energy system under different scenarios.
6.2. Comparative Analysis of Different Scenarios
Based on the above three scenarios, this paper obtains the carbon emissions and operating costs of the integrated energy system under each scenario, as shown in Table 3.
Table 3.
Optimal solutions in different scenarios.
It can be seen from Table 3 that the carbon emissions in Scenario 2 are reduced by 321 t compared to Scenario 1, and the operating cost of the integrated energy system is increased by USD 30,200. Compared with Scenario 2, the carbon emissions in Scenario 3 are reduced by 155 t, and the operating cost is increased by USD 3600. It can be seen that the proposed comprehensive energy demand response scheduling method based on carbon trading can effectively reduce the carbon emissions of IES.
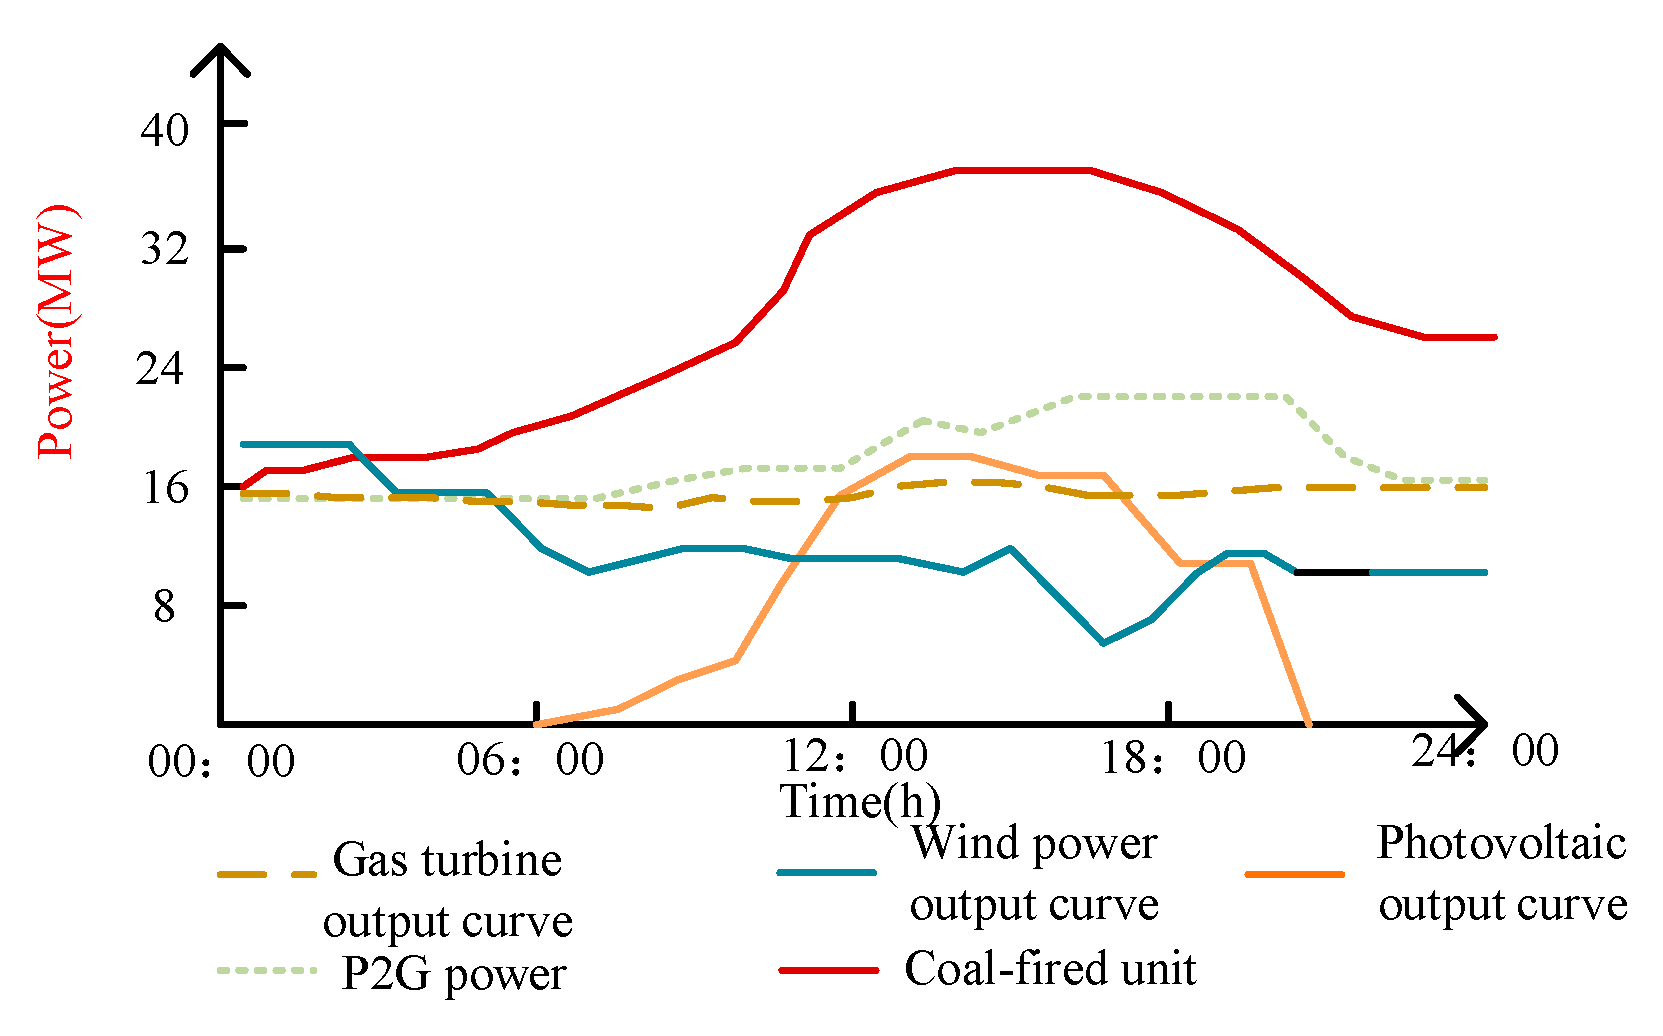
Figure 4, Figure 5 and Figure 6 and show the scheduling results in the three scenarios. It can be seen that during the period 11:00–19:00, the demand for electricity and gas peaks. However, the output of the coal-fired units in Scenario 1 is much larger than that in Scenarios 2 and 3. This is because after considering carbon trading, the operating costs of the units with a high carbon emission intensity (such as coal-fired power plants) increase significantly, while the operating costs of units with a low carbon emission intensity (such as wind turbines and gas-fired units) are relatively reduced. When the operating cost of high energy-consuming units continues to increase, it affects its power generation revenue; thus, in order to ensure the lowest operating cost of the system, the system dispatcher will increase the output by controlling the low-carbon emission units. Therefore, during this period, wind and photovoltaics are used first to meet the needs of users, then gas turbines are used, and coal-fired units are finally considered. To sum up, the carbon-trading mechanism promotes the consumption of clean energy in the integrated energy system and effectively reduces the carbon emissions of the system.
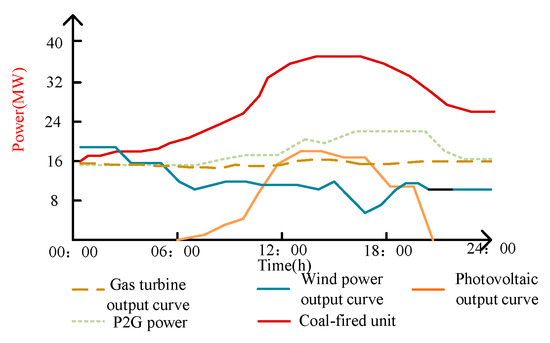
Figure 4.
Operation plan of each unit under Scenario 1.
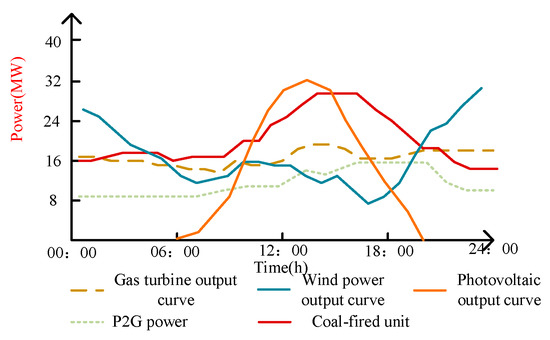
Figure 5.
Operation plan of each unit under Scenario 2.
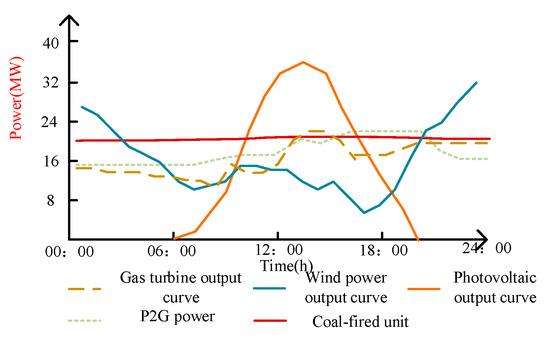
Figure 6.
Operation plan of each unit under Scenario 3.
6.3. The Impact of Integrated Energy Demand Response on Carbon Emissions
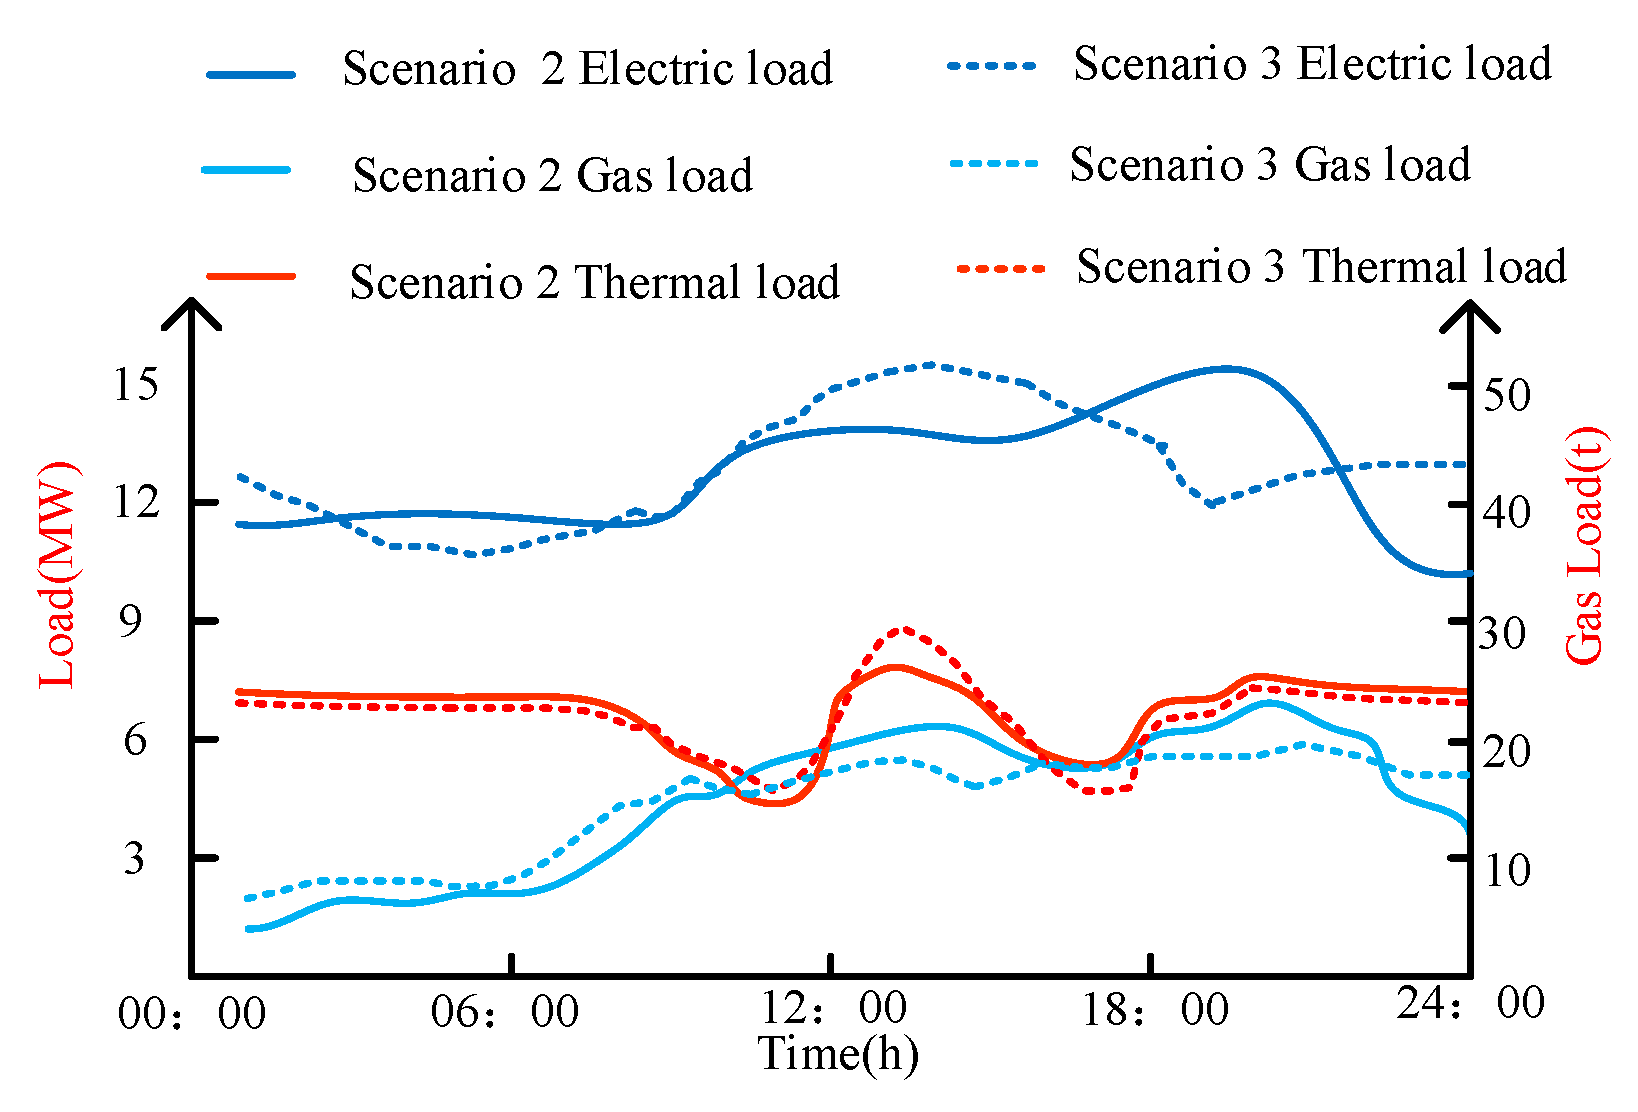
The electrical, gas, and thermal response loads in Scenarios 2 and 3 are shown in Figure 7.
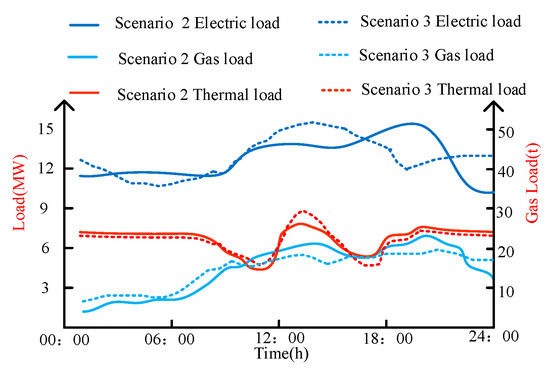
Figure 7.
Actual load under Scenario 2 and Scenario 3.
For the electric load, due to the influence of the new energy output, the system power load moves to the peak period of the new energy output. For gas load, since there are more surplus new energy sources at night, and the P2G equipment can reduce the carbon emissions of the system, the overall gas load of the system is moved to the peak period of new energy output.
Firstly, from Figure 3, Figure 5, Figure 6 and Figure 7, it can be seen that there is a phenomenon of partial wind and light abandonment during the period of 11:00–13:00 and 23:00–24:00 when the new energy units are in full force. However, after considering the demand response, an IES motivates electric load users to reduce their electric load or transfer the load demand when new energy is small. This reduces the electricity load demand at that moment or transfers it to the new energy time. At the same time, the gas load is transferred to the moment when new energy is released, providing sufficient space for the consumption of new energy. Secondly, since the carbon emission intensity of coal-fired units is greater than that of gas turbines, the carbon emission intensity of wind turbines and photovoltaic units is much smaller than that of gas turbines. Therefore, when dispatching, the new energy units will give priority to the output, and the coal-fired units will maintain the minimum technical output, and the gas turbine will perform peak-shaving scheduling to reduce the carbon transaction cost of the system. Finally, although the cost of demand response is temporarily greater than the cost of carbon emissions, it is in line with the development law of the energy industry to exchange a smaller economic cost for the reduction in carbon emissions.
6.4. The Impact of Carbon-Trading Prices on Carbon Emissions
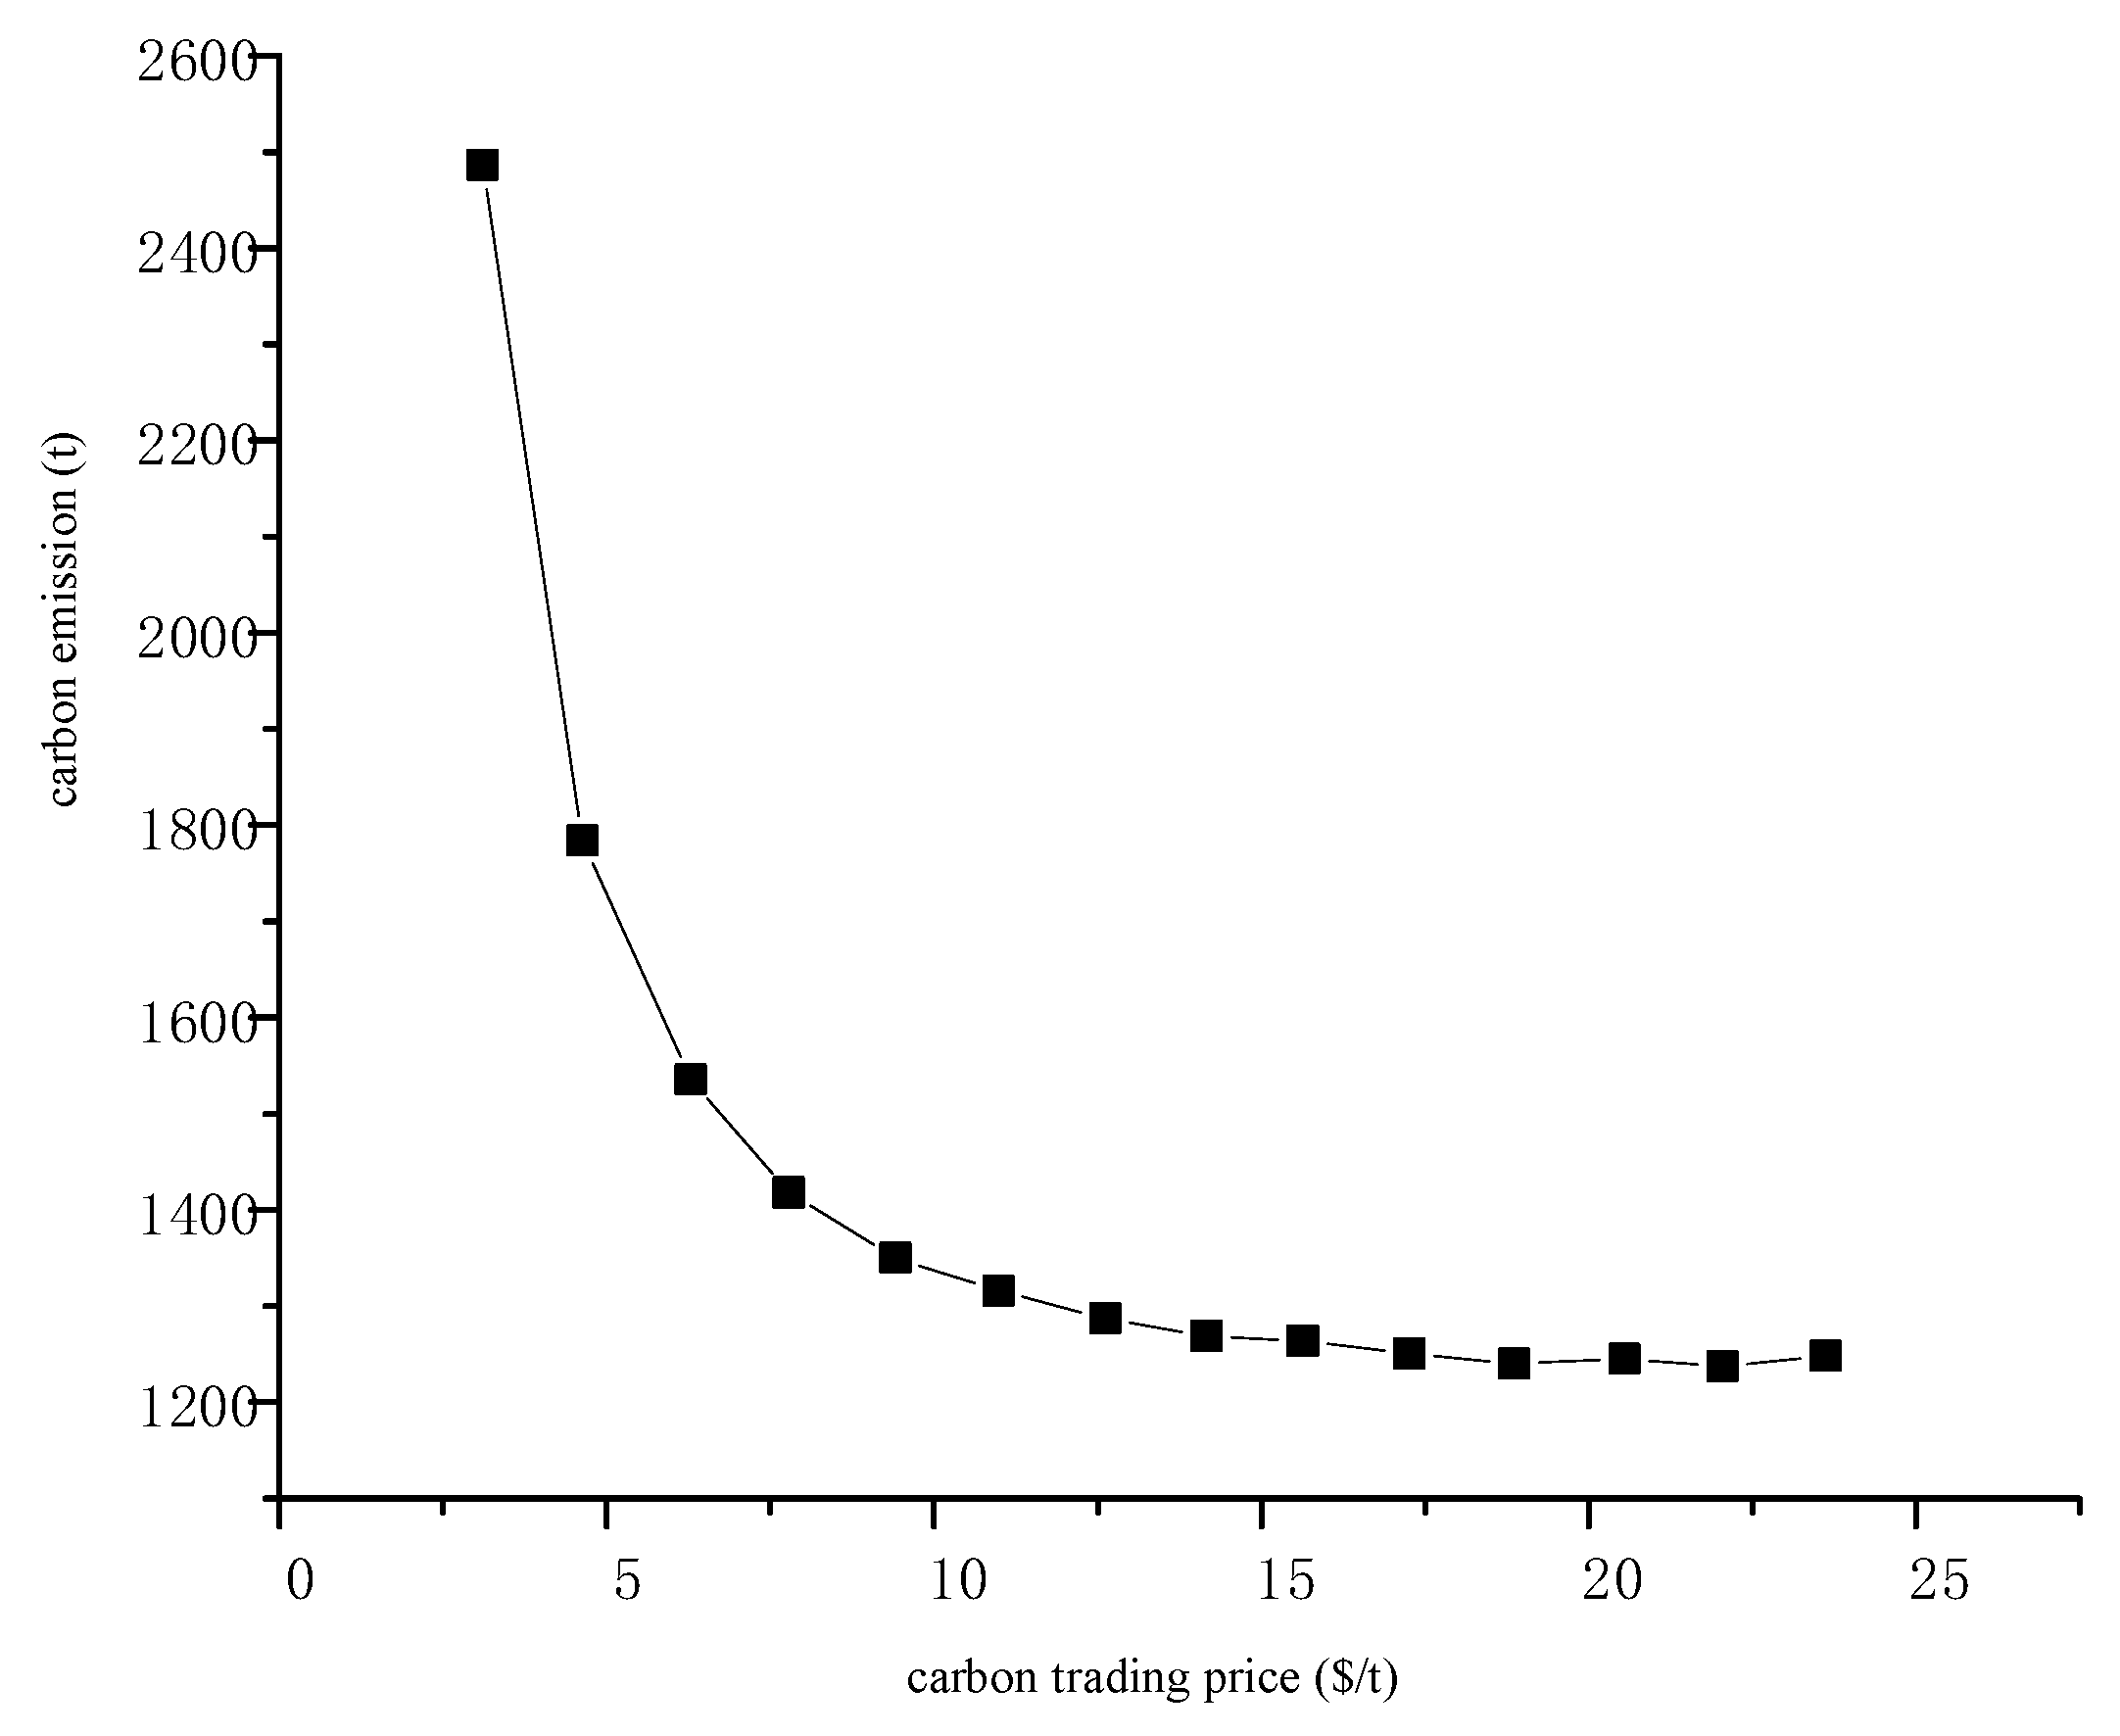
The carbon-trading price is the weight of the objective function, so the change in the carbon-trading price will affect the carbon emission and carbon-trading cost, and then affect the total operating cost of the system. In order to study the impact of carbon-trading price on system operation, the relationship between actual carbon emissions and carbon-trading price was analyzed and drawn.
It can be seen from Figure 8 that with the increase in carbon-trading price, the carbon-trading cost first increases and then decreases. This is because when the carbon-trading price is low, the actual carbon emissions remain unchanged, and the carbon-trading cost increases with the increase in the carbon-trading price. When the carbon-trading price continues to increase, the actual carbon emissions of the system are significantly reduced, and the reduction rate is greater than the increase in the price. In addition, the total operating cost of the system increases first and then flattens with the growth in the carbon-trading price, because the carbon-trading price is equivalent to the weight in the total cost. When the price is low—that is, the weight is small—the carbon transaction cost accounts for a small proportion of the total cost, and the total operating cost of the system increases with the increase in the energy purchase cost. With the increase in the carbon-trading price, the carbon emissions of the system remain basically unchanged.
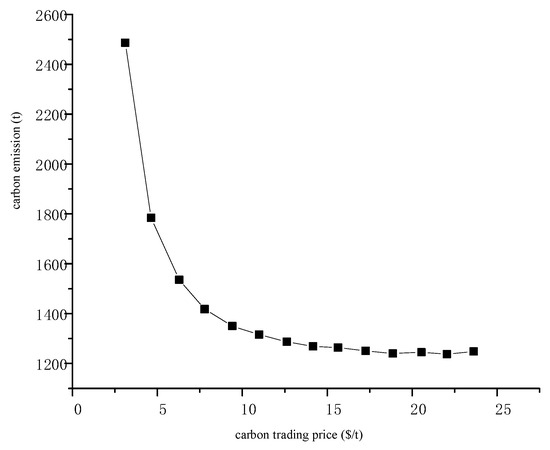
Figure 8.
Carbon price–carbon emissions relationship chart.
7. Conclusions
Aiming at the carbon emission problem in the energy industry, this paper proposes a comprehensive energy demand response scheduling model based on carbon trading by using the flexible characteristics of electricity, heat, and gas loads, and set up three scenarios for simulation to verify the effectiveness of the proposed model in reducing carbon emissions. The following conclusions can be drawn.
- (1)
- After the implementation of the carbon-trading mechanism, it will have a direct impact on the operating costs of various units. Through economic means, we should rationally guide the units with lower carbon emissions to give priority to the output. t effectively balances the economy and environmental protection of the operation of the integrated energy system and promotes the development of the integrated energy system towards a low-carbon path.
- (2)
- A comprehensive demand response can effectively balance the demand among multiple energy flows, change the demand curve of the electricity, gas, and thermal load, and reduce the peak-to-valley difference of the power system, playing the role of “shaving peaks and filling valleys”. During the peak load time, the output of the unit with a higher carbon emission intensity is reduced, and part of the load is shifted to the low load peak, improving the system’s ability to absorb new energy and reduce the abandonment of wind and light. In turn, the operating cost is effectively reduced, and the economy of the system operation is greatly improved.
- (3)
- Compared with the traditional dispatch model, after considering the demand response and carbon-trading model, the carbon emission is reduced by 15.19%, and the total system cost is increased by 2.42%. The simulation proves that the combination of a carbon-trading mechanism and comprehensive energy demand response can further reduce the carbon emissions of the system, and exchange environmental benefits at a certain economic cost.
Author Contributions
Conceptualization, W.G. and X.X.; methodology, W.G. and X.X.; software, W.G. and X.X.; validation, W.G. and X.X.; formal analysis, X.X.; investigation, X.X.; resources, X.X.; data curation, X.X.; writing—original draft preparation, X.X.; writing—review and editing, X.X.; visualization, X.X.; supervision, X.X.; project administration, W.G.; funding acquisition, W.G. All authors have read and agreed to the published version of the manuscript.
Funding
This research was funded by the National Social Science Foundation of China, grant number 20BJY239. the Xinjiang Social Science Foundation of China, grant number 21BGL098.
Institutional Review Board Statement
Not applicable.
Informed Consent Statement
Not applicable.
Data Availability Statement
Not applicable.
Conflicts of Interest
The authors declare no conflict of interest.
Appendix A
Table A1.
Generator parameters.
Table A1.
Generator parameters.
| Equipment | Unit Type | Capacity (MW) | Climb Constraint/% |
|---|---|---|---|
| C1 | Coal-fired power plant | 40 | 20 |
| G1 | Gas turbine power plant | 30 | 100 |
| GH1 | Gas heating plant | 10 | 20 |
| P2G | Electric to gas equipment | 20 | 20 |
Table A2.
Device parameters.
Table A2.
Device parameters.
| Equipment | Capacity (MW) | Energy Conversion Efficiency |
|---|---|---|
| G1 | 30 | |
| GH1 | 10 | 0.65 |
| P2G | 20 | 0.6 |
References
- Li, N.; Cui, Y.; Fu, Y.; Liu, X.; Run, Y.; Li, M.; Chen, L.; Xia, H.; Lu, H. Contribution of anthropogenic CO2 in China to global radiative forcing and its offset by the ecosystem during 2000–2015. Ann. N. Y. Acad. Sci. 2021, 1488, 56–66. [Google Scholar] [CrossRef]
- Wang, L.; Zhang, J.; Wang, X.; Chen, X.; Song, X.; Zhou, L.; Yan, G. Pathway of Carbon Emission Peak in China′s Electric Power Industry. Res. Environ. Sci. 2022, 35, 329–338. [Google Scholar] [CrossRef]
- Li, H.; Liu, D.; Yao, D. Analysis and Reflection on the Development of Power System towards the Goal of Carbon Emission Peak and Carbon Neutrality. Proc. CSEE 2021, 41, 6245–6259. [Google Scholar] [CrossRef]
- Zhang, S.; Lu, H.; Lin, X.; Zhong, W.; Liu, S. Operation Scheduling Optimization of Integrated-energy System in Industrial Park in Consideration of Energy Storage. High Volt. Eng. 2021, 47, 93–103. [Google Scholar] [CrossRef]
- Mi, J.; Ma, X. Development Trend Analysis of Carbon Capture, Utilization and Storage Technology in China. Proc. CSEE 2019, 39, 2537–2543. [Google Scholar] [CrossRef]
- Li, G.; Huang, Y.; Bie, C.; An, J.; Sun, S.; Qiu, Q.; Gao, X.; Peng, Y. Review and prospect of operational reliability evaluation of integrated energy system. Electr. Power Autom. Equip. 2019, 39, 12–21. [Google Scholar] [CrossRef]
- Cao, B.; Lyu, G.; Wang, N.; Jia, D. Research and application of demand response based on optimal scheduling of integrated energy system. Power DSM 2021, 23, 45–50. [Google Scholar] [CrossRef]
- Gong, X.; Li, F.; Sun, B.; Liu, D. Collaborative Optimization of Multi-Energy Complementary Combined Cooling, Heating, and Power Systems Considering Schedulable Loads. Energies 2020, 13, 918. [Google Scholar] [CrossRef] [Green Version]
- Zhang, T.; Zhang, J.; Wang, L.; Xu, J.; Zhang, D.; Wang, C. Day-ahead Economical Dispatch of Electricity-Gas-Heat Integrated Energy System Considering User Behaviors. Autom. Electr. Power Syst. 2019, 43, 86–94. [Google Scholar] [CrossRef]
- Fang, S.; Zhou, R.; Xu, F.; Feng, J.; Cheng, Y.; Li, B. Optimal Operation of Integrated Energy System for Park Micro-grid Considering Comprehensive Demand Response of Power and Thermal Loads. Proc. CSU-EPSA 2020, 32, 50–57. [Google Scholar] [CrossRef]
- Yang, H.; Li, M.; Jiang, Z.; Liu, X.; Guo, Y. Optimal Operation of Regional Integrated Energy System Considering Demand Side Electric, Heat and Gas Load Response. Power Syst. Prot. Control 2020, 48, 30–37. [Google Scholar] [CrossRef]
- Zou, C.; Cui, X.; Zhou, B.; Gao, J.; Liu, Y. Optimal dispatch of combined heat and power system considering flexible load and electric boiler under carbon trading environment. Electr. Meas. Instrum. 2019, 56, 34–40+56. [Google Scholar] [CrossRef]
- Liang, B.; Zhang, X.; Li, F.; Wang, H.; Wang, H.; Sun, Y.; Li, Z. Optimizing strategy of integrated energy coordination dispatching considering electric and heating demand response. Power DSM 2020, 22, 12–17. [Google Scholar] [CrossRef]
- Xu, H.; Dong, S.; He, Z.; Shi, Y.; Wang, L.; Liu, Y. Electro-thermal Comprehensive Demand Response Based on Multi-energy Complementarity. Power Syst. Technol. 2019, 43, 480–489. [Google Scholar] [CrossRef]
- Cui, Y.; Zeng, P.; Zhong, W.; Cui, W.; Zhao, Y. Low-carbon economic dispatch of electricity-gas-heat integrated energy system based on ladder-type carbon trading. Electr. Power Autom. Equip. 2021, 41, 10–17. [Google Scholar] [CrossRef]
- Kothe, A.K.; Kuptel, A.; Seidl, R. Simulating Personal Carbon Trading (PCT) with an Agent-Based Model (ABM): Investigating Adaptive Reduction Rates and Path Dependence. Energies 2021, 14, 7497. [Google Scholar] [CrossRef]
- Che, Q.; Wu, Y.; Zhu, Z.; Lou, S. Carbon Trading Based Optimal Scheduling of Hybrid Energy Storage System in Power Systems with Large scale Photovoltaic Power Generation. Autom. Electr. Power Syst. 2019, 43, 76–82+154. [Google Scholar] [CrossRef]
- Shi, J.; Hu, H.; Zhang, J. Distributed Low-Carbon Economy Scheduling for Integrated Energy System With Multiple Individual Energy-Hubs. Power Syst. Technol. 2019, 43, 127–136. [Google Scholar] [CrossRef]
- Qin, T.; Liu, H.; Wang, J.; Feng, Z.; Fang, W. Carbon Trading Based Low-carbon Economic Dispatch for Integrated Electricity-Heat-Gas Energy System. Autom. Electr. Power Syst. 2018, 42, 8–13, 22. [Google Scholar] [CrossRef]
- Wan, W.; Ji, Y.; Yin, L.; Wu, H. Application and prospect of carbon trading in the planning and operation of integrated energy system. Electr. Meas. Instrum. 2021, 58, 39–48. [Google Scholar] [CrossRef]
- Li, B.; Hu, Z.; Song, Y.; Fang, X.; Yang, J. Principle and Model for Assessment on Carbon Emission Intensity Caused by Electricity at Consumer Side. Power Syst. Technol. 2012, 36, 6–11. [Google Scholar]
- Li, B.; Hu, Z.; Song, Y.; Wang, G. Principle and Model for Regional Allocation of Carbon Emission from Electricity Sector. Power Syst. Technol. 2012, 36, 12–18. [Google Scholar]
- Xu, Z.; Sun, Y.; Xie, D.; Wang, J.; Zhong, Y. Optimal Configuration of Energy Storage for Integrated Region Energy System Considering Power/Thermal Flexible Load. Autom. Electr. Power Syst. 2020, 44, 53–59. [Google Scholar] [CrossRef]
- Shehzad Hassan, M.A.; Assad, U.; Kabir, U.F.A.; Khan, M.Z.; Bukhari, S.; Jaffri, Z.u.A.; Oláh, J.; Popp, J. Dynamic Price-Based Demand Response through Linear Regression for Microgrids with Renewable Energy Resources. Energies 2022, 15, 1385. [Google Scholar] [CrossRef]
- Zhou, C.; Zheng, J.; Jing, Z.; Wu, Q.; Zhou, X. Multi-Objective Optimal Design of Integrated Energy System for Park-Level Microgrid. Power Syst. Technol. 2018, 42, 1687–1697. [Google Scholar] [CrossRef]
- Zhao, H.; Miao, S.; Li, C.; Zhang, D.; Tu, Q. Research on optimal operation strategy for regional integrated energy system considering cold-heat-electric demand coupling response characteristics. Proc. CSEE 2022, 42, 573–588. [Google Scholar] [CrossRef]
- Zhang, H.; Cao, F.; Wu, J.; Liu, K. A Dynamic Economic Dispatching Model for Power Grid Containing Wind Power Generation System. Power Syst. Technol. 2013, 37, 1298–1303. [Google Scholar]
- Zhang, N.; He, S.; Wang, J.; Chen, Y.; Kang, L. Carbon Intensity and Benchmarking Analysis of Power Industry in Tianjin under the Context of Cap-and-Trade. Res. Environ. Sci. 2018, 31, 187–193. [Google Scholar] [CrossRef]


Publisher’s Note: MDPI stays neutral with regard to jurisdictional claims in published maps and institutional affiliations. |
© 2022 by the authors. Licensee MDPI, Basel, Switzerland. This article is an open access article distributed under the terms and conditions of the Creative Commons Attribution (CC BY) license (https://creativecommons.org/licenses/by/4.0/).