Abstract
Using high charge dilution low temperature combustion (LTC) strategies in a diesel engine offers low emissions of nitrogen oxides (NOx). These strategies are limited to part-load conditions and involve high levels of charge dilution, typically achieved through the use of recirculated exhaust gases (EGR). The slow response of the gas handling system, compared to load demand and fuelling, can lead to conditions where dilution levels are higher or lower than expected, impacting emissions and combustion stability. This article reports on the sensitivity of high-dilution LTC to variations in EGR rate and fuel injection timing. Impacts on engine efficiency, combustion stability and emissions are assessed in a single-cylinder engine and compared to in-cylinder flame temperatures measured using a borescope-based two-colour pyrometer. The work focuses on low-load conditions (300 kPa gross indicated mean effective pressure) and includes an EGR sweep from conventional diesel mode to high-dilution LTC, and sensitivity studies investigating the effects of variations in charge dilution and fuel injection timing at the high-dilution LTC condition. Key findings from the study include that the peak flame temperature decreased from ~2580 K in conventional diesel combustion with no EGR to 1800 K in LTC with low-NOx, low-soot operation and an EGR rate of 57%. Increasing the EGR to 64% reduced flame temperatures to 1400 K but increased total hydrocarbon (THC) and carbon monoxide (CO) emissions by 30–50% and increased fuel consumption by 5–7%. Charge dilution was found to have a stronger effect on the combustion process than the diesel injection timing under these LTC conditions. Advancing fuel injection timings at increasing dilution kept combustion instability below 2.5%. Peak in-cylinder temperatures were maintained in the 2000–2100 K range, while THC and CO emissions were controlled by delaying the onset of bulk quenching. Very early injection (earlier than 24 °CA before top-dead-centre) resulted in spray impingement on the piston crown, resulting in degraded efficiency and higher emissions. The results of this study demonstrate the potential of fuel injection timing modification to accommodate variations in charge dilution rates while maintaining low NOx and PM emissions in a diesel engine using low-temperature combustion strategies at part loads.
1. Introduction
The high thermal efficiency and low carbon dioxide (CO2) emissions of diesel engines make them an attractive primary power source for many applications. Despite advances in engine control and exhaust gas aftertreatment systems, emissions of nitrogen oxides (NOx) remain a challenge especially when exhaust temperatures are low, such as at low engine loads and during cold starts. One approach to control NOx within the engine cylinder without impairing combustion efficiency is to use high levels of recirculated exhaust gases to dilute the charge and achieve low-temperature combustion (LTC). Careful control of operating conditions is important to maintain stable LTC. Such conditions can be achieved in a laboratory environment, but variability in charge composition between cylinders and during transient engine operation will impact combustion stability and performance in on-road use. This study combines engine performance and emissions measurements with optical measurements of flame temperature and in-cylinder combustion progression to quantify the sensitivity of LTC to fluctuations in dilution levels and to assess the potential of fuel injection timing as a control method to compensate for these effects.
In conventional diesel combustion, NOx emissions can be controlled with exhaust gas recirculation (EGR). The presence of EGR lowers the oxygen concentration, introduces more reactive species from decomposition of exhaust constituents, and increases the charge specific heat. Combined, these factors reduce the combustion zone temperatures, leading to lower nitric oxide (NO) formation at the expense of increased emissions of particulate matter (PM) [1]. Presently, a combination of moderate levels of EGR (up to ~25%), a selective catalyst reduction (SCR) and a lean NOx trap (LNT) are the preferred architectures for light-duty vehicle manufacturers in order to meet the legislated tailpipe NOx emissions. Although NOx conversion efficiencies > 97% are reported for the SCR system, their conversion efficiency is low when the catalyst inlet temperature is below 200 °C [2,3]. In order to meet upcoming stringent emission legislations (e.g., Euro 7 or CARB 2024), near-zero tailpipe NOx levels are required even during engine cold start and low load operations [3,4] when a traditional SCR will not be active. In highly efficient modern diesel engines, the exhaust temperature can be below 150 °C during low load driving, which will require additional heating measures (such as an electrical catalyst heater or a diesel burner) upstream of the diesel oxidation catalyst in order to meet the future Euro 7 regulations [5]. Various LTC approaches have been investigated to reduce NOx and soot simultaneously at low and intermediate load operating conditions. High dilution (EGR > 50%) reduces reaction zone temperatures to limit NO formation, but typically leads to higher levels of hydrocarbons (THC) and carbon monoxide (CO) while increasing fuel consumption.
The low emissions of NOx and PM from high-dilution LTC can be achieved during steady-state engine operation but retaining these benefits during transient operation is more challenging. Significant increases in PM emissions with intermediate EGR levels (between 30% and 50%, depending on engine loads) are usually encountered during combustion mode transitions between LTC and conventional diesel combustion [6,7,8,9]. This is due to the different response times of the gas exchange process, experienced with different combinations of EGR levels, engine intake and exhaust pressures and intake temperatures, and fuel injection parameters such as start of fuel injection (SOI) timing and fuel injection pressure. Han et al. [8] showed that during transient operation the cycle to cycle EGR rate can vary between 60% and 0% due to the slow response of the EGR system: 20 cycles or more may be needed to reach the target EGR level, during which instability in indicated mean effective pressure (IMEP), combustion instability and high THC emissions are likely to be encountered. Similar considerations have been reported for engines using reactivity-controlled compression ignition (RCCI) strategies, which require transition from part-load RCCI to high-load conventional combustion. Paykani et al. [10] reported slower load response during such mode shifts while combustion stability, in-cylinder conditions and engine-out emissions were sensitive to the conditions encountered during the transient. While RCCI offers ultra-low emissions at part load, the cost and operational implications of multiple fuels are barriers [10,11]. High-dilution LTC and conventional diesel combustion modes with intermediate EGR levels (between 30% and 60%) remain a topic of interest for diesel engines [12] and can be applied to both conventional diesel and alternative low net carbon diesel-like fuels [13,14]. For both RCCI and LTC, smooth transient operation and combustion mode transitions are critical for the successful application in on-road use. Understanding the in-cylinder combustion phenomena encountered during these transitions is critical for engine control but is not reported in the existing literature. Optical assessments of combustion (in-cylinder spray and combustion imaging, flame temperature and soot concentrations) studies have focused on conventional diesel and high-dilution LTC. This work fills a gap in understanding of the in-cylinder processes through spatially resolved flame imaging and field of view averaged flame temperature measurements with two-colour pyrometry at moderate EGR levels (between 30% and 55%) encountered during a mode transition.
Cylinder to cylinder variations of gas exchange parameters is also a challenge when high-dilution LTC is applied to multi-cylinder engines due to differences in gas exchange and retained residual gas fractions [15]. The high-dilution LTC strategy’s sensitivity to changes in the fuel injection timing is widely reported [7,15,16]; however, the effects of fuel injection timings correlating in-cylinder flame temperatures with engine performance and emissions are not investigated. Studies using optical in-cylinder observation have focused on engines with unrepresentative piston bowl shapes such as flat piston bowls that influence interactions between the fuel spray and bowl wall. This significantly impacts the fuel-air mixing in high-dilution combustion. The few optical studies that investigated local flame temperature and soot concentration (represented by KL factor where K represents absorption coefficient and L the optical path length), used mixtures of air, nitrogen (N2) and CO2 to achieve target dilution levels in place of EGR. This ‘simulated’ EGR is missing the water vapour and other minor species found in typical exhaust gases, impacting the thermochemical processes that are especially important at high dilution.
High-dilution LTC is a near-zero NOx formation and emission mode that could be valuable for NOx control, especially in low loads, where engine exhaust is often below the SCR catalyst light-off temperatures. However, at these conditions, LTC is sensitive to variations in EGR rates [17]. Previous work by the present authors and other research teams [18,19,20,21] have shown the importance of high EGR rates on achieving low temperature combustion, and have evaluated the emissions and performance implications of intermediate EGR rates, where soot emissions are high. The aim of the work reported here was to use for the first time in-cylinder temperature measurements and flame images to describe the instability of the combustion process both at the intermediate dilution levels that would be encountered during mode shifts in an LTC-based engine and at high dilution LTC conditions. Therefore, the key objectives of the work reported in this article were: (i) to evaluate the sensitivity of high-dilution combustion to small changes in EGR rates and fuel injection timings on the fuel use, emissions and stability of an engine operating in a low load LTC mode; and (ii) to compare the emissions, in-cylinder flame temperatures and soot concentrations during a transition from conventional diesel to high-EGR LTC. Critically, the work is conducted on an engine with representative piston bowl geometry and with dilution provided by real exhaust gases.
2. Experimental Apparatus
The research was conducted on an AVL5402 single-cylinder engine (AVL List GmbH: Graz, Austria) that is representative of a 2.0 litre, 4-cylinder diesel engine typically found in light-duty passenger and small commercial vehicles. The engine is equipped with a centrally mounted fuel injector. To enable borescopic access into the engine, one of the original exhaust valves was removed, leaving two intake and one exhaust valves. A Bosch fuel injection system supplied automotive grade diesel at up to 135 MPa to a hydraulicly actuated five-hole injector. Further information about the engine and fuelling system are shown in Table 1.

Table 1.
Single cylinder research engine and fuelling system specifications.
Optical access was provided through a pair of fused silica optical windows that protruded into the combustion chamber, attached to installation tubes. One window was connected to a Xenon flash lamp (CX1200, PerkinElmer Inc., Waltham, MA, USA) to illuminate the spray, while a Karl Storz 84583B borescope (KARL STORZ SE & Co., Tuttlingen, Germany) with a 67° field of view (FOV) was used to provide a wide view within the combustion chamber, as shown in Figure 1. Spatially resolved flame images were captured using a 1600 × 1200 pixel monochrome camera (Prosilica GC1380, Allied Vision, Stadtroda, Germany), while spatially averaged results were used to assess the combustion in low-luminosity regimes. More details are available elsewhere [22].
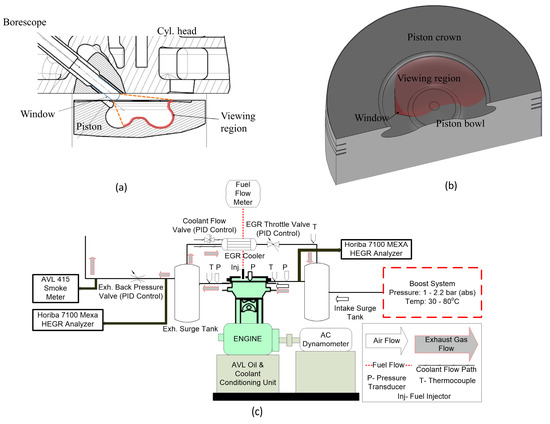
Figure 1.
(a) Cross section showing borescope installation and viewing area (Adapted from [23]); (b) field of view of borescope at 10 °CA ATDC, shaded area shows surface of piston that can be seen through borescope; (c) system layout and process flow diagram for single cylinder engine facility.
In-cylinder flame temperature and soot concentration (KL factor) were measured using a field-of-view integrated two colour pyrometry system. The image collected through the borescope lens was connected to a dichroic mirror to split the light signal from the combustion chamber. Both reflected and transmitted light beams were passed through 550 nm and 700 nm interference filters, respectively, after which intensities were measured by two identical Hamamatsu amplified photomultiplier tube (PMT) modules. The two-colour pyrometry set up and corrections to account for flame area within the FOV are available from a previous work [24]. Note that the two-colour pyrometry and the camera set ups were not used together as both the systems used the same borescope for radiation signals and in-cylinder imaging.
Along with optical access, the engine test bed was equipped with a comprehensive instrumentation suite. Crankshaft position was measured using an AVL365 encoder (AVL List GmbH, Graz, Austria) with 0.5 °CA precision, while pressure in the combustion chamber was recorded with a water cooled flush mounted piezoelectric sensor (AVL QC34C, AVL List GmbH, Graz, Austria). Two hundred consecutive cycles of in-cylinder pressure data were collected for each data point. The apparent energy release rate was calculated from the average pressure using a conventional first law analysis, assuming constant specific heat ratios and neglecting blowby and heat transfer losses [25]. Combustion progression has been defined by integrating the net energy release rate up to a defined crank angle and normalizing by the cumulative energy released over the cycle. The crank angle corresponding to integrated energy release of 10%, 50%, 70% and 90% of the total energy (CA10, CA50, CA70 and CA90, respectively) are used here for in-cylinder imaging and comparison. The energy release rate is also used to identify the start of combustion (SOC), defined as the zero-crossing of the energy release rate excluding the negative temperature coefficient ‘cool-flame’ phase. The time (in °CA) between SOC and the commanded start of injection is defined as the ignition delay; this thereby incorporates both the pre-combustion reactions occurring during the negative temperature coefficient phase as well as any hydraulic delays in the injector itself. Cycle-to-cycle variations in combustion output were assessed based on coefficient of variation (COV) of gross IMEP (GIMEP) calculated from pressure traces for individual cycles. Concentrations of CO, CO2, THC, NOx and oxygen (O2) in the exhaust were measured with a Horiba MEXA 7100HEGR (Horiba, Ltd., Kyoto, Japan) analyser, while particulate emissions, in terms of filter smoke number (FSN), were monitored using an AVL 415 smoke meter (AVL List GmbH, Graz, Austria). The intake CO2 concentration was also measured and used to calculate the EGR level. The system diagram for the test facility is shown in Figure 1c, and further specific information on the experimental configuration is reported in [26,27].
3. Results and Discussion
The single-cylinder engine facility has been used to investigate how sensitive the LTC process is to variations in dilution level, and to evaluate the ability of fuel injection timing to compensate for these variations. The results of a general variation in dilution are presented first, followed by evaluations of sensitivity to dilution and injection timings at EGR > 50% at a fixed fuelling quantity and a constant engine speed. For an LTC engine at low load, the exhaust gas can contain significant quantities of oxygen. As a result, the EGR fraction does not accurately represent the level of dilution of the ingested charge. Throughout this work, intake oxygen mass fraction () is used as it is more representative of the critical impacts of the intake charge dilution than the EGR rate.
The engine operating condition used in this work combined a constant speed (1500 rev.min−1) and a fixed fuelling quantity of 8 mg/cycle. This corresponds to a gross IMEP of 300 kPa under conventional diesel combustion (CDC). To reduce sources of variability in this study, the fuelling quantity was fixed for all tests conducted. At this low load condition, the engine exhaust temperature was below 200 °C, which would lead to poor SCR performance even when the engine is fully warmed up.
3.1. Comparison of Emissions and In-Cylinder Flame Temperature and KL Factor during a Transition from Conventional Diesel to High-EGR LTC
A set of tests were conducted over a range of EGR levels between 0% and 64% to define the trade-offs between emissions of smoke and NOx during transition to LTC. At a given EGR rate, the timing of the start of injection (SOI) was advanced in order to achieve the maximum brake torque (maximum advance for best torque, MBT). The injection advance was limited to a rate of pressure rise below 1 MPa/°CA. MBT timing provides the highest thermal efficiency while reducing COV of IMEP, and emissions of THC and CO [28] at high EGR levels. The test points investigated here are listed in Table 2 and the corresponding emissions and combustion parameters (CA50 and ignition delay) are shown in Figure 2. Intake oxygen mass fraction and the exhaust gas temperature for each case are also listed in the table. The combustion modes are grouped as conventional diesel combustion (CDC, Cases A–C), where the charge dilution does not significantly impact MBT timing; transitional (Case D), where MBT timing is advanced with low NOx but smoke emissions higher than in CDC, and LTC (Cases E–I), where both NOx and smoke emissions are dramatically lower than in the baseline configuration.
Table 2.
Test points (Constant engine speed, 1500 rev.min−1, Single injection, 100 kPa, absolute, intake pressure).
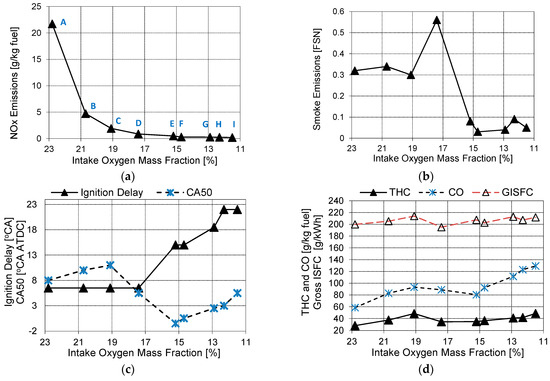
Figure 2.
(a) NOx, (b) smoke, (c) ignition delay, CA50 and GISFC, and (d) THC and CO emissions, during the EGR sweep. Data point references in (a) indicate the corresponding case from Table 2.
Engine emissions follow the expected trends, as shown in Figure 2. NOx decreases significantly as dilution is increased, with emissions as low as ~0.3 g/kg of fuel (<10 ppm) at ~15% intake oxygen mass fraction (57% EGR). This is equivalent to ~0.06 g/indicated kWh, and is approaching the measurement threshold of 10 ppm in the emissions equipment used in this work. In LTC mode ( < 15%), smoke emissions are significantly lower than the baseline, with a relatively small penalty in CO and THC emissions. The impacts of charge dilution on gross indicated specific fuel consumption (GISFC) are relatively minor.
The reduction of Nox emissions with increased dilution correlates well with the trends of in-cylinder flame temperatures, shown in Figure 3a. In conventional diesel combustion (Cases A–C) between 0 and 28% EGR, the peak flame temperature reduced from 2560 K to 2346 K, leading to an 80% decrease in the Nox emission (Figure 2). As dilution increases into the LTC regime, with MBT SOI timing (Cases D–F), the phasing of the peak flame temperature advanced, while peak flame temperatures and the duration of luminous flames were reduced. The optical characterization of the combustion temperature is dependent on the presence of a visible flame [24], which is shorter for LTC than in CDC. Very low Nox emission (<10 ppm) were achieved with < 15% (EGR > 54%) with peak flame temperatures below 2000 K. Below this temperature, Nox formation through the thermal route (i.e., the extended Zeldovich mechanism) is known to be unimportant. As a result, even though higher dilution (Cases G–I) reduces the peak flame temperature, the ability to reduce Nox emissions further (formed through the thermal route) is limited. At these low temperatures, (down to ~1000 K) [29], NO formation is in low temperature combustion is thought to be dominated by the reaction between CH radicals and N2 through the prompt (Fennimore) mechanism [30,31]. Formation of NO via the nitrous oxide (N2O) route, where N2 reacts with atomic oxygen (O) to form N2O, which subsequently reacts with another oxygen atom to form 2NO, may also become important in lean premixed LTC due to its low activation energy [32]. Desantes et al. [31] used simulations to demonstrate that under LTC conditions, when NO is of the order of 10 ppm, the contribution of thermal NO towards the total NO was between 40% and 60%, and the remaining NO was due to the prompt NO and N2O mechanisms.
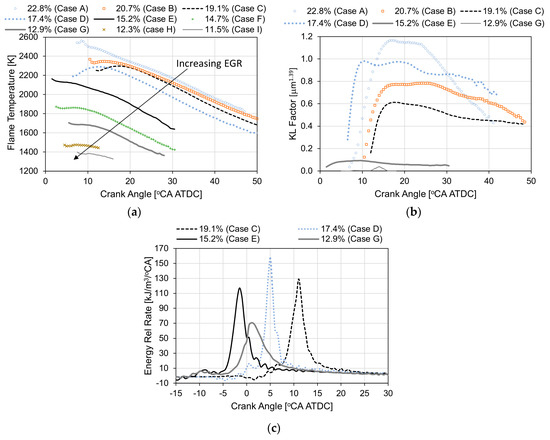
Figure 3.
(a) Flame temperature during an EGR sweep at low load; (b) KL factor; (c) Energy release rate at selected operating points.
Charge dilution with EGR tends to increase particulate matter emissions at moderate dilution levels, before being dramatically reduced at high dilution when LTC is achieved. This is seen in engine-out emissions (Figure 2b) and in-cylinder soot concentration (KL factors) (Figure 3b). This is a result of the competing influences of lower O2 content with charge dilution and increasing ignition delay (Figure 2c). For low-dilution CDC (Cases A–D), the ignition delay was constant; while it increased under LTC (Cases E–I). The longer ignition delay resulted in more premixing of the diesel prior to ignition, limiting the potential for soot formation in rich pockets of the combustion chamber. For LTC cases ( < 15%, EGR > 54%), engine out smoke emissions are <0.1 FSN. While not an exact measure, smoke emissions are generally representative of carbonaceous PM emissions. Similarly, in-cylinder KL factors are generally accepted to be representative of local soot concentrations even if they do not provide a direct quantitative metric.
As shown in Figure 3b, there is a clear distinction in in-cylinder KL factors between CDC (Cases A–C) and the high EGR LTC (Cases E–G). As with the local flame temperature, the KL factor is dependent on a measurable luminous flame. In the CDC cases, the luminous flame is of longer duration, resulting in measurable KL factors being observed later in the expansion stroke relative to LTC. Even within CDC, Case A shows a higher peak KL factor, due to the highest observed reaction zone temperatures but then more rapid oxidation, due to higher temperatures and O2 availability. Cases B and C show lower peak KL factors, due to lower in-cylinder temperatures during the soot formation phase, but subsequent oxidation of soot is also reduced compared to Case A. This is likely due to the lower availability of oxygen to oxidize the soot and lower temperatures in the reaction zone. These effects are offsetting so that engine-out smoke emissions do not change. For Case D, injection timing was advanced leading to in-cylinder temperatures similar to the less dilute Case C, but with an equivalent ignition delay and lower oxygen content. This led to higher soot formation (as demonstrated by the KL factor in Figure 3b) with limited subsequent soot oxidation, resulting in the highest measured soot emissions. With increased charge dilution, soot formation rate reduced because of improved fuel-air premixing due to long ignition delay and low in-cylinder temperature, as seen from the low KL factor with 54% EGR levels (Case E). At very high dilution levels (61% EGR, Case G) soot formation is minimal leading to near-zero KL factor and engine-out smoke emissions (<0.1 FSN).
Further insight into the combustion process is provided by the apparent rate of energy release, calculated from cylinder pressure and shown in Figure 3c. CDC has similar combustion progress (Cases A–C) while the intermediate case (D) has a similar energy release rate but earlier combustion. This is due to the more advanced start of injection (Table 2). At higher dilution levels, the energy release rate is reduced and a significant low temperature reaction (LTR) phase is observed prior to the start of the main combustion event. The presences of the LTR phase reinforces the observation that dilution levels > 50% (Cases E–I) are in the LTC regime.
The trends of KL factors, shown in Figure 3b, can be compared to the in-cylinder flame images, shown in Figure 4 for conventional diesel with moderate dilution (Case C) and two high dilution LTC cases (E and G). The flame images are shown at crank angles corresponding to 50%, 70%, 80%, 90% and 95% of cumulative energy release, designated as CA50, CA70, CA80, CA90 and CA95, respectively. Conventional diesel operation with moderate dilution (Case C) is shown in Figure 4a, with natural luminosity from soot oxidation evident during the later phases of the combustion event. This generally matches the observed KL factor for this case. In comparing KL factor and luminosity images, it is important to recall that the PMTs used for the KL and temperature evaluation are significantly more sensitive than the Prosilica camera.
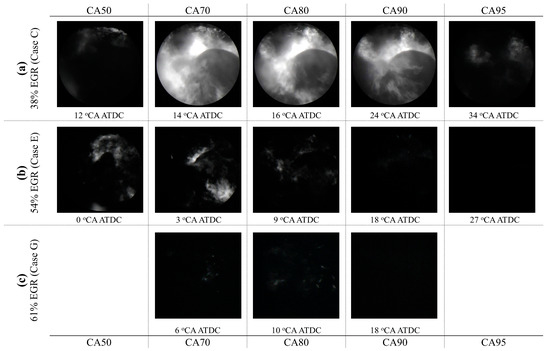
Figure 4.
10 cycle average flame images at low-load condition (8 mg/cycle fueling quantity); (a) Case C—Intermediate EGR combustion at −3 °CA ATDC SOI (images used as recorded); (b) Case E—High-EGR LTC at −21 °CA ATDC SOI (images are intensified) (c) Case G—High-EGR LTC at −24 °CA ATDC SOI (images with maximum intensification).
The combustion images for the high-dilution LTC cases (Cases E and G), shown in Figure 4b,c, differ from conventional diesel combustion cases. Note that the conventional diesel (Case C) combustion images are shown as recorded, whereas the images for Case E are intensified and the images for Case G are presented with maximum intensification. Low-intensity soot luminosity is visible for Case E over the range of 50–90% of cumulative energy release (between~0 and 18 °CA ATDC) and very low-intensity soot luminosity (despite the maximum image intensification) is visible for Case G over the range of 70–80% of cumulative energy release (between 6 and 10 °CA ATDC). No detectable luminosity was observed after 80% of cumulative energy release for Case G. The soot luminosity seen in the images is consistent with the trend of the low KL factor data for LTC, shown in Figure 3b. The lack of observable soot luminosity in the high-dilution LTC mode was reported in earlier publications [24,33]. The temperature and KL factor results demonstrate that even at these modes, low levels of broadband luminosity are being generated that can be resolved by the field-of-view averaged amplified PMTs. This agrees with previous work [24] that showed that even where spatially resolved luminosity was undetectable, representative temperatures and KL factors could be generated for the reaction zones using area-integrated measurements.
Comparing the engine-out emissions with in-cylinder combustion process measurements provides several interesting observations. First, the results are consistent with higher dilution levels leading to lower luminous zone temperatures and lower NOx emissions. Above approximately 50% EGR ( < 15%), the combustion enters the LTC regime. This is characterized by long ignition delays, a low-temperature energy release zone prior to the main combustion, low in-cylinder temperatures, and low soot luminosity from both area-integrated and spatially resolved images. At the low load condition evaluated here, the potential to advance the injection and combustion phasing with LTC at ~15% means that GISFC can be maintained and increases in CO and THC emissions minimized. However, as dilution levels increased ( < 14%), GISFC, THC and CO increased. Further reductions in smoke are not observed, and only marginal reductions in NOx emissions occur. In considering the use of LTC in an operating engine, it is hence critical to achieve dilution levels close to the targeted values in all cylinders. Due to engine variability, this may not always be possible; the rest of this work evaluates the sensitivity to dilution at the high EGR LTC case and assesses the potential to use injection timing control to compensate for variability in dilution levels.
3.2. Comparison of Performance, Emissions and In-Cylinder Flame Temperature to Minor Changes in EGR Rates at Constant SOI in High-EGR LTC
Understanding the sensitivity of the high-dilution LTC strategy to EGR is critical to developing robust combustion control. Delays in the gas exchange system, coupled with the potential for cylinder-to-cylinder variation, mean that an LTC engine needs to be able to accommodate variations in dilution. To evaluate the cross-sensitivity of dilution levels and injection timings, a series of tests were run at three different dilution levels and two different injection timings, as shown in Table 3.
Table 3.
Test points at a fixed SOI with minor variations in the EGR levels (Constant engine speed, 1500 rev.min−1, Single injection (8 mg/cycle), Injection pressure 65 MPa, 100 kPa absolute intake pressure).
In the high-dilution LTC strategy, variations in the EGR rates had a significant effect on the flame temperature (Figure 5a) and engine-out THC and CO emissions (Table 3). Smoke emissions were low (≤0.1 FSN) due to long ignition delay (≥15 °CA) and low flame temperatures and were insensitive to the minor variations in the EGR rate in the high-dilution LTC strategy at the low load operating conditions investigated in this work. Reductions in NOx emissions were also observed with increasing dilution, although the results are within the uncertainty of the NOx measurements. Interestingly, as shown in Figure 5a, the flame temperature dropped by ~250–300 K even with a small change in the EGR rate (increase from 54% to 57%) that had a relatively minor influence on energy release rate (Figure 5b). At higher dilution, the combustion phasing is significantly delayed and the peak energy release reduced, corresponding with a further substantial reduction in local flame temperatures. This corresponds with significant increases in CO and THC emissions and a reduction in thermal efficiency (i.e., increased GISFC). As these changes relate to only a change in EGR rate of approximately eight percentage points (54–62%), they are within the range of variability that could be expected in real engine operation. The trends of flame temperature and energy release rates at −24 °CA ATDC SOI were similar to −21 °CA ATDC SOI and hence, are not shown here. In both cases, maintaining a > 14% appears to be critical in maintaining low-NOx, low-smoke operation without substantially negatively impacting THC and CO emissions and thermal efficiency. However, further evaluation of sensitivity to injection phasing is required.
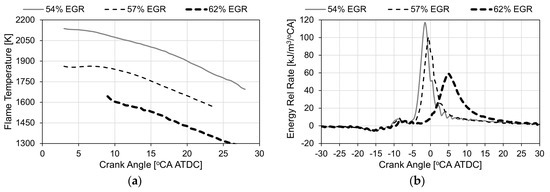
Figure 5.
(a) Flame temperature and (b) energy release rate during a minor change in the EGR rate at a fixed SOI of −21 °CA ATDC. Note different x-axis scales to focus on the flame temperature (a) and provide the full combustion profile (b).
3.3. Comparison of Performance, Emissions and In-Cylinder Flame Temperature to Changes in SOI Timings at Constant EGR Rate in High-EGR LTC
The ability of an engine control system to rapidly achieve a target dilution level is limited by time delays in the response of the turbocharger and EGR systems. During these delays, the fuel injection timing can be adjusted rapidly, at near cycle-by-cycle time scales, to maintain combustion control. To evaluate these effects, a series of injection timings were evaluated at three EGR rates (see Table 4), consistent with the range of dilution levels that would be expected in an engine operating in LTC modes at low loads. The effects on combustion variability are also shown in the table (characterised by the COV of GIMEP) while emissions and GISFC are shown in Figure 6.
Table 4.
Test points (Constant engine speed, 1500 rev.min−1, Single injection, 8 mg fuel per injection, Injection pressure 65 MPa, 100 kPa absolute intake pressure).
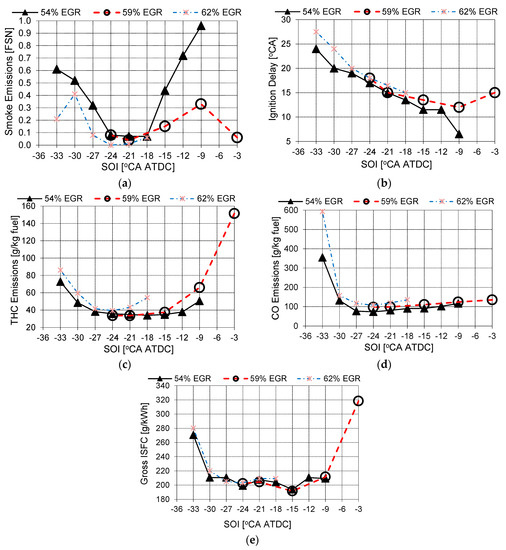
Figure 6.
(a) Smoke (b) ignition delay, (c) THC and (d) CO emissions and (e) GISFC during the SOI sweep at 54%, 59% and 62% EGR rates.
From the emissions data (Figure 6), a few general trends are apparent. Smoke emissions are minimized in the range of –18 to –24 °CA ATDC injection timing, irrespective of dilution level. A similar trend is seen in THC emissions, while both CO emissions and GISFC show less sensitivity to injection timing. The high smoke and THC emissions at later SOI are a result of retarded combustion phasing and shorter ignition delays, which combine to result in less time for premixing—leading to higher soot formation—and reduced time for oxidation before the bulk temperature drops during the expansion stroke. Under advanced timings (SOI earlier than −24 °CA ATDC), THC and smoke emissions increased. As will be discussed in Section 3.4, this is attributed primarily to impingement of the fuel spray on the top of the piston, outside of the piston bowl. This effect also influenced the overall thermal efficiency, with higher THC and CO emissions at advanced (beyond −24 °CA ATDC) and retarded (before −12 °CA ATDC) SOIs reducing the combustion efficiency, as shown in the GISFC plot in Figure 6e. Over a range of injection timings (between −9 and −24 °CA ATDC), however, the overall changes in GISFC were marginal.
Further insight into the effects of injection timing can be extracted from the energy release rate plots, based on the cylinder pressure, and the in-cylinder temperature and KL factor, from the two-colour pyrometry measurements. With 54% EGR level, when the SOI was advanced from −9 to −18 °CA ATDC, combustion phasing advanced and the peak flame temperature increased as shown in Figure 7a. When the SOI was advanced beyond −18 °CA ATDC, the peak flame temperature decreased, while the location of peak flame temperature remained close to the TDC. When the fuel injection timing was advanced beyond −24 °CA ATDC, the flame temperature dropped very quickly, along with the intensity of the energy release rate (Figure 7c). Local soot concentrations, as indicated by KL factor, are highest with the latest injection timing (−9 °CA ATDC), consistent with less mixing time prior to the start of combustion (indicated by a short ignition delay, shown in Figure 6b). For injection timings earlier than −24 °CA ATDC, KL factors are low (<0.1) despite the engine-out FSN increasing. This suggests some other mechanism is leading to soot formation, other than formation in less-mixed fuel-air pockets during the combustion event.
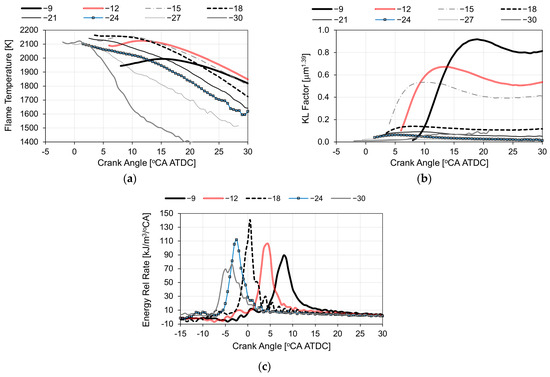
Figure 7.
Flame temperature (a), KL factor (b) and energy release rate (c) during an SOI sweep for the 8 mg/cycle fuelling quantity at 54% EGR.
Combining the results from Figure 6 and Figure 7, at 54% EGR, an optimal timing window can be observed between −18 and −24 °CA ATDC. This region includes relatively low emissions of PM, THC and CO as well as minimized GISFC. The energy release rate shows a strong and stable main combustion event, with high combustion stability (COV of GIMEP < 2%, Table 4), while two-colour pyrometry measurements indicate a long-duration combustion event with durations of 20 °CA or more where in-cylinder temperatures are sufficient (>1800 K) to oxidize partial combustion products.
The variations of flame temperatures and energy release rates at different SOIs at 59% EGR rate is presented in Figure 8, with corresponding in-cylinder flame luminosity images at selected SOIs (−3, −9, −15 and −24 °CA ATDC) at CA70 (crank angle corresponding to 70% cumulative energy release), shown in Figure 9. At −3 °CA ATDC SOI a little natural luminosity is observed (note that the intensity of all the images were enhanced by the same factor), although the two-colour pyrometry results do resolve temperatures in the reaction zone as high as 2100 K; however, this occurs late in the expansion stroke, resulting in less useful energy release and a rapid drop in the temperature as expansion occurs. At −9 °CA ATDC SOI, intense soot luminosity can be seen, along with a higher energy release rate and more rapid combustion compared to the −3 °CA ATDC case. With more advanced SOI (−15 °CA ATDC), both peak energy release rate and peak flame temperature increase and occur closer to TDC. A more robust luminous flame can be observed in the borescope images, Figure 9b,c. However, when the SOI was advanced further (−24 °CA ATDC), both peak energy release rate and flame temperature decrease with a diminished flame luminosity, Figure 9d. The long ignition delay (see Figure 6) helps to minimize the flame luminosity for SOIs at −3 and −24 °CA ATDC.
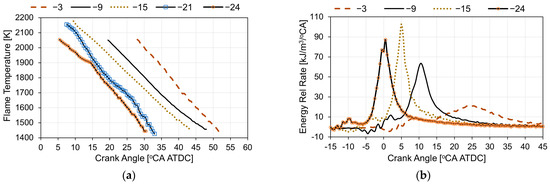
Figure 8.
Flame temperature (a) and energy release rate (b) during an SOI sweep at 59% EGR and 8 mg/cycle fuelling quantity. Legend entries are SOI in °CA ATDC.
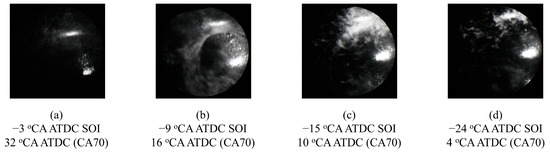
Figure 9.
Comparative flame images at CA70 and 59% EGR over the range of SOI’s tested; (a)—3 °CA ATDC (b)—9 °CA ATDC (c)—15 °CA ATDC (d)—24 °CA ATDC SOIs. The intensity of the images is increased by a factor of two.
At −3 and −9 °CA ATDC SOIs, the retarded phasing of the peak flame temperatures correlates well with the retarded phasing of peak energy release rate (shown in Figure 8b) and CA50 data listed in Table 4. At advanced SOIs (−15 and −21 °CA ATDC), the peak flame temperatures were higher than retarded SOIs and occurred close to TDC; but the rate of decrease of the flame temperature at −21 °CA ATDC SOI was faster compared to −15 °CA ATDC SOI although for both the SOIs, the phasing of the peak flame temperatures was identical. For SOI at −24 °CA ATDC, the peak flame temperature reduced and occurred closer to TDC. Notably, when SOIs were advanced from −3 to −24 °CA ATDC, THC and CO emissions decreased continuously with advanced and near-TDC phasing of peak flame temperatures at moderate intake oxygen mass fractions of 14.4 ± 0.9. The peak flame temperature was greater than 2000 K in all the cases. However, the more advanced combustion with peak flame temperature closer to TDC helped reduce bulk quenching, leading to the observed reduction in THC and CO emissions. This reaffirms our earlier hypothesis that high flame temperature, sufficient local oxygen concentrations and intense near-TDC mixing and long high-temperature residence times are critical to minimize bulk quenching [33].
From this investigation, it is clear that although the high-dilution LTC strategy with retarded near-TDC SOIs lead to simultaneous near-zero smoke and Nox emissions due to longer ignition delay and low flame temperatures (non-luminous combustion), THC and CO emissions and cyclic variations remain high. Advancing the SOI leads to a higher energy release rate and in-cylinder soot formation as well as increased soot oxidation processes; these effects are balanced to retain near-zero smoke and Nox emissions, with low CO and THC emissions and low cyclic variations. However, advancing the SOI to more than −24 °CA ATDC rapidly increases CO, THC and smoke emissions with reducing peak energy release rate and no significant change in combustion phasing. This may be a result of excessive fuel mixing prior to ignition or to interaction between the diesel sprays and the piston crown leading to poor fuel-air mixing. The latter hypothesis was investigated in work reported in the next section.
3.4. Spray Impingement on Piston Lip/Impingement in the Squish Region
When the SOI was advanced to −27 °CA ATDC or earlier, THC, CO and smoke emissions increased, while peak energy release rate and in-cylinder temperatures dropped rapidly with no change in combustion phasing. This could be a result of interactions between the spray and the piston squish deck. This would result in in-cylinder combustion phenomena differing from those of later SOIs. To assess this hypothesis, spray penetration correlations can be used to estimate the spray location relative to the piston with early SOIs. Although the limited field of view of the borescope limited the ability to observed spray impingement on the piston squish region, the spray penetration length can be determined using the spray penetration model of Hiroyasu and Arai [34]. This is shown in Figure 10a for three SOIs (−21, −27 and −33 °CA ATDC) using the measured combustion chamber and injection pressures along with the mass averaged bulk gas temperature calculated from in-cylinder pressure and volume data. The calculation suggests that the spray penetration 1.5 °CA after SOI is more than 24 mm. This would lead to the spray impinging on the piston bowl for the −21 °CA ATDC SOI case, on the piston lip for −27 °CA ATDC and on the piston crown/squish region (−33 °CA ATDC SOI). These spray targeting regions are shown in Figure 10b–d. The combustion system was designed for the spray to impinge in the piston bowl, where the bowl shape helps to enhance combustion rates through better mixing and oxidation of the fuel. However, when the spray impinges on the piston lip or the squish region, some or all of the impinging diesel jet continues to flow outwards along the surface of the piston, resulting in degraded mixing and less combustible fuel/air mixture in the combustion bowl to participate in the primary, partially premixed reactions of LTC. It should be noted that while using the Hiroyasu and Arai model, it can be seen that 1.5 °CA after SOI, the spray impinges on the piston bowl/lip or the squish region prior to the spray breakup time.
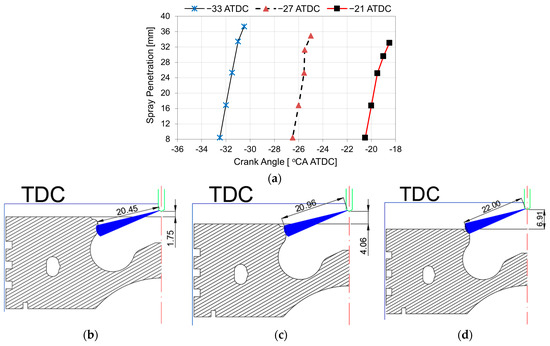
Figure 10.
(a) Spray penetration lengths at different SOIs; spray penetration analysis showing spray impingement positions on the piston bowl, piston lip and squish regions 1.5 °CA after the commanded SOI timing with (b) −21 °CA ATDC SOI (c) −27 °CA ATDC SOI and (d) −33 °CA ATDC SOI under naturally aspirated condition (100 kPa absolute intake pressure). The distance from the injector to the spray tip is in mm.
3.5. Kinetic Parameters of NOx Formation with EGR Dilution
In order to determine the kinetic parameters of NOx formation, all the peak flame temperatures for the evaluated conditions were plotted as a functions of the measured NOx concentrations, as shown in Figure 11. As discussed in Section 3.1, two regions of differing slopes can be seen in the figure—one greater than a flame temperature of 2000 K and the other below 2000 K. The results suggest that below 2000 K, NOx is relatively independent of flame temperature, suggesting that thermal (Zeldovich) NO production is not dominant below 2000 K. This aligns with fundamental studies of thermal NO production [35] and results from conventional diesel combustion (e.g., Plee et al. [36]).
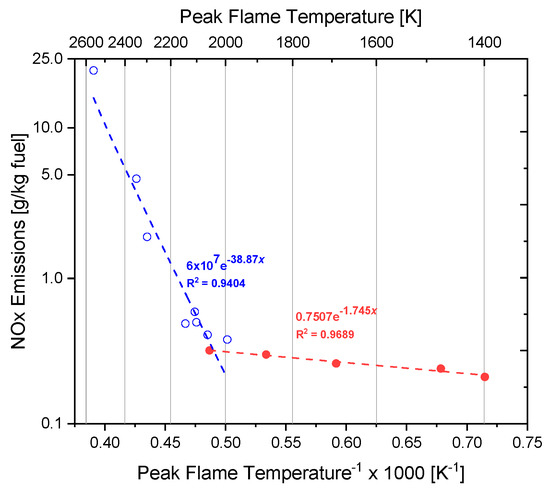
Figure 11.
NOX emissions vs. peak flame temperatures for all operating parameters at low load condition (1500 rev.min−1, 8 mg/cycle fuelling quantity).
The clear distinction at approximately 2000 K is clearly shown in the Arrhenius style plot shown in Figure 11. Above 2000 K there is a strong exponential relationship with index of correlation (R2~0.94). and a slope of −38,870 K. This slope differs by less than 5% from both the theoretical activation temperature (E0/R0) (−38,248 K) for thermal NO production via the Zeldovich mechanism [29] and values reported for diesel engines, of approximately −36,700 K (for, e.g., [36]). The NOx emissions and peak flame temperatures in the low peak flame temperature regions (<2000 K) were also fitted with an Arrhenius type exponential relation with a strong correlation (R2 value ~0.97). The activation temperature (1745 K) reduced significantly compared to the activation temperature (38,248 K) corresponding to thermal NOx production for flame temperatures > 2000 K. Note the several order of magnitude difference in the pre-exponential factor between the high temperature and low temperature Arrhenius correlations (6 × 10⁷ vs. 0.7507) which imply that the effect of temperature on NO formation is minimal for flame temperatures below 2000 K. These results reinforce and explain the observed results that further dilution with EGR does not reduce NO emissions even though it continues to reduce the flame temperature. The change in the NO formation mechanism at ~2000 K shown in Figure 11 demonstrates that for the small amounts of NO being emitted (<10 ppm) either the ‘prompt’ or ‘N2O’ mechanisms are dominant under high-dilution LTC under the conditions evaluated here. This also explains previous work that reported similar results [30,31] but which lacked the insight provided by the in-cylinder temperature measurements. In particular, the NO activation temperature (1745 K) in the low temperature regions is close to the activation temperature of 1508 K reported by [37] which was obtained from measured engine-out NOx emissions and for calculated adiabatic flame temperatures lower than 2270 K.
4. Conclusions
This work investigated the effects of EGR level on engine performance and emissions at conditions encountered during a transition from low-dilution conventional diesel combustion to high-EGR low temperature combustion. In-cylinder flame temperature and combustion images were collected at these conditions and used to relate in-cylinder processes with performance metrics. Within the LTC regime, the impacts of minor changes in EGR rates that could be encountered in-service due to cylinder to cylinder variation and during transient operation were evaluated. The ability to use SOI as a control tool to compensate the combustion behaviour for the changes in the EGR rates were also evaluated. The key conclusions and findings from this work:
- The measurement of in-cylinder flame temperatures during transition from conventional diesel to high-dilution LTC indicated that flame temperature decreased monotonically even though the SOI was advanced to enhance the combustion. At low load (300 kPa gross IMEP), LTC—as defined by simultaneous low smoke and low NOx levels—was achieved at ~54% EGR (~14% intake oxygen mass fraction).
- At intermediate EGR levels (47% EGR, ~17.4%), advanced injection timing (−9 °CA ATDC) led to in-cylinder temperatures similar to the less dilute CDC case (38% EGR—~19.2%), but with an equivalent ignition delay and lower oxygen content. This led to higher soot formation with limited subsequent soot oxidation, resulting in the highest measured in-cylinder KL factor and engine-out soot emissions.
- At the onset of LTC (corresponding to 54% EGR level—~15%), an optimal injection timing window can be observed between −18 and −24 °CA ATDC. This region includes relatively low emissions of PM, THC and CO as well as minimized GISFC and good combustion stability (COV of IMEP < 2%). The two-colour pyrometry measurements indicate a long-duration combustion event with durations of 20 °CA or more where in-cylinder temperatures are sufficient (>1800 K) to oxidize partial combustion products.
- With LTC, advancing the injection provides longer premixing before start of combustion, leading to improved combustion performance. The degree of advance is limited by the need to avoid the diesel spray impinging on the piston lip or squish region. This impingement leads to poor combustion, low thermal efficiency and high combustion by-product emissions.
- NOx emissions correlate well with the peak flame temperature. The activation energy value quantified using engine-out Nox concentrations and measured peak flame temperatures for low to moderate dilution levels, agrees well with the value reported in previous literature. At higher dilution levels (once LTC is achieved), the NOx-peak flame temperature correlation exhibited a lower activation energy and a lower pre-exponential factor which is several orders of magnitudes lower than that of high flame temperatures, indicating a much lower sensitivity of NOx to peak flame temperature at low intake oxygen mass fractions.
- At retarded SOI, the retarded occurrence of peak flame temperature and shorter residence time of high flame temperature are responsible for the combustion instability and bulk quenching which leads to high THC and CO emissions in the high-dilution LTC strategy. With advanced SOI, the peak flame temperature is advanced towards TDC which leads to reduced degree to bulk quenching and hence, lower THC and CO emissions and lower cyclic variability.
- When the timing is advanced beyond −24 °CA ATDC, the flame temperature drops very quickly in the high-dilution LTC strategy. This is a result of spray impingement on the piston lip or a large part of the spray missing the piston bowl. This would likely lead to an over-lean mixture in the piston bowl with rich pockets in the squish region leading to poor combustion in the partially premixed combustion conditions. This leads to a rapid reduction in the flame temperature and increases the smoke, THC and CO emissions and combustion variability.
The high-dilution LTC strategy (EGR levels ~54% or higher) can consistently achieve very low engine-out NOx (<10 ppm) emissions. Emissions of CO, THC and smoke can also be minimized by avoiding higher dilution levels. As dilution levels will vary between cylinders and during transients in an in-service engine, fuel injection timing can be used to reduce emissions and avoid increases in combustion instability. Advancing fuel injection timing to achieve maximum IMEP while avoiding piston lip and squish region spray impingements is critical. As there is only so much that injection timing control can do to offset variations in dilution levels, air path control is also critical to the successful use of high-dilution LTC. These results demonstrate a practical path to achieving a robust low-temperature combustion control strategy for part-load operation in a diesel engine. Further development should focus on applying the findings to higher load conditions and to maintain stable, low-smoke combustion during a mode transition to conventional diesel combustion at higher loads.
Author Contributions
Conceptualization, A.K.S., G.P.M.-C. and C.P.G.; Methodology, A.K.S. and C.P.G.; Formal analysis, A.K.S.; Resources, G.P.M.-C.; Writing—original draft, A.K.S.; Writing—review & editing, G.P.M.-C. and C.P.G.; Visualization, A.K.S.; Supervision, G.P.M.-C. and C.P.G.; Project administration, G.P.M.-C.; Funding acquisition, G.P.M.-C. and C.P.G. All authors have read and agreed to the published version of the manuscript.
Funding
This research was funded by the UK Engineering and Physical Sciences Research Council (EPSRC) grant number F031351/01 and the Royal Academy of Engineering. The APC was funded by Simon Fraser University.
Data Availability Statement
The data used to support the reported results are available from the corresponding author upon reasonable request.
Acknowledgments
The authors acknowledge the contributions of E Winward, S Horner, A Broster, G Smith and S Taylor at Loughborough University’s IC Engines and Powertrain Laboratory for the experimental work and Santanu Sahoo at IIT Bombay for support on image processing. The authors are particularly grateful for Martin Davy’s extensive support for the experimental research programme.
Conflicts of Interest
The authors declare no conflict of interest.
Abbreviations
| ATDC | After top dead centre |
| °CA | Degree crank angle |
| CA10 | 10% of cumulative energy release |
| CA50 | Mid-point of cumulative energy release |
| CA70, CA80 | 70% and 80% of cumulative energy release, respectively |
| CA90 | 90% of cumulative energy release |
| CA95 | 95% of cumulative energy release |
| CCD | Charge coupled device |
| CDC | Conventional diesel combustion |
| CO | Carbon monoxide |
| CO2 | Carbon dioxide |
| COV | Coefficient of variation |
| E0 | Activation energy |
| EGR | Exhaust gas recirculation |
| FOV | Field of view |
| FSN | Filter smoke number |
| GIMEP | Gross indicated mean effective pressure |
| GISFC | Gross indicated specific fuel consumption |
| KL | Soot absorption coefficient (K) and optical path length (L): an indicator of soot concentration [μm1.39] |
| LTC | Low temperature combustion |
| LTR | Low temperature reaction |
| MBT | Maximum advance for best torque |
| NOX | Oxides of nitrogen (NO and NO2) |
| N2O | Nitrous oxide |
| PM | Particulate matter |
| PMT | Photomultiplier tube |
| R0 | Universal gas constant |
| RCCI | Reactivity-controlled compression ignition |
| SCR | Selective catalytic reduction |
| SOC | Start of combustion |
| SOI | Start of injection |
| TDC | Top dead centre |
| THC | Total unburned hydrocarbons (C1) |
| Intake oxygen mass fraction (%) |
References
- Ladommatos, N.; Abdelhalim, S.; Zhao, H. The effects of exhaust gas recirculation on diesel combustion and emissions. Int. J. Engine Res. 2000, 1, 107–126. [Google Scholar] [CrossRef]
- Lambert, C.K. Perspective on SCR NOx control for diesel vehicles. React. Chem. Eng. 2019, 4, 969–974. [Google Scholar] [CrossRef]
- Joshi, A. Review of vehicle engine efficiency and emissions. SAE Int. Jn. Adv. Curr. Pract. Mobil. 2019, 1, 734–761. [Google Scholar]
- Conway, G.; Joshi, A.; Leach, F.; Garcia, A.; Senecal, P.K. A review of current and future powertrain technologies and trends in 2020. Transp. Eng. 2021, 5, 100080. [Google Scholar] [CrossRef]
- Boger, T.; Rose, D.; He, S.; Joshi, A. Developments for future EU7 regulations and the path to zero impact emissions—A catalyst substrate and filter supplier’s perspective. Transp. Eng. 2022, 10, 100129. [Google Scholar] [CrossRef]
- Sarangi, A.K.; Garner, C.P.; McTaggart-Cowan, G.P.; Davy, M.H.; Wahab, E.; Peckham, M. Managing the transition between low temperature combustion and conventional diesel combustion during a load change. In Proceedings of the ASME Internal Combustion Engine Division Fall Technical Conference, Vancouver, BC, Canada, 23–26 September 2012; pp. 243–255, Paper No. ICEF2012-92049. [Google Scholar]
- Sarangi, A.K.; Garner, C.P.; McTaggart-Cowan, G.P.; Davy, M.H.; Wahab, E.; Peckham, M. Load transient between conventional diesel operation and low-temperature combustion. IMechE Part D J. Automob. Eng. 2015, 229, 850–865. [Google Scholar] [CrossRef]
- Han, S.; Bae, C.; Choi, S.B. Effects of operating parameters on mode transition between low-temperature combustion and conventional combustion in a light-duty diesel engine. Int. J. Engine Res. 2012, 14, 231–246. [Google Scholar] [CrossRef]
- Carlucci, A.P.; Laforgia, D.; Motz, S.; Wenzel, S.P. Advanced closed loop combustion control of a LTC diesel engine based on in-cylinder pressure signals. Energy Convers. Manag. 2014, 77, 193–207. [Google Scholar] [CrossRef]
- Paykani, A.; Garcia, A.; Shahbakhti, M.; Rahnama, P.; Reitz, R.D. Reactivity controlled compression ignition engine: Pathways towards commercial viability. Appl. Energy 2021, 282, 116174. [Google Scholar] [CrossRef]
- Agarwal, A.K.; Singh, A.P.; Garcia, A.; Monsalve-Serrano, J. Challenges and opportunities for application of reactivity-controlled compression ignition combustion in commercially viable transport engines. Prog. Energy Combust. Sci. 2022, 93, 101028. [Google Scholar] [CrossRef]
- Lee, J.; Chu, S.; Lim, D.; Jung, H.; Chi, Y.; Min, K. Comparison of combustion and emission characteristics under single-fueled and dual-fueled conditions with premixed compression ignition. Energy 2022, 241, 122855. [Google Scholar] [CrossRef]
- Sogbesan, O.; Garner, C.P.; Davy, M.H. The effects of increasing FAME biodiesel content on combustion characteristics and HC emissions in high-EGR low temperature combustion. Fuel 2021, 302, 121055. [Google Scholar] [CrossRef]
- Ma, Q.; Zhang, Q.; Zheng, Z. An experimental assessment on low temperature combustion using diesel/biodiesel/C2, C5 alcohol blends in a diesel engine. Fuel 2021, 288, 119832. [Google Scholar] [CrossRef]
- Agarwal, A.K.; Singh, A.P.; Maurya, R.K. Evolution, challenges and path forward for low temperature combustion engines. Prog. Energy Combust. Sci. 2017, 61, 1–56. [Google Scholar] [CrossRef]
- Cong, S.; McTaggart-Cowan, G.; Garner, C. Effects of Fuel Injection Parameters on Low Temperature Diesel Combustion Stability; SAE Paper No. 2010-01-0611; SAE International: Warrendale, PA, USA, 2010. [Google Scholar]
- Bittle, J.; Zheng, J.; Xue, X.; Song, H.; Jacobs, T. Cylinder-to-cylinder variation sources in diesel low temperature combustion and the influence they have on emissions. Int. J. Engine Res. 2014, 15, 112–122. [Google Scholar] [CrossRef]
- Han, S.; Kim, J.; Bae, C. Effect of air-fuel mixing quality on characteristics of conventional and low temperature diesel combustion. Appl. Energy 2014, 119, 454–466. [Google Scholar] [CrossRef]
- Jung, Y.; Park, S.S.; Bae, C. Effects of oxygen concentration on highly diluted charge compression ignition combustion in a diesel engine. Appl. Therm. Eng. 2015, 90, 538–550. [Google Scholar] [CrossRef]
- Ogawa, H.; Morita, A.; Futagami, K.; Shibata, G. Ignition delays in diesel combustion and intake gas conditions. Int. J. Engine Res. 2018, 19, 805–812. [Google Scholar] [CrossRef]
- Inaba, K.; Ojima, Y.; Masuko, Y.; Kobashi, Y.; Shibata, G.; Ogawa, H. Thermal efficiency improvement with super-charging and cooled exhaust gas recirculation in semi-premixed diesel combustion with a twin peak shaped heat release. Int. J. Engine Res. 2019, 20, 80–91. [Google Scholar] [CrossRef]
- Sarangi, A.K.; Garner, C.P.; McTaggart-Cowan, G.P.; Davy, M.H.; Wahab EPeckham, M. Effects of engine operating parameters on diesel low temperature combustion with split fuel injection. IMechE Part D J. Automob. Eng. 2012, 226, 1271–1286. [Google Scholar] [CrossRef]
- AVL List GmbH. Instruction Manual for Cylinder Head with Endoscopic Access for AVL 5402 Single Cylinder Research Engine No. 5402.055; AVL List GmbH: Graz, Austria, 2009. [Google Scholar]
- Sarangi, A.K.; McTaggart-Cowan, G.; Davy, M.H.; Kirchen, P.; Garner, C.P. Two-Colour Pyrometry Measurements of Low-Temperature Combustion Using Borescopic Imaging; SAE Paper No. 2021-01-0426; SAE International: Warrendale, PA, USA, 2021. [Google Scholar]
- Heywood, J.B. Internal Combustion Engines Fundamentals, 2nd ed.; McGraw Hill Book Company: Windsor, NJ, USA, 2018. [Google Scholar]
- Cong, S. An Experimental Study of Low Temperature Combustion in a Diesel Engine. Ph.D. Thesis, Loughborough University, Loughborough, UK, 2011. [Google Scholar]
- Sarangi, A.K. Diesel Low Temperature Combustion—An Experimental Study. Ph.D. Thesis, Loughborough University, Loughborough, UK, 2012. [Google Scholar]
- Sarangi, A.K.; McTaggart-Cowan, G.P.; Garner, C.P. The Effects of Intake Pressure on High EGR Low Temperature Diesel Engine Combustion; SAE Paper No. 2010-01-2145; SAE International: Warrendale, PA, USA, 2010. [Google Scholar]
- Warnatz, J.; Maas, U.; Dibble, R.W. Combustion Physical and Chemical Fundamentals, Modeling and Simulation, Experiments, Pollutant Formation, 4th ed.; Springer Publication: Berlin/Heidelberg, Germany, 2006. [Google Scholar]
- Yoshikawa, T.; Reitz, R.D. Development of an improved NOx reaction mechanism for low temperature diesel combustion modelling. SAE Int. J. Engines 2009, 1, 1105–1117. [Google Scholar] [CrossRef]
- Desantes, J.M.; Lopez, J.J.; Redon, P.; Arregle, J. Evaluation of the thermal NO formation mechanism under low temperature diesel combustion conditions. Int. J. Engine Res. 2012, 13, 531–539. [Google Scholar] [CrossRef]
- Miller, J.A.; Bowman, C.T. Mechanism and modeling of nitrogen chemistry in combustion. Prog. Energy Combust. Sci. 1989, 15, 287–338. [Google Scholar] [CrossRef]
- Sarangi, A.K.; Garner, C.P.; McTaggart-Cowan, G.P.; Davy, M.H.; Hargrave, G.K. The impact of intake pressure on high exhaust gas recirculation low-temperature compression ignition engine combustion using borescopic imaging. Int. J. Engine Res. 2021, 22, 2347–2361. [Google Scholar] [CrossRef]
- Hiroyasu, H.; Arai, M. Structures of fuel sprays in diesel engines. SAE Trans. 1990, 99, 1050–1061. [Google Scholar]
- Lavoie, G.A.; Heywood, J.B.; Keck, J.C. Experimental and theoretical investigation of nitric oxide formation in internal combustion engines. Combust. Sci. Technol. 1970, 1, 313–326. [Google Scholar] [CrossRef]
- Plee, S.L.; Ahmad, T.; Myers, J.P.; Faeth, G.M. Diesel NOx emissions-a simple correlation technique for intake air effects. In Proceedings of the 19th International Symposium on Combustion, Haifa, Israel, 8–13 August 1982; pp. 1495–1502. [Google Scholar]
- Kook, S.; Bae, C.; Miles, P.C.; Choi, D.; Pickett, L.M. The Influence of Charge Dilution and Injection Timing on Low-Temperature Diesel Combustion and Emissions; SAE Paper No. 2005-01-3837; SAE International: Warrendale, PA, USA, 2005. [Google Scholar]


Disclaimer/Publisher’s Note: The statements, opinions and data contained in all publications are solely those of the individual author(s) and contributor(s) and not of MDPI and/or the editor(s). MDPI and/or the editor(s) disclaim responsibility for any injury to people or property resulting from any ideas, methods, instructions or products referred to in the content. |
© 2022 by the authors. Licensee MDPI, Basel, Switzerland. This article is an open access article distributed under the terms and conditions of the Creative Commons Attribution (CC BY) license (https://creativecommons.org/licenses/by/4.0/).