Abstract
Series arc faults cause the majority of household fires involving electrical failures or malfunctions. Low-fault current amplitude is the reason for the difficulties faced in implementing effective arc detection systems. The paper presents a novel arc detection and faulty line identification method. It can be easily used in the low-voltage Alternate Current (AC) household network for arc detection in the Non-Intrusive Load Monitoring (NILM). Unlike existing methods, the proposed approach exploits both current and voltage signal time domain analysis. Experiments have been conducted with up to six devices operating simultaneously in the same circuit with an arc fault generator based on the IEC 62606:2013 standard. Sixteen time-domain features were used to maximize the arc-fault detection accuracy for particular appliances. Performance of the random forest classifier for arc fault detection was evaluated for 28 sets of features with five different sampling rates. For the single period analysis arc, detection accuracy was 98.38%, with F-score of 0.9870, while in terms of the IEC 62606:2013 standard, it was 99.07%, with F-score of 0.9925. Location of a series arc fault (line selection) was realized by identifying devices powered by the faulty line. The line selection was based on the Mean Values of Changes feature vector (MVC50), calculated for absolute values of differences between adjacent current signal periods during the arc fault. The fault location accuracy was 93.20% for all cases and 98.20% for cases where the arc fault affected a single device.
1. Introduction
Arc fault, the phenomenon of plasma discharge, is the unintentional arcing condition in the electrical circuit caused by insulation aging, loose wiring, or external damage. Arc faults occur when there is discontinuity on the conductors. It is a serious problem in the low-voltage network and a common cause of home fires. According to the French ONSE (Observatoire National de la Sécurité Electrique), 25% of the fires in France are caused by electrical sources [1]. American National Fire Protection Association (NFPA) report indicates that the arc was the source of heat for 63% of home fires involving electrical failure or malfunction from 2015–2019 [2]. A series and parallel arc fault circuit can be distinguished [3] (Figure 1). During the latter (similar to the short circuit), overcurrent and earth leakage manifest, triggering standard protection devices such as fuses and circuit breakers. Unfortunately, the series arc is more challenging to detect. When it occurs on a single line, the current decreases and the change amplitude is much smaller than for a parallel arc. As the arc and the load form the series, the current magnitude on the line decreases. Standards were formulated to prevent the consequences of arc faults, such as American UL1699 [4] and European IEC 62606 [5]. They recommend the use of Arc Fault Circuit Interrupters (AFCIs) and Arc Fault Detection Devices (AFDD), respectively. Their accuracy is limited in the case of a series arc fault. Some devices (e.g., motors, electronic switching mode power supplies) generate series arcs during operation [6]. Further research is needed to develop an effective and affordable method for detecting arc fault in series and identifying the electrical network branch in which arc fault occurs, called line selection.
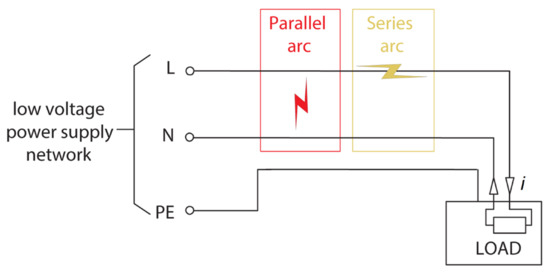
Figure 1.
Parallel and series arc fault, L: Live, N: neutral, PE: earth.
The arc faults are present in low-voltage AC and DC networks. There is a wide research area for DC series arc detection, especially in photovoltaics systems [7,8,9,10,11,12,13,14,15,16]. DC signals are not periodic, so arc fault may not be easily detected via recognizable amplitude or frequency signatures with pattern recognition techniques. Arc detection and location systems for such systems often exploit spectral analysis with Short Term Fourier Transform [7,17] and Wavelet Transform [9,16]. The use of Adaptive Local Mean Decomposition was proposed in [10]. The lightweight convolutional neural network (CNN) for arc fault detection in PV systems was described in [11]. Neural networks were also tested in [12,14,18].
For AC networks, the arc detection and location systems considered three main concepts—mathematical models of the arc, physical characteristics of the arc, and analysis of the characteristics of arc voltage and current signal. Due to the diversity of the arc faults, their mathematical models required a large number of parameters and lacked accuracy [19]. Analysis of the physical arc’s characteristics was based on the corresponding light, heat, or electromagnetic radiation [20,21,22]. These methods were applied in arc detection in medium-voltage switchgear. Arc fault detectors in these methods detected high-intensity light that occurred during the arc fault. This is impractical in a household low voltage network because the wires are hidden in the wall, floor, etc., where an optical sensor cannot be used. The usefulness of some series arc features was proven. Time domain features included Zero Current Period (ZCP) [23,24,25,26], the ratio of the current rate of change to the RMS value (CRC) [26], Maximum Split Difference (MSD) [23], and measures related to Euclidean distance (E, MED—Maximum Euclidean Distance) between adjacent cycles [23,24,25]. The original feature space was often transformed to increase the detection probability. Arc detection accuracy of 99.1% and load identification of 99.3% were achieved using PCA and SVM in [23], but it considered only the case of individually operating devices. In [24], where up to 4 appliances operate simultaneously, the accuracy was 94.86%.
Load identification and line selection based on harmonic current disaggregation of known appliances in operation accuracy was 90.91%. In [26], the distinguishability of categories in the ZCP-CRC plane for the individual appliance operation is presented. In [25] zero–current time proportional coefficient was combined and compared to the empirical threshold to determine whether there was a series arc. Spectral Dispersion Index analysis with adaptive threshold was exploited in [27]. The detection was up to 100%, but with a notable number of false detections and only one load operating at a time. Gray-Level Co-Occurrence Matrix (GLCM) allowed for arc detection accuracy of 99% and appliance identification accuracy of 98% (among 13 appliances) [28]. Multi-load scenario was considered in [29], where wavelet transform, variational mode decomposition, and Wigner-Ville distribution were exploited. The accuracy of arc fault detection was 99.0%, and line selection was 94.1%. In [30,31], neural networks were used for frequency analysis with high accuracy achieved with no information if single or multi-load scenarios were considered. Line selection method based recurrent neural networks (RNN) was proposed in [32] with an accuracy of 98.7% achieved. The analysis involved a 7.5 kW three-phase motor. Some of the cited references include additional features (such as harmonic content in [24]). This study was limited to the analysis of time-domain features only.
The use of methods based on time-domain analysis simplified and accelerated the performance of the detection system. Algorithms for arc fault detection in practical application were implemented in real-time systems. The following paper proposes a novel method for arc detection and line selection. The method consisted of a measurement part (data acquisition), data pre-processing (feature extraction), and decision-making (arc fault detection with random forest classifier and line selection with k-nearest neighbors algorithm). The data processing approach was based on the NILM framework proposed in [33], where the analysis was performed in the time domain. Periodicity of the network voltage signal was exploited by dividing the signal into separate periods. It was assumed that the beginning of each period was the time instant of the voltage’s fundamental component zero crossing. From these periods, the array-like representation of the current and voltage samples vectors was constructed. It enabled easy calculation of the proposed arc detection features and current signal changes aggregation across consecutive periods during the arc. The mean values of changes between the adjacent current periods, during which an arc fault occurred in the last second (), had a repeatable character. This can be considered characteristic for appliances on the fault network branch, despite these changes being discontinuous and having aperiodic characteristics. It should also be noted that arc fault does not have to last continuously. The proposed method enhanced the functionality of the NILM system [33], as analyzed signals were collected at a single point of the electrical network.
Unlike other methods for series arc detection in AC networks, the proposed approach used a voltage signal for the time domain analysis. Values of features extracted from the voltage signal were more resilient to the load-specific changes in non-arc conditions than features extracted from the current signal. This was essential for avoiding false detections.
The content of the paper is as follows. Section 2.1 covers the applied measurement system for Data Acquisition (DAQ) and extracted dataset characteristics. A total of 16 tested arc fault features are defined in Section 2.2. Section 2.3 covers the proposed algorithm for the identification of series arc fault location, including the calculation of the feature vector. Obtained results for arc detection and line selection are presented in Section 3.1 and Section 3.2, respectively. Discussion and future prospects are presented in Section 3.3. Section 4 summarizes the conclusions of the research.
2. Description of the Method
The proposed method was developed based on the uniquely prepared dataset and consisted of two steps (Figure 2). The first one was the general detection of arc fault occurrence in the analyzed circuit (arc fault detection section in Figure 2). It used 16 features indicating the presence of an arc fault (see Section 2.2). The second step was the fault location (arc fault location section in Figure 2). For each period arc fault detection features were calculated. On the basis of these features, detection of a series arc fault was performed using a random forest classifier. If an arc fault was detected in period , the value of the parameter (number of periods in which an arc fault was detected in the last second) was stored in the table in column. If in the last second more than 6 periods with arc fault were detected () then feature was calculated and the line selection process with k-nearest neighbors was performed. This was done through the identification of the appliance powered by an arc fault, hence the particular line. Device identification was based on the novel feature vector proposed in this publication (see Section 2.3). The proposed method enhanced the functionality of the NILM system as in [33]—analyzed signals were collected at a single point of the electrical network.
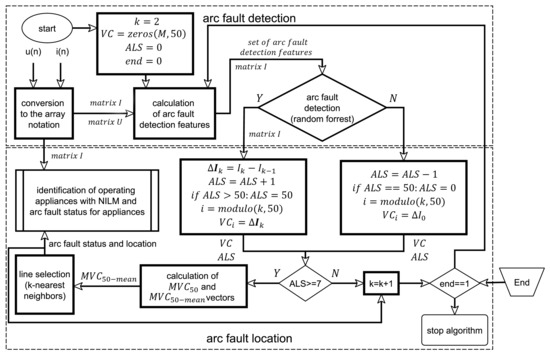
Figure 2.
Arc fault detection and location algorithm.
2.1. Experimental Setup, Dataset, and Data Processing
The experimental setup is shown in Figure 3. The measuring system (based on the 16-bit Advantech PCIE-1816 DAQ card) was adapted from [33]. Signals representing values of the total current in the main power line and the -th socket () were measured using the current transformers (indicated in Figure 3 as and ). The transformer allowed for acquisition of . Voltages and currents , , were measured only for method verification and were not used in the actual NILM system.
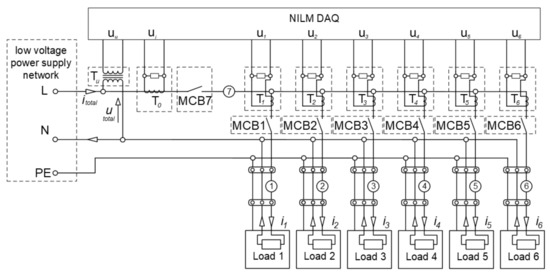
Figure 3.
Experimental setup scheme.
Experiments were conducted for six typical household appliances of different types. Their characteristics (with the location identifier) are in Table 1. A total of 27 sequences of switching each of them on/off were recorded for classifier training purposes. During the test run, the series arc was generated using the arc generator (Figure 4) at a single socket (locations 1–6) or in the main power line (location 7), affecting connected devices. The arc fault generator is compliant with the IEC 62606:2013 standard [5]. In the case of locations 1–6, only one appliance was powered via an arc fault generator by inserting it between the power supply socket and tested appliances. At the same time, remaining appliances could operate in the other 5 lines, without an arc fault. They were used as masking loads, making the fault detection via and signals analysis more difficult. An arc fault scenario on the main power line was realized by the arc generator working at the circuit breaker in main power line (MCB, 7 at Figure 3).

Table 1.
Characteristics of the tested electrical appliances.
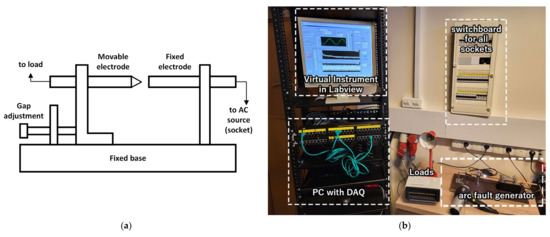
Figure 4.
(a) Schematic setup of series arc fault generator and (b) photo of experimental equipment.
In every run, signals and were registered. At the third channel of DAQ card, the signal representing was recorded (where was the socket number with the arc fault generator connected). These data were used for manual labeling feature vectors and comparison of single and multi-load scenarios. Up to 6 devices operated simultaneously during 15 measured sequences, while only one device was operating in the remaining 12 sequences. Collected data were split into two datasets: the training (7 sequences) and the testing (20 sequences). In the former, during 6 sequences, only one device was connected to the faulty line. During the 7th run, up to 6 devices worked when connected to the faulty line, while the arc fault generator was plugged into the main power line (location 7). The test dataset consisted of sequences with up to 6 devices working simultaneously (at their separate lines) and the arc fault generator plugged into different lines each time. If the arc fault generator was plugged into locations 1–6, one device was powered via a faulty line. At the same time, the remaining 5 appliances could operate normally via non-faulty lines, acting as masking loads. This way the test collection contained sequences of devices working in pairs, threes, fours, fives, and all 6. During data processing the signals and were divided into separate periods for feature extraction (conversion to array notation block in Figure 2). The procedure for transforming the signals and ( and in Figure 2, respectively) to array notation is described in [33]. The beginning of each period was the time instant of the voltage’s fundamental component zero crossing from negative to positive values. Proper selection of time instants required lowpass filtering of the original voltage signal with the cut-off frequency of 70 Hz. Hence the beginning of each period ( was the same, regardless of the disturbances in the particular power network. Table 2 summarizes the number of signal cycles included in the training and test sets considering arc and non-arc cases and arc fault generator location.
Table 2.
Summary of the number cycles in training and test datasets.
Signals , and from each sequence were transformed to 2D-arrays and , respectively [33]. Each column there represents samples from the single 50 Hz current period with
For = 250 kHz, it contained =5000 samples, identified by the index .
2.2. Feature Extraction for Arc Fault Detection
The occurrence of a series arc in the appliance branch caused changes in the current (and voltage signal observed, for instance, in [25]). Examples of such events are shown in Figure 5.
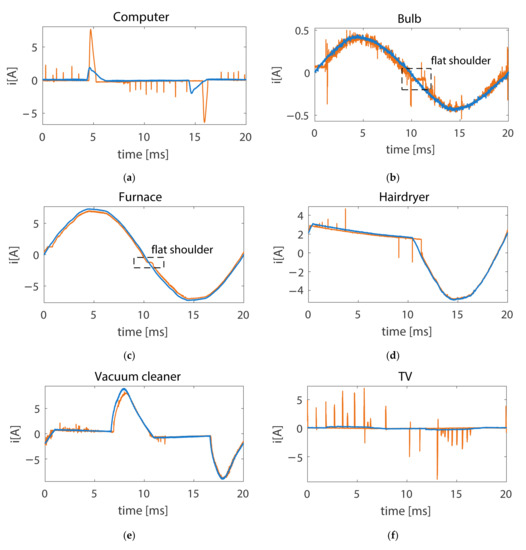
Figure 5.
Current waveform for individually operating appliances with (orange line) or without (blue line) presence of series arc fault. (a) computer, (b) bulb with marked flat shoulder effect, (c) furnace with marked flat shoulder effect, (d) hairdryer, (e) vacuum cleaner, (f) TV.
A method of calculating the following signal features for every signal period used an array notation of signals. The feature vector contained 16 positions: 7 pairs of features for current and voltage signals and only 2 features for the overall signal . A total of 5 were used in the literature, while 11 were the original input of the authors to the domain. The following were calculated both for current and voltage signal:
- The sum of differences between adjacent periods from the array [24]:
- The modified sum (2). Instead of the sum of differences between adjacent periods, the absolute values of these differences were used:
- The Maximum Euclidean Distance (MED) used in [23]:It indicated the largest Euclidean distance between 5 consecutive adjacent cycles. This can be a source of false detections in terms of the IEC 62606:2013 standard [5], in which the arc fault status is activated only when at least 7 cycles are identified as an anomaly within 1 s.
- Euclidean Distance , without selecting the maximum distance across consecutive cycles:
- Maximum Single Sample Distance (MSSD) was used:
- Maximum Slip Difference (MSD) [23] characterized abrupt changes in the current signal:
- The Maximum Change in a Cycle (MCC) without calculating ratio to RMS value was more efficient:Two features from [23,26] were calculated only for the current:
- CRC—the ratio of change between two consecutive samples to the RMS value from the previous cycle, presented in [26]:
- Zero Current Period (ZCP) represented the flat shoulder phenomenon characteristic for resistive appliances in case of an arc fault occurrence (Figure 5b,c). The feature was defined as the rate of all the samples in the current signal cycle whose absolute value was smaller than the 5% of RMS value in the previous cycle (:
The ZCP feature was efficient mostly for individually operating appliances. In the case of a larger number of devices operating simultaneously (where only a part is powered through an arc fault), the flat shoulder effect was reduced (Figure 6). There were current waveforms for the same two periods—one with the presence of an arc fault (orange line) and another without an arc fault (blue line). In Figure 6a, the analyzed signal was , including current signals suppressed by masking loads. The increase of ZCP in the case of an arc fault occurrence was minimal here. In Figure 6b, the analyzed signal was , which was sub-metered only for load 2 (bulb). There was an almost fourfold increase in the value of ZCP when an arc fault occurred.
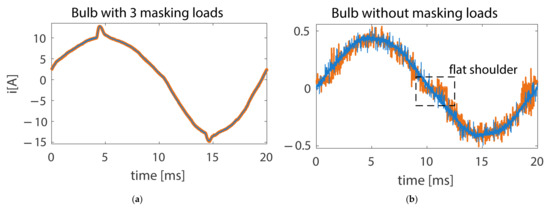
Figure 6.
Comparison of current waveforms for bulb operating with masking loads (a) and without masking loads (b) with (orange line) or without (blue line) presence of series arc fault. The arc-fault generator was plugged into location 2 (bulb). On (a) in addition to the bulb, computer, hairdryer, and furnace were operating. ZCP feature (10). value in case of operating masking loads ((a), analysis of the signal from Figure 3) increased from 0.0182 to 0.0188 after the occurrence of an arc fault. When no masking loads were working in the background ((b), analysis of the signal from Figure 3) ZCP increased from 0.0238 to 0.0820.
Based on these features, 28 sets of features were created. Their purpose was to check the influence of the sets of features on the classifier’s accuracy. They were applied to train a random forest classifier with the number of trees n = 25. It was useful when operating in measurement uncertainty conditions.
All analyzed feature sets (named as ‘#n’ with n ranging from 1 to 28) are presented in Table 3. The inclusion of the feature to the set #n is denoted by ‘x’. The performance of arc fault detection with particular sets of features is described in Section 3.1.
Table 3.
Analyzed sets of features.
Set #1 contained all features except ZCP and CRC. These features were used only for comparing with the literature references. Sets #2–#8 each included 6 of the 7 pairs of arc fault detection features included in set #1. Each of sets #2–#8 was missing a different pair of features included in set #1. Analysis of the results for sets #2 to #8 allowed us to evaluate the impact of missing features compared to the results for set #1 (containing all features). Set #9 contained only 6 features calculated by finding the maximum differences between adjacent periods or between consecutive samples (, , ). Detection accuracy could thus have been vulnerable to a decrease in sampling frequency. Set #10 consisted of features calculated on the basis of differences between whole adjacent periods (, , , ). The accuracy for #10 was less sensitive to a decrease in sampling frequency than for set #9.
For features , , , and (the time domain features already proposed in the cited literature), sets of features #11–#13 were created. They correspond to time-domain features used in the literature, such as #11 (, , ) [23], #12 ( and ) [26], and #13 ( and ) [24]. Set #14 included all features from literature (, , , , ). Sets #11–14 contained only features extracted from the current signal. To verify the change in detection accuracy by using additionally the voltage signal-based features (, , ), sets #15–#18 were defined.
To verify the possibility of arc fault detection based only on the current signal analysis, sets #19 to #28 were created. They contained the same features as sets #1 to #10, but only for the current signal.
2.3. Calculation of the MVC50 Feature Vector for Fault Location Identification
During an arc fault, the discontinuous and aperiodic characteristics changes were observed in the signal. Examples of changes between two adjacent periods are in Figure 7 and Figure 8 for the current and voltage signals, respectively. For SMPS (Switched Mode Power Supplies), power-supplied appliances such as a computer (Figure 7a and Figure 8a) or a tv set (Figure 7f and Figure 8f), these changes were short-term spikes with high amplitude. For resistive devices, the changes had the highest values near the voltage signal zero crossings (Figure 7b,d and Figure 8b,d), which was related to the flat shoulder effect.
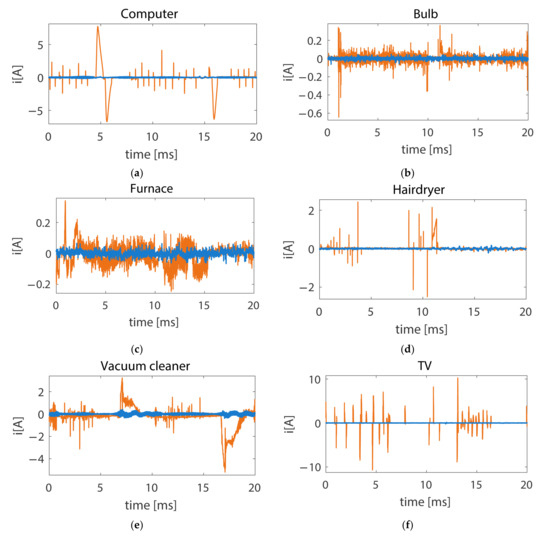
Figure 7.
Changes between adjacent cycles of current signal for individually operating appliances with (orange line) or without (blue line) presence of series arc fault. (a) computer, (b) bulb, (c) furnace, (d) hairdryer, (e) vacuum cleaner, (f) TV.
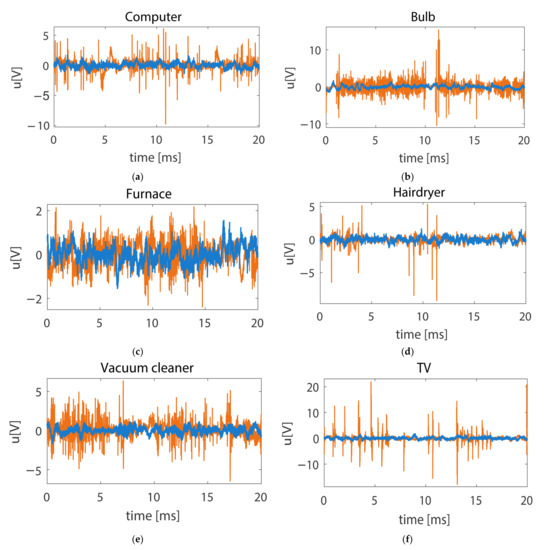
Figure 8.
Changes between adjacent cycles of voltage signal for individually operating appliances with (orange line) or without (blue line) presence of series arc fault. (a) computer, (b) bulb, (c) furnace, (d) hairdryer, (e) vacuum cleaner, (f) TV.
Differences between adjacent periods were varying. For the current signal the sum of absolute values of differences between the adjacent vectors during an arc fault had a repeatable character. We proposed the algorithm for calculating feature vector, allowing for the identification of the device powered via the arc fault line (arc fault location section on Figure 2). Then analyzing the topology of the electrical network and knowing the line powering the device enables locating an arc fault (line selection). Examples of absolute values of differences between 50 consecutive periods are shown in Figure 9. The figure shows only the first half of the periods for better readability. It can be noted that the changes in the current signal occurred only in part of the periods k and had varying values.
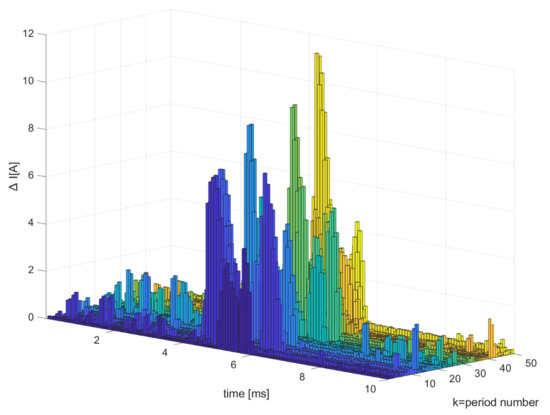
Figure 9.
Absolute values of differences between 50 consecutive periods for computer powered via a line with arc fault. Changes in the current signal occurred only in part of the periods k and had a varying value.
For each period for which the algorithm detected an arc fault, the value of (Arc faults in Last Second, the number of periods for which an arc fault was detected in the most recent second) was incremented, and the vector was calculated:
and stored in the (Values of Changes) array in column, where is equal to modulo 50. If the arc fault was not detected, the value of was decremented and the vector of zeros (12) was stored in array column, where was equal to modulo 50. The feature vector was calculated only for the vectors from periods in which the arc fault was detected.
If the value was greater than or equal 7 (which means that at least in 7 periods during the last second, an arc fault was detected), the feature vector was calculated from the array and . The minimum time required for running the line selection procedure was 0.14 s (7 periods).
For reducing the number of attributes in vector from 5000 (the number of samples in one cycle) to 50, the mean for every 100 values was calculated, resulting in the vector. Figure 10 shows (Figure 10a) and (Figure 10b) vectors, calculated based on the data shown in Figure 9.
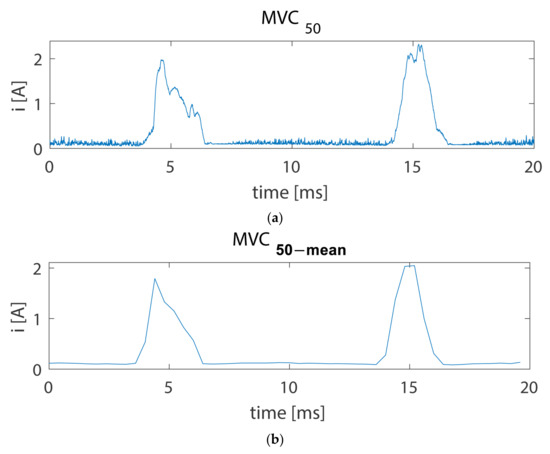
Figure 10.
feature vector (a) and (b) calculated for data from Figure 9.
Examples of vectors for each tested device are shown in Figure 11. Though values of may have varied for the same device, the general characteristic of changes was repeatable for devices on the fault line. These changes may have depended, for example, on the size of the gap in arc fault generator, or the device type. For SMPS power-supplied devices, such as a computer (Figure 11a) or tv set (Figure 11f), most of significant values in were concentrated around maximum absolute voltage values. For resistive devices like bulb (Figure 11b), furnace (Figure 11c), and hairdryer (Figure 11d), they were close to the point of zero crossing.
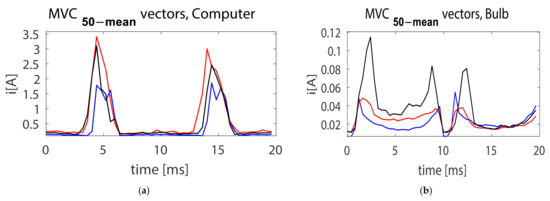
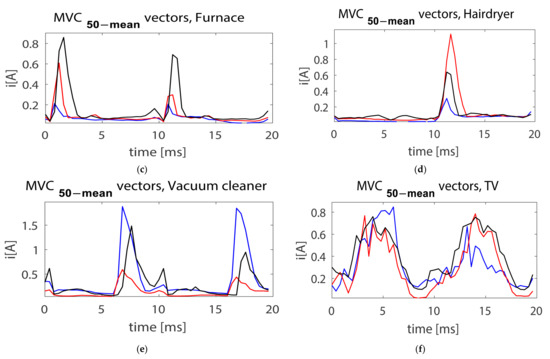
Figure 11.
Examples of vectors for the occurrence of series arc on-line with particular tested appliances for a different number of devices operating simultaneously (blue line—one device, red line—two devices, black line—three devices) (a) computer, (b) bulb, (c) furnace, (d) hairdryer (e) vacuum cleaner, (f) tv.
2.4. Evaluation Metrics
To evaluate the performance of the particular sets of features, a measure based on mean absolute error (MAE) was adopted [24]:
where was the result of classification and was the ground truth for the -th period out of identified ones. The accuracy was calculated for the single-cycle analysis and according to the IEC 62606:2013 norm. The arc fault was detected only when at least 7 anomalous cycles were identified within 1 s (50 cycles), which reduced the number of false detections (False Positive -TP). Another type of misclassification was a False Negative (FN) when a non-arc cycle raises the alarm. Correctly classified cases were divided into True Positives (TP, correct identification of the arc fault cycle) and True Negatives (TN, correctly classified non-arc cycle). The additional measures of the performance of the classification model included recall, precision, and F-score were evaluated. The maximum value of F-score is the best one. A decrease in precision indicated an increase in the number of false detections. Missing arc fault cases were reflected by a decrease in recall values. A method ensuring high accuracy of arc fault detection with a simultaneous low number of false detections had to be characterized by a high F-score, which combined the properties of precision and recall measures. Therefore, the F-score was used to select the most accurate set of features for arc fault detection.
3. Results and Discussion
3.1. Arc Fault Detection Results
Using the training and test data described in Section 2.1, the performance of the proposed 28 sets of features for arc-fault detection, defined in Section 2.2, was evaluated. They were applied to train a random forest with the number of trees n = 25. The value of n =2 5 was a compromise between the accuracy and the complexity of the classifier. Presented results were obtained from data collected at a high sampling rate ( = 250 kHz). Additional experiments were conducted for a signal downsampled to 3.125 kHz, 6.25 kHz, 12.5 kHz, and 25 kHz to evaluate if it was still possible to detect arc using cheaper acquisition hardware.
Results for a single cycle analysis are shown in Table 4, while outcomes according to the IEC 62606:2013 standard are in Table 5. In both cases results were sorted in descending order by F-score value for a sampling rate 12.5 kHz, which was considered practical and affordable for potential real-world implementation in the NILM system.
Table 4.
Arc fault detection results for single cycle analysis, sorted by F-score for 12.5 kHz sampling rate.
Table 5.
Arc fault detection results for analysis in terms of IEC 62606:2013 standard, sorted by F- score for 12.5 kHz sampling rate.
For the single-cycle analysis, and in terms of IEC 62606:2013 standard, the highest F-score (as well as accuracy) with sampling rate 12.5 kHz was obtained for set #2, including 12 features: ,,,,,,,, , and . Their availability allowed for maintaining a high detection rate despite using features that increased the risk of false detections () and depended on the sampling rate (). As presumed, the application of the IEC 62606:2013 standard made reduced the number of false detections — the corresponding scores were higher than for the single cycle analysis.
Some sets with a high F-score for 250 kHz performed much worse for lower sampling rates (#6, #9, #24, #27—F-score above 0.99 for 250 kHz and F-score below 0.93 for 12.5 kHz). The common part for these sets of features was the inclusion of features depending on the sampling rate ( and ). The scores obtained for sets #9, #10, #27, and #28 were interesting. Sets #9 and #27 were based on finding maximum differences between adjacent (, , ). That made them vulnerable to a drop in sampling frequency. The accuracy (in terms of IEC 62606:2013, Table 5) decreased proportionally to the sampling rate. Accuracy for set #9 decreased from 99.56% for 250 kHz to 74.42% for 3.125 kHz, and for set #27 from 98.90% to 74.42%, respectively. For the best performing set (#2), the accuracy obtained with the lowest was 93.07%.
Sets #10 and #28 were complementary to sets #9 and #10, including with regard to features resilient to the drop. The accuracy of 92.79 for set #10 for single cycle analysis (Table 4) with 3.125 kHz was the highest of all.
Confrontation between sets containing current and voltage features (#1–#10) with the ones with only current pattern (#19–#28) showed that introducing voltage features allowed an increase in the arc fault detection. The only exceptions were sets #6 and #24 (without the feature). Their results were comparable, despite the set #6 containing the voltage-based features. Only current signal features (sets #19–#28) ensured high accuracy for the highest sampling frequency (250 kHz). The high accuracy was obtained for set #27, containing only 3 current-based features.
From sets consisting of features already proposed elsewhere (#11–#13) and based on them (#14–#18), the best was set #18. It combined all current-based features (, , , , used in [23,24,26]), and contained the corresponding features calculated for the voltage signal (, , ). The accuracy obtained for the single-cycle analysis was 96.76% and had an F-score of 0.9786. For the original sets used in the literature (sets #11–#13), the best accuracy for arc fault detection was achieved in set #11, with an accuracy of 94.65% and an F-score of 0.9593 for 250 kHz. Extending this set with the voltage-based features (set #15) resulted in an accuracy of 97.18% and an F-score of 0.9768, respectively. The lowest score (82.4%) was obtained for set #12 (containing ZCP). For a significant part of the classified samples, masking loads were working in the background. Therefore, the effect measured by ZCP was weakened.
No analysis has been conducted on the computational complexity of the proposed method. We conducted a test-calculation of proposed arc fault detection features set #2 (12 features) for samples representing 140 s (7000 periods) of signal (sampling rate 250 kHz) that took 4.16 s on i5-8250U as the processor and running memory of 16 GB in Matlab environment.
For the best-performing set (#2), extended tests were conducted with 12.5 kHz, according to the IEC 62606:2013 standard, including the location of detected arc faults (Table 6). The most problems were caused on line 2, where the bulb was located. It was the lowest power resistive device, causing the lowest changes in the signal during an arc fault (Figure 7b and Figure 11b). Most false detections were related to the arc fault occurring on lines 5 or 6 (vacuum cleaner and tv set, respectively). Such an issue was expected in the first case, as arcing can occur during regular vacuum cleaner motor operation. The high false positive rate for the tv set was less obvious, especially with the high performance obtained for the other SMPS device (computer on line 1). The effect was not observed for higher sampling rates.
Table 6.
Arc fault detection in terms of IEC 62606:2013 standard results considering the location of arc faults for sampling rate 12.5 kHz.
3.2. Line Selection Results
Using the training and testing data described in Section 2.1, the performance of proposed feature vector, defined in Section 2.3 was evaluated. From the training sequences (Section 2.1), 5000 periods for which the arc fault occurred during at least 7 periods out of the last 50 were randomly selected for training data. The testing data consisted of 2500 periods from the test sequences (Section 2.1), for which the arc fault detection algorithm (described in Section 2.2) for feature set #2 detected arc faults (for single cycle analysis) in at least 7 of the last 50 periods. During the recording of these periods, non-arcing devices operated in a steady state. Both types of vectors and were calculated according to Section 2.3.
For identification of the faulty line (line selection), the k-nearest neighbor algorithm was used, with k = 6. For the arc fault occurrence in location 7, only cases with at least 2 devices working simultaneously were included. The assignment of appliances to power lines is in Table 1. Features used for classification were based on vectors values. An additional two features were the mean and maximum value of .
The confusion matrices for line selection are shown in Figure 12. Results of line selection for all available cases are in Figure 12a with an overall accuracy of 93.2%. The method was vulnerable to the occurrence of an arc fault on the main power line, resulting in more than one device being powered through the arc. Some misclassifications were between classes 3 (furnace) and 4 (hairdryer). Both are of motor-resistive type. A separate analysis was performed for cases where the arc fault did not occur on location 7 (mainline) —see Figure 12b, the overall accuracy was 98.2%. Almost all misclassifications were for devices of the same type. SMPS-powered computer (line 1) was confused a few times with an SMPS-powered tv (line 6). A noticeable number of misclassifications was between resistive devices—bulb (line 2), furnace (line 3), and hairdryer (line 4). The overall results showed that allowed for effective identification of devices with a series arc fault or powered through such a fault.
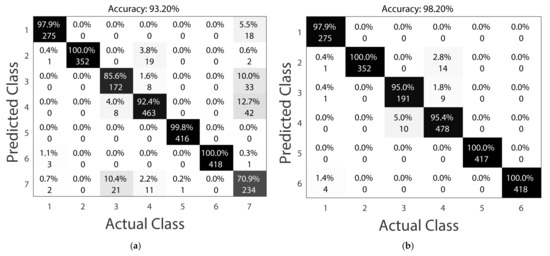
Figure 12.
Results of line selection for all available cases (a) and only for cases where arc fault did not occur on location 7 (main power line) (b).
The proposed faulty line identification method was highly accurate if an arc fault occurred on a single appliance, or if one appliance operated on a faulty line. If the system indicated the presence of an arc fault and, after switching on the next device, values of the vector increased, this device was powered through a faulty line.
The high accuracy of line selection was achieved for the single device arc fault, even though, in multiple cases, more than one device was operating simultaneously. The potential improvement includes the application of other classifiers (such as Support Vector Machines or Fuzzy Inference Systems).
3.3. Discussion
The present research was carried out to evaluate the usefulness of the time domain features in the arc detection and location. The topic was not widely covered in the literature, making direct comparison difficult. The only method based strictly on time-domain features is in [26], where and were exploited. The latter was of limited use if not all operating appliances were powered via an arc fault. In [26] particular appliances were operating individually and the data for faulty branch identification was synthetic.
Time-domain arc fault detection features were core elements for the methods described in [23,24]. In methods from [23,24], in addition to time-domain features (, and in [23], and in [24]), the information about the harmonic levels in the current signal was also used. Our main concern about method described in [23] is that there is no information about arc fault detection tests in the presence of masking loads. Based on experiments the feature [23] is one of the most efficient for arc fault detection. Multiload (up to 4 devices) and masking loads scenarios were considered in [24]. In 2 out of 3 scenarios the arc fault generator was plugged into the main power line. For 3200 Hz the fault detection accuracy achieved according to IEC 62606:2013 was of 93.12%, 94.23%, 94.86% for particular scenarios. In the conducted research the results were similar, where scenarios involving an arc fault on the main power line accounted for less than 15% of the identified examples (Table 2). Performance of the line selection approach from [24], based on the current waveform superposition, was 90.91%. However, it has only been tested on 11 examples of an arc fault that lasted continuously for tens of seconds.
Conducted experiments showed superiority of time-domain features (including both current and voltage signals) for the arc fault detection. The proposed feature vector allowed for the identification of the device operating on a faulty line even if multiple masking loads operated in the background.
We see areas where we can lead our research further, so the presented method can be improved. For instance, unknown devices may be considered for arc fault detection, though the line selection method requires providing the training examples. The requirements for registering the operation of the device in an arc fault condition are a disadvantage. A method for determining the vector based on the analysis of current waveforms recorded without an arc fault should be developed. The proposed line selection method can only identify the type of device powered via arc fault according to the observations from Section 2.3. While conducting such a detailed analysis only for time domain features was valuable and distinctive, the method may be extended to use frequency and time-domain as well. Methods described in [29] should also be applied on our dataset. It is also planned to integrate the described method into the NILM system implemented in our laboratory. The proposed method is based on the analysis of current and voltage signals in the time domain using array notation [33]. Accuracy of line selection may be improved by providing information about operating devices. while detection and localization details could be exploited by the NILM system.
4. Conclusions
The following study proposed a two-step method for series arc fault detection and location of the fault, based on the feature vector. Exploiting both current and voltage signals, the time domain analysis led to the high detection accuracy of series arc faults with low false detections. Features extracted from the voltage signal were especially useful here. The method combined signal processing (for calculating features for classifiers) with adaptive reasoning methods (random forest classifier for arc fault detection, k-nearest neighbors algorithm for line selection).
Experiments were conducted with the simultaneous operation of up to six devices, which is typical in the real-world cases. Overall, sixteen features for arc fault detection were defined with five already described in the cited literature. These sixteen features (including the eleven new ones) were used to build twenty-eight sets of features used for arc fault detection. Performance for each set of features in arc fault detection was investigated for five sampling rates: 3.125 kHz, 6.25 kHz, 12.5 kHz, 25 kHz, and 250 kHz. Based on an analysis of 360,000 examples, the most useful set of the twelve features was identified.
Resilience of features to a decrease in the sampling rate was established. The feature (directly dependent on the sampling rate) allowed for the achievement of the highest accuracy on sampling rate 250 kHz, but feature sets containing it performed much worse for lower sampling rates. For and high series, arc fault detection accuracy was achieved for lower sampling rates to be expected in the cheaper NILM systems.
For the 250 kHz sampling rate, single period arc fault detection accuracy for the selected set of features was 98.38%, with an F-score of 0.9870. The arc detection accuracy in terms of the IEC 62606:2013 standard was 99.08%, with an F-score of 0.9921. For a sampling rate affordable for NILM systems (12.5 kHz), single period analysis accuracy was 95.60% with an F-score of 0.9616, and in terms of the IEC 62606:2013 standard, the accuracy was 97.89% with an F-score 0.9818. Most undetected cases involved an arc fault on the line powering the bulb, a low-power resistive device. False detections of arc faults occurred mainly for the vacuum cleaner and tv set. Motors in the former generate series arcs even during the normal operation. This was the reason for the limited accuracy of known arc fault protection devices like AFDD and AFCI. Precision of 0.9547 for this device and sampling rate of 12.5 kHz can be considered a remarkable result.
Location of the arc fault consisted of the identification of devices powered through the faulty line and used the novel feature vector. It was calculated from absolute values of differences between adjacent current signal periods in the last second, during which the arc fault was detected, and then was compared with current waveforms for each appliance in arc conditions.
An accuracy of 93.20% was achieved for line selection in all cases, with 98.20% in cases where arc fault did not occur on the main power line. Most misclassifications occurred between devices of the same type. Resistive appliances were misclassified with resistive ones, and SMPS-powered ones were misclassified with SMSP-powered ones. This indicated the especially high ability of the algorithm for identification of the type of device powered through series arc fault. The proposed fault line identification method was highly accurate if an arc fault occurred on a single appliance or one appliance operated on a faulty line. This is not necessarily a limitation for the practical application of the method. If the system indicates the presence of an arc fault and after switching on an additional device, the values of the feature vector increase indicates that the device is powered through a faulty line.
The proposed method can be used in the low-voltage Alternate Current (AC) network to enhance the Non-Intrusive Load Monitoring (NILM) system with arc detection and location functionality for the whole household. The method still has potential for improvement, as a relatively simple classifier was used.
Author Contributions
Conceptualization, R.K. and K.D.; methodology, K.D.; software, K.D.; validation, R.K., A.W. and R.Ł.; formal analysis, R.K.; investigation, K.D. and A.W.; resources, A.W. and K.D.; data curation, K.D.; writing—original draft preparation, K.D.; writing—review and editing, R.Ł. and P.B.; visualization, R.Ł.; supervision, P.B.; project administration, P.B.; funding acquisition, R.K. and R.Ł. All authors have read and agreed to the published version of the manuscript.
Funding
The research was funded by the POB Energy of Warsaw University of Technology within the Excellence Initiative: Research University (IDUB) program, agreement 1820/343/Z01/POB7/2021.
Data Availability Statement
The data presented in this study are available on request from the corresponding author.
Conflicts of Interest
The authors declare no conflict of interest.
References
- Lhardit, L.; Dome, B.; Tissot, O.; De Wachter, B.; De Keulenaer, H. Forum for European Electrical Domestic Safety—FEEDS Residential Electrical Safety: How to Ensure Progress. Tech. Rep. 2020, 4, 44. [Google Scholar] [CrossRef]
- Home Fires Caused by Electrical Failure or Malfunction. Available online: https://www.nfpa.org//-/media/Files/News-and-Research/Fire-statistics-and-reports/Electrical/osHomeFiresCausedbyElectricalFailureMalfunction.pdf (accessed on 14 October 2022).
- Artale, G.; Cataliotti, A.; Cosentino, V.; Privitera, G. Experimental Characterization of Series Arc Faults in AC and DC Electrical Circuits. In Proceedings of the 2014 IEEE International Instrumentation and Measurement Technology Conference, Montevideo, Uruguay, 12–15 May 2014; pp. 1015–1020. [Google Scholar] [CrossRef]
- Underwriters Laboratories Inc. UL Standard for Arc-Fault Circuit-Interrupters; Underwriters Laboratories Inc.: New York, NY, USA, 2017. [Google Scholar]
- IEC62606; General Requeriments for Arc Fault Detection Devices. International Electrotechnical Commission: Geneva, Switzerland, 2013.
- Budzisz, J.; Czosnyka, M. Arc Fault Detection Devices Efficiency in Cooperation with Switch-Mode Power Supplies. Electr. Power Syst. Res. 2022, 209, 107943. [Google Scholar] [CrossRef]
- Artale, G.; Caravello, G.; Cataliotti, A.; Cosentino, V.; Cara, D.D.; Guaiana, S.; Panzavecchia, N.; Tinè, G. DC Series Arc Faults in PV Systems. Detection Methods and Experimental Characterization. In Proceedings of the 24th IMEKO TC4 International Symposium and 22nd International Workshop on ADC and DAC Modelling and Testing, Palermo, Italy, 14–16 September 2020; pp. 135–140. [Google Scholar]
- Wang, Z.; Balog, R.S. Arc Fault and Flash Signal Analysis in DC Distribution Systems Using Wavelet Transformation. IEEE Trans. Smart Grid 2015, 6, 1955–1963. [Google Scholar] [CrossRef]
- Pan, P.; Mandal, R.K. Learning Approach Based DC Arc Fault Location Classification in DC Microgrids. Electr. Power Syst. Res. 2022, 208, 107874. [Google Scholar] [CrossRef]
- Wang, L.; Lodhi, E.; Yang, P.; Qiu, H.; Ur Rehman, W.; Lodhi, Z.; Tamir, T.S.; Khan, M.A. Adaptive Local Mean Decomposition and Multiscale-Fuzzy Entropy-Based Algorithms for the Detection of DC Series Arc Faults in PV Systems. Energies 2022, 15, 3608. [Google Scholar] [CrossRef]
- Wang, Y.; Bai, C.; Qian, X.; Liu, W.; Zhu, C.; Ge, L. A DC Series Arc Fault Detection Method Based on a Lightweight Convolutional Neural Network Used in Photovoltaic System. Energies 2022, 15, 2877. [Google Scholar] [CrossRef]
- Dang, H.; Kwak, S. Identifying DC Series and Parallel Arcs Based on Deep Learning Algorithms. IEEE Access 2022, 10, 76386–76400. [Google Scholar] [CrossRef]
- Li, X.; Pan, C.; Luo, D.; Sun, Y. Series DC Arc Simulation of Photovoltaic System Based on Habedank Model. Energies 2020, 13, 1416. [Google Scholar] [CrossRef]
- Dang, H.L.; Kwak, S.; Choi, S. Different Domains Based Machine and Deep Learning Diagnosis for DC Series Arc Failure. IEEE Access 2021, 9, 166249–166261. [Google Scholar] [CrossRef]
- Park, H.P.; Chae, S. Dc Series Arc Fault Detection Algorithm for Distributed Energy Resources Using Arc Fault Impedance Modeling. IEEE Access 2020, 8, 179039–179046. [Google Scholar] [CrossRef]
- Yao, X.; Herrera, L.; Ji, S.; Zou, K.; Wang, J. Characteristic Study and Time-Domain Discrete-Wavelet-Transform Based Hybrid Detection of Series DC Arc Faults. IEEE Trans. Power Electron. 2014, 29, 3103–3115. [Google Scholar] [CrossRef]
- Dołęgowski, M.; Szmajda, M. A Novel Algorithm for Fast Dc Electric Arc Detection. Energies 2021, 14, 288. [Google Scholar] [CrossRef]
- Dang, H.L.; Kim, J.; Kwak, S.; Choi, S. Series Dc Arc Fault Detection Using Machine Learning Algorithms. IEEE Access 2021, 9, 133346–133364. [Google Scholar] [CrossRef]
- Zhang, X.; Bruce, A.; Rowland, S.; Terzija, V.; Bu, S. Modeling the Development of Low Current Arcs and Arc Resistance Simulation. IEEE Trans. Dielectr. Electr. Insul. 2018, 25, 2049–2057. [Google Scholar] [CrossRef]
- Ke, Y.; Zhang, W.; Suo, C.; Wang, Y.; Ren, Y. Research on Low-Voltage AC Series Arc-Fault Detection Method Based on Electromagnetic Radiation Characteristics. Energies 2022, 15, 1829. [Google Scholar] [CrossRef]
- Vasile, C.; Ioana, C. Arc Fault Detection & Localization by Electromagnetic-Acoustic Remote Sensing. In Proceedings of the IOP Conference Series: Materials Science and Engineering, Busan, Republic of Korea, 25–27 August 2017; Volume 198, p. 012009. [Google Scholar] [CrossRef]
- Yang, K.; Zhang, R.; Chen, S.; Zhang, F.; Yang, J.; Zhang, X. Series Arc Fault Detection Algorithm Based on Autoregressive Bispectrum Analysis. Algorithms 2015, 8, 929–950. [Google Scholar] [CrossRef]
- Jiang, J.; Wen, Z.; Zhao, M.; Bie, Y.; Li, C.; Tan, M.; Zhang, C. Series Arc Detection and Complex Load Recognition Based on Principal Component Analysis and Support Vector Machine. IEEE Access 2019, 7, 47221–47229. [Google Scholar] [CrossRef]
- Luan, W.; Lin, J.; Liu, B.; Zhao, B. Arc Fault Detection and Identification via Non-Intrusive Current Disaggregation. Electr. Power Syst. Res. 2022, 210, 108113. [Google Scholar] [CrossRef]
- Zhao, H.; Liu, J.; Lou, J. Series Arc Fault Detection Based on Current Fluctuation and Zero-Current Features. Electr. Power Syst. Res. 2022, 202, 107626. [Google Scholar] [CrossRef]
- Lin, J.; Luan, W.; Liu, B. A Novel Non-Intrusive Arc Fault Detection Method for Low-Voltage Customers. In Proceedings of the 2021 6th Asia Conference on Power and Electrical Engineering (ACPEE), Chongqing, China, 8–11 April 2021; pp. 84–88. [Google Scholar] [CrossRef]
- Humbert, J.B.; Schweitzer, P.; Weber, S. Serial-Arc Detection by Use of Spectral Dispersion Index (SDI) Analysis in a Low-Voltage Network (270V HVDC). Electr. Power Syst. Res. 2021, 196, 107084. [Google Scholar] [CrossRef]
- Ferracuti, F.; Schweitzer, P.; Monteriù, A. Arc Fault Detection and Appliances Classification in AC Home Electrical Networks Using Recurrence Quantification Plots and Image Analysis. Electr. Power Syst. Res. 2021, 201, 107503. [Google Scholar] [CrossRef]
- Guo, F.; Gao, H.; Wang, Z.; You, J.; Tang, A.; Zhang, Y. Detection and Line Selection of Series Arc Fault in Multi-Load Circuit. IEEE Trans. Plasma Sci. 2019, 47, 5089–5098. [Google Scholar] [CrossRef]
- Han, X.; Li, D.; Huang, L.; Huang, H.; Yang, J.; Zhang, Y.; Wu, X.; Lu, Q. Series Arc Fault Detection Method Based on Category Recognition and Artificial Neural Network. Electron 2020, 9, 1367. [Google Scholar] [CrossRef]
- Wang, Y.; Zhang, F.; Zhang, X.; Zhang, S. Series AC Arc Fault Detection Method Based on Hybrid Time and Frequency Analysis and Fully Connected Neural Network. IEEE Trans. Ind. Inform. 2019, 15, 6210–6219. [Google Scholar] [CrossRef]
- Li, W.; Liu, Y.; Li, Y.; Guo, F. Series Arc Fault Diagnosis and Line Selection Method Based on Recurrent Neural Network. IEEE Access 2020, 8, 177815–177822. [Google Scholar] [CrossRef]
- Dowalla, K.; Bilski, P.; Łukaszewski, R.; Wójcik, A.; Kowalik, R. Application of the Time-Domain Signal Analysis for Electrical Appliances Identification in the Non-Intrusive Load Monitoring. Energies 2022, 15, 3325. [Google Scholar] [CrossRef]


Disclaimer/Publisher’s Note: The statements, opinions and data contained in all publications are solely those of the individual author(s) and contributor(s) and not of MDPI and/or the editor(s). MDPI and/or the editor(s) disclaim responsibility for any injury to people or property resulting from any ideas, methods, instructions or products referred to in the content. |
© 2022 by the authors. Licensee MDPI, Basel, Switzerland. This article is an open access article distributed under the terms and conditions of the Creative Commons Attribution (CC BY) license (https://creativecommons.org/licenses/by/4.0/).