Article

Study of Discharge Inception and Propagation in Liquid–Solid Insulation System under DC–LI Superimposed Constraints

Univ Lyon, Ecole Centrale de Lyon, INSA Lyon, Université Lyon 1, CNRS, Ampère, UMR5005, 69130 Ecully, France
*
Author to whom correspondence should be addressed.
Energies 2023, 16(1), 172; https://doi.org/10.3390/en16010172
Submission received: 28 October 2022 / Revised: 28 November 2022 / Accepted: 13 December 2022 / Published: 23 December 2022
(This article belongs to the Topic High Voltage Engineering)

Abstract

:
High-voltage direct current (HVDC) links are starting to become widely implemented thanks to their interesting advantages such as reduced operation losses, the absence of reactive power, which allows energy transport via underground cables over long distances, and improved power control. The latter advantage is very essential for renewable energy resource integration into power grids. However, a thorough understanding of the behavior of insulation systems for HVDC components is critical so as to ensure a more reliable service. Indeed, the existence of the direct current (DC) voltage in HVDC components may induce surface and space charge accumulation that can stress insulation further or even promote discharge inception and propagation. As such, this work focuses on showcasing the effect of surface charge on streamers that develop on the interface of liquid–solid insulation due to the advent of lightning impulse (LI) voltage in the HVDC link. This study was performed using finite-element-based numerical simulations that include a quasi-electrostatic model for surface charge accumulation and an electrohydrodynamic fluid model for streamer initiation and propagation. The geometry used was point–plane configuration where the high voltage is applied to the needle electrode located above the liquid–solid interface. The obtained results suggest that streamer initiation is affected by both the accumulated surface charge density and polarity. For a positive streamer, an accumulation of positive surface charge increases the discharge inception voltage as a result of a weakening in the electric field, while an accumulation of negative surface charge decreases the discharge inception voltage due to an intensification in the electric field. Moreover, streamer travel distance and velocity are also both shown to be affected by surface charge accumulation.

1. Introduction

The energy transition aiming to replace fossil-based sources to renewable energy ones [1] is beginning to take place in several parts of the world. Integrating these renewable energy sources into existing grids can be challenging as they can be located in remote areas and experience intermittencies. The use of high-voltage direct current (HVDC) transmission systems is one way to curb these obstacles. On one hand, since energy transmission in HVDC links is performed using direct current (DC) voltage, line cost and transmission losses are reduced, which offers great cost savings, especially for long distance links [2,3,4]. On the other hand, they provide improved power controllability for a much more efficient management of mixed energy sources, including renewables [5,6,7].
In HVDC transmission systems, converters are used to convert AC to DC and vice-versa at the transmitting and receiving ends, respectively. At each end, a HVDC converter transformer is used to adapt the voltage for DC transmission. The operating voltages of HVDC links can reach up to 800 kV [8]. Increasing operating voltage allows the transmission of energy over long distances while ensuring low energy losses [9]. Needless to say, such high voltage amplitudes require the use of suitable insulation systems. Furthermore, HVDC converter transformers are located between the AC line and the power converters, which results in the generation of a combination of DC and AC voltages in the valve-side of the windings, in addition to harmonics [10]. Thus, the risk of insulation faults increases due to this voltage distortion [11], which is also aggravated by space charge and surface charge accumulation [12,13].
Mineral oil and impregnated cellulose-based paper have been used as insulation materials in HVDC converter transformers and bushings for several decades [14]. Pressboard is arranged in barriers directed perpendicularly to the electric field and conducts of mineral oil are located between these barriers [15]. The use of this combination of liquid and solid insulation in high-voltage transformers allows benefitting from the characteristics of both phases in addition to their insulation proprieties. Liquid insulation has the advantage of dissipating heat by convection and of adapting to any geometry. As for the solid insulation, it is used as a mechanical support for the conductors and the windings of the transformer [16].
Compared with conventional AC transformers, the insulation of HVDC converter transformers and their bushings requires more solid insulation that has a greater thickness [14,15]. This is due to the fact that the steady-state electric field is mainly concentrated in the material that has the greatest resistivity, i.e., solid insulation, especially knowing that the resistivity of impregnated pressboard can reach an order of magnitude of several tens or over one hundred times greater than that of mineral oil [17]. However, the design of the insulation of HVDC transformers must also take into consideration the sizing of the mineral oil conducts, which will undergo a greater electric field than in the pressboard barriers during voltage variations, particularly during polarity reversals [18].
Streamers are ionized filamentary discharges that can be generated when the electric field exceeds the dielectric strength of a dielectric material [19,20]. When at least one of these filaments manages to propagate from one electrode to another, an electric arc will be created in most cases [21]. The main mechanisms responsible for the formation of streamers in liquid dielectrics have been extensively studied, but many aspects are still unclear [20,21].
The structure of streamers depends strongly on several parameters such as the characteristics of the liquid, the polarity of the applied voltage, the geometry of the electrodes, the pressure of the liquid and the nature of the additives [22,23,24]. For example, a filamentary structure is seen in the case of a positive polarity, and a bushy one when the polarity is negative [20]. A difference in velocity is also observed when the amplitude of the applied voltage and the polarity change. Indeed, it has been found experimentally that there are four propagation modes ranging from about 100 m/s up to 100 km/s with obvious transitions between each mode. A transition that is accompanied by a change in the structure of the streamer, in the shape of the current and in the light transmitted, suggesting that different mechanisms are involved in each mode of propagation [23].
In gases, it has been established that the mechanism resulting in the appearance of streamers is the mechanism of impact ionization [19]. However, in liquids, other non-electronic processes such as the generation of gas bubbles have also been observed. This gave rise to two theories explaining the source triggering streamers, which are the bubble theory and the electron ionization theory [19,20,22]. The bubble theory suggests that streamers develop inside a gaseous region. This region constitutes a weak point in the liquid where an electronic avalanche can take place that will elongate the gaseous bubble until a breakdown ensues [25]. As for the electronic ionization theory, streamers take place in the liquid, which does not undergo any phase change [20]. Thus, for streamer initiation, the question that arises concerns the phase of the region where the initial electronic avalanche takes place. Some experiments performed under impulse voltage in negative polarity [26] and others in well-purified liquids under DC voltage [27,28] have highlighted the presence of an initial electron avalanche in the liquid. In addition, other experiments have found that the variation of the onset voltage of the discharges with respect to the pressure is negligible in negative polarity and small in positive polarity [29]. This shows that the initiation of streamers mainly depends on the ionization processes in the liquid, while the formation of bubbles is only a secondary process [23]. These bubbles can be generated either by the vaporization of the liquid thanks to the heating caused by the Joule effect or the electrostriction effect. However, the latter is only confirmed for liquids of high permittivity such as water [23,30]. Regarding the propagation of streamers, several experimental results favor the bubble theory [20] since a dependence of the stopping length of streamers on the variation in the liquid pressure has been observed in experiments [25,30]. Nevertheless, the generation of electron avalanches purely inside liquids was experimentally observed under nanosecond voltage pulses [31]. Additionally, other electron ionization mechanisms can generate gas cavities other than impact ionization, such as electric field ionization [23,25].
Understanding the discharge phenomena under different conditions is key to improving insulation systems for HVDC components. One aspect that is not very well-documented in the literature is the interaction between surface charge and streamer inception and propagation. Indeed, when an overvoltage event arises, streamers may appear in the insulation. Most simulation works focus on the study of streamers without considering the state of insulation beforehand where surface charge accumulates due to the application of a DC voltage. Therefore, in this work, which is a follow-up to our previous one [32], the discharge initiation and propagation in a liquid–solid insulation system under DC superimposed lightening impulse (LI) voltage condition is investigated numerically using finite element method (FEM) commercial software COMSOL Multiphysics®. These simulations allow us to assess important quantities without implementing sophisticated experimental setups, and help define design rules for more reliable HVDC components.
The simulation suggested in this paper includes a quasi-electrostatic model for surface charge accumulation during the DC voltage phase and an electrohydrodynamic fluid model for streamer propagation during the DC-LI superimposed voltage phase. The used strategy allows the investigation of the effect of long-term accumulated surface charge on streamer initiation and propagation. Firstly, the electric field and the surface charge density during the DC voltage phase is analyzed. Then, streamer propagation is explained based both on the electric field magnitude and the space charge density. Afterwards, a study of the current generated during streamer propagation and its velocity is carried out. Finally, two comparative studies between discharge events based on streamer travel distance and its velocity are conducted: a first study in which both cases where there is no prior surface charge accumulation and cases where there is are considered, then, a second study similar to the first one with added polarity inversion. This work is presented in three sections: a “numerical modeling” section where the geometry and mathematical model are described, a “results and discussion” section, and finally, a conclusion.

2. Numerical Modeling

2.1. Geometry

The geometry under study is illustrated schematically in Figure 1. It is composed of two different dielectric materials, which are oil and oil-impregnated pressboard (OIP). This configuration is representative of a typical liquid–solid insulation for transformers. In order to simulate the discharge induced by an electric field enhancement, a needle electrode with a 50 μm tip radius is placed vertically in the oil, at a distance of 0.1 mm above the pressboard. The needle is connected to a high-voltage source. The distance between the tip of the high-voltage electrode and the grounded electrode is 10 mm. The oil and the OIP dielectric constants are set at 2.2 and 4.4, respectively, and their conductivities are fixed at 10−11 S/m and 10−14 S/m, respectively. The line ( O ) corresponds to the symmetry axis between the tip of the needle electrode and the oil–OIP interface, and the line ( I ) corresponds to the interface. The investigation points   O   and   P   are located at oil and OIP, respectively, while the points   I 1 ,   I 2   and   I 3   are located at the oil-OIP interface as shown in Figure 1.
The adopted mesh should be refined enough so that the spatial variations of the electric field at the head of the streamer have clear and precise coordinates. These coordinates help in evaluating the streamer velocity and its travel distance. For this reason, a mesh with 80,956 triangular and quad elements was chosen for this geometry. A boundary layers mesh with quad elements was chosen for the needle electrode tip and along both the symmetry axis and the oil–OIP interface [33]. The mesh is much more refined in the vicinity of the needle electrode tip and both the symmetry axis and the oil–OIP interface, where the element size ranges between 1 and 5 µm approximately. The mesh covers the whole simulation domain with a surface of 19.89 mm2. The average element quality is 0.8687 based on the default quality measure of COMSOL Multiphysics®. Each simulation took about 9 h and 40 min on average using a single node.

2.2. Applied Voltage Waveforms

Four voltage waveforms were used in our simulations to study the effect of surface charge accumulation on streamers in both instances where the surface charge polarity is similar to or opposite that of the streamer. Voltage waveforms of the 1st, 2nd, 3rd and 4th cases are presented respectively in Figure 2a–d. The voltage waveform of the 1st case consists of a superposition of a 20 kV DC voltage and a standard 1.2/50 μs LI voltage [34] so that the peak amplitude is at 80 kV. The voltage waveform of the 2nd case starts with a positive DC voltage whose amplitude is   V D C   and lasts 200 s; then, this DC voltage is superimposed with the standard 1.2/50 μs LI voltage so that the peak amplitude is also at 80 kV. Voltage waveforms of the 3rd and 4th cases are the same as those of the 1st and 2nd cases, respectively, except that the voltage waveform of the 3rd case starts with −20 kV instead of 20 kV and the value of   V D C   in the voltage waveform of the 4th case is negative. Simulations in the 1st and 3rd cases lasted 1.2 μs, while in the 2nd and 4th cases, they included both the 200 s of applied DC voltage and the 1.2 μs of applied DC–LI superimposed voltage. Equations (1) and (2) [35] represent the voltage waveform expressions in the 1st and 3rd cases, respectively. Equation (3) [35] represents the voltage waveform expression in the 2nd and 4th cases.
V 1 = 20 + 60 × 1.0373 × ( e 0.014659 t e 2.4689 t ) ,
V 3 = 20 + 100 × 1.0373 × ( e 0.014659 t e 2.4689 t ) ,
V 2 , 4 = { V D C           i f       200   s < t < 0 V D C + ( 80 V D C ) × 1.0373 × ( e 0.014659 t e 2.4689 t )           i f           t > 0

2.3. Governing Equations during the DC Voltage Phase

Before applying the DC–LI superimposed voltage in the 2nd and 4th cases, the insulation system was subjected to DC voltage. The governing equations during the DC voltage phase are Gauss’ law (4) and the current density continuity Equation (5) in both liquid and solid insulation:
( ε E ) = ρ ,
( σ E ) = ρ t ,
where   E   is the electric field;   ρ   is the space charge density;   ε   and   σ   are the permittivity and the conductivity of the dielectric material, respectively.

2.4. Governing Equations during the DC-LI Superimposed Voltage Phase

Streamers can appear when an overvoltage event arises in the grid. The event considered in our simulations is a lightning impulse voltage that is assumed to superimpose on the existing DC voltage. The equations implemented during the DC–LI superimposed voltage phase are Poisson’s Equation (6) coupled with the drift-dominated charge continuity Equations (7)–(9) [36,37,38,39]. The species considered are electrons and positive and negative ions, represented by their densities   ρ e ,   ρ p   and   ρ n , respectively. The coupling of these equations allows electric field and space charge calculation during the propagation of the discharge in the oil and over the surface of the OIP. The drift-dominated model parameters are summarized in Table 1.
( ε V ) = ρ p + ρ n + ρ e ,
ρ p t ( ρ p μ p V ) = G ( E ) + ρ p ρ n R p n e + ρ p ρ e R p e e ,
ρ n t + ( ρ n μ n V ) = ρ e τ a ρ p ρ n R p n e ,
ρ e t + ( ρ e μ e V ) = G ( E ) ρ p ρ e R p e e ρ e τ a ,
where   V   represents the voltage;   μ p ,   μ n , and   μ e   are the positive ion, negative ion and electron mobilities, respectively;   G ( E )   is the generation term;   τ a   denotes the electron attachment time; and R p n   and   R p e   represent the ion–ion and electron–ion recombination rates, respectively. The generation term of electrons and positive ions is used to represent charge generation mechanisms such as:
  • Field emission charge injection: This is the emission of electrons from the negative electrode under high electric fields. This mechanism is described by the theory of Fowler–Nordheim [41], who developed an equation to describe the electric-field-dependent current density in a vacuum, due to the quantum-mechanical tunneling of electrons from the metal through the potential barrier at the metal–vacuum interface [36];
  • Electric-field-dependent ionic dissociation: When applying a high electric field, neutral ion-pairs are dissociated and the free charge concentration is increased. This mechanism is based on the theory of Onsager [42] where the liquid is assumed to contain a certain concentration of ion-pairs and free charges [36];
  • Impact ionization: This occurs when an energetic electron undergoes a collision in which an electron in the valence band is promoted to the conduction band, resulting in an additional electron and a positive ion being produced;
    • Photoionization: Photoionization is responsible for the photoelectric effect where a photon with high energy is absorbed by an atom or a molecule, which generates an electron.
Several works [36,37] in the literature consider that field-dependent molecular ionization is the most important mechanism in the development of streamers in liquid. Based on his simulations, O’Sullivan [36] concluded that the mechanisms of field emission charge injection and ionic dissociation are not primarily responsible for the development of streamers in liquid. As for the mechanisms of impact ionization and photoionization, some authors have shown through experiments and simulations that these mechanisms are reserved for streamers with electric field peaks of about 1 × 10⁹ V/m and propagating at velocities up to 100 km/s (4th mode) [37,43,44], which is not the case of the streamers generated via our simulations. Thus, only the electric-field-dependent molecular ionization is incorporated in our modeling equations as a charge generation mechanism, which according to [36] captures the majority of streamer dynamics in transformer oil. The electric-field-dependent molecular ionization rate is based on Zener theory [45] upon which it is assumed that electrons and positive ions are generated from molecules as a consequence of a high electric field. Its expression [36,37] is:
G ( E ) = e 2 n 0 a E h exp ( π 2 m * a Δ 2 q h 2 E ) ,
where   n 0   denotes the density of ionizable species;   a   is the molecular separation distance; h   is Planck’s constant;   m *   is the effective electron mass; and   Δ   is the ionization potential. The solid insulation is assigned constant permittivity and conductivity. As such, the equations governing the solid equations are Gauss’ law (4) and the current density continuity Equation (5). Since the discharge simulation duration is a short 1.2 μs, the dynamics of the liquid caused by the electric field and the thermal effects are neglected.

2.5. Surface Charge Calculation

Equation (11) is used to calculate the surface charge density   σ s   at the oil–OIP interface:
σ s t = ( J c , o i l J c , O I P ) · n ,
J c , o i l = ( ρ p μ p ρ n μ n ρ e μ e ) · E ,
J c , O I P = σ O I P E ,
Where   J c , o i l   and   J c , O I P   are the conduction current densities in oil and pressboard, respectively, and   n   is the normal vector at the oil-OIP interface directed towards the OIP. In the 2nd case, the interface charge accumulated during the DC voltage phase is introduced as an initial value for the DC–LI superimposed voltage phase. Equation (11) does not consider the effect of surface conductivity. The calculated surface charge density is set as the boundary condition at the interface as follows:
σ s = ( D O I P D o i l ) · n ,
where   D O I P   and   D o i l   are the displacement fields in pressboard and oil, respectively.

2.6. Current Calculation

Conduction and displacement currents generated due to streamer development are calculated using Morrow and Sato’s Equations (15) and (16), respectively [46].
I c = 1 V a p p A 2 π r ( ρ p μ p ρ n μ n ρ e μ e ) E E L   d S ,
I d = 1 V a p p A 2 π r ε o i l E L t E L   d S ,
where   V a p p   represents the applied voltage at the needle electrode;   E L   is the Laplacien electric field; A is the area of the oil calculation domain; and   ε o i l   is the oil permittivity.

2.7. Boundary Conditions

The boundary conditions considered for the modeling of the discharge are summarized in Table 2. Dirichlet conditions of electric potential are applied to the electrodes. Zero normal electric displacement field is set at the outer boundary. For the transport of charge carriers, a zero diffusive flux is applied at the electrodes. Conditional boundary conditions [33,37] are set at the interface. Zero current density is applied at the outer boundary.

3. Results and Discussion

3.1. The Process of Surface Charge Accumulation during the DC Voltage Phase

Figure 3 shows the evolution of the surface charge density in points   I 1 ,   I 2   and   I 3   (Figure 1) as a function of time (s) in the second case where a   V D C = 20   kV   DC voltage is applied for 200 s. It is noticeable that the surface charge density in these points is positive, which matches the polarity of the applied voltage. This surface charge density increases gradually until a steady-state is reached with a time constant that depends both on the dielectric constants of the oil and the OIP and on their geometry [47]. Additionally, the steady-state surface charge density is bigger as the point gets closer to the needle electrode tip where the electric field magnitude is the highest.
Figure 4 depicts the surface charge density along the line ( I ) (Figure 1) at   t = 0   s   under a DC voltage of different amplitudes in the second or fourth cases. At   t = 0   s , the steady-state is already reached. It is observed that the accumulated surface charge density has the same polarity as that of the applied voltage. Additionally, higher voltage amplitudes lead to more important surface charge density. Moreover, increased surface charge density is noticed closer to the needle electrode as above mentioned. This shows that the stronger the electric field at the interface is, the greater the accumulation of surface charge density will be.
Figure 5 illustrates the electric field magnitude at points   O   and   P   (Figure 1) as a function of time (s) in the second case, where a   V D C = 20   kV   DC voltage is applied for 200 s. It can be observed that the electric field undergoes two states: a transient state that lasts few seconds after the application of the voltage and a steady state. During this process, a capacitive electric field distribution that is dependent on the permittivity of the insulations transforms into a resistive electric field distribution that depends on their conductivity [47]. As such, oil at the vicinity of the interface is more stressed initially than pressboard at the opposite side; then, as the steady-state closes in, the electric field enhancement shifts toward the OIP. This transition of the electric field is caused by the surface charge accumulation at the interface.
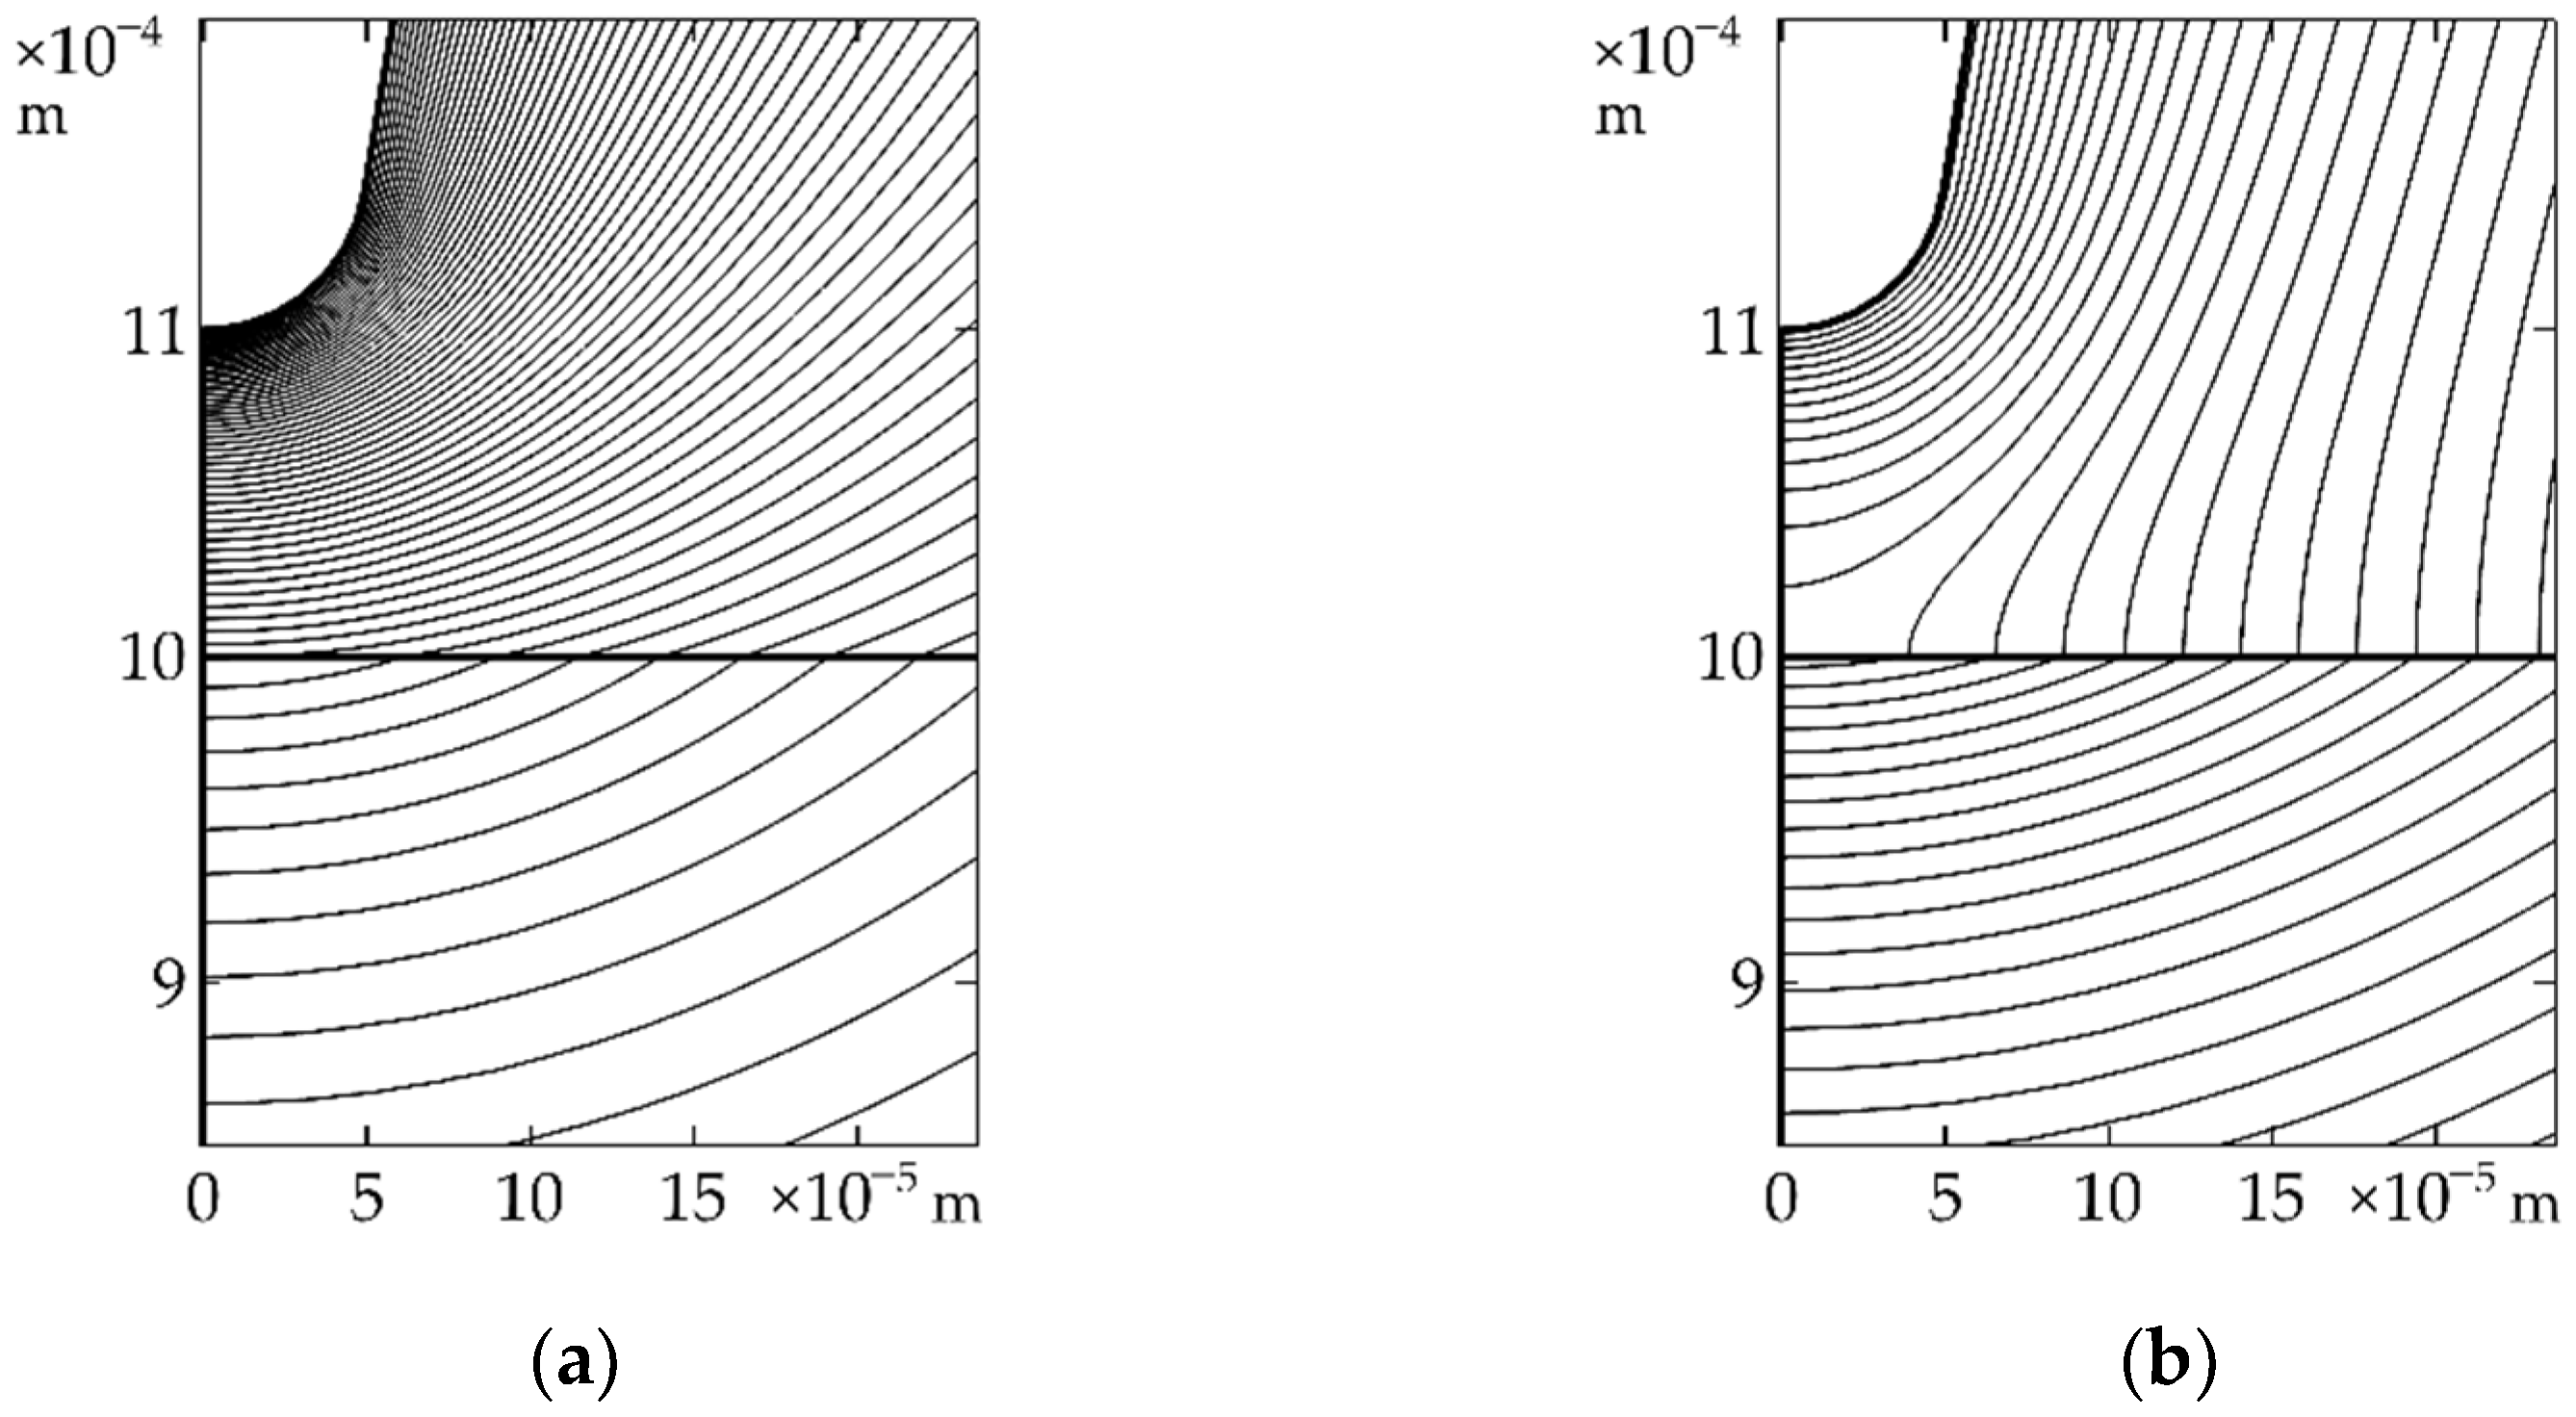
In the second case, under a   V D C = 20   kV   DC voltage, the capacitive-to-resistive transition of the behavior of the electric field is also observed in Figure 6, where equipotential lines are represented at   t = 200   s (Figure 6a) and   t = 0   s   (Figure 6b). Indeed, at the start of DC voltage application, equipotential lines are tighter in oil than in the OIP. This means that the electric field is more intense in oil. Inversely, at the steady-state, equipotential lines are now tighter in the OIP than in the oil at the vicinity of the interface. Consequently, electric field stress is higher in the OIP. However, the electric field in oil at the proximity of the needle electrode is still more intense than in the OIP because of the electric field enhancement caused by the needle electrode curvature.

3.2. Streamer Development during the DC–LI Superimposed Voltage Phase

The 2D plane distribution of the electric field magnitude at three instants in the first case (without prior surface charge accumulation) is shown in Figure 7. At   t = 0   s   (Figure 7a), the electric field magnitude at the tip of the needle electrode is higher than 250 kV/mm. Thus, the DC–LI superimposed voltage waveform used in the simulation provides an electric field magnitude high enough to enable the development and propagation of the discharge [48]. The streamer starts its development vertically in the oil from the electrode tip toward the OIP as shown in Figure 7b. When it reaches the surface, it changes its direction and travels alongside the oil–OIP interface towards the grounded electrode as can be seen in Figure 7c. The electric field magnitude reaches its highest values at the streamer head.
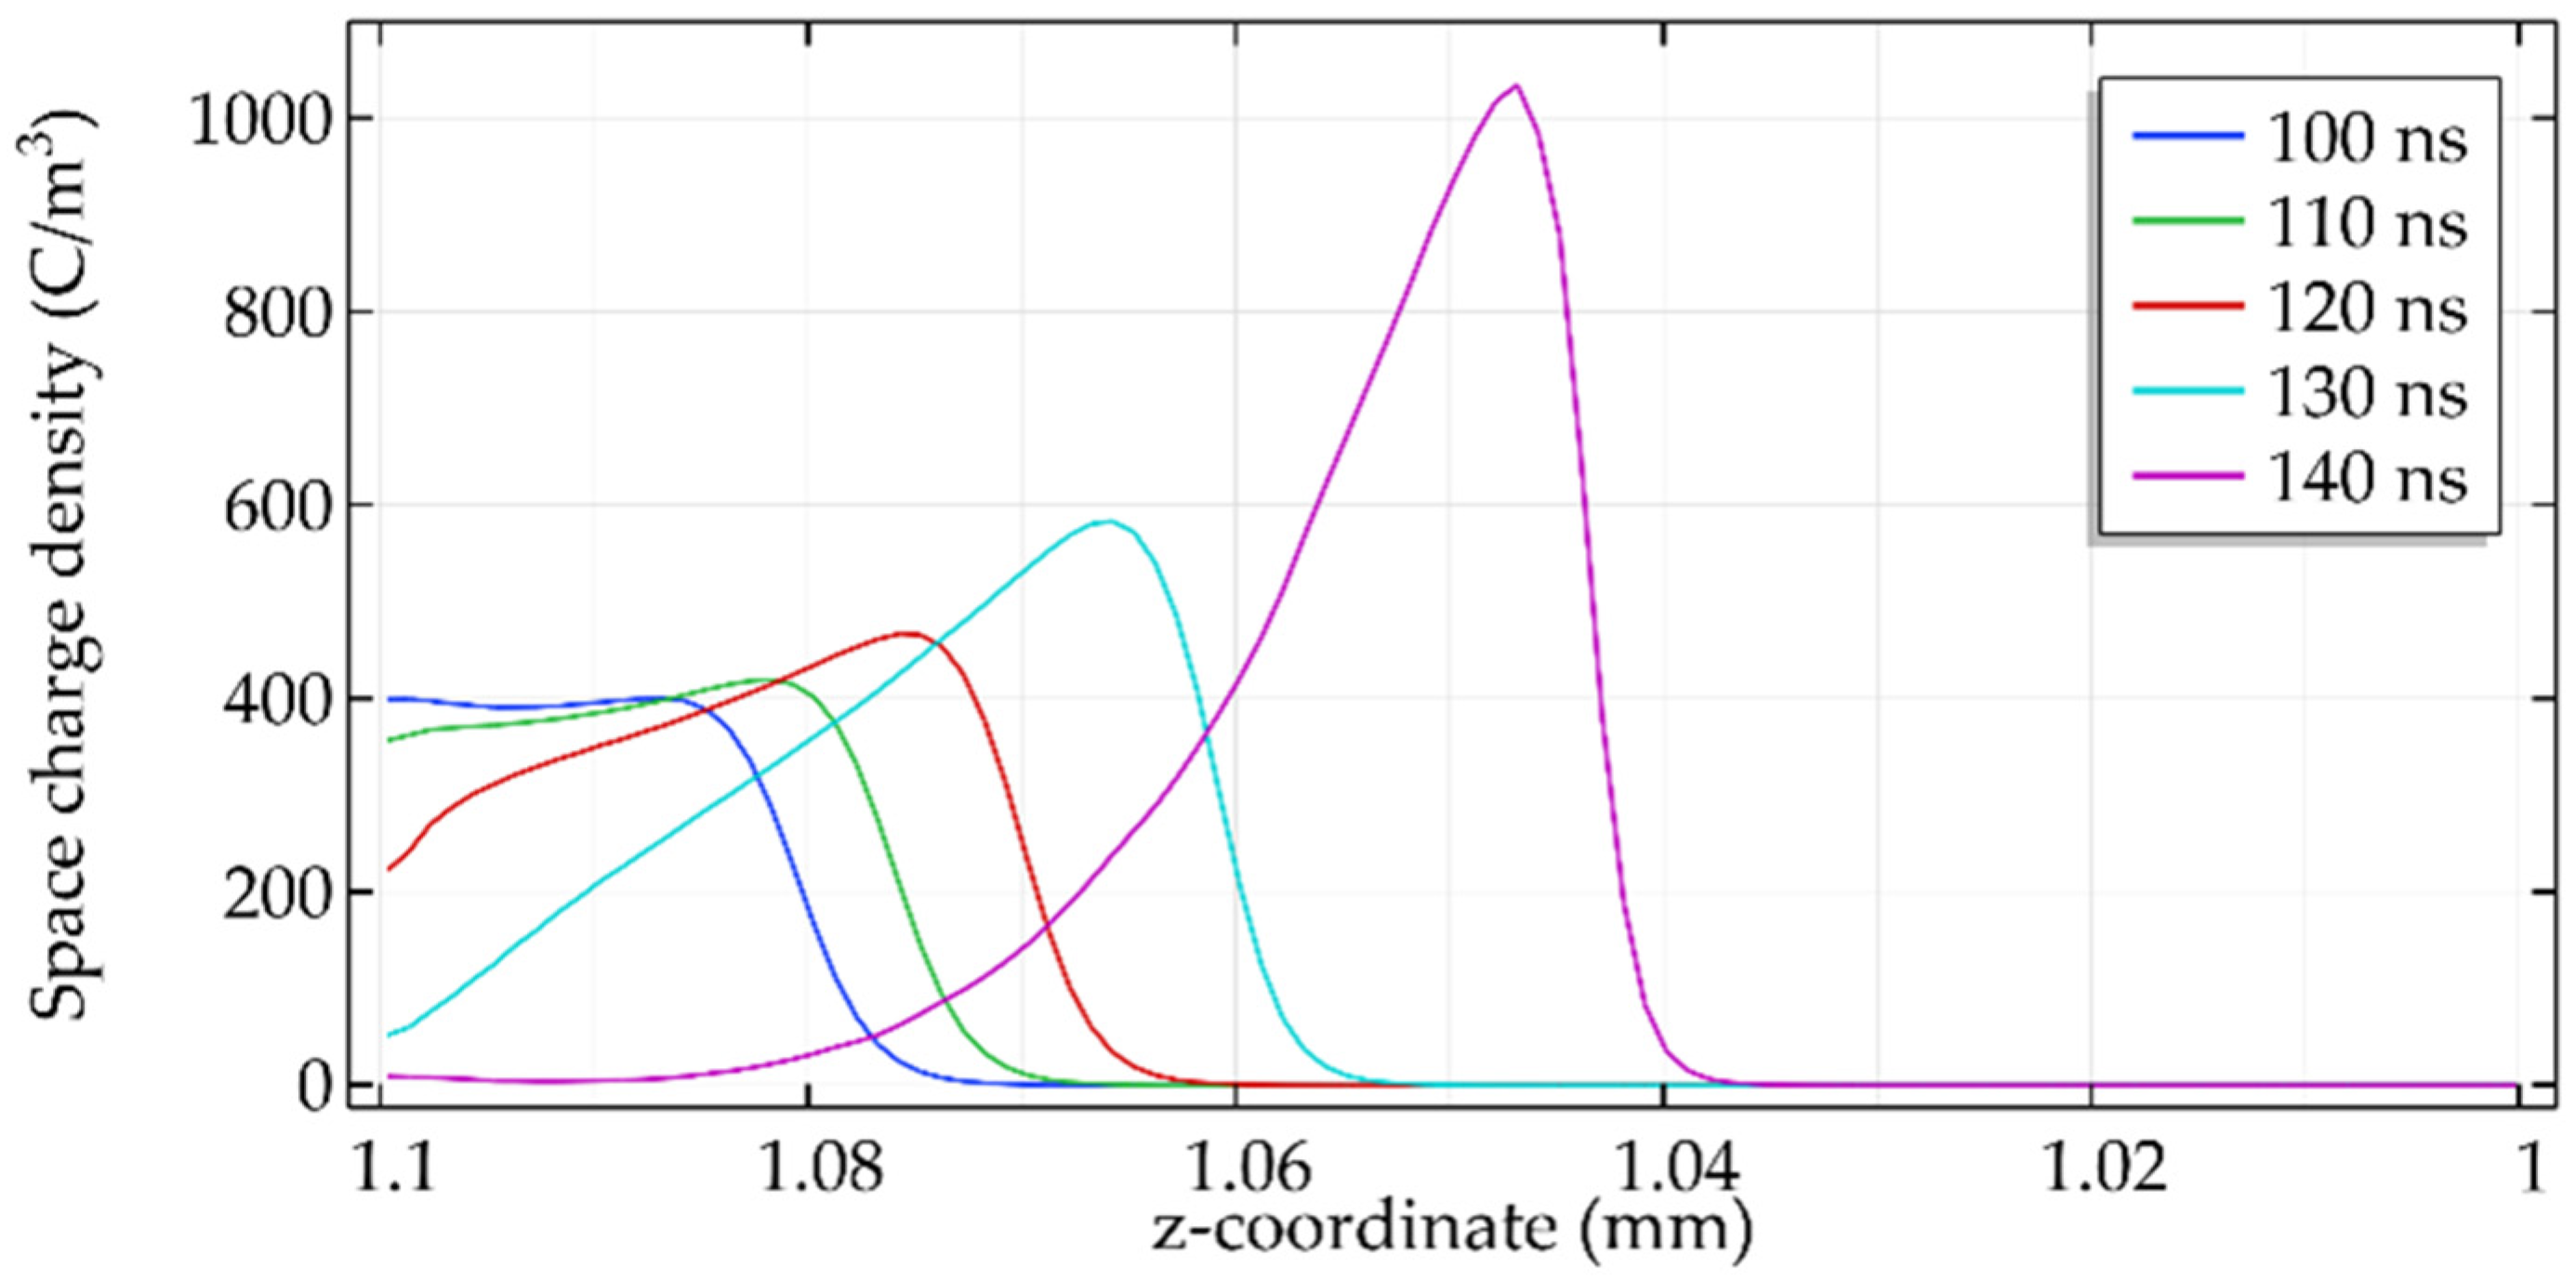
To explain the streamer development in Figure 7, the magnitude of the electric field and the space charge density along the line ( O ) (Figure 1) at several instants in the first case are presented in Figure 8 and Figure 9, respectively. It can be seen that the electric field intensifies more and more as the streamer heads towards the oil–OIP interface and this is resulted by the compression of the space charge into a smaller volume when the streamer gets closer to the interface [37]. The intensification of the electric field induces a higher generation of electrons and positive ions thanks to the mechanism of electric-field-dependent molecular ionization. The electrons are pushed towards the positive high voltage electrode, and only the positive ions remain at the head of the streamer, which enhances the local electric field. A positive feedback mechanism is created between the positive ions and the electric field magnitude at the head of the streamer [39] that explains the upward trend showcased in Figure 8 and Figure 9.
Figure 10 and Figure 11 show the electric field magnitude and the space charge density, respectively, at several instants along the line ( I ) in the first case. Around   t = 147   ns , the streamer reaches the oil–OIP interface. At this moment, the electric field and the space charge density are at their maximum values. During the streamer propagation along the interface, the electric field and space charge peaks gradually decrease. Indeed, the recombination mechanisms induce a decrease in the density of electrons and positive ions and an increase in the density of negative ions that cause the electric field at the head of the streamer to decrease in magnitude, resulting in even less free charge generation until the extinction of the discharge.
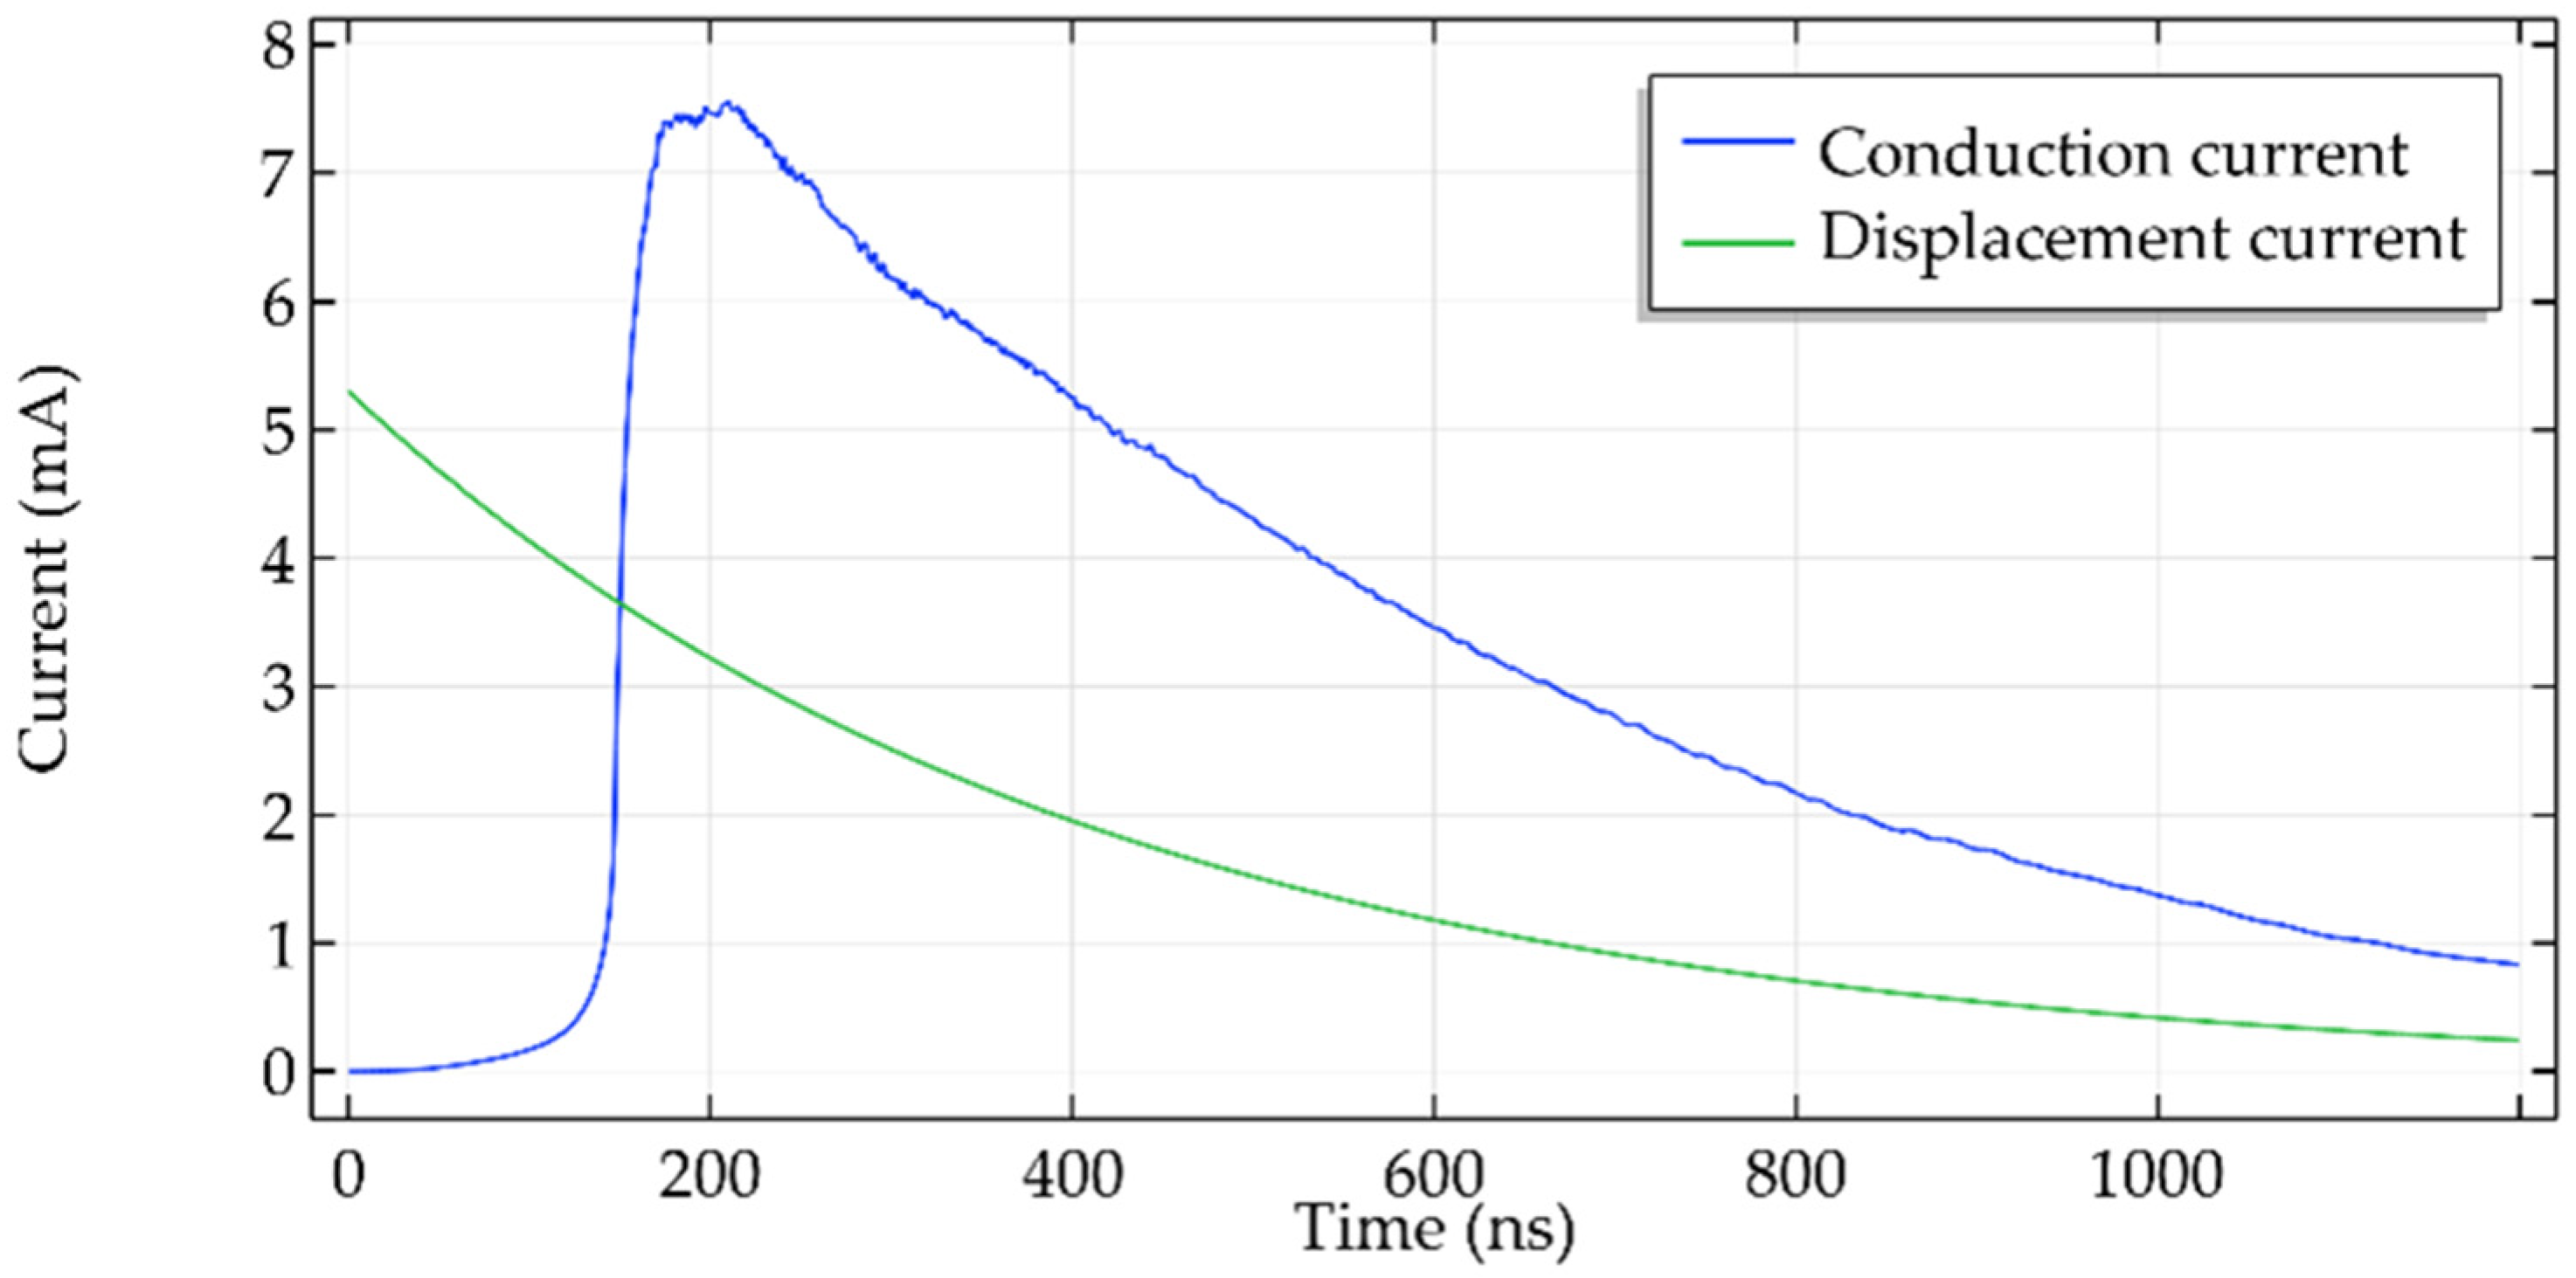
Figure 12 presents the evolution of the conduction current and the displacement current as a function of time in the first case. The decrease in the displacement current is due to the increase in the amplitude of the applied DC–LI superimposed voltage during the simulation, which lasts 1.2 μs. As for the conduction current, it increases more and more as the streamer approaches the oil–OIP interface, after which it starts to decrease gradually over time. The evolution of the conduction current is explained by its dependence on both the electric field magnitude and the space charge density. Indeed, these two variables were found to increase until the streamer reaches the interface at around   t = 147   ns   before they decayed over time. The conduction current depends also on the applied voltage amplitude, which increases gradually during the simulation duration (1.2 μs). As such, the rising portion of the impulse voltage contributes to a milder upward slope of the conduction current, to a reduced peak and to a steeper tail at the end.
Figure 13 shows the streamer average velocity during its propagation in oil (Figure 13a) and along the oil–OIP interface (Figure 13b) in the first case. The average velocity in a particular instant was calculated by dividing the travel distance by a defined time interval. This time interval differs depending on the streamer location. Before the streamer reaches the interface at around   t = 147   ns   (Figure 13a), the time interval chosen was 3 ns since it was noticed that the streamer average velocity was changing rapidly. However, while propagating along the interface (Figure 13b), the time interval was set at 100 ns. The last data point in the graph of Figure 13a represents the average streamer velocity at 1.5 ns before the streamer head reached the coordinate   z = 1.02   mm   at the vicinity of the interface, while the first data point in the graph of Figure 13b represents the average streamer velocity at 50 ns after the streamer head reached the coordinate   r = 0.1   mm   in the interface. Before reaching the oil–OIP interface, the streamer velocity is below 1 km/s, which corresponds to velocities at which first mode streamers propagate. When the streamer gets closer to the interface, its velocity is about 5.6 km/s, which correlates to second mode streamers. As the streamer moves along the interface, its velocity starts decreasing until it reaches values below 1 km/s again. A dependence of the streamer velocity on the electric field magnitude and the space charge density and mobility can be deduced considering that the streamer velocity follows the same trend as that of the electric field magnitude and the space charge density in Figure 8 and Figure 9. This dependence confirms the results of previous works in the literature [23] where the streamer velocity varies with the applied voltage. Moreover, the streamer velocity peak observed when the streamer approaches the solid insulation agrees with the results of a simulation found in [38] and also with experiments published in [44,49].

3.3. Study of the Effect of Surface Charge Accumulation on Streamers

3.3.1. Effect on Streamer Initiation

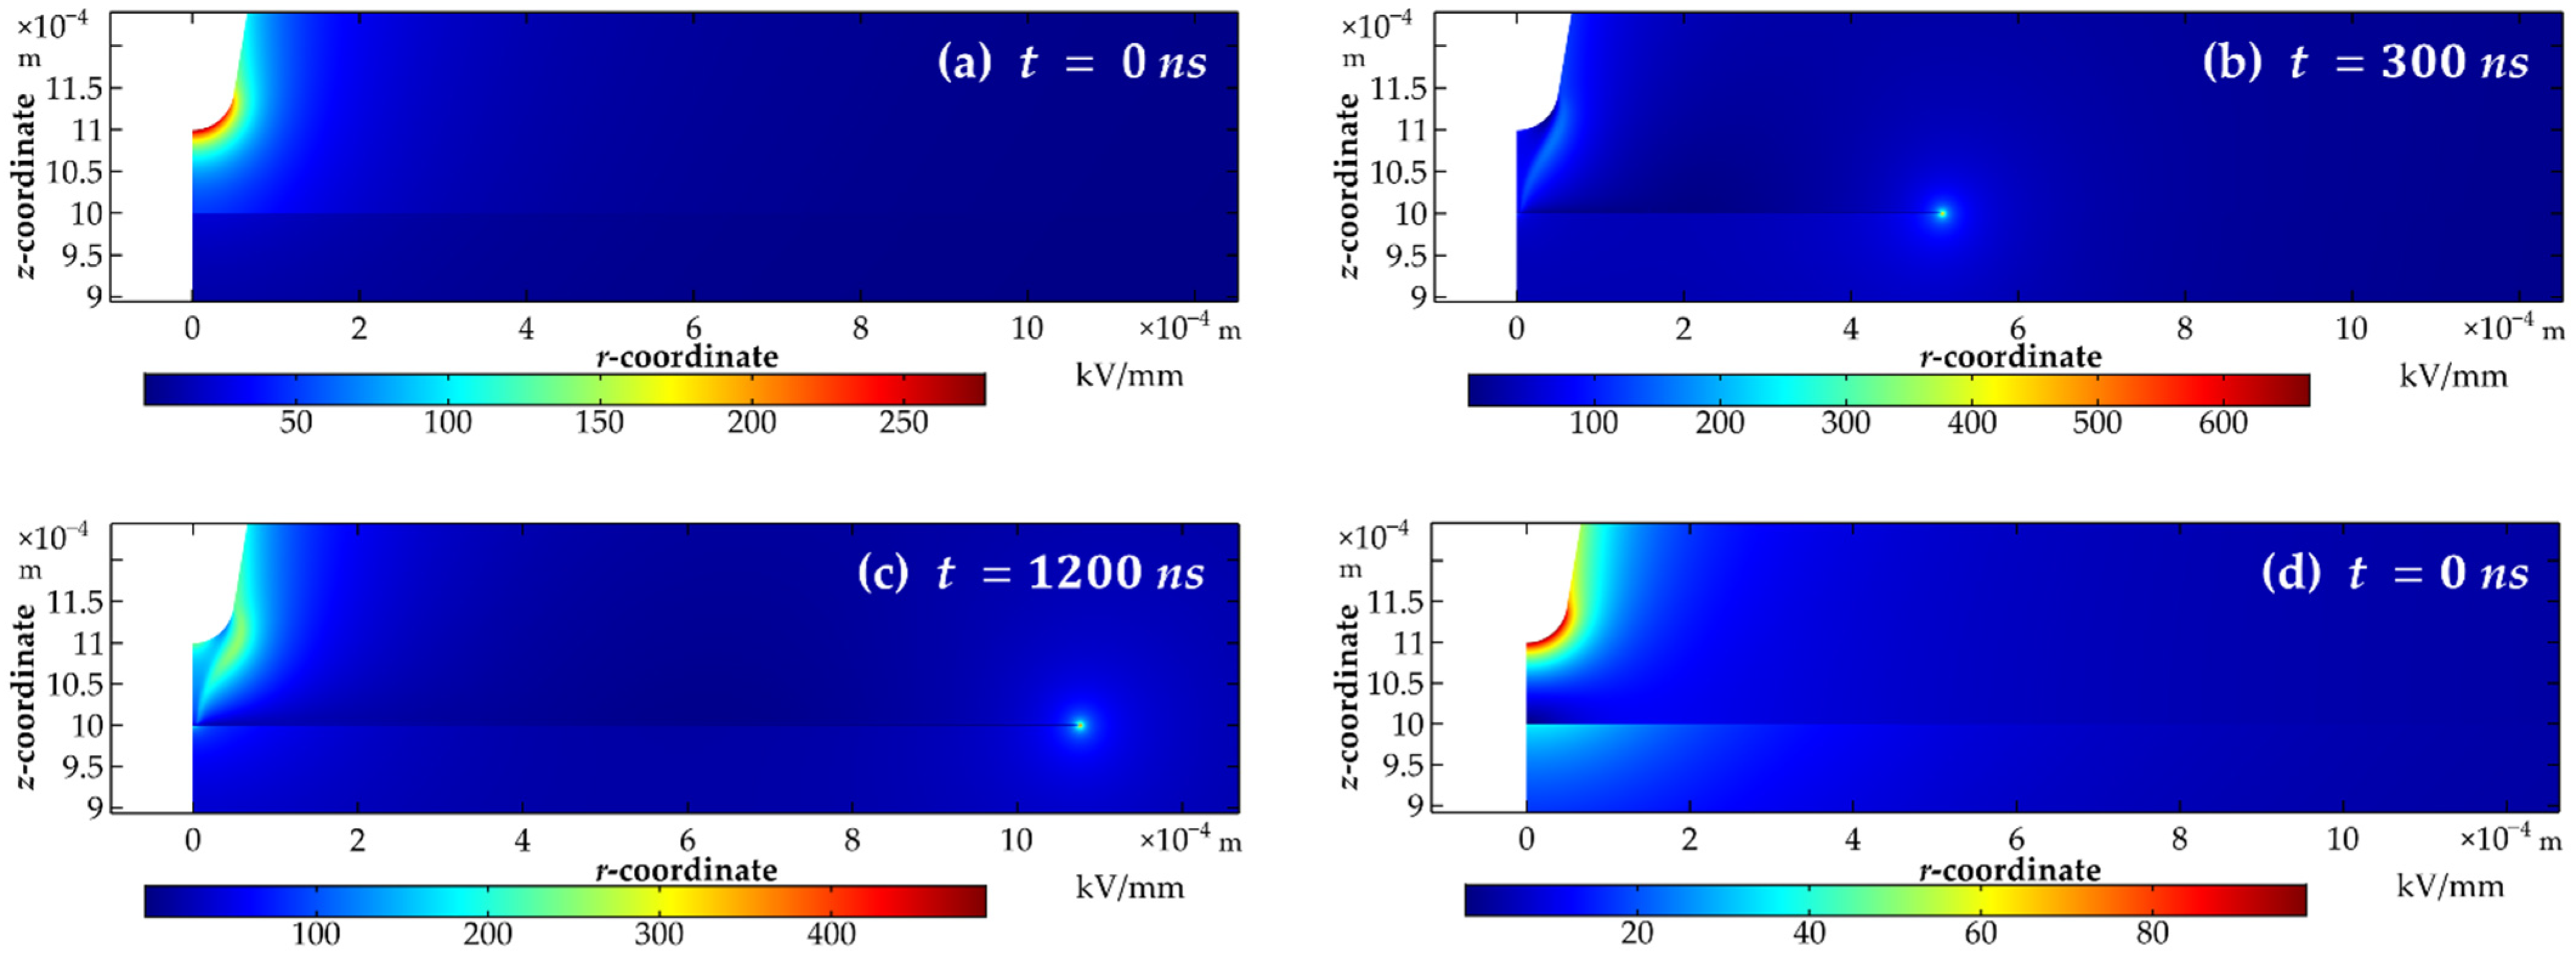
Figure 14a–c illustrates the 2D plane distribution of the electric field magnitude at   t = 0   ns ,   t = 300   ns   and   t = 1200   ns , respectively, in the first case (without previous surface charge accumulation). Figure 14d–f presents the 2D plane distribution of the electric field at   t = 0   ns ,   t = 300   ns   and   t = 1200   ns , respectively, in the second case (with previous accumulation of positive surface charge density) with   V D C = 20   kV . It is observed that the magnitude of the electric field at the tip of the electrode in the second case at   t = 0   ns   (Figure 14d) is lower than that in the first case at the same instant (Figure 14a). Indeed, since the accumulated surface charges have the same polarity as the applied voltage, they induce a normal component of the electric field opposite to the total electric field that gets weakened in oil. The weakening of the initial electric field leads to a delay in the initiation of the streamer in the second case compared to the results in the first case [32]. Thus, the streamer inception voltage is increased in the second case. Indeed, this observation can be noted at   t = 300   ns   since the streamer traveled a distance of around 500 μm in the first case while it just reaches the interface in the second case. At   t = 1200   ns , it can be seen that the streamer head position in the two cases is approximately the same, which can be caused by the difference in the streamer velocity in the first and the second cases.
Figure 15a–c showcases the 2D plane distribution of the electric field magnitude at   t = 0   ns ,   t = 300   ns   and   t = 1200   ns , respectively, in the third case (without previous surface charge accumulation). Figure 15d–f shows the 2D plane distribution of the electric field magnitude at   t = 0   ns , t = 300   ns   and   t = 1200   ns , respectively, in the fourth case (with previous accumulation of negative surface charge density) with   V D C = 20   kV . Compared to the results in the case of positive surface charge accumulation, the opposite can be said in the case of polarity reversal where an advancement of the streamer is observed in the fourth case compared to the results in the third case. This is due to the accumulation of negative surface charge at the oil–OIP interface during the DC voltage phase. Since this surface charge has the opposite polarity of the applied DC–LI superimposed voltage, they induce a normal component of the electric field in the same direction as the total electric field that causes its intensification in oil. Thus, the streamer inception voltage is decreased in the fourth case. As a consequence, the streamer already covers a distance of around 300 μm in the fourth case at   t = 300   ns   while it just arrives at the interface in the third case at the same instant. At   t = 1200   ns , it can be also seen that the streamer head position in the two cases is approximately similar with a slightly bigger distance traveled by the streamer in the fourth case.

3.3.2. Effect on Streamer Velocity

Figure 16 shows the streamer velocity in the first case and the second case with different values of   V D C   during its propagation in oil (Figure 16a) and along the oil–OIP interface (Figure 16b). A steep rise in the streamer velocity is observed in Figure 16a, which happens as the streamer approaches the oil–OIP interface. As mentioned before, these velocity peaks are due to the electric field and space charge enhancement as the streamer approaches the interface. A shift in the velocity curves can be noticed in the two figures. This shift is induced by the accumulation of positive surface charge, which was previously shown to increase streamer inception voltage, resulting in a streamer initiation delay. Hence, streamer contact with the oil–OIP interface that correlates to the velocity peak is also delayed. Another observation that can be made is related to the difference in the amplitude of the velocity peaks. The cause of this difference depends on the direction of the streamer in relation to the oil–OIP interface:
  • When the streamer is traveling in oil (Figure 16a): The streamer velocity in the first case (5.6 km/s) is higher than in the second case with   V D C = 20   kV   (3.6 km/s). In the second case, the maximum value of the streamer velocity decreases with the increase in the DC voltage. This behavior is caused by the accumulated surface charge that weakens the total electric field and causes streamer velocity peaks to decrease in amplitude. It is worth mentioning that changing the value of   V D C   necessarily slightly affects the voltage rise time. However, based on simulations where the effect of surface charge was removed, no considerable effect was observed on streamer velocity. As a consequence, the effect of the accumulated charges dominates.
  • When the streamer starts traveling along the oil–OIP interface (Figure 16b), the effect of the applied voltage dominates, and the effect of the accumulated surface charge can be neglected. This can be explained by the fact that the surface charges create a vertical electrical field and the streamer propagates horizontally. Knowing that the applied voltage is increasing over time, as the streamer initiation is delayed, the applied voltage when the streamer reaches the interface will be higher. This explains why the first data points of the curves increase as the streamer is delayed. As the streamer continues to propagate further in the interface, its velocity gradually decreases because of the decrease of the electric field as mentioned beforehand.
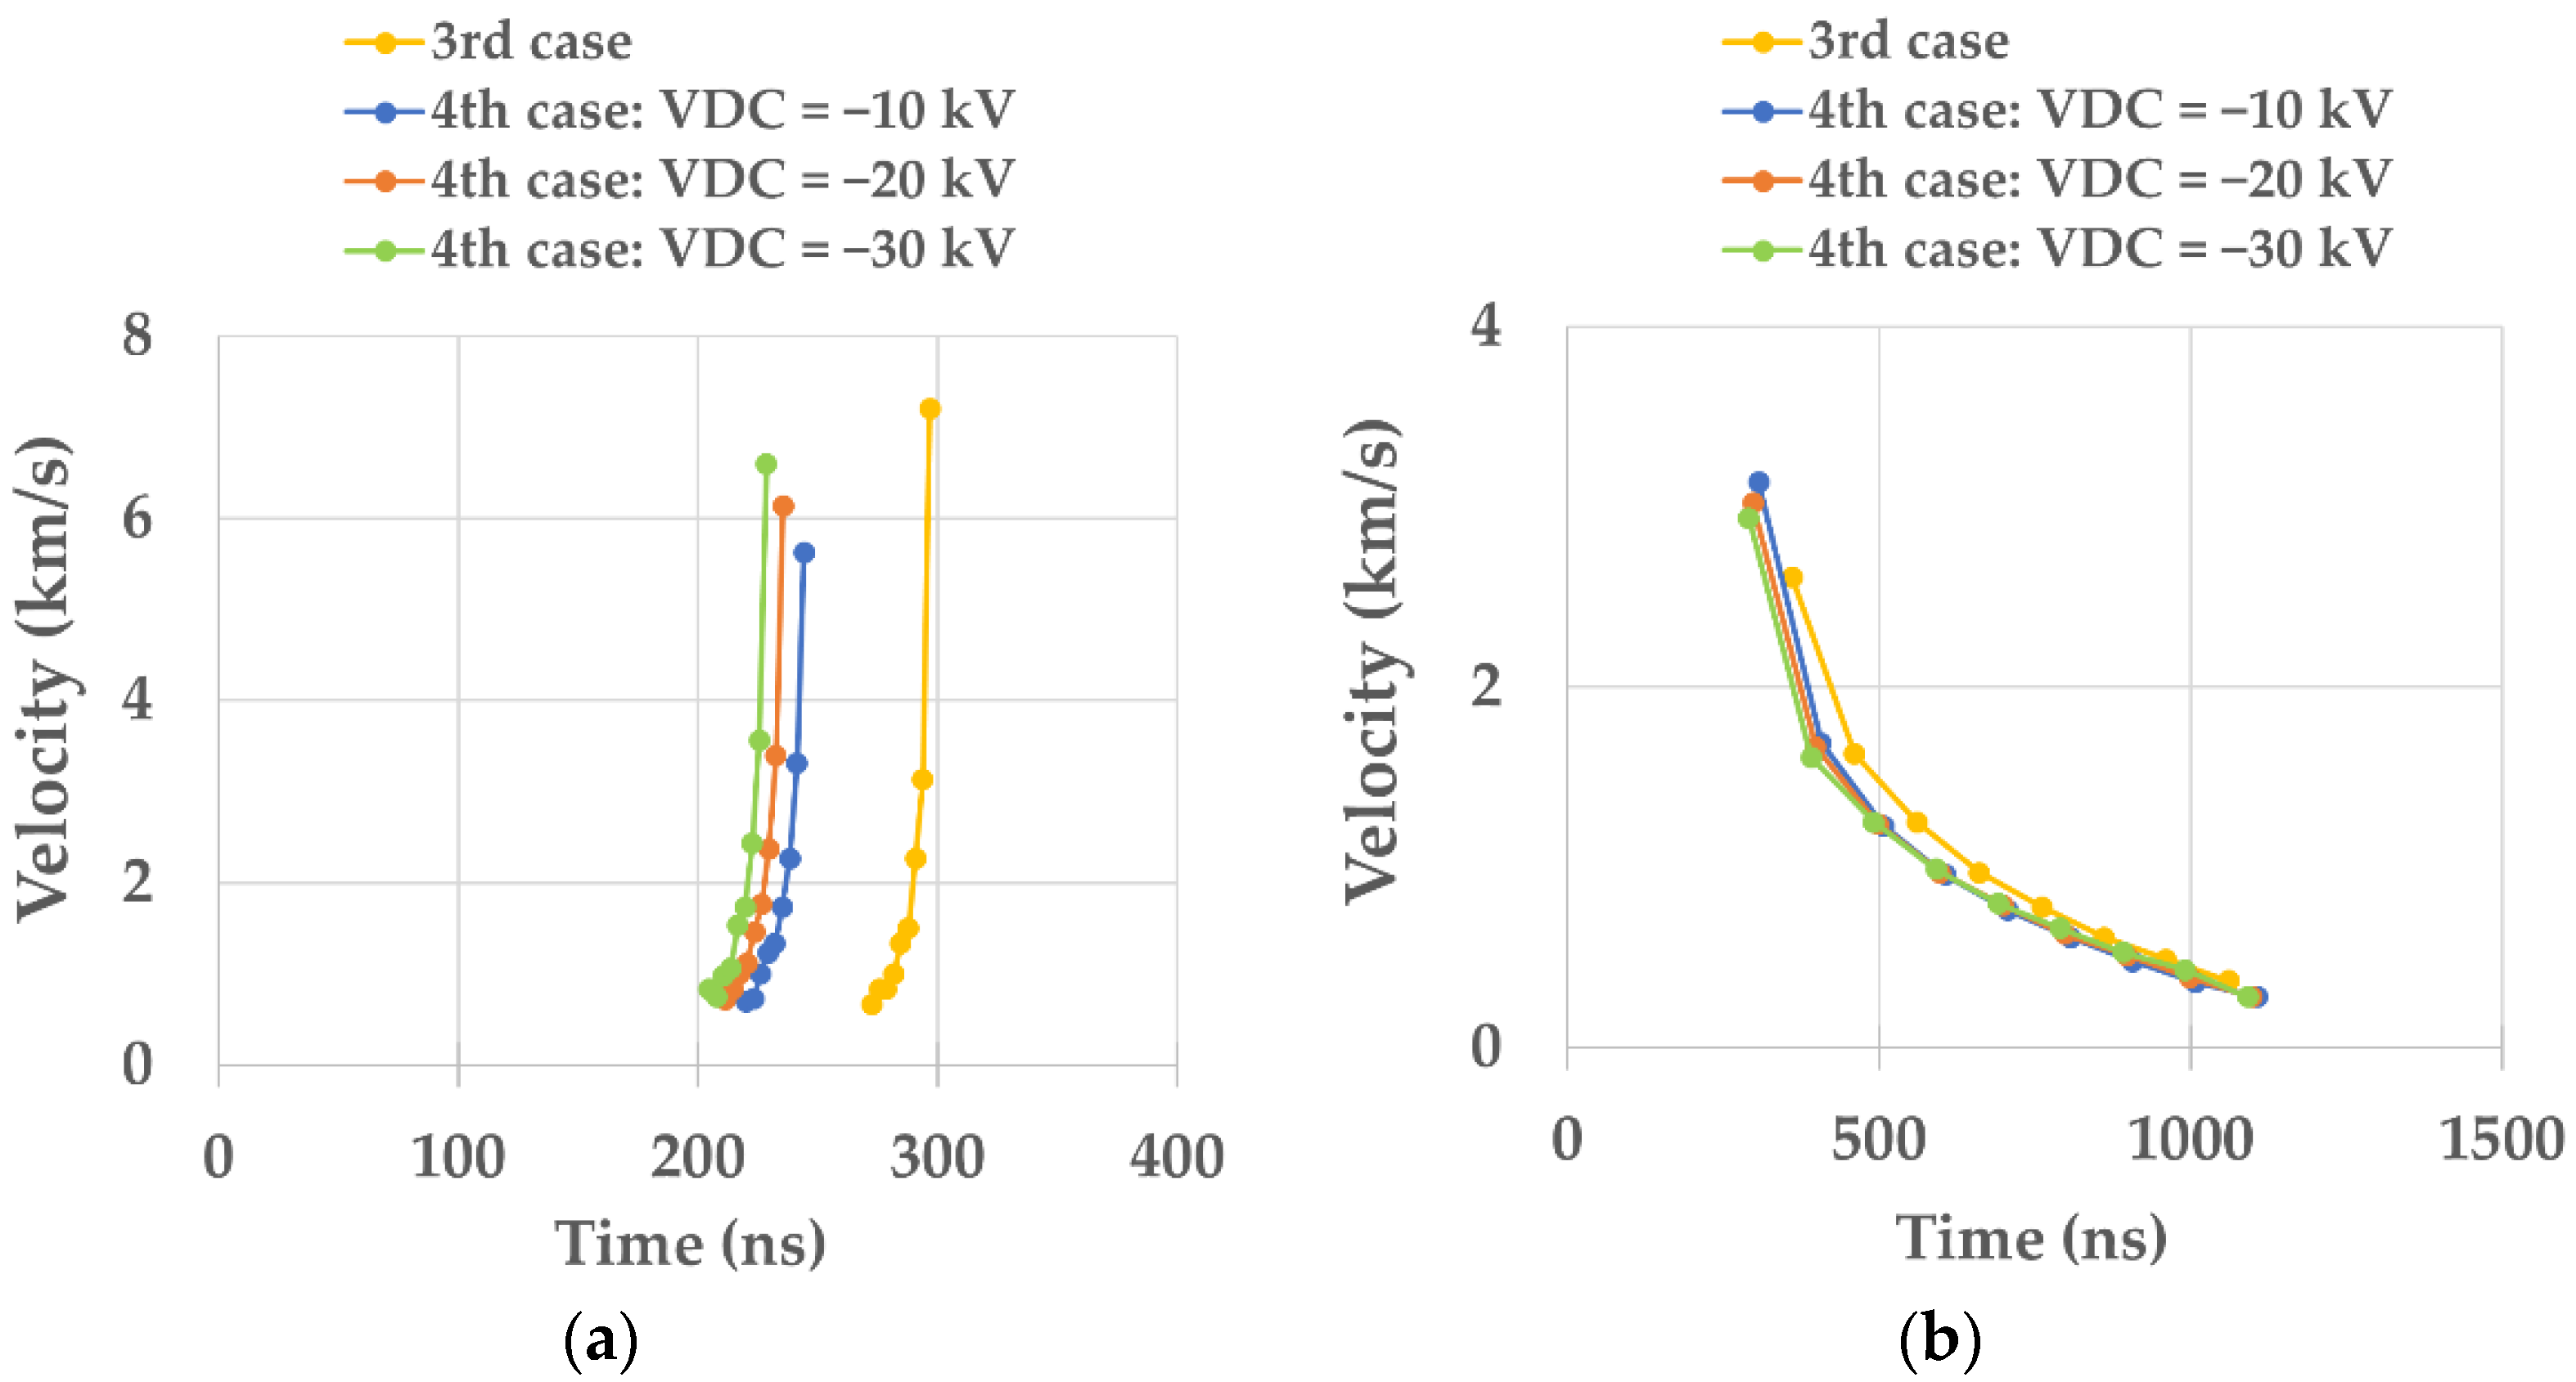
Figure 17 shows the streamer velocity in the third case and in the fourth case with different values of   V D C   during its propagation in oil (Figure 17a) and along the oil–OIP interface (Figure 17b). A shift in streamer velocity peaks is present as well compared to the results in Figure 16. However, increasing the negative DC voltage amplitude has the opposite effect: the streamer inception voltage is decreased and the peaks appear earlier due to the effect of negative surface charge accumulation that intensifies the total electric field since its polarity is opposite to that of the streamer. As for the difference in the amplitude of the streamer velocity peaks, it is also caused primarily by the effect of surface charge accumulation in Figure 17a and in the difference in the DC applied voltage in Figure 17b as detailed before in the first and second cases. It is also observed that the maximum velocity values are higher when the streamer is propagating in the oil than when it is propagating at the interface. It is noticed that the maximum velocity in the third case is higher than that in the fourth case in oil (Figure 17a), and it is lower at the interface (Figure 17b). This behavior was not expected; it is caused by an increase in negative surface charge at the beginning of the voltage application. Further investigations are necessary to understand the mechanism related to this behavior.

3.3.3. Effect on Streamer Travel Distance

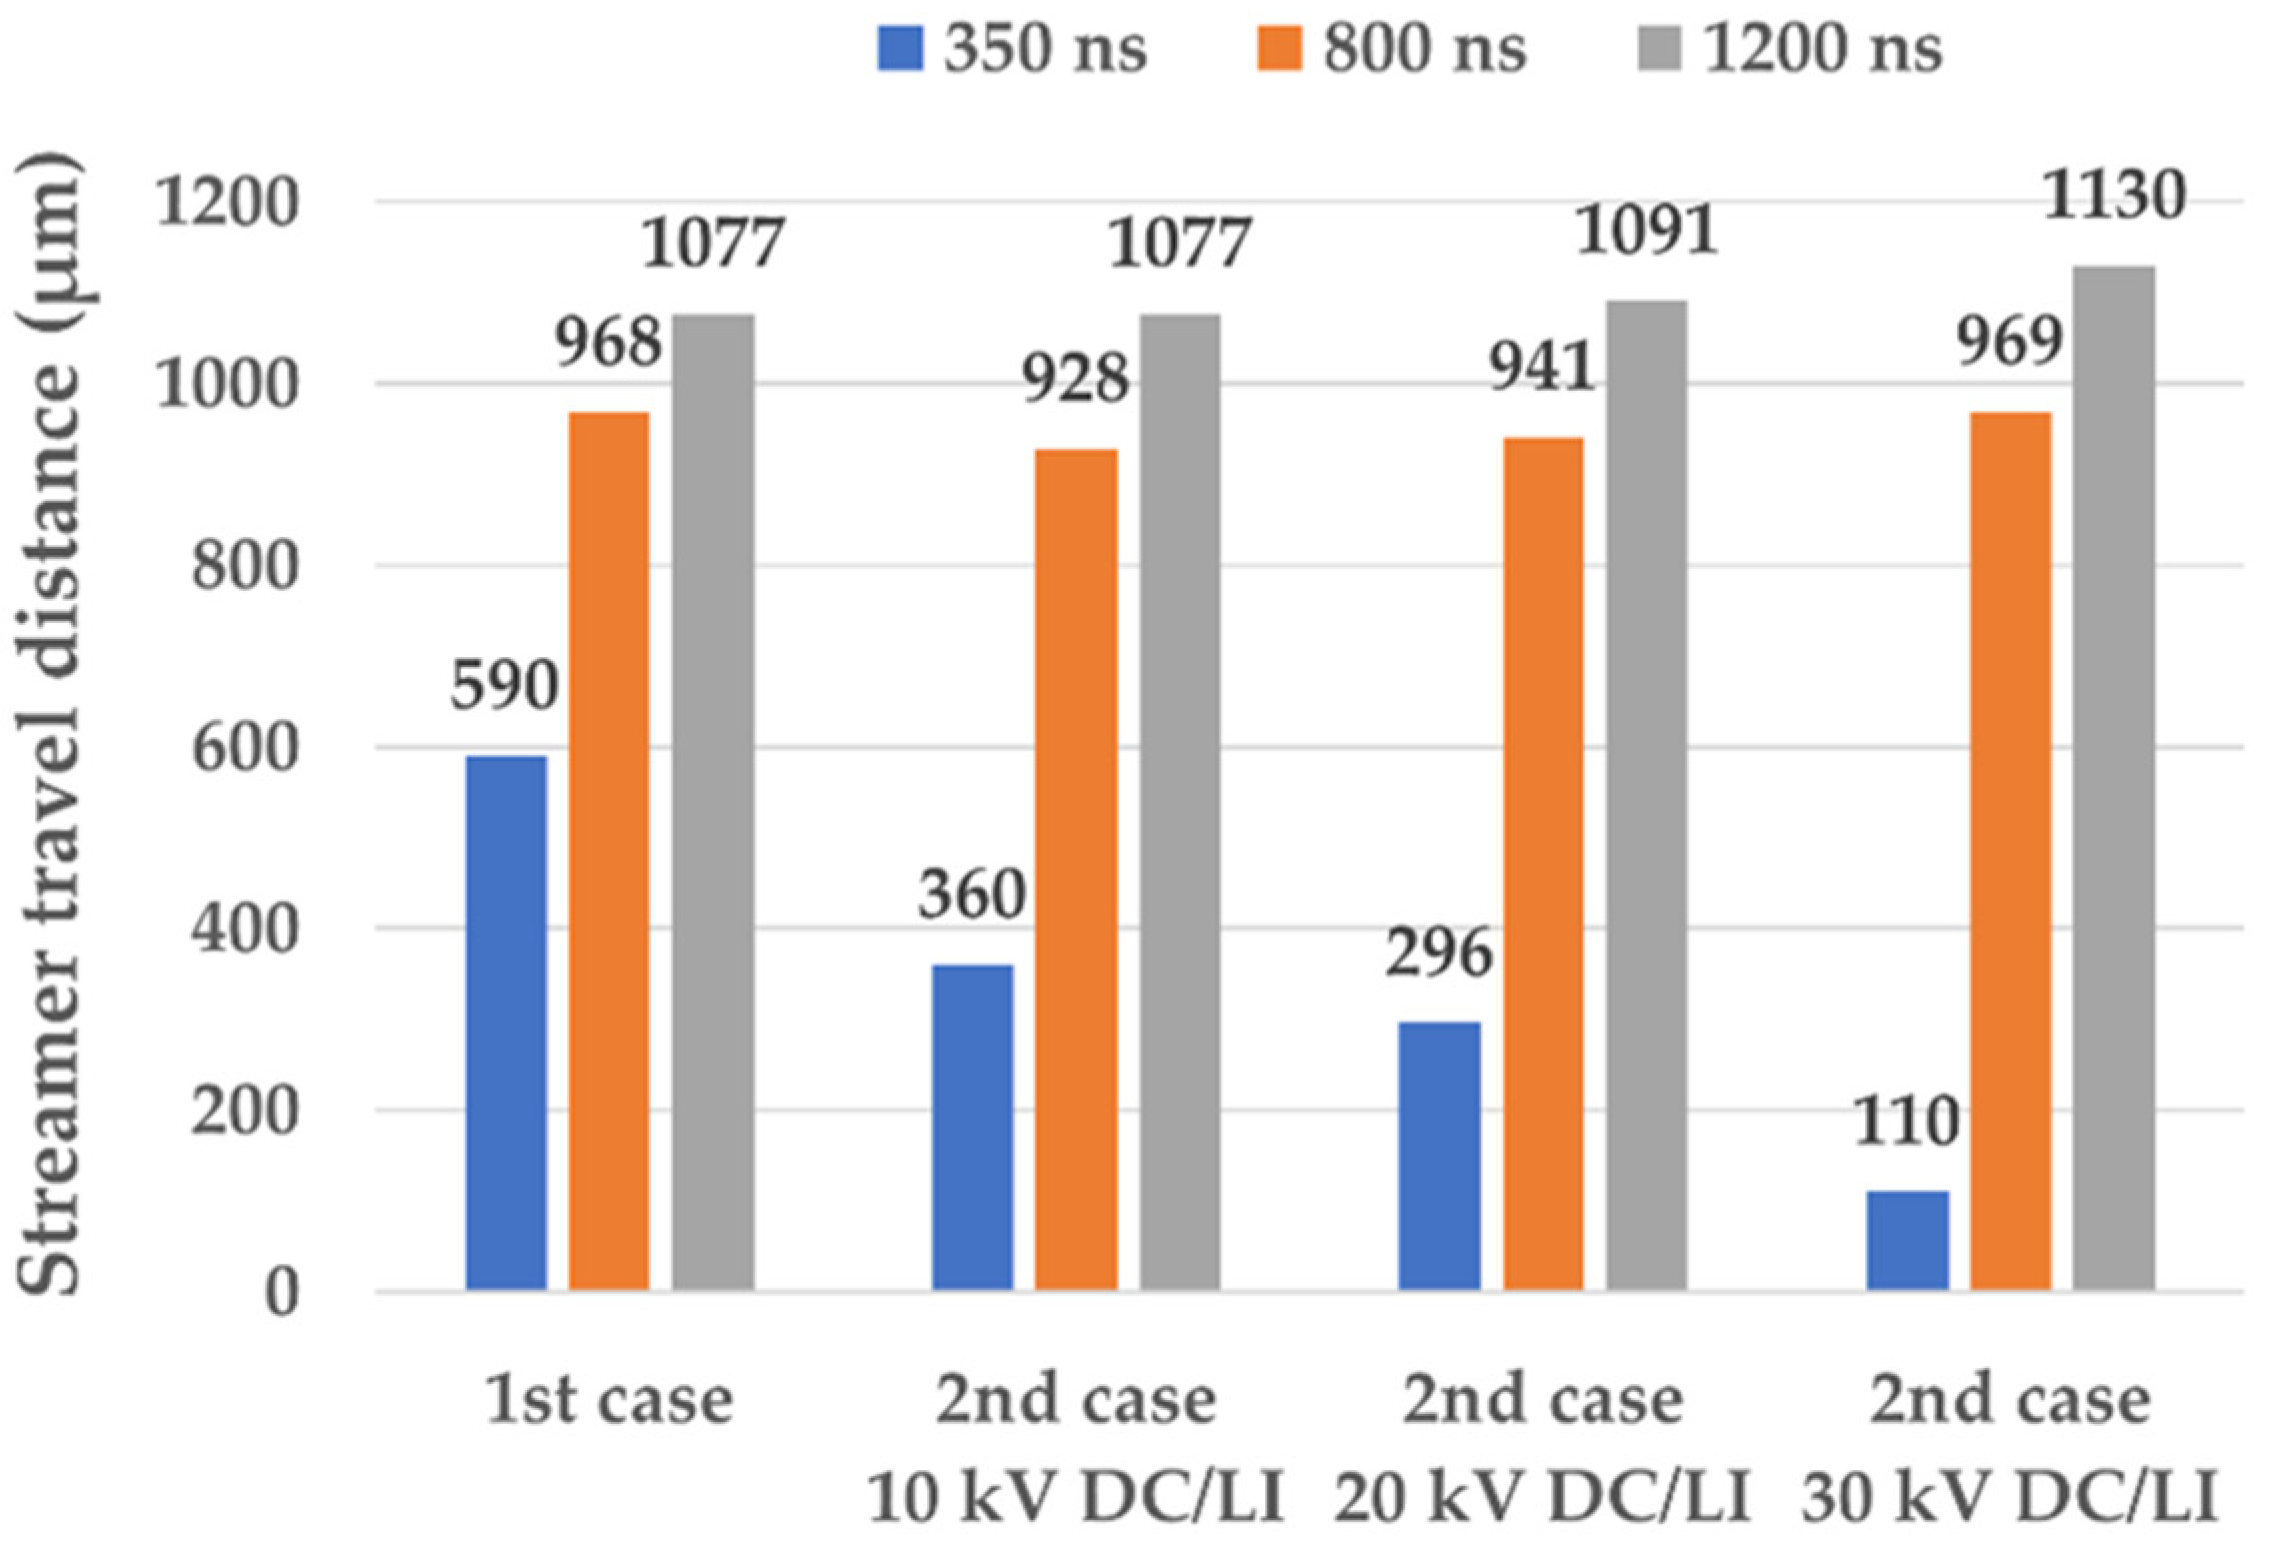
Figure 18 presents a graph of streamer travel distance at three instants in the first case and the second case using different values of   V D C . At 350 ns, the streamer travel distance in the second case is less than in the first case, and increasing the DC voltage amplitude in the second case reduces streamer travel distance even further. This can be explained by the fact that increasing the DC voltage amplitude was shown to cause a delay in the streamer initiation when the streamer and the accumulated surface charge have a positive polarity. The effect of the streamer velocity (Figure 16b) on its travel distance is starting to become more apparent at 800 ns and especially at 1200 ns where the streamer travel distance increases in the second case as the value of   V D C   increases and the streamer travel distance in the first case is no longer the biggest.
Figure 19 presents a graph of streamer travel distance at three instants in the third case and the fourth case using different values of   V D C . It can be observed that the streamer travel distance is bigger in the fourth case compared to its travel distance in the third case, which increases even further as the amplitude of the DC voltage in the fourth case is increased. The trend in the streamer travel distance at 350 ns showcased in the graph is corroborated by previous results stating that surface charge accumulation induces an advance in streamer initiation. However, the effect of the streamer velocity (Figure 17b) on its travel distance becomes more obvious at 800 ns and less at 1200 ns since the difference in the travel distance is either reversed or reduced compared to results at 350 ns.

4. Conclusions

In this work, a study of the effect of surface charge accumulation on surface streamer development in a liquid–solid insulation system is presented. Two models were implemented successively to perform this study: a quasi-electrostatic model in the DC phase to simulate surface charge accumulation, and a fluid model in the DC–LI superimposed voltage phase to simulate streamer initiation and propagation.
The results show that during the DC voltage phase, a surface charge density accumulates at the oil–OIP interface. The polarity and the density of these accumulated surface charges depend on the polarity and amplitude of the applied voltage, respectively. Moreover, they create their own electric field that contributes to the total electric field either by intensifying it or by reducing it. When the DC–LI superimposed voltage is applied, a streamer develops as soon as the electric field at the needle electrode reaches the initiation threshold value. The streamer travels vertically in oil while the electric field and the space charge density at its head increases gradually. As the streamer reaches the oil–OIP interface, a spike in the electric field magnitude and in the space charge density lead to a sudden rise in the conduction current. Then, the streamer starts traveling horizontally along the oil–OIP interface. During its travel, the electron attachment mechanism reduces the amount of space charge in oil, which causes a decrease in the electric field magnitude at the streamer head. Thus, the conduction current also reduces due its dependence on both the space charge density and the electric field magnitude. Moreover, since the streamer velocity increases with the electric field magnitude, it was observed that at the interface, the streamer reaches its highest velocity value at which it switches modes from the first mode to the second mode. Eventually, a reverse to the first mode takes place due to a decay in the electric field magnitude.
As for the effect of surface charge on streamers, it was shown that the threshold value at which streamers initiate is affected by the accumulated surface charge during the DC voltage phase. Thus, a delay or an advance in streamer development is observed compared to the cases where no DC voltage was applied prior to streamer initiation. It was observed that increasing the positive applied DC voltage amplitude resulted in:
  • Increased accumulation of positive surface charge;
  • Increased streamer inception voltage that causes further delay in streamer initiation;
  • Decreased streamer velocity just before reaching the oil–OIP interface, which increases at the beginning of streamer travel in the interface;
  • Decreased streamer travel distance.
However, increasing the negative applied DC voltage amplitude produced the opposite effect, namely:
5.
Increased accumulation of negative surface charge;
6.
Decreased streamer inception voltage that causes further advance in streamer initiation;
7.
Increased streamer velocity just before reaching the oil–OIP interface, which decreases at the beginning of the streamer travel in the interface;
8.
Increased streamer travel distance.
In polarity reversal, a streamer propagates longer due to the effect of the opposite accumulated surface charges. Thus, an increased probability of streamers reaching the opposite electrode exists, which can facilitate the creation of electrical arcs as a consequence. Additionally, surface tracking will be more important and solid insulation will have a shorter lifespan. Thus, the effects of surface charge accumulation must be taken into consideration in HVDC transformer design, especially at the valve side winding of the transformer where DC voltage superimpose with other voltage waveforms.
The obtained results suggest that surface charge accumulation can be a potential threat to electrical components used in HVDC links. The growing number of future worldwide projects of HVDC links should be an encouraging factor for researchers to give particular attention to the effect of space and surface charge on the discharge phenomena. In this work, only surface charge accumulation was considered. However, implementing a space charge model in the pressboard could provide more information to understand these interactions. In future works, the experimental approach will be considered in order to ascertain the simulation results. Additionally, the possibility of investigating the effect of varying material parameters will be looked into.

Author Contributions

Conceptualization: Y.M., A.Z. and C.V.; methodology: Y.M., A.Z. and C.V.; writing—original draft preparation: Y.M., A.Z.; writing—reviewing and editing: Y.M., A.Z. and C.V.; supervision and project administration: A.Z. and C.V. All authors have read and agreed to the published version of the manuscript.

Funding

The authors would like to thank the French Ministry of Higher Education, Research and Innovation (M.E.S.R.I.) for their financial support.

Institutional Review Board Statement

Not applicable.

Informed Consent Statement

Not applicable.

Data Availability Statement

Data is provided in the paper.

Conflicts of Interest

The authors declare no conflict of interest.

References

  1. S & P Global. Available online: https://www.spglobal.com/en/research-insights/articles/what-is-energy-transition (accessed on 24 October 2022).
  2. Wang, P.; Goel, L.; Liu, X.; Choo, F.H. Harmonizing AC and DC: A Hybrid AC/DC Future Grid Solution. IEEE Power Energy Mag. 2013, 11, 76–83. [Google Scholar] [CrossRef]
  3. Adapa, R. High-Wire Act: HVdc Technology: The State of the Art. IEEE Power Energy Mag. 2012, 10, 18–29. [Google Scholar] [CrossRef]
  4. Bahrman, M.P.; Johnson, B.K. The ABCs of HVDC Transmission Technologies. IEEE Power Energy Mag. 2007, 5, 32–44. [Google Scholar] [CrossRef]
  5. Flourentzou, N.; Agelidis, V.G.; Demetriades, G.D. VSC-Based HVDC Power Transmission Systems: An Overview. IEEE Trans. Power Electron. 2009, 24, 592–602. [Google Scholar] [CrossRef]
  6. Yang, J.; Fletcher, J.E.; O’Reilly, J. Short-Circuit and Ground Fault Analyses and Location in VSC-Based DC Network Cables. IEEE Trans. Ind. Electron. 2012, 59, 3827–3837. [Google Scholar] [CrossRef] [Green Version]
  7. Nakajima, T.; Irokawa, S. A Control System for HVDC Transmission by Voltage Sourced Converters. In Proceedings of the 1999 IEEE Power Engineering Society Summer Meeting. Conference Proceedings (Cat. No.99CH36364), Edmonton, AB, Canada, 18–22 July 1999; Volume 2, pp. 1113–1119. [Google Scholar]
  8. Kouro, S.; Malinowski, M.; Gopakumar, K.; Pou, J.; Franquelo, L.G.; Wu, B.; Rodriguez, J.; Pérez, M.A.; Leon, J.I. Recent Advances and Industrial Applications of Multilevel Converters. IEEE Trans. Ind. Electron. 2010, 57, 2553–2580. [Google Scholar] [CrossRef]
  9. Hammons, T.J.; Lescale, V.F.; Uecker, K.; Haeusler, M.; Retzmann, D.; Staschus, K.; Lepy, S. State of the Art in Ultrahigh-Voltage Transmission. Proc. IEEE 2012, 100, 360–390. [Google Scholar] [CrossRef]
  10. Thind, B.S.; Thomas, A.J.; Reddy, C.C. Effect of Voltage Waveforms of HVDC Converter Transformer on Lifetime Characteristics. IEEE Trans. Power Deliv. 2021, 36, 3101–3108. [Google Scholar] [CrossRef]
  11. Bhuvaneswari, G.; Mahanta, B.C. Analysis of Converter Transformer Failure in HVDC Systems and Possible Solutions. IEEE Trans. Power Deliv. 2009, 24, 814–821. [Google Scholar] [CrossRef]
  12. Huang, B.; Hao, M.; Hao, J.; Fu, J.; Wang, Q.; Chen, G. Space Charge Characteristics in Oil and Oil-Impregnated Pressboard and Electric Field Distortion after Polarity Reversal. IEEE Trans. Dielectr. Electr. Insul. 2016, 23, 881–891. [Google Scholar] [CrossRef]
  13. Zhang, J.; Chi, M.; Chen, Q.; Sun, W.; Cao, J. Effect of Temperature on Space Charge Distribution in Two Layers of Transformer Oil and Impregnated Pressboard Under DC Voltage. IEEE Access 2020, 8, 16647–16655. [Google Scholar] [CrossRef]
  14. Piovan, U. Insulation Systems for HVDC Transformers: Present Configurations, Trends, Challenges, Solutions and Open Points. In Proceedings of the 2013 IEEE International Conference on Solid Dielectrics (ICSD), Bologna, Italy, 30 June–4 July 2013; pp. 254–257. [Google Scholar]
  15. Carlson, A. ABB Library-Specific Requirements on HVDC Converter Transformers. Available online: https://library.e.abb.com/public/5f6d61425208b604c1256fda004aeada/Specific%20requirements%20on%20HVDC%20converter%20transformers.pdf (accessed on 24 October 2022).
  16. Azcárraga, C.G. Partial Discharge Phenomena in Converter and Traction Transformer: Identification and Reliability. Ph.D. Thesis, Università di Bologna, Bologna, Italy, 2014. [Google Scholar]
  17. Ebisawa, Y.; Yamada, S.; Mori, S.; Teranishi, T. DC Creepage Breakdown Characteristics of Oil-Immersed Insulation. IEEE Trans. Dielectr. Electr. Insul. 2009, 16, 1686–1692. [Google Scholar] [CrossRef]
  18. Kharezy, M.; Thiringer, T. Challenges with the Design of Cost Effective Series DC Collection Network for Offshore Wind Farm. In Proceedings of the 17th Wind Integration Workshop, Stockholm, Sweden, 17–19 October 2018. [Google Scholar]
  19. Sun, A.; Huo, C.; Zhuang, J. Formation Mechanism of Streamer Discharges in Liquids: A Review. High Volt. 2016, 1, 74–80. [Google Scholar] [CrossRef]
  20. Wedin, P. Electrical Breakdown in Dielectric Liquids-a Short Overview. IEEE Electr. Insul. Mag. 2014, 30, 20–25. [Google Scholar] [CrossRef]
  21. Lesaint, O. “Streamers” in Liquids: Relation with Practical High Voltage Insulation and Testing of Liquids. In Proceedings of the 2008 IEEE International Conference on Dielectric Liquids, Poitiers, France, 30 June–3July 2008; pp. 1–6. [Google Scholar]
  22. Beroual, A.; Zahn, M.; Badent, A.; Kist, K.; Schwabe, A.J.; Yamashita, H.; Yamazawa, K.; Danikas, M.; Chadband, W.D.; Torshin, Y. Propagation and Structure of Streamers in Liquid Dielectrics. IEEE Electr. Insul. Mag. 1998, 14, 6–17. [Google Scholar] [CrossRef] [Green Version]
  23. Lesaint, O. Prebreakdown Phenomena in Liquids: Propagation `modes’ and Basic Physical Properties. J. Phys. D Appl. Phys. 2016, 49, 144001. [Google Scholar] [CrossRef]
  24. Akiyama, H. Streamer Discharges in Liquids and Their Applications. IEEE Trans. Dielectr. Electr. Insul. 2000, 7, 646–653. [Google Scholar] [CrossRef]
  25. Rao, U.M.; Fofana, I.; Beroual, A.; Rozga, P.; Pompili, M.; Calcara, L.; Rapp, K.J. A Review on Pre-Breakdown Phenomena in Ester Fluids: Prepared by the International Study Group of IEEE DEIS Liquid Dielectrics Technical Committee. IEEE Trans. Dielectr. Electr. Insul. 2020, 27, 1546–1560. [Google Scholar] [CrossRef]
  26. Dumitrescu, L.; Lesaint, O.; Bonifaci, N.; Denat, A.; Notingher, P. Study of Streamer Inception in Cyclohexane with a Sensitive Charge Measurement Technique under Impulse Voltage. J. Electrost. 2001, 53, 135–146. [Google Scholar] [CrossRef]
  27. Denat, A.; Gosse, J.P.; Gosse, B. Electrical Conduction of Purified Cyclohexane in a Divergent Electric Field. IEEE Trans. Electr. Insul. 1988, 23, 545–554. [Google Scholar] [CrossRef]
  28. Bonifaci, N.; Denat, A.; Atrazhev, V. Ionization Phenomenon in High-Density Gaseous and Liquid Argon in Corona Discharge Experiments. J. Phys. D Appl. Phys. 1997, 30, 2717–2725. [Google Scholar] [CrossRef]
  29. Naidis, G.V. On Streamer Inception in Hydrocarbon Liquids in Point-Plane Gaps. IEEE Trans. Dielectr. Electr. Insul. 2015, 22, 2428–2432. [Google Scholar] [CrossRef]
  30. Naidis, G.V. Modelling of Streamer Propagation in Hydrocarbon Liquids in Point-Plane Gaps. J. Phys. D Appl. Phys. 2015, 48, 195203. [Google Scholar] [CrossRef]
  31. Starikovskiy, A.; Yang, Y.; Cho, Y.I.; Fridman, A. Non-Equilibrium Plasma in Liquid Water: Dynamics of Generation and Quenching. Plasma Sources Sci. Technol. 2011, 20, 024003. [Google Scholar] [CrossRef]
  32. Moufakkir, Y.; Zouaghi, A.; Vollaire, C. Analysis of Electric Field and Surface Discharge in Liquid-Solid Insulation System for HVDC Components. In Proceedings of the 2022 IEEE 21st International Conference on Dielectric Liquids (ICDL), Sevilla, Spain, 29 May–2 June 2022; pp. 1–4. [Google Scholar]
  33. Zainuddin, H. Study of Surface Discharge Behaviour at the Oil-Pressboard Interface. Ph.D. Thesis, University of Southampton, Southampton, UK, 2013. [Google Scholar]
  34. IEC 60060-1:2010; High-Voltage Test Techniques—Part 1: General Definitions and Test Requirements. IEC Standard: Geneva, Switzerland, 2010.
  35. Du, B.; Dong, J.; Liang, H.; Kong, X. Polarity Reversal and Over Voltage Affecting Discharge Inception of Tri-Post Insulator in ±800 KV GIL. IEEE Trans. Dielectr. Electr. Insul. 2022, 29, 223–230. [Google Scholar] [CrossRef]
  36. O’Sullivan, F.M. A Model for the Initiation and Propagation of Electrical Streamers in Transformer Oil and Transformer Oil Based Nanofluids. Ph.D. Thesis, Massachusetts Institute of Technology, Cambridge, MA, USA, 2007. [Google Scholar]
  37. Hwang, J.W.G. Elucidating the Mechanisms behind Pre-Breakdown Phenomena in Transformer Oil Systems. Ph.D. Thesis, Massachusetts Institute of Technology, Cambridge, MA, USA, 2010. [Google Scholar]
  38. Jadidian, J. Charge Transport and Breakdown Physics in Liquid/Solid Insulation Systems. Ph.D. Thesis, Massachusetts Institute of Technology, Cambridge, MA, USA, 2013. [Google Scholar]
  39. Qian, J.; Joshi, R.P.; Schamiloglu, E.; Gaudet, J.; Woodworth, J.R.; Lehr, J. Analysis of Polarity Effects in the Electrical Breakdown of Liquids. J. Phys. D Appl. Phys. 2006, 39, 359. [Google Scholar] [CrossRef]
  40. O’Sullivan, F.; Hwang, J.G.; Zahn, M.; Hjortstam, O.; Pettersson, L.; Liu, R.; Biller, P. A Model for the Initiation and Propagation of Positive Streamers in Transformer Oil. In Proceedings of the Conference Record of the 2008 IEEE International Symposium on Electrical Insulation, Bucharest, Romania, 15–19 September 2008; pp. 210–214. [Google Scholar]
  41. Fowler, R.; Nordheim, L. Electron Emission in Intense Electric Fields. Proc. R. Soc. A Math. Phys. Eng. Sci. 1928, 119, 173–181. [Google Scholar] [CrossRef]
  42. Onsager, L. Deviations from Ohm’s Law in Weak Electrolytes. J. Chem. Phys. 1934, 2, 599–615. [Google Scholar] [CrossRef]
  43. Ghassemi, M.; Chen, Q.; Cao, Y. The Influence of Magnitude and Rise Time of Applied Voltage and the Type of Oil on Streamer Growth in a Wet-Mate DC Connector. IEEE Trans. Dielectr. Electr. Insul. 2017, 24, 1646–1656. [Google Scholar] [CrossRef]
  44. Lundgaard, L.; Linhjell, D.; Berg, G.; Sigmond, S. Propagation of Positive and Negative Streamers in Oil with and without Pressboard Interfaces. IEEE Trans. Dielectr. Electr. Insul. 1998, 5, 388–395. [Google Scholar] [CrossRef]
  45. Zener, C. A Theory of the Electrical Breakdown of Solid Dielectrics. Proc. R. Soc. London. Ser. A Contain. Pap. A Math. Phys. Character 1934, 145, 523–529. [Google Scholar] [CrossRef] [Green Version]
  46. Morrow, R.; Sato, N. The Discharge Current Induced by the Motion of Charged Particles in Time-Dependent Electric Fields; Sato’s Equation Extended. J. Phys. D Appl. Phys. 1999, 32, L20–L22. [Google Scholar] [CrossRef]
  47. Nakane, R.; Kato, K.; Hayakawa, N.; Okubo, H. Time and Space Transition Characteristics of DC Electric Field Stress in Oil-Pressboard Composite Insulation Systems. Electron. Commun. Jpn. 2020, 103, 13–21. [Google Scholar] [CrossRef]
  48. Ghassemi, M.; Tefferi, M.B.; Chen, Q.; Cao, Y. Modeling a Liquid-Solid Insulation System Used in a DC Wet-Mate Connector. In Proceedings of the 2016 IEEE Conference on Electrical Insulation and Dielectric Phenomena (CEIDP), Toronto, ON, Canada, 16–19 October 2016; pp. 161–166. [Google Scholar]
  49. Lesaint, O.; Massala, G. Transition to Fast Streamers in Mineral Oil in the Presence of Insulating Solids. In Proceedings of the Conference Record of the 1996 IEEE International Symposium on Electrical Insulation, Montreal, QC, Canada, 16–19 June 1996; Volume 2, pp. 737–740. [Google Scholar]
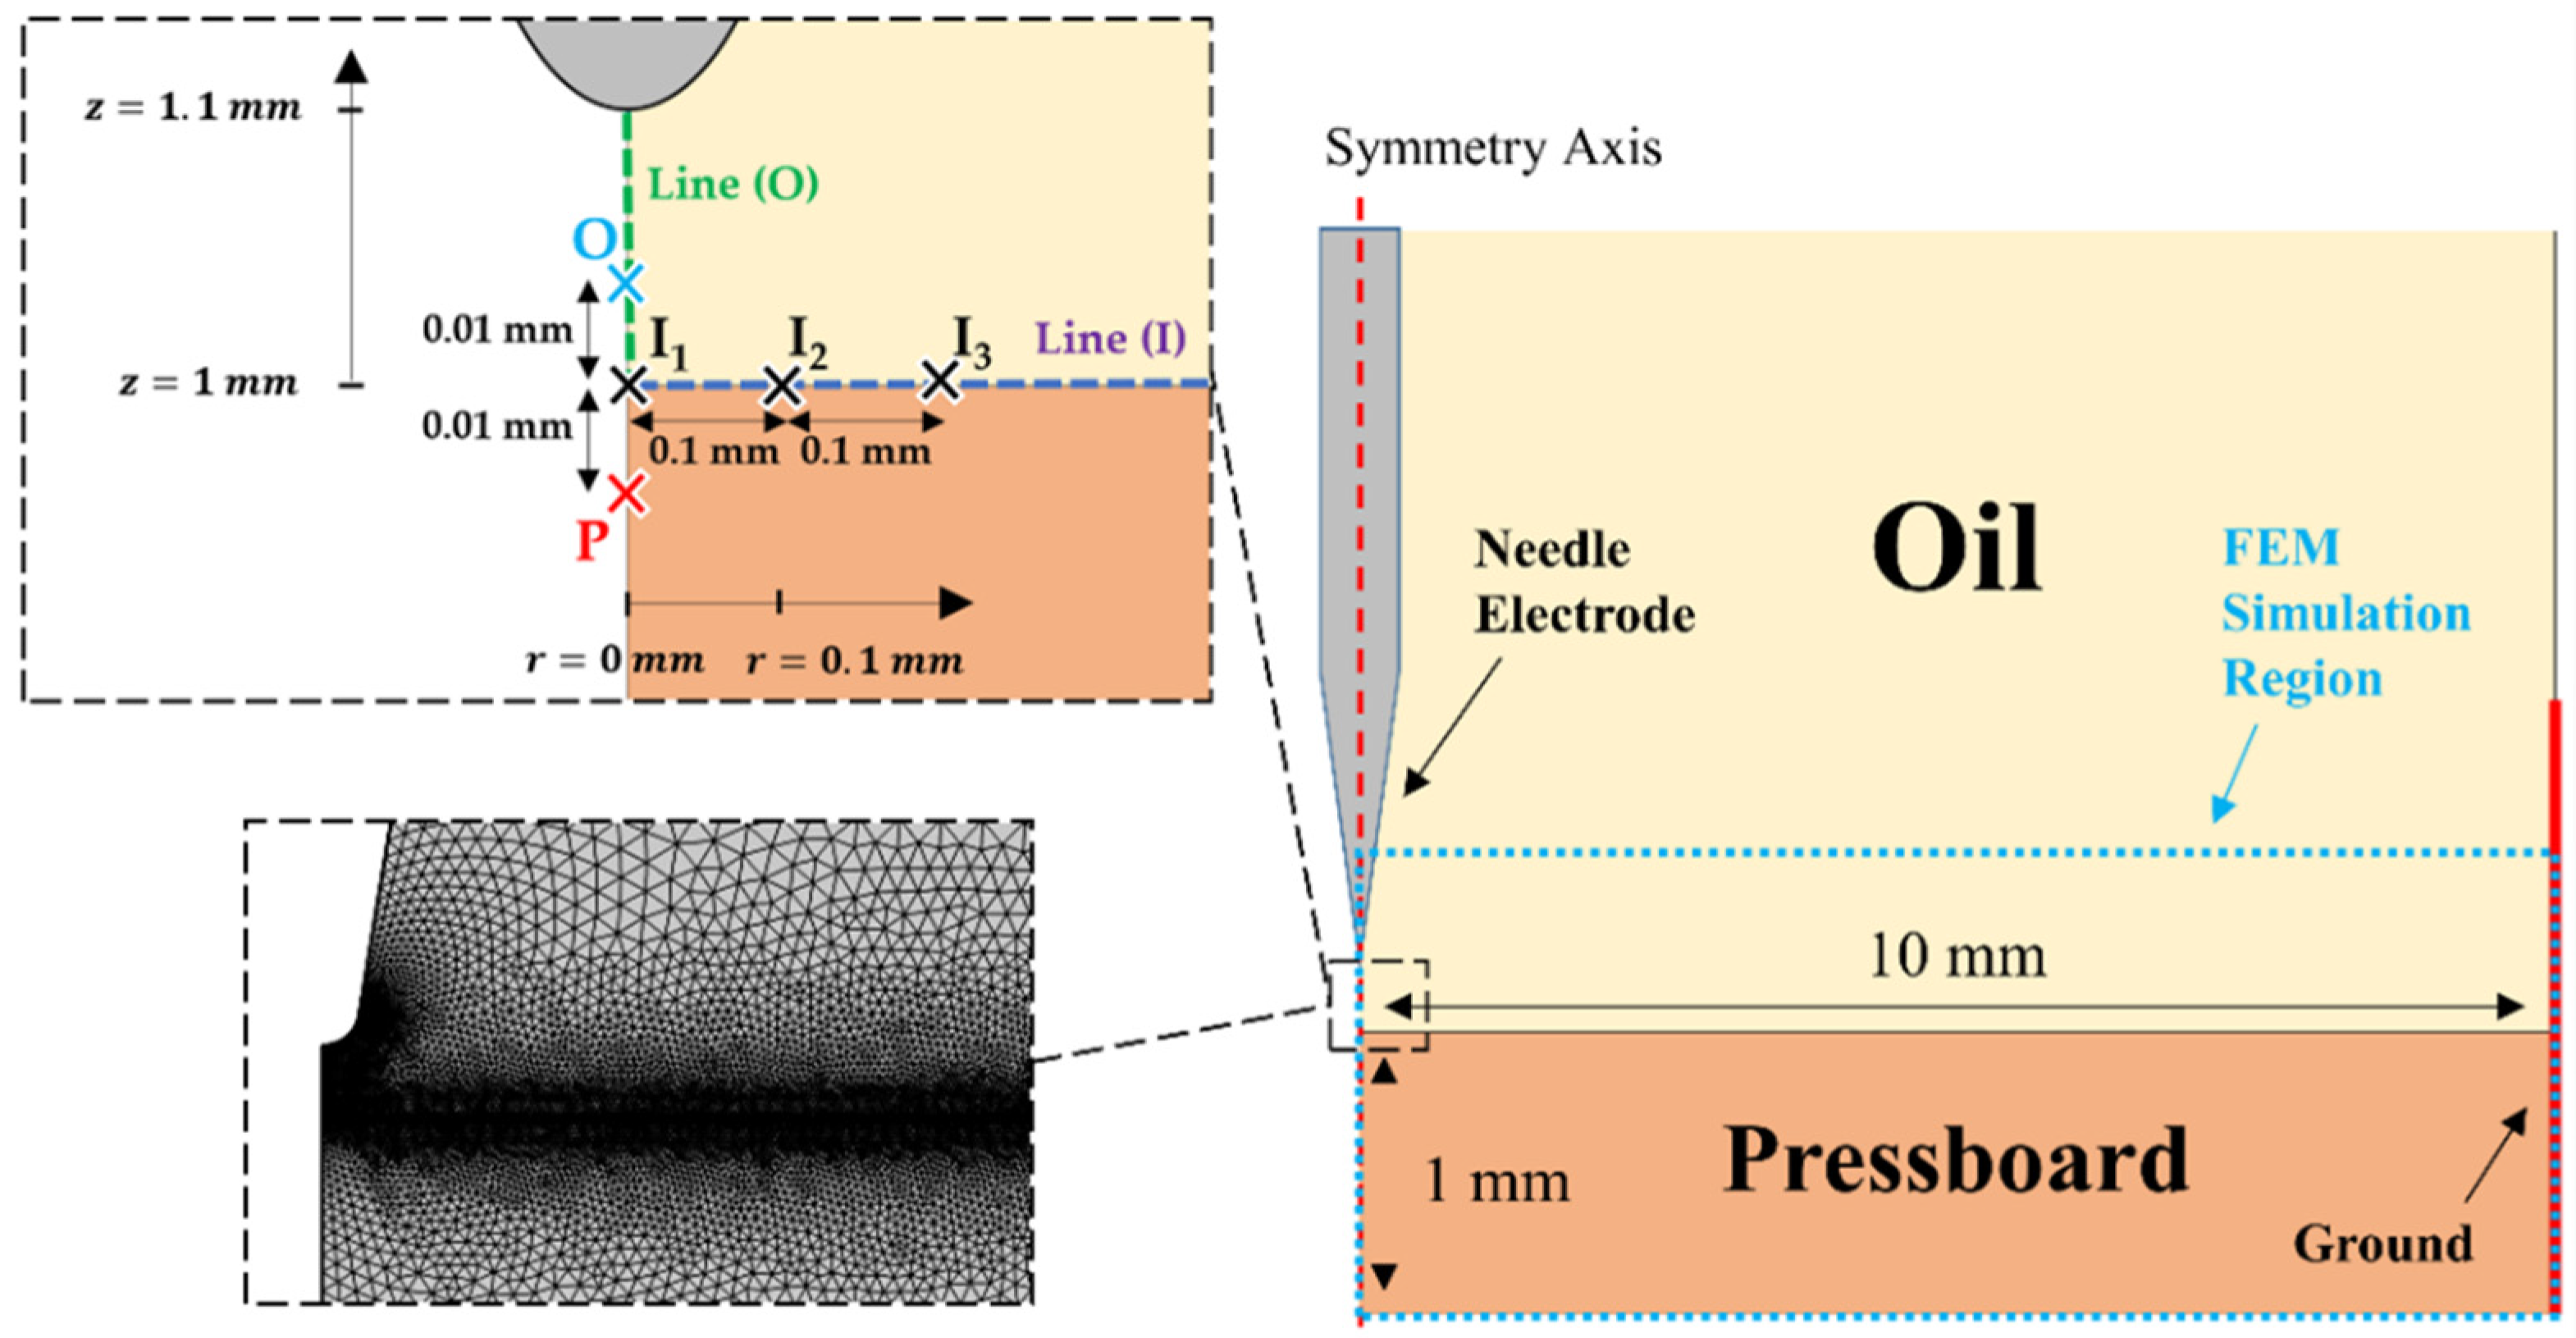
Figure 1. Schematic illustration of the studied geometry (2D axisymmetric) and the used mesh.
Energies 16 00172 g001
Figure 2. Voltage waveforms used in the simulations: (a) 1st case; (b) 2nd case; (c) 3rd case; (d) 4th case.
Energies 16 00172 g002
Figure 3. Surface charge density (mC/m2) in points   I 1 ,   I 2   and   I 3   (Figure 1) as a function of time (s) in the 2nd case under applied 20 kV DC voltage.
Energies 16 00172 g003
Figure 4. Surface charge density (mC/m2) along the line ( I ) (Figure 1) in the 2nd and 4th cases under applied DC voltage with different amplitudes.
Energies 16 00172 g004
Figure 5. Electric field magnitude (kV/mm) in points   O   and   P   (Figure 1) as a function of time (s) in the 2nd case under applied 20 kV DC voltage.
Energies 16 00172 g005
Figure 6. Equipotential lines in the 2nd case under applied 20 kV DC voltage: (a) at voltage application   t = 200   s ; (b) at the steady-state   t = 0   s .
Energies 16 00172 g006
Figure 7. Two-dimensional plane distribution of the electric field magnitude (kV/mm) in the 1st case at three instants: (a) 0 ns; (b) 150 ns; (c) 200 ns.
Energies 16 00172 g007aEnergies 16 00172 g007b
Figure 8. Electric field magnitude (kV/mm) along the line ( O ) (Figure 1) at several instants in the 1st case.
Energies 16 00172 g008
Figure 9. Space charge density (C/m2) along the line ( O ) at several instants in the 1st case.
Energies 16 00172 g009
Figure 10. Electric field magnitude (kV/mm) along the line ( I ) at several instants in the 1st case.
Energies 16 00172 g010
Figure 11. Space charge density (C/m2) along the line ( I ) at several instants in the 1st case.
Energies 16 00172 g011
Figure 12. Conduction and displacement currents as a function of time (ns) in the 1st case.
Energies 16 00172 g012
Figure 13. Streamer velocity (km/s) as a function of time (ns) in the 1st case: (a) streamer propagation in oil; (b) streamer travel along the oil–OIP interface.
Energies 16 00172 g013
Figure 14. Two-dimensional plane distribution of the electric field magnitude (kV/mm) at different instants: (ac) 1st case; (df) 2nd case with   V D C = 20   kV .
Energies 16 00172 g014aEnergies 16 00172 g014b
Figure 15. Two-dimensional plane distribution of the electric field magnitude (kV/mm) at different instants: (ac) 3rd case; (df) 4th case case with   V D C = 20   kV .
Energies 16 00172 g015
Figure 16. Streamer velocity (km/s) as a function of time (s) in the 1st and 2nd cases: (a) streamer propagation in oil; (b) streamer travel along the oil–OIP interface.
Energies 16 00172 g016
Figure 17. Streamer velocity (km/s) as a function of time (s) in the 3rd and 4th cases: (a) streamer propagation in oil; (b) streamer travel along the oil–OIP interface.
Energies 16 00172 g017
Figure 18. Streamer travel distance (μm) at three instants in the 1st and 2nd cases.
Energies 16 00172 g018
Figure 19. Streamer travel distance (μm) at three instants in the 3rd and 4th cases.
Energies 16 00172 g019
Table 1. Parameter values for the streamer model in transformer oil.
ParameterSymbolValue [33,37,38,40]
Positive ion mobility μ p 1 × 10 9   m 2 · V 1 · s 1
Negative ion mobility μ n 1 × 10 9   m 2 · V 1 · s 1
Electron mobility μ e 1 × 10 4   m 2 · V 1 · s 1
Ion–ion recombination rate R p n 1.64 × 10 17   m 3 · s 1
Electron–ion recombination rate R p e 1.64 × 10 17   m 3 · s 1
Electron attachment time τ a 200   ns
Elementary charge e 1.602 × 10 19   C
Density of ionizable species n 0 1 × 10 23   m 3
Molecular separation distancea 3 × 10 10   m
Planck’s constant h 6.26 × 10 34   J · s
Effective electron mass m * 9.11 × 10 32   kg
Ionization potential Δ 1.14 × 10 18   J
Table 2. Boundary conditions.
BoundaryElectrostaticTransport of Charge Carriers
Needle electrode V a p p = V 1 , 2 , 3 , 4   n · ρ p , n , e = 0
Ground V a p p = 0 n · ρ p , n , e = 0
Oil–OIP interfaceEquations (11) and (14) { i f   n · E < 0   t h e n   n · ρ p μ p E = 0 e l s e   n · ρ p μ p E = n · ρ p μ p E
{ i f   n · E > 0   t h e n   n · ρ n , e μ n , e E = 0 e l s e   n · ρ n , e μ n , e E = n · ρ n , e μ n , e E
Outer boundary n · D = 0 ρ p , n , e μ p , n , e n · E = 0
Disclaimer/Publisher’s Note: The statements, opinions and data contained in all publications are solely those of the individual author(s) and contributor(s) and not of MDPI and/or the editor(s). MDPI and/or the editor(s) disclaim responsibility for any injury to people or property resulting from any ideas, methods, instructions or products referred to in the content.