
Energy Performance Analysis of a Heat Supply System of a University Campus


Abstract
:1. Introduction
- Find the energy consumption area for which the detailed energy audit should be done;
- Identify the systems to be analyzed together with their components and related technical specifications;
- Develop the actual complex energy balance based on the measurements and specific data of the equipment and installations;
- Identify measures to reduce energy consumption in order to develop an optimized energy balance;
- Perform economic efficiency calculations for the identified optimization measures;
- Calculate the greenhouse gas emissions and assess the environmental impact.
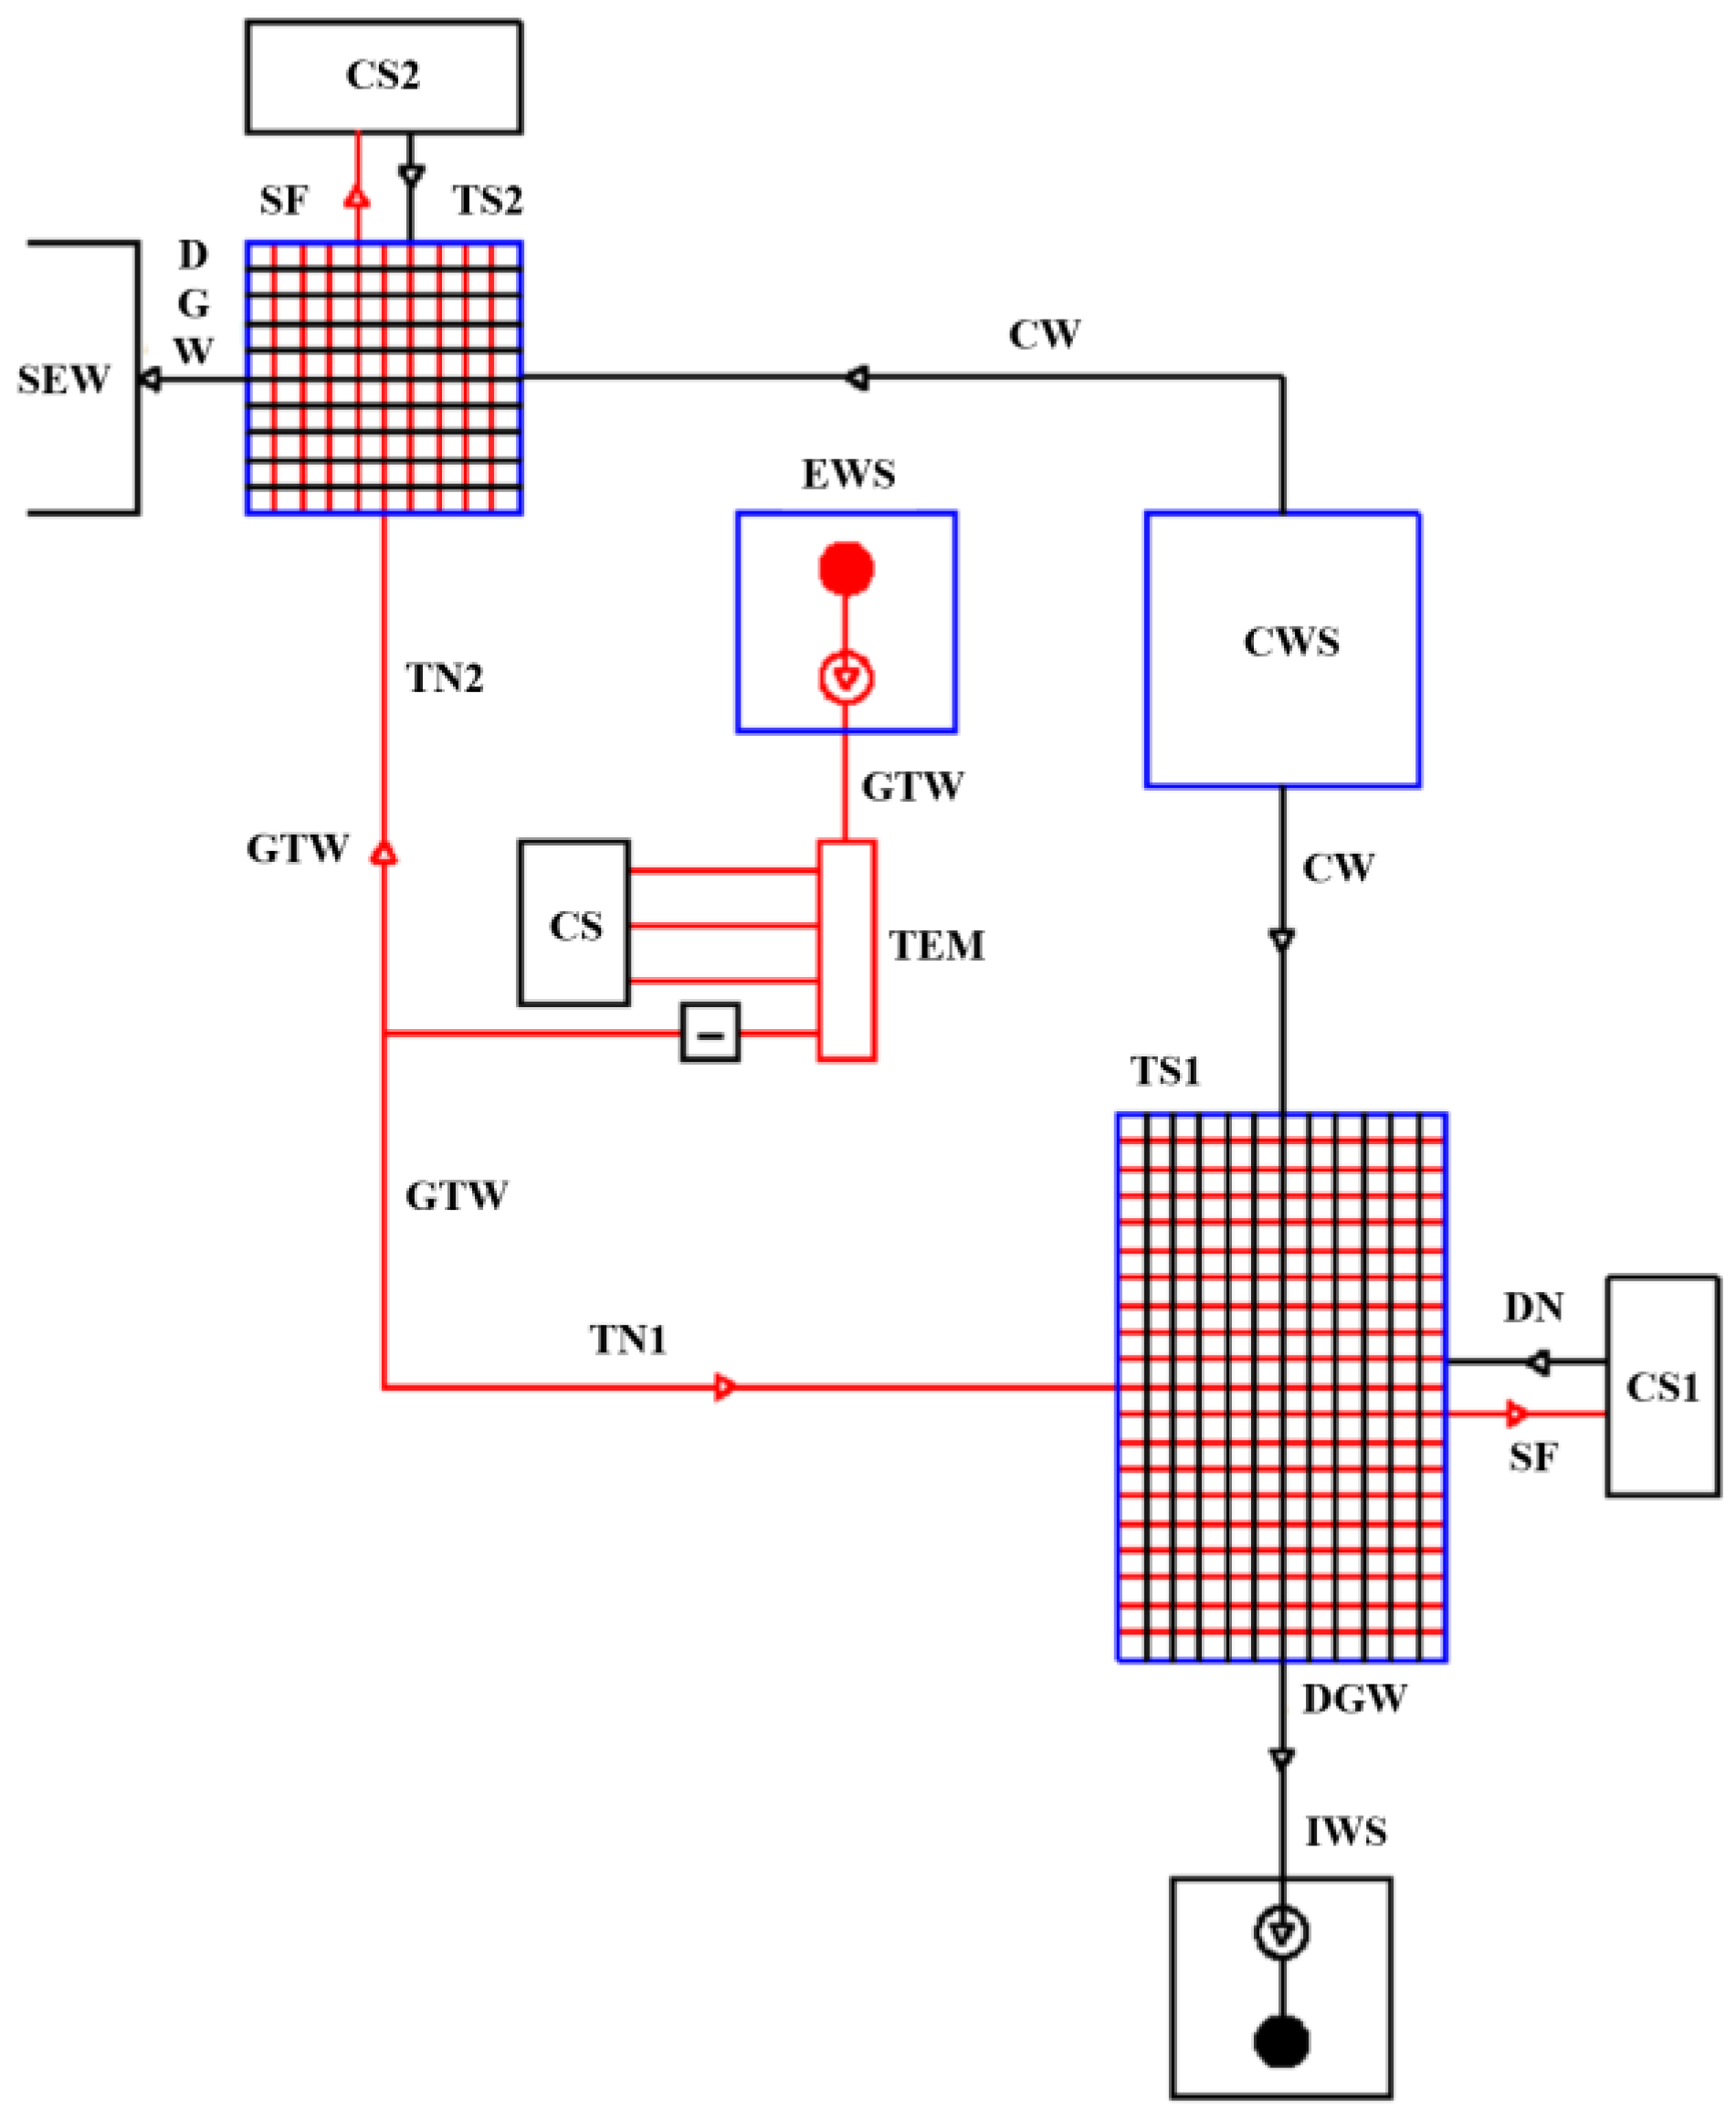
2. Description of the Analyzed System
- 1.
- Production of secondary fluid for space heating:
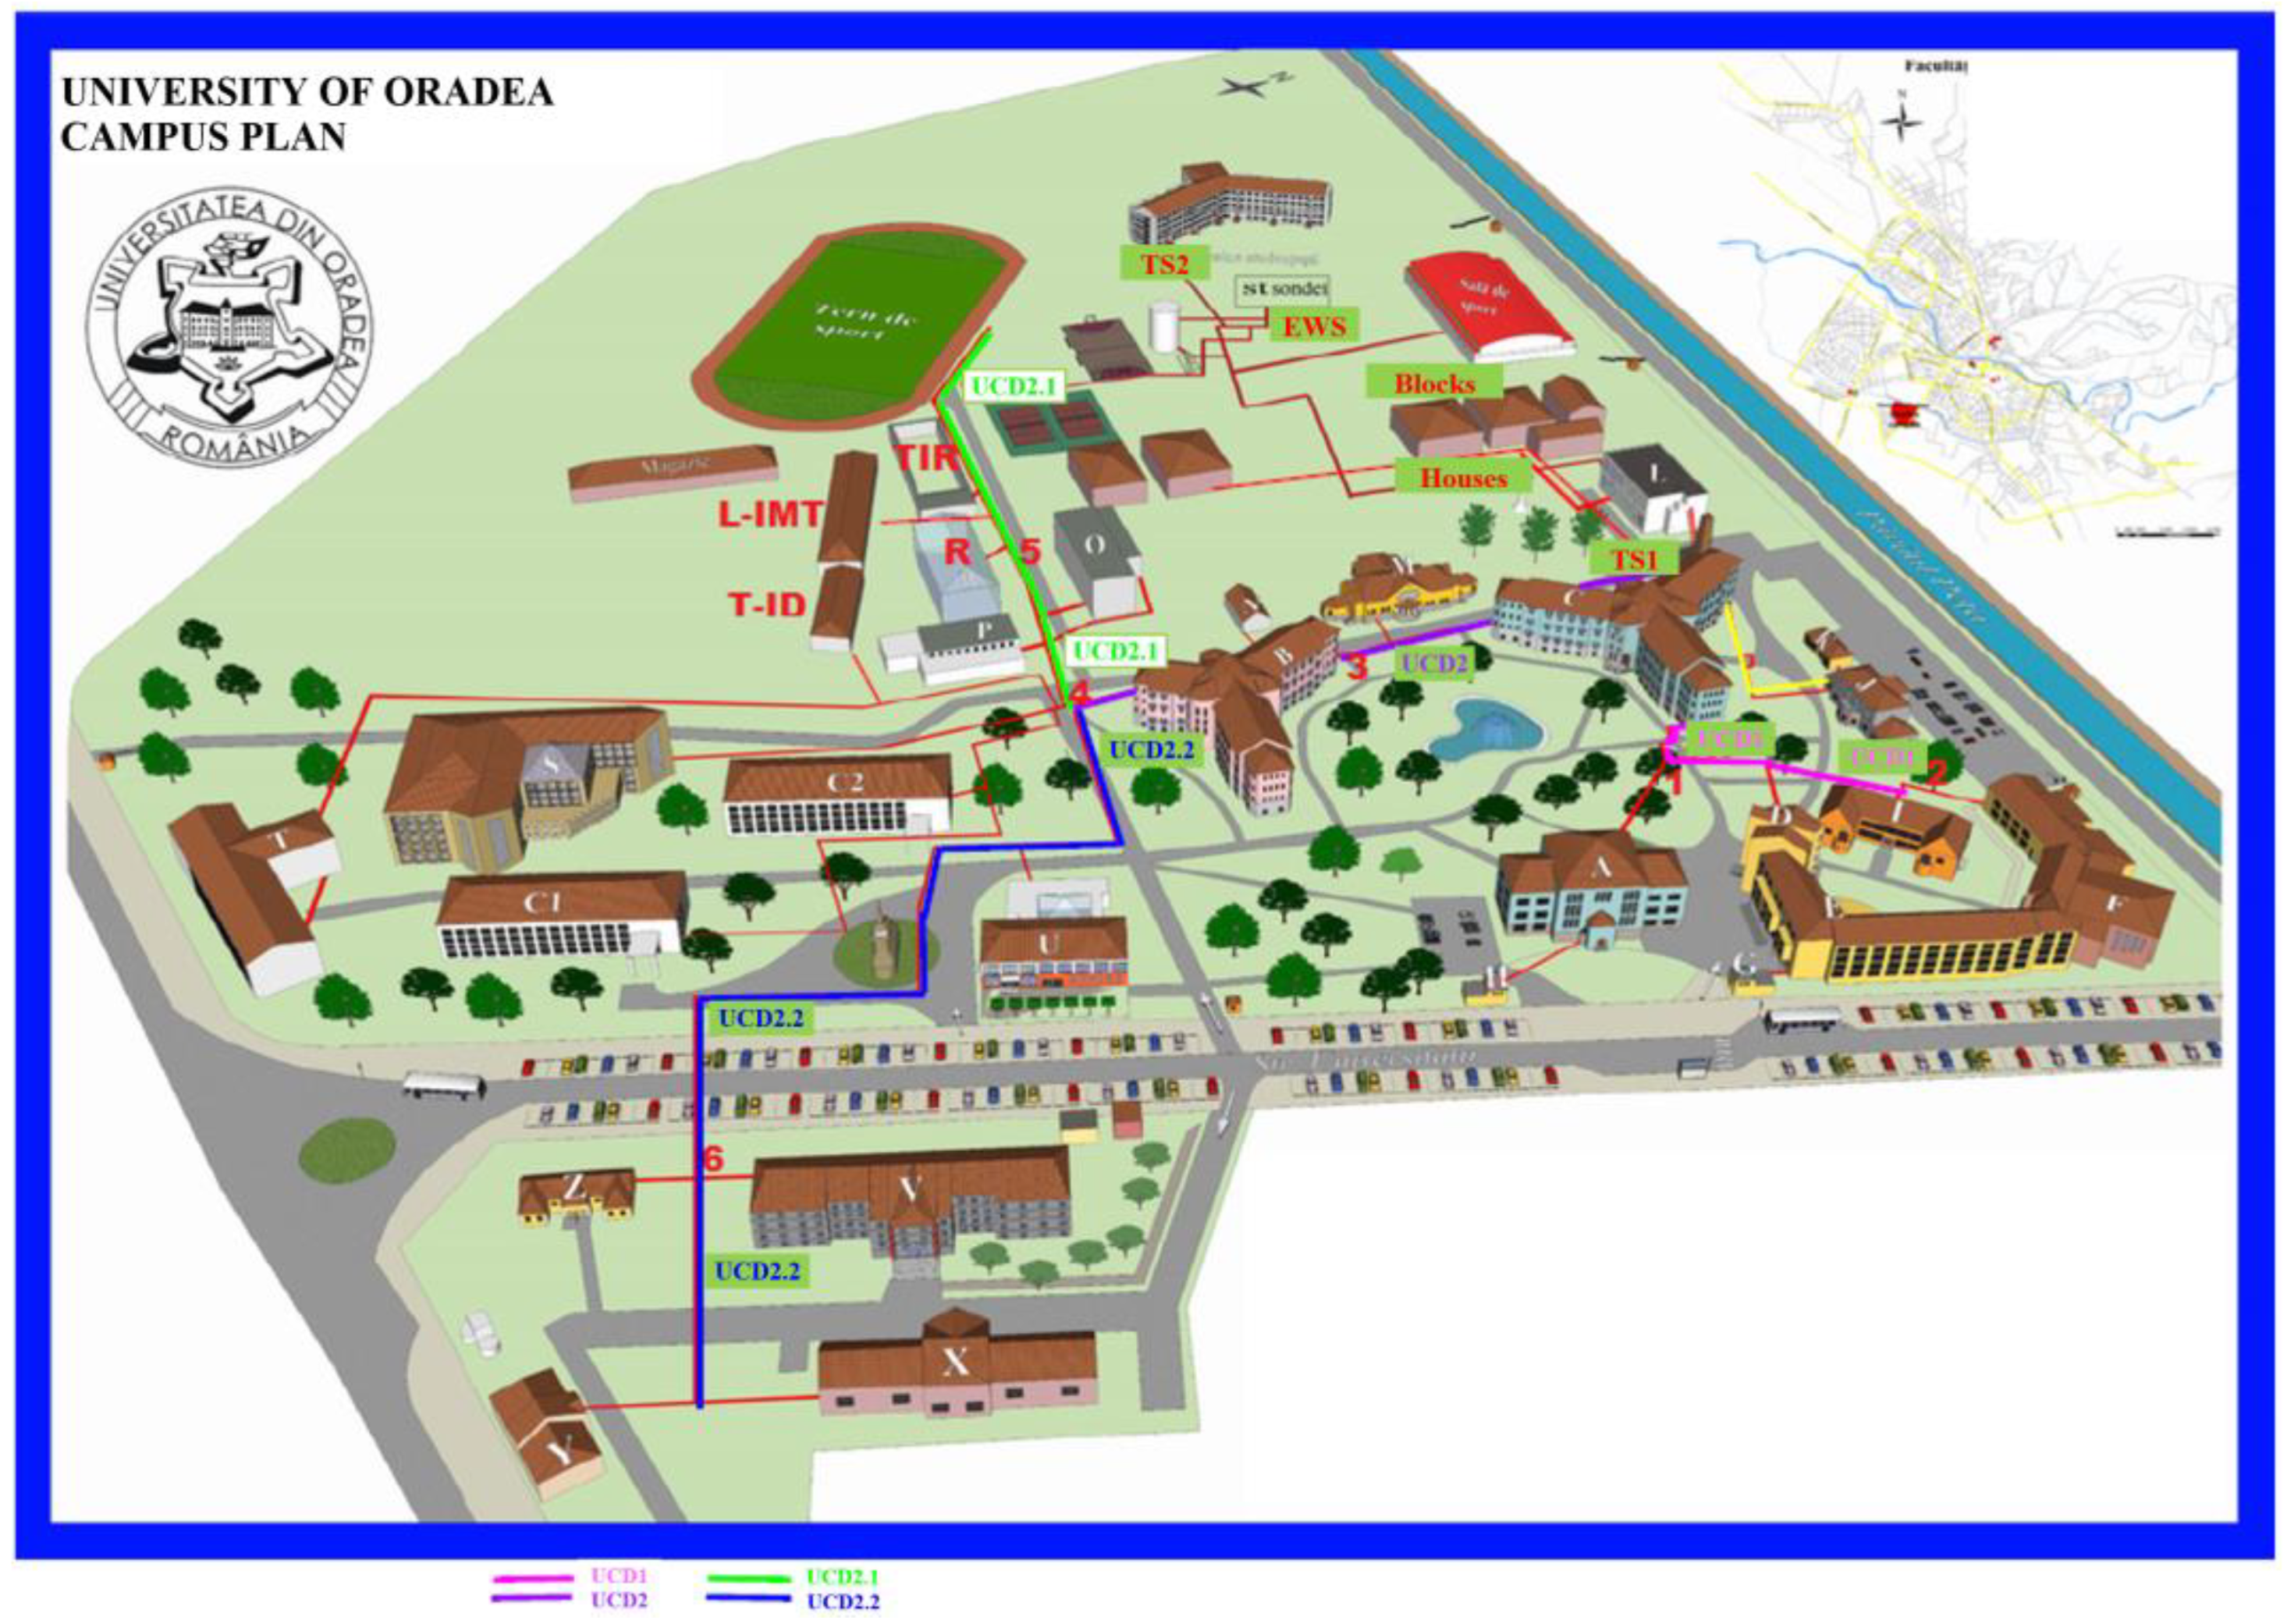
- HEx1.1 and HEx1.2 (2 × 100%)—for buildings: A, C, D, E, F, G, H, I, L, K, houses, and block of flats;
- HEx2.1 and HEx2.2 (2 × 100%)—for buildings: B, N, M, O, P, R, C1, C2, S, T, U, V, X, Y, Z, shooting room (TIR), IMT research laboratory (L-IMT), ID printing house (T-ID), sports field, and wooden church;
- HEx4—for building J (floor heating);
- HEx5.1 and HEx5.2 (2 × 100%)—for the new students’ dormitory (C3).
- 2.
- DHW production:
- HEx3—for buildings: C1, C2, O, R, L-IMT, D, E, F, S, U, L, B, C, shooting room, and locker rooms;
- HEx6.1 and HEx6.2 (2 × 100%)—for the new students’ dormitory (C3).
- Network Analyzer, Chauvin Arnoux CA 8334, that is equipped with 3 voltage measurement channels and 3 current measurement channels, capturing and recording all the parameters, transients, alarms, and waveforms simultaneously. The current sensors connected are actually transformer clamps with a round jaw shape and uniformly distributed winding that offer a high level of accuracy and a minimum phase difference. For voltage measurements, crocodile clips were used.
- Thermocamera Fluke Ti20 has a temperature range of −20 °C to +250 °C and an accuracy of ±2 °C or 2%. The spatial resolution (IFOV) is 2.5 mRad and the view field is 23° × 17°.
- Measuring devices existing in HSGWPE:
- Thermal energy meter for the geothermal water (SONTEX type), EN1434, θϵ (20 °C–200 °C), Δθ = (3–150) K and an accuracy of 2%;
- Flow meter for cold water (for DHW preparation and make-up water), SENSUS type, with a a HRI-Mei-B3 sensor reading device that provides a high-resolution pulse output with a flow direction signal, and a maximum flow rate of 25 m3/h;
- Electromagnetic flow sensors Isomag MS 5000, compact version, together with its MV 800 transducer;
- Industrial analogic manometers having a pressure range of 0 to 12 bars.
3. Calculation Methodology for Energy Efficiency Indicators
3.1. Energy Balance
- Input energy (WI)
- Useful energy (WU) is the thermal energy supplied to end-users within the UO campus and, also, to third parties, and is calculated as follows:
- Own consumption (WCPT) represents the energy needed to drive the pumps within HSGWPE, therefore:
- Energy losses (WP) are expressed as follows:
3.2. Mass Balance
- In the primary circuit (EWS-HEx), the geothermal water is circulated through the transport network pipeline and heat exchanger. Therefore, the equation is:
- In the secondary circuit (distribution network), the mass balance equation is:
3.3. Calculation of the CEB Components
3.3.1. Energy Inputs
3.3.2. Energy Losses
- Transmission network (TN) losses will be calculated as follows:
- Thermal substation (TS) losses have 2 components:
- a.
- Energy losses for the HEx—are calculated based on the heat exchanger energy balance.
- b.
- Energy losses in TS piping
- Distribution network (DN) energy losses is calculated using:
3.3.3. Useful Energy
3.3.4. Energy Performance Indicators
- HSGWPE gross energy efficiency:
- HSGWPE net energy efficiency:
- HEx efficiency:
- Pipeline temperature (heat) losses (percentage):
- Pipeline specific temperature losses:
- Specific thermal energy consumption of buildings (per area unit or volume unit):
3.3.5. Environmental Impact Assessment
- CO2 = 314.52 g/kWh;
- SO2 = 34.74 g/kWh;
- NOX = 0.64 g/kWh.
4. Survey, Measurements, and Results
4.1. Gathered Data from the UO Database
4.2. Data from Direct Measurements
4.2.1. Power Analyzer Recordings
4.2.2. Thermal Camera Measurements
4.2.3. Synthesis of Measured Data
5. Results
- CEB—current load (hourly);
- CEB—maximum load (for a winter month);
- CEB—minimum load (for a summer month);
- Annual CEB.
5.1. Hourly Complex Energy Balance
5.1.1. Details and Clarifications with Respect to the Calculated Values
- a.
- SF flow rate inside the distribution networks as well as at the entrance point to buildings were not measured because of their inaccessibility, therefore:
- SF flow rate inside the HEx was estimated based on the rated values, considering the GTW flow rate as well;
- SF flow rate inside the buildings (Di) was estimated as a share of the total flow rate (Dt) using the quasi-empirical equation:
- b.
- SF temperature was not measured directly. Temperature measurements were performed on the non-insulated surface of heating pipes placed inside the underground concrete thermal duct, on sections connected to buildings. When comparing the directly measured temperatures of GTW and SF with the measurements of the pipe temperature, a negligible deviation has been found for SF and deviations of (2–4) °C—for GTW.
- c.
- GTW flow rate
- Based on the measured data, the shares of GHW between TS1 and TS2, for a winter month, is:DGTW = DI,GS1 + DI,GS2 = 72 m3/h,So, DI,GS1 = 64.44 m3/h (89.5%), DI,GS2 = 7.56 m3/h (10.5%).
- Similarly, for a summer month: DI,GS1 = 10.5 m3/h; DI,GS2 = 2.32 m3/h;
- For TS1, the shares of SF for space heating and DHW is: DI,GS1 = 57.53 m3/h (winter) and DI,GS1 = 10.5 m3/h (summer) exclusively for DHW preparation (18.2%). Therefore, the GTW flow rate used for space heating in thermal substation TS1 is about 81.8% of the total flow rate in January 2019, representing 47.03 m3/h;
- The shares between HEx1, HEx2 and HEx4 are: 1%—for HEx4 (GWT input to this HEx is controlled); between HEx1 and HEx2—depending on their capacity: 63.2% for HEx2 and 36.8% for HEx1;
- For TS2, for the most represantative winter month—January—the share of GTW between HEx5 and HEx6 is calculated according to the above results: HEx5 (DHW): 2.32 m3/h (30.7%); HEx6 (space heating): 7.56—2.32 = 5.24 m3/h (69.3%).
- d.
- Wellhead GTW temperature in EWS (outlet pipe from EWS) is 85 °C, according to drilling 4796 documentation [21].
- e.
- Distribution network losses (sections connected to TS1) were calculated based on the average values [28], resulting in Dp,2 = 11.33—10.9 = 0.43 m3/h; Dp,2 = 10.32 m3/day (3.8%). No losses were reported for the transmission network, distribution network supplied from TS2, or inside the buildings. So, all SF losses belong to the DN and for calculations purposes, it was proportionally split between the two underground concrete thermal ducts: UCD1: 0.16 m3/h (1.4%); on UCD2: 0.27 m3/h (2.4%).
5.1.2. Enthalpy Values
5.1.3. Flow Rates
- a.
- GTW flow rate
- GTW inlet pipe to TS1: DI,GS1 = 64.44 m3/h; split between the four heat exchangers as follows: HEx1: 19.2 m3/h; HEx2: 33 m3/h; HEx3: 11.7 m3/h; HEx4: 0.54 m3/h;
- GTW inlet pipe to TS2: DI,GS2 = 7.56 m3/h; out of which HEx5: 5.24 m3/h; HEx6: 2.32 m3/h.
- b.
- SF flow rate has been calculated based on the energy balance equation for each heat exchanger and its connections using:
5.1.4. Systemic Assessment of Useful Energy
5.1.5. Real Hourly Energy Balance
- a.
- b.
- Energy losses in HEx and its connecting pipes were calculated based on their estimated efficiency:Wp,SCD = (1 − ηSCD)·WGTWHEx,
- c.
- DN energy losses were calculated using the energy balance equation and the results are shown in Table 10:WI,DN = WU + Wp,DN,
- d.
- DN input energy was calculated as a difference between the energy input and energy losses. For example, the energy input to the distribution network through HEx1 is:WI,DNHEx1 = (2.547 − 0.127)·106 kJ = 2.42·106 kJ,
5.2. Annual Energy Balance
5.3. Energy Performance Indicators (EnPI)
5.4. Environmental Impact Assessment
6. Recommended Measures to Improve Energy Efficiency
Work Assumptions
- ΔCO2 = 862 tons/year;
- ΔSO2 = 5.1 tons/year;
- ΔNOx = 2.49 tons/year.
7. Conclusions
- The average value of the indicator “specific consumption of thermal energy per square unit” (= 161 kWh/m2 year) is competitive for the current state of educational buildings in Romania, for which average values of total energy consumption (TE + EE) are recommended [23,24,25] in the range [200–296] kWh/m2·yr;
- A large dispersion of the energy efficiency of buildings can be observed, values in the range: = [39 ÷ 364] kWh/m2·year for thermal energy only. The buildings having higher values than the national average (248 kWh/m2·year) are: C3, Y, P, R, Z, and S;
- Most of the buildings included in this study have a higher value of than the maximum recommended for nZEB public buildings [34], but some of the buildings included in the national statistics are equipped with complex systems: heating, ventilation, and air conditioning.
Author Contributions
Funding
Institutional Review Board Statement
Informed Consent Statement
Data Availability Statement
Conflicts of Interest
Abbreviations
| CEB | complex energy balance |
| CS | thermal energy consumer |
| CW | cold water |
| CWS | cold water source |
| DGW | depleted geothermal water |
| DHW | domestic hot water |
| DN | distribution network |
| EE | electrical energy |
| EWS | extraction well station |
| GHG | greenhouse gases |
| GWT | geothermal water |
| HEx | heat exchanger |
| HSGWPE | heating system with geothermal water as primary energy |
| IWS | injection well station |
| PPR | polypropylene |
| SEW | sewer |
| SF | secondary fluid |
| TE | thermal energy |
| TN | transmission network |
| TS | thermal station |
| UCD | underground concrete duct |
| UO | University of Oradea |
Appendix A

| DN Section | Building | ||||||
|---|---|---|---|---|---|---|---|
| From | To | Length [m] | Diameter [inch] | Pipe and Insulation Material | Code | Area Sd [×103 m2] | Volume [×103 m3] |
| TS1/HEx1 | C | 25 | 4 | St/MW | C | 4.3 | 16.13 |
| TS1/HEx1 | L | 25 | 4 | St/MW | IT | 1.31 | 4.22 |
| TS1/HEx1 | UCD1 | 80 | 8 | steel/no insulation | - | - | - |
| UCD1 | A | 55 | 3 | St/MW | A | 2.13 | 8.3 |
| UCD1 | D + E | 38 | 4 | St/MW | D + E | 4.7 | 21.9 |
| UCD1 | F | 21 | 3 | St/MW | F | 1.77 | 8.04 |
| UCD1 | I | 2 | 2 | steel/no insulation | I | 0.73 | 2.65 |
| A | H | 4 | 1.5 | steel/no insulation | H | 0.061 | 0.15 |
| E | G | 4 | 1.5 | St/MW | G | 0.053 | 0.11 |
| TS1/HEx2 | UCD2 | 180 | 8 | St/MW | - | - | - |
| UCD2.1 | UCD2.1 | 110 | 1.5 | steel/no insulation | - | - | - |
| UCD2.2 | UCD2.2 | 285 | 4 | steel/no insulation | - | - | - |
| UCD2 | B | 7 | 4 | steel/no insulation | B | 3.52 | 13.04 |
| UCD2 | M | 9 | 1.5 | steel/no insulation | M | 0.96 | 3.1 |
| UCD2 | N | 10 | 1.5 | St/MW | N | 0.11 | 0.41 |
| UCD2.1 | A | 13 | 2 | steel/no insulation | A | 0.86 | 3.29 |
| UCD2.1 | P | 5 | 2 | steel/no insulation | P | 0.74 | 4.46 |
| UCD2.1 | R | 7 | 2 | St/MW | R | 0.15 | 0.42 |
| UCD2.1 | Shooting room | 2 | 1.5 | steel/no insulation | Shooting room | 0.12 | 0.37 |
| UCD2.1 | Sports field | 57 | 1.25 | PPR | Sports field | 0.04 | 0.04 |
| UCD2.1 | L-IMT | 38 | 1.5 | St/PI | L-IMT | 0.59 | 2.01 |
| UCD2.1 | T-ID | 37 | 2 | PPR | T-ID | 0.27 | 0.78 |
| UCD2 | T | 239 | 3 | St/PI | T | 2.73 | 9.69 |
| UCD2 | S | 95 | 8 | St/PI | S | 5.87 | 31.6 |
| UCD2 | C2 | 55 | 4 | St/MW | C2 | 3.88 | 10.11 |
| UCD2-C2 | C1 | 151 | 4 | St/MW | C1 | 3.88 | 10.11 |
| UCD2.2 | U | 12 | 4 | St/MW | U | 1.04 | 3.77 |
| UCD2.2 | V | 9 | 2 | St/PI | V | 2.87 | 9.98 |
| UCD2.2 | X | 18 | 2 | St/PI | X | 0.67 | 2.54 |
| UCD2.2 | Y | 24 | 2 | St/PI | Y | 0.23 | 0.68 |
| UCD2.2 | Z | 16 | 2 | St/PI | Z | 0.39 | 1.48 |
| C1 | Wooden church | 106 | 1.5 | St/MW | Wooden church | 0.05 | 0.18 |
| TS1/HEx4 | J | 65 | 2 | PPR | J | 0.54 | 1.92 |
| TS1/HEx1 | K | 64 | 2 | PPR | K | 0.10 | 0.39 |
| TS2/HEx5 | C3 | 4 | 3 | PPR | C3 | 2.68 | 7.22 |
| TS1/HEx1 | C | 25 | 4 | St/MW | C | 4.3 | 16.13 |
| Measurement Point | Temperature [°C] | Measurement Point | Temperature [°C] |
|---|---|---|---|
| GTW inlet pipe, HEx1 | 81.1 | i/o pipe/ambient building R | 49.2/44.3/17.1 |
| GTW inlet pipe, HEx2 | 81.5 | i/o pipe/ambient shooting room | 49.2/44.3/17 |
| GTW inlet pipe, HEx3 | 80.4 | i/o pipe/ambient L-IMT | 45.2/35/25.2 |
| GTW outlet pipe, HEx4 | 44.7 | i/o pipe/ambient T-ID | 48.6/36.2/20.6 |
| GTW outlet pipe, HEx2 | 47.2 | i/o pipe/ambient building T | 45.2/35.2/23.7 |
| SF supply pipe from HEx1 | 56.7 | i/o pipe/ambient building S | 49.2/34/21 |
| SF supply pipe from HEx2 | 57.2 | i/o pipe/ambient building C1 | 49.4/45/26.7 |
| SF return pipe from DN, to HEx1 | 39.7 | i/o pipe/ambient building C2 | 49.5/43/26.1 |
| SF return pipe from DN to HEx2 | 41.1 | i/o pipe/ambient building U | 47.7/33.8/20 |
| GTW outlet pipe, HEx3 | 40.1 | i/o pipe/ambient building V | 49.7/41.1/24 |
| CW inlet pipe in HEx3 | 12.4 | i/o pipe/ambient building X | 51.1/43.8/22.7 |
| DHW supply pipe from HEx3 | 43.2 | i/o pipe/ambient building Y | 46.9/34.4/21.6 |
| i/o pipe/ambient building C | 57/46.6/25.6 | i/o pipe/ambient building Z | 49.2/40.7/22.8 |
| i/o pipe/ambient building J | 36.6/26.6/20 | i/o pipe/ambient building C3 | 46/41/25 |
| i/o pipe/ambient building K | 55.9/50.6/22 | i/o pipe/ambient block of flats | 47.7/42.8/25 |
| i/o pipe/ambient building I | 53.5/39.2/27 | i/o pipe/ambient private houses | 47.7/42. /25 |
| i/o pipe/ambient buildings D + E | 56.1/42.2/23 | i/o pipe/ambient building M | 47.5/40/19.2 |
| i/o pipe/ambient building F | 53.4/40.6/25.8 | i/o pipe/ambient building L | 50.4/37.9/25 |
| i/o pipe/ambient building A | 55.6/42.9/24.7 | GTW pipeline at EWS | 80.8 |
| i/o pipe/ambient building B | 50.1/44.2/25.1 | GTW, HEx5 and HEx6 i/o pipe | 81/44.1 |
| i/o pipe/ambient building N | 47.2/42.5/17.5 | DHW supply pipe from HEx6 | 40.1 |
| i/o pipe/ambient building O | 49.7/45.2/23.3 | DHW inlet pipe in (C1 + C2) | 35.6 |
| i/o pipe/ambient building P | 49.2/40.5/23 | SF supply pipeline from HEx5/ inlet pipe to C3/ambient C3 | 50/41/25 |
References
- Gupta, P.; Anand, S.; Gupta, H. Developing a roadmap to overcome barriers to energy efficiency in buildings using best worst method. Sustain. Cities Soc. 2017, 31, 244–259. [Google Scholar] [CrossRef]
- World Energy Balances-Analysis, IEA. Available online: https://www.iea.org/reports/world-energy-balances-overview (accessed on 15 January 2022).
- Report of World Watch Institute. Available online: https://www.worldwatchinstitute.org (accessed on 15 January 2022).
- Mahdi, A.M.J. Energy Audit a step to effective Energy Management. Int. J. Trend Res. Dev. 2018, 5, 521–525. [Google Scholar]
- ISO 50001:2011; Energy Management Systems. Available online: https://www.iso.org/obp/ui/#iso:std:iso:50001:ed-1:v1:en (accessed on 15 January 2022).
- ISO 50006:2014; Energy Management Systems—Measuring Energy Performance Using Energy Baselines (EnB) and Energy Performance Indicators (EnPI). Available online: https://www.iso.org/obp/ui/#iso:std:iso:50006:ed-1:v1:en (accessed on 15 January 2022).
- Batlle, E.A.O.; Palacio, J.C.E.; Lora, E.E.S.; Reyes, A.M.M.; Moreno, M.M.; Morejón, M.B. A methodology to estimate baseline energy use and quantify savings in electrical energy consumption in higher education institution buildings: Case study, Federal University of Itajubá (UNIFEI). J. Clean. Prod. 2020, 244, 118551. [Google Scholar] [CrossRef]
- Chaichan, M.T.; Kazem, H.A. Energy conservation and management for houses and building in Oman—Case study. Saudi J. Eng. Technol. 2016, 1, 69–76. [Google Scholar]
- Shcherbak, V. Using the university’s energy efficiency knowledge hub for energy renovation and energy modernization of university buildings. J. Manag. 2021, 34, 35–44. [Google Scholar] [CrossRef]
- Gryshchenko, I. Implementing best practices for improving energy efficiency in universities. J. Manag. 2021, 34, 9–17. [Google Scholar] [CrossRef]
- Shafie, S.M.; Nu’man, A.H.; Yusuf, N.N.A.N. Strategy in Energy Efficiency Management: University Campus. Int. J. Energy Econ. Policy 2021, 11, 310–313. [Google Scholar] [CrossRef]
- Ruviaro, A.; Sperandio, M.; Ebert, P.; Boaski, M.A.F.; Mallmann, J.F. Energy Efficiency Studies in a Brazilian University Campus. In Proceedings of the IEEE PES Transmission & Distribution Conference and Exhibition—Latin America (T & D-LA), Lima, Peru, 18–21 September 2018. [Google Scholar]
- Koçalioğlu, H.L.; Onat, A. University campus building energy modeling: A case study. In Proceedings of the 6th International Conference on Advances in Mechanical Engineering, Istanbul, Turkey, 20–22 October 2021; pp. 215–221. [Google Scholar]
- Nizamutdinova, Z.F.; Krivchikov, N.E. Architecture of the University campus in terms of maximum energy efficiency. IOP Conf. Ser. Mater. Sci. Eng. 2020, 880, 012068. [Google Scholar] [CrossRef]
- Guan, J.; Nord, N.; Chen, S. Energy planning of university campus building complex: Energy usage and coincidental analysis of individual buildings with a case study. J. Energy Build. 2016, 124, 99–111. [Google Scholar] [CrossRef] [Green Version]
- Shcherbak, V.; Ganushchak-Yefimenko, L.; Nifatova, O.; Dudko, P.; Savchuk, N.; Solonenchuk, I. Application of international energy efficiency standards for energy auditing in a university buildings. Glob. J. Environ. Sci. Manag. 2019, 5, 501–514. [Google Scholar] [CrossRef]
- Felea, I.; Blaga, A.; Felea, A. Energy audit report on the geothermal heat supply system at University of Oradea. 2020. Available online: www.epsystems.ro (accessed on 24 February 2022).
- Kamila, Z.; Kaya, E.; Zarrouk, S.J. Reinjection in geothermal fields: An updated worldwide review 2020. Geotherm. J. 2021, 89, 101970. [Google Scholar] [CrossRef]
- Gavriliuc, R.; Roșca, M.; Bendea, C. Geothermal Energy in Romania—Country Update 2015–2019. In Proceedings of the World Geothermal Congress 2020, Den Haag, The Netherlands, 11–14 June 2019. [Google Scholar]
- Utilization of Geothermal Energy by Producing Thermal Heating Agent for PT902 Consumers and Reinjection. Available online: www.oradea.ro (accessed on 1 March 2022).
- Drilling Report for 4796 Well at University of Oradea, National Center for Geothermal Research. Available online: www.uoradea.ro (accessed on 1 March 2022).
- Guidelines for Performing and Analyzing Energy Balances, Romanian Agency for Energy Conservation Decision No. 56/2003. Available online: https://lege5.ro/Gratuit/hezdgnrx/principii-generale-de-elaborare-si-analiza-a-bilanturilor-energetice-anexa?dp=gi2dcmjtga3da (accessed on 21 February 2022).
- Cleveland, C. Encyclopedia of Energy; Academic Press: Oxford, UK, 2004; Volume 1–6. [Google Scholar]
- Carabulea, A.; Carabogdan, G. Real and optimal energy models and balances, R.S.R.; Academy Publishing House: Bucharest, Romania, 1986. [Google Scholar]
- Carabogdan, G. Energy Balances. Problems and Applications for Engineers; “Tehnica” Publishing House: Bucharest, Romania, 1986. [Google Scholar]
- Calantzis, F.; Revoltella, D. Do energy audits help SMEs to realize energy-efficiency opportunities ? Energy Econ. 2019, 83, 229–239. [Google Scholar] [CrossRef]
- Badiola, M.; Basurko, O.C.; Gabina, G. Integration of energy audits in the Life Cycle Assessment methodology to improve the environmental performance assessment of Recirculating Aquaculture Systems. J. Clean. Prod. 2017, 157, 155–166. [Google Scholar] [CrossRef]
- Felea, I.; Crenci, E.; Szabo, E. Analysis of Energy Performance of a Cogeneration Source. J. Sustain. Energy 2019, 10, 49–59. [Google Scholar]
- Răducanu, C.; Patrascu, R. Thermal Energy Balances; University “Politecnica”Bucharest Print House: Bucharest, Romania, 2004. [Google Scholar]
- Popa, I.; Popa, T. Thermotechnical Tables; IDOC: Bucharest, Romania, 1986. [Google Scholar]
- ANRE, 2019, Report on the Results of the Electricity Market Monitoring. Available online: www.anre.ro (accessed on 21 February 2022).
- Pleșa, A. Utilaje Termice—Schimbătoare de Căldură Cu Plăci; Mediamira Publishing House: Cluj Napoca, Romania, 2008; Volume I. [Google Scholar]
- Guidelines for Performing Energy Audits, the National Authority for Energy Regulation Decision No. 21232014. Available online: https://www.anre.ro/ro/eficienta-energetica/legislatie/legislatie-efic-en (accessed on 21 February 2022).
- EU Recommendation 2016/1318 on nZEB Buildings. Available online: www.europa.eu (accessed on 21 February 2022).
- Norm for Design, Execution and Operation of Central Heating Installations, I13/2015; MatrixRom Publishing House: Bucharest, Romania, 2016.
- Dinu, C. Thermal Energy Distribution; University of Craiova Publishing House: Craiova, Romania, 2014. [Google Scholar]


| Data | HEx1.1 HEx1.2 | HEx2.1 HEx2.2 | HEx3 | HEx4 | HEx5.1 HEx5.2 | HEx6.1 | HEx6.2 |
|---|---|---|---|---|---|---|---|
| Rated capacity [kW] | 2400 | 1400 | 580 | 500 | 580 | 227 | 96 |
| Primary flowrate [m3/h] | 63.27 | 37.23 | 16 | 10 | 15.7 | 6 | 2.1 |
| Secondary flowrate [m3/h] | 175.09 | 121.94 | 25 | 16 | 25.3 | 7 | 7 |
| Transfer area [m2] | 69.92 | 40.8 | 17 | 14.6 | 13.6 | 4.95 | 4.35 |
| Year | GTW Consumption [m3] | Price [Euro/m3] |
|---|---|---|
| 2018 | 272,602 | 0.76 |
| 2019 | 259,805 | 0.77 |
| Date | θIGS1 [°C] | θEGS1 [°C] | DIGS1 [m3/h] | θISF1 [°C] | θESF1 [°C] | DSF [m3/h] |
|---|---|---|---|---|---|---|
| 01 | 84.2 | 45.6 | 50.4 | 47 | 39 | 9.7 |
| 02 | 84.2 | 45.6 | 50.4 | 47 | 39 | 9.7 |
| 03 | 84.2 | 45.6 | 50.4 | 47 | 39 | 9.7 |
| 04 | 84.2 | 45.6 | 50.4 | 47 | 39 | 9.7 |
| 05 | 84.2 | 45.6 | 50.4 | 47 | 39 | 9.7 |
| 06 | 84.2 | 45.6 | 50.4 | 47 | 39 | 9.7 |
| 07 | 84.4 | 45.6 | 50.4 | 47 | 39 | 9.7 |
| 08 | 84.4 | 46.6 | 52.2 | 46 | 39 | 11.96 |
| 09 | 84.5 | 46.6 | 59.4 | 52 | 43 | 12.3 |
| 10 | 84.3 | 47.5 | 55.8 | 50 | 40 | 12.3 |
| 11 | 84.8 | 49.8 | 64.8 | 50 | 42 | 12.2 |
| 12 | 84.7 | 53.3 | 73.8 | 51 | 44 | 11.8 |
| 13 | 84.7 | 53.3 | 73.8 | 51 | 44 | 11.8 |
| 14 | 84.7 | 53.3 | 73.8 | 51 | 44 | 11.8 |
| 15 | 84.7 | 51.6 | 68.4 | 51 | 44 | 12.2 |
| 16 | 84.6 | 51.1 | 66.6 | 51 | 44 | 12.2 |
| 17 | 84.4 | 49.4 | 61.2 | 51 | 42 | 12.1 |
| 18 | 84.3 | 49.3 | 59.4 | 51 | 43 | 12 |
| 19 | 84.5 | 51.4 | 63 | 51 | 42 | 11.6 |
| 20 | 84.5 | 51.4 | 63 | 51 | 42 | 11.6 |
| 21 | 84.5 | 51.4 | 63 | 51 | 42 | 11.6 |
| 22 | 84.5 | 50.7 | 63 | 51 | 43 | 12 |
| 23 | 84.6 | 52.4 | 68.4 | 52 | 43 | 12 |
| 24 | 84.7 | 53 | 72 | 52 | 44 | 11.9 |
| 25 | 84.7 | 53 | 72 | 52 | 44 | 11.9 |
| 26 | 84.5 | 51.2 | 63 | 50 | 42 | 11.6 |
| 27 | 84.5 | 51.2 | 63 | 50 | 42 | 11.6 |
| 28 | 84.5 | 51.2 | 63 | 50 | 42 | 11.6 |
| 29 | 84.4 | 51.6 | 63 | 50 | 42 | 11.9 |
| 30 | 84.3 | 49.7 | 55.8 | 49 | 40 | 11.9 |
| 31 | 84.3 | 49 | 57.6 | 50 | 42 | 12 |
| Average value | 84.5 | 49.6 | 57.53 | 49.8 | 41.7 | 11.33 |
| Date | θIGS1 [°C] | θEGS1 [°C] | DIGS1 [m3/h] | DSF [m3/h] |
|---|---|---|---|---|
| 01 | 76.8 | 41.8 | 10.8 | 9.9 |
| 02 | 77.1 | 42.4 | 9 | 10.1 |
| 03 | 76.9 | 42 | 10.8 | 10.4 |
| 04 | 77 | 43.3 | 10.8 | 10 |
| 05 | 76.9 | 42.4 | 9 | 10 |
| 06 | 76.9 | 46.9 | 10.8 | 9.96 |
| 07 | 76.9 | 46.9 | 10.8 | 9.96 |
| 08 | 76.9 | 46.9 | 10.8 | 9.96 |
| 09 | 76.5 | 44.5 | 10.8 | 10.2 |
| 10 | 76.7 | 42.2 | 9 | 11.1 |
| 11 | 76.7 | 41.9 | 9 | 10.2 |
| 12 | 76.7 | 43.1 | 10.8 | 10.3 |
| 13 | 77 | 44.3 | 12.6 | 10.3 |
| 14 | 77 | 44.3 | 12.6 | 10.3 |
| 15 | 77 | 44.3 | 12.6 | 10.3 |
| 16 | 77 | 42.7 | 10.8 | 10.7 |
| 17 | 76.9 | 42.8 | 10.8 | 10.7 |
| 18 | 76.9 | 42.3 | 10.8 | 10.7 |
| 19 | 77 | 42.4 | 10.8 | 10.8 |
| 20 | 76.9 | 43.3 | 10.8 | 10.6 |
| 21 | 76.9 | 43.3 | 10.8 | 10.6 |
| 22 | 76.9 | 43.3 | 10.8 | 10.6 |
| 23 | 77 | 42.9 | 10.8 | 10.96 |
| 24 | 77.1 | 42.7 | 10.8 | 10.92 |
| 25 | 77 | 41 | 9 | 8.92 |
| 26 | 77.1 | 42.5 | 9 | 11.13 |
| 27 | 77.4 | 43.9 | 10.8 | 10.94 |
| 28 | 77.4 | 43.9 | 10.8 | 10.94 |
| 29 | 77.4 | 43.9 | 10.8 | 10.94 |
| 30 | 77.4 | 44.3 | 12.6 | 11.12 |
| 31 | 77.3 | 44.8 | 10.8 | 11.2 |
| Average value | 77 | 43.5 | 10.5 | 10.9 |
| Name/Symbol | MU | Value |
|---|---|---|
| Well head GTW flow rate [DGTW] | m3/h | 72 |
| GTW flow rate at TS1 inlet [DIGS1] | m3/h | 64.44 |
| GTW temperature at TS1 inlet [θIGS1] | °C | 84 |
| Themally depleated GTW outlet temperature [θEGS1 ≡ θE,HEx] | °C | 52 |
| CW flow rate at TS1 inlet [DAI1] | m3/h | 13.35 |
| CW temperature at TS1 inlet [θAI1] | °C | 12.4 |
| GTW pressure at TS1 inlet [PIGS1] | bar | 3 |
| SF temperature on the heating circuits connected to TS1 | ||
| DN supply pipe [θI,SF1] | °C | 54 |
| DN return pipe [θE,SF1] | °C | 42 |
| SF pressure on the heating circuits connected to TS1 | ||
| DN supply pipe, after HEx [PI,SF1] | bar | 3.2 |
| DN return pipe, before HEx [PE,SF1] | bar | 3.6 |
| Outdoor temperature (ambient) [θa] | °C | 1.5 |
| Energy Carrier Fluid/Measurement Point/Calculation Area | i [kJ/kg] | Δi [kJ/kg] | Measurement Point/ Calculation Area | i [kJ/kg] | Δi [kJ/kg] |
|---|---|---|---|---|---|
| GTW—well head | 356.83 | - | SF return to HEx2 | 171.6 | |
| GTW—TS1 inlet | 352.63 | - | SF in UCD2 and CS1.2 | 67.5 | |
| GTW—TS2 inlet | 352.63 | - | GTW—HEx3 output | 167.4 | |
| GTW on TN1 | - | 4.2 | GTW—HEx4 output | 187.9 | |
| GTW on TN2 | - | 21.31 | CW—HEx3-inlet pipe | 52 | |
| GTW—TS1 outlet (HEx1 + HEx2) | 217.26 | DHW—supply line from HEx3 | 180.4 | ||
| GTW—TS2 outlet | 179.53 | DHW—end-user inlet (C1 + C2) | 148.6 | ||
| GTW on TS1—(HEx1 + HEx2) | 135.37 | GTW on HEx3 | 185.23 | ||
| GTW on TS2 | 173.1 | GTW on HEx4 | 164.73 | ||
| SF supply from HEx1 | 234 | DHW on HEx3 | 128.4 | ||
| SF return to HEx1 | 165.7 | DHW at end users C1 + C2, temp. range 25–35.6 °C | 44.23 | ||
| SF in UCD1 and CS1.1 | 68.3 | DHW at end user C3, | 63 | ||
| SF—supply from HEx2 | 239.1 | temp. range 25–40.1 °C |
| Heat Exchanger | SF Flow Rate [m3/h] |
|---|---|
| HEx2 | 62.36 |
| HEx3 | 15.87 |
| HEx4 | 0.64 |
| HEx5 | 14 |
| HEx6 | 3.7 |
| Building | D [m3/h] | Δi [kJ/kg] | Wu [106 kJ] |
|---|---|---|---|
| C | 12 | 43.6 | 0.523 |
| J | 0.64 | 41.7 | 0.026 |
| K | 0.5 | 22.1 | 0.011 |
| I | 1.04 | 60.6 | 0.06 |
| (D + E + G) | 5.12 | 54.7 | 0.277 |
| F | 2 | 56 | 0.11 |
| (A + H) | 2.67 | 53 | 0.14 |
| B | 13.06 | 24.6 | 0.315 |
| M | 2.02 | 31.3 | 0.062 |
| N | 0.59 | 19.6 | 0.011 |
| O | 1.54 | 18.8 | 0.029 |
| P | 3.78 | 36.3 | 0.136 |
| R | 1.24 | 20.5 | 0.025 |
| Shooting room | 0.42 | 20.5 | 0.008 |
| Sports field | 0.048 | 20.5 | 0.001 |
| L-IMT | 0.3 | 42.6 | 0.013 |
| T-ID | 0.3 | 51.8 | 0.015 |
| T | 4.74 | 41.7 | 0.155 |
| S | 13.06 | 63.4 | 0.813 |
| C2 | 5.33 | 27.3 | 0.142 |
| C1 | 4.45 | 18.4 | 0.081 |
| U | 2.96 | 58 | 0.17 |
| V | 3.55 | 35.5 | 0.126 |
| X | 1.54 | 30.5 | 0.047 |
| Y | 0.81 | 52.2 | 0.043 |
| Z | 1.15 | 35.5 | 0.043 |
| L | 3.77 | 52.3 | 0.156 |
| Total SF for space heating—HEx1 | 1.277 | ||
| Total SF for space heating—HEx2 | 2.235 | ||
| Total SF for space heating—HEx4 | 0.026 | ||
| (C1 + C2)/DHW (HEx3) | 15.87 | 97 | 1.532 |
| Total TS1 | 5.07 | ||
| C3/SF for space heating | 14 | 37.6 | 0.521 |
| C3/DHW | 3.7 | 63 | 0.23 |
| Total TS2 | 0.751 | ||
| Total TS1 + TS2 | 5.821 |
| Name/Equipment | Symbol | MU | Value |
|---|---|---|---|
| Total GTW energy input in TS1 of which: | WGTW1 | GJ | 9.136 |
| HEx1 + HEx2 | WGTW1,2 | GJ | 6.925 |
| HEx3 | WGTWHEx3 | GJ | 2.124 |
| HEx4 | WGTWHEx4 | GJ | 0.087 |
| GTW energy input in TS2 | WGTW2 | GJ | 1.282 |
| Electricity | WEE | kWh | 43.47 |
| EWS | WEEEWS | kWh | 11.65 |
| TS1 | WEETS1 | kWh | 31.82 |
| Total TN energy losses of which: | Wp,TN | GJ | 0.324 |
| Between EWS and TS1 (TN1) | Wp,TN1 | GJ | 0.265 |
| Between EWS and TS2 (TN2) | Wp,TN2 | GJ | 0.059 |
| DN Thermal Energy Component | Symbol | MU | Value |
|---|---|---|---|
| DN-SF from TS1-HEx1, to CS1.1 | Wp,DN1.1 | 106 kJ | 1.143 |
| DN-SF from TS1-HEx2, to CS1.2 | Wp,DN1.2 | 106 kJ | 1.924 |
| DN-SF section from TS1-HEx4, to building J | Wp,DNJ | 106 kJ | 0.0175 |
| DN-DHW from TS1-HEx3, to CS1.2 | Wp,DN DHW1 | 106 kJ | 0.486 |
| DN-SF from TS2 to C3 | Wp,DNC3 | 106 kJ | 0.083 |
| Name/Equipment | Symbol | Value | |
|---|---|---|---|
| 106 kJ | % | ||
| 1. Energy input | WI | 10.898 | 100 |
| 1.1. GTW | WGTW | 10.742 | 98.57 |
| 1.2. EE | WEE | 0.156 | 1.43 |
| 2. Energy output | WE | 10.898 | 100 |
| 2.1. Useful energy | WU | 5.821 | 53.41 |
| a. From TS1 | WU,TS1 | 5.07 | 46.5 |
| b. From TS2 | WU,TS2 | 0.751 | 6.9 |
| 2.2. Energy losses | Wp | 4.921 | 45.16 |
| a. TN | Wp,TN | 0.324 | 2.97 |
| b. TS (HEx and connecting pipes) | Wp,TS | 0.9435 | 8.66 |
| c. DN | Wp,DN | 3.6535 | 33.53 |
| 3. Own energy consumption | WCPT | 0.156 | 1.43 |
| Load Level | Energy [×106 kJ] | |||||||||
|---|---|---|---|---|---|---|---|---|---|---|
| WI | WGTW | WEE = WCPT | WU | WU,SH | WU,DHW | Wp | Wp,TN | Wp,TS | Wp,DN | |
| Max. (December) | 6025.8 | 5935 | 90.8 | 3186.54 | 2355.6 | 830.9424 | 2748.5 | 188.2 | 548.1 | 2012.1 |
| Min. (June) | 1131.3 | 1114.2 | 17.644 | 804.2 | - | 804.2 | 310 | 35.1 | 102.9 | 171.9 |
| Average (year 2019) | 37412.9 | 36850.2 | 562.7 | 21004.1 | 14646.1 | 6358 | 15846.1 | 1169 | 3404.5 | 11272.5 |
| Section (Delimitation Points) | Temperature Drop | Building | TE Specific Consumption for Space Heating | ||
|---|---|---|---|---|---|
| ps | pT | ||||
| [°C/m] | [%] | [Wh/m2] | [Wh/m3] | ||
| TN between EWS and TS1 | 0.007 | 1.18 | A + H | 17.76 | 4.6 |
| TN between EWS and TS2 | 0.007 | 1.18 | D + E + G | 16.2 | 3.5 |
| DN-UCD1, between TS1 pt 1 | 0.005 | 0.35 | F | 17.26 | 3.8 |
| DN-UCD1, between pts 1–2 | 0.075 | 5.31 | I | 22.83 | 6.29 |
| DN-UCD2, between TS1 and pt 3 | 0.071 | 12.4 | J | 13.37 | 3.76 |
| DN-UCD2, between pts 3–4 | 0.004 | 0.6 | K | 30.56 | 7.84 |
| DN-UCD2.1, between pts 4–5 | 0.007 | 0.8 | C | 33.78 | 9 |
| DN-UCD2 (pts 4–6) | 0.0008 | 0.4 | IT | 33.1 | 10.27 |
| UCD1—buildings (A + H) | 0.022 | 2.1 | B | 24.86 | 6.71 |
| UCD1—buildings (D + E + G) | 0.005 | 0.35 | M | 17.94 | 5.56 |
| UCD1—building F | 0.005 | 0.19 | N | 27.78 | 7.45 |
| TS1—building K | 0.0125 | 1.4 | A | 9.37 | 2.45 |
| UCD2—building B | 0.014 | 0.2 | P | 51.05 | 8.47 |
| UCD2—building M | 0.29 | 5.2 | R | 46.3 | 16.53 |
| UCD2—building N | 0.29 | 5.8 | Shooting room | 18.5 | 6 |
| UCD2.1—building O | 0.008 | 0.2 | Sports field | 6.9 | 6.9 |
| UCD2.1—building P | 0.08 | 0.8 | T | 15.77 | 4.44 |
| UCD2.1—building R | 0.029 | 0.4 | S | 38.47 | 7.15 |
| UCD2.1—Shooting room | 0.05 | 0.2 | C2 | 10.17 | 3.9 |
| UCD2.1—L-IMT building | 0.11 | 8.5 | C1 | 5.8 | 2.23 |
| UCD2.1—T-ID building | 0.022 | 1.62 | L-IMT | 6.12 | 1.8 |
| UCD2—building T | 0.02 | 9.24 | T-ID | 15.4 | 5.34 |
| UCD2—building S | 0.006 | 1.2 | U | 4.54 | 1.25 |
| UCD2 – students dormitory C2 | 0.005 | 0.6 | V | 12.2 | 3.5 |
| UCD2—students dormitory C1 | 0.003 | 0.8 | X | 19.5 | 5.14 |
| UCD2.2—building U | 0.13 | 3.25 | Y | 51.9 | 17.57 |
| UCD2.2—building Y | 0.096 | 4.7 | Z | 39.8 | 8.07 |
| TS1—building L | 0.252 | 11.1 | C3 | 54 | 20 |
| Total | 23.88 | 6.35 | |||
| Yearly value 2018 | 71 | 18.9 | |||
| Yearly value 2019 | 62.2 | 16.6 | |||
| Pollutant | 2019 | 2020 | ||||||
|---|---|---|---|---|---|---|---|---|
| EE | TE | EE | TE | |||||
| Consumed | Total Losses | DN Losses | Consumed | Total Losses | DN Losses | |||
| CO2 | 49.2 | 1840.7 | 791.5 | 563 | 63.9 | 2392.9 | 1029 | 731.9 |
| NOx | 0.1 | 5.5 | 2.4 | 1.7 | 0.13 | 7.1 | 3.1 | 2.2 |
| SO2 | 5.4 | - | - | - | 7 | - | - | - |
| The Proposed Measure | Energy Saving [toe/yr.] | Investment Required [×103 lei] | Return on Investment [Years] |
|---|---|---|---|
| Replacement of the existing energy carrier network at UO campus, with a new one, so that the technical norm I13—2015, point 8.88 to be met (heat losses should not exceed 0.5 °C/km). Detachable thermal insulation will be used on flanges/valves/other parts [17] | 379.1 | 4113.74 | 9—Hyp1 2.5—Hyp2 |
| Replacement of TS connecting pipes with pre-insulated pipes that have specific losses according to norm I13—2015, and insulation for connections and flanges/valves/other parts with removable thermal insulation [17] | 31.7 | 200 | 5.6—Hyp1 1.5—Hyp2 |
| A share of GHW from TS1 to be supplied to HEx4, after the manifold and before the geothermal injection well station | 7.5 | 4.2 | 0.5—Hyp1 Hyp2—not suitable |
| Assumption | EnPI | |
|---|---|---|
| ηgross [%] | ηnet [%] | |
| Hypothesis 1 | 86.7 | 85.1 |
| Hypothesis 2 | 86.5 | 85.9 |
| Pollutant | Energy Component | |||
|---|---|---|---|---|
| EE | TE | |||
| Delivered | Total Losses | DN Losses | ||
| CO2 | 17.3 | 1577.5 | 213.5 | 50.4 |
| NOx | 0.04 | 4.7 | 0.64 | 0.15 |
| SO2 | 1.9 | - | - | - |
Disclaimer/Publisher’s Note: The statements, opinions and data contained in all publications are solely those of the individual author(s) and contributor(s) and not of MDPI and/or the editor(s). MDPI and/or the editor(s) disclaim responsibility for any injury to people or property resulting from any ideas, methods, instructions or products referred to in the content. |
© 2022 by the authors. Licensee MDPI, Basel, Switzerland. This article is an open access article distributed under the terms and conditions of the Creative Commons Attribution (CC BY) license (https://creativecommons.org/licenses/by/4.0/).
Share and Cite
Bendea, G.; Felea, I.; Hora, C.; Bendea, C.; Felea, A.; Blaga, A. Energy Performance Analysis of a Heat Supply System of a University Campus. Energies 2023, 16, 174. https://doi.org/10.3390/en16010174
Bendea G, Felea I, Hora C, Bendea C, Felea A, Blaga A. Energy Performance Analysis of a Heat Supply System of a University Campus. Energies. 2023; 16(1):174. https://doi.org/10.3390/en16010174
Chicago/Turabian StyleBendea, Gabriel, Ioan Felea, Cristina Hora, Codruta Bendea, Adrian Felea, and Alin Blaga. 2023. "Energy Performance Analysis of a Heat Supply System of a University Campus" Energies 16, no. 1: 174. https://doi.org/10.3390/en16010174
APA StyleBendea, G., Felea, I., Hora, C., Bendea, C., Felea, A., & Blaga, A. (2023). Energy Performance Analysis of a Heat Supply System of a University Campus. Energies, 16(1), 174. https://doi.org/10.3390/en16010174