Article

Declining Discount Rates for Energy Policy Investments in CEE EU Member Countries

by
Rafał Buła
* and
Monika Foltyn-Zarychta
Faculty of Finance, Department of Investment, University of Economics in Katowice, 1 Maja 50, 40-287 Katowice, Poland
*
Author to whom correspondence should be addressed.
Energies 2023, 16(1), 321; https://doi.org/10.3390/en16010321
Submission received: 18 November 2022 / Revised: 4 December 2022 / Accepted: 19 December 2022 / Published: 28 December 2022
(This article belongs to the Section C: Energy Economics and Policy)

Abstract

:
Energy policy investments are usually evaluated using a cost-benefit analysis (CBA), which requires an estimation of the social discount rate (SDR). The choice of SDR can be crucial for the outcome of the appraisal, as energy-related investments generate long-term impacts affecting climate change. Once discounted, these impacts are highly sensitive to slight changes in the value of the SDR. Some countries (the UK and France) switched from a constant SDR to the declining rate scheme—a solution that limits the impact sensitivity. To our knowledge, none of the CEE countries apply DDR in CBA. While a constant SDR is a relatively well-established approach, declining SDRs are estimated to be used much less frequently, particularly for CEE EU member countries and energy policies. The rationale for the decline can rest on uncertainty over future discount rates, as shown by the approach developed by Weitzman and Gollier, which extends the classical Ramsey model. We applied this approach in our paper, as the Ramsey formula is the prevailing formula for EU countries’ SDR estimates. We estimated a flat SDR via the Ramsey formula with Gollier’s “precautionary term”, and next, we calculated Weitzman’s certainty equivalent rates for the 500-year horizon. Ramsey’s SDRs, obtained using consumption growth rates dating back to 1996, varied between 6.77% for Lithuania and 2.95% for Czechia and declined by 0.15% on average (Gollier’s term). Declining SDRs for the longest horizon dropped to approx. 0.5% (from 0.35% for Bulgaria to 0.67% for Poland), and the descent is deeper and faster when forward SDRs (following the UK Green Book approach) were considered (0.01% to 0.04%). The results are important for long-term policies regarding energy and climate change in CEE EU member countries, but they are still dependent on fossil fuels and experience an investment gap to fulfil EU climate goals.

1. Introduction

Energy policies and investments related to the area of energy call for particular attention nowadays, primarily due to two factors. The first is the current energy crisis triggered by Russian aggression on Ukraine, which could be a turning point for European energy policies [1]. It has often been emphasized in past decades that political conflicts usually cause energy crises (e.g., the Yom Kippur War and the oil crisis in 1973–1974, and the first Gulf War and the embargo on oil from Iraq in 1990) [2]. In the case of the EU, the situation has been extremely difficult, as the EU imported a significant amount of natural gas (40%), coal (50%), and oil (25%) from Russia [3]. However, as various analyses have shown, the rise in energy prices was often an impulse for additional innovative investments due to the changes in the relative prices of the factors of production (the Hicksian-induced innovation hypothesis), slowed down by the undermined profits of companies [4]. As a result, the Russo-Ukrainian war could give an additional impetus for EU nations to accelerate the transition towards clean energy sources, not only as the renewable energy sector seems more resilient to global crises but also due to the changes in relative prices of energy from different sources.
Secondly is an observable positive change in the public opinion of many EU countries toward reducing fossil fuel usage and moving towards clean energy alternatives [1]. The transition towards renewable energy sources will create new geopolitical winners and losers, and the negative impact will be especially visible in the case of petrostates, e.g., Russia [5]. The loosening dependency on Russia as an energy provider is especially important for CEE EU countries, where Russia tries to maintain its influence and control via energy policies [6]. However, the transition towards clean energy sources is impossible without additional investment spending [7]. The current geopolitically induced energy crisis offers a long-term double-dividend opportunity. In the long run, energy-related projects offer, apart from higher political stability of energy sources, a chance to increase energy efficiency and combat climate change more effectively. The European Green Deal set ambitious long-term targets for EU climate neutrality. It aimed to make considerable impacts, like creating jobs, enhancing economic growth, and reducing external energy dependency [8]. The energy policy plays a pivotal role in the transition to a sustainable economy for the EU and—particularly—for CEE EU member countries (Bulgaria, Czechia, Estonia, Hungary, Latvia, Lithuania, Poland, Romania, Slovakia, and Slovenia). In these countries, energy efficiency and energy mix call for immediate action and intensification of energy sector investments to meet the desired EU goals in the short and long term.
A crucial step towards fulfilling those goals is the consistent framework of investment proposal evaluation that allows for the efficient use of limited resources. A predominant approach to a project appraisal in the energy policy area is cost-benefit analysis (CBA), which is recommended for evaluating public investments with considerable social or environmental impacts [9]. Energy-related investments affect both dimensions, generating short- and long-term changes in social welfare. CBA allows measuring those changes in monetary terms and weighs costs against benefits to indicate investments with a positive net value that maximizes social welfare. However, evaluating energy-related investments poses several challenges related to the monetary valuation of impacts and cost-benefit intertemporal comparisons.
Particularly the latter put forward some compelling issues due to the extremely long timeframe and ethical questions raising intergenerational justice concerning climate change or nuclear energy’s delayed impacts [10,11,12]. CBA deals with intertemporal comparisons by discounting procedures that allow for calculating the present value equivalents of future impacts, assuming that society needs some reimbursement for the delay, as in the future, we expect to become richer. The parameter that reflects that reimbursement level is the social discount rate (SDR), which may be based on several theoretical approaches. Setting the SDR’s precise value may be crucial for the outcome of the appraisal. This is because, along with a lengthy delay, the discounting shrinks present values considerably with relatively small changes in the SDR, particularly in the case of energy investments like mitigating climate change or nuclear waste with impacts reaching hundreds of years in the future.
Although the predominant approach in Europe is an SDR based on the Ramsey rule [13,14,15], the discounting regimes differ in practice, as some countries apply EU recommendations [9,16]. In contrast, others prepare their own guidelines [17]. Additionally, for long-term timeframes, the time-declining discount rate scheme is introduced in some countries, such as France, Denmark, or the UK—a former EU member [17,18,19,20]—and outside of Europe by the US [18,21]. The time-declining regime is preferable for intergenerational impacts as it reduces the tremendous inequality between discounted delayed impacts and undiscounted immediate outlays. However, this approach is not used in CEE EU member countries, which usually rest on the constant general EU Ramsey-based estimate of 3% (or 5% for the previous programming period 2014–2020). While investment needs in the energy sector for CEE EU member countries are vast and generate multiple long-term impacts, e.g., concerning climate change, a deep investigation into the discount rate scheme seems to be beneficial for energy sector policy planners. Particularly, the research in this area is limited, focusing mainly on constant discount rate estimations [13,15,22,23], and rarely addressing the decline issue, e.g., [24,25]. The deficiency is even more striking in the case of CEE countries. The studies presenting SDR for CEE EU countries are rare, e.g., [13,22,23], while research on the long-term horizon is almost non-existent [26,27].
This paper aims to fill the diagnosed gap by deriving Ramsey rule discount rates [28] for CEE EU countries (Bulgaria, Czechia, Estonia, Hungary, Latvia, Lithuania, Poland, Romania, Slovakia, and Slovenia) and extending it to deliver certainty-equivalent discount rates based on the Weitzman-Gollier approach [29,30]. The certainty-equivalent discount rates are suited to the long-term perspective, often present in energy-related investments, e.g., averting climate change activities by investing in renewable or nuclear energy sources. One of the recent examples applying this approach to energy policy investments is the Maselli and Nesticὸ paper [24] that discussed the role of DDR in energy policy investments. They based their approach on the Ramsey rule, Weitzman-Gollier declining rates rationale, and Gollier’s ecological discounting model. In our paper, we partly followed their methodology and rationale for the research, focusing on CEE EU countries. Moreover, not only did we provide the researchers and policymakers with SDR declining scheme estimates, but we also proposed a new method of simulating the discount rates used to calculate the certainty equivalent rate based on a non-parametric approach employing the kernel estimates of the probability density function. As a result, we obtained estimates free from additional assumptions regarding the shape of the per capita consumption growth density function, which is the primary novelty of our paper. The aforementioned method is more reliable than fitting a probability distribution to growth data, which makes the sample more reflective of the original data pattern. Consequently, we received a set of declining discount rates that, on the one hand, aimed at reflecting the societies’ propensity to consume and, on the other hand, encouraging them to make additional investment efforts leading to the achievement of sustainable economic goals.
The paper is organised as follows. Section 2 presents the theoretical basis for the SDR based on the Ramsey approach and its Gollier’s modification, followed by the Weitzman-Gollier certainty-equivalent rate approach. In Section 3, the sources and treatment of data for constant and declining SDR estimation are described. Section 4 demonstrates the results for both the flat and declining SDR approaches, with a time horizon of up to 500 years for the latter, based on per capita consumption growth rates dating back to 1996 and mortality rates dating back to the 1960s. This is followed by a discussion comparing the results with other studies and confronting declining SDRs with alternative regimes, for example, intergenerational investments and limitations of the results. Conclusions are the summary of the input of the paper.

2. Dilemmas in Evaluating Energy-Related Investments

2.1. Energy Policy Investment Requirements in CEE EU Member Countries in the Light of European Union Strategic Goals

The energy sectors in CEE EU member countries need considerable investments in their current state. When comparing the energy consumption mix of CEE EU member states and the EU (Figure 1), there is a visible drawback in relation to the share of renewable and other non-fossil fuel sources of energy. While the EU average is approx. 27%, only a few countries fell close to this percentage or exceeded it (Slovenia, Bulgaria, Slovakia, and Romania), primarily due to the presence of nuclear energy sources in their energy mixes. Other CEE countries lag behind, reaching an 8% (Estonia, Lithuania) to 21% (the Czech Republic) proportion of renewable and nuclear energy sources in primary energy consumption.
The scale of investment needs can also be seen via carbon dioxide emissions (Table 1). While the per capita emissions for most of CEE EU member countries are below the EU average (only Czechia, Poland, Estonia, and Slovenia are above the EU level), the efficiency of emissions measured in kg of carbon dioxide per unit of GDP (US dollars at PPP rates) is usually worse than the average EU estimate. Only three countries (Lithuania, Romania, and Latvia) are below the EU mean.
The investment gap is even more apparent when compared with the European Union’s ambitious strategy, where energy policy plays a pivotal role in social and environmental goals. Some of the more aspiring goals include energy source diversification, integration of the internal energy market to allow the free flow of energy, and supporting research into low-carbon and clean energy technologies [36]. These aims align with the European Green Deal that sets the short-term (by 2030: reduction of 55% in greenhouse gas emissions compared to 1990 levels; 32% share of renewables in energy consumption; 32.5% improvement in energy efficiency; and 15% of interconnected EU’s electricity systems) and long-term (by 2050: achieving climate-neutrality in greenhouse gases emissions) goals in line with the Paris Agreement [36,37,38].
These ambitious plans require considerable investments, especially if we take into account the significant role of government support in the development of the renewable energy sector [39]. The estimates for achieving the 2030 goals are estimated to reach €260 billion annually [40]. The EU also plans to support regions heavily based on coal through the Just Transition Fund [41]. These regions are usually located in CEE countries, which, in many cases, have much larger investment needs than the EU average, particularly in the energy transition to non-fossil fuels and energy efficiency (compare Figure 1 and Table 1). The estimated investment needs based on the published long-term national strategies (2050 perspective) for CEE EU members vary [42]. Additional investment over the period 2020–2050 (as compared with business-as-usual scenarios) is estimated to reach between €183 billion to €335 billion in Czechia, €36.5 billion to €68 billion in Hungary, €16 billion in Latvia, €200 billion in Slovakia, and €66 to €72 billion in Slovenia. In general, some long-term national strategies published for CEE countries estimate that the required additional yearly investment outlays will reach around 4% of GDP in those countries [42], which is much more than the average EU estimate (1.5% of 2018 EU GDP) [40].

2.2. Social Discount Rate in Energy Investments Evaluation

The energy-related investments can be described as a special type of investment activity that should be evaluated by methods reaching beyond financial appraisal. The basis for this extension includes the environmental and social impacts not usually represented in a corporate investment appraisal. On the one hand, the former is related to possible interventions in biodiversity areas or pollution emissions and waste generation [11,43] and, on the other hand, to climate change impacts by increasing or reducing greenhouse gas emissions [44,45]. The latter is linked to increasing energy dependence of economies, energy inefficiency, and the issue of energy poverty, which is particularly important for CEE countries, where the considerable investment needs and rising energy costs merge with the relatively low level of disposable income [46,47]. Both areas call for switching from market-price-based financial methods of appraisal to alternative approaches, mainly cost-benefit analysis (CBA).
CBA is the predominant method for any investment where private-perspective effectiveness deviates from social evaluations [14,48]. This is the case for most of the environmental or social impacts, which change public goods and generate externalities not reflected properly in market prices, creating a divergence in the assessment results between private and social points of view. Investment activities with such features are evaluated in a CBA based on shadow prices and the social discount rate (SDR), which fix the flaws of market prices and the financial cost of capital in the Net Present Value (NPV) criterion calculation, respectively.
Particularly the SDR choice has a tremendous impact on the NPV in cases of energy-related investments due to the extension in time of both social and environmental impacts, particularly those related to climate change mitigation or nuclear power investments, that stretches over decades or even hundreds of years [24,27,49,50]. The long timeframe leads to immense sensitivity to the present value of future impacts on the choice of the discount rate regime and discount rate value. The effect generated after 100 years shrinks to 5% of its original worth when discounted by 3%, then to a mere 0.7% of its initial value at a discount rate of 5%. Meanwhile, for an SDR of 7%, its present value is only 0.1% of the future amount. In this paper, we discuss whether the general approach in a CBA based on a constant SDR works in the particular case of intergenerational investments like energy-related projects. The discussed controversy emerges because an extremely long-term temporal horizon significantly reduces the present value of delayed impacts [51,52,53].
SDR is defined as a rate that reflects society’s perception of how future benefits and costs should be valued against present ones. The construct is similar to the cost of capital employed in a financial appraisal, representing the opportunity cost of invested assets. In the context of the NPV criterion, the discount rate determines the value of the discount factor, which allows for the comparison of monetary flows and other impacts borne at various moments in time. The farther in time the impact emerges, the more its present value diminishes in comparison with any outlay or benefit borne today. In model conditions, when the markets are perfectly effective, the SDR and financial discount rate converge (the same way as shadow prices converge with market prices in the valuation of impacts). In practice, the need to calculate SDR arises due to a number of distortions.
There are two main approaches to this task that follow two separate rationales for discounting [54]. The first refers to the demand side of the capital market: the investment-based approach [18], in which the investment should be accepted if it brings more than an alternative activity that is abandoned. The social opportunity cost of capital (SOC) is the basis for calculating the SDR as a marginal return on private investments that are pushed out by evaluated (in most cases public) investment projects [55]. The SOC empirical estimates usually use the real before-tax rate of return on corporate bonds [56] or calculate the profitability of the private sector based on national income accounts [57]. The second is the capital market supply side or consumption-based approach [51], where the SDR reflects the social time preference (STP) rate that illustrates the rate at which society is willing to trade future consumption for today’s consumption, assuming that the investment is financed from savings (future consumption) that crowd out current consumption. Two main approaches are used to measure STP: consumption rate of interest (CRI), approximated by the real rate of return on long-term government bonds [55], or the Ramsey rule [28], based on intertemporal social welfare function. The latter is the prevailing approach to SDR calculations in Europe [13,14,17] and is considered a prescriptive approach.
Under perfect market conditions, the STP and SOC should give the same estimate [18,54]. In the real world, the SOC approach usually gives higher estimates than STP. The former is represented by discount rates for developed countries ranging from 6% to 8% [55,58], while the latter gives values of 1.5% to 6% [59,60,61]. Those estimates can be twice as high for developing countries [45].
The SDR values above raise a pivotal challenge evaluating such investments: the mentioned sensitivity of the SDR choice on the present value of time-distant impacts incur the risk of being completely pushed out by any short-term investment, where gains are much lower only due to its closeness in time. Whether the Ramsey rule or SOC approach is applied, they are both based on time-constant rates, which inevitably leads to serious discrepancies between close and remote investment impact values.
The literature offers various solutions that give the rationale for applying lower or time-declining discount rates that can build up a more balanced approach to compare today’s undiscounted outlays and benefits appearing in the distant future. One of the proposed approaches is Gollier’s precautionary term [29,62], which offers an extension of the Ramsey rule, taking into account the uncertainty over the future consumption level, assuming that the fluctuations in consumption growth are independently and normally distributed. However, the estimates of the reduction value are not high, ranging from 0.3% to 0.5% lower than the canonical Ramsey rule SDRs [23,63].
Apart from lowering the value of the discount rate, many literature sources argue for applying a declining discount rate (DDR) regime in case of far-distant future impacts, which leads to increasing the present value of time-distant impacts. The set of DDR approaches (other names include “hyperbolic”, “decreasing”, “logistic”, or “intergenerational”) [64] rests on various assumptions.
The prescriptive subset rationalizes the decline via ethical considerations, arguing for the application of a lower discount rate for impacts affecting future generations. This may be backed up by philosophical arguments raised, i.a., by [10,65,66,67] or based on society’s views (elicited, e.g., by questionnaires) [23,68] or expert opinions [69,70,71]. The decline in the value of the discount rate favouring future impacts in the evaluation, as ref. [72] puts it, is the moral question of if our sacrifices on behalf of future descendants could be richer or poorer. However, the issue that should be taken into consideration is the vast number of people likely to live in the future and the danger of catastrophic damage to their welfare and the whole planet. The ethical perspective is also visible in some empirical works, e.g., [71], where the surveyed experts did not follow the canonical Ramsey rule in their long-term discount rate recommendations. This is supported by Freeman and Groom [19], who looked more closely into Weitzman’s expert survey [69], arguing that the variability of the responses could be explained by ethical judgements and descriptive forecasting errors.
The second subset is based on the assumption of including uncertainty over the future. It originates from influential papers by Weitzman [30,69] and Gollier [73,74]. Weitzman’s and Gollier’s approaches produced similar results of declining regimes starting from a slightly different basis. Weitzman’s Expected Net Present Value (ENPV) concentrates on uncertainty over the future discount rate that is transformed via the discount factor into a certainty equivalent discount rate that declines over time. Gollier’s starting point was the uncertainty over the growth rate of per capita consumption in the Ramsey formula; when the shocks to g are positively correlated over time, the precautionary term becomes considerable, and the rate declines with time [29]. The two approaches were then merged in [75], where both authors concluded that when future discount rates are uncertain but have a permanent component, then the ‘effective’ discount rate must decline over time toward its lowest possible value (see also [20] for the discussion). In the following sections of the paper, we focus on deriving the DDR based on the ENPV since it draws on present value calculations and is the predominant approach in investment project evaluation practice.
Considering the empirical results of DDR calculations for developed countries, the estimates depend on the theoretical foundations, but in general, they usually start with Ramsey-based values of 4–6% and then decline to around 0.5–1% depending on the longest timeframe investigated [26,71,76,77]. For developing countries, some papers report that the decline starts from and finishes at a higher level (approx. 13% to 5.4% over 300 years for China) [24], while others give estimates that do not differ significantly from the US or Europe (e.g., Gollier et al. [77] certainty equivalent DR for India starts at 4.5% and declines to 0.8% over a 400-year period).

3. Materials and Methods

3.1. Constant SDR: Ramsey Equation and Gollier’s Precautionary Term

The canonical Ramsey rule, while giving the constant value of the discount rate over time, is a starting point for further calculations leading to declining discount rates regime. The Ramsey formula is illustrated by:
STP = ρ + η × g
Ramsey’s STP sums up pure time preference, ρ, and the product of elasticity of marginal utility of consumption, η, and the expected growth rate of per capita consumption, g. Pure time preference is usually interpreted as the measure of society’s impatience and is approximated by the mortality rates [78]. The elasticity of marginal utility of consumption should reflect the society’s inequality aversion and is usually empirically derived from the progressive income tax structures (“the equal sacrifice” method) [79]. However, other methods are also used, e.g., observed household saving decisions [80]. Finally, the expected growth rate of per capita consumption reflects the society’s welfare increase and is estimated based on the historical or expected per capita GDP growth rate [13,81]. The product of η and g is designed to reflect the consumption opportunity cost of investing that considers the growing consumption and the social aversion to inequality.
To embrace the uncertainty over the future growth rate of per capita consumption, Gollier’s proposal of the extended Ramsey rule was put forward:
STP = ρ + η × μ 0.5 η 2 σ 2
where µ represents the mean of the consumption growth rate, and σ2 is the variance of the consumption growth rate. The term 0.5η2σ2 represents the prudence of a risk-averse society (or a social planner) willing to save more now for greater benefit in the uncertain future, and it leads to reductions in the discount rate.

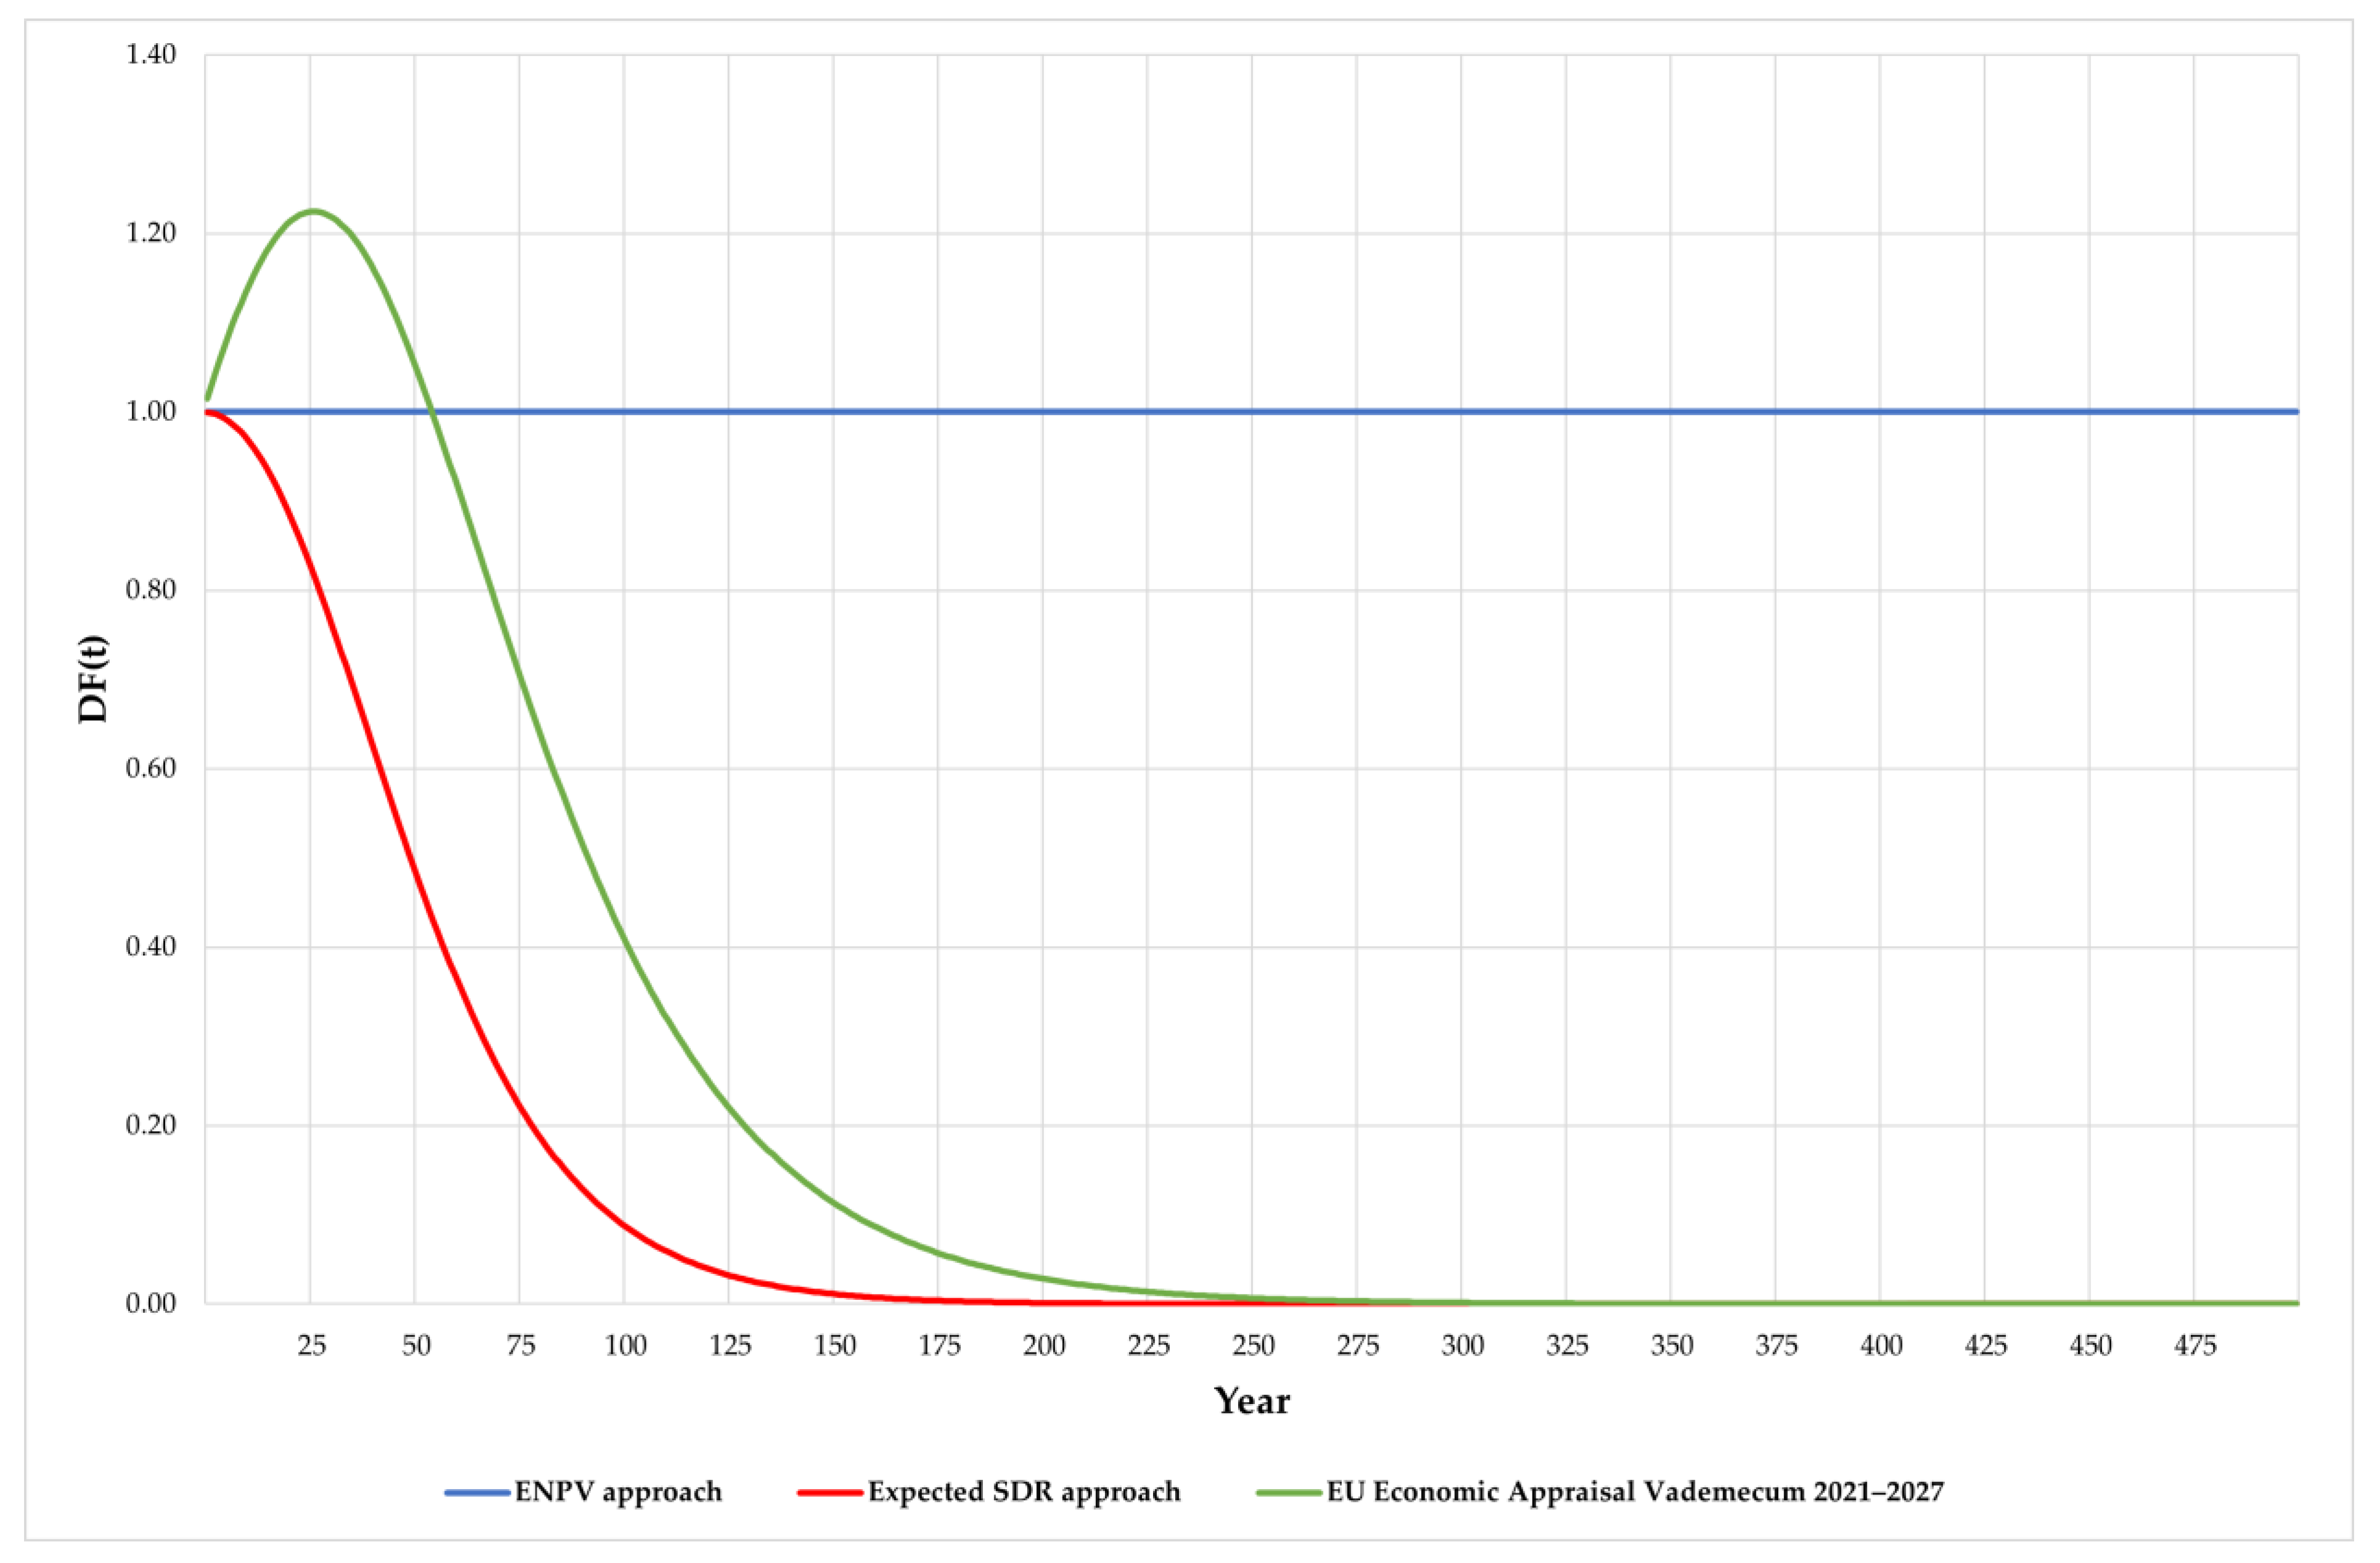
3.2. Time-Declining SDR Based on Expected Net Present Value

To derive declining discount rates as certainty-equivalent rates, we need to assume that the future discount rate is uncertain in each of the investment periods:
r j ( t ) : j = { 1 , , n } , t , p j > 0 , j = 1 n p j = 1
where rj(t) is the value of the discount rate in the jth future state of the economy at the tth time [30]. In a state of uncertainty over future rates, the project can be evaluated in two ways. The first is as an average rate for each period t, and then the NPV for the investment based on the future average rates can be calculated:
D F t = exp ( s = 1 t j = 1 n p j r j ( s ) )
This is the standard approach adapted, leading to time-constant discount rates and exponential discounting, which tremendously diminish the present value of time-distant impacts. The second is the ENPV approach, in which first, the future discount factors for each state of the economy and the time-dependent average (certainty-equivalent) discount factors A(t) are calculated [75]:
A ( t ) = j = 1 n p j exp ( s = 1 t r j ( s ) )
The discount factors can be transformed into the certainty-equivalent or “effective” discount rate R(t):
R ( t ) = 1 t ln ( j = 1 n p j exp ( s = 1 t r j ( s ) ) )
Arrow et al. defined a certainty-equivalent discount rate as a rate “which, when applied with 100% certainty, results in the same NPV as when multiple rates are applied with less than 100% certainty” [18]. The Weitzman-Gollier approach argues that R(t) for an infinite time horizon diminishes to its minimum value when a fixed but uncertain rate persists forever:
R ( + ) = min j = 1 , , n { r j }
The intuition behind this approach is cunningly explained by Newell and Pizer: “Intuitively, the only relevant scenario in the limit is the one with the lowest possible interest rate, because all other possible higher interest rates have been rendered insignificant by comparison through the power of compounding over time” [76].
The compelling power of the ENPV approach is given in a simple numerical example below, where we assumed two future scenarios with 3% and 7% rates and equal probabilities. The expected discount rate was, therefore, 5% (which is the EU recommendation for CEE countries for the CBA of investment project evaluation [9,16]). Table 2 presents the results of the standard discount factor and certainty-equivalent discount factor (continuous compounding), effective rates (discrete time units), and the comparison of differences in present values between the standard and ENPV approaches (calculated as a CE discount factor divided by expected rate discount factor). Figure 2 and Figure 3 provide additional illustrations of the present value and effective rates for a timeframe of up to 300 years. The far higher ENPV discount factor values stem from the convexity of exponential functions, where the convexity rises with time, leading to the decline of discount rates (increasing Jensen’s inequality) [19].
Based on the example, it can be observed that the ENPV approach may significantly increase the present value of distant future impacts. However, if the yearly uncertain rates are independent and identically distributed (uncorrelated over time), the CE rates are time constant. The correlation of the rates in time causes persistence in the value of the rates over time and, therefore, the decline in CE rates [18]. The decline is also higher, and the volatility of future yearly discount rates is higher [19]. Hence, the important step in delivering the DDR scheme is the choice of, or assumption of, the time correlation of the yearly rates.

3.3. Data Sources

The empirical studies devoted to the ENPV approach use two different methods for estimating the yearly uncertain discount rates and modelling their time-correlation function and, as a consequence, have two distinct sets of data. Some papers use the production-based term structure of discount rates (SOC) derived by assuming that the investment under consideration is financed through a reduction of other investments [77]. In equilibrium, this assumption results in applying the rate of return on marginal investment in the production sector to assess the efficiency of new investments. In practice, financial markets’ interest rates are used (mainly government bond yields), e.g., [76,77]. The second approach relies on the assumption that new investments crowd out current consumption and, consequently, exploit the consumption-based term structure of discount rates (STP). Usually, the calculations are based on per capita GDP or consumption growth rates and their volatility, allowing us to estimate the Ramsey rule STP rate [24,80].
From the theoretical standpoint, in the absence of any distorting frictions, the equilibrium is reached, and there is no difference in whether a new investment is financed by consumption or investment volume reduction. As a result, the equilibrium interest rate in the economy should be equal to the marginal rate of intertemporal substitution of consumption and the marginal rate of return on capital. However, as pointed out by Spackman [82], due to i.a. taxation, transaction costs, and risk, these approaches do not necessarily lead to the same result, which has also been confirmed in empirical research regarding CEE countries (see, e.g., [23]). Moreover, CEE countries’ financial markets are relatively short-lived, often insufficiently liquid, and the availability of market rates of return is rather limited, especially when compared to the corresponding UK or US time series (see, e.g., Newell and Pizer, who use the US market interest rates based on the period starting in 1790 [76]). Therefore, we argue for using the consumption, or GDP-based term structure, of discount rates.
Having adopted the approach mentioned, the data regarding consumption or per capita GDP growth rates are necessary. The Ramsey model and its modifications take into account the growth of consumption (as they rest on optimization of its current and future level), so we decided to use consumption expenditure as our basis. This is the approach exploited, i.a., by Groom and Maddison [80]. There are also studies using GDP growth as a proxy for long-term consumption growth (e.g., [24,60]). Therefore, we also calculated the per capita GDP growth as an alternative to the approach based on consumption changes.
All the observations we used were provided by the Organisation for Economic Co-operation and Development via the OECD Statistics website. To check the robustness of our estimates, yearly and quarterly values based on quarterly data starting from the first quarter of 1996 were employed. Following Groom and Maddison [80], when considering consumption changes, we used real quarterly, not seasonally, adjusted consumption expenditure on semi-durable goods, non-durable goods, and services per capita (time series labelled as P31DC: Households consumption expenditure (Domestic Concept)-P312N: Other goods and services measured as LNBQR: National currency, chained volume estimates, national reference year, quarterly levels). Unfortunately, these data are unavailable at an aggregated level of all the CEE EU countries or the national level if expressed in a common currency (i.e., the US dollar). Consequently, we used as a proxy real, quarterly, seasonally adjusted final consumption expenditure time series (VPVOBARSA: US dollars, volume estimates, fixed PPPs, OECD reference year, annual levels, seasonally adjusted). With regard to the GDP, the real quarterly, not seasonally, adjusted values were employed (Gross Domestic Product-expenditure approach, LNBQR: National currency, chained volume estimates, national reference year, quarterly levels). Analysing the quarterly data, we covered Q1 1996–Q2 2022, while in the case of yearly data—the years from 1996 to 2021. As we used the real values, phenomena like prices rising solely due to monetary factors could influence our result only indirectly, via impacting real consumption or GDP growth. Additionally, the prevailing approach in investment appraisal is the use of cash flow projections calculated in real terms. Therefore, the real SDR delivered in our paper may be directly applied to calculate the present value. In our opinion, this approach is fully justified as it separates the real economy from purely monetary phenomena.
The next problem to be solved was whether to analyse total or per capita values. Different approaches regarding this problem are adopted in the literature. Ramsey [28] avoided the problem by assuming that the population is constant. Eckstein [83] used the per capita values, while Feldstein [78,84] supported the use of total consumption, claiming that social welfare rises not only when consumption per capita grows but also when the population increases while consumption per capita is held constant. However, recent studies (e.g., [15,60,80]) have employed per capita values, and in this study, the same concept is used to achieve comparable results. To calculate the per capita values, data series prepared by the Population Division of the Department of Economic and Social Affairs on the United Nations Secretariat were used [85]. This step allowed us to avoid problems arising due to the periodic reassessment of population size after general censuses, as the statistical offices usually do not make any backward adjustments. The linear interpolation of yearly data given as of 1 July made it possible to calculate end-of-quarter values then used to obtain quarter mean values.
In this study, we constantly used logarithmic rates of return and logarithmic rates of change. This concept was also applied to calculate the per capita GDP or consumption growth. The variance of the growth rate was estimated as a sample variance around the mean.
To estimate the SDR via the Ramsey equation, the elasticity of marginal utility of consumption was also necessary. We followed the practice of using “the equal sacrifice” method based on tax rates introduced by [86], as it did not require introducing the condition of additive separability [59].
The necessary data on CEE EU countries, excluding Bulgaria and Romania, are available on the OECD Tax Database website [87] covering 2000–2021. To obtain the data for Bulgaria and Romania, we used the OECD Tax-Benefit web calculator [88]. As the OECD Tax Database provides the average and marginal tax rates (imposed by central and sub-central government) and wedges for four levels of income (expressed as a share of the average wage, i.e., 67%, 100%, 133%, and 167%), we analogously calculated the net income of a single, employed 40-year-old person having no children and working on a full-time basis, who does not receive any additional benefits (connected with unemployment, family situation, social assistance, etc.). The average tax wedge was calculated as the percentage reduction of gross in-work earnings. We decided to treat social security contributions as a part of the tax wedge following [13,80]. The marginal wedge was obtained by calculating the incremental average wedge for the aforementioned relative levels of income increased by one percentage point. The elasticity of marginal utility of consumption was estimated using an equal sacrifice approach by regressing ln ( 1     MTR ) vs. ln ( 1     ATR ) without weighting observations by the number of people to whom they refer and by imposing a constraint that the regression line has to go through the origin [81,86]. The weighting scheme was abandoned due to a lack of data on the structure of the population while considering the salary income level. The potential differences should not be significant, as in the cases where the data were available (Poland), the results obtained by applying the schemes described were immaterial (1.1136 vs. 1.1174) [23].
The only remaining variable to be estimated to make the Ramsey equation applicable was the utility discount rate mirroring the individuals’ preference towards current consumption and certain types of risk. Usually, the risk component is aimed at reflecting catastrophic risks like the risk of societal collapse or project failure [89]. On the other hand, Kula [90,91,92] equated it with the mortality risk. We share this point of view, and as a result, the l component of the SDR was estimated using mortality data provided by the World Bank [93]. The historical mean was used for countries as the estimate of future mortality rate, transformed into the logarithmic rate. The average mortality for CEE EU members as a group was calculated as an average of these forecasts, weighted by the population size at the end of Q2 2022. Regarding the pure time preference rate reflecting individuals’ myopia, we assumed that it was equal to zero. As it is often claimed, a positive pure time preference mirrors individuals’ irrationality and distorts the process of making investment decisions [24,54]. Moreover, it leads to unequal treatment of current and future generations, and this phenomenon is magnified if we consider far-distant cohorts. Therefore, in this study, we assumed that the pure time preference rate equaled zero.

4. Results

We implemented the approaches mentioned to estimate constant and declining discount rates for 10 CEE EU countries: Bulgaria, Czechia, Estonia, Hungary, Latvia, Lithuania, Poland, Romania, Slovakia, and Slovenia. To the best of our knowledge, as of now, there are no estimates of a declining SDR for all CEE EU members (e.g., the latest estimates provided by [15] do not include values for Bulgaria and Romania, and only the constant discount rate was considered by the authors).

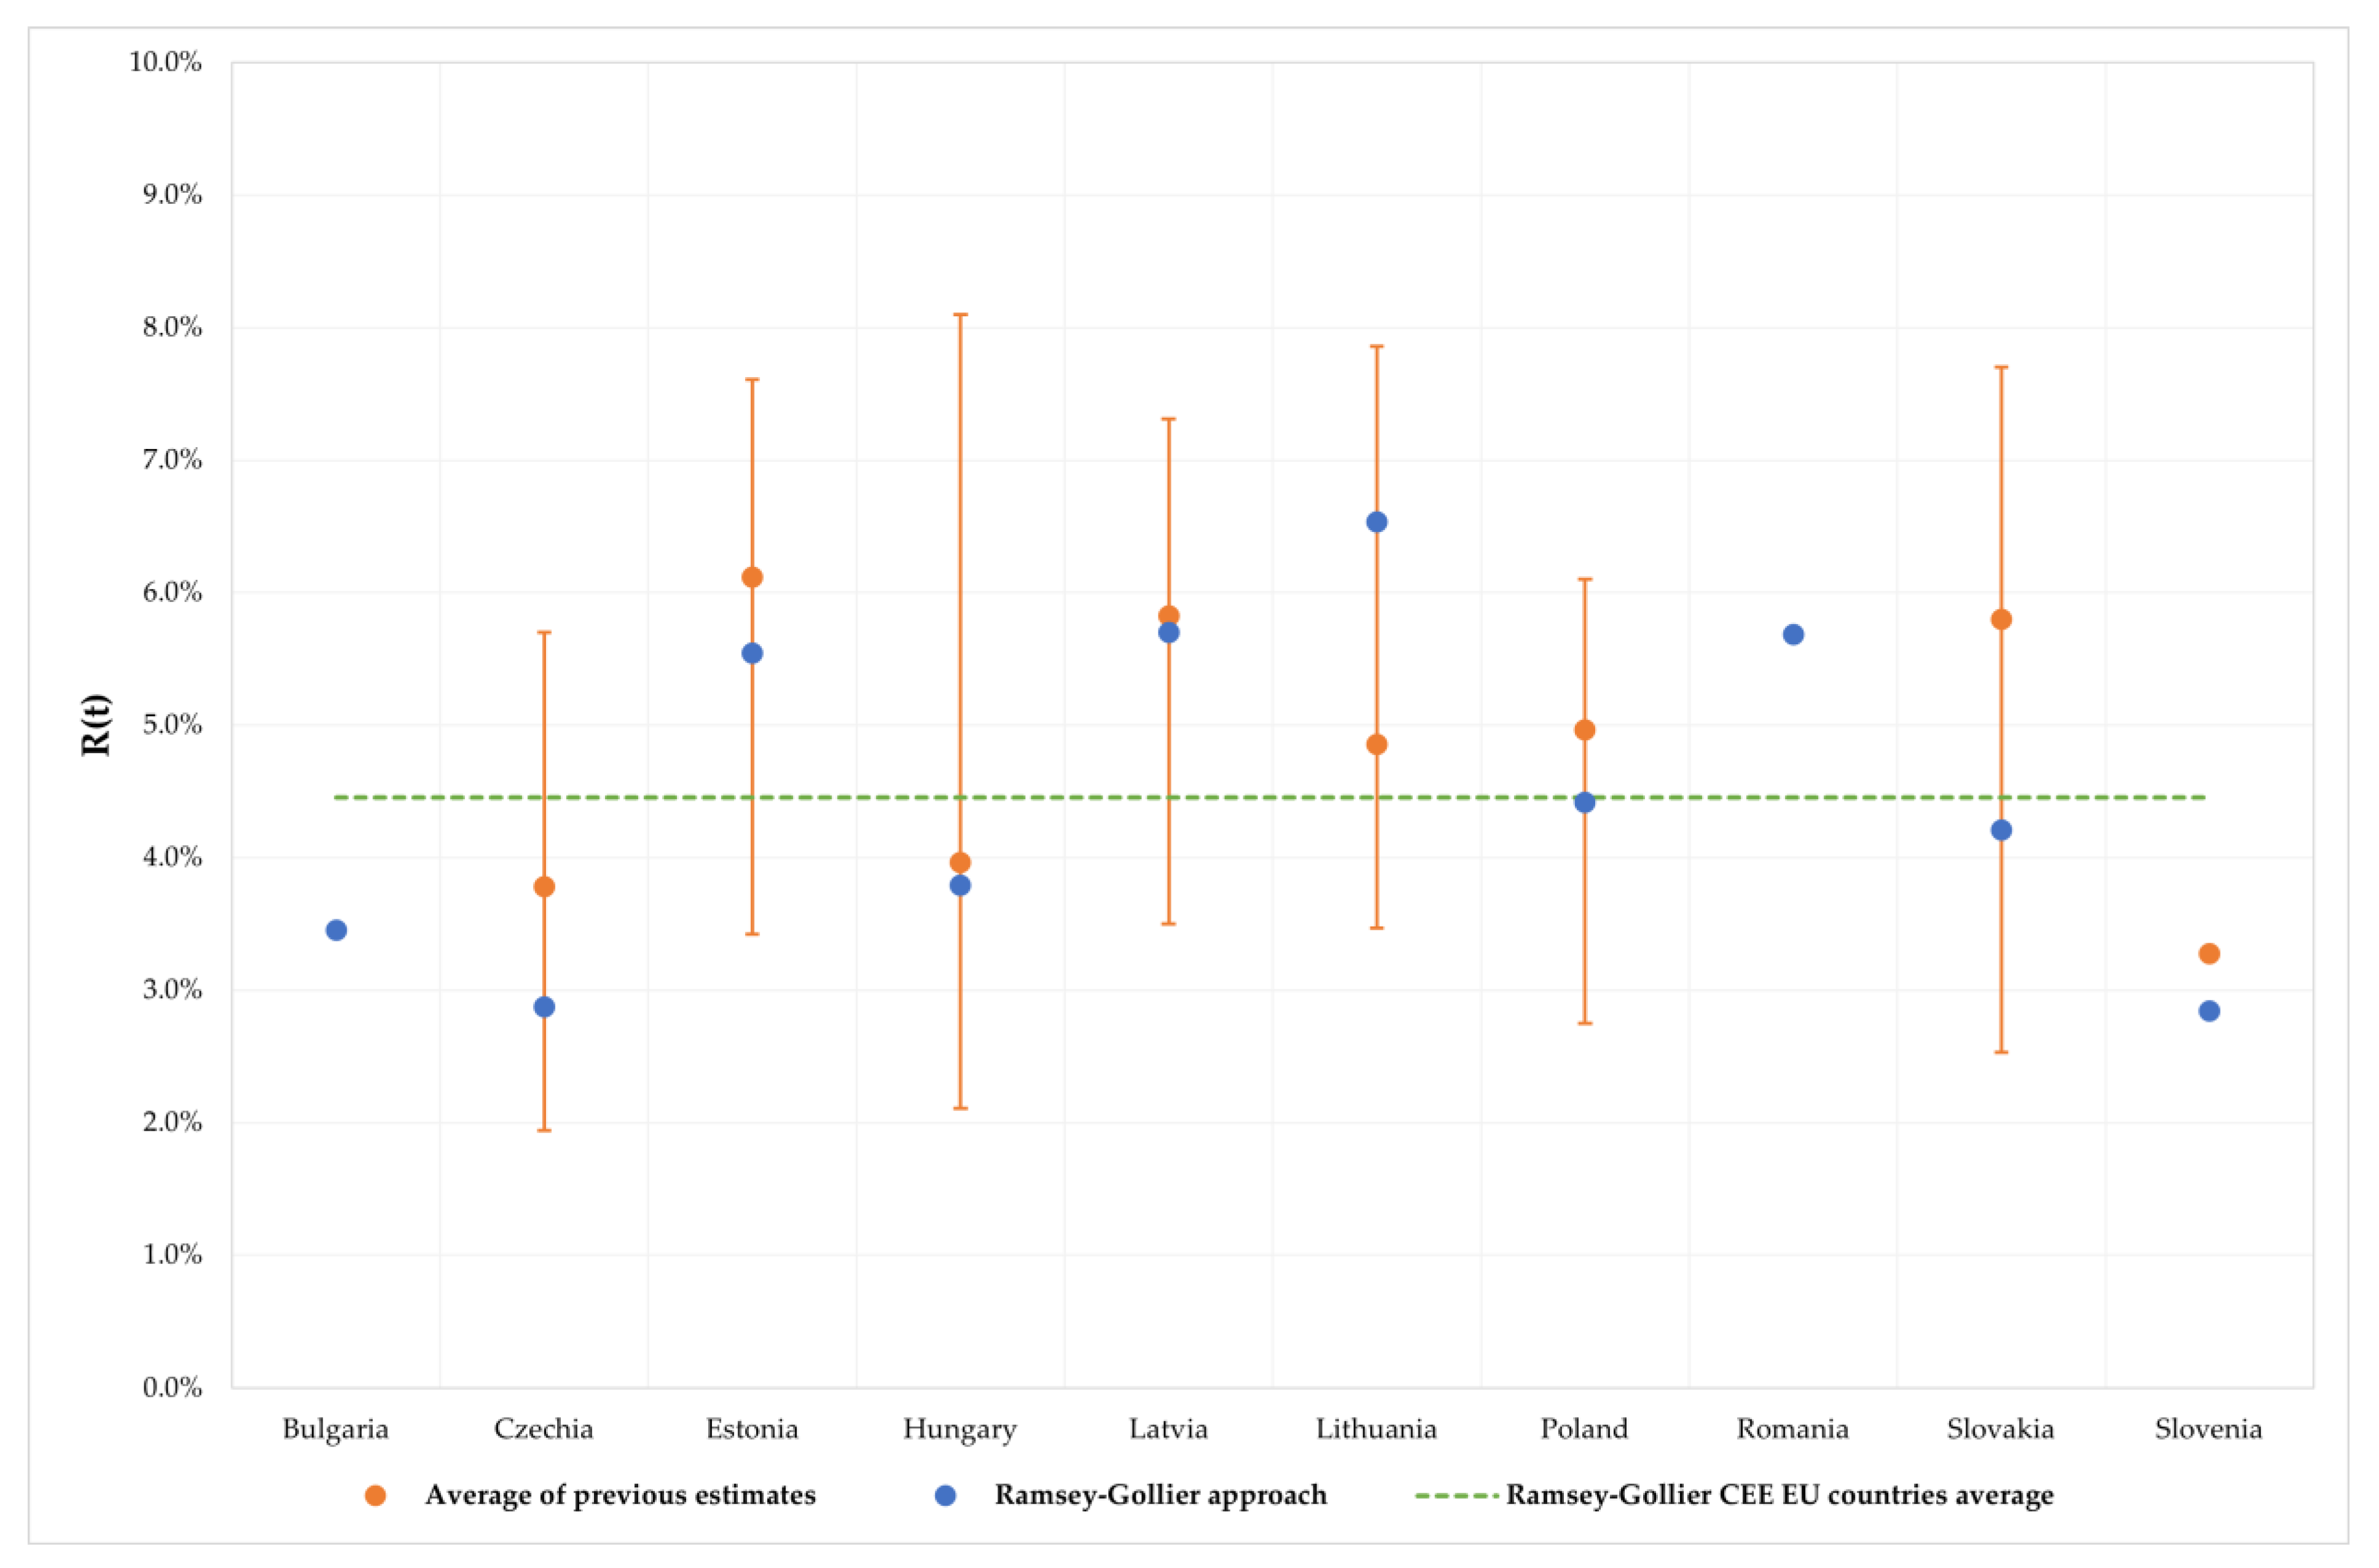
4.1. Estimation of the Constant SDR

We assumed the pure discount rate to be zero on the ethical basis that the only component of the utility discount rate was the rate reflecting mortality. Table 3 shows the results of the calculation for particular countries and aggregated values for the whole group (in this case, the mortality rates are weighted by the population sizes as of Q2 2022).
The average mortality rate was 1.06%, and the country-level rates were similar to values obtained in other studies, e.g., [13,15]. Using these values, the mortality component of the utility discount rate was calculated as ln ( 1     mortality   rate ) .
In the next step, the elasticity of the marginal utility of consumption was estimated using the tax method (“the equal sacrifice” approach). The lowest value we received was for Bulgaria (nearly unitary elasticity), while the highest was for Slovenia (1.3770). At the same time, the average elasticity (1.2189) was significantly lower than the average estimate for other CEE EU countries (1.6625, [15]). The weighted average elasticity for all CEE EU members was calculated by taking into account the differences in consumption levels among these countries. Assuming that the total utility for all the CEE EU countries’ inhabitants equals the sum of utilities for particular societies, and considering the consumption distribution as constant, the elasticity of marginal utility of consumption can be calculated as:
η = i = 1 n η i c i 1 η i i = 1 n c i 1 η i
The weighted average (1.0638) was significantly lower than the arithmetic average (1.2189), as the three countries with the lowest elasticity (Bulgaria, Poland, and Romania) had a 64% share in the total CEE EU countries’ consumption. These values are shown in Table 4.
We estimated the Ramsey SDR using the past average growth rate of consumption/GDP as a predictor of the future evolution of these variables. Due to differences in growth level (per capita GDP growth was on average higher than per capita consumption growth by 0.69%—excluding Romania, where it was lower), the estimated SDR was usually higher if we employed GDP data (mean difference equalled 0.87%—excluding Romania). As in the Ramsey model, we were focused mainly on the consumption level; the remaining results presented in this study were calculated using yearly per capita consumption data.

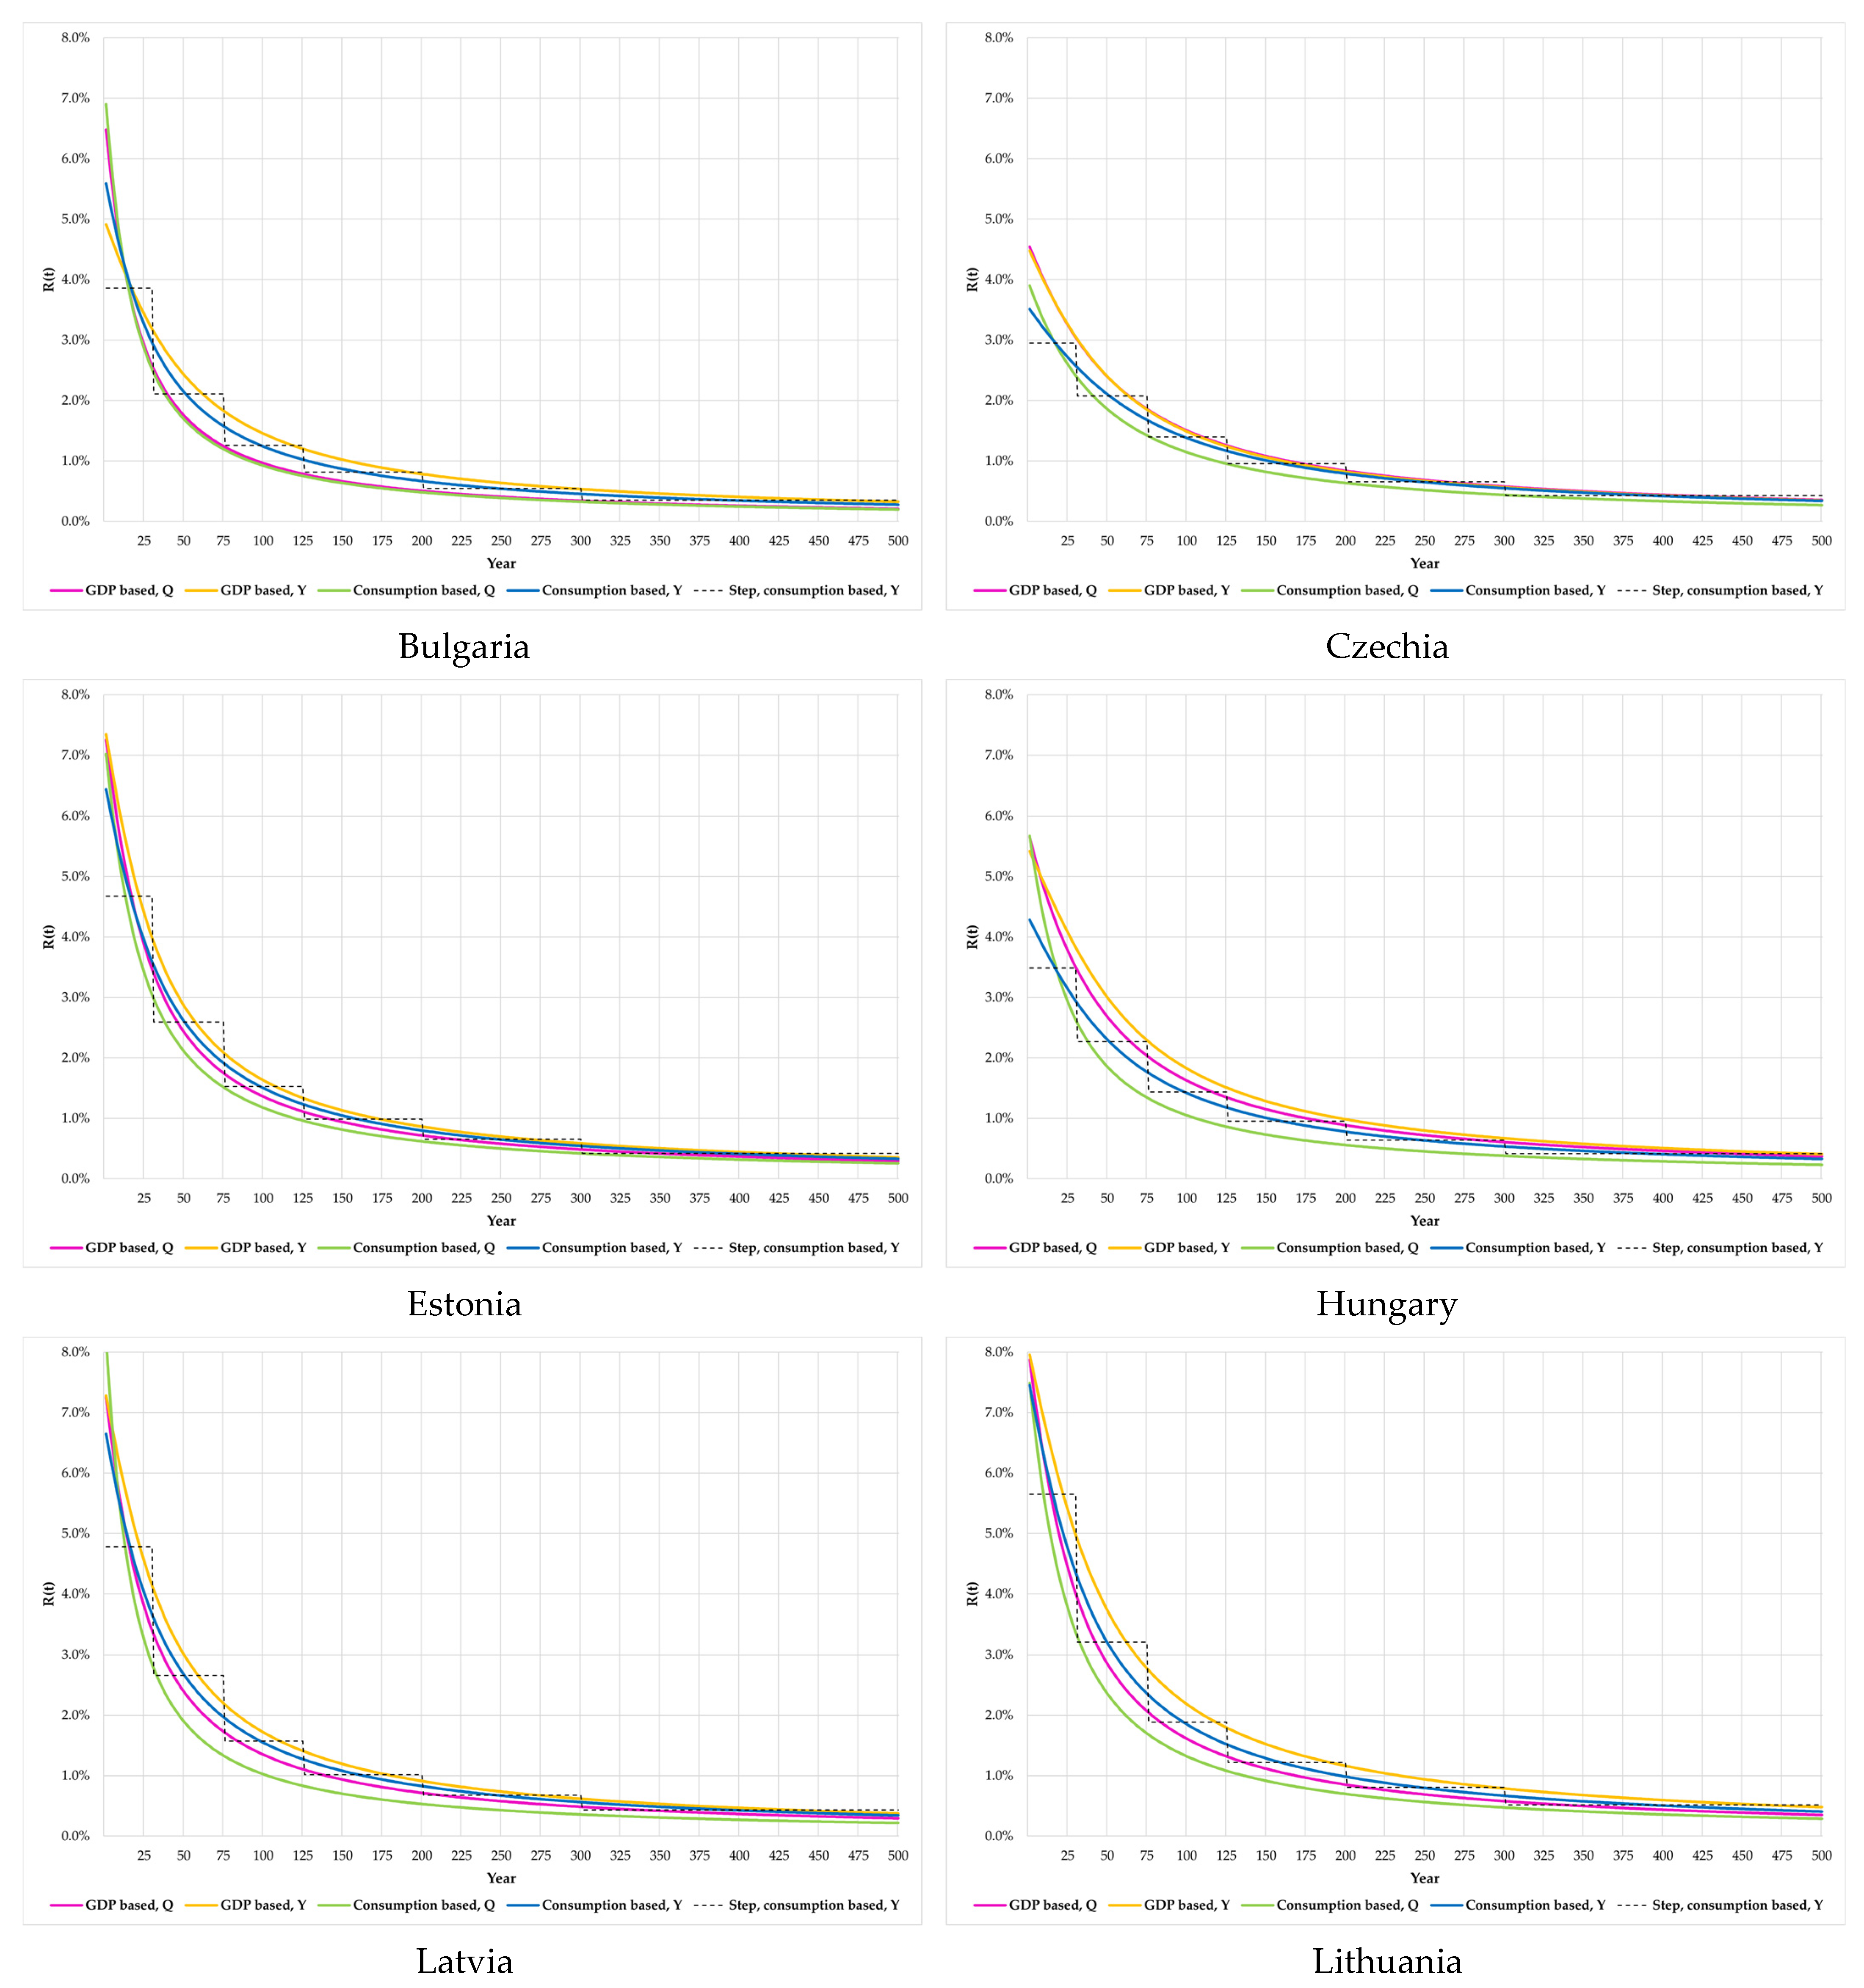
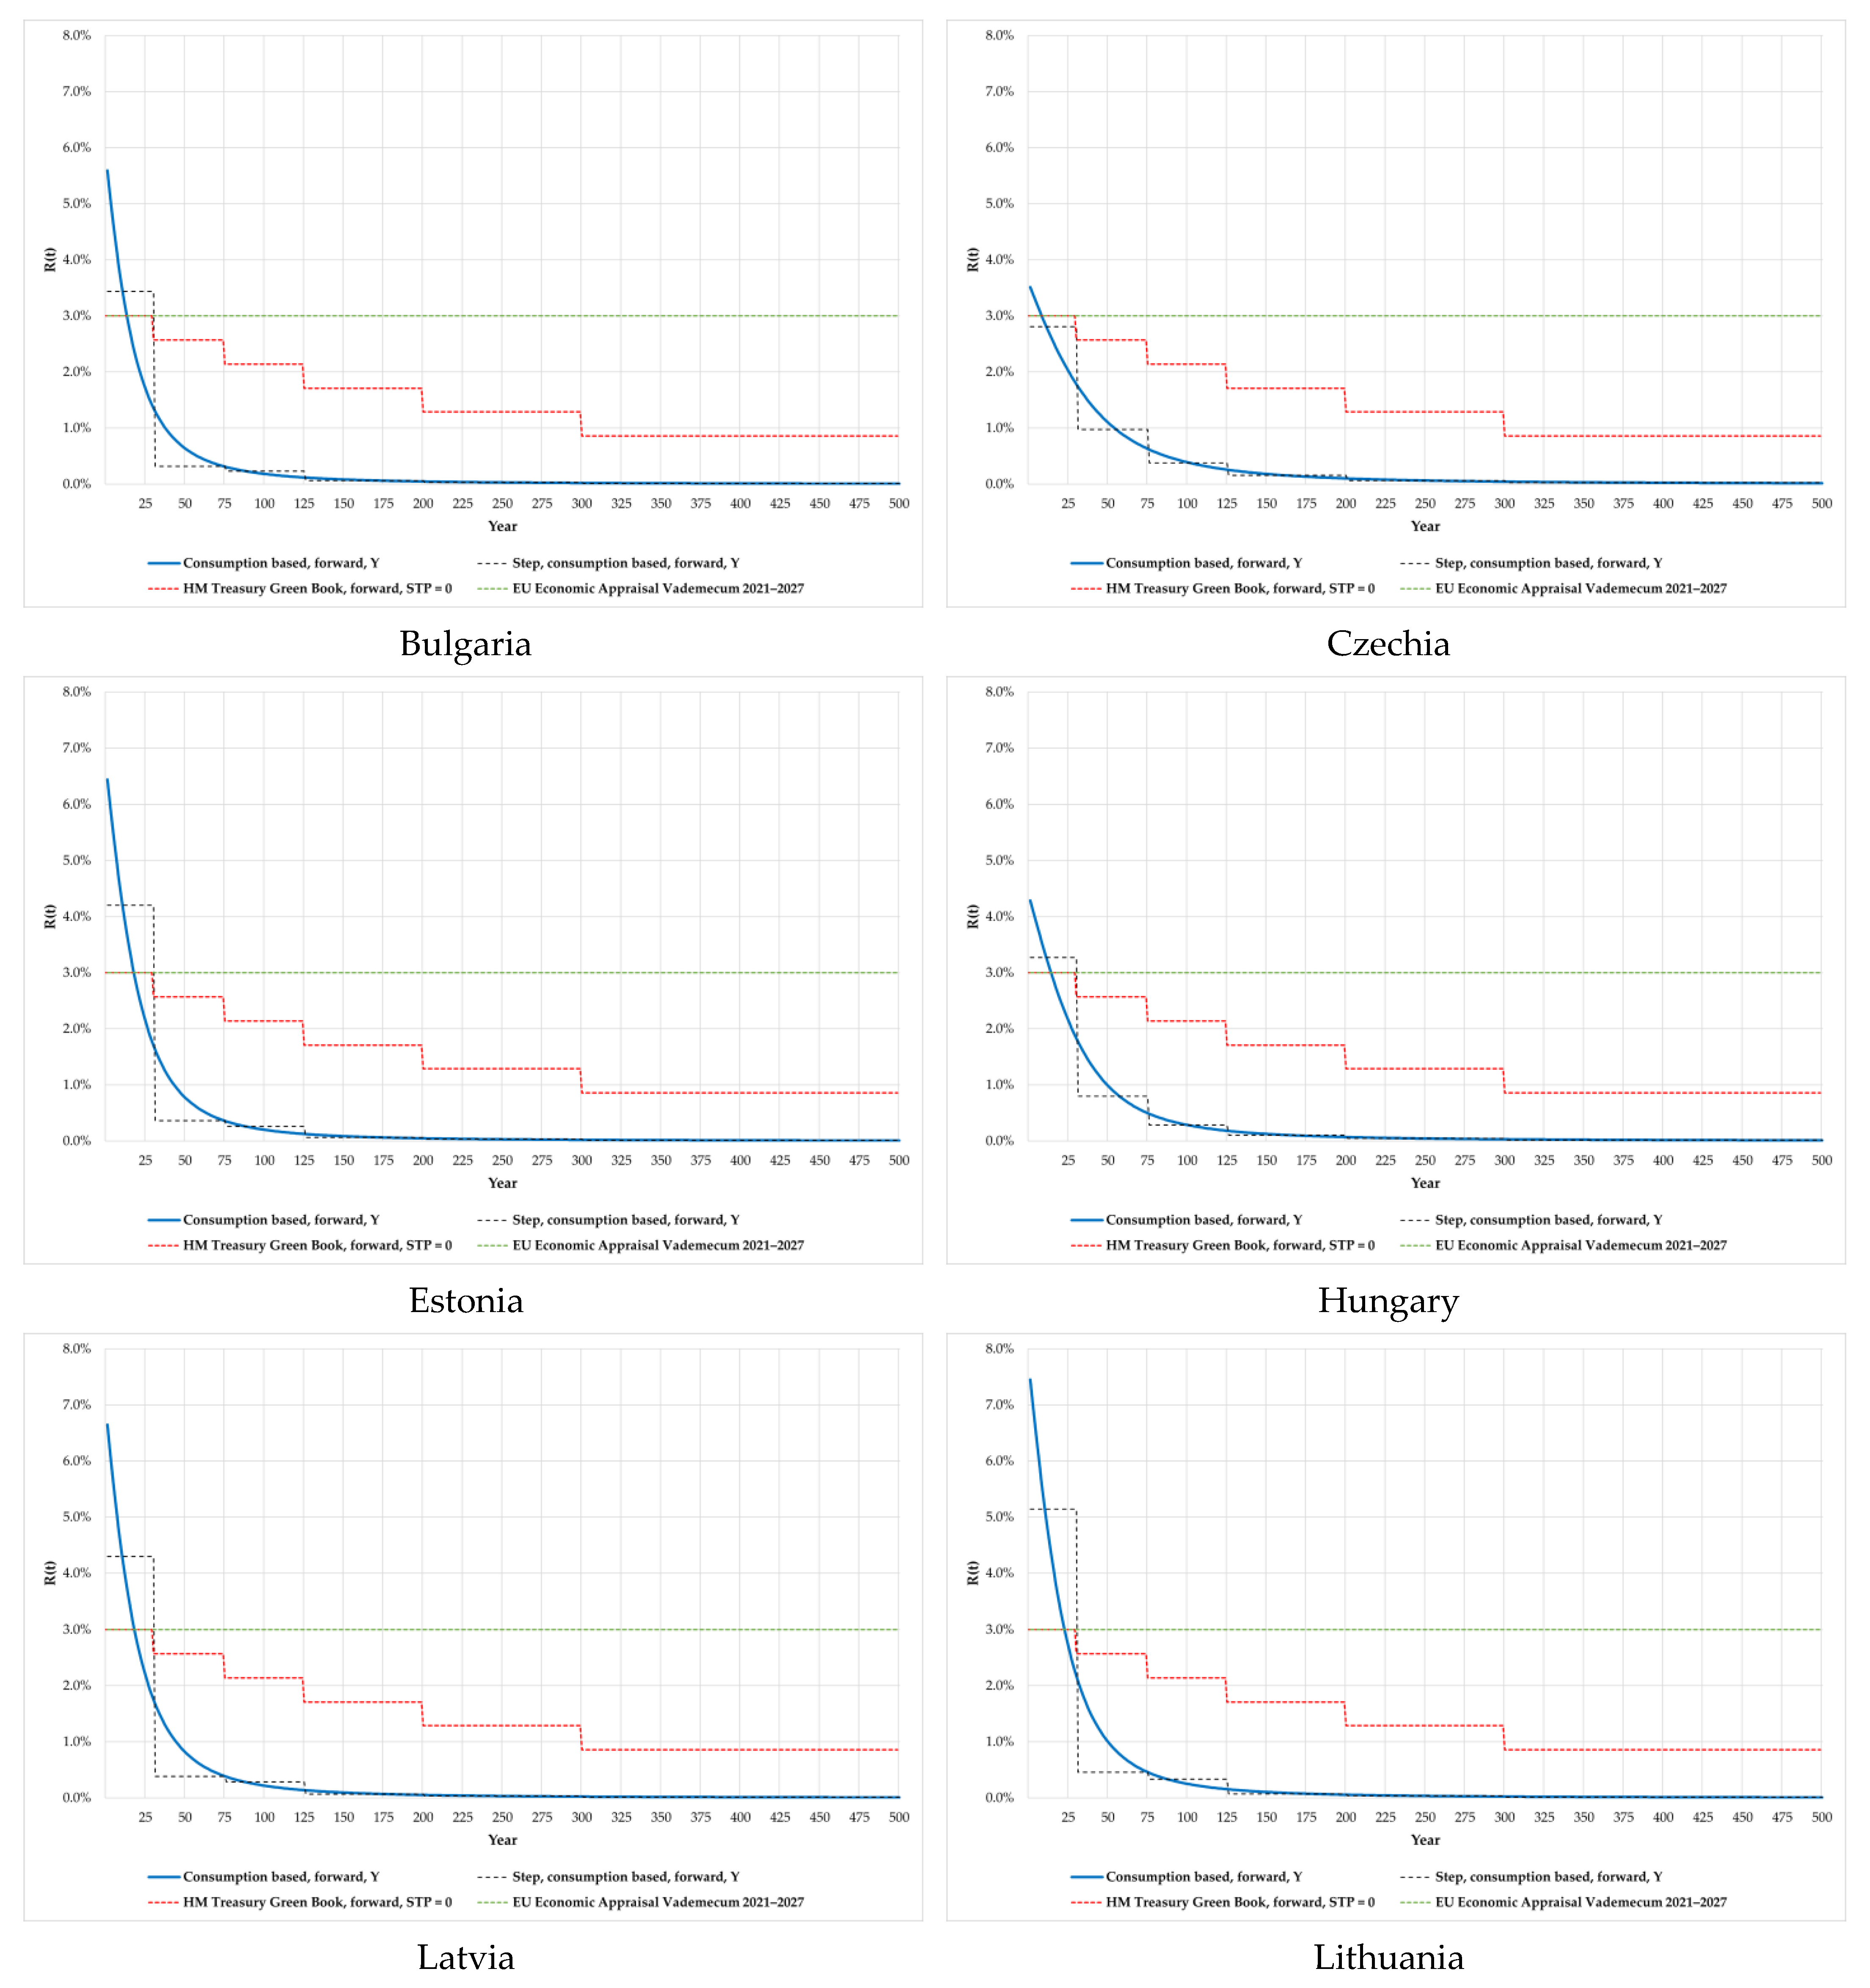
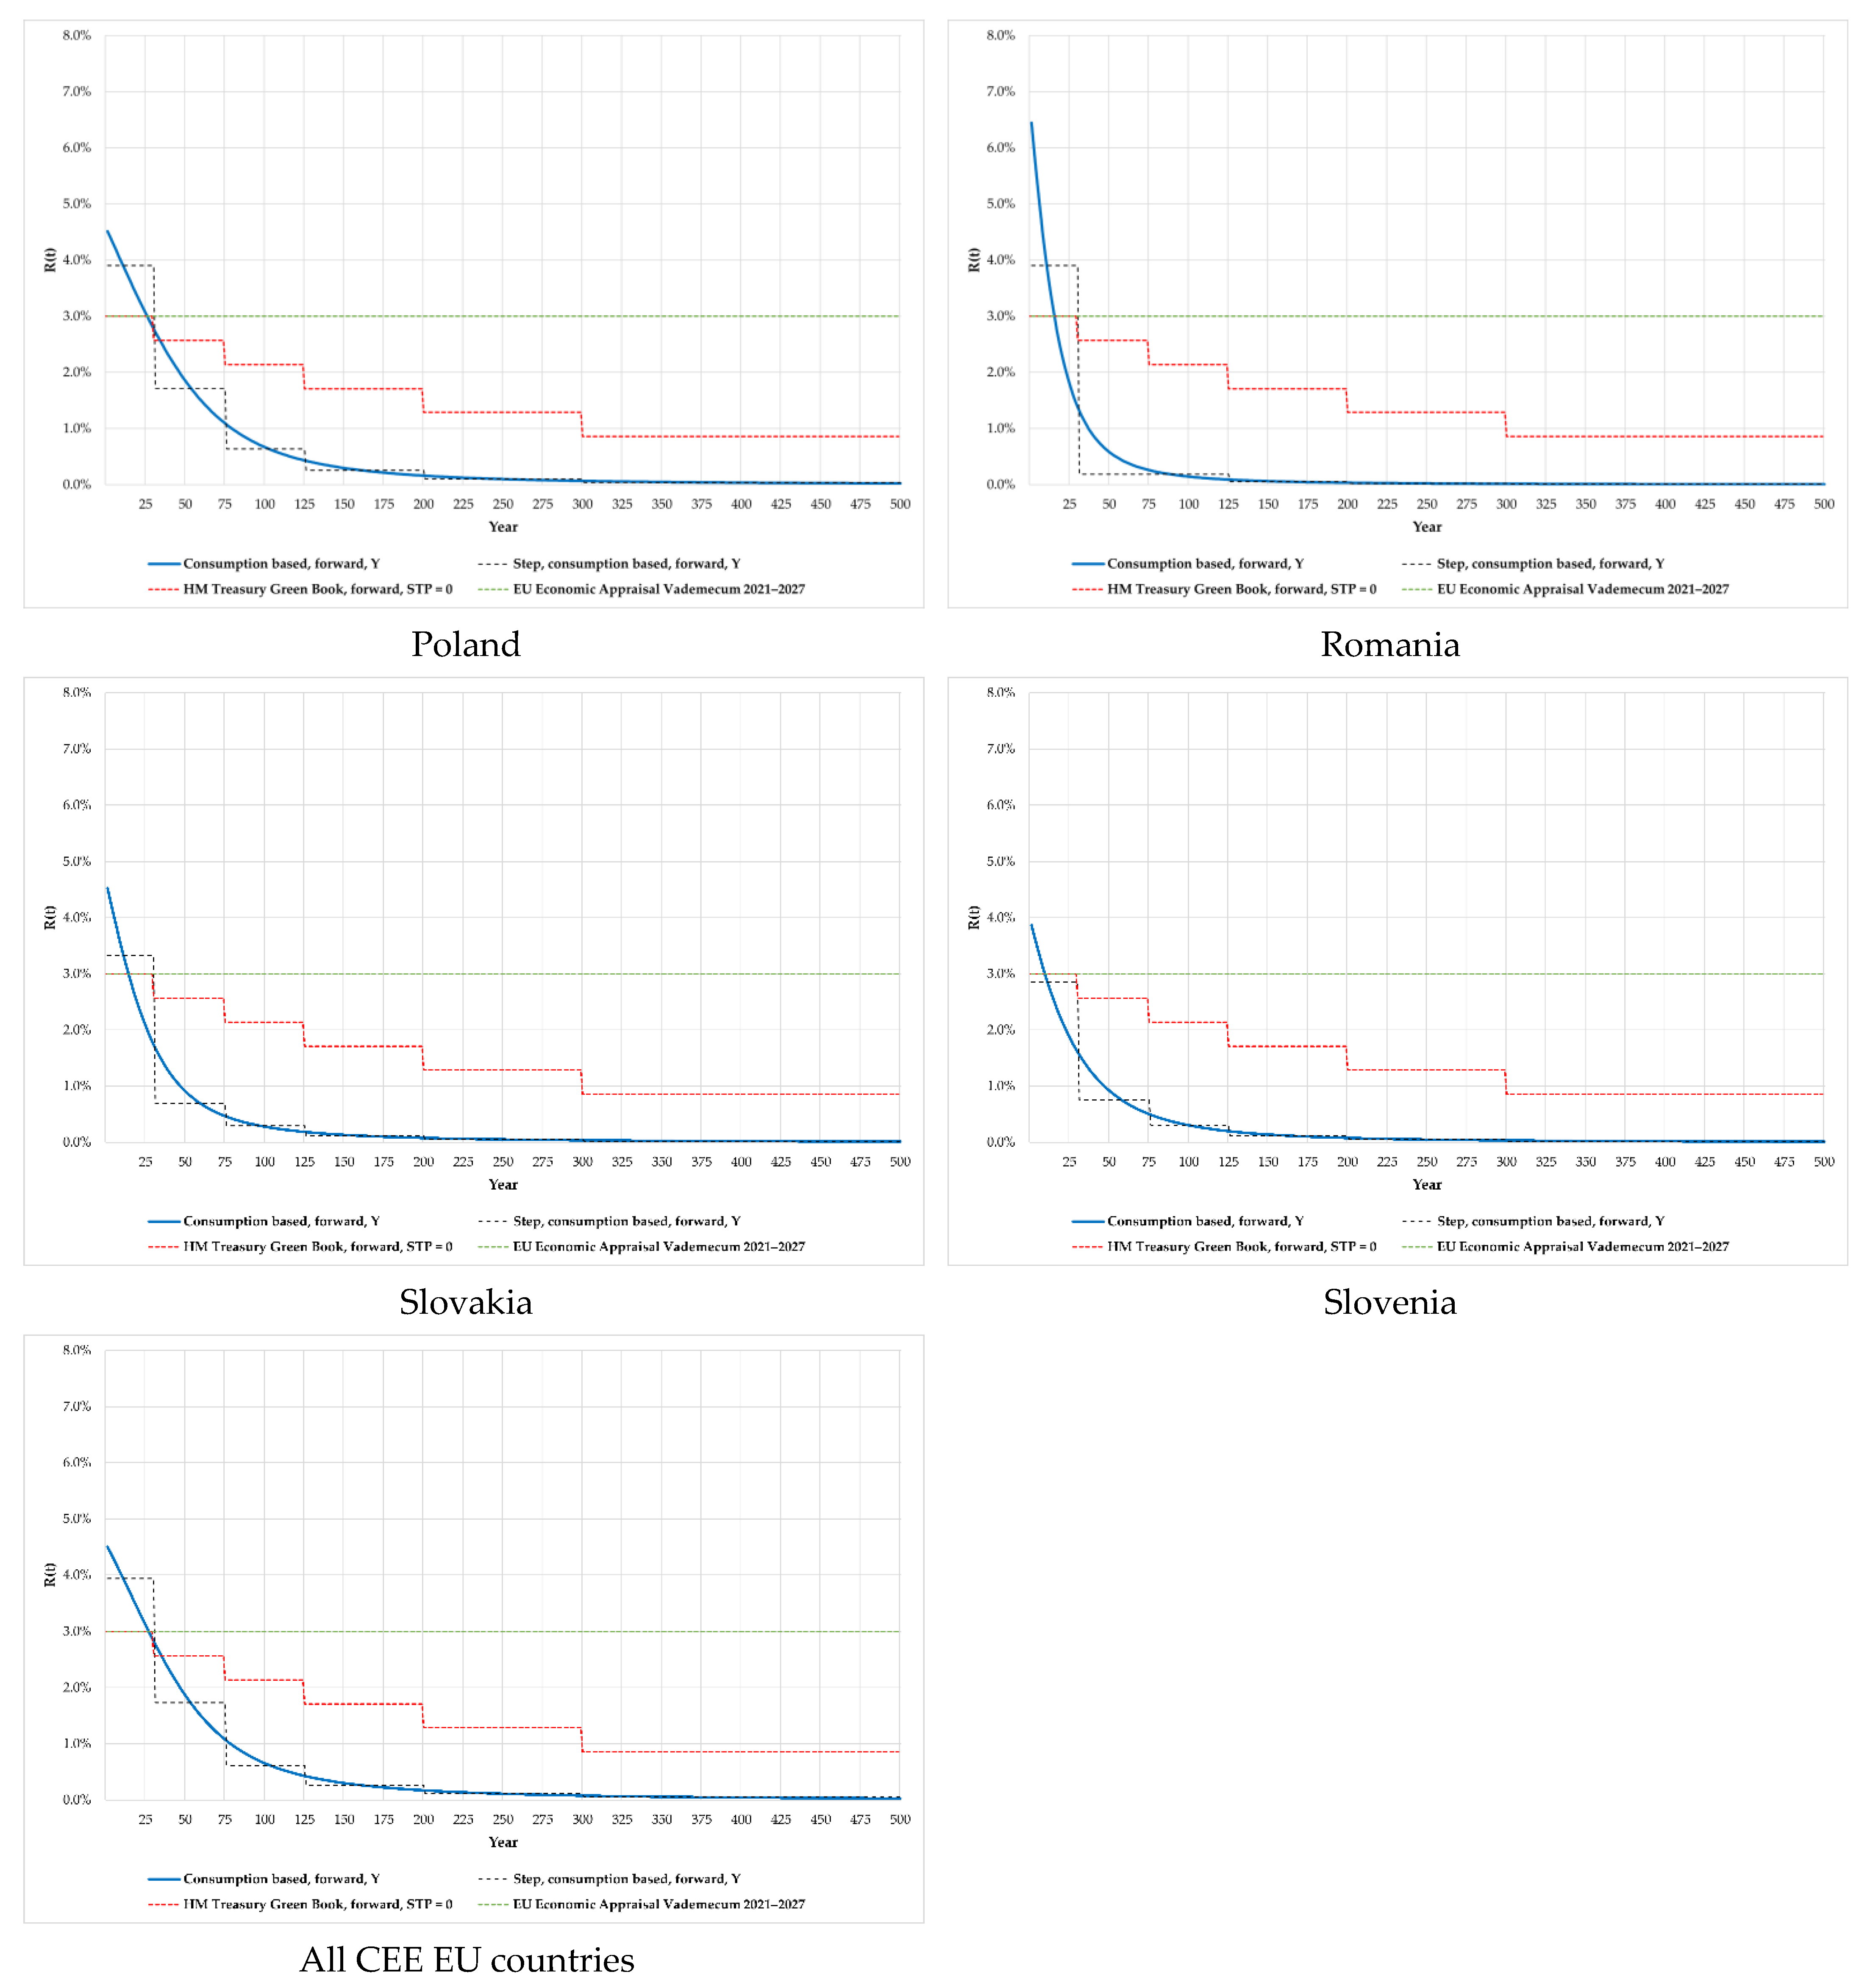
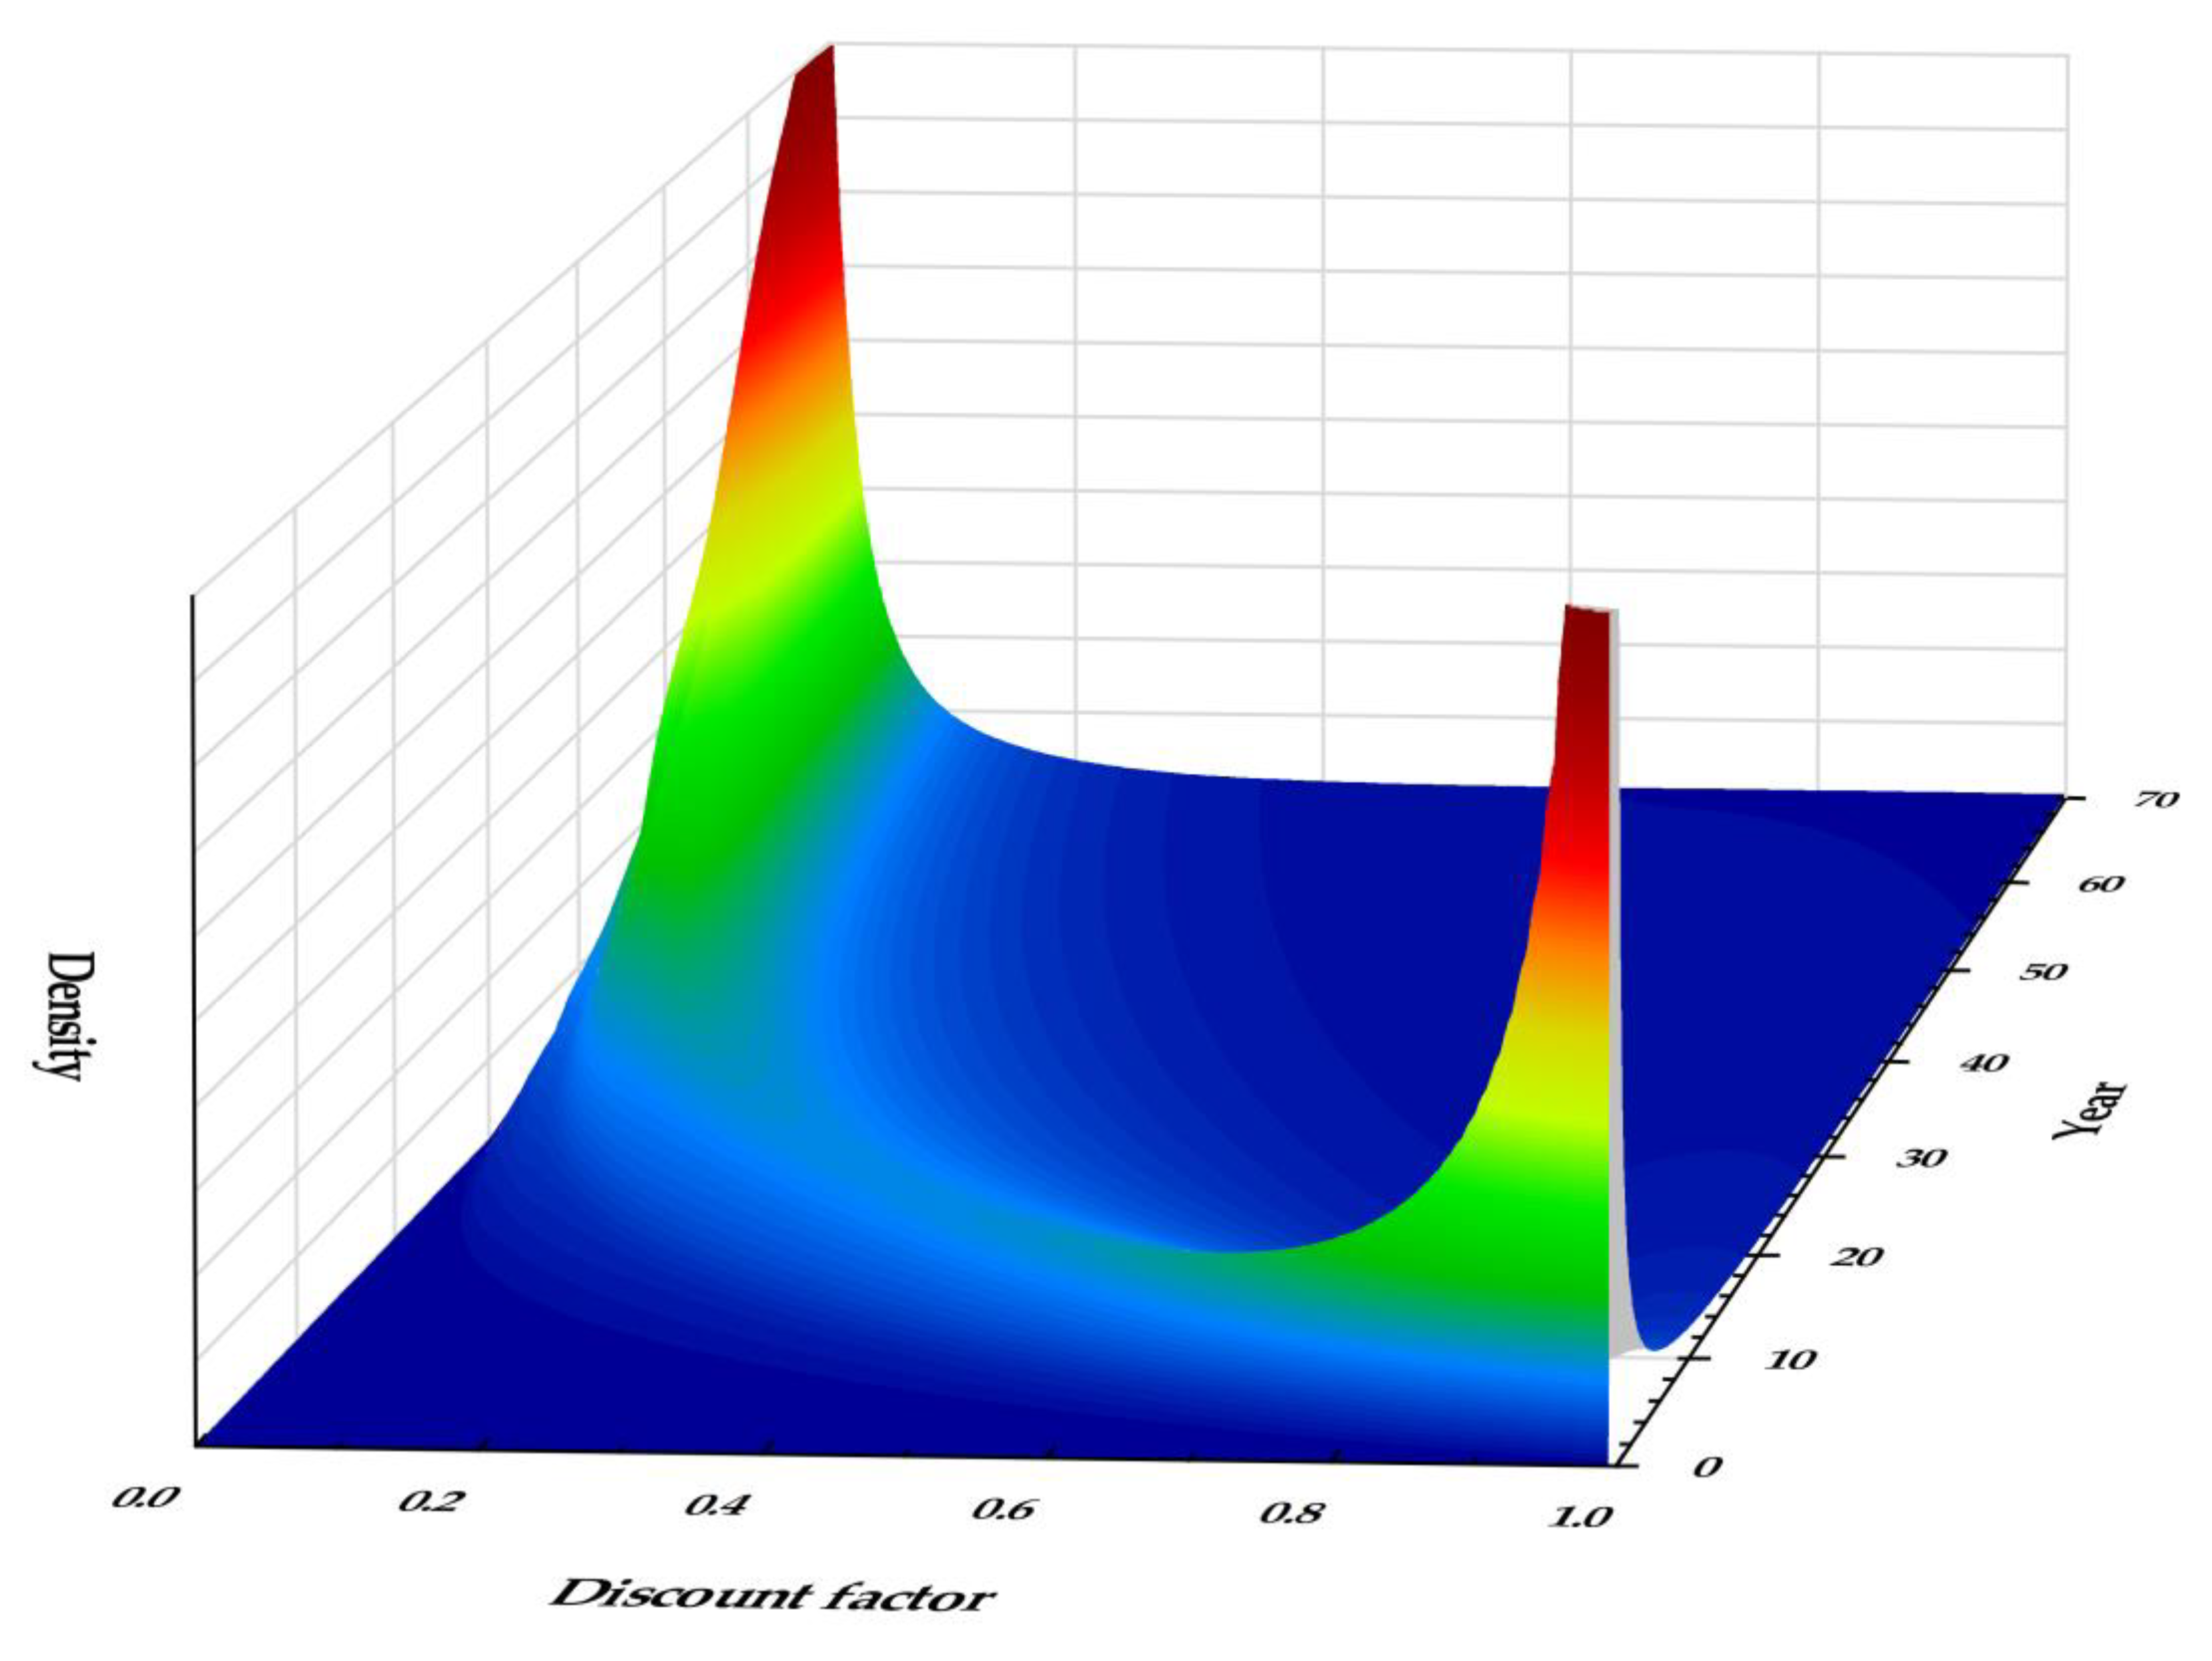
4.2. Estimation of Declining SDR

The ENPV approach requires the randomization of discount factors and is usually based on the Monte Carlo simulation regarding per capita consumption growth [76]. One of the employed techniques is fitting a known probability distribution to empirical data and then drawing future growth rates using the fitted distribution (see, e.g., [24]). We propose a different approach. To avoid restricting the choice of distribution to known distribution families, we would rather use the kernel estimator to obtain a smooth empirical estimate of unknown per capita consumption growth rate distribution. In this study, the Gaussian kernel and the standard optimal bandwidth ( 4 3 n ) 1 / 5 σ ^ were employed. The density and the cumulative distribution functions were estimated in the interval [−100%, 100%], step 0.01%. For quarterly growth rates, a separate distribution was found for every quarter of the year, while for yearly growth rates, one distribution was estimated regarding the whole period. We adopted the Weitzman approach [30], then simulated growth rates using MS Excel, calibrated on 10,000 trials. A detailed description of the results obtained is presented in Table 5.
As the support of the empirical distributions obtained (−∞, +∞) was restricted for practical reasons to [−100%, 100%], we also observed negative growth rates among the simulated values. Including these results in our final calculation would have resulted in exploding discount factors depressing the certainty equivalent rate deeply below zero. There are different possible solutions to this problem. One of them, applied by Maselli and Nesticὸ [24], is to ignore the negative outcomes. This approach brings the risk of inflating the SDR. In our opinion, the lowest possible SDR, in this case, is zero, and therefore, we replaced negative values with zeros as proxies. As a result, the distribution of the SDR became a mixture of continuous and discrete concentrated in 0. Following Weitzman’s argument [30], the SDR limiting value in infinity is 0. Assuming that the probability of each scenario was equal, we calculated the expected discount factors and, consequently, certainty equivalent SDRs. The results for the next 500 years and their step approximation are depicted in Figure 4 and Table 6.
As various sources use forward rates rather than spot ones (e.g., [94]), we also calculated these. We followed the HM Treasury Green Book and assumed that forward SDRs could be represented by a step function (the same time intervals were employed: 1–30, 31–75, 76–125, 126–200, 201–300, and 301–500). To find the values of forward SDRs, we minimized the expression under the condition that forward rates cannot increase with time:
Ψ ( D F ) = t = 1 500 ( D F t D F t ¯ ) 2
where DF represents the discount factor, while the DF ¯ is the fitted discount factor. The results are shown in Table 7 and Figure 5.
To compare the potential influence of applying our estimates to the assessment of various phenomena, the ratio of the discount factor, obtained assuming a constant SDR equal to 3% or to the mean of simulated values to the discount factor, corresponding to a declining SDR was calculated. The calculation is depicted in Figure 6, and the chosen values are given in Table 8.

5. Discussion

In this study, we delivered new estimates for the SDR for ten CEE EU members and employ the ENPV approach to find the declining SDRs based on the Ramsey-Gollier formula. This discussion provides comparisons with other studies and the advantages and limitations of these approaches.
While analysing the estimates obtained via the Ramsey-Gollier formula, the dispersion of the results must be emphasized. The highest values were obtained for Latvia, Lithuania, and Romania, while the lowest were for Bulgaria, Czechia, and Slovenia. These differences are caused mainly by the variability of per capita consumption growth rates between countries and, to a lesser extent, by differences in the elasticity of marginal utility of consumption (see Figure 7). The remaining factors (mortality rate and precautionary term) are negligible in the majority of cases.
Our estimates in most cases are coherent with the results delivered by other authors [13,22,95,96,97] (see Figure 8) with the notable exceptions of Lithuania, Czechia, and Slovakia (we did not include the results of Addicott et al. [98], as they are based on the common elasticity assumption of the marginal consumption utility across the world). In the case of Lithuania, the discrepancy resulted from [96] employing the food demand method as an estimating method of the elasticity of marginal utility of consumption. Regarding Czechia and Slovakia, the discrepancy emerged due to different historical per capita consumption growth rates. The differences cannot be attributed to the precautionary effect, which was approximately 0.15% on average. This means that the relatively stable evolution of the consumption path does not heavily influence the SDRs obtained.
When analysing the declining discount rates, it must be observed that they diminish over time to zero (this result is even more visible in the case of forward rates). It is not surprising in light of Weitzman’s proof [30], as our procedure of replacing negative values with zeros introduced a positive probability to the zero-growth scenario (see the estimated probability density function of simulated discount factors for all CEE EU countries depicted in Figure 9). This could be perceived as a potential advantage of our approach. Furthermore, countries that should apply the highest SDR in the short term do not necessarily have the highest suggested rate in the long term. For short-term decisions (approx. up to 30 years), the highest SDRs were obtained for Baltic states (we observed the highest rate in the case of Lithuania), but when looking at the long-term decisions, the Hungarian SDR is the one with the most depressing discount factors. The lowest in the long-term is the Bulgarian SDR, which is not surprising as the Bulgarian per capita consumption distribution function has the highest probability of the growth rate falling below zero. What may also be of particular interest to policymakers is the rapid decline in the forward rate level in all cases. In the first 30-year period, the average fitted forward SDR was 3.71%, but in the following half-century, it dropped to 0.66% (the maximum value equalled 1.71%). In years 76–125, the average reached the level of 0.32% (while the maximum value equalled 0.64%), but past year 126, they did not exceed 0.25% (or 0.10% past year 201). This decrease is extremely fast when compared, e.g., to the regulations included in the HM Treasury Green Book [94] (see Figure 5), which assumes the SDR diminishing to 0.86% after 300 years.
To compare the previously proposed solutions and our estimates, the ratios of appropriate discount factors were calculated (Figure 6). The discount factor calculated using the average SDR fell to less than 50% of the discount factor obtained using the ENPV approach after 50 years. After 100 years, it equalled approx. 9% of the ENPV approach’s discount factor. A different situation occurred in the case of the newly adopted EU economic appraisal SDR [9], as the 3% SDR made the ratio of discount factors initially rise. However, once compared with the previous recommendations for the CEE countries of 4.5–5%, valid till the year 2020 [16], the ratio would decline. Nevertheless, after 55 years, the discount factor obtained by employing the declining SDR became higher than the discount factor calculated using the constant 3% SDR. After 92 years, the last one drops to less than 50% of the declining SDR discount factor.
To make these results more convincing, we calculated the present values of three examples of intergenerational investments, i.e., reducing carbon dioxide emissions based on the social cost of carbon, nuclear decommissioning, and nuclear decommissioning delayed by 50 years (Table 9, data about projected cash flows were taken from [19]). If we considered the relatively short-lived project of nuclear decommissioning (up to 100 years), the values obtained using three approaches, the Ramsey-Gollier SDR, the declining SDR, and the constant 3% SDR, were similar to the highest present value received in the last case. However, the same project delayed by half a century brought approx. 46% more if we compare the declining SDR to the constant 3% SDR, or 286% more when compared to the Ramsey-Gollier SDR case. The long-term effects of the declining SDR became more visible when we considered the social cost of carbon. In this case, the declining SDR gave a result higher by 167% than the constant 3% SDR.
When discussing the limitations and advantages of our results, it must be pointed out that they are based on Ramsey’s approach, which is often considered a descriptive approach, resting (as a CBA itself) on neoclassical assumptions of self-centred rational agents and consequentialism, which limits the theoretical basis for open inclusion of future generations in investment decisions [27,99]. The Ramsey rule and the ENPV approach, even if the latter led to an SDR regime declining over time, do not make any explicit normative judgements about intergenerational justice (except for fairly widespread agreement on applying a zero pure time preference rate for longer, intergenerational timeframes). The decline is justified by the uncertainty over future discount rates; therefore, intergenerational ethical considerations may enter the results only indirectly. This could be perceived both as advantageous and disadvantageous. The upper hand of our study is the resistance to the implicit prescriptive assumptions over the probability distribution, as we based our calculations on the kernel estimator. The only assumption required here is that the historical data give a satisfactorily close approximation of predicted future discount rates. The limitation can be ascribed to the elasticity of the marginal utility of consumption calculation method, which is based on historical tax data in our study, reflecting the society’s inequality aversion intragenerationally rather than intergenerationally. However, since the preferences of unborn people are not available for obvious reasons, this flaw is permanent, applying the preferences of current generations to all studies on long-term discounting. Last but not least, as of yet, the results are not tested on real-life primary data case studies, and Table 9 bases the calculations on secondary data taken from Freeman and Groom’s study [19]. The analysis of energy policy or investment in a selected CEE EU member country or countries could form a promising direction for future research.

6. Conclusions

The problem of determining the correct level of discount rate is crucial to making decisions aimed at maximizing social utility welfare. The choice between current consumption and investment becomes increasingly complex as the time horizon of various investment projects lengthens. This problem heavily influences energy transition policies, as the investment projects in this sector usually influence not only the current or next generation but also the generations living in the far-distant future. One of the widely discussed economic issues of current times is reaching the climate neutrality objective through increased energy efficiency and exploiting renewable and clean energy sources. Due to its multidimensionality, the challenges created are not only environmental but also social and economic. Among the questions to be answered is not only what the level of investment in energy production should be but also which energy sources are preferable. As lengthening a project’s time horizon makes it more vulnerable to the choice of the discount rate, the decision to adopt a certain level of SDR becomes a central one. This burning problem is especially relevant in the former socialist CEE EU countries due to their non-renewable-based energy sector and below-average efficiency of carbon dioxide emissions. As a consequence, the main aim of this study was to investigate the issue of determining an SDR for CEE EU countries.
This paper describes different approaches to the problem mentioned, starting with the widely known Ramsey prescriptive approach. As his method seems to produce a constant discount rate too high, even if extended to reflect the influence of uncertainty, we followed another path leading to the declining SDR. We found the ENPV concept a promising choice, producing a declining certainty equivalent rate if applied, assuming the uncertainty of the future evolution of interest rates. The ENPV idea was implemented to estimate SDRs for ten CEE EU countries. This was the first time the declining SDR scheme was suggested to be applied in the case of these EU members. The results obtained via the Monte Carlo simulation showed that even though the initial level of the SDR (for short-term investments) varies among the countries analysed, it finally approaches zero as the time horizon goes to infinity. This is a result of excluding negative rates by replacing them with zeros. This feature of our method can be treated as an advantage or a drawback. On the one hand, the replacement decision can be perceived as an arbitrary one. On the other hand, the assumption of a negative growth rate of the economy could result in negative discount rates that would result in “infinitely large” investments and contradict general economic assumptions of a positive economic growth rate. Since, in the case of climate change, some analyses assume catastrophic scenarios and the plunge of the per capita growth rate, the issue deserves a separate study.
Our procedure limits unfavourable states of the economy, making the results obtained by using this approach more prudent by slightly increasing SDRs. Our short-term estimates are similar to the results obtained by other researchers. The situation is quite different in the long term, especially if we compare the forward rates. The ENPV method led to SDRs falling rapidly and notably increasing the level of discount factors, even if the lowered 3% EU appraisal rate was applied instead of the Ramsey (or Ramsey-Gollier) estimate. As a consequence, our results provide additional support for using the declining discount rates scheme in evaluating energy investments. They also justify lowering the basic EU discount rate from 5% to 3%, although, in our opinion, it should be additionally lowered or replaced with declining discount rates for long-term investments. This study is also important to policymakers as it provides a rationale for the application of declining SDRs, as well as the necessary estimates that could be implemented, e.g., as a part of the EU or national energy policies. Thus, we strongly advocate an introduction of a new scheme of SDRs in the investment appraisal process, especially in climate change mitigation and energy-related investments. The estimates obtained can be included at the national level, e.g., in EU investment appraisal handbooks. The declining SDR scheme sometimes seems more complicated than a single rate scheme, although this is not a serious obstacle as it has been used in a few countries for some time [15].
Furthermore, our study results in a more balanced view of long-term and short-term investments. We also advocate using a non-parametric approach to simulate the discount rates used to calculate the certainty equivalent rate. In our opinion, this method is more reliable than fitting a known probability distribution to growth data, as it makes the sample more reflective of the original data pattern. As a result, the probability that long-term investments will be rejected in favour of short-term ones, as frequently as it occurs nowadays, decreases, and policymakers have the incentive to evaluate the investment in a more forward-looking manner.

Author Contributions

Conceptualization, M.F.-Z.; methodology, R.B. and M.F.-Z.; software, R.B.; validation, R.B.; formal analysis, R.B. and M.F.-Z.; investigation, R.B. and M.F.-Z.; resources, R.B. and M.F.-Z.; data curation, R.B. and M.F.-Z.; writing—original draft preparation, R.B. and M.F.-Z.; writing—review and editing, R.B. and M.F.-Z.; visualization, R.B.; supervision, R.B. and M.F.-Z.; project administration, R.B. and M.F.-Z.; funding acquisition, R.B. All authors have read and agreed to the published version of the manuscript.

Funding

This research received no external funding.

Data Availability Statement

The authors declare that open access databases used in this study are: the Organisation for Economic Co-operation and Development database (2022), the Population Division of the Department of Economic and Social Affairs of the United Nations Secretariat database (2022), and the Our World in Data database (2022).

Conflicts of Interest

The authors declare no conflict of interest.

References

  1. Steffen, B.; Patt, A. A Historical Turning Point? Early Evidence on How the Russia-Ukraine War Changes Public Support for Clean Energy Policies. Energy Res. Soc. Sci. 2022, 91, 102758. [Google Scholar] [CrossRef]
  2. Żuk, P.; Żuk, P. National Energy Security or Acceleration of Transition? Energy Policy after the War in Ukraine. Joule 2022, 6, 709–712. [Google Scholar] [CrossRef]
  3. Zakeri, B.; Paulavets, K.; Barreto-Gomez, L.; Echeverri, L.G.; Pachauri, S.; Boza-Kiss, B.; Zimm, C.; Rogelj, J.; Creutzig, F.; Ürge-Vorsatz, D. Pandemic, War, and Global Energy Transitions. Energies 2022, 15, 6114. [Google Scholar] [CrossRef]
  4. Kong, D.; Yang, X.; Xu, J. Energy Price and Cost Induced Innovation: Evidence from China. Energy 2020, 192, 116586. [Google Scholar] [CrossRef]
  5. Peña-Ramos, J.A.; del Pino-García, M.; Sánchez-Bayón, A. The Spanish Energy Transition into the EU Green Deal: Alignments and Paradoxes. Energies 2021, 14, 2535. [Google Scholar] [CrossRef]
  6. Ostrowski, W. The Twenty Years’ Crisis of European Energy Security: Central and Eastern Europe and the US. Geopolitics 2022, 27, 875–897. [Google Scholar] [CrossRef]
  7. Ciołek, M.; Emerling, I.; Olejko, K.; Sadowska, B.; Wójcik-Jurkiewicz, M. Assumptions of the Energy Policy of the Country versus Investment Outlays Related to the Purchase of Alternative Fuels: Poland as a Case Study. Energies 2022, 15, 1945. [Google Scholar] [CrossRef]
  8. Delivering the European Green Deal. Available online: https://ec.europa.eu/info/strategy/priorities-2019-2024/european-green-deal/delivering-european-green-deal_en (accessed on 15 November 2022).
  9. Economic Appraisal Vademecum 2021–2027—General Principles and Sector Applications; European Commission: Brussels, Belgium, 2021.
  10. Gardiner, S.M. A Perfect Moral Storm: Climate Change, Intergenerational Ethics and the Problem of Moral Corruption. Environ. Values 2006, 15, 397–413. [Google Scholar] [CrossRef] [Green Version]
  11. Taebi, B. Intergenerational Risks of Nuclear Energy. In Handbook of Risk Theory Epistemology, Decision Theory, Ethics, and Social Implications of Risk; Roeser, S., Hillerbrand, R., Sandin, P., Peterson, M., Eds.; Springer: Dordrecht, The Netherlands; Heidelberg, Germany; London, UK; New York, NY, USA, 2012; pp. 295–318. [Google Scholar]
  12. van den Bergh, J.C.J.M.; Botzen, W.J.W. Monetary Valuation of the Social Cost of CO2 Emissions: A Critical Survey. Ecol. Econ. 2015, 114, 33–46. [Google Scholar] [CrossRef]
  13. Florio, M.; Sirtori, E. The Social Cost of Capital: Recent Estimates for the EU Countries; CSIL Centre for Industrial Studies: Milano, Italy, 2013. [Google Scholar]
  14. Florio, M. Applied Welfare Economics: Cost-Benefit Analysis of Projects and Policies; Routledge: New York, NY, USA, 2014; ISBN 1-317-81425-8. [Google Scholar]
  15. Catalano, J.; Pancotti, C. Estimation of SDR in Selected Countries; Working Papers; CSIL Centre for Industrial Studies: Milano, Italy, 2022. [Google Scholar]
  16. Guide to Cost-Benefit Analysis of Investment Projects. Economic Appraisal Tool for Cohesion Policy 2014–2020; European Commission: Brussels, Belgium, 2015.
  17. The Green Book Central Government Guidance on Appraisal and Evaluation 2020; HM Treasury: London, UK, 2020.
  18. Arrow, K.; Cropper, M.; Gollier, C.; Groom, B.; Heal, G.; Newell, R.; Nordhaus, W.; Pindyck, R.; Pizer, W.; Portney, P.; et al. Determining Benefits and Costs for Future Generations. Science 2013, 341, 349–350. [Google Scholar] [CrossRef]
  19. Freeman, M.C.; Groom, B. Positively Gamma Discounting: Combining the Opinions of Experts on the Social Discount Rate. Econ. J. 2015, 125, 1015–1024. [Google Scholar] [CrossRef] [Green Version]
  20. Gollier, C.; Hammitt, J.K. The Long-Run Discount Rate Controversy. Annu. Rev. Resour. Econ. 2014, 6, 273–295. [Google Scholar] [CrossRef] [Green Version]
  21. Circular A-4. Available online: https://obamawhitehouse.archives.gov/node/15644 (accessed on 26 October 2022).
  22. Seçilmiş, E.; Akbulut, H. Social Discount Rates for Six Transition Countries. Ekon. Cas. 2019, 67, 629–646. [Google Scholar]
  23. Foltyn-Zarychta, M.; Buła, R.; Pera, K. Discounting for Energy Transition Policies—Estimation of the Social Discount Rate for Poland. Energies 2021, 14, 741. [Google Scholar] [CrossRef]
  24. Maselli, G.; Nesticò, A. The Role of Discounting in Energy Policy Investments. Energies 2021, 14, 6055. [Google Scholar] [CrossRef]
  25. Moser, C.; Stauffacher, M.; Smieszek, T.; Seidl, R.; Krütli, P.; Scholz, R.W. Psychological Factors in Discounting Negative Impacts of Nuclear Waste. J. Environ. Psychol. 2013, 35, 121–131. [Google Scholar] [CrossRef]
  26. Foltyn-Zarychta, M. Future-Generation Perception: Equal or Not Equal? Long-Term Individual Discount Rates for Poland. Energies 2021, 14, 8218. [Google Scholar] [CrossRef]
  27. Foltyn-Zarychta, M. Ocena Inwestycji Międzypokoleniowych-Kryteria Etyczne w Ekonomicznej Ocenie Efektywności Projektów Inwestycyjnych; C.H. Beck: Warszawa, Poland, 2018. [Google Scholar]
  28. Ramsey, F.P. A Mathematical Theory of Saving. Econ. J. 1928, 38, 543–559. [Google Scholar] [CrossRef]
  29. Gollier, C. Pricing the Planet’s Future: The Economics of Discounting in an Uncertain World; Princeton University Press: Princeton, NJ, USA, 2012; ISBN 978-1-4008-4540-8. [Google Scholar]
  30. Weitzman, M.L. Why the Far-Distant Future Should Be Discounted at Its Lowest Possible Rate. J. Environ. Econ. Manag. 1998, 36, 201–208. [Google Scholar] [CrossRef] [Green Version]
  31. Primary Energy Consumption by Source. Available online: https://ourworldindata.org/grapher/primary-energy-source-bar (accessed on 1 November 2022).
  32. Statistical Review of World Energy|Energy Economics|Home. Available online: https://www.bp.com/en/global/corporate/energy-economics/statistical-review-of-world-energy.html (accessed on 1 November 2022).
  33. Andrew, R.; Peters, G. The Global Carbon Project’s Fossil CO2 Emissions Dataset; CICERO Center for International Climate Research: Oslo, Norway, 2021. [Google Scholar] [CrossRef]
  34. Friedlingstein, P.; Jones, M.W.; O’Sullivan, M.; Andrew, R.M.; Bakker, D.C.E.; Hauck, J.; Le Quéré, C.; Peters, G.P.; Peters, W.; Pongratz, J.; et al. Global Carbon Budget 2021. Earth Syst. Sci. Data 2021, 14, 1917–2005. [Google Scholar] [CrossRef]
  35. Available online: https://www.iea.org/data-and-statistics/data-product/co2-emissions-from-fuel-combustion-highlights (accessed on 1 November 2022).
  36. Energy Policy: General Principles|Fact Sheets on the European Union|European Parliament. Available online: https://www.europarl.europa.eu/factsheets/en/sheet/68/energy-policy-general-principles (accessed on 1 November 2022).
  37. Energy and the Green Deal. Available online: https://ec.europa.eu/info/strategy/priorities-2019-2024/european-green-deal/energy-and-green-deal_en (accessed on 1 November 2022).
  38. European Commision 2050 Long-Term Strategy. Available online: https://climate.ec.europa.eu/eu-action/climate-strategies-targets/2050-long-term-strategy_en (accessed on 1 November 2022).
  39. Espinosa, V.I.; Peña-Ramos, J.A.; Recuero-López, F. The Political Economy of Rent-Seeking: Evidence from Spain’s Support Policies for Renewable Energy. Energies 2021, 14, 4197. [Google Scholar] [CrossRef]
  40. The European Green Deal. Available online: https://ec.europa.eu/commission/presscorner/detail/en/ip_19_6691 (accessed on 1 November 2022).
  41. Proposal for a Regulation of the European Parliament and of the Council Establishing the Just Transition Fund; EU: Brussels, Belgium, 2020.
  42. National Long-Term Strategies. Available online: https://ec.europa.eu/info/energy-climate-change-environment/implementation-eu-countries/energy-and-climate-governance-and-reporting/national-long-term-strategies_en (accessed on 1 November 2022).
  43. Atlason, R.S.; Unnthorsson, R. Energy Return on Investment of Hydroelectric Power Generation Calculated Using a Standardised Methodology. Renew. Energy 2014, 66, 364–370. [Google Scholar] [CrossRef]
  44. Jansen, J.; Bakker, S. Social Cost-Benefit Analysis of Climate Change Mitigation Options in a European Context; Energy Research Centre of The Netherlands: The Hague, The Netherlands, 2006. [Google Scholar]
  45. IPCC. Climate Change 2014: Mitigation of Climate Change; Cambridge University Press: Cambridge, UK; New York, NY, USA, 2014; ISBN 978-1-107-05821-7. [Google Scholar]
  46. Ürge-Vorsatz, D.; Tirado Herrero, S. Building Synergies between Climate Change Mitigation and Energy Poverty Alleviation. Energy Policy 2012, 49, 83–90. [Google Scholar] [CrossRef]
  47. Feng, T.; Du, H.; Coffman, D.; Qu, A.; Dong, Z. Clean Heating and Heating Poverty: A Perspective Based on Cost-Benefit Analysis. Energy Policy 2021, 152, 112205. [Google Scholar] [CrossRef]
  48. Mishan, E.J. Cost-Benefit Analysis: An Informal Introduction; Praeger Publishers: New York, NY, USA, 1976; ISBN 978-0-275-85690-8. [Google Scholar]
  49. Stern, N. The Economics of Climate Change: The Stern Review; Cambridge University Press: Cambridge, UK, 2007; ISBN 978-0-521-70080-1. [Google Scholar]
  50. Ilg, P.; Gabbert, S.; Weikard, H. Nuclear Waste Management under Approaching Disaster: A Comparison of Decommissioning Strategies for the German Repository Asse II. Risk Anal. 2017, 37, 1213–1232. [Google Scholar] [CrossRef]
  51. Arrow, K.J.; Cropper, M.L.; Gollier, C.; Groom, B.; Heal, G.M.; Newell, R.G.; Nordhaus, W.D.; Pindyck, R.S.; Pizer, W.A.; Portney, P.R.; et al. Should Governments Use a Declining Discount Rate in Project Analysis? Rev. Environ. Econ. Policy 2014, 8, 145–163. [Google Scholar] [CrossRef] [Green Version]
  52. Dasgupta, P. Discounting Climate Change. J. Risk Uncertain. 2008, 37, 141–169. [Google Scholar] [CrossRef] [Green Version]
  53. Lind, R.C.; Arrow, K.J.; Corey, G.R.; Dasgupta, P.; Sen, A.K.; Stauffer, T.; Stiglitz, J.E.; Stockfisch, J.A. Discounting for Time and Risk in Energy Policy; Routledge: New York, NY, USA, 2013; ISBN 1-135-98518-9. [Google Scholar]
  54. Azar, C.; Sterner, T. Discounting and Distributional Considerations in the Context of Global Warming. Ecol. Econ. 1996, 19, 169–184. [Google Scholar] [CrossRef]
  55. Spackman, M. Social Discounting and the Cost of Public Funds: A Practitioner’s Perspective. J. Benefit-Cost Anal. 2020, 11, 244–271. [Google Scholar] [CrossRef]
  56. Poterba, J. The Rate of Return to Corporate Capital and Factor Shares: New Estimates Using Revised National Income Accounts and Capital Stock Data; National Bureau of Economic Research, Inc.: Cambridge, MA, USA, 1999. [Google Scholar]
  57. Kuo, C.-Y.; Jenkins, G.P.; Mphahlele, M.B. The Economic Opportunity Cost of Capital in South Africa. S. Afr. J. Econ. 2003, 71, 523–543. [Google Scholar] [CrossRef]
  58. Burgess, D.F.; Zerbe, R.O. Appropriate Discounting for Benefit-Cost Analysis. J. Benefit-Cost Anal. 2011, 2, 1–20. [Google Scholar] [CrossRef]
  59. Evans, D.J. The Elasticity of Marginal Utility of Consumption: Estimates for 20 OECD Countries. Fisc. Stud. 2005, 26, 197–224. [Google Scholar] [CrossRef]
  60. Nesticò, A.; Maselli, G. A Protocol for the Estimate of the Social Rate of Time Preference: The Case Studies of Italy and the USA. J. Econ. Stud. 2020, 47, 527–545. [Google Scholar] [CrossRef]
  61. Jouini, E.; Marin, J.-M.; Napp, C. Discounting and Divergence of Opinion. J. Econ. Theory 2010, 145, 830–859. [Google Scholar] [CrossRef] [Green Version]
  62. Gollier, C. Time Horizon and the Discount Rate. J. Econ. Theory 2002, 107, 463–473. [Google Scholar] [CrossRef] [Green Version]
  63. Cropper, M.L.; Freeman, M.C.; Groom, B.; Pizer, W.A. Declining Discount Rates. Am. Econ. Rev. 2014, 104, 538–543. [Google Scholar] [CrossRef] [Green Version]
  64. Costanza, R.; Kubiszewski, I.; Stoeckl, N.; Kompas, T. Pluralistic Discounting Recognizing Different Capital Contributions: An Example Estimating the Net Present Value of Global Ecosystem Services. Ecol. Econ. 2021, 183, 106961. [Google Scholar] [CrossRef]
  65. Page, E.A. Climate Change, Justice and Future Generations; Edward Elgar Publishing: Cheltenham, UK, 2006; ISBN 978-1-84542-471-8. [Google Scholar]
  66. Roser, D.; Seidel, C. Climate Justice: An Introduction; Routledge: London, UK, 2016; ISBN 978-1-315-61796-1. [Google Scholar]
  67. Sumaila, U.R.; Walters, C. Intergenerational Discounting: A New Intuitive Approach. Ecol. Econ. 2005, 52, 135–142. [Google Scholar] [CrossRef]
  68. Cropper, M.L.; Aydede, S.K.; Portney, P.R. Preferences for Life Saving Programs: How the Public Discounts Time and Age. J. Risk Uncertain. 1994, 8, 243–265. [Google Scholar] [CrossRef]
  69. Weitzman, M.L. Gamma Discounting. Am. Econ. Rev. 2001, 91, 260–271. [Google Scholar] [CrossRef]
  70. Almansa, C.; Martínez-Paz, J.M. What Weight Should Be Assigned to Future Environmental Impacts? A Probabilistic Cost Benefit Analysis Using Recent Advances on Discounting. Sci. Total Environ. 2011, 409, 1305–1314. [Google Scholar] [CrossRef] [PubMed]
  71. Drupp, M.A.; Freeman, M.C.; Groom, B.; Nesje, F. Discounting Disentangled. Am. Econ. J. Econ. Policy 2018, 10, 109–134. [Google Scholar] [CrossRef] [Green Version]
  72. Rendall, M. Discounting, Climate Change, and the Ecological Fallacy. Ethics 2019, 129, 441–463. [Google Scholar] [CrossRef]
  73. Gollier, C. Discounting an Uncertain Future. J. Public Econ. 2002, 85, 149–166. [Google Scholar] [CrossRef] [Green Version]
  74. Gollier, C. Maximizing the Expected Net Future Value as an Alternative Strategy to Gamma Discounting. Financ. Res. Lett. 2004, 1, 85–89. [Google Scholar] [CrossRef] [Green Version]
  75. Gollier, C.; Weitzman, M.L. How Should the Distant Future Be Discounted When Discount Rates Are Uncertain? Econ. Lett. 2010, 107, 350–353. [Google Scholar] [CrossRef] [Green Version]
  76. Newell, R.G.; Pizer, W.A. Discounting the Distant Future: How Much Do Uncertain Rates Increase Valuations? J. Environ. Econ. Manag. 2003, 46, 52–71. [Google Scholar] [CrossRef] [Green Version]
  77. Gollier, C.; Koundouri, P.; Pantelidis, T. Declining Discount Rates: Economic Justifications and Implications for Long-Run Policy. Econ. Policy 2008, 23, 758–795. [Google Scholar] [CrossRef]
  78. Feldstein, M.S. The Derivation of Social Time Preference Rates. Kyklos 1965, 18, 277–287. [Google Scholar] [CrossRef]
  79. Moore, M.A.; Vining, A.R. The Social Rate of Time Preference and the Social Discount Rate; Mercatus Center at George Mason University: Arlington, TX, USA, 2018. [Google Scholar]
  80. Groom, B.; Maddison, D. New Estimates of the Elasticity of Marginal Utility for the UK. Environ. Resour. Econ. 2019, 72, 1155–1182. [Google Scholar] [CrossRef]
  81. Akbulut, H.; Seçilmiş, E. Estimation of a Social Discount Rate for Turkey. Socio-Econ. Plan. Sci. 2019, 67, 78–85. [Google Scholar] [CrossRef]
  82. Spackman, M. Discount Rates and Rates of Return in the Public Sector: Economic Issues; Government Economic Service Working Paper; HM Treasury: London, UK, 1991; Volume 113.
  83. Eckstein, O. Investment Criteria for Economic Development and the Theory of Intertemporal Welfare Economics. Q. J. Econ. 1957, 71, 56. [Google Scholar] [CrossRef]
  84. Feldstein, M.S. The Social Time Preference Discount Rate in Cost Benefit Analysis. Econ. J. 1964, 74, 360–379. [Google Scholar] [CrossRef]
  85. World Population Prospects-Population Division-United Nations. Available online: https://population.un.org/wpp/Download/Standard/Population/ (accessed on 6 November 2022).
  86. Stern, N. Welfare Weights and the Elasticity of the Marginal Valuation of Income. In Studies in Modern Economic Analysis: The Proceedings of the Association of University Teachers of Economics, Edinburgh, 1976; Basil Blackwell: Oxford, UK, 1977. [Google Scholar]
  87. OECD Tax Statistics. Available online: https://www.oecd-ilibrary.org/taxation/data/oecd-tax-statistics_tax-data-en (accessed on 6 November 2022).
  88. The OECD Tax-Benefit Web Calculator. Available online: https://www.oecd.org/els/soc/tax-benefit-web-calculator/ (accessed on 27 October 2022).
  89. Freeman, M.; Groom, B.; Spackman, M. Social Discount Rates for Cost-Benefit Analysis: A Report for HM Treasury; HM Treasury: London, UK, 2018.
  90. Kula, E. Estimation of a Social Rate of Interest for India. J. Agric. Econ. 2004, 55, 91–99. [Google Scholar] [CrossRef]
  91. Kula, E. Derivation of Social Time Preference Rates for the United States and Canada. Q. J. Econ. 1984, 99, 873–882. [Google Scholar] [CrossRef]
  92. Kula, E. Social Interest Rate for Public Sector Appraisal in the United Kingdom, the United States and Canada. Null 1987, 2, 169–174. [Google Scholar] [CrossRef] [Green Version]
  93. The World Bank. World Development Indicators. Available online: https://databank.worldbank.org/source/world-development-indicators (accessed on 6 November 2022).
  94. The Green Book. 2022. Available online: https://www.gov.uk/government/publications/the-green-book-appraisal-and-evaluation-in-central-governent/the-green-book-2020 (accessed on 8 November 2022).
  95. Evans, D.J.; Sezer, H. Social Discount Rates for Member Countries of the European Union. J. Econ. Stud. 2005, 32, 47–59. [Google Scholar] [CrossRef]
  96. Kazlauskienė, V.; Stundžienė, A. Estimation of Social Discount Rate for Lithuania. Trendy Ekon. Manag. 2016, 10, 39–47. [Google Scholar] [CrossRef] [Green Version]
  97. Guide to Cost-Benefit Analysis of Investment Projects; European Commission: Brussels, Belgium, 2008.
  98. Addicott, E.T.; Fenichel, E.P.; Kotchen, M.J. Even the Representative Agent Must Die: Using Demographics to Inform Long-Term Social Discount Rates. J. Assoc. Environ. Resour. Econ. 2019, 7, 379–415. [Google Scholar] [CrossRef] [Green Version]
  99. Hansson, S.O. Philosophical Problems in Cost–Benefit Analysis. Econ. Philos. 2007, 23, 163–183. [Google Scholar] [CrossRef]
Figure 1. Energy mix (primary energy consumption) of CEE EU countries and EU27 comparison in 2021. Data source [31,32].
Energies 16 00321 g001
Figure 2. Discount factor for expected discount rate and certainty-equivalent discount factor (two scenarios of equal probability, 3% and 7% discount rates, average discount rate of 5%).
Energies 16 00321 g002
Figure 3. Time-constant expected discount rate and time-declining certainty-equivalent discount rate (two scenarios of equal probability, 3% and 7% discount rates, average discount rate of 5%).
Energies 16 00321 g003
Figure 4. Declining SDR estimates for CEE EU countries.
Energies 16 00321 g004aEnergies 16 00321 g004b
Figure 5. Declining forward SDR estimates for CEE EU countries.
Energies 16 00321 g005aEnergies 16 00321 g005b
Figure 6. Ratios of discount factors for all CEE EU countries.
Energies 16 00321 g006
Figure 7. Influence of differences in components of the Ramsey-Gollier formula on the level of SDR in CEE EU countries vs. the SDR estimated for all CEE EU countries.
Energies 16 00321 g007
Figure 8. Comparison of SDR estimates.
Energies 16 00321 g008
Figure 9. Estimated probability density function of simulated discount factors for all CEE EU countries.
Energies 16 00321 g009
Table 1. Ranking of CEE EU countries and comparison with EU27 average for CO2 emissions in tonnes per capita and kg per GDP (US dollars at Purchasing Power Parity rates), data source [33,34,35].
Country/EntitytCO₂
per Person
CountrykgCO₂
per GDP $
Czech Republic8.58Poland0.28
Poland8.02Bulgaria0.28
Estonia7.04Czech Republic0.27
Slovenia6.19Estonia0.24
Slovakia5.70Slovenia0.20
Bulgaria5.32Slovakia0.19
Lithuania5.02Hungary0.18
Hungary4.89Lithuania0.16
Romania3.85Romania0.16
Latvia3.71Latvia0.15
EU275.89EU270.17
Table 2. Standard discount factor (continuous compounding), certainty-equivalent discount factor (continuous compounding), effective discount rate (discrete time units), and the comparison of the difference in present values between standard and ENPV approaches (two scenarios of equal probability, 3% and 7% discount rates, average discount rate of 5%).
PeriodPV[1, E(R)]E[PV(1, R)]Certainty
Equivalent R
E[PV(1, R)]: PV[1, E(R)]
10.95122940.95141974.8580%1.00
100.60653070.61870184.5192%1.02
300.22313020.26451303.8636%1.19
500.08208500.12666383.4253%1.54
1000.00673790.02534953.0266%3.76
1500.00055310.00556832.9652%10.07
2000.00004540.00123982.9568%27.31
2500.00000370.00027662.9556%74.21
3000.00000030.00006172.9555%201.72
Table 3. Mortality rates for CEE EU countries over the 1960–2020 period.
Average Death Rate
PeriodBulgariaCzechiaEstoniaHungaryLatviaLithuaniaPolandRomaniaSlovakiaSloveniaCEE EU Members
1960–19700.85%1.09%1.06%1.05%1.04%0.82%0.77%0.89%0.82%0.98%1.18%
1971–19801.02%1.25%1.16%1.24%1.21%0.95%0.88%0.96%0.96%0.99%1.11%
1981–19901.17%1.26%1.21%1.37%1.26%1.05%0.99%1.06%1.01%1.00%1.13%
1991–20001.36%1.12%1.37%1.40%1.44%1.17%1.00%1.18%0.98%0.96%1.09%
2001–20101.46%1.04%1.28%1.31%1.44%1.29%0.97%1.23%0.98%0.93%0.99%
2011–20201.54%1.05%1.17%1.33%1.45%1.41%1.06%1.33%0.98%0.97%0.87%
1960–20201.23%1.14%1.21%1.28%1.30%1.11%0.94%1.10%0.95%0.97%1.06%
Table 4. Estimates of the Social Discount Rate for CEE EU countries based on the Ramsey and Ramsey-Gollier approach.
BulgariaCzechiaEstoniaHungaryLatviaLithuaniaPolandRomaniaSlovakiaSloveniaCEE EU Members
l1.23%1.14%1.21%1.29%1.31%1.12%0.95%1.11%0.96%0.98%1.06%
η1.00011.34781.25531.33461.13491.24291.11361.05111.33181.37701.0638
g2.65%1.34%3.61%1.93%4.06%4.55%3.15%4.54%2.49%1.44%3.21%
σ20.00870.00080.00250.00080.00340.00300.00050.00360.00080.00130.0004
SDR (Ramsey)3.89%2.95%5.74%3.86%5.92%6.77%4.45%5.88%4.28%2.96%4.48%
SDR (Ramsey-Gollier)3.45%2.87%5.54%3.79%5.70%6.54%4.42%5.68%4.21%2.84%4.45%
Table 5. Statistical indices on Ramsey-Gollier SDR.
BulgariaCzechiaEstoniaHungaryLatviaLithuaniaPolandRomaniaSlovakiaSloveniaCEE EU Members
Trials10,00010,00010,00010,00010,00010,00010,00010,00010,00010,00010,000
Base case3.45%2.87%5.54%3.79%5.70%6.54%4.42%5.68%4.21%2.84%4.45%
Mean3.47%2.82%5.54%3.80%5.77%6.56%4.40%5.61%4.23%2.90%4.46%
Median4.89%3.44%6.20%4.44%6.26%7.37%4.67%6.27%4.58%3.51%4.88%
Standard
deviation
10.51%4.40%7.09%4.19%7.42%7.74%2.83%7.13%4.15%5.53%2.50%
Skewness2.251.720.680.570.581.430.620.150.181.390.56
Excess
kurtosis
7.304.600.83−0.001.083.640.80−0.42−0.663.69−0.11
Coefficient
of variation
3.031.561.281.101.291.180.641.270.981.900.56
Min−55.09%−18.44%−24.88%−11.83%−23.08%−32.56%−7.29%−17.74%−9.10%−22.88%−4.43%
Max28.91%13.94%26.71%15.79%28.56%27.33%12.24%32.33%16.25%21.95%11.58%
Mean
stand. error
0.11%0.04%0.07%0.04%0.07%0.08%0.03%0.07%0.04%0.06%0.02%
Nonnegative trials75948302816081648271874193447660817479459396
Table 6. Average step approximation SDRs for CEE EU countries.
SDR
PeriodBulgariaCzechiaEstoniaHungaryLatviaLithuaniaPolandRomaniaSlovakiaSloveniaCEE EU Members
1–303.86%2.95%4.67%3.49%4.78%5.65%4.06%4.43%3.58%3.06%4.09%
31–752.11%2.07%2.59%2.27%2.66%3.21%3.09%2.31%2.25%2.00%3.13%
76–1251.26%1.40%1.53%1.44%1.57%1.89%2.15%1.33%1.41%1.29%2.17%
126–2000.82%0.96%0.98%0.95%1.02%1.22%1.49%0.85%0.94%0.87%1.49%
201–3000.55%0.66%0.65%0.64%0.68%0.81%1.02%0.57%0.63%0.59%1.03%
301–5000.35%0.43%0.42%0.41%0.43%0.52%0.67%0.36%0.41%0.38%0.68%
Table 7. Fitted forward-step SDRs for CEE EU countries.
SDR
PeriodBulgariaCzechiaEstoniaHungaryLatviaLithuaniaPolandRomaniaSlovakiaSloveniaCEE EU Members
1–303.43%2.81%4.20%3.27%4.30%5.14%3.90%3.90%3.33%2.86%3.94%
31–750.32%0.97%0.36%0.80%0.38%0.46%1.71%0.19%0.69%0.76%1.73%
76–1250.23%0.38%0.26%0.29%0.28%0.34%0.64%0.19%0.29%0.31%0.61%
126–2000.06%0.16%0.06%0.11%0.07%0.07%0.25%0.05%0.11%0.12%0.26%
201–3000.03%0.06%0.03%0.05%0.04%0.04%0.10%0.02%0.05%0.05%0.11%
301–5000.01%0.03%0.01%0.02%0.01%0.01%0.04%0.01%0.02%0.02%0.05%
Table 8. Discount factors and their ratios.
PeriodPV[1, 3%]PV[1, E(R)]E[PV(1, R)]Certainty Equivalent RE[PV(1, R)]: PV[1, 3%]E[PV(1, R)]: PV[1, E(R)]
10.9704460.9557190.9559854.5013%0.991.00
100.7408180.6357760.6540674.2455%0.881.03
300.4065700.2569880.3331673.6637%0.821.30
500.2231300.1038770.2104423.1171%0.942.03
1000.0497870.0107900.1199642.1206%2.4111.12
1500.0111090.0011210.0962491.5605%8.6685.87
2000.0024790.0001160.0859821.2268%34.69738.46
2500.0005530.0000120.0802901.0088%145.176638.40
3000.0001230.0000010.0766870.8560%621.4061,038.40
Table 9. The present value of intergenerational investments—comparison using different discounting schemes.
Social Cost of CarbonNuclear DecommissioningNuclear Decommissioning
(Delayed, 50 Years)
$/tCbn £bn £
Ramsey-Gollier SDR4.4836.463.93
Declining SDR27.9343.0715.18
SDR = 3%10.4546.6510.41
Data about projected cash flows taken from [19].
Disclaimer/Publisher’s Note: The statements, opinions and data contained in all publications are solely those of the individual author(s) and contributor(s) and not of MDPI and/or the editor(s). MDPI and/or the editor(s) disclaim responsibility for any injury to people or property resulting from any ideas, methods, instructions or products referred to in the content.

