Article

Extraordinarily High Organic Matter Enrichment in Upper Permian Wujiaping Formation in the Kaijiang-Liangping Trough, Sichuan Basin

1
State Key Laboratory of Oil and Gas Reservoir Geology and Exploitation, Southwest Petroleum University, Chengdu 610500, China
2
Exploration Division of PetroChina Southwest Oil & Gasfield Company, Chengdu 610041, China
3
School of Geoscience and Technology, Southwest Petroleum University, Chengdu 610500, China
4
Research Institute of Shale Gas, PetroChina Southwest Oil & Gasfield Company, Chengdu 610051, China
5
Exploration and Development Research Institute, PetroChina Southwest Oil & Gasfield Company, Chengdu 610051, China
*
Author to whom correspondence should be addressed.
Energies 2023, 16(1), 349; https://doi.org/10.3390/en16010349
Submission received: 27 November 2022 / Revised: 23 December 2022 / Accepted: 23 December 2022 / Published: 28 December 2022
(This article belongs to the Special Issue Advances in Petroleum Geology and Unconventional Oil and Gas)

Abstract

:
The study of extraordinarily high organic matter content (EHOMC) is beneficial to promote the fine evaluation of shale oil and gas, but so far, there have been few studies on its mechanism. This paper carried out a comprehensive lithological and geochemical analysis of the black shales of the Wujiaping Formation in the Kaijiang-Liangping Trough. The results showed that the black shales of the Wujiaping Formation can be divided into two units (the upper and lower parts), and EHOMC occurs in its upper part. The redox-sensitive trace elements (RSTEs), MoEF-UEF covariation, and Ni/Co correlation showed that the lower part of Wujiaping Formation was a weakly restricted oxidation environment, while the upper part evolved into a sulfidation reducing environment. The productivity indicator elements (BaXS, NiXS, CuXS, P, and Mo) indicated that the upper Wujiaping Formation had higher primary productivity than the lower part. However, rare earth elements ((La/Yb)N) indicated that the deposition rate in the lower part of the Wujiaping Formation was higher than that in the upper part. In general, although the oxygenated water in the lower part of the Wujiaping Formation is not conducive to the preservation of organic matter, the high input of nutrients from land sources and the high deposition rate inhibit the decomposition of organic matter, so the lower part has a certain degree of organic matter accumulation. The sulfidation reducing environment and high paleoproductivity are the main reasons for the enrichment of organic matter in the upper part of the Wujiaping Formation. In addition, the sulfidation reducing environment and high paleoproductivity occurred during the violent upwelling at the end of Guadeloupe, a period of high sea level, these factors have jointly contributed to the enrichment of OM in the upper the Wujiaping Formation.

1. Introduction

Shale oil and gas exploration practice has confirmed that marine shale with high organic matter contents (EHOMCs) (>10 wt%), the organic matter types I-II1, and high hydrocarbon expulsion efficiency may be top-quality hydrocarbon source rocks and shale reservoirs [1]. It is also widely recognized that these EHOMC shales are important hydrocarbon source rocks or shale-gas-producing formations, such as the Bakken Formation shale in the Upper Devonian-Lower Mississippian of Saskatchewan, Canada (TOC < 22%) [2], the Illinois Devonian New Albany Shale in the United States (TOC < 25%) [3], the Lower Jurassic oil shales in the Qiangtang Basin, China [4], the five regional sets of highly organic shales developed in the Upper Yangtze region [5], the Lower Silurian Longmaxi Formation (TOC < 8.6%) [6], the Lower Cambrian Uribe Formation (TOC < 22.15%) [7], the Upper Permian Dalong Formation (TOC < 14.40%) [8], the Gufeng member of the Lower Permian Maokou Formation (TOC < 32.58%) [1], and the Upper Permian Wujiaping Formation (TOC < 38%) [9]. Recently, the Upper Permian EHOMC shale in the Upper Yangtze region has gradually received attention, but the formation mechanism of the EHOMC shale in the Wujiaping Formation is still unclear.
The study of OM enrichment has a six-decade-long history and is usually carried out for the production and preservation of organic matter [10,11,12,13,14]. Although these models can solve most of the OM enrichment problems, the EHOMC enrichment model has specificity and complexity. The Bakken Formation shales have a typical marine EHOMC enrichment pattern, resulting in numerous EHOMC enrichment recognitions. For example, the interaction of productivity and preservation resulted in a high TOC of 35% [15], while seasonal thermocline, nutrient supply, and relative sea level produced EHOMC [16]. Obviously, production and preservation models alone or in combination cannot adequately explain the enrichment of EHOMC. Indeed, other geological factors such as paleoclimate, sea level, and paleogeography also need to be considered. The Dongwu Movement and the basalt eruption of Emei Mountain, during the formation of the Middle and Upper Permian, resulted in the mutation of lithofacies’ paleogeography (the development of the Kaijiang-Liangping Trough) and the upwelling and extinction of organisms in the Upper Yangtze region [17,18,19]. Whether these deposition events are related to the enrichment of EHOMC remains to be further studied. In addition, the introduction of super-enriched trace elements (Mo, U, and V) also provides a good research idea for EHOMC [20].
In this paper, the shales of the Wujiaping Formation in Well A of the Sichuan Basin were studied. In 2022, CNPC drilled Well A for the Wujiaping Formation in the Sichuan Basin. On 30 November 2022, Well A was tested to produce 32.06 × 10⁴ m3/day. A comprehensive petrological and inorganic geochemical study of these black shales was conducted. The purposes of this study are as follows: (1) primary productivity, redox condition, and deposition rate; (2) controlling factors and enrichment models of EHOMC. The study of the enrichment features of EHOMC is helpful to deepen the understanding of the genesis of hydrocarbon source rocks.

2. Geological Settings

In the global plate structure, during the Permian, South China was located near the Equator and east of the Paleo-Tethys Ocean [21]; in general, the Permian in South China was mainly carbonate platform facies [22] (Figure 1A). However, in the late Middle Permian, the southern continental margin of the Mianlue Ocean on the northwestern margin of the Yangtze Plate subducted to the northern Qinling Microplate, and the Emei taphrogeny was accompanied by large-scale basalt eruption, leading to the tectonic sedimentary differentiation in the northern margin of the Yangtze platform and forming the prototype of the Kaijiang-Liangping Trough in the Bazhong Dazhou area [23]. From the end of the Early Permian to the beginning of the Late Permian, the area of the Dongwu Movement was uplifted and denuded, and the Kangdian ancient land was expanded. The deep–shallow-water pattern of the late Maokou period is still maintained in the northeastern Sichuan Basin. The Wujiaping Formation keeps the differentiation characteristics of the platform-shed of the late Maokou period and develops deep-water siliceous shale deposits. The thickness of the Wujiaping Formation shale in the Kaijiang-Liangping Trough is 20–60 m. It is usually buried at a depth of more than 4000 m. It was stretched again in the Changxingian Age and reached its peak at the end of this period. Meanwhile, with the large-scale transgression process, the deep-water basin facies siliceous rocks and siliceous shale were deposited in the Kaijiang-Liangping Trough in northern Sichuan, which is called the Dalong Formation. The organic-rich shale deposited in the Late Permian has become an important coalbed methane and shale gas exploration layer in South China. Well A is located in Chongqing, eastern Sichuan Basin (Figure 1B), with a total depth of more than 4000 m. The shale of the Wujiaping Formation can be divided into upper and lower members according to lithology and composite characteristics (Figure 1C). Previous studies on the shales of the Wujiaping Formation have shown that the types of shale organic matter are generally I–II [24].

3. Materials and Methods

3.1. Sample Testing

A total of 20 samples were collected from the shales of Well A at the same time, and the related analytical tests were completed in the Analysis Experimental Center of the Exploration and Development Research Institute of Southwest Oil and Gas Field Company. Samples were ground into powders of an 80 mesh and less than a 200 mesh, respectively, for chemical analysis. The samples of the 80 mesh were used for total organic carbon (TOC) analysis, and the TOC was measured by the LECOCS 230 carbon-sulfur analyzer. The samples were ground to less than a 200 mesh to analyze major, trace, and rare earth elements (REEs). The contents of major elements were determined by an X-ray fluorescence spectrometer (XRF); the test process followed the standard GB/T 14506.28-2010, and the test accuracy was better than 3% (Table 1). Trace and rare earth elements were determined by ELAN DRC-E high-resolution inductively coupled plasma mass spectrometry (ICP-MS); the test process followed the standard GB/T 14506.30-2010, and the test accuracy was better than 5% (Table 2).

3.2. Data Processing

Taking the content of post-Archean Australian Shale (PAAS) as the reference standard, if the content of an element in the sediment was significantly higher than the average shale content, it would indicate that this element is authigenic enrichment; otherwise, it is relatively depletion [25]. Some biogenic carbonate minerals can dilute authigenic minerals in sediments, which can be reduced by Al standardization [26,27]. The enrichment factor (EF) can quantitatively analyze the enrichment degree of an element [28]. XEF = (X/Al)sample/(X/Al)PASS; the trace element X has more enrichment when XEF element > 1; the trace element X has relative depletion when XEF element < 1 [26,27]. To avoid the influence of terrigenous detrital, the content of bio-related elements was calculated according to the following formula: Xxs = Xsample − Alsample × (X/Al)PAAS [29], where X is the concentration of the element that needs to be calculated.
Table 1. TOC, major, and trace element contents and their correlation values of the shales of the Wujiaping Formation.
Depth
m
TOC
%
Fe2O3
%
Al2O3
%
SiO2
%
K2O
%
CaO
%
TiO2
%
MgO
%
P2O5
%
MnO
%
Na2O
%
Ba
ug/g
V
ug/g
Sr
ug/g
Cr
ug/g
U
ug/g
Cu
ug/g
Cd
ug/g
Mo
ug/g
Co
ug/g
Ni
ug/g
Zn
ug/g
TCPCCIA
432815.002.452.0152.320.9015.250.140.380.05183.000.44129.001270.004170.00210.0027.4065.00120.00398.009.30187.50126.000.160.4361.41
432914.002.211.9549.840.9212.370.150.340.06190.000.37165.001120.003560.00190.0025.60120.3895.00289.6110.29186.25150.000.340.4560.64
433015.266.321.9646.871.3211.290.210.290.45265.000.65187.001320.001560.00200.0018.60160.9380.00256.319.74230.00160.000.291.1562.93
433110.0010.324.3137.412.2113.250.350.520.03276.000.70191.501495.001675.00310.0011.65185.5017.20156.0022.00245.00221.000.391.2560.60
43326.003.874.2839.182.3214.310.220.280.03290.000.56187.00980.001450.00240.0015.60100.8510.00160.2318.65235.00116.000.221.0759.95
433312.311.401.6256.640.7314.600.120.390.24358.000.33106.50786.001185.00260.0022.2080.4015.8530.008.90127.00126.000.141.1862.54
433413.262.211.6949.270.9515.300.080.360.69350.000.34110.00790.001095.00240.0023.50140.5814.3270.3210.21128.19123.000.201.2560.26
433514.361.322.1248.921.0310.890.110.270.76980.000.31148.00620.00860.00290.0032.30143.6610.0082.3811.23213.34127.000.272.0763.55
433613.003.002.9351.411.3112.950.220.330.721060.000.53154.00592.00882.00380.0038.80155.5010.0073.3012.90217.00140.000.242.1662.94
433714.002.634.6547.422.369.390.380.520.721660.000.50250.00361.00572.00340.0021.10214.006.0317.1023.90357.00363.000.413.3065.39
433811.005.323.5850.302.319.760.320.430.611520.000.29213.00410.00680.00320.0020.42180.297.2316.2520.14321.31320.000.572.8860.22
43610.4510.211.2345.203.113.560.890.860.061890.000.37220.00390.00580.00130.002.60190.360.154.3638.6598.00160.000.283.1752.82
43622.108.363.2542.133.234.232.691.020.061560.000.58215.00380.00390.00110.001.96185.260.253.6941.2579.36158.001.053.5552.49
43632.206.254.6845.282.872.071.320.810.061763.000.61201.00160.00340.00130.002.1390.360.233.2845.6261.28169.001.163.9766.64
43644.4018.088.2339.772.692.141.620.950.072280.000.60208.00165.00296.00120.002.2058.300.183.6853.1078.40171.001.666.8074.94
43653.2120.705.9228.801.201.301.110.490.03316.000.86233.00147.00214.00100.003.22120.500.108.8228.9053.7046.001.241.0069.39
43664.264.329.6829.671.981.253.260.270.03450.000.92290.00132.00320.00240.006.36110.000.205.6824.5680.0045.002.991.2374.35
43673.5611.5413.4540.572.730.343.720.330.03532.001.48319.00370.00442.00270.009.66105.000.104.0623.00112.0041.003.711.1974.44
43684.005.6513.4045.103.540.443.820.510.1061.001.16337.00386.00477.00280.006.59100.000.238.5731.30123.0055.003.782.5476.25
43695.122.313.5840.173.250.363.210.470.0960.001.15310.00320.00580.00270.008.26120.760.303.1829.7548.3256.003.742.5470.16
Table 2. Rare earth element contents and their correlation parameters (ug/g) of the shales of the Wujiaping Formation (UCC quoted from [30]).
Depth
m
LaCePrNdSmEuGdTbDyYHoErTmYbLuREEEUEF(La/Yb)N
432812.9024.003.1112.202.550.492.370.362.1816.100.451.330.190.690.1979.701.350.74
432912.8026.203.1512.102.610.502.100.282.1014.600.461.360.180.570.2079.871.420.75
433013.6028.903.6814.302.470.211.960.402.3213.700.501.450.300.860.2585.611.110.62
433115.7029.703.7813.702.600.472.200.362.3315.900.521.580.250.750.2691.000.610.70
433214.8030.203.9215.302.300.502.300.312.1016.300.571.600.280.720.3092.360.360.69
433311.4017.402.399.001.900.382.170.332.1217.400.471.410.220.630.2368.211.300.60
433410.8018.502.6812.301.910.602.150.362.3615.700.301.350.300.900.2871.031.840.55
433512.6060.106.2115.603.650.716.210.503.4718.500.652.360.450.860.34132.873.140.62
433629.4061.507.1328.506.401.307.021.056.6049.601.373.690.481.030.45207.432.460.40
433723.3043.005.2820.304.530.874.930.754.7538.501.033.120.461.520.51154.461.040.73
433824.6044.306.2319.403.920.905.300.794.3235.201.203.200.501.420.61153.571.490.55
436160.3050.3010.3258.706.701.206.301.204.3058.201.894.250.801.411.02270.0910.430.58
436270.50150.2015.6260.109.201.308.451.3610.2057.901.804.680.873.101.00398.813.680.97
436369.6080.2016.3161.3010.622.1510.611.7011.3260.302.105.300.902.551.30339.193.120.92
436472.90155.5017.0062.7012.902.7612.251.9111.4062.502.316.550.912.490.85428.241.860.93
436595.70208.0024.2095.6020.202.4919.103.1818.9597.903.709.841.292.641.15609.062.340.92
436671.30148.0018.4572.0015.653.6213.702.3014.1073.902.797.871.063.530.96452.221.540.90
436776.30130.5019.6276.2014.522.9814.602.3113.6574.202.687.681.252.450.85443.791.500.80
436888.80191.5022.4086.1018.354.6915.652.3313.9075.002.787.721.062.950.93537.701.940.86
436989.00201.0023.6085.7017.654.1014.002.3514.2076.402.767.801.302.950.98547.295.601.00
UCC30.007.1026.004.500.883.800.643.800.643.500.802.300.332.200.3286.81

4. Results

4.1. Petrological Characteristics

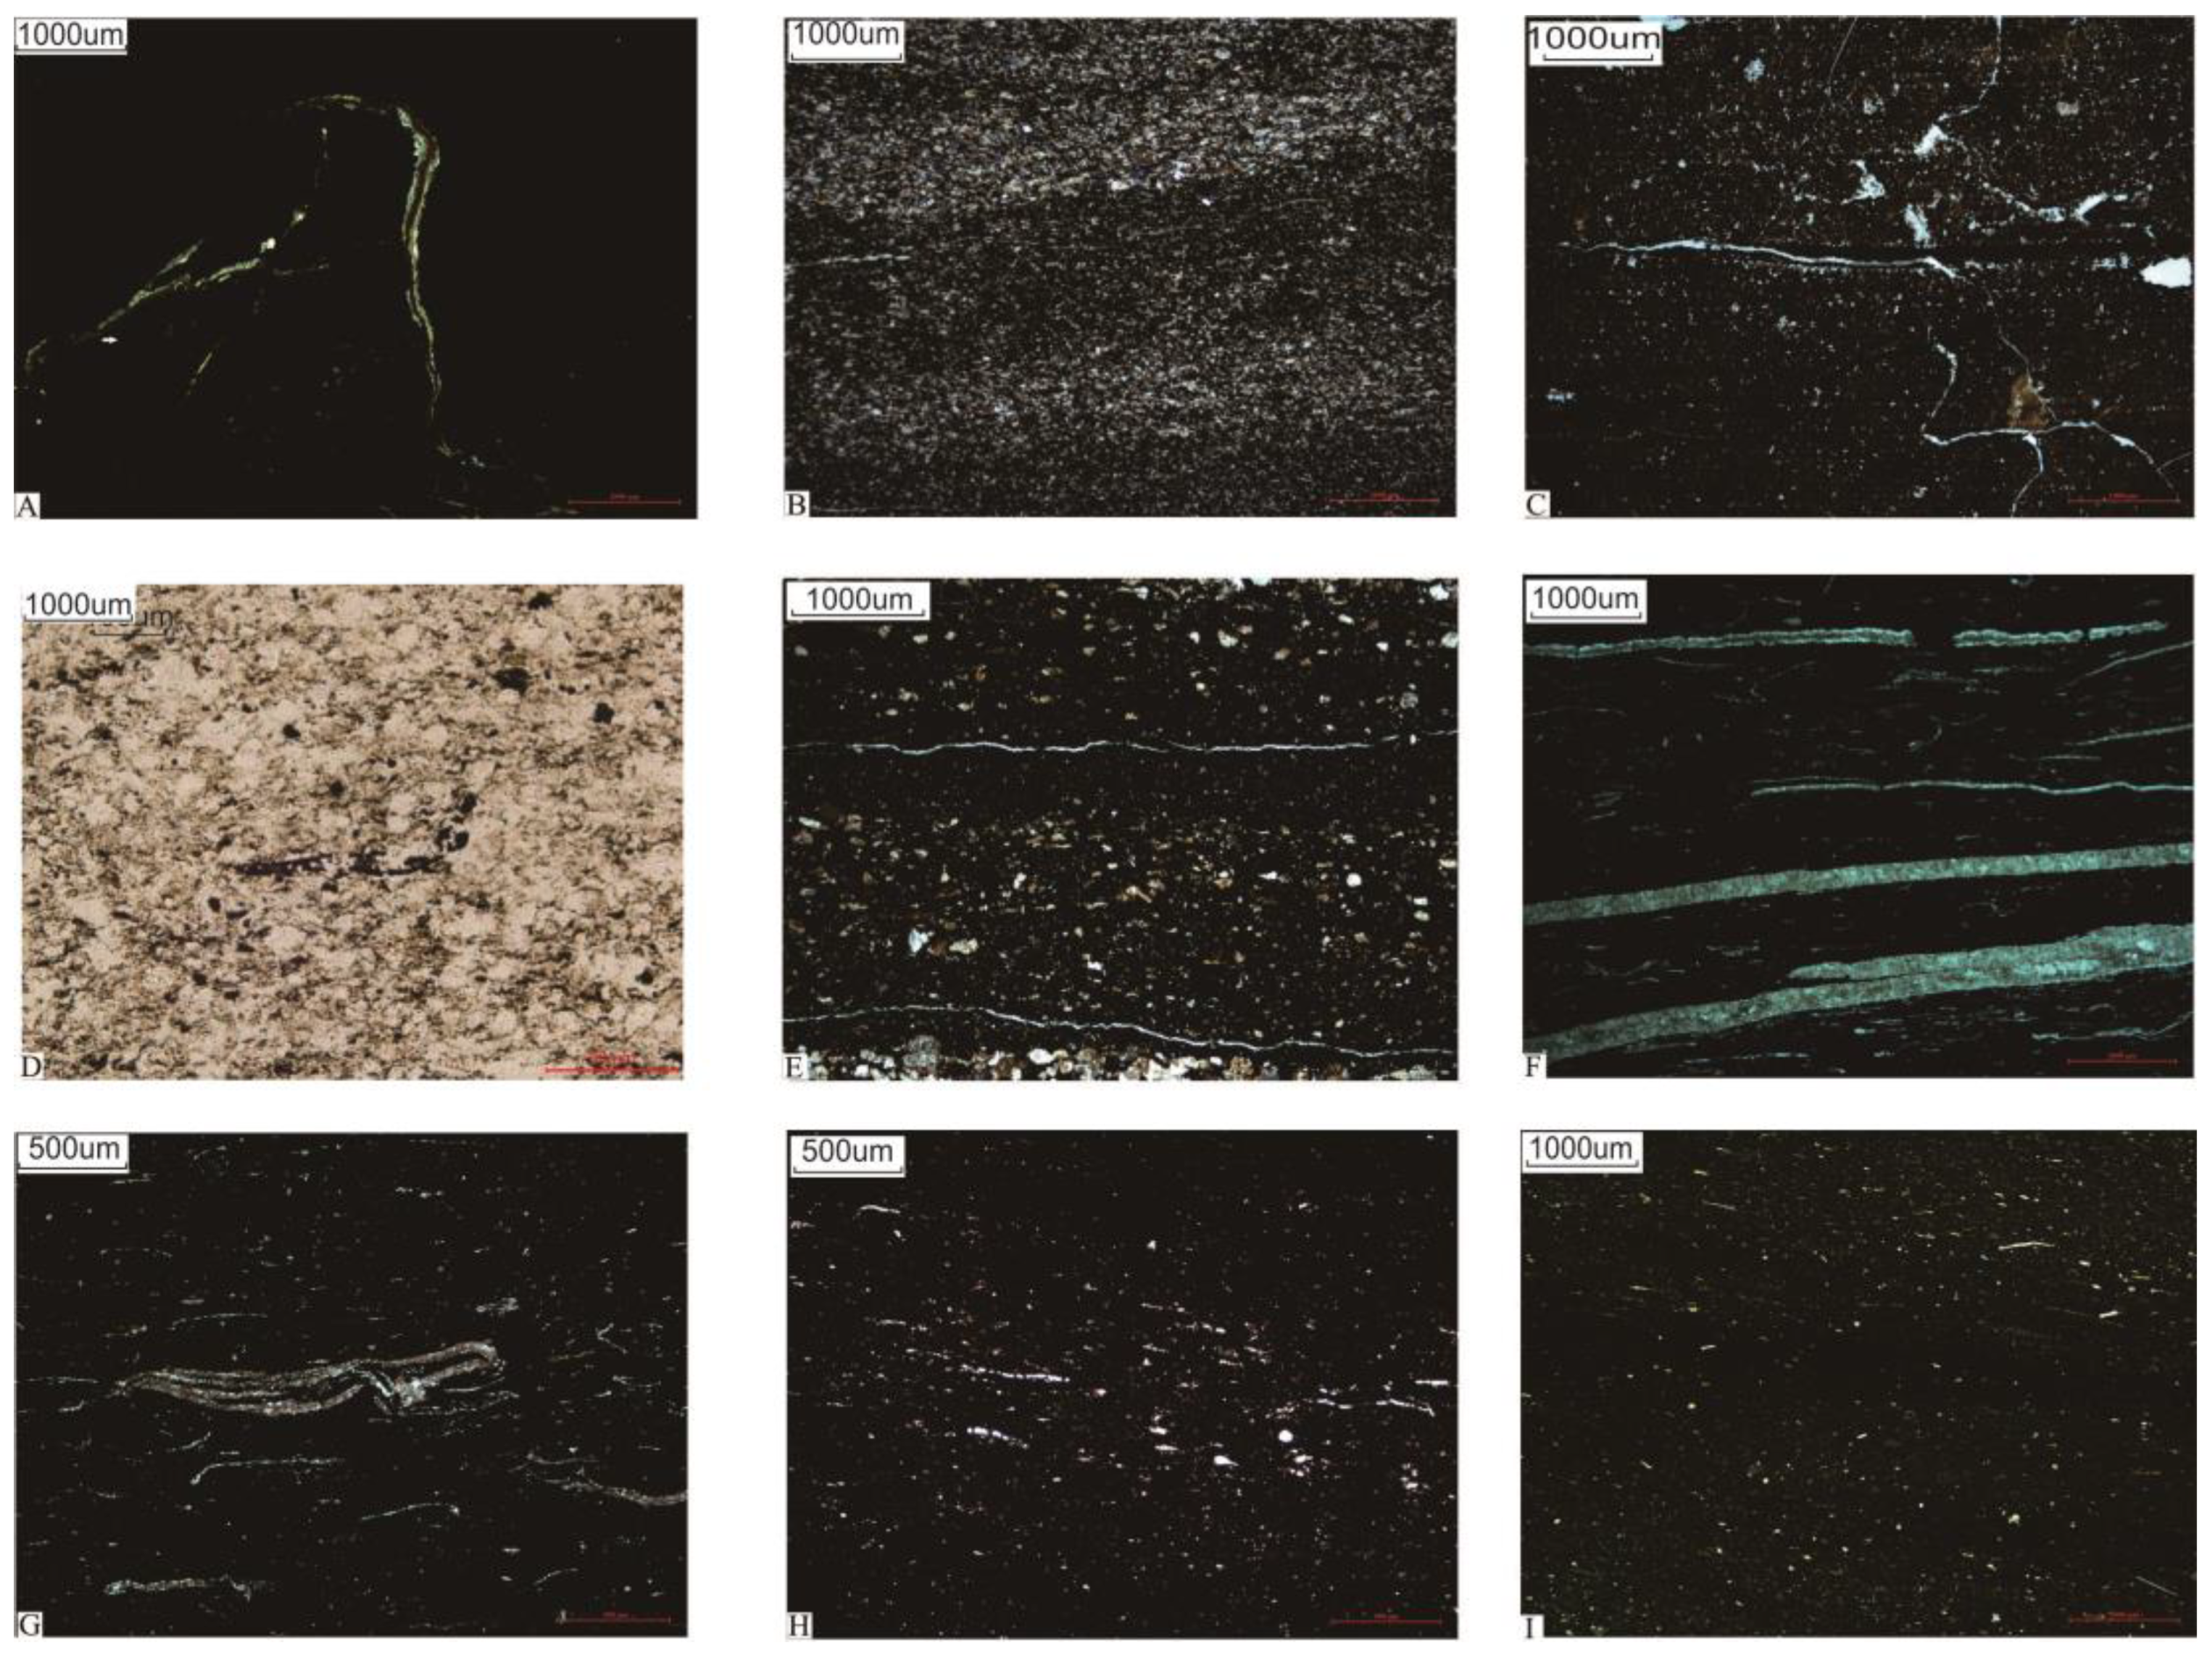
The siliceous clay shale in the lower part of the Wujiaping Formation (4346~4369 m) is composed of argillaceous, organic matter (Figure 2A), and quartz debris (Figure 2B). The bright and dark laminae are distributed alternately, with more debris particles in the bright layer and higher organic matter content in the dark layer, and the layer cracks are visible (Figure 2C). Plant debris can be seen (Figure 2D). Horizontal laminae development and fine sandstone mixed with silty mudstone can be seen (Figure 2E). The upper part (4328~4346 m) is a siliceous–calcareous mixed shale with massive horizontal laminae (Figure 2F) and layer alignment of large double-shell debris (Figure 2G), radiolarians, and bone spicule (Figure 2H), as well as a significant amount of bioclasts and organic matters filling the fissures (Figure 2I).

4.2. Geochemical Characteristics

4.2.1. Total Organic Carbon

The TOC of the black shale of the Wujiaping Formation spans from 0.45% to 15.26% (on average, 8.37%), with the abnormal enrichment zone of TOC mostly in the upper part of the Wujiaping Formation with values between 6% and 15.26% (on average, 12.56%). With values ranging from 0.45% to 5.12% (on average 3.25%), the lower part is rather low. The Wujiaping Formation shale is highly richer in TOC when compared to the PAAS shale [31] (Table 1).

4.2.2. Major and Trace Elements

The primary oxides found in the shale samples are SiO2, CaO, Fe, and Al2O3, with Si concentrations averaging 44.31% and ranging from 28.8% to 56.64%, the highest. In the longitudinal stratum section, SiO2 and CaO contents in the upper part are higher than those in the lower part; Al2O3 and total Fe (TFe) contents in the lower part are lower than those in the upper part (Table 1).
According to the experiment result, trace elements such as Ba, V, Cr, Th, U, Sr, Cu, Co, Ni, and Mo are mostly adopted to characterize the paleoenvironment evolution through time. Concentrations of Mo, U, and V are 3.18 ug/g to 398.00 ug/g (on average, 81.37 ug/g), 1.96 ug/g to 38.80 ug/g (on average, 15.01 ug/g), and 132 ug/g to 1495 ug/g (on average, 609.7 ug/g), respectively. The Wujiaping Formation’s trace element contents (average values) vary greatly, with the upper part having significantly greater Mo, U, and V concentrations and enrichment factors than the lower part (Table 1). The Ba concentration ranges from 106.5 ug/g to 337 ug/g (on average, 208.7 ug/g) and is generally lower. P, ranging from 300 ug/g to 7560 ug/g (on average, 2435 ug/g), is commonly higher (Table 1).

4.2.3. Rare Earth Elements

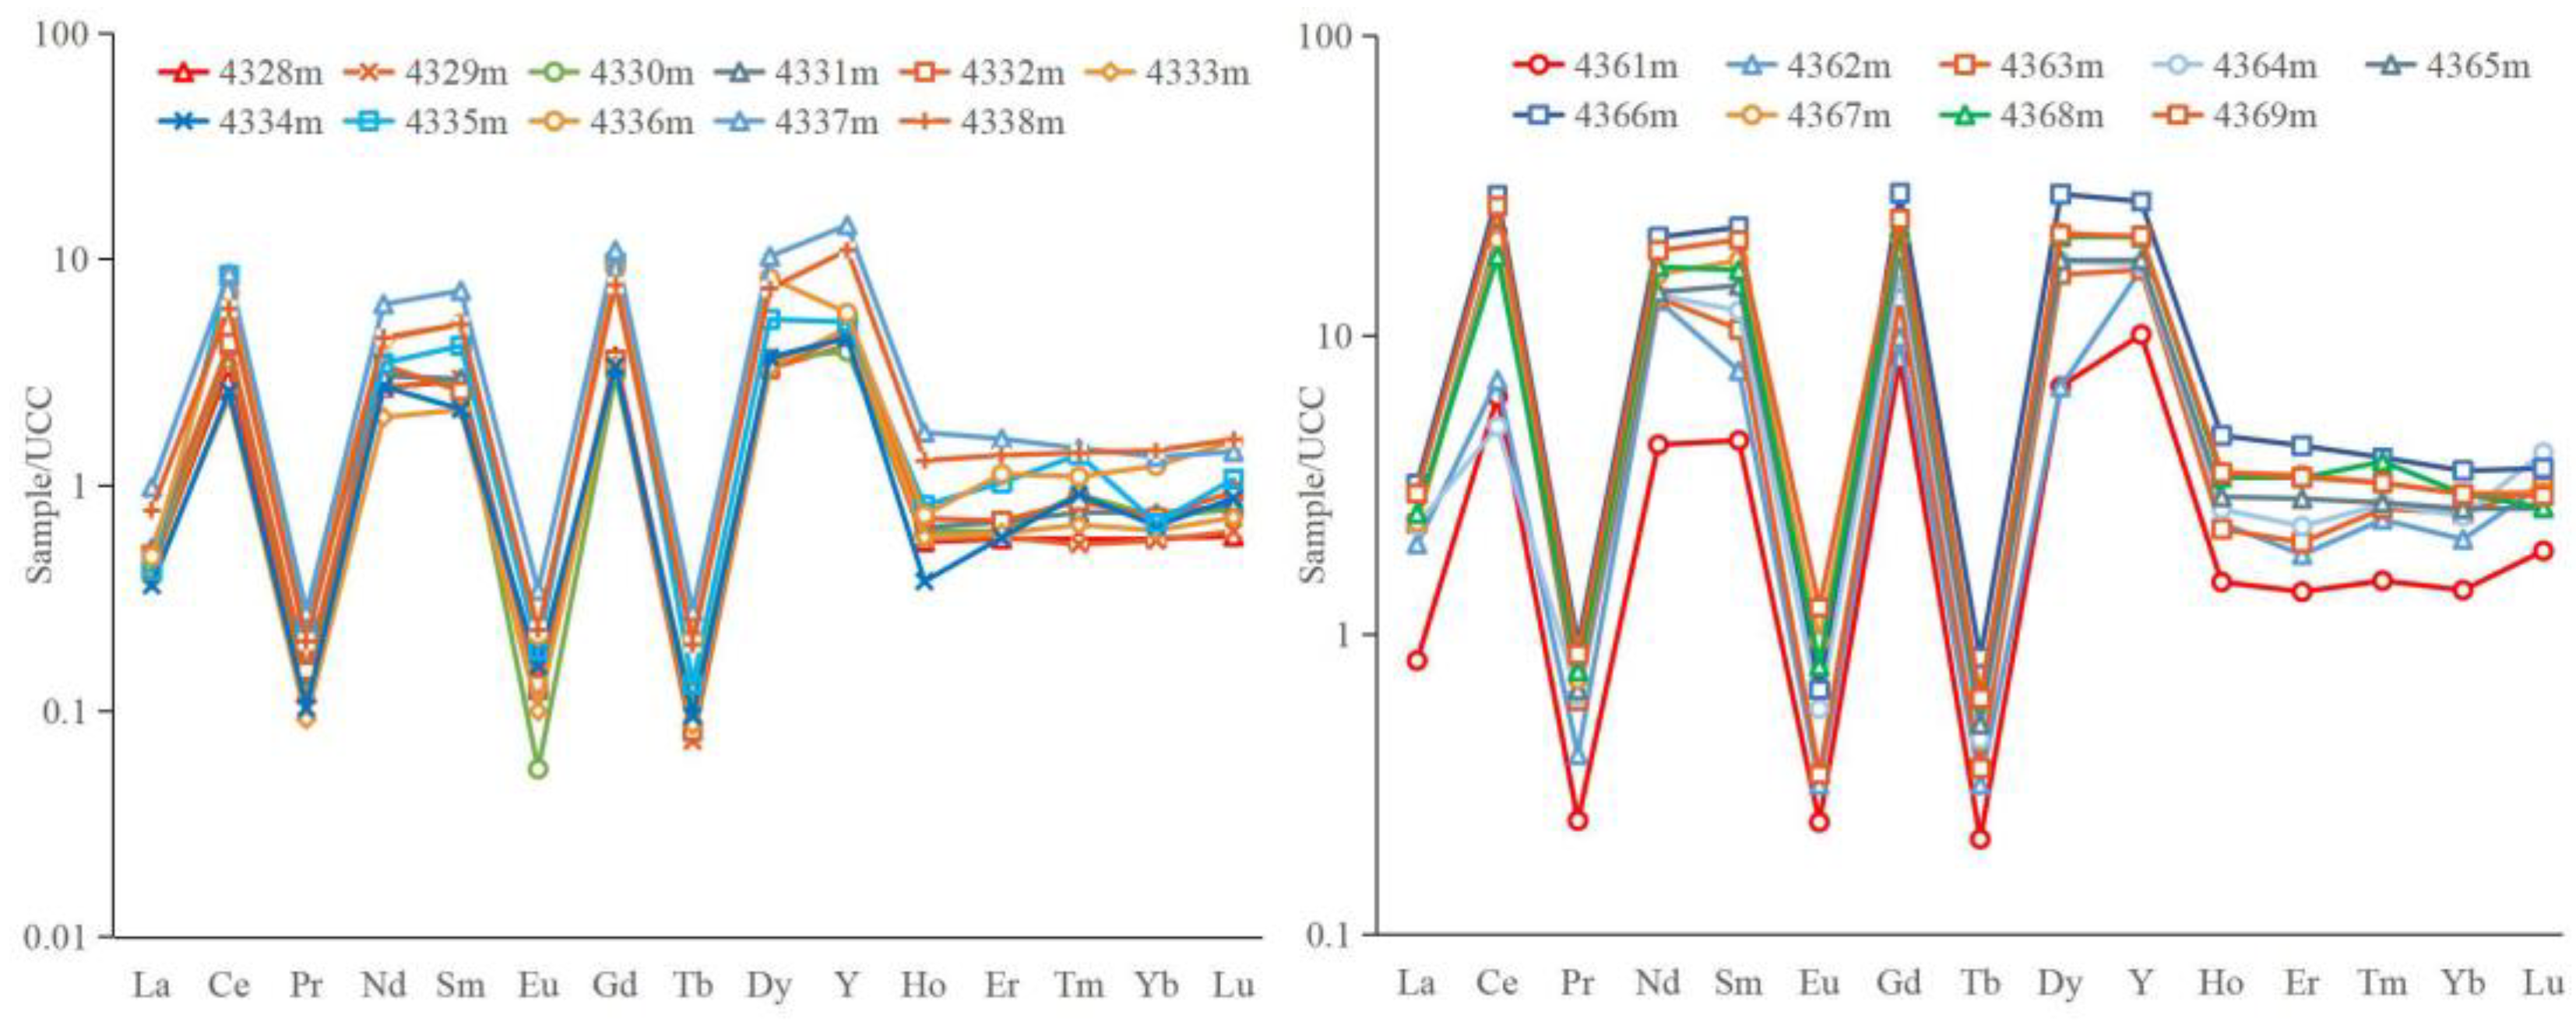
Total rare earth elements’ concentration ranges from 68.21 ug/g to 609.06 ug/g with an average value of 86.81 ug/g (Table 2), which is substantially greater than that of chondrite (65.9 ug/g) [32] and lower than the upper crust (146.4 ug/g) [25] and North American shale (NASC) (173.21 ug/g) [33]. The Wujiaping Formation’s shales contain comparable patterns of rare earth elements, according to this study’s normalization of rare earth elements by upper continental crust (UCC) concentrations (Figure 3) [25], presumably with terrigenous clastic rocks’ input.

5. Discussion

5.1. Factors Affecting OM Enrichment

5.1.1. Redox Condition

Due to the characteristics of dissolution or precipitation under various redox conditions, redox-sensitive elements (RSTEs), such as Mo, U, and V, can be utilized to reconstruct redox conditions in the paleoenvironment [34]. While the concentration of U in sediments is solely dependent on hypoxic conditions and is not directly connected to sulfidation status, Mo can only be taken by the sediments in the presence of H2S in water [35]. V behaves as a two-step reduction when reducing wastewater. When oxygenated water is converted to sightly reducing wastewater, V is reduced from the soluble and stable vanadate form to vanadium ions or insoluble hydroxides [36]; in addition, in the presence of free H2S, V is reduced to solid oxides or hydroxides under stronger reducing conditions [37].
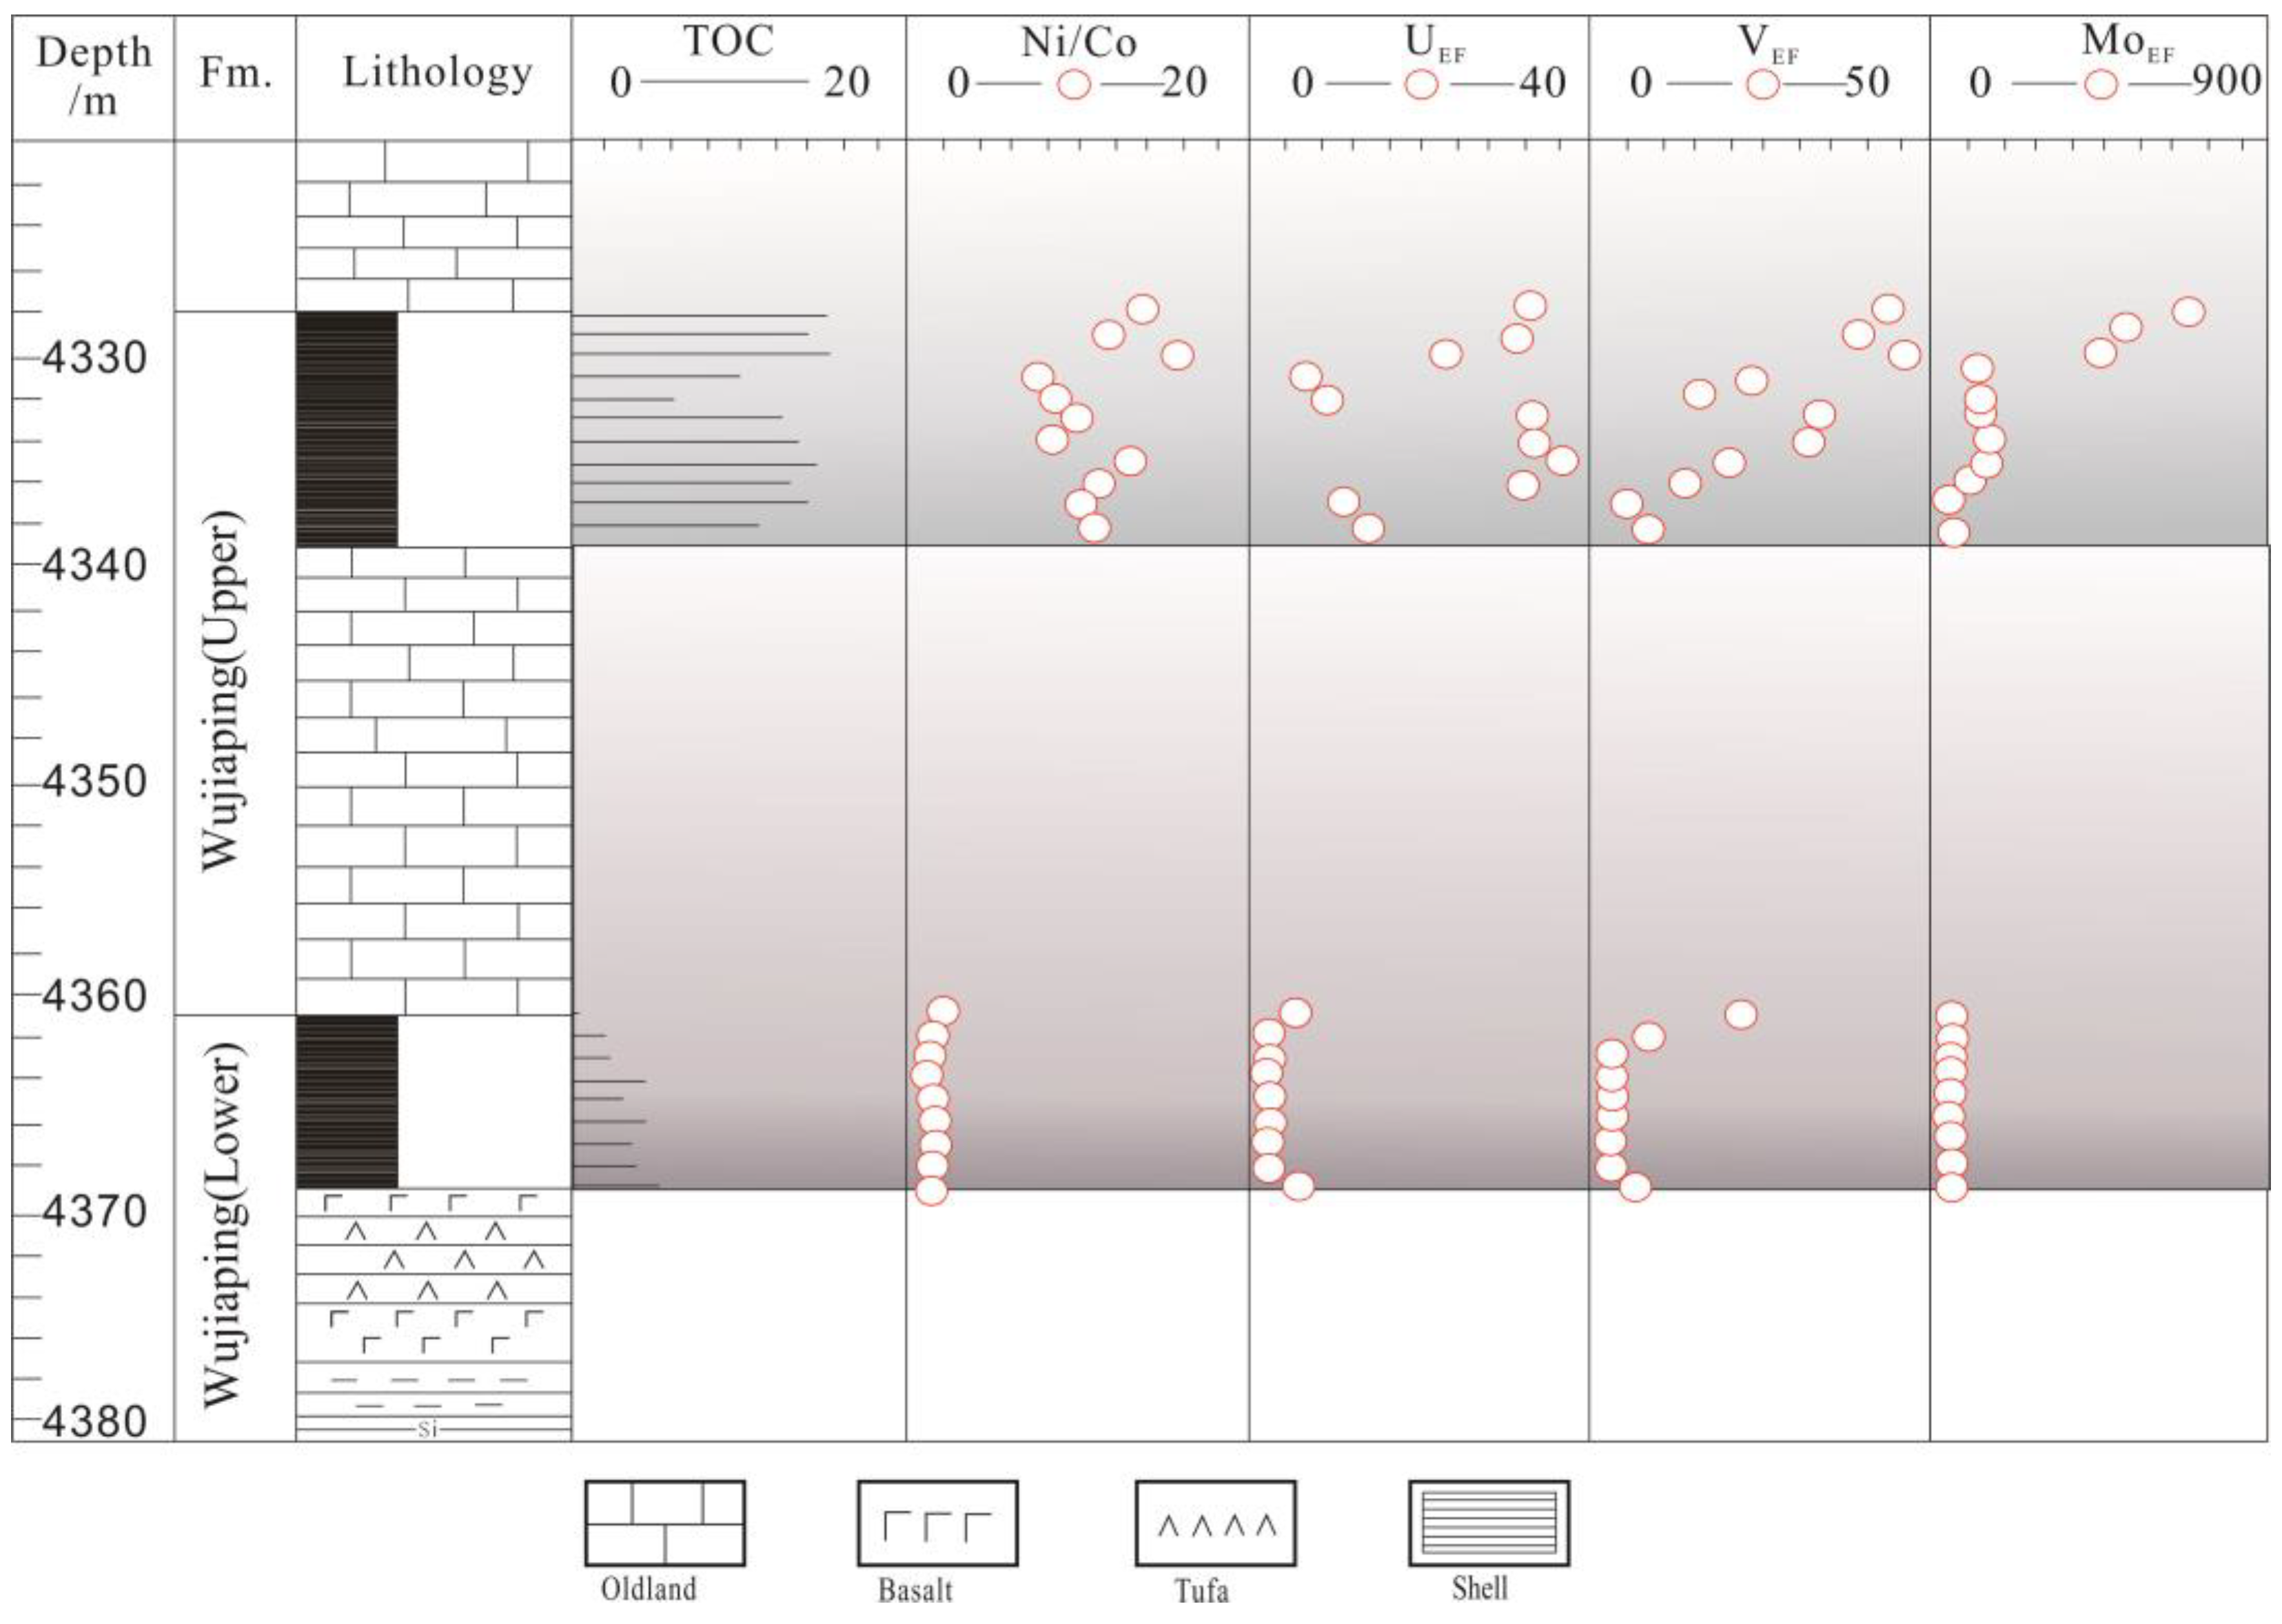
Over the whole Upper Permian in terms of enrichment coefficients, RSTEs are generally greater than 1, and enrichment coefficients of a tiny minority of samples are less than 1. Moreover, the upper part of the Wujiaping Formation has considerable enrichment of RSTEs (Figure 4) and has much higher RSTE values than that of the lower part, demonstrating that the upper part of the depositional environment is more constrained.
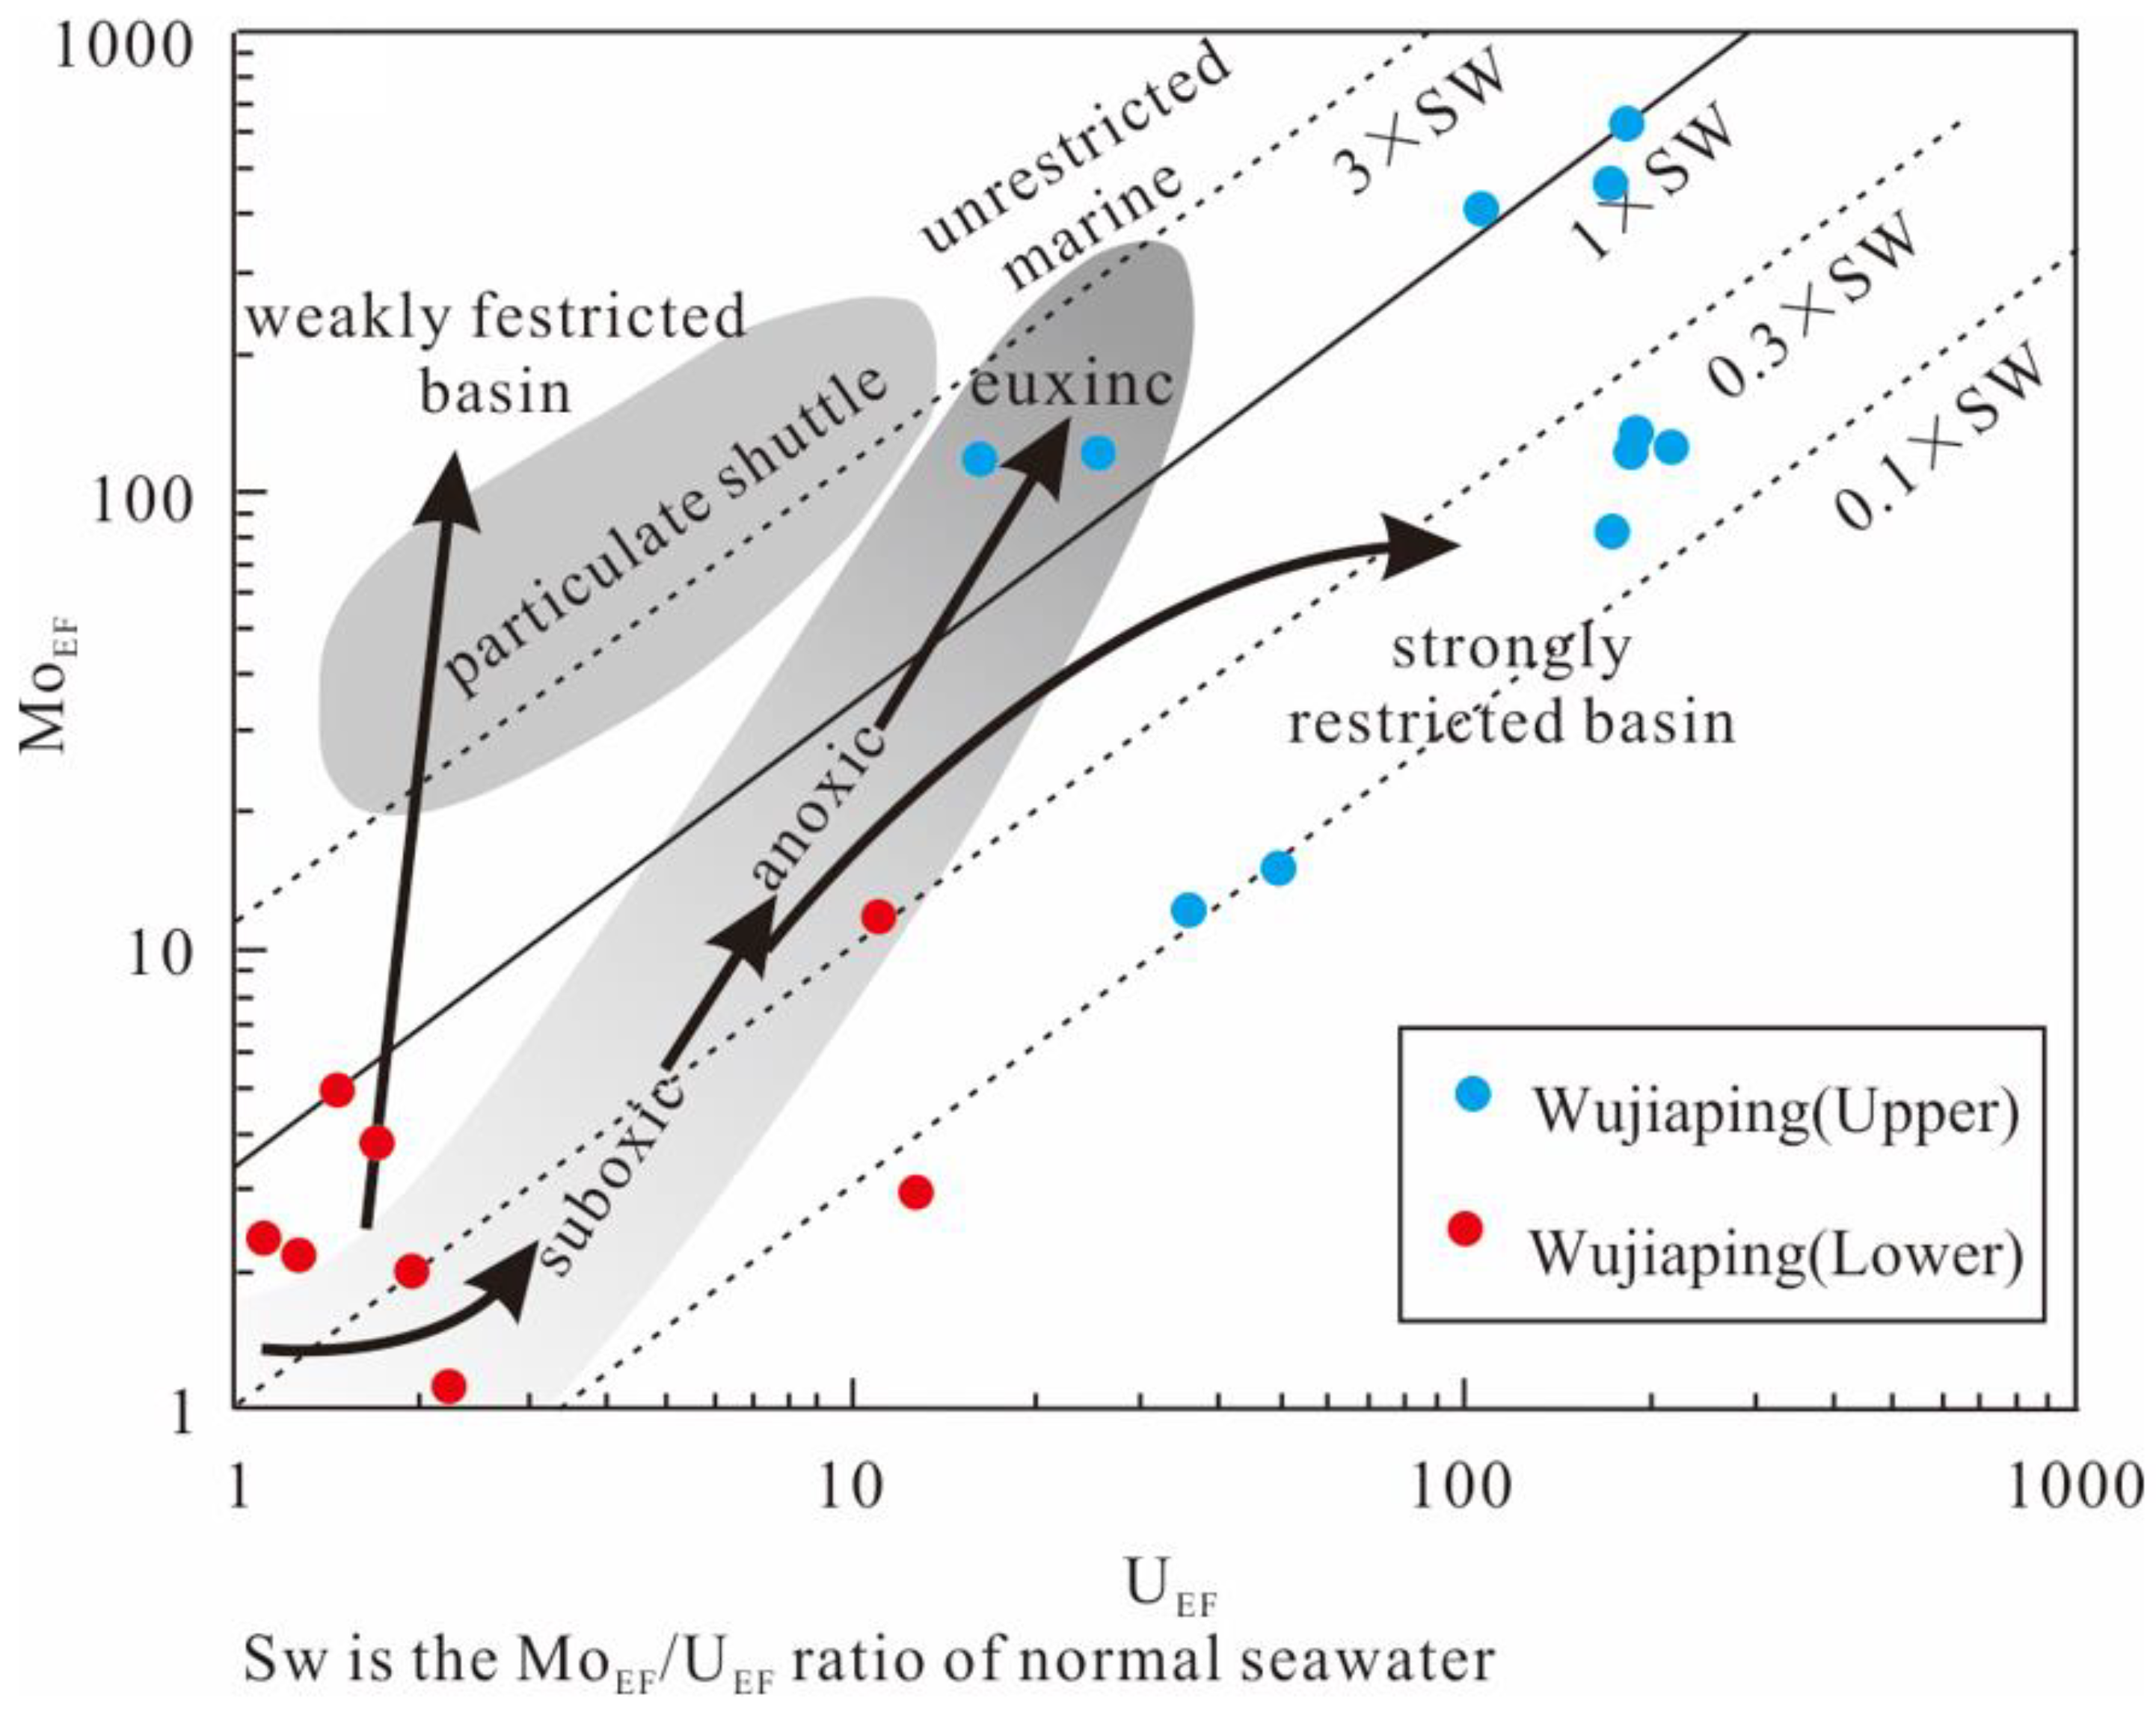
However, according to the research on biomarker compounds, the organic matter of the Late Permian Wujiaping Formation hydrocarbon source rocks in the eastern Sichuan region originated in a sulfur-rich and highly reducing environment [38]. The MoEF-UEF covariant mode of the research samples can clarify other factors such as the oxidation–reduction quality and limitation degree of the bottom water [39]. Most data from the Upper Permian Wujiaping Formation demonstrate that MoEF and UEF have almost similar trends at low values and a strong correlation, but as they go towards the upper domains, MoEF grows more in proportion to UEF, demonstrating a weak correlation (Figure 5). This trend suggests that MoEF/UEF are generally less than 1 in the lower part, and the period is basically in an open, weakly oxidizing seawater environment, which in the upper part of the Wujiaping Formation, marine waters change from suboxic to persistent hypoxic conditions, even to a strongly restricted environment. In terms of the depositional principles of Mo and V, the strong enrichment of MoEF and VEF indicates that the upper part of Wujiaping Formation is in a dead water environment, which reduces sulfidation. This confirms that, regionally, the Late Permian in South China had a variety of sulfidation environments from deep to shallow seas [1].
Ni/Co is one elemental ratio that may be used to track redox conditions. Joness and Manning [40] suggested that a Ni/Co ratio over 7.00 represents an anaerobic environment, between 5.00 and 7.00 represents an oxygen-lean environment, and below 5.00 represents an oxygen-rich environment. Ni/Co ratios are all less than 5.0 in the lower part of the Wujiaping Formation, indicating an oxygen-rich environment. They are all higher than 5.0 in the upper part of the Wujiaping Formation, indicating a relatively anoxic environment (Figure 4).
In summary, the Wujiaping Formation’s redox conditions varied greatly throughout its depositional history, developing an oxygen-rich, anaerobic environment, with the upper part being more highly reduced than the lower part, the lower part being a relatively oxygen-rich environment, and the upper part being a dead water sulphureous reducing environment.

5.1.2. Paleoproductivity

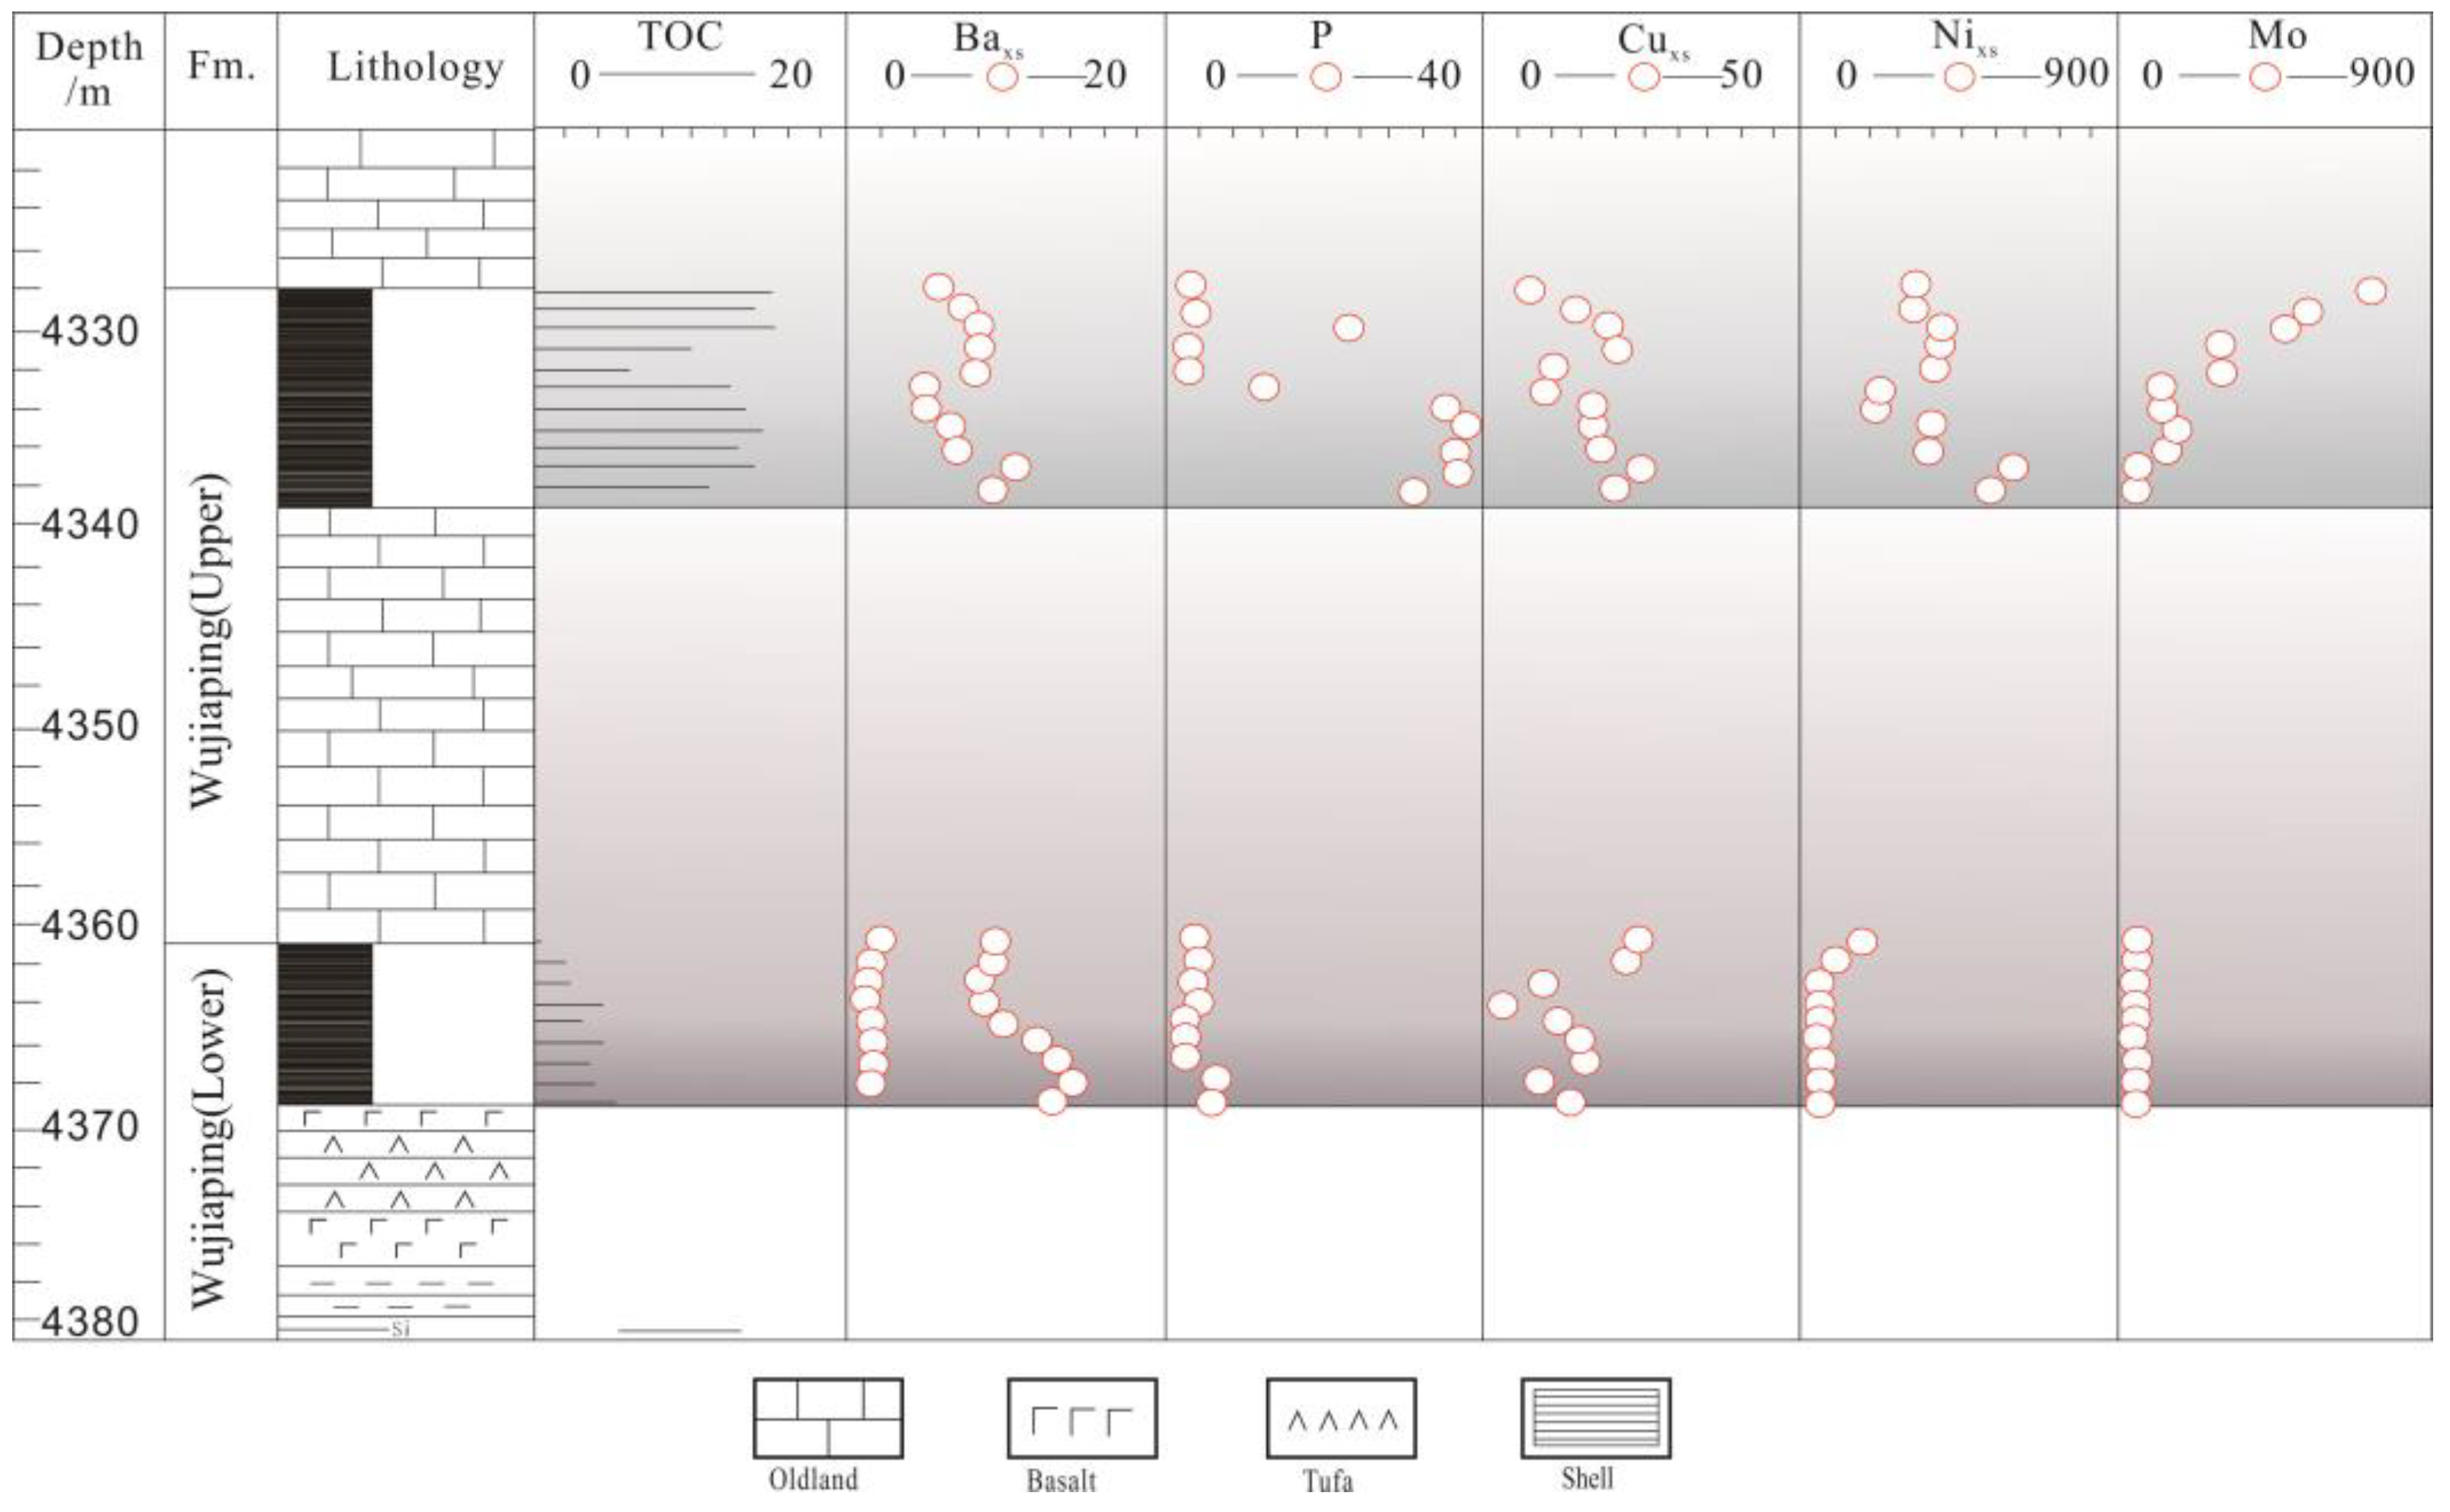
The paleoproductivity under oxidizing circumstances is best reflected by Ba organisms based on elemental Ba concentrations [41]. According to this study, Baxs’ distribution in the upper part of Wujiaping Formation ranges from 110 ug/g to 250 ug/g (on average 167.36 ug/g), whereas in the lower part, it ranges from 201 ug/g to 337 ug/g (on average 259.22 ug/g) (Figure 6), which seems to reflect lower productivity in the upper part of the Wujiaping Formation. However, substantial Ba loss occurs as a result of autogenous barium sulfate’s easy dissolution under reducing conditions, which does not represent lower productivity. On the contrary, in the Formation, high concentrations of Ni, P, and Mo excesses along with its comparatively enriched organic content imply a brisk rate of production. For example, the P distribution ranges from 300 ug/g to 7560 ug/g (on average, 2034 ug/g), which is higher than the P content of the Shangsi section in southern China (1356 ug/g–1715 ug/g). It is worth noting that P tends to move in water under reducing conditions and format out of water under oxidizing ones (Tribovillard et al., 2006); therefore, the concentration of P may fluctuate under redox conditions. For example, P content increases from the lower part to the upper part of the Wujiaping Formation (Figure 6). In order to avoid the dilution effect of sedimentary organic matter and authigenic minerals on P content in terrigenous clastic rocks, the P/Ti ratio can be adopted to represent the nutrient composition of the ocean [42]. From the P/Ti ratio, the upper part of the Wujiaping Formation is more productive than the lower part since it is much higher (Figure 6).
Ni and Cu are produced during the decomposition of organic matter and are maintained by pyrite capture in the sediment under sulfate reducing conditions, which means Ni and Cu are ideal indicators of the amount of organic matter entering the sediment under reducing conditions [43]. The upper part of the Wujiaping Formation has an average Ni value reaching 222.51 ug/g and an average Cu content of 140.64 ug/g. The terrestrial components of Cu and Ni need to be removed in order to reconstruct paleoproductivity. The Nixs in the upper part of Wujiaping Formation simples are on average 200.80 ug/g, almost twice as high as PAAS’s Ni concentration of 68 ug/g, and the Cuxs are on average 126.28 ug/g, almost three-times as high as PASS’s Cu concentration of 45 ug/g (Figure 6), suggesting a high level of paleoproductivity of the upper part of the Wujiaping Formation.
In extremely reduced sulfide environments, variable ions, such as Mo, easily combine with sulfur ions and enter the sediment, and the flux is approximately proportional to the rate of organic carbon accumulation. Thus, Mo can be used as an indicator of productivity under certain conditions; for example, during the Cretaceous period, black shales of the Cariaco and Cape Verde basins in Venezuela show a positive correlation between Mo and deposition fluxes of organic carbon [44]. The previous study found that the Late Permian Wujiaping Formation in the study area is a sulfidation reduction environment, where Mo is an ideal indicator of paleoproductivity, with Mo content in the upper part ranging from 16.25 ug/g to 398.00 ug/g, reaching an average of 143.76 ug/g, much higher than PAAS (2.60 ug/g) (Table 1), while the Mo distribution in the lower part ranges from 3.18 ug/g to 8.82 ug/g (on average, 5.04 ug/g), reflecting the high paleoproductivity of the upper part of the Wujiaping Formation in the study area, compared to the lower part, during the shale depositional period.

5.1.3. Deposition Rate

Rare earth elements (REEs) are primarily carried into the ocean along with debris or suspended materials. The oceanic retention time will be a key factor in the fractionation of rare earths [45]. High deposition rates cause sediments to deposit quickly, and REEs’ limited contact periods with clay minerals result in a weak differential degree; conversely, modest deposition rates cause sediments to be deposited gradually, giving time for rare earth elements (REEs) to interact with clay minerals and bind to organic matter, resulting in a substantial fractionation of REEs [42]. As a result, the degree of REE fractionation can be used to determine the sediment deposition rate. The (La/Yb)N ratio (UCC standardization) is a reliable indicator of the degree of REE differentiation. The (La/Yb)N ratio represents a high deposition rate (weak REE fractionation) when it is close to 1.0 and a low deposition rate (strong REE fractionation) when it is much higher or lower than 1.0 [46]. The lower (La/Yb)N ratio of the Wujiaping Formation ranges from 0.80 to 1.00 (Table 2), representing a higher deposition rate, while the upper (La/Yb)N ratio of the Wujiaping Formation ranges from 0.54 to 0.73 (Table 2), reflecting a lower deposition rate for this period.

5.1.4. The Relation among TOC, Paleoproductivity, and Redox

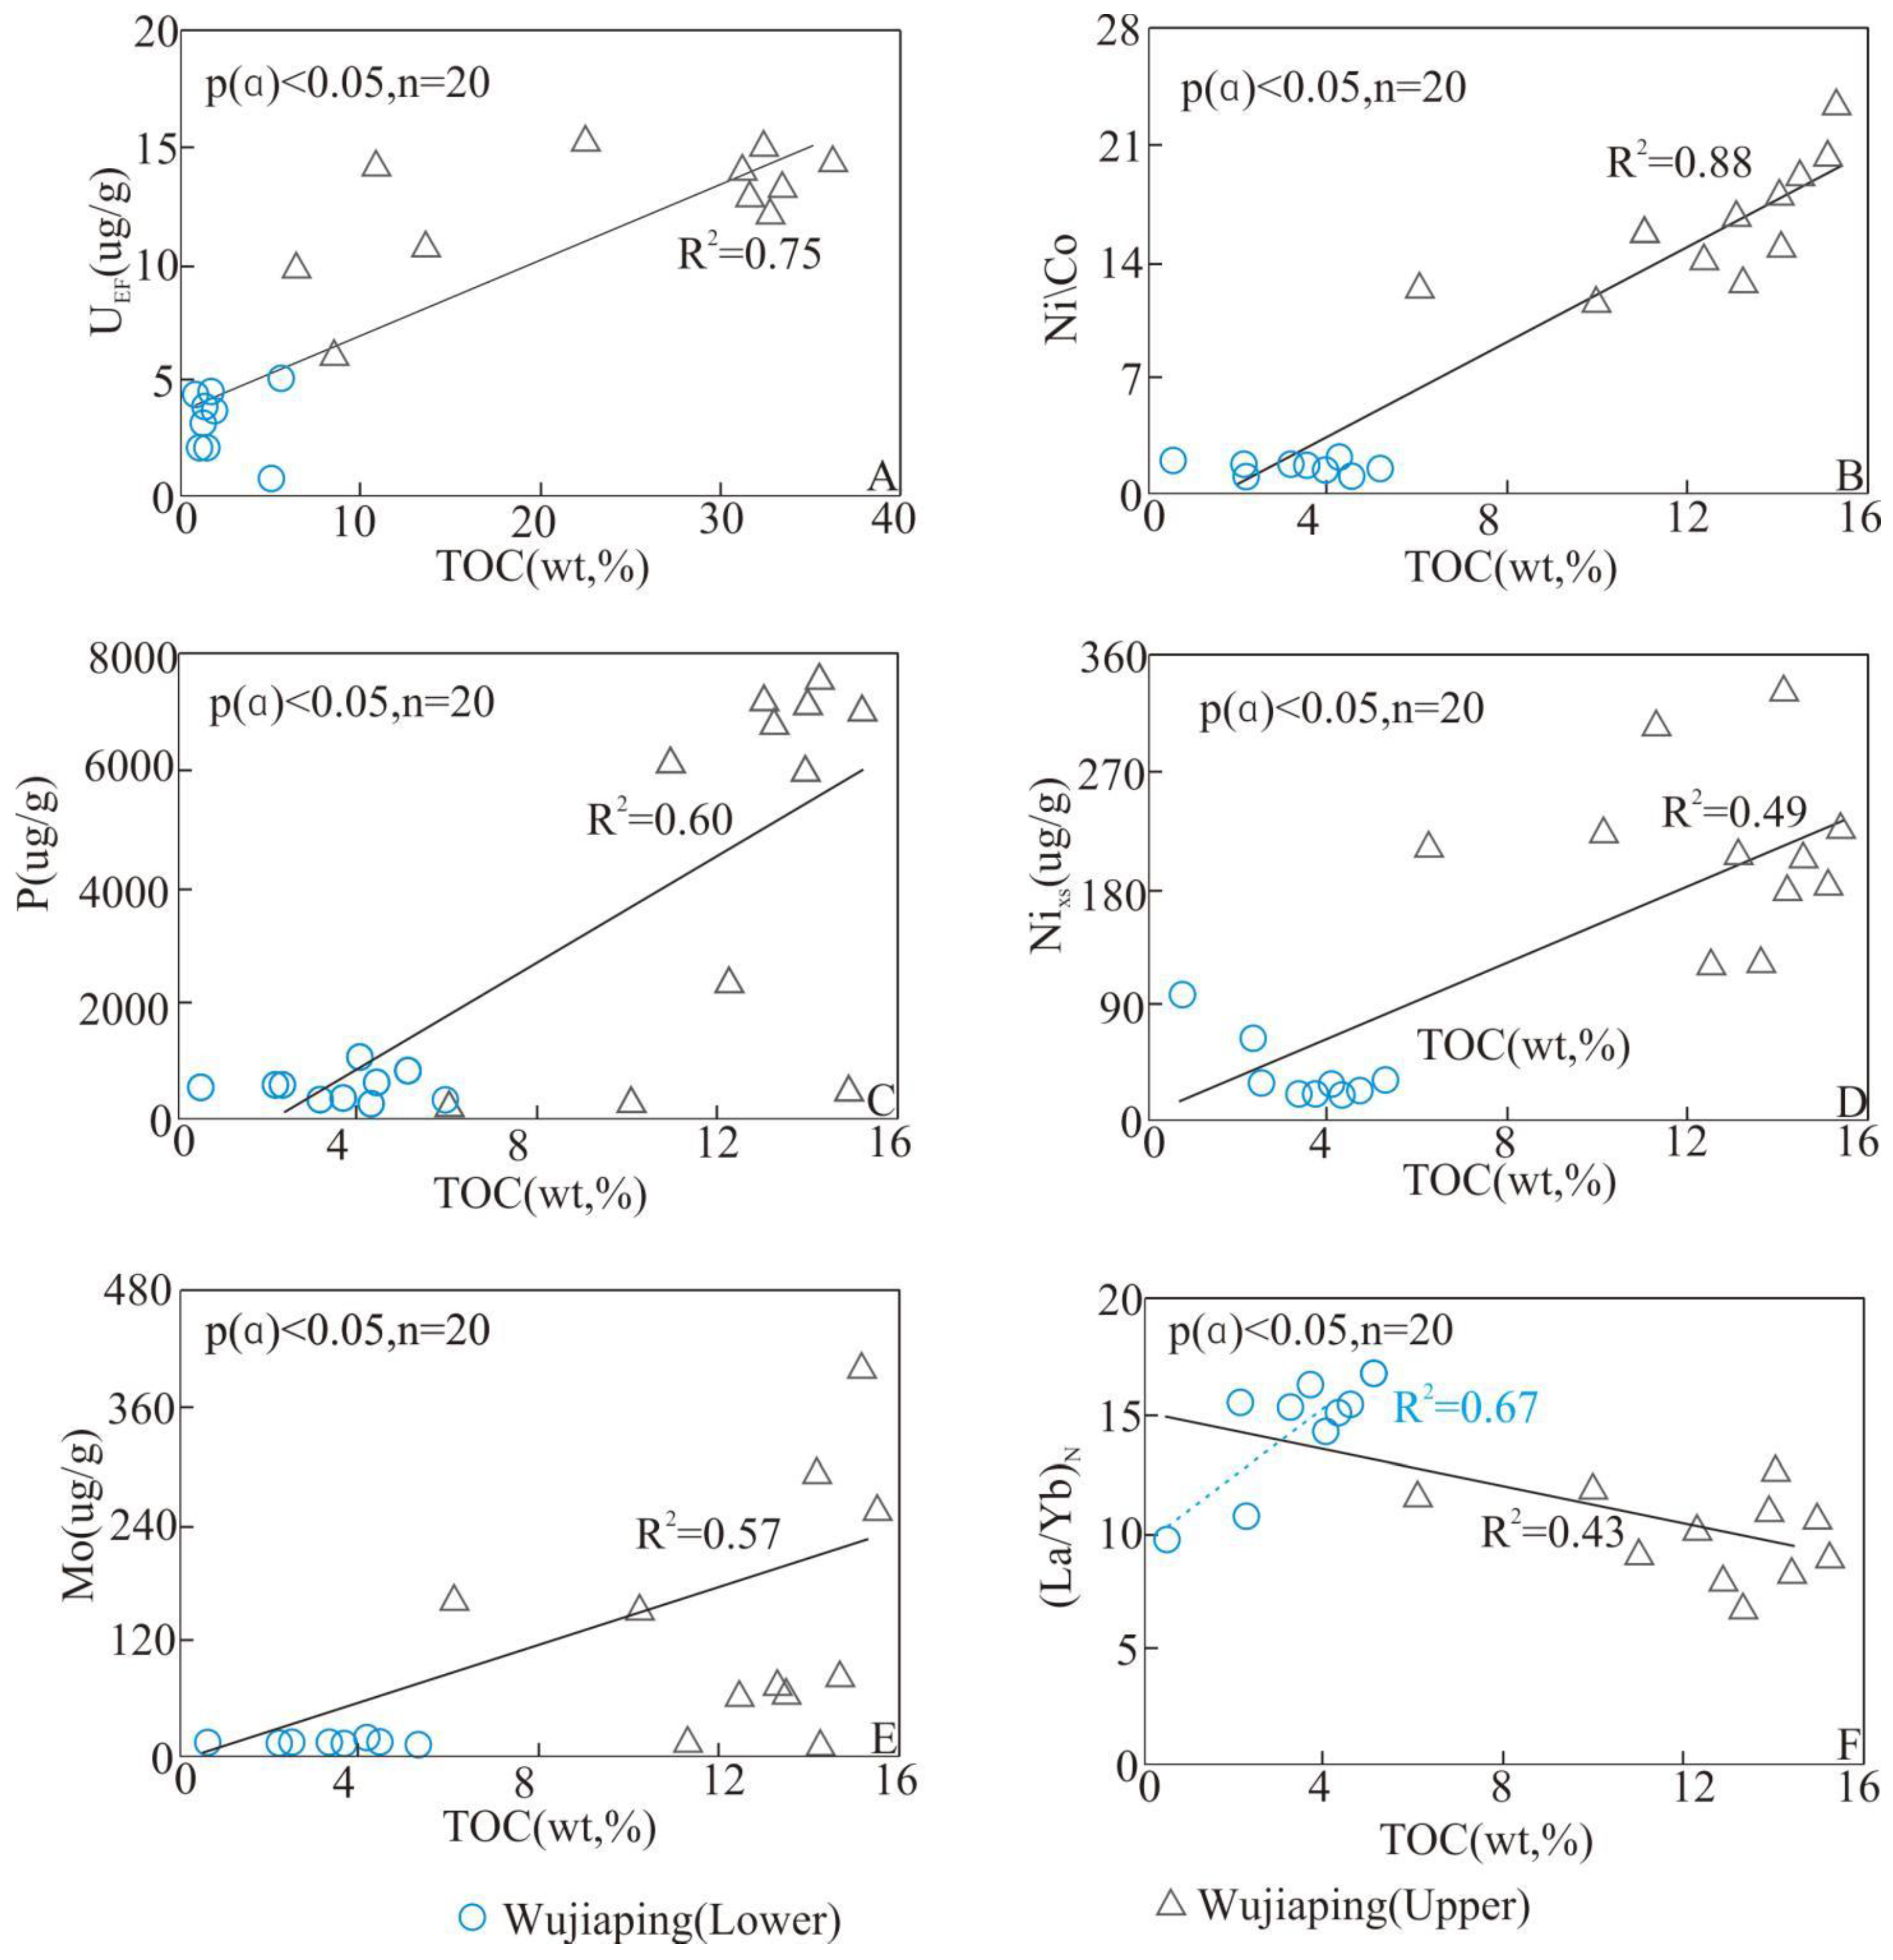
In order to determine the main controlling factor of the organic matter enrichment of the shale in the Wujiaping Formation, the relations between various indicators and TOC were analyzed, respectively. Figure 7A,B indicate that a significant positive correlation exists between the content of TOC and two redox indicators, UEF and Ni/Co, with correlation coefficients of 0.75 and 0.88, respectively (Figure 7). Simultaneously, the content of TOC is positively correlated with P, Mo, and Nixs, with correlation coefficients of 0.60, 0.49, and 0.57, respectively (Figure 7C–E). Therefore, the redox property and paleoproductivity have a significant impact on the content of TOC. The correlation between TOC and the deposition rate (La/Yb)N also reaches 0.44, especially with the lower part of the Wujiaping Formation, reaching 0.67 (Figure 7F).
The lower part of the Wujiaping Formation has lower productivity and oxidizability, but its deposition rate is higher and its TOC is medium; in contrast, the upper part of the Wujiaping Formation has higher productivity and develops a sulfidation reducing environment, as well as shows the highest primary productivity, which indicates that the deposition rate mainly impacts the enrichment of TOC at the lower part of the Wujiaping Formation, while the EHOMC at the upper part of the Wujiaping Formation is mainly impacted by the preservation condition and productivity.

5.2. Paleogeography Factors Causing Productivity and Anoxic Environment Changes

5.2.1. Reasons for High Productivity

Factors impacting productivity mainly include weathering, climate, and terrestrial input. Terrestrial input is mainly the source and transport mode of nutrient input. Nutrient elements can get into water bodies through rivers and upwellings [47].
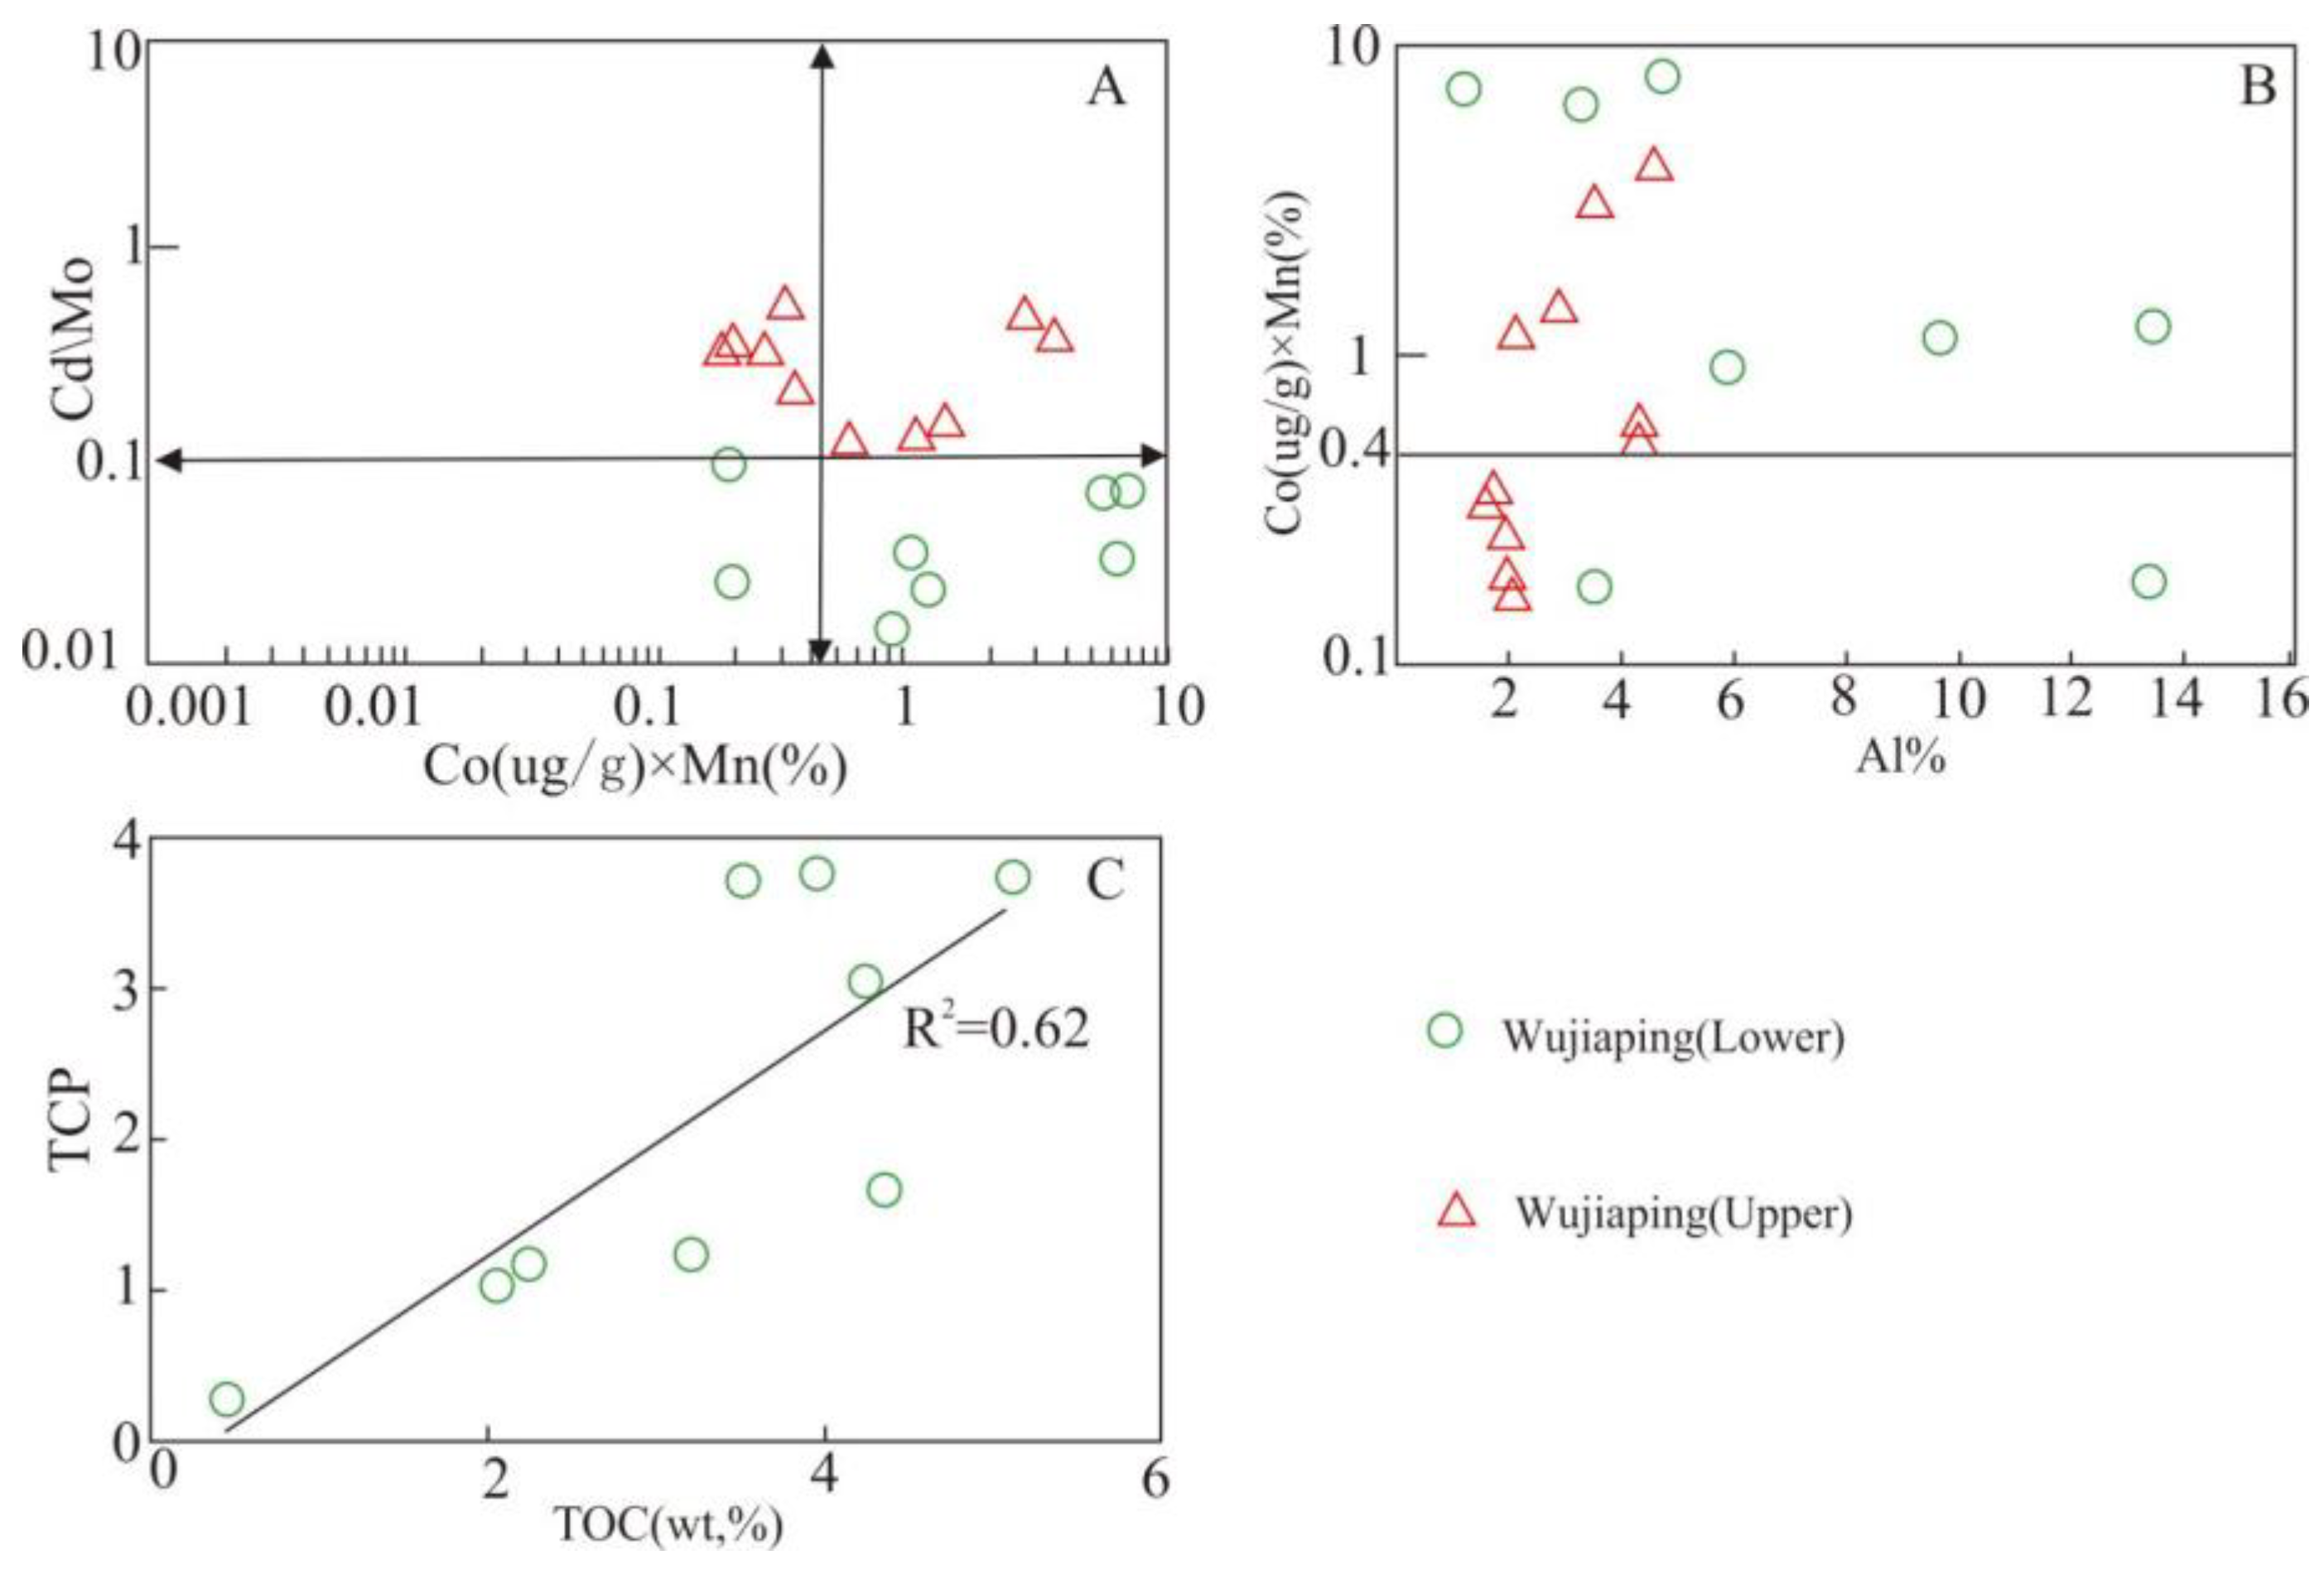
Hydrothermal activities usually carry nutrients to the sea level through upwelling, thereby significantly increasing the paleoproductivity and the enrichment of organic matter. Some scholars have indicated that the northern margin of South China was in the upwelling region (east of the Paleo-Tethys at that time) during the Late Permian [48]. Volcanic activities in South China were frequent during the Permian, and the basalt and tuff at the bottom of the Wujiaping Formation of Well A had developed to 40 m, indicating that Kaijiang-Liangping Trough was covered by volcanic activities during the end of the Late Permain and the value of paleo-heat flows at the northeast of Sichuan Basin had increased significantly with the intensification of mantle plume activities at Emei [49]. Eu has good indicative significance for hydrothermal processes. The range of value of Euef from the lower part to the upper part is 1.03~10.43, which has the typical feature of hydrothermal fluid (Table 1). Moreover, Cd/Mo and Co × Mn have been widely used to track various environments, such as upwelling and a confined water environment [50]. Sweere proposed that the upwelling and confined threshold of Cd/Mo and Co × Mn are 0.1 and 0.4, respectively. The overlap graph of Cd/Mo and Co × Mn shows that some specimens of the upper part of the Wujiaping Formation distribute in the upwelling area (Cd/Mo > 0.1; Co × Mn < 0.4) (Figure 8A,B). Thus, hydrothermal fluid upwelling is the important factor for impacting the productivity of the upper part of the Wujiaping Formation during the Late Permian.
Climate is the main cause of the depositional environment change, which mainly impacts the weathering of parent rocks, sediment erosion, and the transport and supply of terrigenous clastic rocks. Considering that Fe, Mn, Cr, Ni, V, and Co are generally enriched in humid conditions, while Ca, Mg, Sr, Ba, K, and Na are accumulated in arid environments, C = Σ(Fe + Mn + Cr + Ni + V + Co)/Σ(Ca + Mg + Sr + Ba + K + Na) is adopted to represent the paleoclimate. C values of 0.6~0.8, 0.4~0.6, and 0.2~0.4 represent semi-humid, semi-humid, semi-arid, and semi-arid climates, while C values >0.8 or <0.2 reflect humid and arid paleoclimatic environments, respectively [51]. From the change of the C value, C is generally greater than 0.8, which indicates that the paleoclimate is in a humid environment.
The Chemical Index of Alteration (CIA) is an index to indicate the degree of chemical weathering. The degree of weathering is affected by climate, and a warm and humid climate will lead to heavier weathering and a higher CIA value. CIA = {x(Al2O3)/ [x(Al2O3) + x(CaO*) + x(Na2O) + x(K2O)]} × 100. The difficulty of accurate calculation of CIA is to deduct CaO in phosphate. The calibration method proposed by Mclennan et al. was used to remove Ca from phosphate in this study [52]. A CIA within the range of 50–60 represents low weathering; 60–80 represents moderate weathering; more than 80 represents heavy weathering. According to the analysis of the major elements of Well A, the CIA value during the Late Permian is 52.48–76.25. In general, the weathering in the Late Permian was moderate.
Al, Zr, and the input composition of terrigenous clastic rocks (TCP = Tisample/TiPAAS × 100%) are widely used to indicate terrestrial input. The three parameters gradually decrease from the lower part to the upper part of the Wujiaping Formation (Table 1), reflecting that the input of terrigenous clastic rocks in the lower part of the Wujiaping Formation is higher than that in the upper part of the Wujiaping Formation, and the terrestrial input of the lower part of the Wujiaping Formation has a good correlation with TOC. Therefore, it can be inferred that, under the influence of a humid climate and moderate weathering, the nutrient input from land and the high deposition rate are the main reasons for the organic matter accumulation in the lower part of the Wujiaping Formation.

5.2.2. Sea Level Change

In recent years, many scholars have carried out comparatively deep research on the sequence of the Late Permian–Early Triassic in South China and the level, quantity, and duration of the corresponding sea level changes [53,54]. From the end of the Middle Permian to the beginning of the Late Permian, the Dongwu Movement caused large-scale tension movement in the upper Yangtze platform area. Sichuan Basin was uplifted and denuded integrally, and the sea level declined on a large scale. However, an open weak oxidizing seawater environment has been formed in the Kaijiang-Liangping Trough, and a set of siliceous clay shales was deposited (Figure 2). Besides, a large transgression began after the Dongwu Movement. In the middle and late Wujiaping Period, due to the crust sinking, the sea water invading the basin from the east and north, and the northeast of Sichuan being drowned widely, the Kaijiang-Liangping Trough kept the deep-water, low-energy, and reducing environment and accepted the deposition of the black carbonaceous shale and siliceous calcareous mixed shale, which are rich in organic matter in the middle and upper sections (Figure 2).
Geochemical data show that land input is also a good indication of sea level change. The content of TCP and Al2O3 is the highest in the lower part of the Wujiaping Formation (Table 1). This indicates that the sea level of the lower part of the Wujiaping Formation is obviously lower than that of the upper part of the Wujiaping Formation. Therefore, the Wujiaping Formation as a whole is a process of transgression.

5.3. Enrichment Pattern of EHOMC

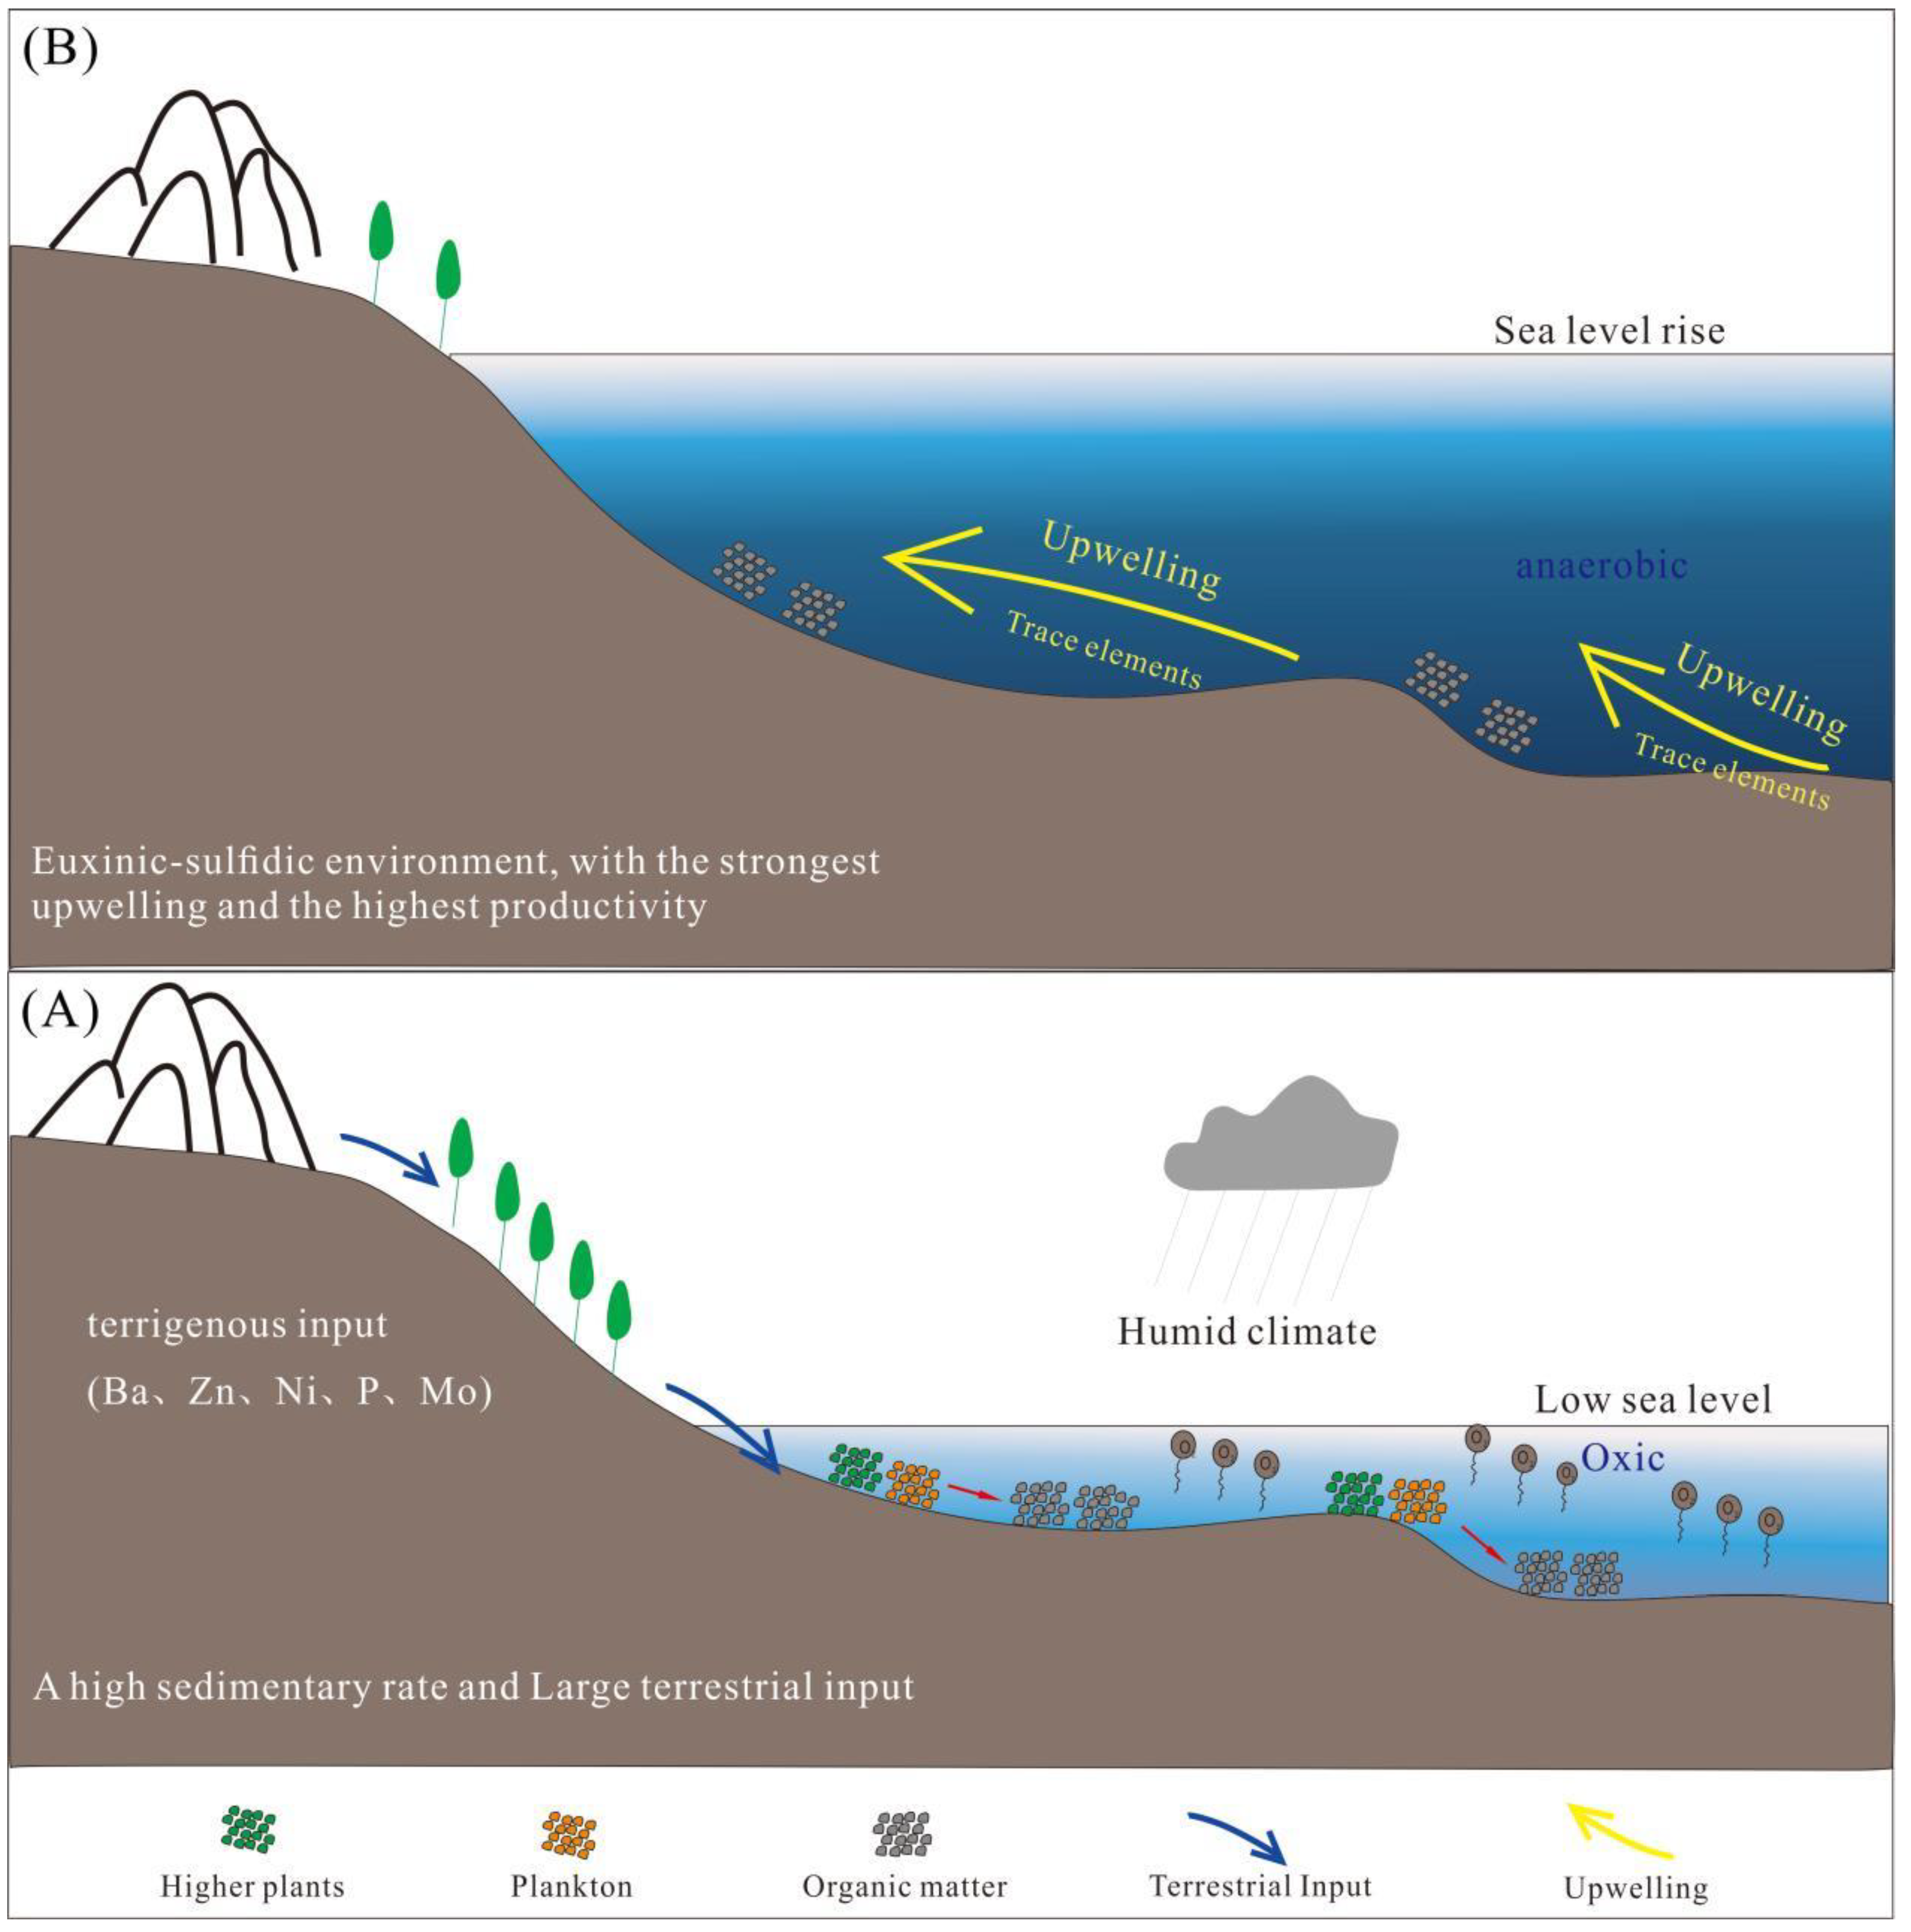
The black shale of Well A has different TOC contents, redox conditions, and primary productivity, especially when the TOC content exceeds 10%, which provides an excellent case for studying the enrichment mechanism of EHOMC. Based on the redox conditions, paleoproductivity, and paleoenvironment of the Late Permian, two classification models are proposed (Figure 9).
At the beginning of the Late Permian, the Permian in Sichuan Basin was located in a low-latitude area [38], which was a tropical warm-water sedimentary environment with a warm and humid climate. Simultaneously, the Permian on the carbonatite platform depositional environment brought vitality to plankton [38] and higher plants (Figure 2D). On the one hand, more nutrients were imported from the land, and organisms reproduced in large numbers, providing organic matter sources for rich organic shale [55]. The organic matter will be further buried and preserved after production. Although the oxidation environment is not conducive to the preservation of organic matter, the lower part of the Wujiaping Formation has a higher deposition rate, which can shorten the exposure time of organic matter in oxygen-rich water bodies, so that organic matter cannot be oxidized or decomposed in time [56]. Therefore, during this period, the accumulation of OM was mainly based on the high deposition rate and terrestrial nutrients, which promoted the accumulation of organic matter (Figure 9A).
In the global plate tectonic framework, the Permian on the Sichuan Basin is located in the eastern structural domain of the Tethys Ocean in the Permian, surrounding the eastern Tethys Ocean and the Paleo-Pacific Ocean [57]. The eastern Circum-Tethys Ocean is located in the upwelling region [48], and the hydrothermal upwelling developed in the upper part of the Wujiaping Formation in the late Permian, so that a large amount of nutrients may reach the sea surface with the upwelling, stimulating the development of primary productivity. When the upper part of the Wujiaping Formation was deposited, the sea level was always higher with the continuous rise of the sea level. The deep-water setting promoted the formation of the sulfidation reducing environment, which was conducive to the preservation of organic matter. Coincidentally, during this period, biological extinction occurred, accompanied by a wide range of lentic environments, resulting in the release of H2S gas, and the scope of sulfurization was large [58]. Therefore, sea level rise, the sulfidation reducing environment, and upwelling affect productivity and preservation conditions and promote the enrichment of OM (Figure 9B).

6. Conclusions

The shale of the Wujiaping Formation in the Kaijiang-Liangping Trough was taken as the research object to study its depositional environment and organic matter enrichment characteristics. The conclusions are as follows:
(1) During the deposition period of the Wujiaping Formation, the sea level continued to rise and productivity gradually increased. The lower part of the Wujiaping Formation was integrally in an oxidation environment, but with a higher deposition rate; the upper part of the Wujiaping Formation had higher primary productivity and a strong reducing environment, and there existed obvious hydrothermal upwelling activity.
(2) There are two enrichment models of organic matter in the Wujiaping Formation: One is a low paleoproductivity, an oxygen-rich environment, and a high deposition rate; The other one is a high paleoproductivity, reducing environment, and hydrothermal upwelling model. The upper part of the Wujiaping Formation has better oil and gas exploration potential.
(3) The enrichment of EHOMC is related to sea level rise, a high paleoproductivity, and a sulfidation reducing environment, and a high paleoproductivity is caused by strong hydrothermal upwelling.

Author Contributions

Conceptualization and methodology, Y.D.; writing—original draft preparation, Y.D.; investigation, X.W.; resources, R.T.; software, Y.Z.; validation and data curation, H.Z., C.Y. and Q.P. All authors have read and agreed to the published version of the manuscript.

Funding

This research received no external funding.

Institutional Review Board Statement

“Not applicable” for studies not involving humans or animals.

Informed Consent Statement

Not applicable to research not involving human beings.

Data Availability Statement

The original data used for the simulations are not publicly available.

Conflicts of Interest

The authors declare no conflict of interest.

References

  1. Pang, Q.; Zhang, X.H.; Chen, C.; Gao, Z.L.; Shan, S.J.; Chen, Y.G.; You, J.; Hu, C.W.; Hu, G. Extraordinarily high organic matter enrichment during the late Guadalupian in northwestern Sichuan basin, China. J. Pet. Sci. Eng. 2022, 210, 110058. [Google Scholar] [CrossRef]
  2. Scott, C.; Slack, J.F.; Kelley, K.D. The hyper-enrichment of V and Zn in black shales of the Late Devonian-Early Mississippian Bakken Formation (USA). Chem. Geol. 2017, 452, 24–33. [Google Scholar] [CrossRef] [Green Version]
  3. Curtis, J.B. Fractured shale-gas systems. AAPG Bull. 2002, 86, 1921–1938. [Google Scholar]
  4. Xia, G.Q.; Mansour, A.; Gentzis, T.; Li, G.J.; Carvajal-Ortiz, H.; Ocubalidet, S.; Yi, F.; Yun, C.; Yi, H.S. Depositional paleoenvironment and source rock characterization across the Toarcian Oceanic Anoxic Event from the eastern Tethys, Tibet, SW China. Int. J. Coal Geol. 2021, 243, 103780. [Google Scholar] [CrossRef]
  5. Liang, D.G.; Guo, T.L.; Bian, L.Z.; Chen, J.; Zhao, Z. Some progresses on studies of hydrocarbon generation and accumulation in marine sedimentary regions, Southern China (Part 3): Controlling factors on the sedimentary facies and development of Palaeozoic marine source rocks. Mar. Orig. Pet. Geol. 2009, 14, 1–19. [Google Scholar]
  6. Dong, D.Z.; Gao, S.; Huang, J.L.; Guan, Q.; Wang, S.; Wang, Y. A discussion on the shale gas exploration & development prospect in the Sichuan Basin. Nat. Gas Ind. 2014, 34, 1–15. [Google Scholar]
  7. Dong, D.Z.; Cheng, K.M.; Wang, Y.M.; Li, X.J.; Wang, S.J.; Huang, J.L. Forming conditions and characteristics of shale gas in the Lower Paleozoic of the Upper Yangtze region, China. Oil Gas Geol. 2010, 31, 288–299. [Google Scholar]
  8. Wei, Z.; Wang, Y.; Wang, G.; Sun, Z.; Xu, L. Pore characterization of organic-rich Late Permian Da-long Formation shale in the Sichuan Basin, southwestern China. Fuel 2018, 211, 507–516. [Google Scholar] [CrossRef]
  9. Zhao, P.R.; Gao, B.; Guo, Z.F.; Wei, Z.H. Exploration potential of marine-continental transitional and deep-water shelf shale gas in Upper Permian, Sichuan basin. Pet. Geol. Exp. 2020, 42, 335–344. [Google Scholar]
  10. Demaison, G.J.; Moore, G.T. Anoxic environments and oil source bed genesis. AApG Bull. 1980, 64, 1179–1209. [Google Scholar] [CrossRef]
  11. Pedersen, T.F.; Calvert, S.E. Anoxia vs. productivity: What controls the formation of organic-carbon-rich sediments and sedimentary rocks? Aapg Bull. 1990, 74, 454–466. [Google Scholar]
  12. Bruyevich, S. Rates of mineralization of suspended organic carbon in the low latitudes of the Pacific during the pre-depositional stage. Geochemistry 1963, 3, 349–352. [Google Scholar]
  13. Mort, H.; Jacquat, O.; Adatte, T.; Steinmann, P.; Föllmi, K.; Matera, V.; Berner, Z.; Stüben, D. The Cenomanian/Turonian anoxic event at the Bonarelli Level in Italy and Spain: Enhanced productivity and/or better preservation? Cretac. Res. 2007, 28, 597–612. [Google Scholar] [CrossRef] [Green Version]
  14. Mansour, A.; Wagreich, M.; Gier, S.; Gentzis, T.; Kloetzli, U.; Tahoun, S.S. Elewa AM. Climate variability and paleoceanography during the Late Cretaceous: Evidence from palynology, geochemistry and stable isotopes analyses from the southern Tethys. Cretac. Res. 2021, 126, 104831. [Google Scholar] [CrossRef]
  15. Sageman, B.B.; Murphy, A.E.; Werne, J.P.; Ver Straeten, C.A.; Hollander, D.J.; Lyons, T.W. A tale of shales: The relative roles of production, decomposition, and dilution in the accumulation of organic-rich strata, Middle–Upper Devonian, Appalachian basin. Chem. Geol. 2003, 195, 229–273. [Google Scholar] [CrossRef]
  16. Smith, M.G.; Bustin, R.M. Production and preservation of organic matter during deposition of the Bakken Formation (Late Devonian and Early Mississippian), Williston Basin. Palaeogeogr. Palaeoclimatol. Palaeoecol. 1998, 142, 185–200. [Google Scholar] [CrossRef]
  17. Wignall, P.B.; Sun, Y.; Bond, D.P.; Izon, G.; Newton, R.J.; Védrine, S.; Widdowson, M.; Ali, J.R.; Lai, X.; Jiang, H.; et al. Volcanism, Mass Extinction, and Carbon Isotope Fluctuations in the Middle Permian of China. Science 2009, 324, 1179–1182. [Google Scholar] [CrossRef]
  18. Zhang, B.; Wignall, P.B.; Yao, S.; Hu, W.; Liu, B. Collapsed upwelling and intensified euxinia in response to climate warming during the Capitanian (Middle Permian) mass extinction. Gondwana Res. 2021, 89, 31–46. [Google Scholar] [CrossRef]
  19. Shen, S.Z.; Yuan, D.X.; Henderson, C.M.; Wu, Q.; Zhang, Y.C.; Zhang, H.; Mu, L.; Ramezani, J.; Wang, X.D.; Lambert, L.L.; et al. Progress, problems and prospects: An overview of the Guadalupian Series of South China and North America. Earth-Sci. Rev. 2020, 211, 103412. [Google Scholar] [CrossRef]
  20. Bian, L.; Schovsbo, N.H.; Chappaz, A.; Zheng, X.; Nielsen, A.T.; Ulrich, T.; Wang, X.; Dai, S.; Galloway, J.M.; Małachowska, A.; et al. Molybdenum-uranium-vanadium geochemistry in the lower Paleozoic Alum Shale of Scandinavia: Implications for vanadium exploration. Int. J. Coal Geol. 2021, 239, 103730. [Google Scholar] [CrossRef]
  21. Tibiletti, M.G.; Trubia, M.; Ponti, E.; Sessa, L.; Acquati, F.; Furlan, D.; Bernasconi, B.; Fichera, M.; Mihalich, A.; Ziegler, A.; et al. Physical map of the D6S149-D6S193 region on chromosome 6Q27 and its involvement in benign surface epithelial ovarian tumours. Oncogene 1998, 16, 1639. [Google Scholar] [CrossRef] [PubMed] [Green Version]
  22. Feng, Z.; Yang, Y.; Jin, Z.; He, Y.; Wu, S.; Xin, W.; Bao, Z.; Tan, J. Lithofacies paleogeography of the Permian of South China. Acta Sedimentol. Sin. 1996, 14, 1–11. [Google Scholar]
  23. Wang, X.Z.; Li, B.; Yang, X.Y.; Wen, L.; Xu, L.; Xie, S.Y.; Du, Y.; Feng, M.Y.; Yang, X.F.; Wang, Y.P.; et al. Characteristics of “Guangyuan-Wangcang” trough during late Middle Permian and its petroleum geological significance in northern Sichuan Basin, SW China. Pet. Explor. Dev. 2021, 48, 562–574. [Google Scholar] [CrossRef]
  24. Xiao, W.; Zhang, B.; Yao, Y.J.; Wang, Y.; Yang, H.Y.; Yang, K. Lithofacies and sedimentary environment of shale of Permian Longtan Formation in eastern Sichuan Basin. Lithol. Reserv. 2022, 34, 152–162. [Google Scholar]
  25. Taylor, S.R. The abundance of chemical elements in the continental crust-A new table. Geochim. Cosmochim. Acta 1964, 28, 1273–1285. [Google Scholar] [CrossRef]
  26. Wedepohl, K.H. Environmental influences on the chemical composition of shales and clays. Phys. Chem. Earth 1971, 8, 305–333. [Google Scholar] [CrossRef]
  27. Tribovillard, N.; Algeo, T.J.; Lyons, T.; Riboulleau, A. Trace metals as paleoredox and paleoproductivity proxies: An update. Chem. Geol. 2006, 232, 12–32. [Google Scholar] [CrossRef]
  28. Turekian, K.K.; Wedepohl, K.H. Distribution of the Elements in Some Major Units of the Earth’s Crust. Geol. Soc. Am. Bull. 1961, 72, 175. [Google Scholar] [CrossRef]
  29. Brumsack, H.J. The trace metal content of recent organic carbon-rich sediments: Implications for Cretaceous black shale formation. Palaeogeogr. Palaeoclimatol. Palaeoecol. 2006, 232, 344–361. [Google Scholar] [CrossRef]
  30. Windley, B.F. The continental crust: Its composition and evolution. Phys. Earth Planet. Inter. 1986, 42, 196–197. [Google Scholar] [CrossRef]
  31. Huang, Z.; Wang, X.; Yang, X.; Zhu, R.; Cui, J.; Shi, W.; Zhu, Y. Paleoenvironment and Organic Matter Accumulation of the Upper Ordovician-Lower Silurian, in Upper Yangtze Region, South China: Constraints from Multiple Geochemical Proxies. Energies 2020, 13, 858. [Google Scholar] [CrossRef] [Green Version]
  32. McLennan, S.M.; Taylor, S.R. Sedimentary rocks and crustal evolution: Tectonic setting and secular trends. J. Geol. 1991, 99, 1–21. [Google Scholar] [CrossRef]
  33. Gromet, L.P.; Haskin, L.A.; Korotev, R.L.; Dymek, R.F. The “North American shale composite”: Its compilation, major and trace element characteristics. Geochim. Cosmochim. Acta 1984, 48, 2469–2482. [Google Scholar] [CrossRef]
  34. Du, Y.; Wang, X.; Zhao, R.R.; Chen, C.; Wen, S.; Tang, R.F.; Zahng, J.Z.; Zhang, Y.; He, S. Controlling factors of organic matter enrichment in continental shale: A case study of the Jurassic Da'anzhai member in the Sichuan Basin. Frontiers in Earth Science 2022, 10, 921529. [Google Scholar] [CrossRef]
  35. Glass, J.B.; Chappaz, A.; Eustis, B.; Heyvaert, A.C.; Waetjen, D.P.; Hartnett, H.E.; Anbar, A.D. Molybdenum geochemistry in a seasonally dysoxic Mo-limited lacustrine ecosystem. Geochim. Cosmochim. Acta 2013, 114, 204–219. [Google Scholar] [CrossRef] [Green Version]
  36. Glass, J.B.; Chappaz, A.; Eustis, B.; Heyvaert, A.C.; Waetjen, D.P.; Hartnett, H.E.; Anbar, A.D. Trace metal evidence for changes in the redox environment associated with the transition from terrigenous clay to diatomaceous sediment, Saanich Inlet, BC. Mar. Geol. 2001, 174, 355–369. [Google Scholar]
  37. Takahashi, S.; Yamasaki, S.I.; Ogawa, Y.; Kimura, K.; Kaiho, K.; Yoshida, T.; Tsuchiya, N. Bioessential element-depleted ocean following the euxinic maximum of the end-Permian mass extinction. Earth Planet. Sci. Lett. 2014, 393, 94–104. [Google Scholar] [CrossRef]
  38. Tenger, Q.J.; Fu, X.; Yang, Y.; Xie, X. Hydrocarbon source rocks evaluation of the Upper Permian Wujiaping Formation in northeastern Sichuan area. J. Palaeogeogr. 2010, 12, 334–346. [Google Scholar]
  39. Algeo, T.J.; Tribovillard, N. Environmental analysis of paleoceanographic systems based on molybdenum–uranium covariation. Chem. Geol. 2009, 268, 211–225. [Google Scholar] [CrossRef]
  40. Jones, B.; Manning, D.A. Comparison of geochemical indices used for the interpretation of palaeoredox conditions in ancient mudstones. Chem. Geol. 1994, 111, 111–129. [Google Scholar] [CrossRef]
  41. Huang, Z.S.; Wang, X.Z.; Yang, X.Y.; Zhu, R.K.; Cui, J.W.; Lu, Y.Z.; Li, Y. Constraints of sedimentary environment on organic matter accumulation in shale:A case study of the Wufeng-Longmaxi Formations in the southern Sichuan Basin. Acta Sedimentol. Sin. 2021, 39, 631–644. [Google Scholar]
  42. Liu, W.; Xu, Y.; Chen, J. Comprehensive geochemical identification of highly evolved marine carbonate rocks as hydrocarbon-source rocks as exemplified by the Ordos Basin. Sci. China Ser. D 2006, 49, 384–396. [Google Scholar]
  43. Riboulleau, A.; Baudin, F.; Deconinck, J.F.; Derenne, S.; Largeau, C.; Tribovillard, N. Depositional conditions and organic matter preservation pathways in an epicontinental environment: The Upper Jurassic Kashpir Oil Shales (Volga Basin, Russia). Palaeogeogr. Palaeoclimatol. Palaeoecol. 2003, 197, 171–197. [Google Scholar] [CrossRef]
  44. Brumsack, H.J. The inorganic geochemistry of Cretaceous black shales (DSDP Leg 41) in comparison to modern upwelling sediments from the Gulf of California. Geol. Soc. Lond. 1986, 21, 447–462. [Google Scholar] [CrossRef]
  45. Murray, R.W.; Brink, M.R.; Gerlach, D.C.; Russ, G.P.; Jones, D.L. Rare earth, major, and trace elements in chert from the Franciscan Complex and Monterey Group, California: Assessing REE sources to fine-grained marine sediments. Geochim. Cosmochim. Acta 1991, 55, 1875–1895. [Google Scholar] [CrossRef]
  46. Zeng, S.; Wang, J.; Fu, X.; Chen, W.; Feng, X.; Wang, D.; Song, C.; Wang, Z. Geochemical characteristics, redox conditions, and organic matter accumulation of marine oil shale from the Changliang Mountain area, northern Tibet, China. Mar. Pet. Geol. 2015, 64, 203–221. [Google Scholar] [CrossRef]
  47. Liu, Q.; Zhu, D.; Jin, Z.; Meng, Q.; Li, S. Influence of volcanic activities on redox chemistry changes linked to the enhancement of the ancient Sinian source rocks in the Yangtze craton. Precambrian Res. 2019, 327, 1–13. [Google Scholar] [CrossRef]
  48. Winguth, A.M.; Maier-Reimer, E. Causes of the marine productivity and oxygen changes associated with the Permian–Triassic boundary: A reevaluation with ocean general circulation models. Mar. Geol. 2005, 217, 283–304. [Google Scholar] [CrossRef]
  49. Zhu, C.; Xu, M.; Yuan, Y.; Zhao, Y.; Shan, J.; He, Z.; Tian, Y.; Hu, S. Palaeogeothermal response and record of the effusing of Emeishan basalts in the Sichuan basin. Chin. Sci. Bull. 2010, 55, 949–956. [Google Scholar] [CrossRef]
  50. Sweere, T.; Boorn, S.; Dickson, A.J.; Reichart, G.J. Definition of new trace-metal proxies for the controls on organic matter enrichment in marine sediments based on Mn, Co, Mo and Cd concentrations. Chem. Geol. 2016, 441, 235–245. [Google Scholar] [CrossRef]
  51. Moradi, A.V.; Sarı, A.; Akkaya, P. Geochemistry of the Miocene oil shale (Hançili Formation) in the Çankırı-Çorum Basin, Central Turkey: Implications for Paleoclimate conditions, source–area weathering, provenance and tectonic setting. Sediment. Geol. 2016, 341, 289–303. [Google Scholar] [CrossRef]
  52. McLennan, S.M.; Hemming, S.; McDaniel, D.K.; Hanson, G.N. Geochemical approaches to sedimentation, provenance, and tectonics. In Processes Controlling the Composition of Clastic Sediments; Special Papers; Geological Society of America: Boulder, CO, USA, 1993; p. 21. [Google Scholar]
  53. Tian, Y.; Zhang, X.Y.; He, Y.B. Lithofacies palaeogeography of the Late Permian Wujiaping age of Sichuan Basin. J. Palaeogeogr. 2010, 12, 164–176. [Google Scholar]
  54. Cao, Q.G.; Liu, G.X.; Zhang, C.J.; Pan, W.L. Sedimentary environment and its controlling on source rocks during late Permian in Sichuan Basin. Pet. Geol. Exp. 2013, 35, 36–41. (In Chinese) [Google Scholar]
  55. Sheng, J. Volcanic effects to marine environments and organisms across the Permian-Triassic transition in South China. Ph.D. Thesis, China University of Geosciences, Beijing, China, 2014. [Google Scholar]
  56. Ding, J.H.; Zhang, J.C.; Shi, G.; Shen, B.J.; Tang, X.; Yang, Z.H.; Li, X.Q.; Li, C.X. Sedimentary environment and organic matter accumulation for the Longtan Formation shale in Xuancheng area. Acta Sedimentol. Sin. 2021, 39, 324–340. [Google Scholar]
  57. Metcalfe, I. Gondwana dispersion and Asian accretion: Tectonic and palaeogeographic evolution of eastern Tethys. J. Asian Earth Sci. 2013, 66, 1–33. [Google Scholar] [CrossRef]
  58. Zhang, G.; Zhang, X.; Li, D.; Farquhar, J.; Shen, S.; Chen, X.; Shen, Y. Widespread shoaling of sulfidic waters linked to the end-Guadalupian (Permian) mass extinction. Geology 2015, 43, 1091–1094. [Google Scholar] [CrossRef]
Figure 1. Paleogeographic map (A), geographic location (B), and stratigraphic column (C) of the Kaijiang-Liangping Trough: (A) paleogeographic map of Kaijiang-Liangping Trough [1]; (B) geographical location map of Kaijiang-Liangping Trough; (C) stratigraphic column of Kaijiang-Liangping Trough.
Energies 16 00349 g001
Figure 2. Microscopic image of the shale of the Wujiaping Formation. (A) Development of argillaceous and organic matter, 4366.17 m; (B) quartz debris, 4368.74 m; (C) alternating distribution of bright–dark laminae, 4364.00 m; (D) plant debris, 4365.92 m; (E) fine sandstone mixed with silty mudstone, 4364.93 m; (F) massive development of horizontal laminae, 4332.50 m; (G) double-shell debris, 4331.73 m; (H) layer alignment of radiolarian and bone spicule, 4334.30 m; (I) layer distribution of bioclast, 4337.40 m.
Energies 16 00349 g002
Figure 3. The standardized distribution pattern of rare earth elements in the Wujiaping Formation’s shale samples.
Energies 16 00349 g003
Figure 4. Redox index distribution characteristics of the Wujiaping Formation’s shale samples.
Energies 16 00349 g004
Figure 5. MoEF-UEF covariant mode for the Wujiaping Formation shale’s samples.
Energies 16 00349 g005
Figure 6. Distribution characteristics of shale productivity indicators in the Wujiaping Formation.
Energies 16 00349 g006
Figure 7. The figure of the correlation between the content of TOC and redox elements’ concentration (UEF, Ni/Co), indicators of paleoproductivity (P, Nixs, Mo), and the deposition rate (La/Yb)N.
Energies 16 00349 g007
Figure 8. (A) Scatterplot of the Co × Mn and Cd/Mo of the shale of the Wujiaping Formation; (B) scatterplot of Co × Mn and A1%; (C) scatterplot of the TCP and TOC of the lower part of the Wujiaping Formation.
Energies 16 00349 g008
Figure 9. “Kaijiang-Liangping” Trough of the Wujiaping Formation shale organic matter enrichment pattern. (A) Wujiaping (lower); (B) Wujiaping (upper).
Energies 16 00349 g009
Disclaimer/Publisher’s Note: The statements, opinions and data contained in all publications are solely those of the individual author(s) and contributor(s) and not of MDPI and/or the editor(s). MDPI and/or the editor(s) disclaim responsibility for any injury to people or property resulting from any ideas, methods, instructions or products referred to in the content.