1. Introduction
The issue of reducing greenhouse gas emissions has been at the heart of European policies for many years. With a view to achieving climate neutrality by 2050, the climate framework for 2030 foresees a reduction of these emissions by 55% compared to 1990 levels [
1]. All energy-intensive sectors are involved in the energy transition process and therefore must undergo processes of efficiency, electrification—reducing the consumption of fossil fuels—and decarbonization. One of the main energy-intensive sectors is that of construction, responsible for about 36% [
2] and 38% [
3] for energy consumption and CO
2-eq emissions, respectively. As for new buildings, strict rules have been laid down for the components of the envelope, the plants, and for integration of renewable energy sources, but this is not enough because a high percentage of buildings currently in existence—built before the 1980s and therefore highly inefficient—will continue to exist [
4]. The solution is therefore a profound energy renewal of the existing European building stock. In agreement with the International Energy Agency, 20% of existing construction should be energy renovated by 2030, an annual renewal rate of 2% is needed to reach the net zero emissions scenario [
5], and several directives have been published, with regard to both public and private buildings, to provide rules in the matter of energy efficiency. In particular, regarding public administration buildings, Directive 2012/27/EU prescribes an annual renewal rate of 3% [
6], highlighting the exemplary role that these buildings play, a role also reaffirmed by the Renovation Wave of 2020 [
7]. The energy efficiency measures for such building stock must fulfil the minimum energy performance requirement set out in Directive 2010/31/EU [
8]. The goal for 2050 is to have a zero-emission building stock. The definition of nearly zero energy building (nZEB), “a building that has a very high energy performance with zero or very low amount of energy required, that should be covered to a very significant extent by energy from renewable sources, including energy from renewable sources produced on-site or nearby”, was given for the first time in 2010 in the Energy Performance of Building Directive (EPBD). The processes of energy efficiency, however, must necessarily be supported by economic resources [
9], and in this context, the various European states have planned economic initiatives to promote the adoption of such measures [
10].
The public building sector has been widely investigated in the literature. Magrini et al. [
11] investigated the efficiency of different measures—concerning the retrofit of roof surface, transparent surface, and heating system—for university public buildings. A similar study was conducted in [
12], with the evaluation of both the energy consumption and environmental impact of several efficiency measures for six different public buildings. The implementation of more natural materials, with a low life cycle impact, has also been investigated [
13]. In [
14] a system, to evaluate the economic sustainability of different efficiency interventions in relation to the achievable energy savings for public housing stocks, is proposed; while in [
15] the implementation of artificial neural networks to evaluate the potentialities of the efficiency measures is suggested. In summary, literature studies show that the implementation of energy efficiency measures—be they related to the envelope or plant—can certainly contribute to the achievement of European targets in terms of energy consumption and pollutant emissions. At the same time, however, the process of implementing such interventions requires a driving force and the economic one is certainly primary. For example, Galatioto et al. [
16] highlighted the need to find and adopt solutions to overcome the long payback periods that are usually obtained when energy efficiency interventions are adopted. This leads back to the need to provide economic instruments to encourage the energy transition of existing buildings [
17]. Individual European governments are the only ones who can contribute to this process and set up funds dedicated for this purpose. The aim of this study was to provide data in this regard by identifying and suggesting appropriate incentive rates for public buildings for several energy renewal measures. The idea was to suggest incentive values so that the investigated measure involves a reduced payback time of the investment, in particular an acceptable value if compared to the lifetime of the measure itself. The study was conducted on a building located in Naples, South of Italy. The investigated energy efficiency measures concerned the insulation of the opaque building envelope, the substitution of the transparent components, the efficiency of the air conditioning system, and the installation of a photovoltaic system. All such interventions are aimed at achieving the nZEB standard. In Italy, this standard is regulated by the Inter-ministerial Decree of 26 June 2015 [
18] as regards the building envelope and the installed systems, as well as by the Legislative Decree 28 of 2011 [
19] and the Legislative Decree 199 of 2021 [
20] as regards the requirements for the renewable energy sources. The proposed measures were investigated both from an energy and economic point of view, and the incentive necessary to obtain an acceptable payback time was assessed based on their useful life. The structure of the paper is as follows: the materials and methods are outlined in
Section 2; the building under investigation is presented in
Section 3; the energy efficiency measures are described and discussed from an energy and economic point of view in
Section 4, and the conclusions are summarized in
Section 5.
2. Materials and Methods
DesignBuilder
® (version 6.1.8) [
21] and EnergyPlus (version 8.9) [
22] software are used respectively for the modeling and the evaluation of the energy performance and energy consumption of the building. In particular, in the DesignBuilder
® environment [
23], the geometrical and physical model is realized by characterizing the following: the thermophysical parameters of the opaque and transparent envelope, the use of the building in terms of activity, occupancy, lighting, and electric equipment, as well as the type and the efficiency of the systems for microclimatic control. In the EnergyPlus environment [
24], after the setting of the weather file and specific boundary conditions, a dynamic energy simulation is conducted to evaluate the energy consumption of the building. The created model is validated through a comparison between the simulated and the typical energy consumption of a building with a similar intended use, located in a similar environmental context. Successively, different energy efficiency measures—concerning the building envelope, systems for heating and cooling requirements, and integration of renewable energy sources—are selected. In particular, the thermal insulation of the vertical walls and the roof surface, the replacement of the windowed components and of the installed systems, and the installation of a photovoltaic system are analyzed. The Italian Ministerial Decree 26 June 2015 defines the requirements that existing buildings subject to energy renovation must meet. These requirements concern the value of the characteristic parameters of the building elements and of the installed systems, which are the thermal transmittance values for opaque and transparent components and the efficiencies for the plant components. For this reason, all the investigated measures ensure compliance with these requirements. As for the obligations regarding renewable sources, reference is made to the Legislative Decree n.199 of 2021 which updated and partially repealed Decree n. 28 of 2011. It defines the power of the plant that must be compulsorily installed and the percentage of coverage of the energy needs to be met. The proposed measures are implemented and discussed first individually and then as a whole, and therefore different models of the building are created. For each scenario, the energy and economic savings are evaluated. The objective of the study is to assess the incentive rate necessary for the intervention to be cost-effective. For this reason, and for each energy retrofit scenario, the simple payback period (SPB) is assessed as follows [
25]:
where
IC, the investment cost, is the cost for the materials and their installation,
RC, the running cost, is the cost necessary for the use of the building, given by the product of Eel, the electricity consumption per year, and its unitary cost, cel (EUR/kWh).
For each measure, the estimated lifetime is known [
26], and it is clear that for a measure to be convenient, the payback time of the investment must be less than its useful life. Therefore, a limit is fixed for the payback time of the investment equal to about half of the useful life of the single intervention. Based on this choice, the incentive to meet this limit is estimated.
Finally, the energy class of the building is evaluated both in its current state and with the different energy efficiency measures. The energy certification of the building, and therefore the drafting of the energy performance certificate is carried out according to the guidelines contained in Decree 26 June 2015. For this purpose, an assessment is carried out under standard conditions, “asset”, in accordance with EN 15603 [
27]. The main indicator for this assessment is EPgl,nren (Global Non-renewable Energy Performance Index), which, according to Annex 1 of the Decree of 26 June 2015, includes primary energy demand for heating, cooling, ventilation, production of domestic hot water, lighting, and lifts (the last two items only for non-residential buildings, as in the present case). The energy class is defined by comparing the EPgl,nren of the building under investigation with that of a reference building (EPgl,nren,rif (2019/21)). The latter is defined, according to Appendix A of the Decree of 26 June 2015, as an identical building in terms of geometry, orientation, location, intended use, and boundary conditions to the actual building, but having thermal and plant-related characteristics defined in the same Appendix.
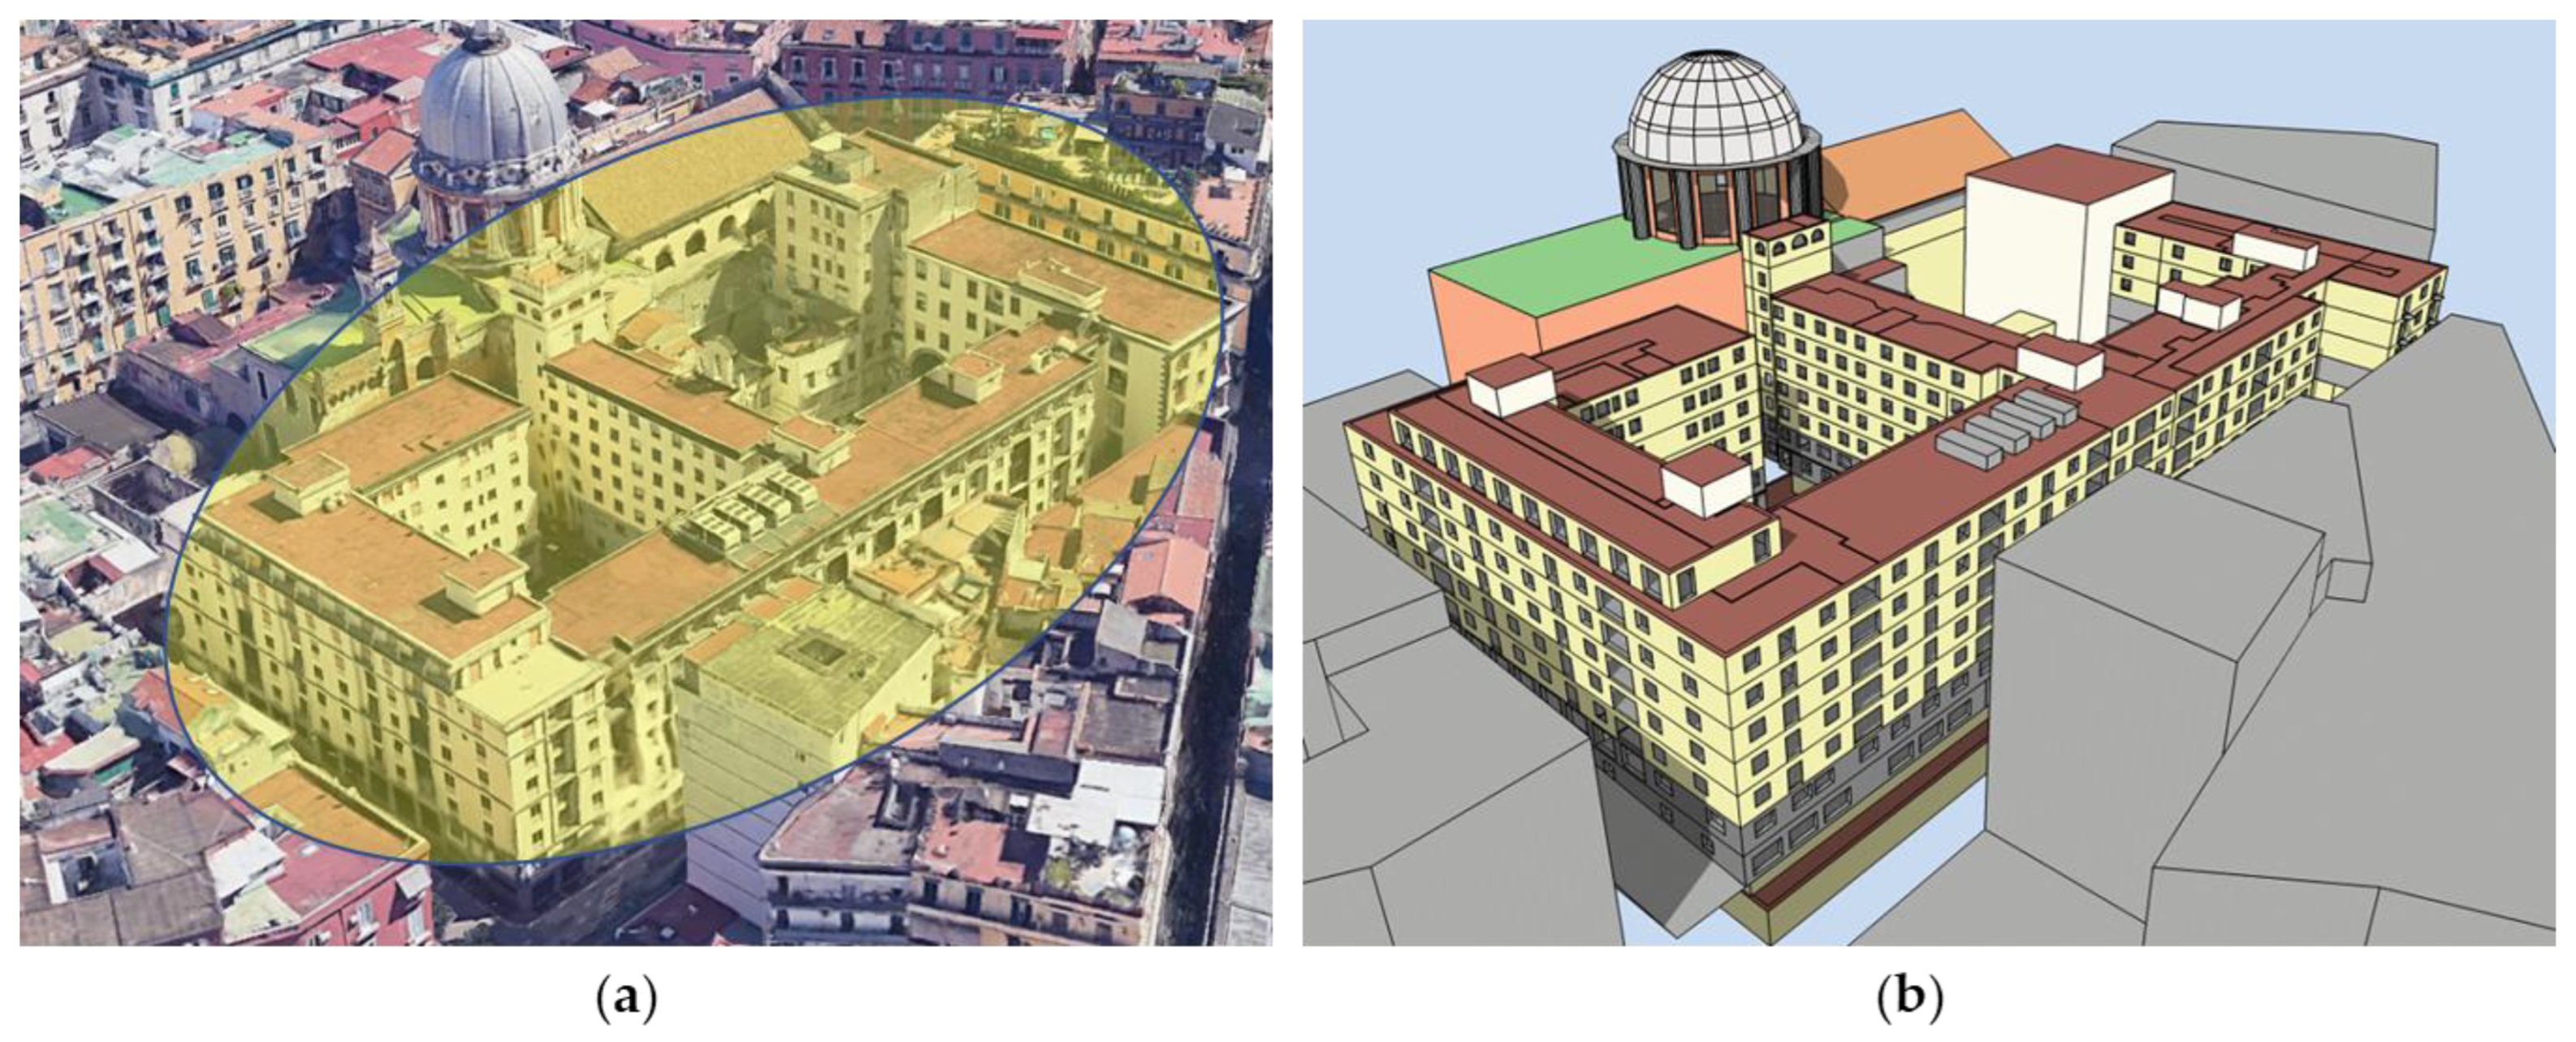
3. Case Study
The building under analysis dates from the second half of the sixteenth century but was then demolished and rebuilt between 1965 and 1974. It has the architectural and compositional characteristics typical of those years for Southern Italy and therefore is representative of all the construction of that era and of that climatic location. It houses the Architecture Department of the University of Naples Federico II and is dedicated to both offices and classrooms. The model of the building is realized in DesignBuilder
® (version 6.1.8) environment (
Figure 1).
The following required parameters are defined in the tabs.
Activity: in the building there are administrative and educational activities, the use is, therefore, diurnal—typical offices and educational occupancy profile—from Monday to Friday, from 8:00 to 18:00, and on Saturday from 8:00 to 16:00. Electric devices with a power of 4 W/m2 are scheduled.
Construction: the external walls have a thickness of 36 cm—internal plaster, lapillus, air gap, perforated blocks, external plaster—and a thermal transmittance value (U-value) of 1.10 W/m2K. The ceilings and the slabs have a total thickness of 30 cm—lightweight cast concrete interposed between joists and beams made of reinforced concrete—and a U-value of 1.3 W/m2K. The roof surface implements a layer of insulation with respect to the slab surface, the U-value is of 0.6 W/m2K. The infiltration rate is of 1 h−1.
Opening: the transparent envelope is made up of double glass component with a wooden frame and a thermal transmittance value of 2.72 W/m2K. Shading systems are not implemented.
Lighting: a power density of 1.5 W/m2 per 100 lux is defined, and control of the lighting devices according to daylight is foreseen.
Heating, ventilation, and air conditioning system: the generated system consists of four air-water heat pumps, each with a power of 500 kW. It supplies hot and cold water to various air handling units (AHU) and to fan coils arranged in the rooms. The winter operation runs from 15 November to 31 March and, according to the Italian Decree D.P.R. 26/93 [
16], the maximum activation time per day is 10 h. The heating setpoint is 21 °C. The summer operation runs from 1 June to 30 September; an activation time of 10 h per day and a cooling setpoint of 25 °C are set.
Other information concerning the building geometry and the parameters for the simulation are listed in
Table 1.
The evaluation of the energy consumption is conducted with EnergyPlus (version 8.9.0). The electricity consumption is about 1,130,000 kWh per year. Considering the cost of electricity, referring to the month of January 2023, equal to 0.43 EUR/kWhel [
28], the annual costs for winter and summer conditioning are about 1146 EUR/100 m
2, and 920 EUR/100 m
2 respectively. For a building in a location with a Mediterranean climate dedicated to offices and university classrooms, these are statistically reliable values, and this guarantees the accuracy and reliability of the model created. By considering a primary energy factor for the electricity of 1.95, the annual primary energy consumptions, for the different uses, are as follows:
836,961 kWhp for the heating system, or 51.6 kWhp/m2 year;
674,318 kWhp for the cooling system, or 41.6 kWhp/m2 year;
353,923 kWhp for the lighting system, or 21.8 kWhp/m2 year;
337,141 kWhp for equipment, or 20.8 kWhp/m2 year.
4. Energy Renovation of the Building: Evaluation of Energy and Economic Impact
The energy renovation of the investigated building is analyzed both from the energy and economic point of view. In detail: the improvement of the performance of the building-plant system, energy and economic savings, the payback time of the investment are evaluated. The investigated energy renovation interventions are described in
Table 2. The features—thermal transmittance value, the efficiency of the systems, installed power of PV system—of the current state of the building and of the energy-renovated solution are shown in
Table 3.
The intervention on the cellar was excluded because it is an invasive activity that would have required an interruption of educational and office activities. Moreover, it would be very complicated to avoid the thermal bridge effect due to the RC pillars crossing the slab.
The implementation of such measures will involve the efficiency of the building components and therefore a reduction of the building’s energy demand. From an economic point of view, the reduction of energy consumption results in economic saving.
Table 4 shows the involved components for the energy efficiency of the building and the relative unit costs considered for the economic evaluation.
In the following
Section 4.1 and
Section 4.2, the energy interventions are discussed individually, then in
Section 4.3, all measures are combined.
Section 4.4 evaluates the energy class of the various scenarios. Finally, the discussion of the results is presented in
Section 4.5.
4.1. Efficiency of the Building Envelope
The energy efficiency intervention for the building envelope consists of the thermal insulation of the external walls, the roof surface, and the replacement of the transparent components. As mentioned above, the Italian Ministerial Decree 26 June 2015 defines specific requirements for buildings subject to energy efficiency. These requirements differ according to the climate zone. The Italian territory is in fact divided into climatic zones on the basis of the value of degrees per day, according to DPR 412 of 1993 [
35]. The city of Naples belongs to climate zone C, with a daily degree value of 1034, and the values to be respected are as follows:
a maximum thermal transmittance value for the opaque vertical structures of 0.36 W/m2K;
a maximum thermal transmittance value for the opaque horizontal structures, as roof surface, of 0.32 W/m2K;
a maximum thermal transmittance value for the transparent component of 2 W/m2K.
The proposed interventions, previously listed and described in
Table 2 and
Table 3, allow respecting these limits. In detail:
the U-value of the wall, thanks to the installation of 8 cm of polyurethane foam, is reduced from 1.10 W/m2K to 0.27 W/m2K;
the U-value of the roof surface, thanks to the installation of 12 cm of polyurethane foam, is reduced from 0.608 W/m2K to 0.19 W/m2K;
the U-value of the windowed component, thanks to the installation of a double low-emissivity glass with an aluminum frame and thermal break, is reduced from 2.72 W/m2K to 1.49 W/m2K.
Figure 2 shows the primary energy savings for space heating and cooling achieved with the different energy retrofit measures.
The insulation of the outer wall surfaces results in an annual primary energy saving of 14.8% and 0.5% for heating and cooling, respectively. The annual saving of CO
2 emissions is approximately 6.3%. Regarding the economic context, the annual saving of operating costs is approximately EUR 30,673 against an investment of about EUR 1,432,832, and the payback time is approximately 50 years. Regarding the insulation of the roof surface, it allows, as expected, a low energy saving both for heating and cooling consumption (
Figure 2) against an investment cost of about EUR 485,669 and a consequent payback period much longer than 50 years.
With the replacement of the windowed components, yearly primary energy savings of 27.2% and 1.5% for heating and cooling, respectively, are achieved. The enhancement of the window components affects both the energy dispersion for conduction and convection thanks to the improvement of the air tightness which reduces undesired infiltration. The annual saving of CO2 emissions is approximately 10.3%. The annual operating cost is reduced by about EUR 49,943 for an investment of EUR 1,029,236, and a consequent payback time of 22 years is obtained.
The reported payback times are evaluated without any form of incentive.
4.2. Efficiency of Air Conditioning Systems—Integration of Renewable Energy Sources
The microclimatic control of the indoor environments is guaranteed by the use of heat pumps coupled with fan coils and AHUs, and thus the renovation of the energy system consists of the replacement of such systems with more efficient ones. In particular, the selected system is characterized by a COP of 3.16 and an EER of 2.96 in heating and cooling operation, respectively. Primary energy savings of 17.4% and 20.4% in the heating and cooling season, respectively, are achieved. The annual saving of CO2 emissions is approximately 13%. An annual economic saving of about EUR 62,575 is obtained against an investment of EUR 312,000, and a consequent payback time of about 5 years is achieved.
To reach the standard of nZEB, the energy demand of the building should be covered in a significant measure by renewable energy sources. For this reason, the installation of a photovoltaic system is proposed, by analyzing two configurations. The first configuration derives from the obligation prescribed by Annex III of Decree 199 of 2021 [
20] according to which the minimum power of the plant that must be compulsorily installed is as below:
where S is the floor area of the building at ground level, measured in m
2, and k is a coefficient equal to 0.025 for existing buildings. Moreover, for the public building, the Decree prescribes an increase of the obligation of 10%. The floor area of the investigated building at ground level is 3236.66 m
2, and thus the minimum power of the system must be about 89 kW.
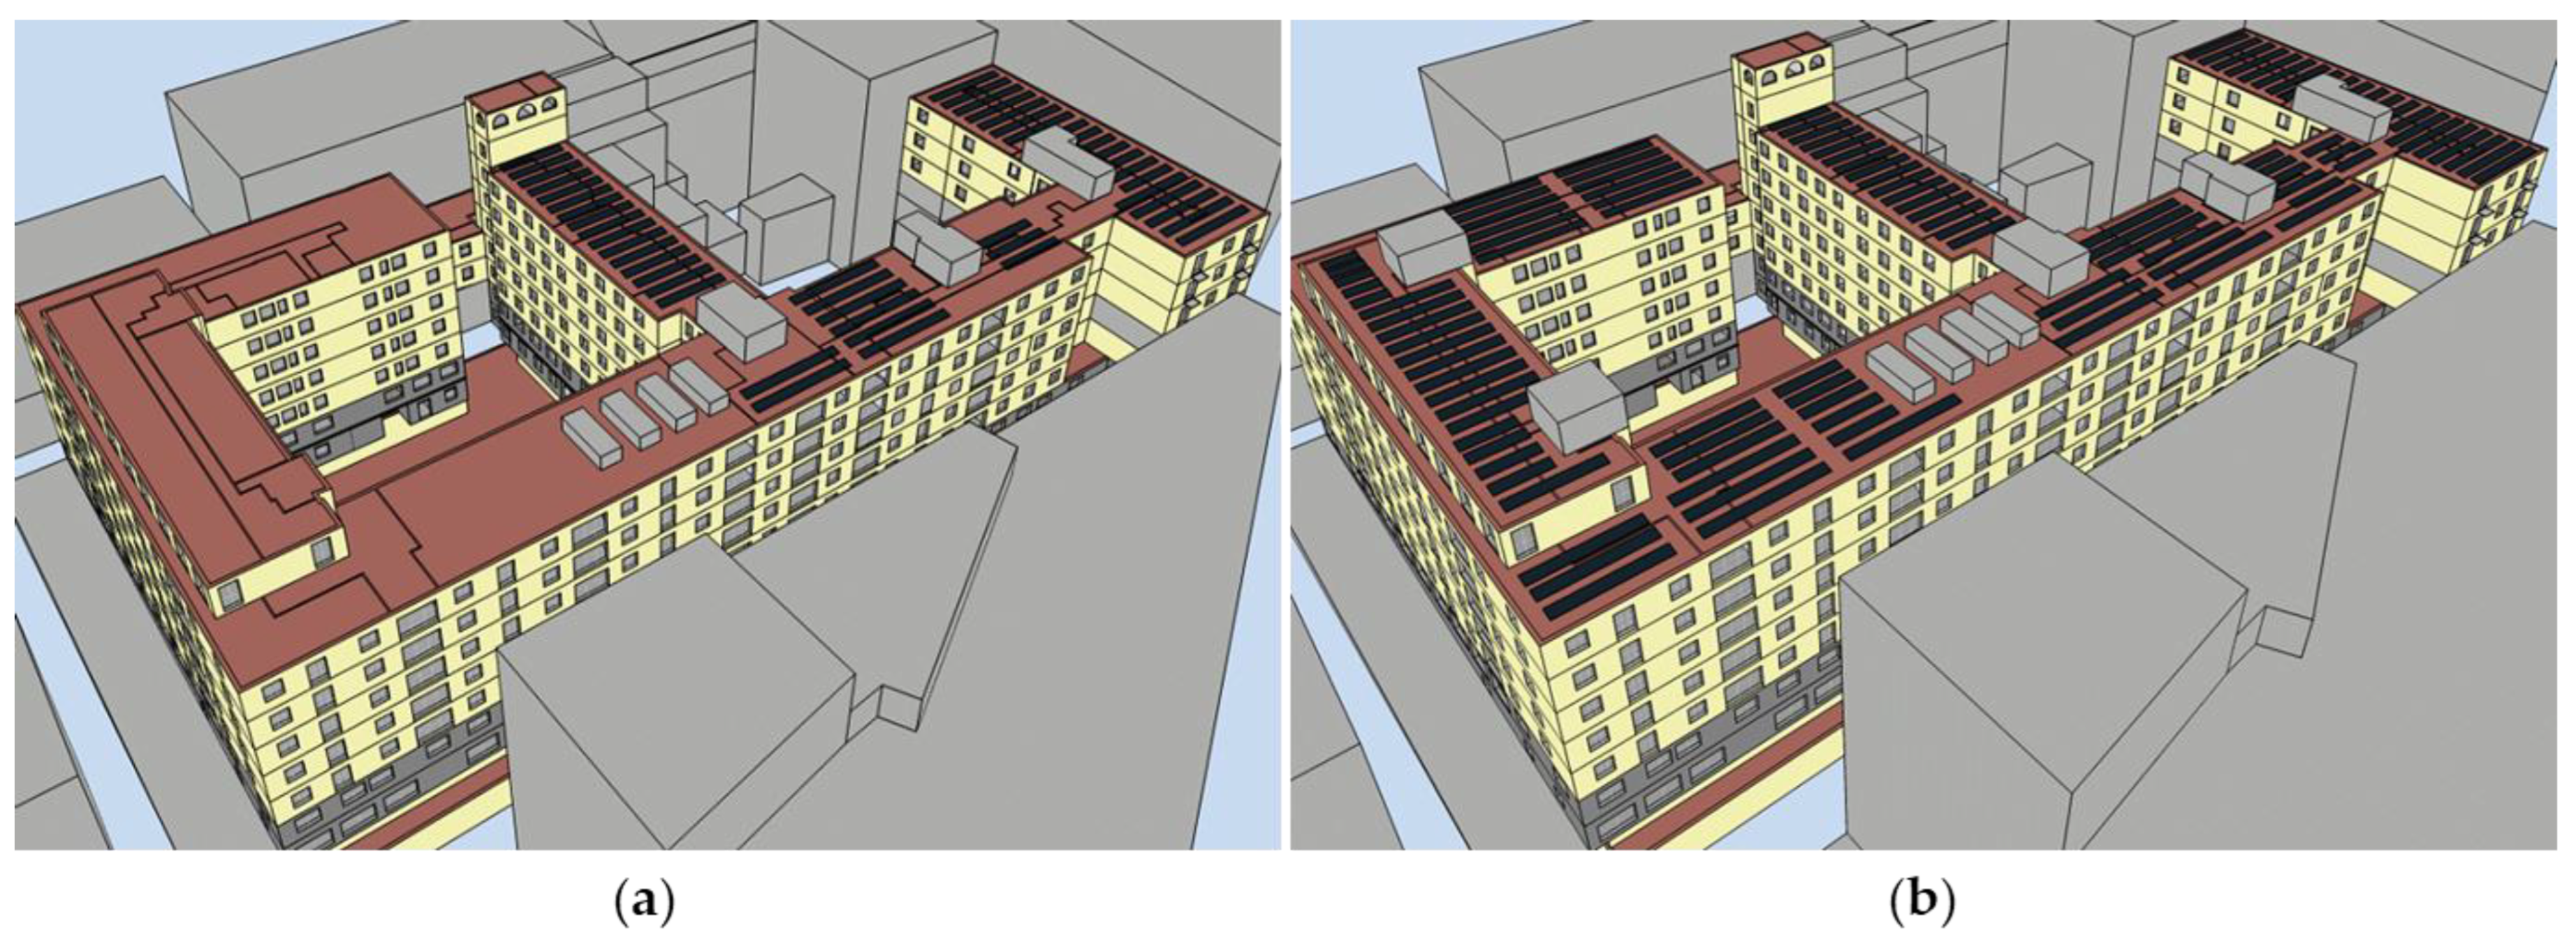
The electrical specifications of the chosen module are the following: maximum power of 335 W and an efficiency of 19.7%. Furthermore, the module has an area of about 1.67 m2 and a height of 40 mm. The annual electricity production is 117,077 kWh, and this allows a coverage of the building’s energy demand of about 10.4%. The investment cost is EUR 151,300 and thus the payback time of the investment is about 3 years.
The maximum installed power for the photovoltaic system, in relation to the available coverage area, is equal to 193 kW. This system is characterized by an annual electricity production of 249,262 kWh, and it allows a coverage of the building’s energy demand by 22.1%. The IC is of EUR 328,100 and the SPB is approximately 3 years.
Figure 3 shows the roof surface and its coverage by PV panels, in the two analyzed cases.
The renewable source system should ensure a coverage of 65% of the consumption for DHW and 65% of the sum of the consumption of DHW, heating and cooling. Due to a technical impossibility, namely the lack of additional space on the roof surface and the impossibility of realizing off-site plant, these values are not achievable. The percentage achieved is in fact equal to 52%.
4.3. Energy Efficiency of the Building: Envelope, Plants, and Renewable Sources
Applying all the efficiency measures analyzed in the previous sections—insulation of walls and roof, replacement of windowed components and heat pumps, total coverage of the roof surface with PV system—we achieve a high energy performance building. Indeed, the heating and the cooling demands are reduced by 55.8% and 22.4%, respectively, and the production of electricity by the PV system allows a coverage of the building’s energy demand by 30.7%. In this case, the investment cost is clearly given by the sum of the costs of the single interventions, and an SPB of about 17 years is obtained.
4.4. Building Energy Performance Certification
The energy class of the building is evaluated both in its current state and with the investigated energy efficiency measures. First the “reference building” is characterized according to the Appendix A of the Decree of 26 June 2015 [
27], in particular the following.
For the building envelope: the thermal transmittance value of the vertical walls is 0.34 W/m2K, the U value of the roof is 0.33 W/m2K, the U value of the ground floor is 0.38 W/m2K, the U value of the transparent component is 2.20 W/m2K.
For the systems: the efficiency of the heating system is 2.46; the efficiency of the cooling system is 2.05, the efficiency of the domestic hot water is 1.75, and the efficiency of the ventilation system is 0.85.
Moreover, the assessment is conducted under conventional conditions to ensure replicability of the energy class assessment, i.e., an indoor microclimatic control for 24 h with a constant temperature of 20 °C for the heating season and 26 °C for the cooling season. The model of the reference building, according to the cited requirements, is created to evaluate the energy requirements for heating, cooling, and domestic hot water. As for the requirement for ventilation, the specific electricity energy, according to the typology of the plant, is indicated in Appendix A of the Decree 26 June 2015, while the air flow rates are the same as the real building.
According to Annex 1 of the Decree of 26/06/2015, for the non-residential sector, as in the investigated case, to assess the energy class, the energy requirements for lighting and lifts must also be considered. As for the energy requirement for lighting, the calculation is carried out according to UNI EN 15193 and UNI/TS 11300-2. This need depends on various factors—in relation to employment, to the daylight, to the hours of light and absence of light—which have been assessed in accordance with the above-mentioned legislations. For the lifts, the average consumption is about 5% of the total electricity consumption [
36].
Through the comparison of the EPgl,nren of the reference building and the real building, the energy class is D. The energy class and the EPgl,nren value, achieved with the different energy efficiency interventions are summarized in
Table 5.
The analysis described confirms the results of the previous sections. Among the measures of energy efficiency of the building envelope, the most profitable, in terms of energy saving, is the replacement of the transparent components, while the least convenient is the thermal insulation of the roof surface. With reference to this intervention, even if the energy class passes from D (current state of the building) to C, the reduction of EP is negligible. In general, the solution that allows the maximum reduction of energy demand is the one that includes all the interventions, both on the envelope and on the systems. The energy class goes from D to B; we are very close to the standard of the reference building (that is to class A1).
The improvement of the energy performance of the building with the installation of the photovoltaic system (with a power of 193 kW), in addition to all the interventions on the building envelope and systems previously described (thermal insulation of vertical walls and roof, replacement of windowed components and replacement of heat pumps), allows a high-efficiency building to be achieved. Indeed, the energy class reaches A3 starting from D.
4.5. Discussion
Table 6 shows the obtained savings on the total primary energy consumption and the relative times of return of the investment.
In the case of the installation of the PV system, the energy saving represents the energy demand of the building satisfied through the production of energy from photovoltaic.
Among the energy efficiency measures of the building envelope, the one concerning the replacement of the window components is the most convenient both from an energy and economic point of view. As regards the opaque envelope, the intervention on the vertical walls, which covers a large area (about 12,460 m
2) and involves all the zones of the building, allows greater energy saving compared to the intervention on the roof surface. Overall, long payback times are achieved, especially for the opaque envelope efficiency. At the same time, however, these are interventions with a longer service life, about 50 years for thermal insulation and about 30 for transparent components [
26]. Measures relating to the efficiency of the systems and the integration of renewable energy sources are characterized by high energy savings and reduced recovery times for the investment, but their lifetime is shorter compared to that of the building envelope.
In this context, the aim of the present study was to suggest the incentive values—for several energy efficiency measures—so that the investigated measure determines a reduced payback time of the investment, in particular an acceptable value if compared to the lifetime of the measure itself.
For an intervention to be convenient the payback time of the economic investment must be less than the useful life of the intervention itself. For this reason, a maximum payback time was set on the basis of the lifetime of the interventions, in accordance with DIN 15459.
As regards the technical installation, the useful lifetime is of 15 years and having obtained in the case investigated—for the replacement of the heat pumps—a payback time of about 5 years, it can be deduced that such an intervention is economically and energetically convenient even without the support of economic funds. A similar result is achieved with reference to the installation of the photovoltaic system. Considering the lifetime of the PV panel and of the inverter, about 20 and 10 years respectively, an SPB of about 3 years is an admissible value. The intervention is economically viable even without economic funds.
Economic sustainability is not achieved for building envelope interventions. However, these measures are necessary to improve the energy behavior of the building. The envelope in fact regulates the heat flows between the internal and external environment, and its efficiency not only ensures less heat loss but allows an optimization of the use of the systems. According to [
26], the lifetime for the thermal insulation, with reference to all the opaque components, is around 50 years. The maximum payback time settled is 20 years and, considering the investment cost, an incentive rate of 75% and 90% would be necessary for the intervention on the vertical walls and roof, respectively. The lifetime for the windows is around 30 years [
26], so 15 years is settled as the maximum payback time. In this case, an incentive rate of 45% is required to achieve the established limit. The highest incentive rate is therefore required for thermal insulation of the roof surface, which represents the intervention with the least energy saving and therefore economic saving, which in the absence of incentives is characterized by a payback time much higher than its useful life. In
Figure 4 the cumulated cash flows in 20 years are represented both with and without incentives for the building envelope interventions. In general, it is possible to observe an inversely proportional dependence between the required incentive rate and the energy saving and consequently the economic saving that is obtained.
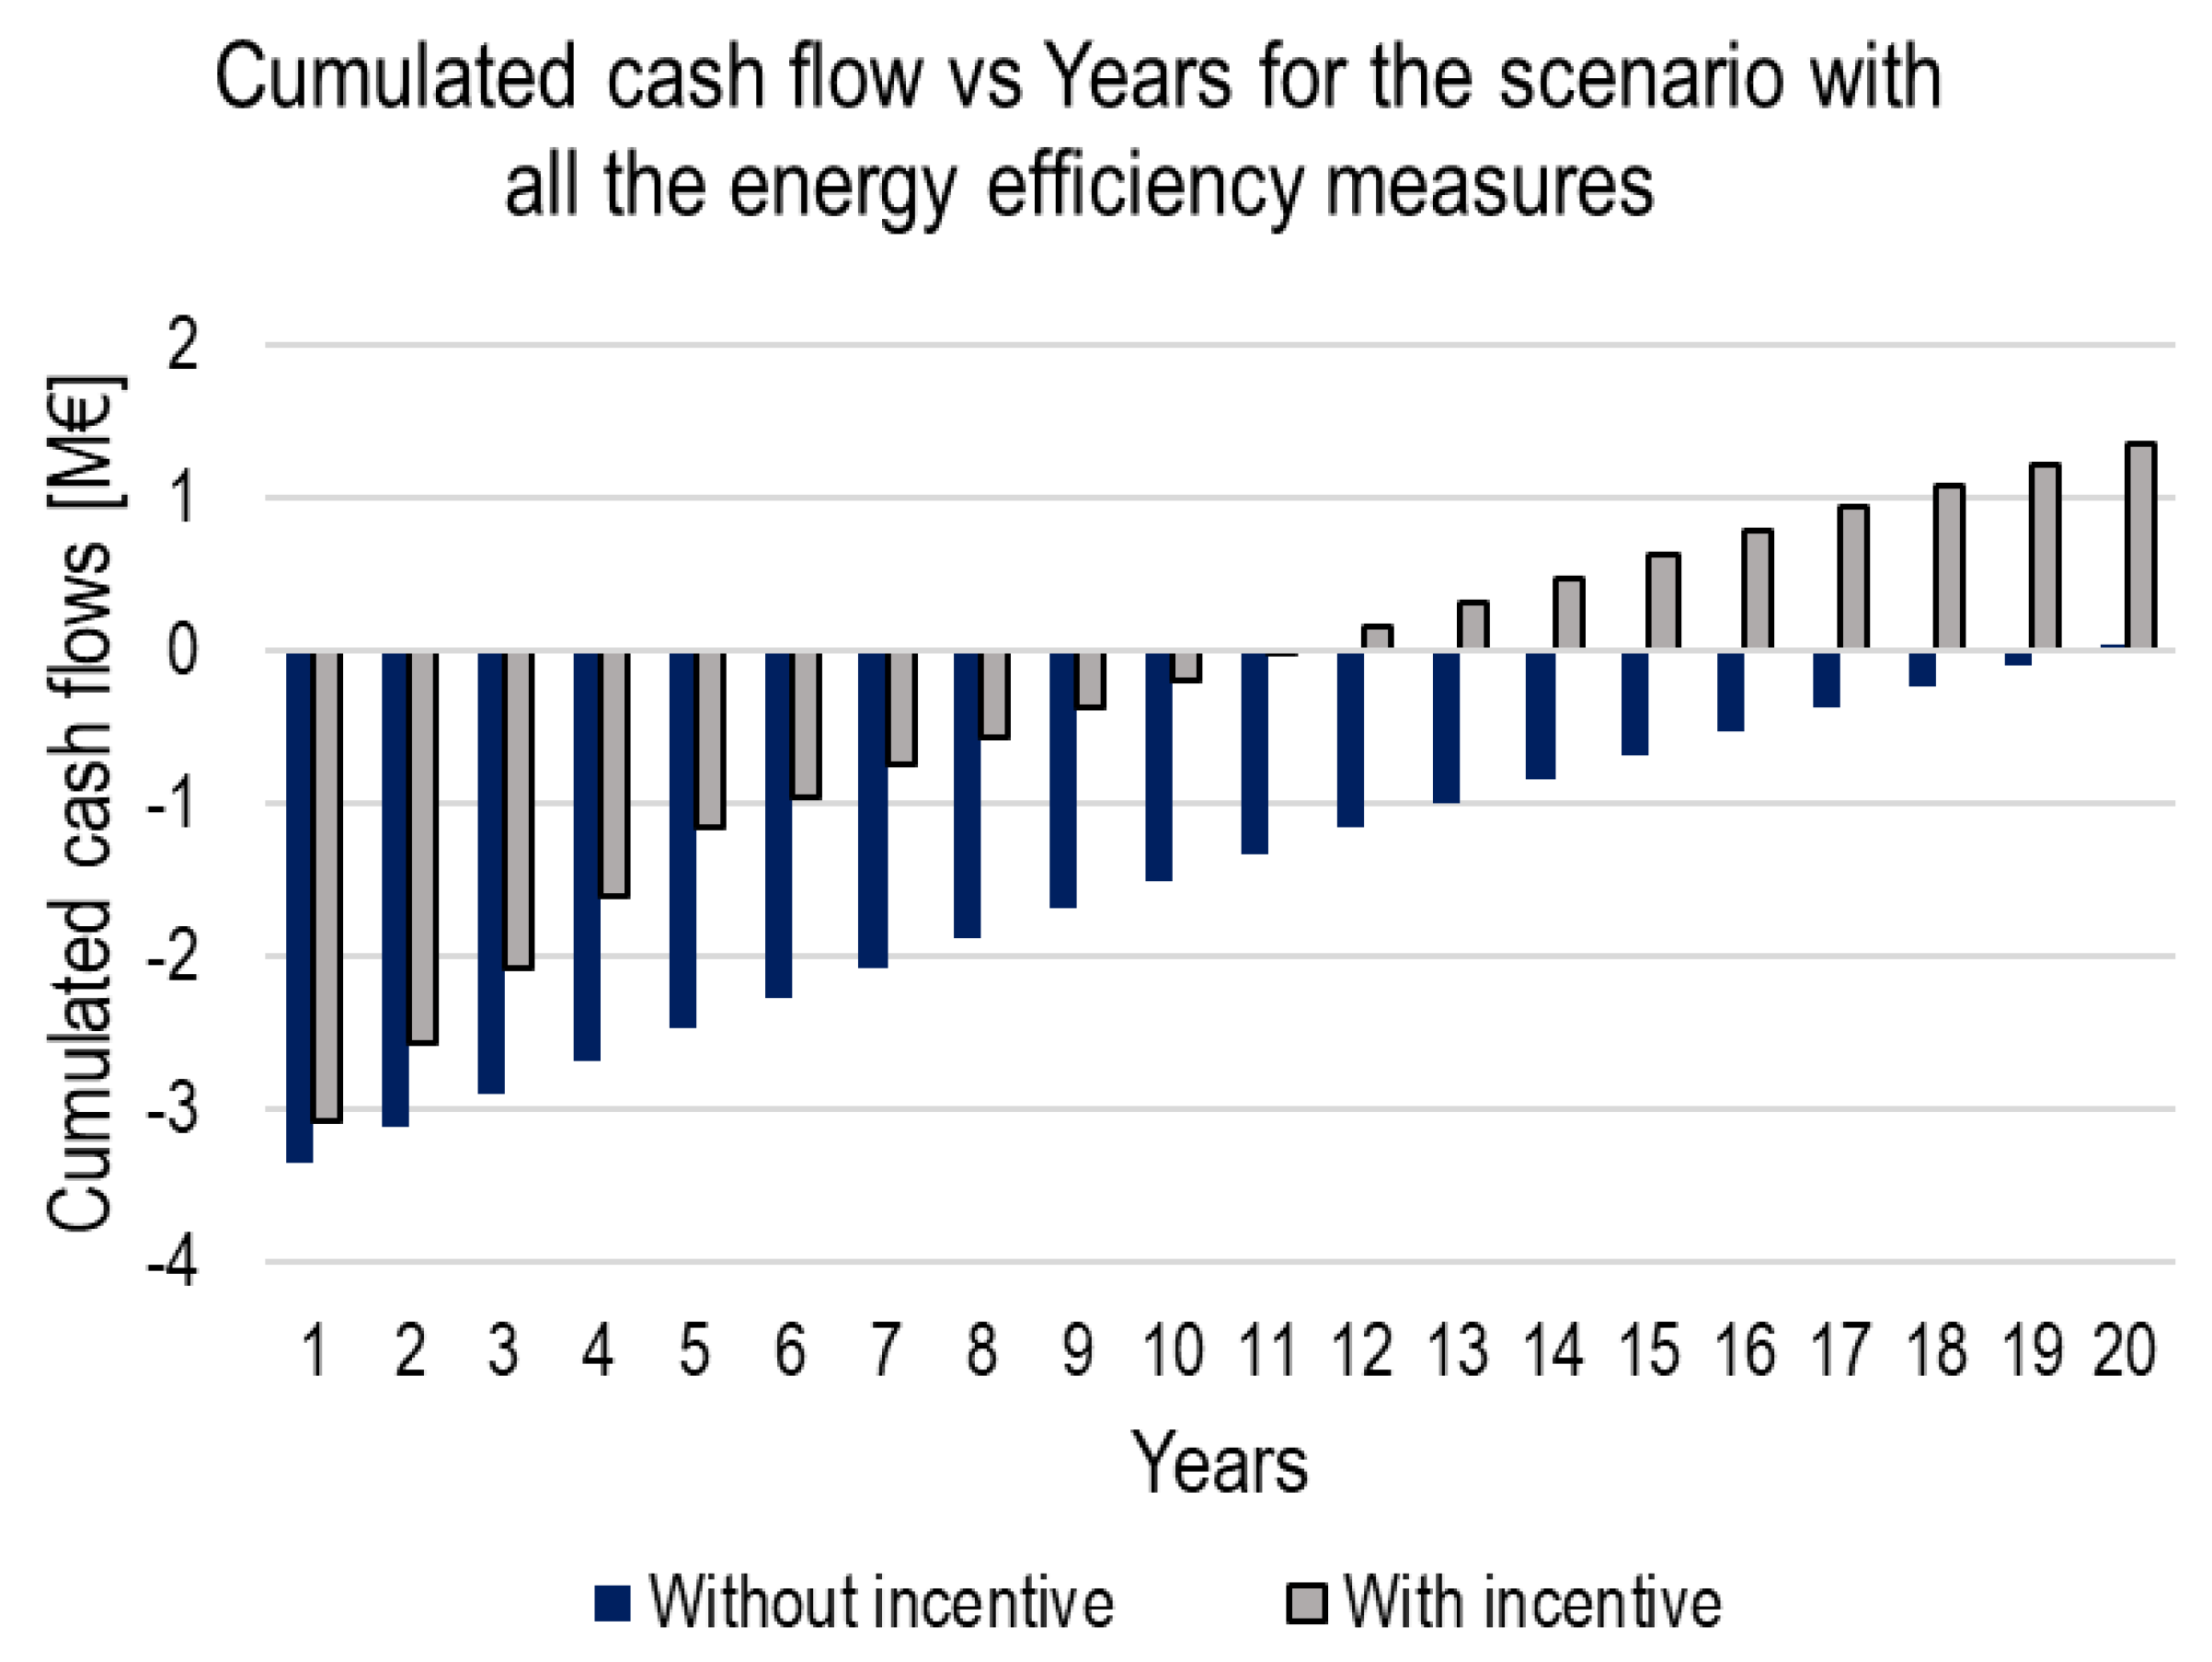
With reference to the solution that combines all the efficiency measures, which allows a very high-performance building (energy class A3) to be achieved, considering the lifetime of all involved interventions, a maximum payback time of 10 years is established, and an incentive rate of 40% would be necessary.
Figure 5 shows a comparison of the cumulated cash flows in 20 years with and without incentives for the described solution. The calculation made provides that the forms of incentive evaluated are distributed over 5 years, as is the case for the most common and currently present incentives in Italy. Moreover, a discount rate of 3% is considered [
37].
5. Conclusions
The processes of energy efficiency should be supported by economic resources because this scenario can provide an increase of the energy renewal rate in the building sector. In the private sector, in Italy, thanks to a tax relief called Superbonus, the renovation rate is increased, and the same could happen for the public sector, which must renew 3% of its buildings annually. What is clear, however, is that this rate is insufficient to achieve the target of decarbonization by 2050. It is therefore essential to provide solutions in order to accelerate the process of energy adaptation and renovation of the existing building environment, and this requires an important economic commitment. In this context, the aim of the paper was to identify and suggest appropriate incentive rates for public buildings for several energy renewal measures.
The study was developed for a University Italian building, located in Naples, and the investigated energy efficiency measures concerned the insulation of the opaque building envelope, the substitution of the transparent building envelope, the efficiency of the air conditioning system, and the installation of a photovoltaic system. All the interventions respect the requirements set by the Italian Decree in the matter of building energy efficiency. The measures were analyzed both from an energy point of view, investigating the energy saving achievable for heating and cooling loads, and from an economic point of view, evaluating the simple payback time. The following results were obtained.
Thermal insulation of vertical walls: total primary energy saving of about 6.5%, SPB of approximately 50 years.
Thermal insulation of roof surface: total primary energy saving of about 1.1%, SPB more than 50 years.
Replacement of transparent components: total primary energy saving of about 10.5%, SPB of approximately 22 years.
Replacement of heat pumps: total primary energy saving of about 13%, SPB of approximately 5 years.
Photovoltaic system: 10% and 18% coverage of the building’s energy demand respectively for a power of the system of 89 kW and 193 kW, and a SPB of approximately 3 years in both cases.
Generally, an intervention can be considered convenient if the recovery time of the investment is less than the useful life of the intervention itself. Therefore, in this case, the interventions concerning the replacement of plant systems (heat pumps) and the installation of the photovoltaic system are convenient, even without economic incentives. Conversely, interventions on the building envelope, both opaque and transparent, are not economically convenient; indeed, the SPB ranges from 22 years for the substitution of the window components up to more than 50 years for the insulation of the roof surface. For this reason, a maximum recovery time of the investment was established based on the duration of the intervention and the necessary rate of incentive, to achieve it, was evaluated. The following results were obtained.
Thermal insulation of the building envelope: an incentive rate of 75% and 90% would be required for the vertical walls and the roofing area, respectively. These incentive rates allow an SPB of about 20 years to be obtained.
The replacement of glazed components: an incentive rate of 45% is sufficient to obtain an SPB of about 15 years.
The high incentive rates obtained depend on the long return on investment that must be faced to energetically adapt the building. In turn, they—the long SPB—are due to a constant increase in the prices of construction materials (which was recorded from the post COVID-19 phase and then continued due to the Russian–Ukrainian conflict) for the same energy benefit obtained from the application of these interventions.
If all energy efficiency measures are applied to the building, the requirements for the thermal transmittance of the envelope components and for the efficiency of air conditioning components, which allow the achievement of the standard nZEB, are respected. Moreover, the maximum coverage of the roof surface with the PV system was considered. In this case, a total primary energy saving of about 46% and an SPB of approximately 17 years were achieved. Thanks to a minimum incentive rate equal to 40% of the investment cost, it is possible to reduce the SPB to about 10 years. The only “actors” that can provide such high rates are governments, in this case, the Italian one that is dependent on Europe. In reference to the Italian reality, where in 2020 a measure known as “Superbonus” was introduced which provided for a tax reduction of 110% for energy efficiency in the private construction sector, these are possible and realistic solutions.
The results achieved are correlated and strictly dependent on the type of building and its use: a university building (i.e., intense daily use: high crowding between 8:00–18:00, and thus high internal loads due to people, lights, and equipment) belonging to the construction period of the 1960–1970s located in a Mediterranean area, in a dense urban context. The requirements for the envelope components and the installed systems are specific for the climatic zone, i.e., zone C for the city of Naples, as discussed in the study. The power of the photovoltaic system depends on the available surface, and its electricity production depends on the building exposition and on the surrounding building context. Generally, the case analyzed represents a very common type of building in the territory, typical of neighborhoods that have undergone a process of mass expansion in the period of urban construction growth. The state of the building investigated, in terms of thermophysical characteristics, identifies a large portion of buildings and therefore the effect that is obtained with the several energy requalification interventions can be considered representative. At the same time, however, it is important to emphasize that it is essential to describe in detail the baseline energy performance of a building and develop a specific design of the energy requalification.
The general outcome is evidence that the building sector requires forms of incentives to pursue energy renewal. European standards are becoming increasingly stringent and deadlines are becoming ever closer, so the issue is no longer deferrable.


 ,
, 


