1. Introduction
The rapid migration of people in urban environments is reflected by the notable growth of cities throughout the world, and this growth presents a great challenge. In the European Union, the degree of urbanization, i.e., the share of the population living in cities (density of at least 1500 inhabitants/km
2 and a minimum of 50,000 inhabitants) is about 42%, reaching as high as 90% in Malta and 56% in The Netherlands, and as low as 16% in Luxembourg [
1]. A city includes a single urban center with a high population density, which may be split by a wide river (e.g., Budapest) or cover two or more distinct cities that have expanded towards each other, but are functionally independent (e.g., greater metropolitan Athens), with at least 50,000 inhabitants each [
2].
The urban areas (i.e., cities, towns and suburbs) of the EU are home of about 73% of the population, while they occupy only 4% of the territory [
3]. On an annual basis, European cities use about 6 to 48 MWh per capita, and contribute to greenhouse gas (GHG) emissions with 2.5 to 16.4 tons of carbon dioxide equivalent (tCO
2-eq) per capita [
4]. To set an example, the EU has initiated an ambitious plan to introduce 100 climate-neutral and smart cities by 2030 [
3]. The cities will implement specific solutions targeting multiple sectors (e.g., green energy, construction and operation of near-zero or energy-positive buildings, and urban transport) and create synergies between citizens, local authorities, private sector and investors, so that all European cities be climate-neutral and smart cities by 2050.
The buildings sector used 391.1 million tons of oil equivalent (Mtoe) in 2021 (
Figure 1), or 41.6% of the total final energy consumption in the EU-27 [
5]. Following the COVID-19 pandemic and the resulting drop in final energy use of 8% that was recorded in 2020, energy consumption rebounded by 6% in 2021 and exceeded the 2020 trajectory lines towards the 2030 target (
Figure 1). Among all types of buildings, the residential sector consumes about double the energy used by services, due to the relatively higher number of residential buildings and their floor space. As a result, the residential sector is at center stage within EU policies for improving energy efficiency and curbing energy consumption. Similar challenges are also faced in other parts of the world. According to the world energy balances of the international energy agency (
www.iea.org), the energy use in buildings reached 2872Mtoe in 2020, which represents 30% of the world total final energy consumption, averaging 369Mtoe or 62% in Africa, 465Mtoe or 32% in the United States of America, and 453Mtoe or 21% in the People’s Republic of China.
The preliminary projection of the total EU-27 GHG emissions in 2021 is 3524 million tons of carbon dioxide equivalent (MtCO
2-eq), representing a rebound of about 5% from 2020, a year that reported a notable drop as a result of the economy slowing down during the COVID-19 pandemic [
6]. The contributions of energy-related emissions from the buildings sector are also significant. Specifically, direct emissions from onsite combustion in buildings reached about 534 MtCO
2-eq, or 15.2% of the total EU-27 emissions in 2021 [
6], while the allocated indirect emissions from power generation to the buildings sector are estimated at about 509.4 MtCO
2-eq, or 14.5% of the total.
The current trends of energy use and emissions reveal a challenging reality for countries that wish to comply with EU efforts to achieve climate neutrality by 2050 [
7]. Moving forward, the EU has set three intermediate key targets for 2030 that currently stand to produce a 55% net GHG reduction in emissions from the levels of 1990 [
8], at least a 40% share of renewables, and at least a 36% improvement in energy efficiency compared with the 2007 baseline projections of a ‘business as usual’ scenario for 2030 [
9].
Accordingly, all EU-27 Member States have developed National Energy and Climate Plans (NECP) for this decade (2021–2030) that detail long-term strategies and mandate major renovations of buildings, with the aim of a decarbonized building stock to be attained by 2050 [
10]. The work is evolving from a focus on nearly zero-energy buildings (nZEB) that have constituted new buildings in Europe since January 2021 [
11] to zero-emission buildings (ZEB), as of 2030 [
12], in order to meet the longer-term climate neutrality goal. Similar efforts are also being scaled up from buildings to zero-energy districts [
13], alongside other bottom-up initiatives [
14].
1.1. Building Stock Modelling
Within this framework, there is a need to handle a very large number of buildings in an urban environment, a region, or even a whole nation, in order to assess the effectiveness of different renovation measurements and quantify energy savings and the abatement of carbon emissions. This type of work is usually facilitated by building stock models (BSM) to support the decision-making process [
15]. BSMs are used to quantify emissions from the operation of a large stock of buildings, model their future evolution, and assess different renovation measures for the reduction of energy use and the abatement of GHG emissions. Among the available approaches, bottom-up BSMs utilize building typologies to handle the diversity of the thousands (or even millions) of existing buildings. The building typologies represent groups of buildings with the same use (e.g., residential, offices, or commercial buildings) and vintage that relate to typical envelope constructions, according to the energy codes and typical technical installations applicable at the time. One European typology that stands out and has been recognized for its applicability is TABULA, which has been developed for 20 EU Member States [
16] and successfully implemented to calculate the potential savings resulting from energy efficiency measures, and to prioritize policies. For example, in Germany, the TABULA database was used to relate the building’s age to the quantity of heating energy savings resulting from the renovation of residential buildings; these savings reached 8.6%, compared to only 3.9% when using the limited municipality data [
17]. In Greece [
15], using the Hellenic TABULA typology, it was estimated that the national final energy targets for heating energy use and related emissions will be met by reaching a 40% share of total energy from solar, along with a 3.6% annual renovation rate of the building envelope, and a 1.1% system modernization. In The Netherlands [
18], despite the significant number of energy improvements that have been realized, 28.0% of the dwellings achieved a slightly better energy label category, while only 3.5% had a major renovation that resulted in an improvement in their energy label by at least three categories. Finally, in Italy [
19], the analysis revealed that renovating the building envelope and upgrading heat production units can produce an average of 65% energy savings, which are usually most cost-effective in old and small buildings (e.g., pre-1945 construction period houses) and in cold climate zones.
The common inputs to bottom-up BSMs include the number of buildings, the size from the building’s footprint, and the number of floors (which is also related to the building type, such as a single-family house (SFH) or a multi-family house (MFH), for example, a multi-story apartment building). This information is usually derived from the census or from statistical data, which are then matched to the different building types with specific construction and system characteristics [
15]. However, these data are usually updated every decade, are cumbersome to analyze, and usually are not available with a sufficient spatial analysis suitable for local planning.
In addition, there is growing interest in the installation of solar systems on building rooftops, including thermal collectors and photovoltaics (PV), which are common energy conservation measures in NECP. However, the potential electricity produced by the PV will depend on the total panel area that can be installed on the buildings’ rooftops. Accordingly, among the critical parameters for a realistic assessment of potential heat or electricity produced by solar systems is the available (free) rooftop area (which may be different from the footprint of existing buildings), the roof orientation and the tilt angle, along with shading from surrounding buildings and other obstacles [
20]. This is another example of how more detailed information is necessary in order to support more realistic calculations.
Another potential reason for supporting and expediting data identification, along with the collection and processing of information about the built environment, is the development of urban scale sustainability assessment and rating systems [
21]. The audit process for collecting the necessary input data in order to quantify various sustainability criteria and key performance indicators is usually time-consuming. For example, soil sealing [
22] is one of the key indicators for assessing the environmental impact of urbanization. It refers to permanent coverage of the ground with impermeable materials such as asphalt and concrete, compared to the bare soil or vegetation of the natural landscape. It is estimated that on an annual basis, about 1000 km
2 of land in the EU (i.e., an area larger than the city of Berlin) is taken over for human occupancy, a large percentage of which is eventually sealed [
22]. Land taking and soil sealing reduce and sometimes practically eliminate the amount of rain water that the soil can absorb. This has several direct and indirect consequences on the hydrological cycle, the area’s ambient temperature and humidity, and consequently, on the microclimate, on soil stability as a result of landslide hazards, on the risk of flooding, and eventually, on fresh water scarcity. The percentage (%) of the weighted soil surface that is covered with different permeability materials within the total surface of the area of interest can be used as an indicator to quantify soil permeability.
1.2. Use of Georeferenced Data
Building stock modelling can greatly benefit from an automated process that can be used to extract up-to-date information about existing buildings, identify a building’s geometrical characteristics (e.g., building height, footprint), measure the available space on the rooftop areas, and differentiate the types of ground surface cover and their spatial distributions. These data can be extracted from images generated by high accuracy aerial mapping and remote sensing methods, e.g., light detection and ranging (LiDAR) or satellite images, which are now available to the public for further processing. However, there may be problems in detecting objects in satellite and aerial images. For example, to detect and differentiate building heights in urban environments, we must overcome obstacles such as trees and power lines, which may be located near the buildings in question. Similar problems can arise when buildings feature different construction materials which may have different reflective properties [
23]. LiDAR data have been used to calculate and visualize the solar potential of building rooftops, and to develop a 3D city model of Vitoria-Gasteiz, Spain [
24].
Eventually, the survey data can be used to generate digital city models, derive building footprints and heights, and identify the different types of surfaces within the urban context. The available information is then stored, analyzed and visualized with geographic information systems (GIS). Using manual processes to extract information about a building’s location and shape outlines from optical images is extremely time-consuming and expensive in large-scale applications; thus, there is a need to automate these processes for inclusion in GIS [
25].
GIS can also be used to facilitate efforts to model energy use and emissions from a large pool of buildings, and urban building energy modeling [
26], by supporting the geometric characterization of buildings and helping to visualize the spatial distribution of urban energy use [
27]. In this context, polygonal mapping of buildings is commonly used to extract a building’s footprint from high-resolution images in the form of polygons, and plays an important role in GIS [
28]. The available automatic processes include methods based on object detection formulas and building vectorization, among others.
Similarly, GIS can expedite efforts to collect the necessary input data, for example, through quantifying the open and green areas, or through identifying the different types of materials to then estimate the environmental impacts of soil permeability [
29]. Finally, GIS-supported tools can map different types of information that can facilitate spatial analysis for urban planners, and can effectively communicate a wealth of information to decision-makers and other experts.
For example, a case study aiming to exploit GIS using open-source information for building stock was implemented for a neighborhood in Bologna, Italy [
30]. The work mapped the current energy performance of buildings and identified their renovation potential. The maps developed from the GIS tool provided an estimate of the energy use and analysis of both residential and non-residential buildings’ performance. As a result, the system can help public administrators to develop targeted energy policies according to the different energy diagnoses of the building stock. In an another effort, simple GIS files were used to automatically generate urban building geometries that were then coupled with typical energy use intensities for single- and multi-family houses and retail buildings to simulate and visualize the energy performance of buildings in Evanston, IL, USA [
31]. A geo-referenced BSM was used to collect, manage and analyze spatial data in Trondheim, Norway [
32]. The GIS model utilized cadastral maps with all the necessary data on building types (i.e., three types of residential building and eight types of service building), the year of construction, and the floor area of the buildings. The work analyzed various scenarios for energy upgrades of existing buildings, new construction of energy-efficient buildings, various heating technologies, and energy carriers in order to assess energy savings and GHG emissions from the present day until 2050. The findings were integrated in GIS-generated maps to help local planners visualize the results and support policy decisions by identifying urban areas of interest and the future expansion potential of the built environment and its impacts on power capacity, the extension of district heating, local energy production, etc. A geospatial database was created by linking a GIS database of building footprints with the TABULA building archetypes and their attributes for a study in Dublin, Ireland [
33]. The study exploited data from images in Google Street View, used census data to link with the construction period, and was complemented with some field work. The result of the process was the development of a digital ‘twin’ used to model spatiotemporal energy flows.
GIS has also been used to facilitate the investigation of the degree of urbanization classification in a geospatial context [
34]. In addition to the available tools, global interactive maps are accessible online for the presentation of the urban center’s database, with a 1 × 1 km resolution, differentiating among an urban center, urban cluster and rural grid cells [
35].
1.3. Aim of This Work
The overall aim of this work is to exploit free public datasets in order to retrieve more accurate and updated data as the input to a BSM (which is suitable for urban scale spatial analysis) that are complemented, where necessary, with in situ and statistical data from other publicly available statistical, cadaster and socio-economic data. Initiating the effort, this paper presents an automated procedure that was developed for extracting relevant information about the building’s characteristics and other features of urban environment from open data, using non-commercial tools provided by GIS. Energy performance indicators and the potential energy savings from the use of PVs on rooftops were calculated. The procedure was written using a common programming language and implemented as an external code in a free and open-source geographic information system platform. As a case study, the workflow and tools were demonstrated on a city block to identify and size the building’s structures, the free rooftop area for the installation of PV, and the area’s ground coverage. The data were then used to characterize and visualize the energy class of the buildings before and after the installation of PVs on the rooftops, along with the area’s ground permeability factor.
2. Methods
This work developed and tested an automated procedure that exploits GIS to facilitate the data collection and analysis of information on the built environment in large urban areas, solely using open-source data. Large-scale urban modeling can be very demanding in terms of time, data, software and the accuracy of results [
36]. Different modeling details depend on the input parameters, specifically on the data availability and the accuracy of any simplifying assumptions incorporated into the model.
The procedure was implemented as a code in Python programming language (
Supplementary Material), and computed to run on the open-source QGIS python platform [
37]. The zonal statistics process used in this procedure already exists and is supported by the QGIS application programming interface (API). Among other languages, Python is easier to use, having logical syntax and easy access to well-known libraries such as Google Maps, making it a very popular language in the GIS community [
38].
Each of the processes can be used from third party programs using the Python API that runs in QGIS. This work used the QGIS software version 3.16, which was the most stable according to QGIS.org; meanwhile, this work was also test-run with the 3.22 version, which was the newest version at the time that the work was completed.
The code was first used to process the information collected from various data sources, and second to derive some new information. For validation, the code and the various intermediate steps and processes were applied to a city block of a municipality in the northern Athens metropolitan area (see
Section 3). Dealing with a relatively small urban area, it was possible to validate the results against visual observations and onsite measurements, and if needed, tweak the implemented rules, criteria and other processes to improve accuracy.
The overall approach identifies the specific buildings in the investigated area, automatically extracts data on the available rooftop areas for the installation of PV, relates the building characteristics to the energy performance of specific building types, and estimates the resulting energy savings and the abatement of emissions. Another case study was performed on the general urban environment to automatically process and extract relevant data for calculating soil permeability, which is a commonly used sustainability indicator.
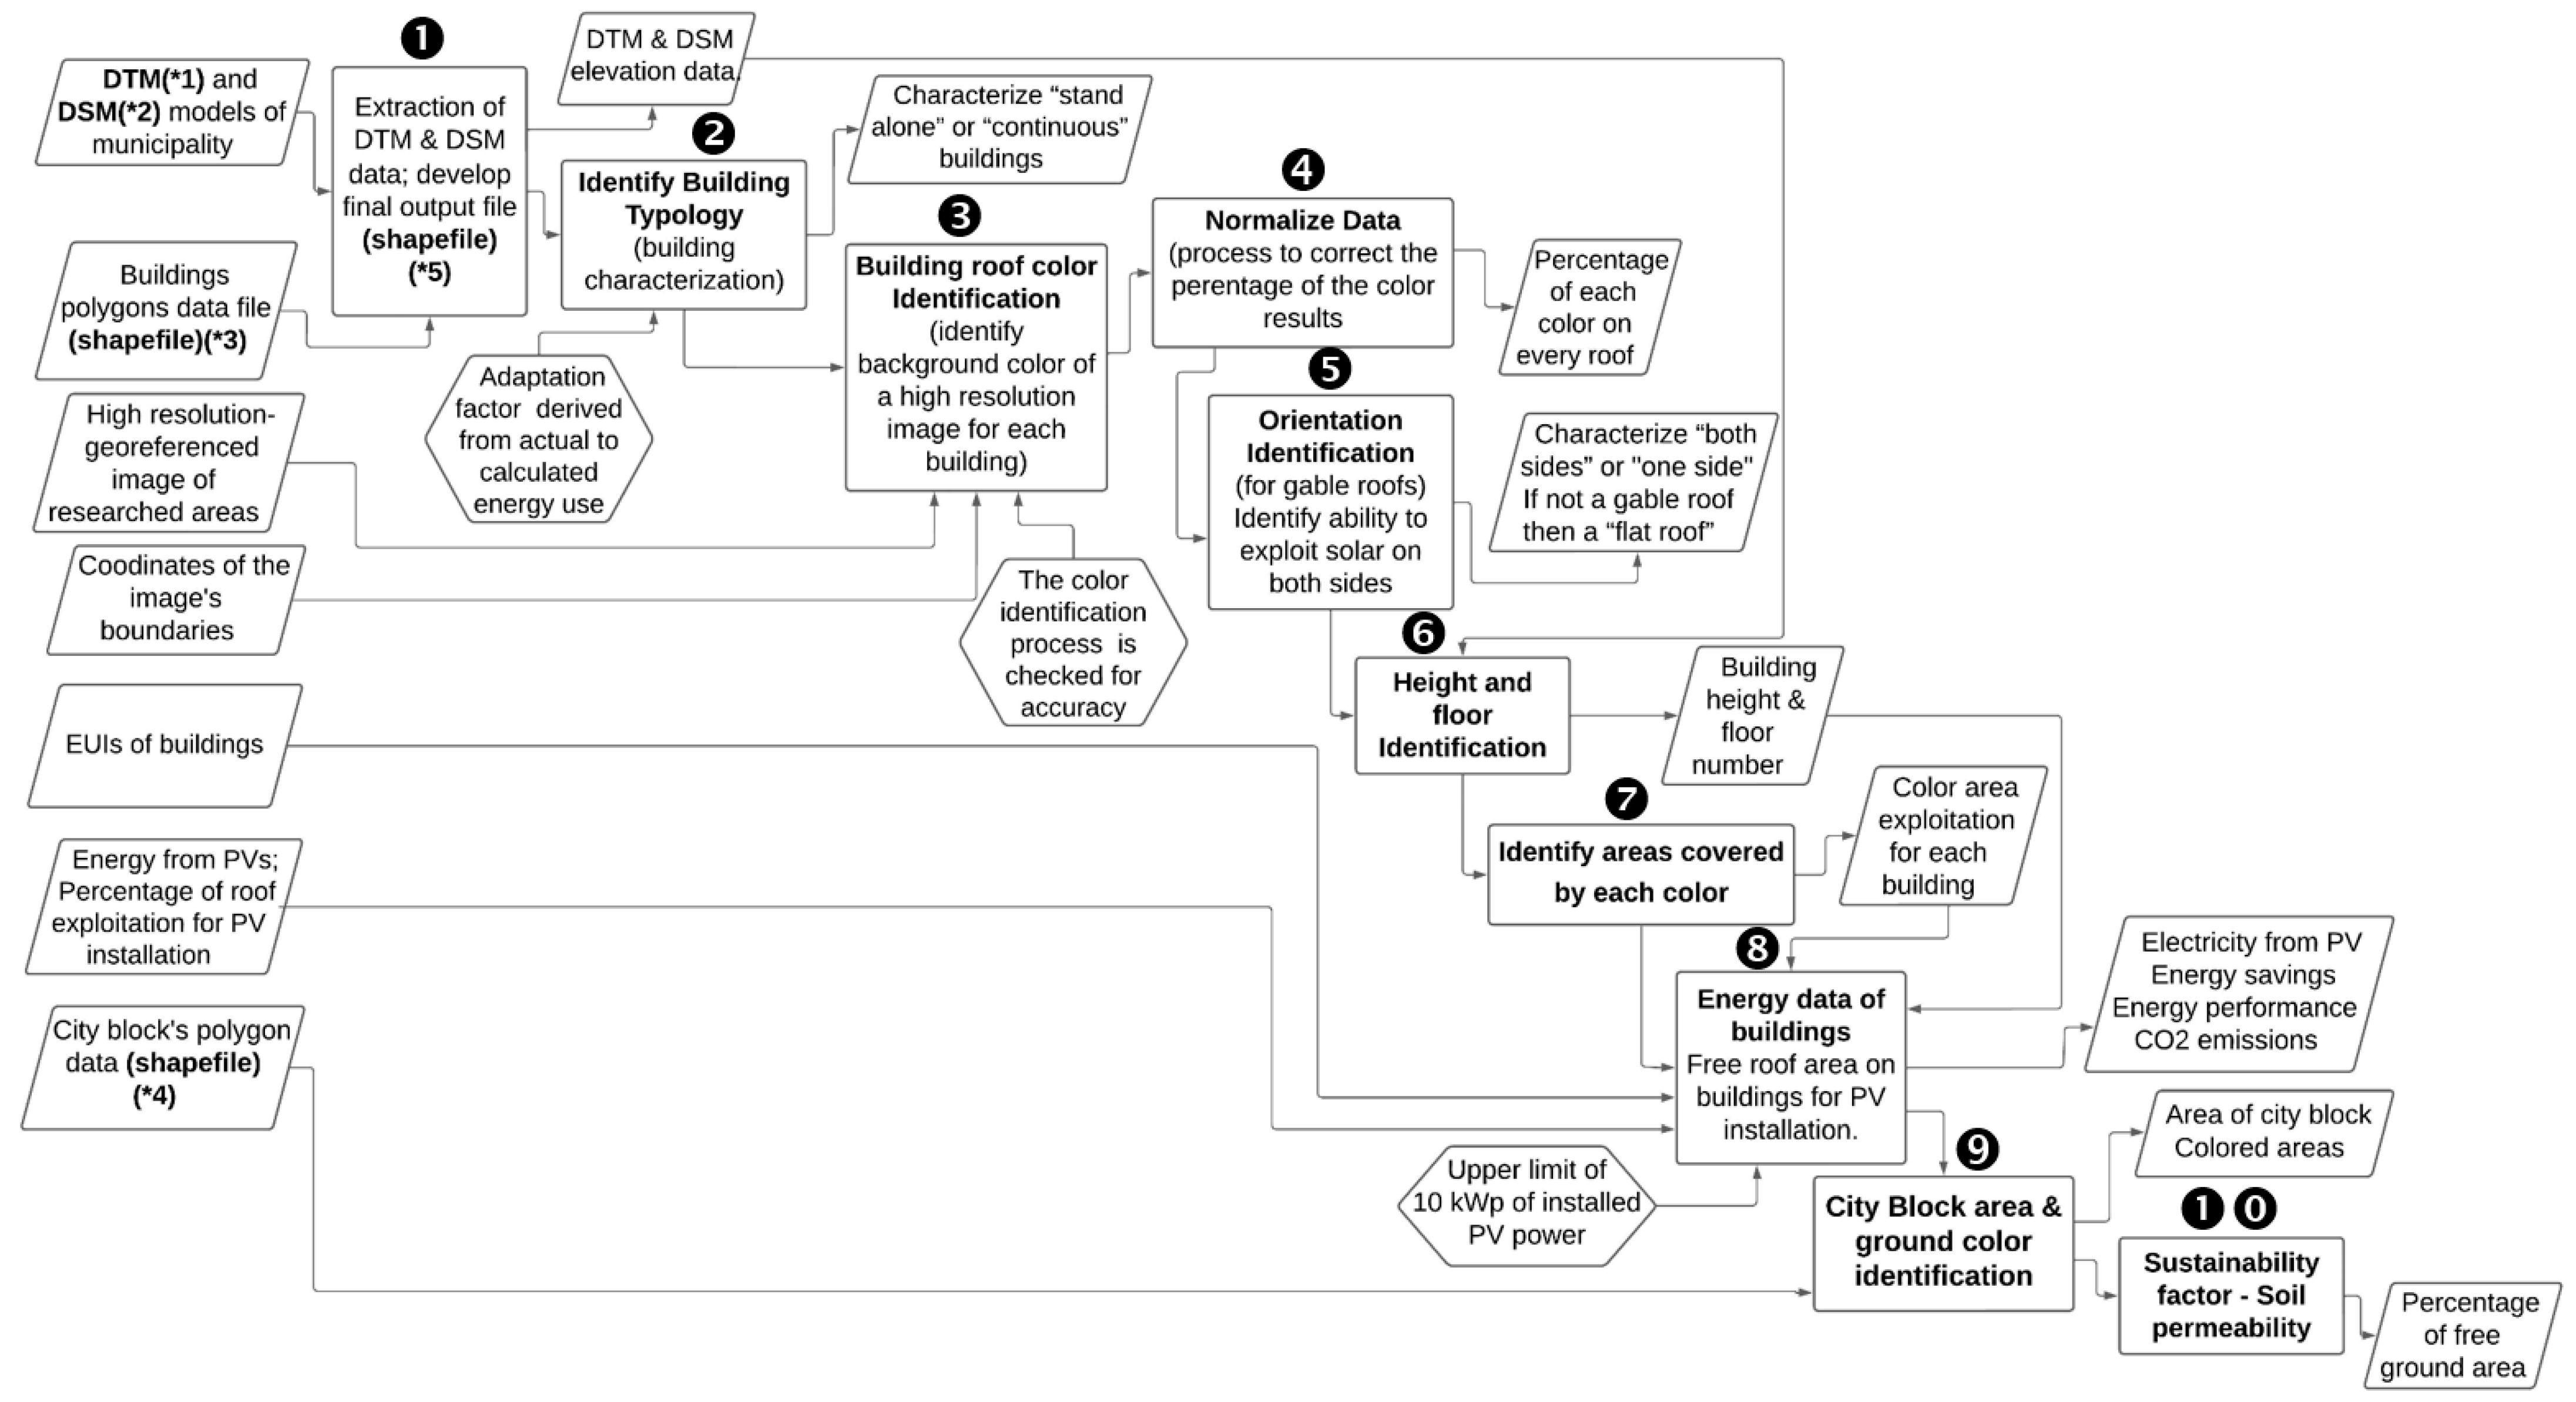
Figure 2 presents a flow chart that illustrates the main stages of the overall method. The necessary input data, along with the main calculation steps and analysis, are elaborated in the following sections. Finally, all the main results (e.g., building height, number of floors, type of roof, available rooftop areas, electricity produced by PVs, soil permeability factor) are stored in a specific output file.
2.1. Data Sources
The data collected about the built environment targets the definition of the buildings’ architectural characteristics (e.g., number of floors, rooftop available areas) along with relevant information on the open spaces in the urban area of interest. As shown in
Figure 2, the overall method is divided into ten processes. Each one requires a specific input that can be obtained from various open-source data sources that are outlined next. As already mentioned, a fundamental criterion for identifying and using potential data sources in this work is the requirement that the main information is derived from open data sources. This minimizes any complementary data that will have to be provided from competent companies for the case study in Greece.
The geodata are used to extract a variety of information such as the buildings’ polygons, roads, etc. The procedure (
Figure 2) starts with the definitions of the polygons that outline the footprints of the buildings. The basic information is extracted from a platform that provides open-source data for about almost every country in the world [
39], and depicts the digitized area of each building.
2.1.1. Building Height and Floors
The main information for deriving the specific geometrical characteristics of all the buildings in the investigated area (step #1 in
Figure 2) is retrieved from a DTM (digital terrain model) and a DSM (digital surface model) that capture both the features of the natural and the built environment [
40]. The DSM contains remotely sensed elevation data, with both bare-earth and above-ground information such as vegetation cover. The DTM contains only ground-level information data. Accordingly, the height of the buildings is calculated by subtracting the height of the terrain (DTM) from the surface height (DSM).
Since the DTM and DSM files do not contain any additional long-lasting relevant data for other processes or stages of this work, an automated procedure was first developed (
Supplementary Material) and used to determine the building height data. This information is then stored in the final output file (a shapefile identified as (*5) in
Figure 2) that is the data depository of all the results of this work.
The number of floors for each building is derived by assuming that the typical floor height is 3 m. The total floor surface of each building is calculated by multiplying the number of floors with the building’s footprint area, which was initially derived from the building polygons. In addition, the number of floors is relevant input data for defining the building type (e.g., SFH or MFH), which is then related to the total building’s floor area, energy consumption, etc.
2.1.2. Building Types
The process identifies the building types in terms of characterizing each building as a “standalone” structure, if all the facades are exposed, or as part of terraced buildings, which represent a “continuous” construction. The only input data needed for this process are the buildings’ polygons. A buffer zone of 50 cm is created around the outline of each building. An intersection of the outlines from the buffered buildings will identify the standalone or terraced buildings. The 0.5 m distance was empirically defined after examining different cases of dense urban environments, and this distance may need to be adapted for other applications. The results of the process were successfully checked for their accuracy when characterizing buildings by using the Google Street View application [
41].
2.1.3. Rooftop Type
This process focuses on building roofs in order to identify the type of roof (e.g., flat or tilted) and the available rooftop area for the potential installation of solar systems. The analysis is based on the identification of the rooftop surface colors, utilizing the buildings’ polygons data as well as high-resolution images (3840 × 2160 pixel analysis) that are extracted from Google Earth [
41]. The identified surface colors are related to specific roof materials and other surfaces. For example, the free rooftop surfaces are identified by terracotta and shades of brown Roman roof-tiles for tilted roofs, and by the light gray color of flat concrete tiles for flat roofs. The color pallet and the colors’ associations with specific building materials and types of roofs may need to be refined, depending on common construction practices.
To improve the accuracy of the results from this process, it is necessary to use high image analysis to properly depict all the details on each building’s roof. However, the available images from Google Earth do not provide sufficient accuracy, and must be properly processed.
Accordingly, the first step is to georeference the available images so that they can be further processed. In this work, this issue is addressed using the Hellenic Geodetic Reference System (EGSA87) [
42]. In addition, the buildings’ polygons data are also georeferenced with the EGSA87 system. This is necessary in order to have a common reference system for processing all the data. This initial process uses the buildings polygons data as background, and automatically clips all the edges and images outside the buildings’ footprint polygons. The result is a newly georeferenced image that contains only the information that relates to the building’s roof surface.
The coordinates of the vertices of each building polygon are calculated using the “extract vertices” process of the open-source QGIS, and then developed using “add geometry attributes” [
37]. The vertices of every examined building are defined with (x,y) coordinates, and the minimum and maximum coordinates are identified so as to pinpoint the building’s location in each direction. This way, it is possible to identify the area of the georeferenced image that belongs to each building. The boundary coordinates of the image are necessary for this process. These are the starting coordinates, since the vertex coordinates of each building will lay between them.
Having identified the area of each building, the process to identify the roof surface colors for each building is facilitated using the “pillow” external library [
43]. This library is used to identify the pixel colors in Python programming language. Accordingly, the entire roof is considered as a collection of different pixels. By identifying the surface color on each pixel and summing up their corresponding areas, it is possible to calculate the total surface area that corresponds to a given color code. The results of this process are the percentages of each surface color that is detected on every roof. The color pallet used in this analysis and their interpretations are as follows:
Grey (light and dark coloration) and grayish white, which refer to concrete tiles on flat roofs;
Terracotta and shades of brown, which refer to Roman tiles on tilted roofs;
Green, which refers to roof gardens, plants or other vegetation;
Black, which refers to shades in the image.
The distinction between light and dark coloration of grey colors was necessary in order to identify different objects that may be located on each roof and had to be excluded from the total available area on each rooftop. In addition, the black colored pixels depict areas that may not be available for the installation of new solar systems. Finally, the data are used to identify the available space on each rooftop for the installation of solar systems.
The limitation of this approach is that the definition of the building’s area was only based on the coordinates of the vertices. As a result, some rooftop pixels may be outside the actual building polygon; thus, in some cases, the identified area may also contain information outside the perimeter of the building roof. To address this problem, a normalization process was developed in order to adapt the estimated rooftop area. In this context, the percent of the area that corresponds to each surface color is divided by the sum of the combined percentages for all four rooftop surface colors (i.e., brown, grey, green and black). The normalized results are stored in the final output file (the shapefile identified as (*5) in
Figure 2), which is the data depository of all the results from this work.
2.1.4. Roof Orientation
The orientation of the tilted roofs is important when considering the performance of solar systems that may be installed on the roofs, since it will impact the intensity of the incident solar radiation. The brown color that corresponds to Roman roof tiles identifies pitched roofs and differentiates them from flat roofs. However, it is possible to encounter other colors, for example, different shades of terracotta or burgundy, and even to identify some other objects and obstacles that are brown-colored within the available roof images. To handle this issue, the rule was that the specific surface color must be the dominant one, i.e., it must exceed 60% of the total roof surface, which corresponds to a pitched roof. The simplifying assumption is that the design is always a gable roof, with two sloped sections on opposite sides of the roof ridge, which represents the most popular style of tilted roof.
The orientation of the tilted roof is determined based on the coordinates of the vertices of the building’s polygons to calculate the azimuth angle (grad) [
42] between the long axis of the building roof and the north direction. The results range from 0 to 400 grad. If the azimuth angle lies in the range of 0–75, 125–275 and 325–400 grad, then the roof is characterized as a “double-pitched roof”, which implies that solar systems can be installed on “both sides” of the roof. Otherwise, the tilted roof is a “single-pitched roof”, which is referred to as “one side”. Assuming that all titled roofs have a common inclination of 20 degrees according to local urban planning and building regulations, it is possible to calculate the actual tilted roof area using the rooftop footprint. Although the tilt angle will depend on the building design and architecture, small deviations are not essential for this type of work. However, depending on the geographic region, it may be necessary to account for a steeper slope of up to 40 degrees in areas with significant snowfall, such as northern parts of Greece.
Buildings with a flat roof are not part of this process. It is evident that in this case, the orientation of solar systems can be optimized on a flat roof. Accordingly, the characterization of flat roof buildings is included in the final output file (the shapefile identified as (*5) in
Figure 2).
2.1.5. Roof Area
The building’s rooftop area is calculated for two categories (step #7 in
Figure 2). The first one refers to flat roof buildings, for which it is possible to use the “add geometry attributes” process that determines the areas in view. This information is then used to derive the corresponding segment that is occupied by a specific roof surface color (from
Section 2.1.3) on every building.
The second category corresponds to buildings with a pitched roof. Assuming a tilt angle of 20 degrees for the gable roofs, which is a common feature of roof architecture, the tilted surface hypotenuse on each side of the roof is calculated as a function of the footprint multiplied by the cosine of the tilt angle. The results of the rooftop area for each building are also stored in the final output file (the shapefile identified as (*5) in
Figure 2).
2.1.6. Energy Use and Carbon Emissions
Adapting the concept of the European TABULA building typologies to this type of work, it is possible to handle the complexities of a building stock and make a first estimate of their energy and carbon performance. Accordingly, the building types are classified based on their size (e.g., SFH for buildings with up to two floors, and MFH for buildings with more than two floors) and vintage (e.g., construction period), which relates to the different construction practices (e.g., the use of thermal insulation in building codes, and the energy performance of the building’s technical installations) [
44]. For example, according to the Hellenic energy codes, the first construction period of pre-1980 refers to buildings with no thermal insulation (e.g., Uwall about 1.9 W/m
2·K), the 1981–2010 period refers to the time at which buildings were constructed according to the first thermal insulation regulation (e.g., Uwall at 0.7 W/m
2·K), the 2011–2017 period refers to the time at which that buildings were constructed according to new energy efficiency regulations of buildings (e.g., Uwall from 0.4 to 0.6 W/m
2·K, according to the four national climate zones), and the post-2018 time period refers to the latest and more strict energy efficiency codes for new buildings (e.g., Uwall from 0.35 to 0.55 W/m
2·K for the four national climate zones).
The classification of the studied buildings into different categories allowed the use of relevant information from the corresponding classes of the Hellenic TABULA typology [
44], associating energy use intensities (EUIs) and carbon emission intensities (CEIs) with each building. Typical buildings reflect the architectural trends of their age band, with construction and system characteristics calculated as weighted averages of the corresponding data for the existing building stock.
Ideally, the actual energy use of the buildings may also be retrieved from the utilities for electricity, natural gas and district heating, although some restrictions apply due to the limitations on the use of personal data and privacy laws. On the other hand, the delivery of bulk fuels such as heating oil or biomass from different suppliers may be more challenging to monitor and keep track of. For example, in Greece, where the use of heating oil remains popular in areas without access to natural gas, this habit would mandate direct contact and collaboration with the building owner/manager/occupant in order to collect this data, provided that invoices are available and accessible. In any event, considering the constraints of data availability and time restrictions, a detailed analysis of the buildings’ energy performance was not within the scope of this work; in any event, it would be challenging for large building stocks.
Alternatively, the actual energy consumption of individual buildings may come from energy performance certificates (EPC) and adapt the calculated values for realistic estimates of actual energy consumption [
45]. In some cases, it may also be possible to use EPC data on actual thermal and electrical energy consumption, if available, since this information is included on a voluntary basis. In some cases, it may be possible to directly access the actual energy consumption data from the national registry for a city or a region, provided that this information is linked to unique building code identifiers.
This type of information can facilitate the process of identifying the energy classes of the existing building stock, and identifying hotspots in the parts of a city or the neighborhoods that are dominated by high-energy-consuming buildings. On the other hand, this process would not be straightforward, because one would need to first relate every physical building in the investigated areas to the corresponding EPCs, if available. This matching process can also be challenging, since the information contained in publicly available EPCs does not reveal personal data and unique building identification data.
Usually, the building EUIs can be based on national averages of actual energy use, they can be retrieved as an average value from a European database [
46], or they can be associated with archetypal buildings from the European TABULA typology, which is available for 20 EU Member States [
16], one example being the Hellenic TABULA typology [
44].
In this work, the EUIs and CEIs of the typical Hellenic buildings are the result of normative calculations adapted using a derived set of empirical factors as multipliers for correcting the calculated values to obtain more realistic estimates of actual energy use [
45]. Next, specific energy consumption is calculated by multiplying the average EUI and CEIs with the corresponding floor area of each building in order to calculate the final energy consumption (total and electrical) as well as the CO
2 emissions of the area in its present state.
In Greece, normative calculations for residential buildings only account for space heating, cooling and domestic hot water (DHW), according to the national regulation on the energy performance of buildings in Greece [
47]. For energy labeling, end-uses such as lighting (only considered for non-residential buildings), cooking, white appliances, and other plug loads are not taken into account. With regard to actual energy consumption, the use of electricity for space heating represents 3.0% of the total electricity use in Hellenic households, while 4.9% is used for cooling, and 9.4% for DHW [
48]. Thus, only 17.3% of the total electrical EUI of buildings is considered within the national calculation method. Accordingly, the total electricity consumption from the normative calculations should be adapted by 17.3% in order to include all the different energy uses in the estimated EUIs from the normative calculations. Depending on the calculation approach, this step of the method may not be necessary if the calculations include all end-uses.
An energy performance rating is assigned to each building in the investigated area. According to the national energy performance regulation [
47], the scale extends from the lowest energy class, G (low-performance buildings), to the highest energy class, A+ (high-performance buildings). The average electrical EUI of residential buildings is estimated and then transformed into primary energy using the appropriate national primary energy factor. In this work, the national conversion factor of 2.9 is used for multiplying the electricity consumption, according to the national regulation [
47].
The final step in the process is the calculation of the carbon dioxide emissions from the use of electricity. In this work, the national conversion factor of 0.989 kgCO
2/kWh for electricity is used for calculating the carbon emissions, according to the national regulation [
47].
2.1.7. Rooftop-Mounted PV
A popular renovation measure for improving the energy performance of existing buildings and GHG mitigation is the installation of PV on building rooftops. An added value of this work is that we realistically assess the free rooftop area of each building, which enables a more realistic calculation of the total power capacity that can be installed on each building.
The general approach to sizing the installation will utilize information about the free rooftop area of each building (
Section 2.1.5) in order to install the PV panels, optimize the PV orientation on flat roofs and account for the tilt and azimuth angle of pitched roofs, and calculate the generated electricity for the selected type of PV panels using an appropriate tool [
49]. In this work, the PV sizing and electricity production follows a simplified approach which is exemplified during the case study (see
Section 3).
Finally, the electricity produced from the rooftop PVs on each building is used to determine the new energy class of each renovated building. All the results of this process are collected and stored in a final output file. This completes the development of the relevant building data and the energy performance assessment of the buildings.
2.1.8. Soil Permeability
This part of the procedure is intended to facilitate efforts in the direction of sustainability assessment. This step is related to the color identification of the ground surface in a city block. The objective is to facilitate and expedite the process of identifying open green and soil-covered areas, in contrast to the areas covered and sealed by hard surfaces, such as buildings, paved roads, sidewalks, etc.
The same color identification procedure as the one used for buildings is followed here. Again, the city block undergoes a pre-processing procedure in order to qualify for use under the stipulations of the code. First, the city block is retrieved from the official platform of the Hellenic national urban planning services; then, it is georeferenced using the QGIS platform. The process starts with the identification of the city block area and continues with the color identification process. Both of these steps are performed in the same way as in the color identification process. The only difference is that this time, the image coordinates are not necessary, since these are defined by a single polygon. The results of this process are stored in the city block final output file.
The available information is used to calculate a sustainability indicator of the city block that relates to the condition of the ground. Urbanization is usually related to soil sealing with impermeable materials for expanding the built environment, road networks, and other infrastructures. This poses a great risk to biodiversity, increases the risks of floods and water scarcity, and contributes to global warming. This indicator may be of practical importance to decision-makers, in order that they develop strategies and assess solutions in pursuit of sustainable communities [
21].
The calculation of soil permeability requires the type of areas that compose the urban environment as input data. Specifically, the indicator is defined as a ratio of the sum of the different type of surface areas multiplied by their corresponding permeability coefficient (e.g., 1 for grass, 1 for soil, 0 for concrete) to the total area of the city block.
3. Validation Case Study
Validation of the method and tool was performed using a city block of a residential area in northern metropolitan Athens as a case study.
Figure 3 illustrates a high-resolution image of the area, which is used to facilitate the object definition and the color identification process of the buildings and the surrounding area. As a point of caution, the structure highlighted with the yellow outline in
Figure 3 is missing from the DTM and the DSM models. In addition, the buildings’ polygons shapefile did not include the outline of this building. Apparently, this is a rather new construction, and as a result, there were no height data available in the input data files. Consequently, this building was also excluded from the following process.
Table 1 lists the files that were used as the input (*1–4) and output (*5) of the method (
Figure 2) during this validation exercise, and that appear in the code (
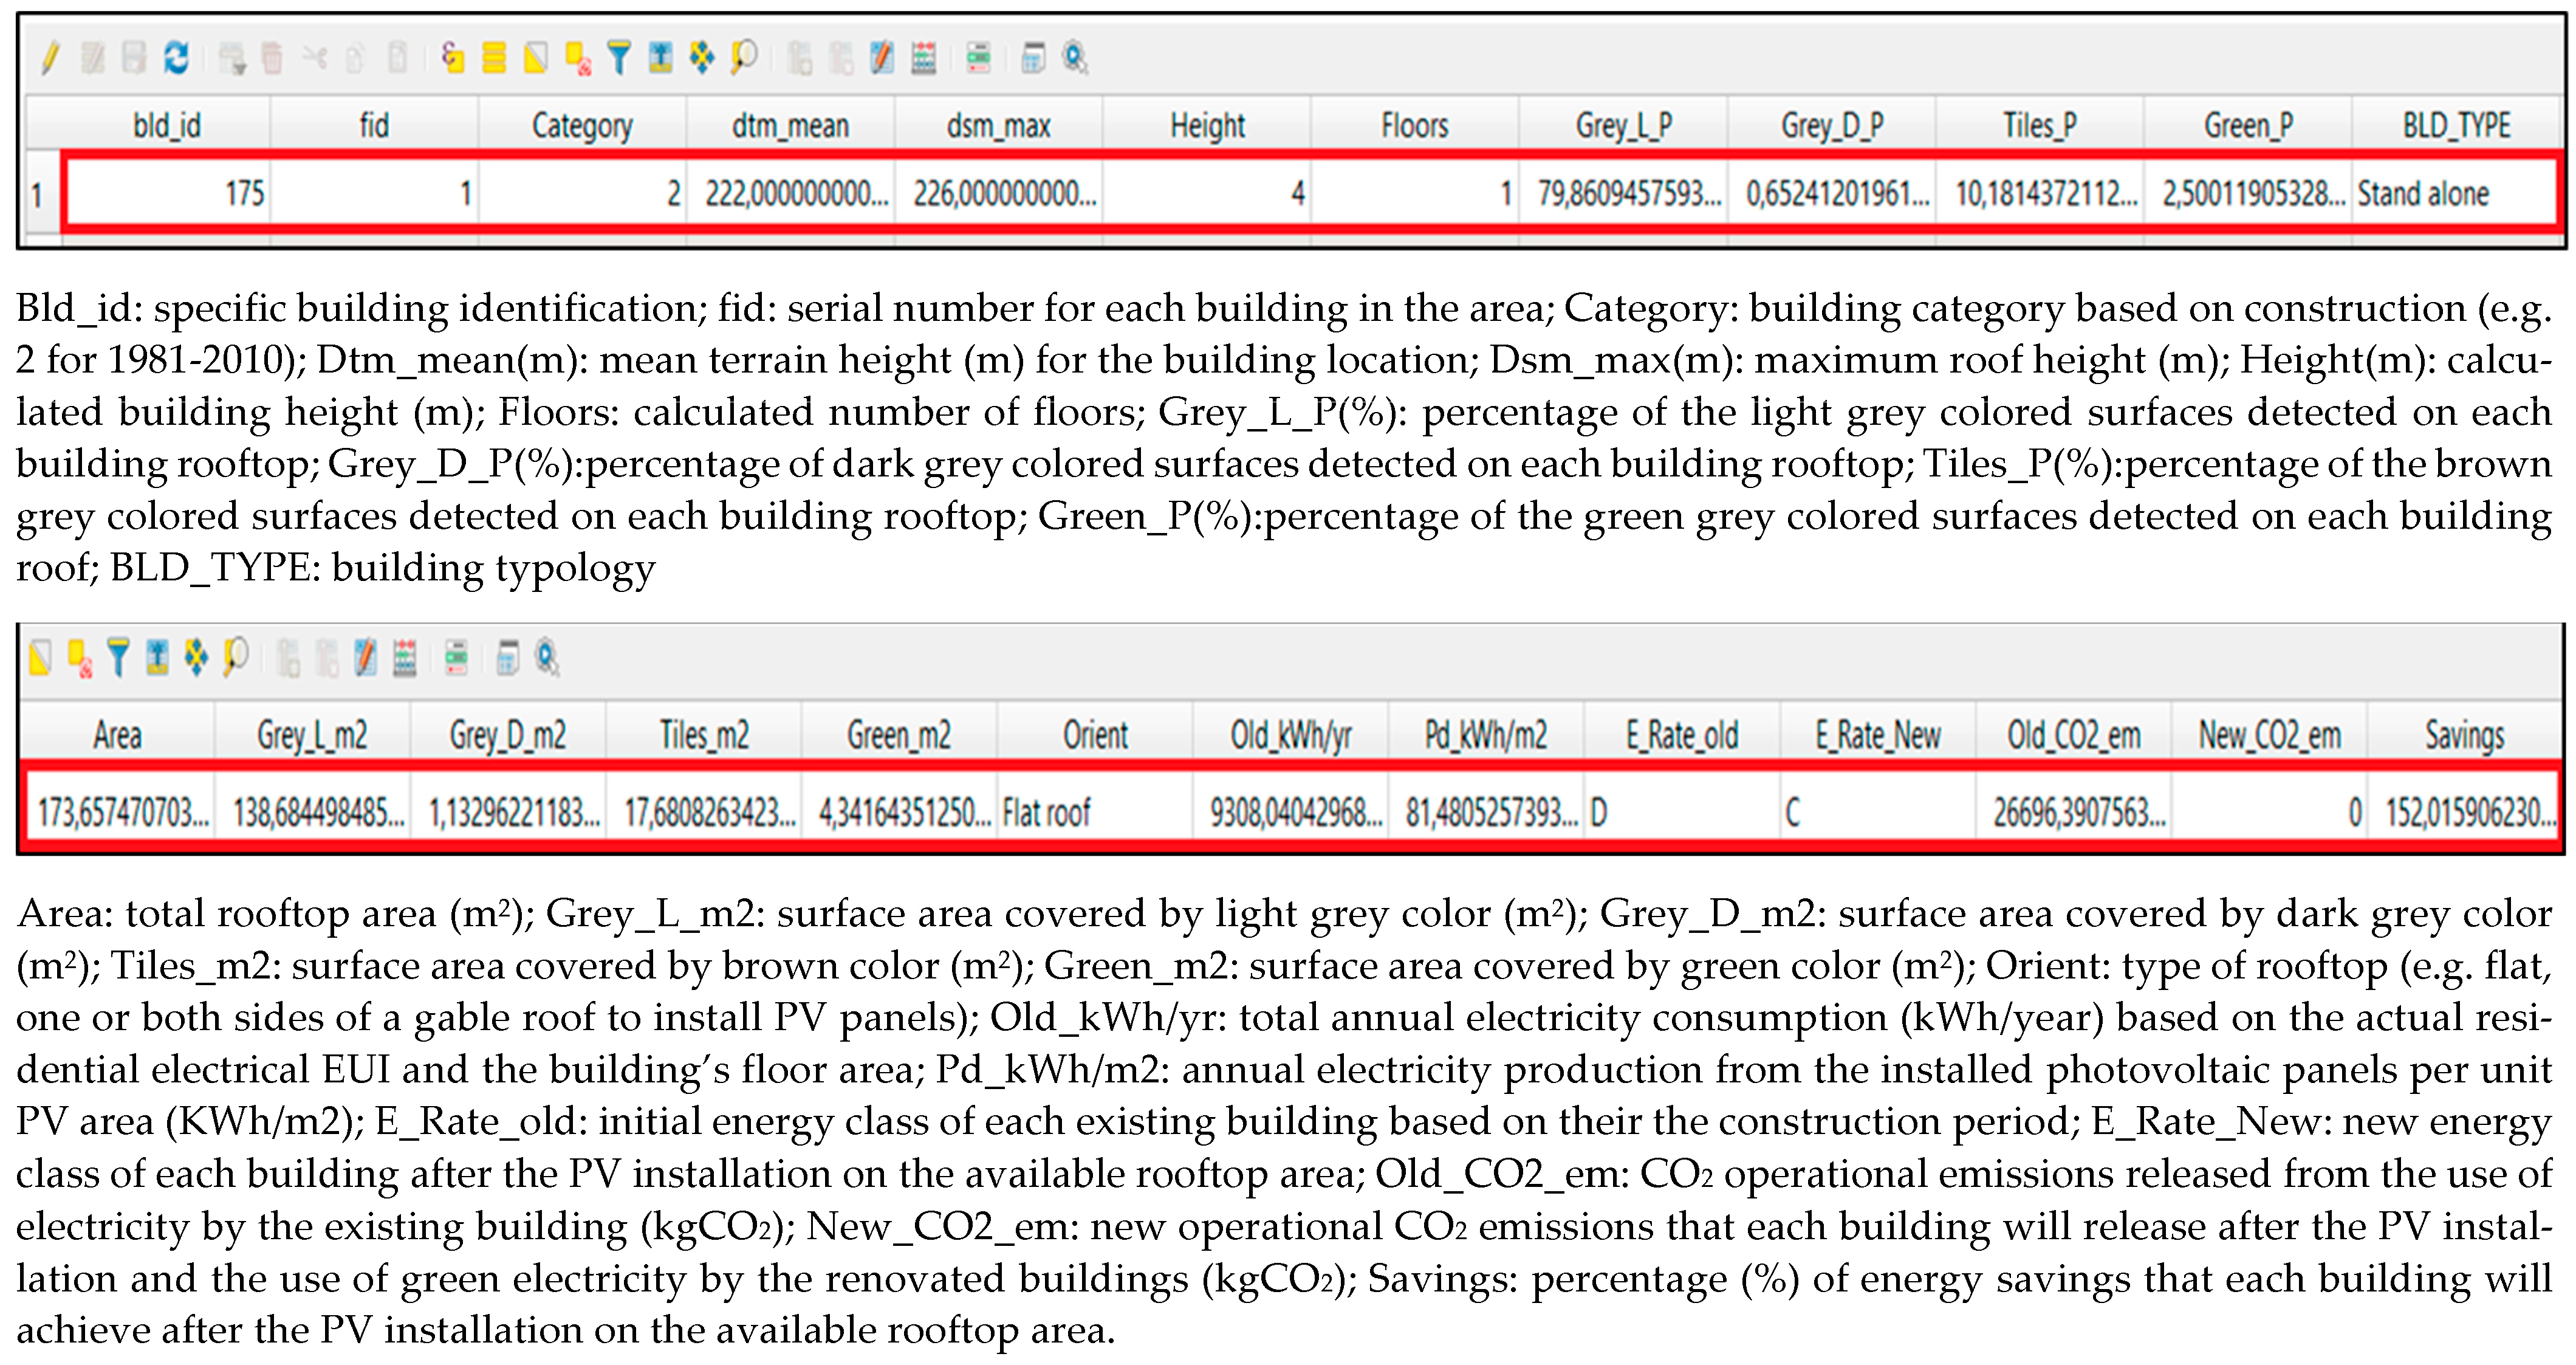
Supplementary Material). The results in the *5 file are presented in the output file’s attribute table, which displays information on specific features of a selected layer, e.g., the buildings’ polygons. The attribute table is divided into rows and columns. Each row in the table represents a feature of each building’s characteristics, and each column contains a particular piece of information about the type of data (e.g., building height, area, etc.) and other features that each row contains [
37]. As far as the city block’s developed data are concerned, the *4 file was used as the output file.
Table 1.
Input (*1, *2, *3) and output (*4, *5) files for the case study.
Table 1.
Input (*1, *2, *3) and output (*4, *5) files for the case study.
| Code | File Name |
|---|
| *1 | Municipality_DTM.tif |
| *2 | Municipality_DSM.tif |
| *3 | Building_Polygons.shp |
| *4 | City_Block.shp |
| *5 | Municipality_Building_Stats.shp |
Figure 4 illustrates the derived buildings’ polygons from the available geodata [
39] as a layer over the corresponding high-resolution image. As shown, the polygons realistically match the footprint of the buildings, and give us confidence that the process can recreate the building’s dimensions and locations. Also included are two captions for the visualization of the inputs for the mean heights from DTM and the maximum heights from DSM.
The data for the city block were obtained from the online platform of the national urban planning services (e-Poleodomia) in Greece [
50]. The data were only available in portable document format (pdf) files, and had to be digitized using the QGIS platform. This information is necessary for developing a process that can identify and extract data about the city block with regard to the green and soil-covered areas.
In order to overcome missing information and simplify the calculation process for this case study, some assumptions were made during this stage of the work. All the buildings in this city block are considered to have an exclusive residential use, which is actually realistic, considering that this is a residential area.
The concept of building typologies is used in this work to handle the complexities of individual buildings in a large building stock, and to make a first estimate of their energy performance. In this context, the classification scheme of the Hellenic building typology is defined as a function of the building size (i.e., single-family houses, SFH, for low-rise buildings with one or two floors, and multifamily houses, MFH); building age, with a classification based on the year of building construction (which relates to the minimum code requirement on envelope thermal protection); and building location, which relates to the prevailing weather conditions for the different climate zones [
15]. In this work, the year of construction (age) of the buildings was estimated by analyzing the façade of the buildings using the Google Street View application [
41].
Each building is assigned an energy performance rating according to the prevailing energy classes derived from analyzing the EPCs of residential buildings for different construction periods [
51]. Considering that these data are representative national data for residential buildings in Greece, they were attributed to the buildings of the case study according to their construction period. For example, the predominant energy class for the pre-1980 construction period (no thermal insulation) is energy class G. The second construction period (1981–2010) is dominated by buildings partly insulated according to the first national regulation, and these are characterized by an energy class D. The third period (2011–2017) corresponds to an era of energy efficiency regulation of buildings, for which the most popular energy class is C [
51]. In the post-2018 construction period, according to the latest and more strict energy codes, the ranking is set at energy class B for all new buildings, and also for every existing building that undergoes a major renovation.
Regarding the architectural building features, the typical floor height is taken to be 3 m. The calculated number of floors was validated through visual inspection of the actual buildings. Accordingly, it was confirmed that the process can accurately estimate the number of floors for 8 out of the total 14 buildings. In the other cases, there was a difference of 1 floor. This is acceptable and comparable with other open-source tools that achieve an error of 1 floor in building heights, which is sufficient for most city-scale analysis [
52]. Furthermore, a closer investigation revealed that the deviations are attributed to cases in which the ground floor was below street level (for buildings with semi-basements), or to cases in which the first floor is above the street level (for buildings with pilotis).
Buildings with tilted roofs are considered to have a gable roof. Apparently, this simplification is not realistic for two of the buildings in this block (i.e., buildings #7 and #13 in
Figure 3), which have more complex geometries.
The results of the process for the identification of the rooftop surface colors were checked for their accuracy using visual inspection of the outputs and the actual images. Specifically, for the city block considered in this case study, the identification accuracy in a small area featuring brown, light grey and green colors was 98%, 94% and 95%, for each color, respectively. The 95% accuracy for the green was observed in areas with limited vegetation, while in areas with widespread greenery cover and trees, the accuracy dropped down to 66% due to shading from trees.
Other possible deviations may have occurred as a result of faded surface colors. For example, the widest disparity between reality and the interpreted colors was noted on a rooftop application, with a success rate of only 53% for the brown color on a tilted roof, and of 43% for light grey on a flat roof. Overall, the process provided results with which the majority of the surface colors and their interpretation according to the type of rooftop were in agreement with reality.
3.1. Assumptions and Energy Calculations
The exact year of construction for the buildings was not readily available for this case study. This information is relevant because it is needed in order to classify each building under one of four different construction periods that relate to different building codes and the use of thermal insulation in the envelope construction, both of which have a great impact on a building’s overall energy performance. Accordingly, the vintage along with its location and end-use (e.g., SFH, MFH) define the building’s typology.
All the buildings considered in this case study were erected during the second construction period from 1981 to 2010. From the Hellenic TABULA typology, the buildings’ total EUI was 196.4 kWh/m2, while the electrical EUI was 137.3 kWh/m2. The operational CO2 emissions were estimated at 164.5 kgCO2/m2.
The case study considers the installation of PV on building rooftops. As a rule of thumb, the installation of 1 kWp of PV requires an available area of about 15 m
2 on flat roof buildings (to avoid self-shading between panels) and 10 m
2 on gable roofs [
53]. Using the free rooftop area derived in the previous step (
Section 2.1.5), the maximum power of PV systems to be mounted on each rooftop was limited to 10 kWp, without any battery storage, which is common for residential buildings and used in most national PV support programs for urban installations. The type of PV modules considered in this study are crystalline silicon cells, which are the most common in commercial applications. Finally, the PV annual electricity production is estimated based on the roof type (e.g., flat or tilted roof) and the location, using an online tool.
The annual electricity production from the installation of 1 kWp in the studied region was estimated to be 1592 kWh for flat roofs with optimum orientation. In the case of tilted roofs, the PV panels are placed on the roof structure with an arbitrary orientation that may deviate from one that is optimal for the performance of PV. The identification process of the tilted roof orientation considered two categories. If the orientation of the gable roof is between 75 and 125 grad, then the building is considered to be “one-side”. In this case, the PVs are south-facing, with an optimum performance generating 1460 kWh per year, which was calculated by averaging the electricity produced for the orientation angles of 75, 100, and 125 grad [
49]. However, in this case, only “one side” of a gable roof is considered exposed to sufficient direct solar radiation, and therefore only half of the pitched roof may be used for the installation of the PV panels. The other side of the titled roof would face north, meaning it is not exposed to sufficient diffuse solar radiation to justify the installation of PV panels. The second category refers to a gable roof with such an orientation that “both sides” are exposed to sufficient solar radiation and can be utilized for the installation of PV panels. This time, the annual electricity production was calculated by averaging the values for a set of three orientations, namely, for an azimuth of 0, 50, 75 grad and then for 125, 175 and 200 grad orientation angles, generating a total of 1348 kWh per year [
49].
The assumption is that the electricity produced from the PVs is equally distributed and used for all individual end-uses of a household. Accordingly, only 17.3% of the annually produced PV electricity is allocated to the end-uses accounted for using the Hellenic calculation method for the EPC (i.e., DHW, space heating and cooling) and the energy labeling of buildings. This is an attempt to make more realistic estimates of the anticipated energy gains and how they may be reflected in the improved energy class of the renovated buildings. This way, it is possible to calculate the new energy class of the buildings following the installation of the PV on the available rooftop areas.
Finally, for the calculation of soil permeability, in this work, the surface areas of interest include the green-covered and soil-covered areas. The main assumption is that all brown-colored surfaces correspond to soil. However, this may not always be true, since there may be different kinds of constructions that may be also identified with a brown color, or are covered with tiles (for example, garages). Finally, the results of this process are stored in the final output file for the city block.
3.2. Issues and Challenges
The main challenge in the development of this method was the definition of the color palette to be used for the identification of the different types of surfaces, such as the rooftop construction and open areas. Each color (brown, light gray, dark gray, green) had to be carefully classified for identification. The color palette had to be manually cross-checked multiple times to identify the best-fitted combinations of R-G-B values in order to accurately process the color read in each pixel. This iterative process at the end provided a well-defined color palette that can identify the type of surfaces with sufficient accuracy.
Another demanding process was the optimization method. The differences between each building (e.g., type of roof, number of floors, orientation) made the computation of the code challenging. For this purpose, the results for each building were checked against the real structures to identify possible miscalculations and errors as a result of the various calculation steps. Following iterative processes to learn from possible real life variations in the built environment, it was possible to improve the identification rules, and using the various calculation steps, we gained confidence in the accuracy of this method and its ability to provide an accurate outcome.
4. Results
In Greece, households used about 4.24 Mtoe, and services used about 2.05 Mtoe, which represent 28.4% and 13.7% of the total final energy, respectively [
5]. The annual EUI of Hellenic residential buildings over the past decade (from 2010 to 2019) averages about 143.8 kWh/m
2 [
46]. The environmental impacts of Hellenic buildings is also significant, accounting for 35% of the total carbon emissions in 2021 [
6]. In particular, residential buildings contribute 13.61 MtCO
2, or 19.5% of the total direct and indirect emissions, and non-residential buildings 10.17 MtCO
2, or 14.6% of the total.
4.1. Energy and Emission-Related Outputs
The original buildings’ polygons (*3) shapefiles (
Table 1) initially captured the specific building identification (bld_id) for each structure and the category code number based the building’s construction period (e.g., category 2 for the second construction period of 1981–2010. Currently, it is not possible to automate this process in Greece, since this information is not readily available from an open database (e.g., the national EPC database, the national electronic identification (eID) scheme). Eventually, these data will be readily available, once the electronic city planning geographic information system is enhanced and enriched with more data from eID. In this case, study, the category data for each building in the neighborhood were manually added to the *3 shapefile. This is important information for the evaluation of the optimization methodology; it is used check the accuracy of the developed data, determine the building type, derive the building envelope characteristics, and assess the building’s energy performance. Following the execution of the code (
Supplementary Material), the results are collected and stored in the output file, i.e., Municipality_Building_Stats (*5) file (
Table 1). The collected information is presented in 25 columns (
Figure 5).
The following sections present an overview of selected results from the implementation of the developed method in the city block used in the case study.
4.2. Energy Consumption and Emissions
The city block used in this case study includes a total of 15 residential buildings (
Figure 3).
Table 2 summarizes the main findings from the implementation of the proposed method to analyze and extract relevant information for the buildings’ architectural characteristics using the available open data and non-commercial tools provided by GIS. Most of the buildings are multi-family houses (MFH) from the second age band (i.e., the construction period of 1981–2010) with flat roofs. There are also four single-family houses (SFH). Building number 12 was under construction at the time of the study, and therefore it is not included in
Table 2 and is excluded from further analysis.
Table 2.
Building characteristics in the studied city block.
Table 2.
Building characteristics in the studied city block.
| Building No | Size (Building Type) | Age Band | Number of Floors | Footprint
(m2) | Available Rooftop Area (m2) | Roof Type |
|---|
| 1 | SFH | 2 | 1 | 174 | 140 | Flat |
| 2 | MFH | 1 | 4 | 311 | 221 | Flat |
| 3 | MFH | 2 | 3 | 64 | 32 | Flat |
| 4 | MFH | 2 | 4 | 245 | 203 | Flat |
| 5 | MFH | 2 | 3 | 100 | 86 | Flat |
| 6 | MFH | 1 | 3 | 114 | 72 | Flat |
| 7 | SFH | 1 | 1 | 152 | 139 | Pitched |
| 8 | MFH | 1 | 3 | 141 | 92 | Pitched |
| 9 | SFH | 1 | 1 | 172 | 132 | Flat |
| 10 | MFH | 2 | 4 | 138 | 127 | Flat |
| 11 | MFH | 3 | 5 | 143 | 91 | Flat |
| 13 | MFH | 2 | 4 | 167 | 150 | Pitched |
| 14 | MFH | 2 | 4 | 118 | 102 | Flat |
| 15 | MFH | 2 | 3 | 179 | 133 | Flat |
In this case, study, the available rooftop areas were used for the installation of photovoltaics to generate electricity. As a result, both the electricity use and the operational CO
2 emissions of the buildings were significantly reduced (
Figure 6). Electricity savings ranged from 10% to 75%, while the total energy consumption savings ranged from 7% to 56% among the various buildings in the city block under investigation. The abatement of total operational CO
2 emissions ranged from 8% to 58% for the individual buildings. For the entire city block, the total electrical energy consumption was reduced by 21%, while the operational CO
2 emissions were reduced by 17%.
4.3. Visualization of Energy Classes
The installation of PV on a building rooftop will reduce the operational energy use and improve the building’s energy performance. Applying this renovation measure on the available rooftops of all the buildings in the city block may improve the energy profile of the neighborhood. The calculated energy class for each building before and after the PV installation on the available rooftop areas is illustrated in
Figure 7.
The initial condition of the studied city block clearly represents a hotspot. The existing buildings have a poor energy performance that is reflected by the prevailing dark red rooftop colors, which correspond to energy classes that range from “G” up to “D”. The energy class of every building is improved by at least one level by installing the PVs. This type of visualization can facilitate decision-making processes and efforts to identify priority buildings and areas within a city, and can help to monitor progress and communicate results following building renovations.
4.4. Soil Permeability
After implementing the derived method and available code (
Supplementary Material), the results related to the assessment of the soil permeability are presented in (
Figure 8) and include the variables outlined in the 7 columns of the output file.
The undeveloped areas with soil and green cover within the city block under investigation are representative of developed suburban metropolitan Athens. The calculated sustainability indicator is presented in the Sustain_ft column in
Figure 8. The value of the soil permeability indicator is 22.2%, which is considered valid based on the green and soil areas illustrated in
Figure 3.
4.5. Limitations
The developed automated procedure exploits GIS to audit large urban areas in order to facilitate the process of collecting data regarding the built environment, for example, building geometry, architectural characteristics, and open spaces. As a case study, the method was applied to make a more realistic assessment of the benefits resulting from the installation of PV on the available building rooftops, whilst accounting for soil permeability.
A practical limitation of the developed method and the code is that there is no automated input for some information. For example, the construction period and the function of the specific buildings is missing, as this type of information was not included in the open databases that were available during the undertaking of this work. This was not a major obstacle in the specific case study, since it was conducted in an area with buildings that were constructed during a similar period, and in a predominantly residential area. However, when considering large urban areas or even an entire city, it will be necessary either to have access to the specific building end-uses, or to utilize statistical and census data to categorize the number of buildings using the different typologies in terms of construction period and residential or non-residential use. For example, a similar study [
54], used OpenStreetMap to extract relevant city district data, which were then complemented with statistical data from the national building stock and coupled with the energy performance of archetypal buildings.
In light of this, the need to recover this type of information may be facilitated by exploiting a building’s energy performance certificates, if available, or by using the insight and relevant data from the national building census data of the national statistical authority. In all cases, there may be conflict regarding the availability and accessibility of these data at individual building scale due to the General Data Protection Regulation (GDPR) and confidentiality of personal data. Accordingly, the challenge will be to collect and match scattered information from the same database under a unique system of building identification.
Furthermore, the current analysis is limited when assessing the area of a given rooftop that is available for the installation of solar systems, in that it does not account for possible roof shading as a result of neighboring buildings, trees, panel-to-panel, or other obstructions [
55]. Similar issues may also occur with shading or other obstructions on ground surfaces. Apparently, these limitations can introduce some errors. With this in mind, images extracted from Google Earth were chosen in order to minimize the shade on the ground surface. In addition, excluding roads and sidewalks from the area’s ground cover can eliminate some of the problematic shaded areas resulting from traffic and parked cars.
The assumption that tilted roofs are limited to a single geometry that corresponds to a gable roof should also be amended to consider other possible variations. The pitched roof orientation and even tilt angle will influence the electricity generation from the installed PV panels, or the heat production from solar thermal systems. Depending on the geographic region, and on local urban planning and building regulations, the tilt angle of pitched roofs can be properly selected to reflect the prevailing conditions (e.g., from 20 degrees in southern areas up to 40 degrees in areas with significant snowfall).
Overall, the results from the implementation of the procedure were mostly valid and accurate. However, there were some sporadic miscalculations that occurred with regard to the number of floors and the identification processes of the available rooftop areas. The procedure can be further improved by using input from a more analytical DTM and DSM. This means that these models are free of external objects such as trees or other irrelevant elements on the roof of the buildings. These issues are elaborated upon in the following section.
5. Discussion
Traditional urban design methods focus on the form-making process, and lack performance dimensions such as energy efficiency. Consequently, there is a need to couple urban design with energy system models [
56,
57]. Particularly in Greece, the available data about the existing building stock and the characteristics of the built environment are very limited. As a result, automated processes such as the one initiated in this work, which can facilitate the process of collecting relevant data in order to assess and optimize buildings’ energy performance and assess the sustainability of the built environment, are of great importance for the decision-making process.
This work proposed a method, presented a code and demonstrated how this type of application can be used to expedite data collection and calculations for relevant applications. The overall accuracy of the approach is promising. However, there were some small deviations from the actual conditions in the calculation of the number of floors and the outline of the building polygons, with some pixels crossing the building line. Furthermore, during the method and code development, it was possible to check and validate the various calculation steps, and in some cases, even to calibrate some rules and definitions (for example, the surface colors). This was an iterative process carried out by progressively checking the results against visual inspection of the actual building’s rooftop and site characteristics.
The results from the case study performed in this work quantified and illustrated that the installation of PV panels would actually improve the buildings energy performance for every examined building case. The soil permeability indicator calculated for the city block identified the percentage of the total area that is not yet covered with any kind of impermeable material. The results were quite accurate when compared with the actual open areas from a high-resolution image of the city block.
This work demonstrated that the automated method can facilitate the process of auditing large urban areas to collect relevant information about the built environment, open spaces and geometry, and the architectural characteristics of buildings. Nevertheless, the research objects are buildings, and there can be many differences from one building to the next. For example, the type of roof, the type of construction, and the different elements placed on each roof (e.g., super structures, chimneys, natural ventilation shafts, existing solar collectors) are some of the most common differences that are easily observed among buildings. In addition, buildings tend to change due to aging; thus, their facades and roofs may deteriorate. This means that materials such as roof tiles may lose their original surface color, which will cause many variations between the actual situation of a building’s roof and the developed data. This is an important consideration, since the surface color was the main parameter used during the automated process to identify and relate specific surface colors from a predefined color pallet and link them to specific materials. Finally, the accuracy of the results is greatly dependent on the quality of the input data, as well as on the assumptions and parameters used to process them and develop the results.
5.1. Building Characteristics and Ground Cover
In this work, the input data were derived from open data sources that may not have the highest accuracy. For example, in many cases, the buildings’ polygons had to be manually digitized or georeferenced in order to match with the roofs depicted in the real images. The accuracy of defining the building’s polygons can be improved using a different approach. Higher quality polygons can be defined by combining object-based image analysis (OBIA) with machine learning for detecting residential houses from Google Earth images [
58]; in this way, potential errors can be minimized.
The results from the code itself are also influenced by the accuracy of the derived data. The parameters set for the color identification process were based on comparing the results with the actual situation shown in the real image. As already mentioned, the lowest accuracy for tilted roof buildings was 83%, and was 74% for flat roof buildings.
The heights derived from DTM and DSM models may also alter the results’ accuracy, as these models play a significant role in the calculation of the building’s height and number of floors, and eventually on the building’s energy performance assessment. A DSM model contains height data from every object (surface data) in the studied area. Thus, adjacent trees and objects on the roofs such as chimneys, antennas, solar collectors or other super structures are responsible for the potential differences between the actual and calculated number of floors of the buildings. In addition, the DTM models may not provide accurate information about the terrain, as sometimes, a building may have a semi-basement floor that is constructed below ground level (or constructed above ground level when the building has pilotis). Nevertheless, the number of floors were accurately estimated for the majority of the buildings in the case study (57%), and for the rest with accuracy of ±1 floors, which is considered acceptable for a large-scale analysis [
52]. The building height and the number of floors can also be determined using other methods, including light detection and ranging data with high resolution [
59].
The identification of the types of roof related to surface color identification (e.g., brown for a titled roof, light grey for a flat roof) experienced some issues. Compared against the actual roof types and surface coverage, the deviations can be attributed to color fading and the analysis of the available images. For example, variations in the brown-colored surfaces related to the Roman roof tiles that cover tilted roofs, and to the whitish color of the concrete tile surfaces on the flat roof cases.
To overcome issues related to color identification and shading, image segmentation, classification, multi-source verification, and object identification [
23,
58] can be used to further and better analyze images. Considering that the images constitute the most important element of the process, a more thorough analysis would be desirable in order to improve the results. These methods can be used to identify objects on roofs (e.g., PV panels, chimneys, etc.) and ground surfaces, to remove shadows, and to detect buildings, thereby providing more accurate results. The integration of artificial neural networks has benefited a variety of applications [
60] and may also facilitate the work required to recognize the relationship between the various inputs/outputs and with GIS [
61].
5.2. Building Energy Performance
The notable contribution of the automated process was its capacity to calculate the available surface on a flat or titled roof along with its orientation in order to more realistically assess the potential savings that result from the installation of PV on the roofs of the buildings. In this work, the PV electricity output was calculated with an external standalone application, and the results were used as the input in the remaining calculations. The energy consumption of the buildings was based on average benchmarks that relate to the identified building typologies. The energy performance of each building was individually assessed, and then the energy label for each building was estimated before and after the installation of the PVs. This step of the procedure can be improved by performing more accurate calculations, or even simulations, by coupling the generated data with external building performance tools. Similar calculations were also performed for quantifying CO2 emissions from the electricity consumption before and after the installation of the PV panels.
The results documented that all buildings were positively affected by the PV installation and became more energy efficient. Specifically, the energy class of every building was improved by at least one level (
Figure 7). In addition, there were equivalent savings for CO
2 emissions. These data are significant because they can help to identify hotspots of poorly performing buildings, and guide decision-makers in identifying priorities and planning interventions for the exploitation of renewables and other energy-related renovations in their municipality.
The results of this work and the outputs from the code can be used to assist decision-makers in setting up more effective building renovation plans and effective sustainability plans. Building energy consumption has increased dramatically in the past decade due to factors such as population growth, more time spent indoors, increased demand for indoor environmental quality, and global climate change [
62].
Beyond the building’s rooftop areas for the installation of photovoltaics, the whole community could benefit from the installation of more PVs through using open lots in the city block and nearby open areas that may be available for public use, forming energy communities [
63,
64]. By promoting social and solidarity-based economies and innovations in the energy sector, energy communities can contribute to the reduction of energy poverty, promote the production, storage, self-consumption, supply and distribution of energy, and improve local acceptance of renewable energy sources and energy efficiency for end-uses at a local and regional level [
65].
5.3. Soil Permeability
The findings from the case study revealed that 22% of the total city block’s area is covered with vegetation. However, the calculation of the soil permeability indicator was based on the assumption that the city block incorporates surfaces for building structures, concrete areas, soil and green areas. Thus, the existence of non-building structures (e.g., garages or ramps) was not considered, but may influence the accuracy of the results. In any event, the applicability of this sustainability indicator is strengthened by this automated process, which can ease the data collection process and facilitate its monitoring. This insight can then be used to guide decision-makers in making successful plans and strategies in pursuit of a “green” future.
5.4. Future Directions
The work developed an automated procedure than can extract and process data about buildings from open data sources to assess energy performance and to reduce energy use and emissions. Future work will focus on how to enhance specific facets of the overall procedure, improve the accuracy of the results, consider different building renovation measures with integrated calculation tools, and extract more data that can be used to quantify other building and urban sustainability indicators.
Future work can be facilitated by open access to statistical data and other databases from utilities and local authorities [
66]. This may be, for example, through coupling GIS data with spatial distribution of buildings’ energy consumption, including electricity, natural gas, and even delivered bulk fuels. In addition, the rooftop analysis developed to determine the available area for the installation of PV can be enhanced to account for the impact of shade from surrounding buildings and other obstacles in order to more accurately size solar systems and calculate their output.
Moreover, the identification of each building based on its end-use (e.g., residential, school, hospital) using the energy performance optimization method could provide more accurate results. The introduction of different types of buildings could also provide an improved overview of the total energy consumption of a city block or a community, alongside showing decision-makers where to focus their sustainability plans. In addition, the calculation of more sustainability indicators for the assessment of city blocks can also lead to more thorough community planning.
One can also consider the development of more enhanced visuals that can be integrated in flexible decision-making tools. These tools can be used for illustrating the energy consumption of individual buildings and performing more detailed statistical analyses of the average energy class of a city block in order to identify hotspots and prioritize different renovation measures that reduce energy use and emissions.
Finally, the proposed method and code could be used to progressively create databases about buildings as well as communities in cities that do not have readily available data. Relevant data can be collected in a common database to provide local authorities with practical information in order to monitor the current energy and environmental performance and progress after the implementation of renovation plans or other strategies. This type of automated procedure can close the gap between the limited available data and other resources, and successfully tackle the challenges of the EU renovation wave in pursuit of the 2050 decarbonization target.


