Article

Advanced ECMS for Hybrid Electric Heavy-Duty Trucks with Predictive Battery Discharge and Adaptive Operating Strategy under Real Driving Conditions

1
Institute for Alternative Propulsion Systems, FH Aachen University of Applied Sciences, Hohenstaufenallee 10, 52066 Aachen, Germany
2
Chair of Thermodynamics of Mobile Energy Conversion Systems, RWTH Aachen University, Forckenbeckstrasse 4, 52074 Aachen, Germany
*
Author to whom correspondence should be addressed.
Energies 2023, 16(13), 5171; https://doi.org/10.3390/en16135171
Submission received: 28 May 2023 / Revised: 20 June 2023 / Accepted: 28 June 2023 / Published: 5 July 2023

Abstract

:
To fulfil the CO2 emission reduction targets of the European Union (EU), heavy-duty (HD) trucks need to operate 15% more efficiently by 2025 and 30% by 2030. Their electrification is necessary as conventional HD trucks are already optimized for the long-haul application. The resulting hybrid electric vehicle (HEV) truck gains most of the fuel saving potential by the recuperation of potential energy and its consecutive utilization. The key to utilizing the full potential of HEV-HD trucks is to maximize the amount of recuperated energy and ensure its intelligent usage while keeping the operating point of the internal combustion engine as efficient as possible. To achieve this goal, an intelligent energy management strategy (EMS) based on ECMS is developed for a parallel HEV-HD truck which uses predictive discharge of the battery and adaptive operating strategy regarding the height profile and the vehicle mass. The presented EMS can reproduce the global optimal operating strategy over long phases and lead to a fuel saving potential of up to 2% compared with a heuristic strategy. Furthermore, the fuel saving potential is correlated with the investigated boundary conditions to deepen the understanding of the impact of intelligent EMS for HEV-HD trucks.

1. Introduction

Modern HD trucks build the backbone of our globalized economy and therefore play a crucial role in the mitigation of climate change. They were purposely designed for the long-haul application and have been undergoing a decade-long maximization of their powertrain efficiency. However, they are now facing a major overhaul enforced by strict emission reduction targets by the EU [1]. The CO2 emissions need to be cut by 15% by 2025 and by 30% by 2030 and will be calculated transparently for every truck manufacturer by the simulation tool VECTO [2]. The electrification of the powertrain is inevitable and its holistic integration into the vehicle is essential to gain the maximal amount of fuel saving. In contrast to passenger cars, the powertrains of HD trucks were designed and optimized for large diesel engines. Furthermore, HD trucks experience a broad spectrum of boundary conditions regarding road slope and vehicle payload in real world applications. The knowledge and expertise that enabled the high fuel saving potential of HEV passenger cars in city driving conditions cannot be directly transferred to HD trucks. Therefore, the question that arises is how to utilize the full potential of the electrification of HD trucks and to optimize their overall efficiency further.
To face these challenges, an EMS is required. As the HEV features two different power converters, the vehicle can be operated in several operating modes that differ from that of a conventional vehicle. In the assist mode, the electric machine can support the internal combustion engine to shift its operation point and therefore its efficiency. In addition, the ICE can apply excess power to the electric machine, which is then driven as a generator to charge the battery. In downhill driving situations, potential and kinetic energy can be recuperated back into the battery. Depending on the power of the electric machine and battery, some HEVs can be operated purely electrically. One key parameter is the state of charge (SOC) of the battery. The EMS is the supervisory algorithm that coordinates the two power converters in every driving situation and therefore defines the operating mode of the HEV. The consecutive choices of the operating mode (e.g., assist mode) determine the operating strategy. The basic operating strategies are charge-depleting (CD) and charge-sustaining (CS).
In the literature, several EMSs are documented that differ in their basic approaches and details. A common approach is to distinguish between optimization-based and heuristic EMSs [3]. Within the optimization-based approaches, a distinction can be made between global-optimal and local-optimal functionality. Global-optimal EMSs require a priori knowledge of the complete driving cycle. Often, the mathematical optimization of Dynamic Programming (DP) by [4] is applied to formulate and solve the optimal control problem of HEVs [5,6]. Another approach is based on the Pontryagin Maximum Principle (PMP), where the Lagrange multiplier transfers the electrical energy of the battery into an equivalent amount of fuel [7]. EMSs based on local-optimization methods do not consider the whole driving cycle a priori but only the conditions of the powertrain in the current driving situation. One approach is the Equivalent fuel Consumption Minimization Strategy (ECMS), which can be derived from PMP. Similar to the Lagrange multiplier, an equivalence factor is used to consider and optimize the overall efficiency of the powertrain [8]. The tuning of this equivalence factor is the scope of several research papers [9,10]. The state-of-the-art EMS implemented in HEVs for real-time application is the heuristic approach based on rules (RB). These rules determine the switch between the different operating modes based on the conditions of the powertrain. They can be defined in characteristic diagrams or tables, or as a state machine [11]. The parameterization of the rules can be done by observations of the optimal system behavior [3,12,13]. For a detailed overview of EMSs and their implementation, see [14,15,16,17,18]. To obtain high quality in an EMS, the specific boundary conditions of the target vehicle should be considered during its development process.
For commercial vehicles, the application of EMSs is also documented for a broad range of boundary conditions in the literature. The EMS of a hybrid cement mixer was designed and parameterized differently from that of a hybrid mining truck [19,20]. For a serial-hybrid city bus, the predictable schedule and recurring bus lines were used for an adaptive ECMS approach based on specifically generated maps for the equivalence factor [21]. For an HEV medium-duty (MD) truck, the design and implementation of an EMS based on ECMS is presented in [22]. The equivalence factor for the EMCS was derived from the global optimal solution and stored in maps for different road elevations and vehicle masses. A fuel saving potential of up to 3% compared with a rule-based approach was observed for a low vehicle mass in a standard testing cycle (FTP75). In [23], an adaptive ECMS based on driving pattern recognition was applied to an HEV-HD truck. A combination of standard driving cycles without height profiles was used. The SOC trajectories indicated that the useable depth of discharge (DOD) of the battery was not utilized. This system behavior was also observed in [24]. However, under real driving conditions, the battery will experience the total DOD several times per driving cycle due to the height profile [25]. In [26], a predictive EMS based on a global optimal approach was tested under real driving conditions. The aim was to avoid thermal derating of the battery and electric machine during downhill driving situations to maximize the recuperated energy. A fuel saving potential of up to 2% was obtained compared with a heuristic approach. In [25], it was shown that approaches based on ECMS lack the ability to optimize the efficiency of the ICE and maximize the recuperated energy at the same time for HD application. In addition to that, it was observed that an adaptive EMS, as formulated in [27], is required due to distinct changes of the height profile. Therefore, the main question is how to utilize the full potential of HEV-HD trucks by an intelligent and online-capable EMS for various boundary conditions such as changing vehicle mass and different height profiles.
To address this research question, the design of an intelligent EMS and its impact on fuel saving potential for a HEV-HD truck is proposed in this paper. The presented EMS is based on ECMS and is extended by a predictive discharge of the battery and adaptive operating strategy depending on the height profile and the vehicle mass. The predictive functionality is based on a moving average window (MAW) of the road gradient to ensure a depleted battery before long downhill driving phases. The adaption between a CS and CD operating strategy is based on driving cycle recognition. Both functionalities are tuned based on a set of real road measurement cycles which are representative regarding the height profile of the German Autobahn network. In addition, a variation in the vehicle mass is included in the development to cover a broad range of boundary conditions for HD long-haul applications. The fuel saving potential is obtained by numerical simulation and compared to a rule-based EMS and the global optimal solution from DP.
The paper is organized as follows: In Section 2, the vehicle model for the simulation is described, including the characteristics of the components. In Section 3, the three basic EMSs and their application to HEV-HD trucks is presented. For the ECMS, a basic equivalence factor (EF) is determined. Based on this, the function development of the prediction and adaption is described in Section 4 and Section 5, respectively. Section 6 contains the simulation results and a strategy comparison. Furthermore, the results are discussed and recommendations for further research are proposed. Section 7 concludes the paper with a summary.

2. Vehicle Model

In this section, the used powertrain configuration and its component characteristics are described.
The powertrain topology of the used parallel HEV-HD truck is shown in Figure 1. The electric machine is positioned between the transmission and the clutch. The combustion engine features 330 kW and 2200 Nm. The electric machine supplies another 110 kW peak power and 70 kW continuous. The lithium-ion battery can store 7.115 kWh of energy, while 40% of this energy is used. The power is transmitted to the final drive via a 12-gear automated manual transmission.

2.1. Longitudinal Dynamics

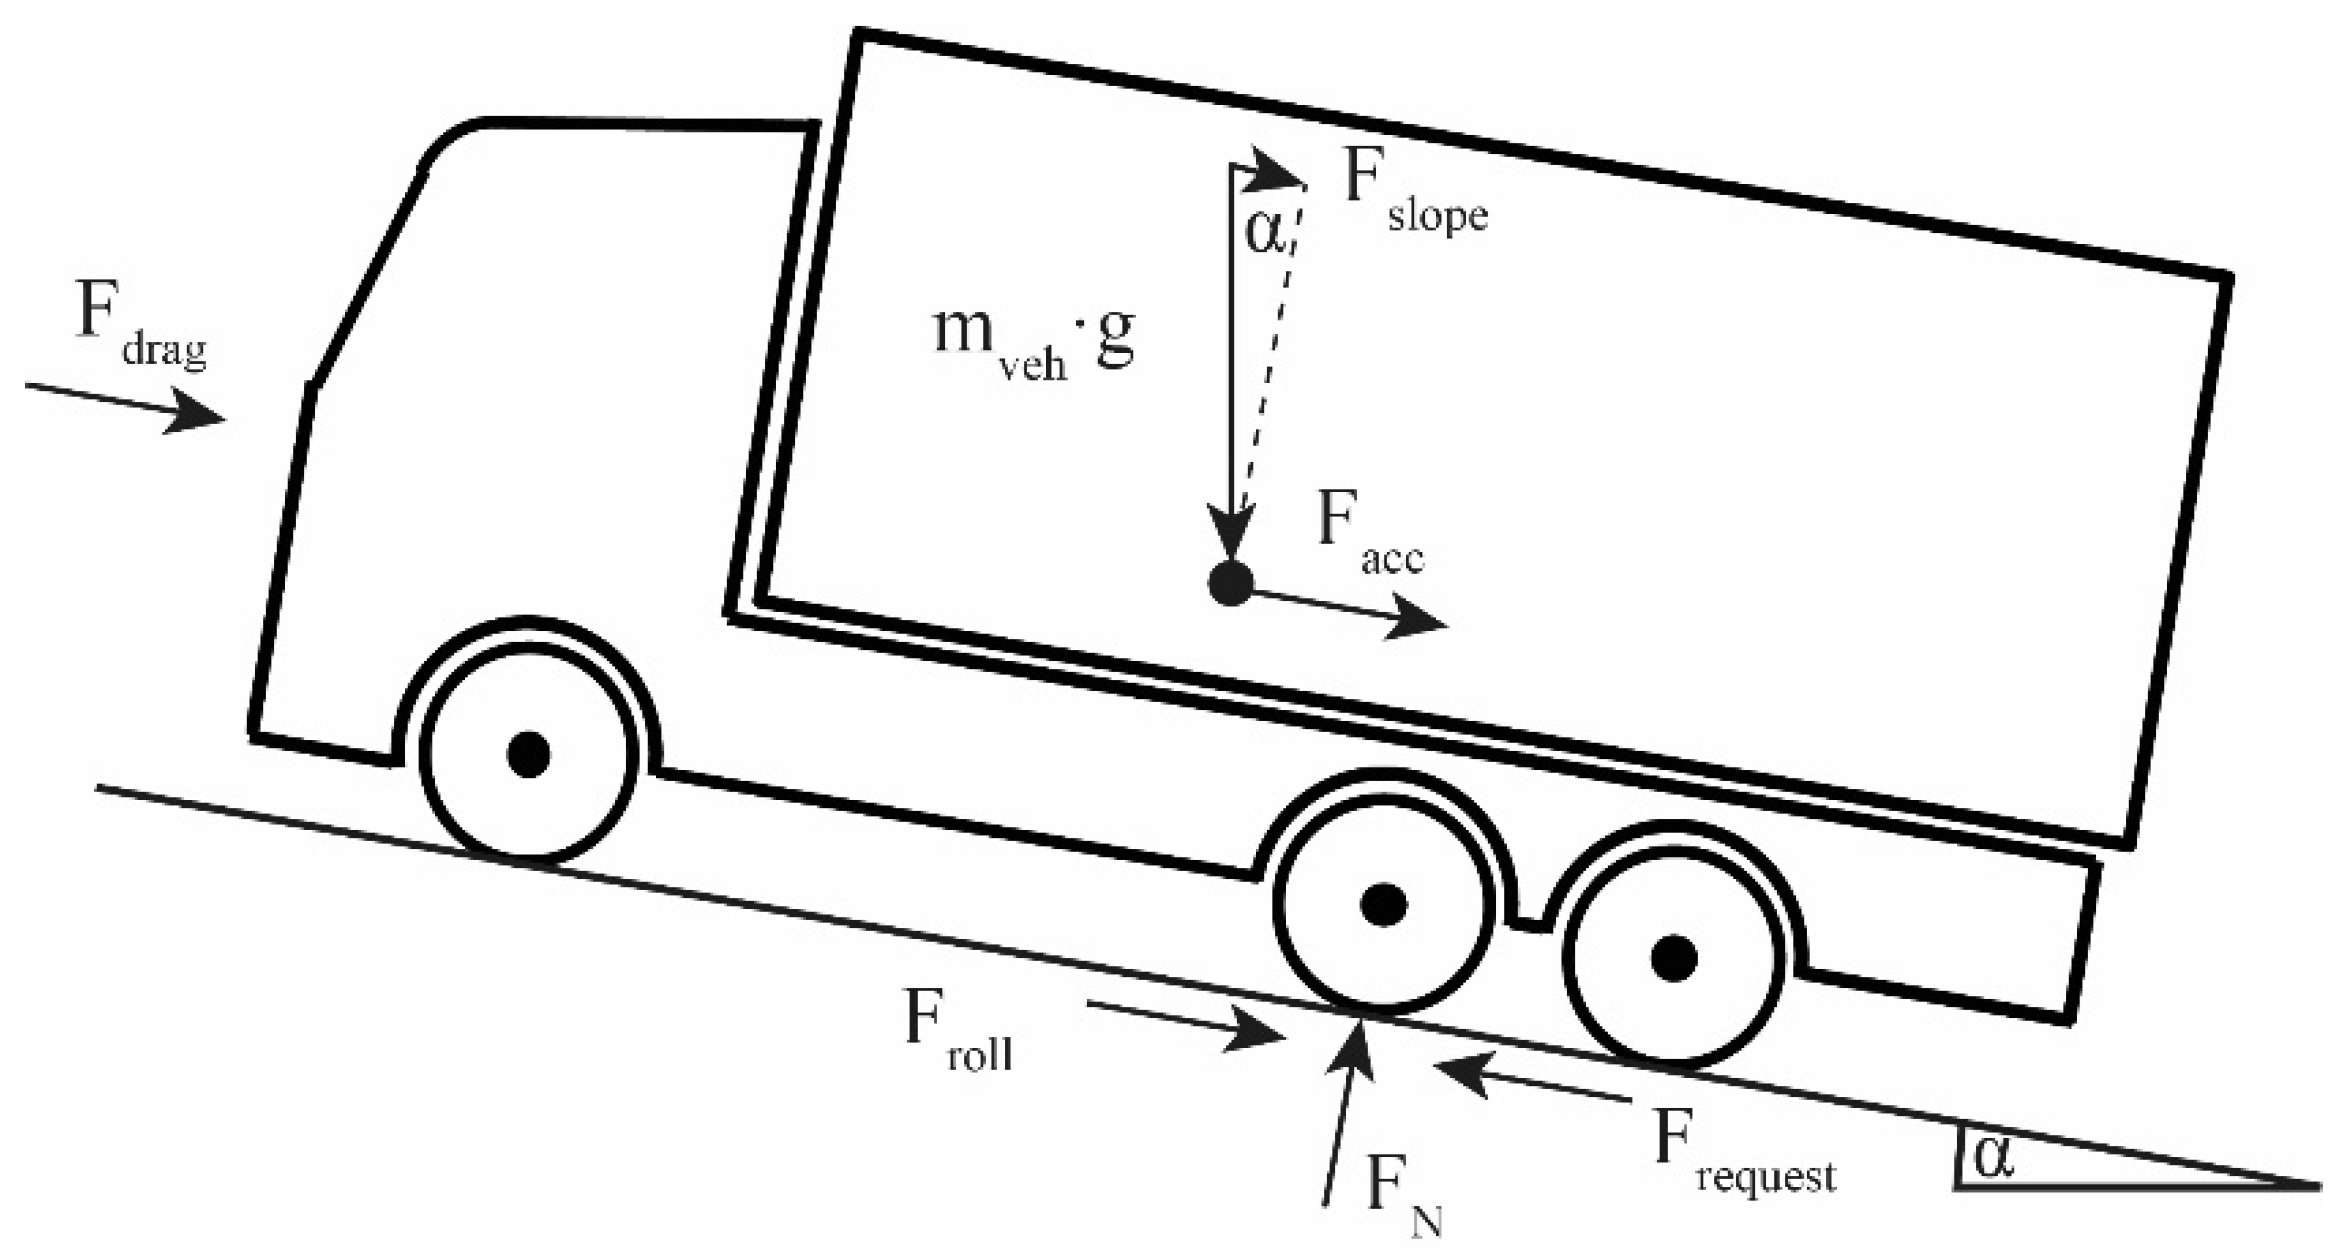
The longitudinal dynamics of the vehicle are illustrated in Figure 2. The powertrain of the vehicle must overcome the resistance forces F r o l l resulting from rolling friction, F d r a g of the aerodynamic drag and F s l o p e acting on the vehicle from the road slope α. In addition, F a c c acts in situations where the vehicle is accelerated by the powertrain. The vehicle mass m v e h affects all resistance forces other than the aerodynamic drag. The sum of these resistance forces multiplied with the dynamic tyre radius r d y n determines the required torque T r q r e q at the wheel in the current driving situation (1)–(5).
F d r a g = 1 2 · ρ a i r · c W · A · v 2
F r o l l = m v e h · g · cos α · c r
F s l o p e = m v e h · sin α
F a c c = m v e h · a
T r q r e q = F d r a g · F r o l l · F s l o p e · F a c c · r d y n
The efficiency of the gearbox η G B and differential gear are assumed as constant for each gear. Based on the efficiency and the overall transmission ratio i t o t a l , the torque at the gearbox T r q G B is calculated:
T r q G B = T r q r e q i t o t a l · 1 η G B   ,                           T r q r e q > 0 T r q r e q i t o t a l ·   η G B   ,                           T r q r e q     0  

2.2. Drive Units

The engine is modelled based on a steady state engine map as shown in Figure 3. The efficiency of the engine is then taken from the engine map based on the torque of the engine T q I C E and the engine speed n I C E (7). The resulting fuel mass flow m ˙ f u e l is attained by the lower heating value H U of the diesel fuel and the angular velocity of the ICE ω G B (8).
η I C E = f ( T r q I C E , n I C E )
m ˙ f u e l = T r q I C E · ω I C E η I C E · H U
Analogous to the combustion engine, the competent model of the electric machine (EM) is also based on an efficiency map, as shown in Figure 4. Next to the efficiency losses of the electric machine itself, the losses of the inverter are included. The efficiency map is again a function of the torque T r q E M and the speed of the electric machine n E M . The conversion from mechanical power to electric power is dependent on the direction of the energy flow as stated by (10). Here, the angular velocity of the EM ω E M and the torque T r q E M   are used for the calculation of the power.
η E M = f ( T r q E M , n E M )
P E M ,   e l . = T r q E M · ω E M · η E M   ,                           T r q E M < 0 T r q E M · ω E M ·   1 η E M   ,                           T r q E M     0  

2.3. Battery

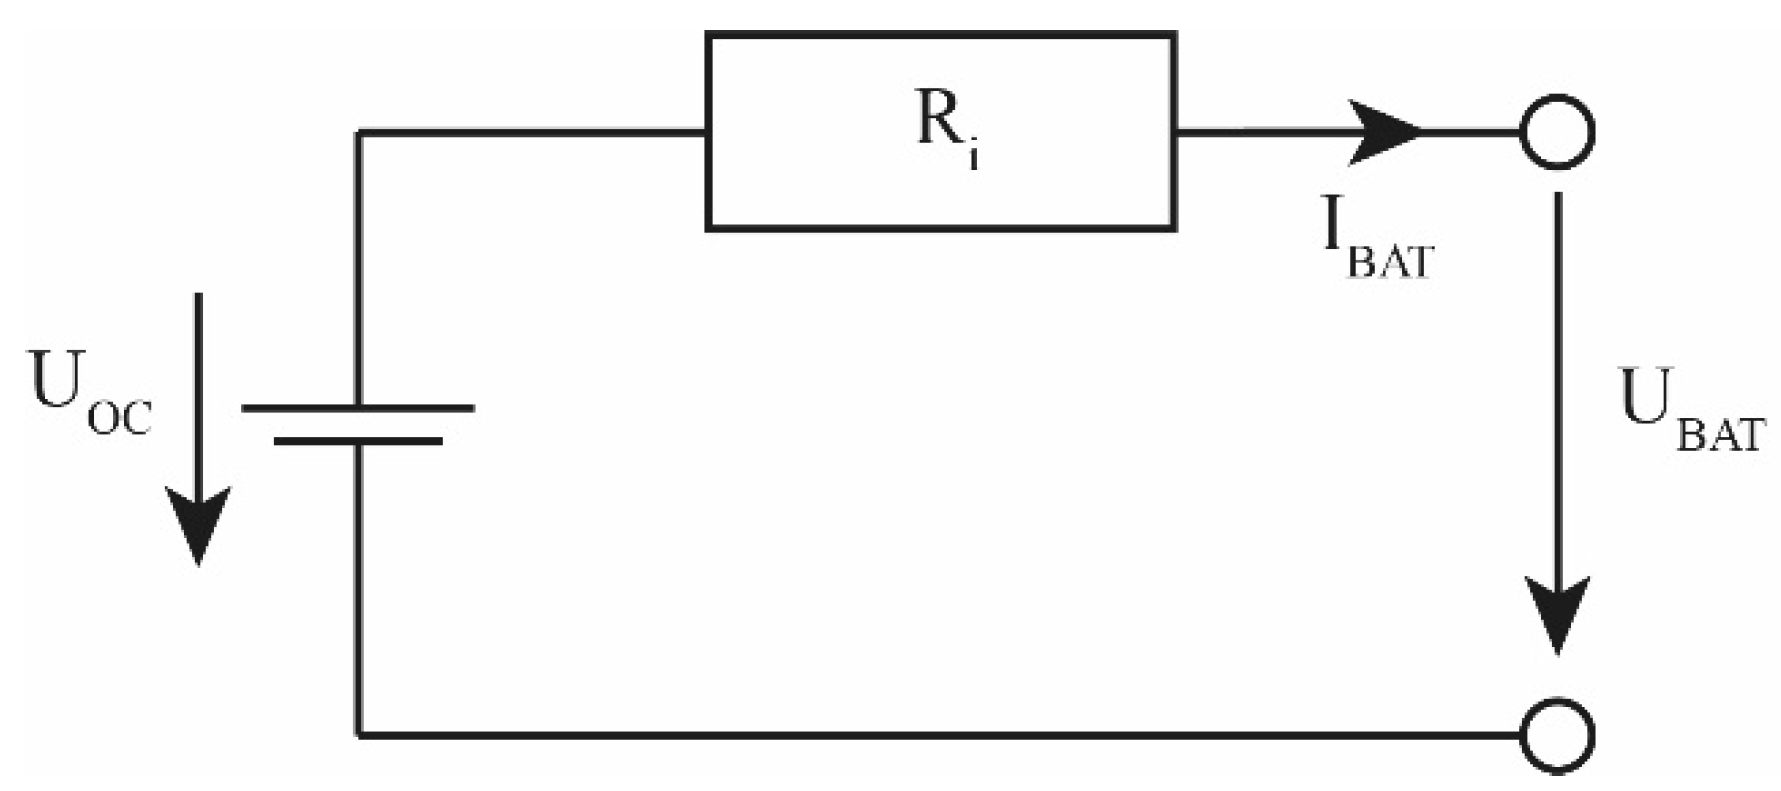
The battery is modelled based on a zero-dimensional equivalent circuit, as shown in Figure 5. The terminal voltage U B A T can be determined by formulating Kirchhoff’s second law (11). In addition to the open circuit voltage U O C , the internal resistance R i and the current of the battery I B A T are considered. The electric power of the battery P B A T is calculated according to (12). From (11) and (12), the battery current is determined according to (13).
U B A T = U O C I B A T ·   R i
P B A T = U B A T ·   I B A T
I B A T = U B A T U O C 2 4 · R i · P B A T   2 · R i
The SOC is calculated by summing up the battery current (14). Starting from an initial state of charge S O C ( t s ) , the current flow over the period t s to t e is integrated and set in relation to the nominal battery capacity Q B A T , 0 .
S O C   ( t ) = S O C ( t s ) 1 Q B A T , 0   · t e t s I B A T ( t )   d t
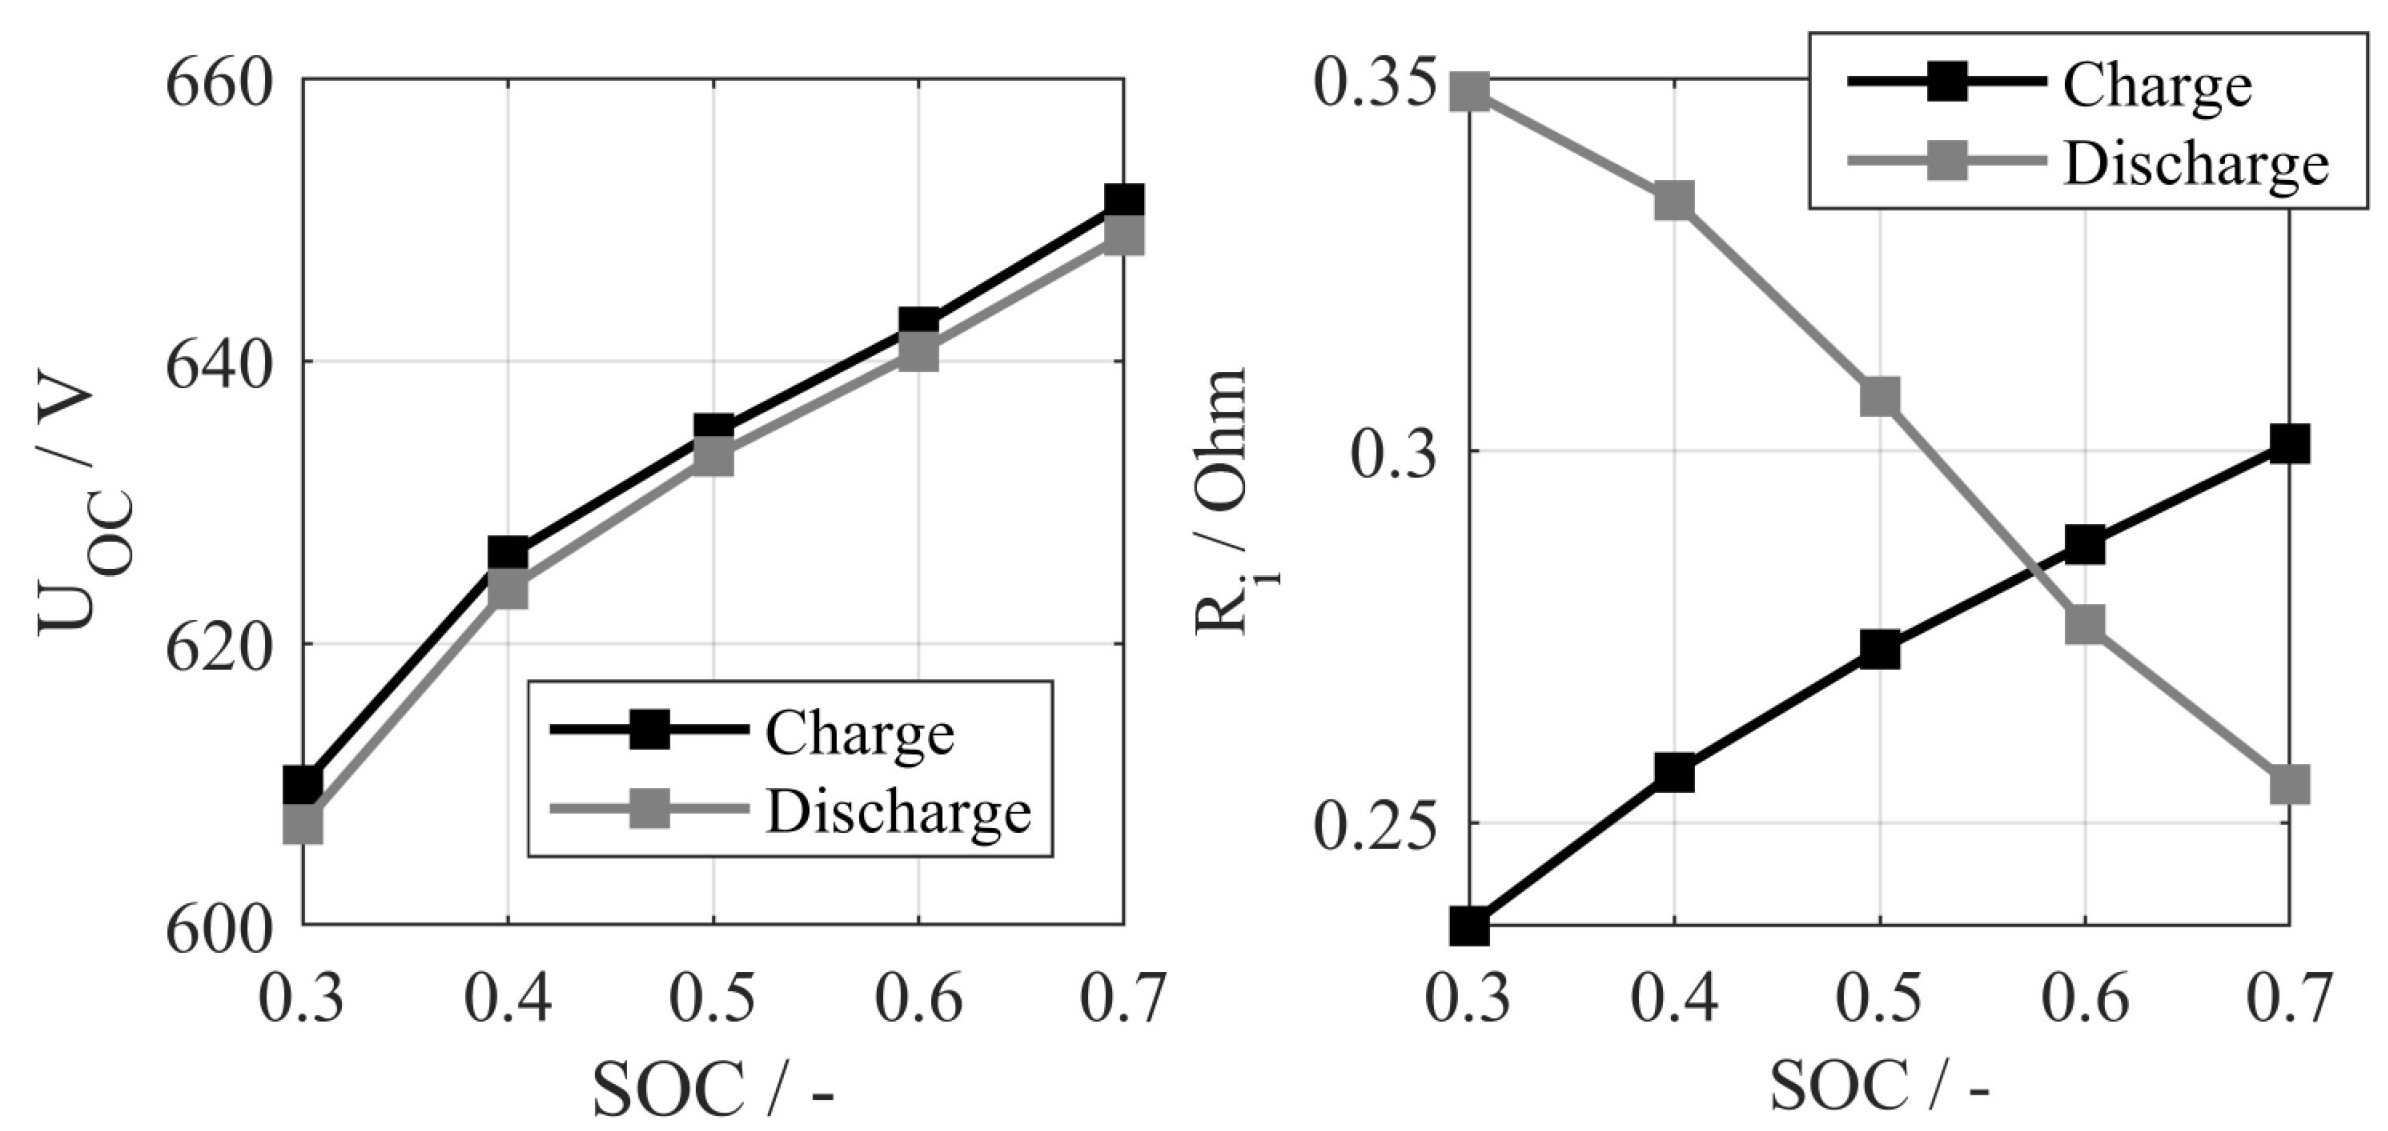
The open circuit voltage U O C and the internal resistance R i are parameterized as a function of SOC. In addition, a distinction is made as to whether the battery is being charged or discharged (see Figure 6).

2.4. Driving Cycles

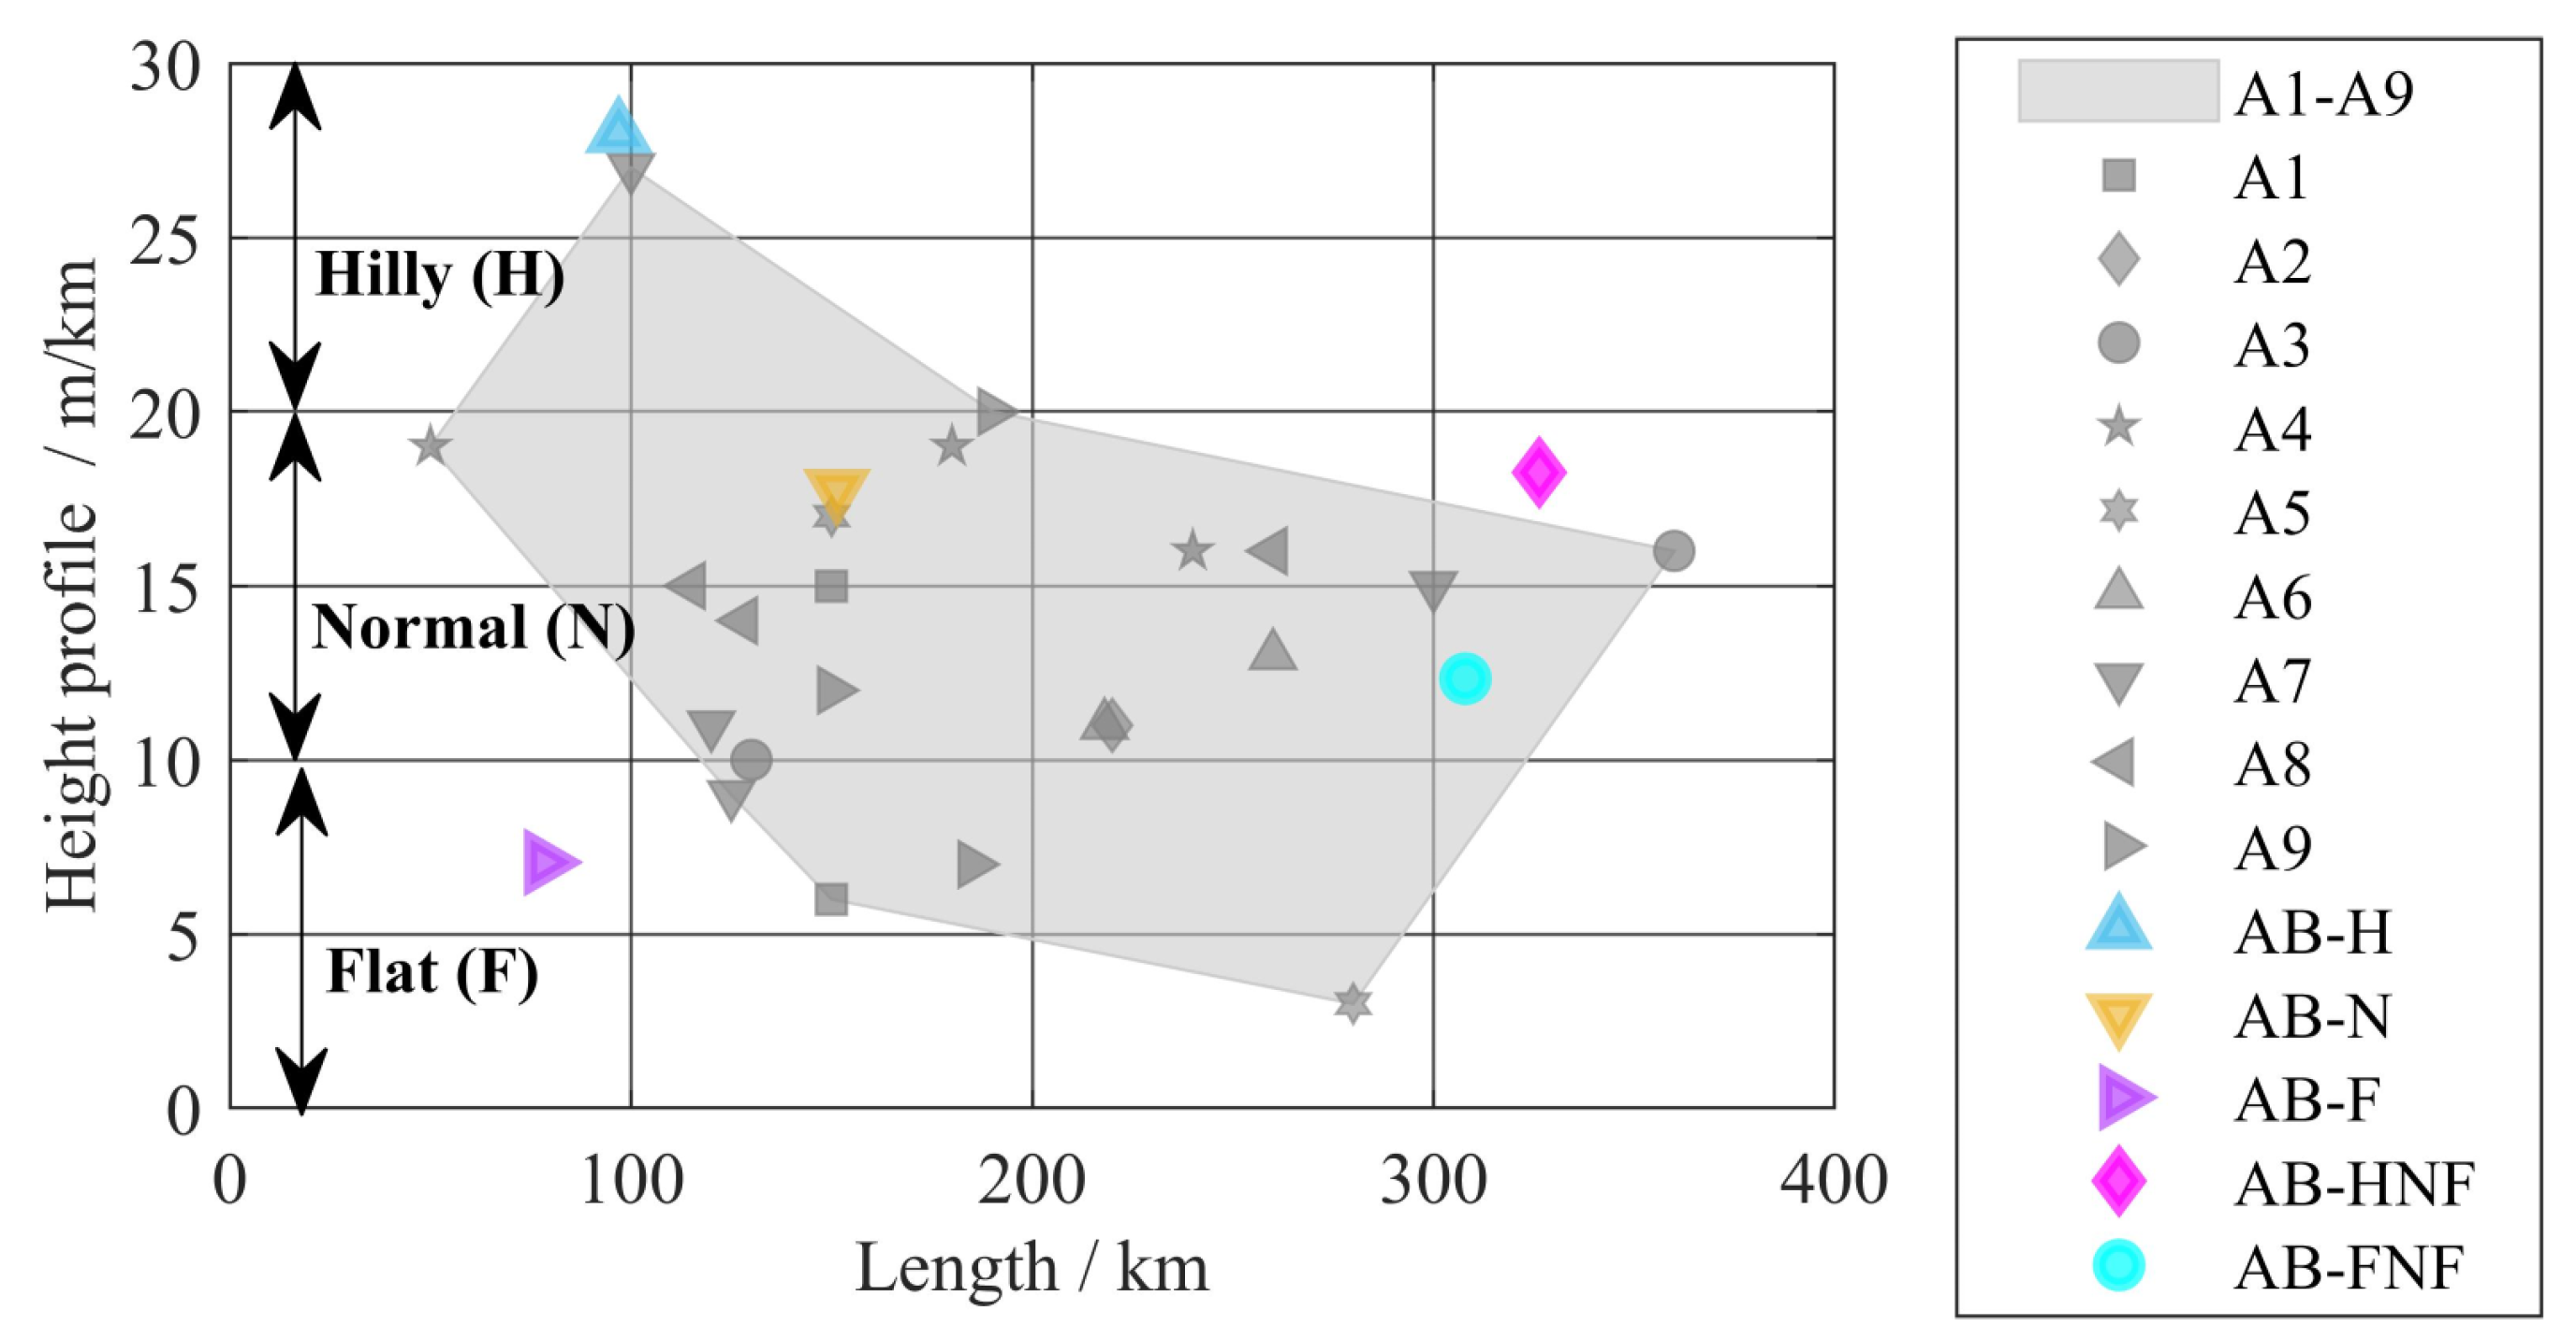
The driving cycle has a significant influence on the saving potential of HEV-HD trucks. To consider realistic operating conditions in the development of the intelligent EMS, measurements on several sections of the German Autobahn (AB) that were carried out by [29] are taken as driving cycles. The driving cycles AB-H, AB-N and AB-F are used for the development of the functionality of the proposed EMS and therefore are labelled as training cycles. The driving cycles AB-HNF and AB-FNF are composed of the three training cycles to evaluate the intelligent EMS on unknown cycles where the height profile changes significantly. These two cycles are therefore referred to as testing cycles. The focus of this paper is the constant long-haul driving situation, excluding traffic jams and changing of highways.
The height profile and the cycle length of the used driving cycles are put into perspective with the available Autobahn sections in [30], as shown in Figure 7. The unit of the height profile is the cumulative meters of altitude covered (uphill and downhill) per kilometer driven. The driving cycles used for this investigation cover the range of height profiles and distances of the respective Autobahn sections well. The speed and slope profile of the three training cycles can be found in the Appendix D.

3. Development of Energy Management Strategy

In this section, the three basic EMSs and their application for HEV-HD trucks are described. In the first step, the RB and DP are described and the difference in the operating strategy is explained. The application of the ECMS is carried out by a grid iteration to identify the basic EF. The results from this basic investigation are the ECMS-H, ECMS-N and ECMS-F, as shown in Figure 8. These EMSs are specifically tuned for the training cycles, which is indicated by the last letter referring to the height profile. Based on the insights from Section 3, a predictive battery discharge (PBDis) function is developed in Section 4. Here, the focus is on the training cycles with distinct height profile. In Section 5, the predictive EMSs are extended by an adaptive feature and combined in one functional structure. The resulting Prd-AECMS is investigated on the test cycles to evaluate how well the operating strategy is adjusted to the changing boundary conditions. A final comparison of the Prd-AECMS with the other EMSs is carried out for all cycles and different vehicle masses and is described in Section 6.

3.1. Rule Based

For the application of the RB in HEV-HD trucks, the main premise is to utilize electrical energy from the battery as soon as possible. This is implemented by the rules that there needs to be enough energy stored in the battery and that the power request needs to be positive. If both conditions are true, the vehicle is operated in assist mode or is driven purely electrically, depending on the magnitude of the power request. This ensures an empty battery prior to any downhill driving to maximize the amount of recuperated energy.

3.2. Global Optimal Control—DP

The application of the DP regarding the optimal control problem of HEVs is based on the open-source DPM function [31]. For details regarding problem formulation, see Ref. [5]. The DPM function was adjusted to the described vehicle model in Section 2. To emphasize the difference between the global optimal solution and the heuristic approach, the corresponding SOC trajectories are plotted in Figure 9. The top graph shows the SOC trajectories, the vehicle speed, and the road slope. In the bottom graph, the corresponding torque of the electric machine is plotted. The immediate discharging of the battery by the RB can be observed in the SOC trajectory (I). In contrast to that, DP depletes the battery over a long period of time (II) so that the battery is depleted just before the next downhill section where the complete DoD of battery is recharged. A recharging of the battery by the means of a load point shift would conflict with the slow discharge of the optimal control solution and is therefore neglected in this study. A third observation is the delayed recuperation of the DP (III), which is only possible due to the a priori knowledge.
The different magnitude of torque during propulsion and recuperation is explained in Figure 10. Even if the electric machine can deliver a peak power of up to 110 kW, it is only operated within the continuous power limit of 70 kW during propulsion (IVa in Figure 9). The impact of this imposed limitation can be explained by the operating points of the combustion engine. An assist mode with peak power would lower the operating point below its best point. In recuperation mode, the peak power is applied (IVb in Figure 9).

3.3. ECMS

The main idea of the ECMS for the application of HEVs is formulated in [8]. The electric energy of the battery is made comparable using an EF. The real fuel power P f u e l results from the used fuel mass flow m ˙ f u e l and the lower heating value H U (15). The electric power of the battery P B A T (16) is transferred by the static EF λ 0 into as virtual fuel power. An equivalent fuel power P λ is gained from the addition of the real and virtual fuel power (17). For the calculated equivalent fuel power, the minimum is determined to define the optimal operation mode for each time step of the driving cycle.
P f u e l ( u ( t ) , t ) = m ˙ f u e l ( t ,   u ( t ) )   ·   H U
P B A T ( u ( t ) , t ) = I B A T ( t ,   u ( t ) )   ·   U B A T
P λ ( u ( t ) , t ) = P f u e l ( u ( t ) , t ) + λ 0 · P B A T ( u ( t ) , t )
For the determination of the EF, many approaches are documented in the literature. In the following, three approaches are described. A common approach presented in [9] is to calculate the static EF λ 0 based on the average efficiency of the battery η ¯ B A T ,   E M   η ¯ E M and ICE η ¯ I C E :
λ 0 = 1 η ¯ I C E · η ¯ E M · η ¯ B A T ,                           P B A T < 0 η ¯ E M · η ¯ B A T η ¯ V M   ,                           P B A T     0  
The static EF λ 0 is used by [9,10] to propose an adaptive ECMS where a dynamic EF λ factor is adjusted based on the deviation of the actual SOC and a defined reference SOC (19). This leads to a higher degree of freedom regarding the operating mode selection and is commonly referred to A-ECMS. However, in this paper, this approach is referred to as basic ECMS according to the introduced nomenclature (see Figure 8).
λ ( t ) = λ 0 + K · ( S O C r e f S O C ( t ) )
Based on this approach, [22] proposed as an adjustment to the reference SOC S O C r e f considering the kinetic K E and potential energy K E h (20). This aims to have low reference SOC values when the vehicle is fast and is driving at high altitude to maximize the amount of energy that can be recuperated. The current height is continuously compared to a base height h 0 while S O C r e f , 0 defines the base value for the reference SOC.
S O C r e f ( t ) = S O C r e f , 0   K E · m   1 2   ·   v 2 ( t ) K h · m · g · ( h ( t ) h 0 )
For a detailed formulation of the optimal control problem in the form of PMP and ECMS, please refer to [7]. Further approaches and methods to determine the EF are documented in [3].

3.4. Application of ECMS to HEV-HD Trucks

In this section, the EF λ for the basic ECMS of the HEV-HD truck is determined for the three training cycles. The resulting operation strategies are analysed to identify limitations of the common approach and to derive requirements for the development of an intelligent EMS for real driving conditions. The determination of λ is based on an equivalent fuel mass to guarantee a fair comparison of all different operating strategies (see Appendix A).
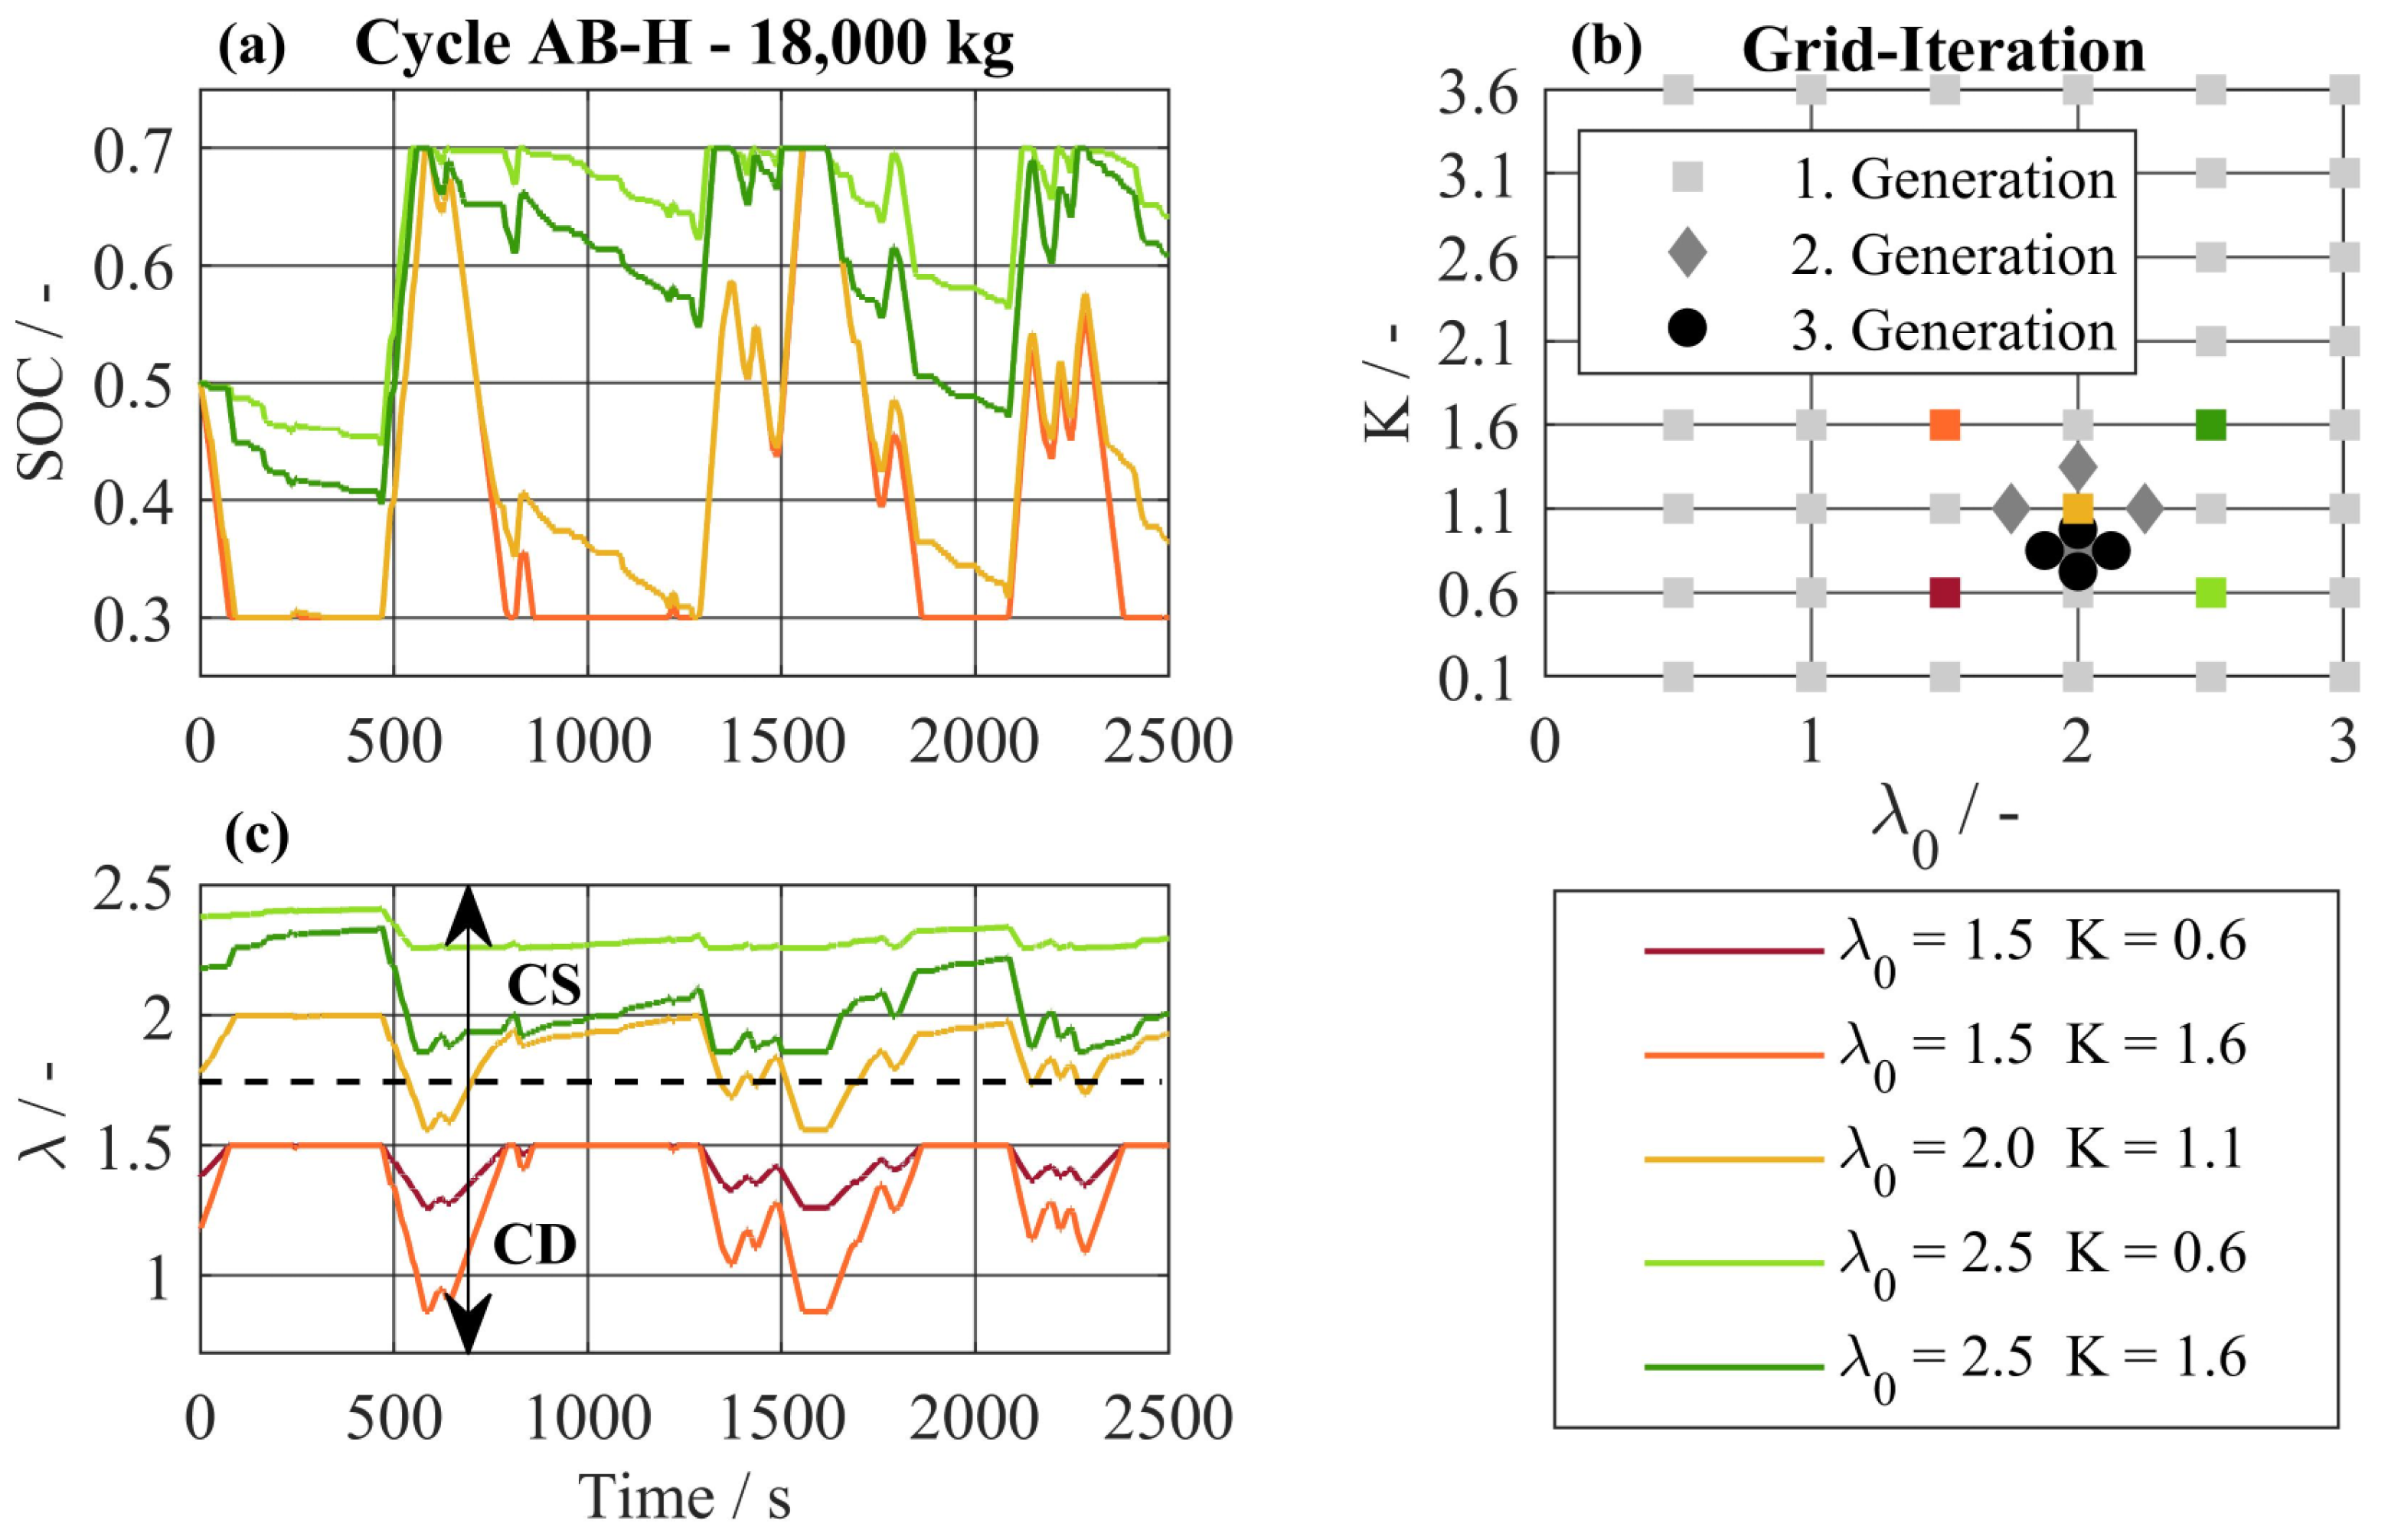
To identify a basic parametrization of the dynamic EF λ for the investigated HEV-HD truck, a grid iteration is used. The ECMS is based on the approach according to (19). The reference SOC is set to the minimum value of 30% to ensure an empty battery before long downhill driving phases. The used grid iteration and the resulting operation strategy of different parameter sets are displayed in Figure 11. The covered parameter range of λ 0 and K is shown in Figure 11b. During the first iteration, the whole range of parameter sets is simulated on the training cycles. The resulting equivalent fuel mass is used to find the optimal parameter set. Around this optimal parameter set, a second iteration is carried out, and so on. The resulting operation strategy of five different parameter sets is shown in Figure 11a in the form of the SOC trajectories. The corresponding trajectories of the dynamic EF λ are plotted in Figure 11c. It can be observed that a value of λ below 2 leads to a CD operating strategy, while a value above 2 leads to a CS operating strategy. In the latter case, the SOC does not drop below a value of 50%. While the basic EF λ 0 determines the type of operating strategy, the K-values determine the characteristics of the operating strategy. A low value of K leads to a slower battery discharge than a high value. The final parameters for the three training cycles confirm the observed impact of the EF. The hilly driving cycles require a CD operating strategy with a λ 0 of 2, while the flat driving cycle requires a CS operating strategy with a λ 0 of 2.5 (see Appendix B).
Table 1 shows the used parameter sets of λ 0 and K for the first two and final iterations of the grid iteration. The parameter sets are evaluated regarding the resulting equivalent fuel mass resulting from the numerical simulation. The final parameter set is derived from the final generation where the optimal equivalent fuel mass is converging for a λ 0 value of 2 and a K value of 0.89. These values are used for the further analysis. The complete results of the grid iteration can be found in the Appendix B (see Figure A1).
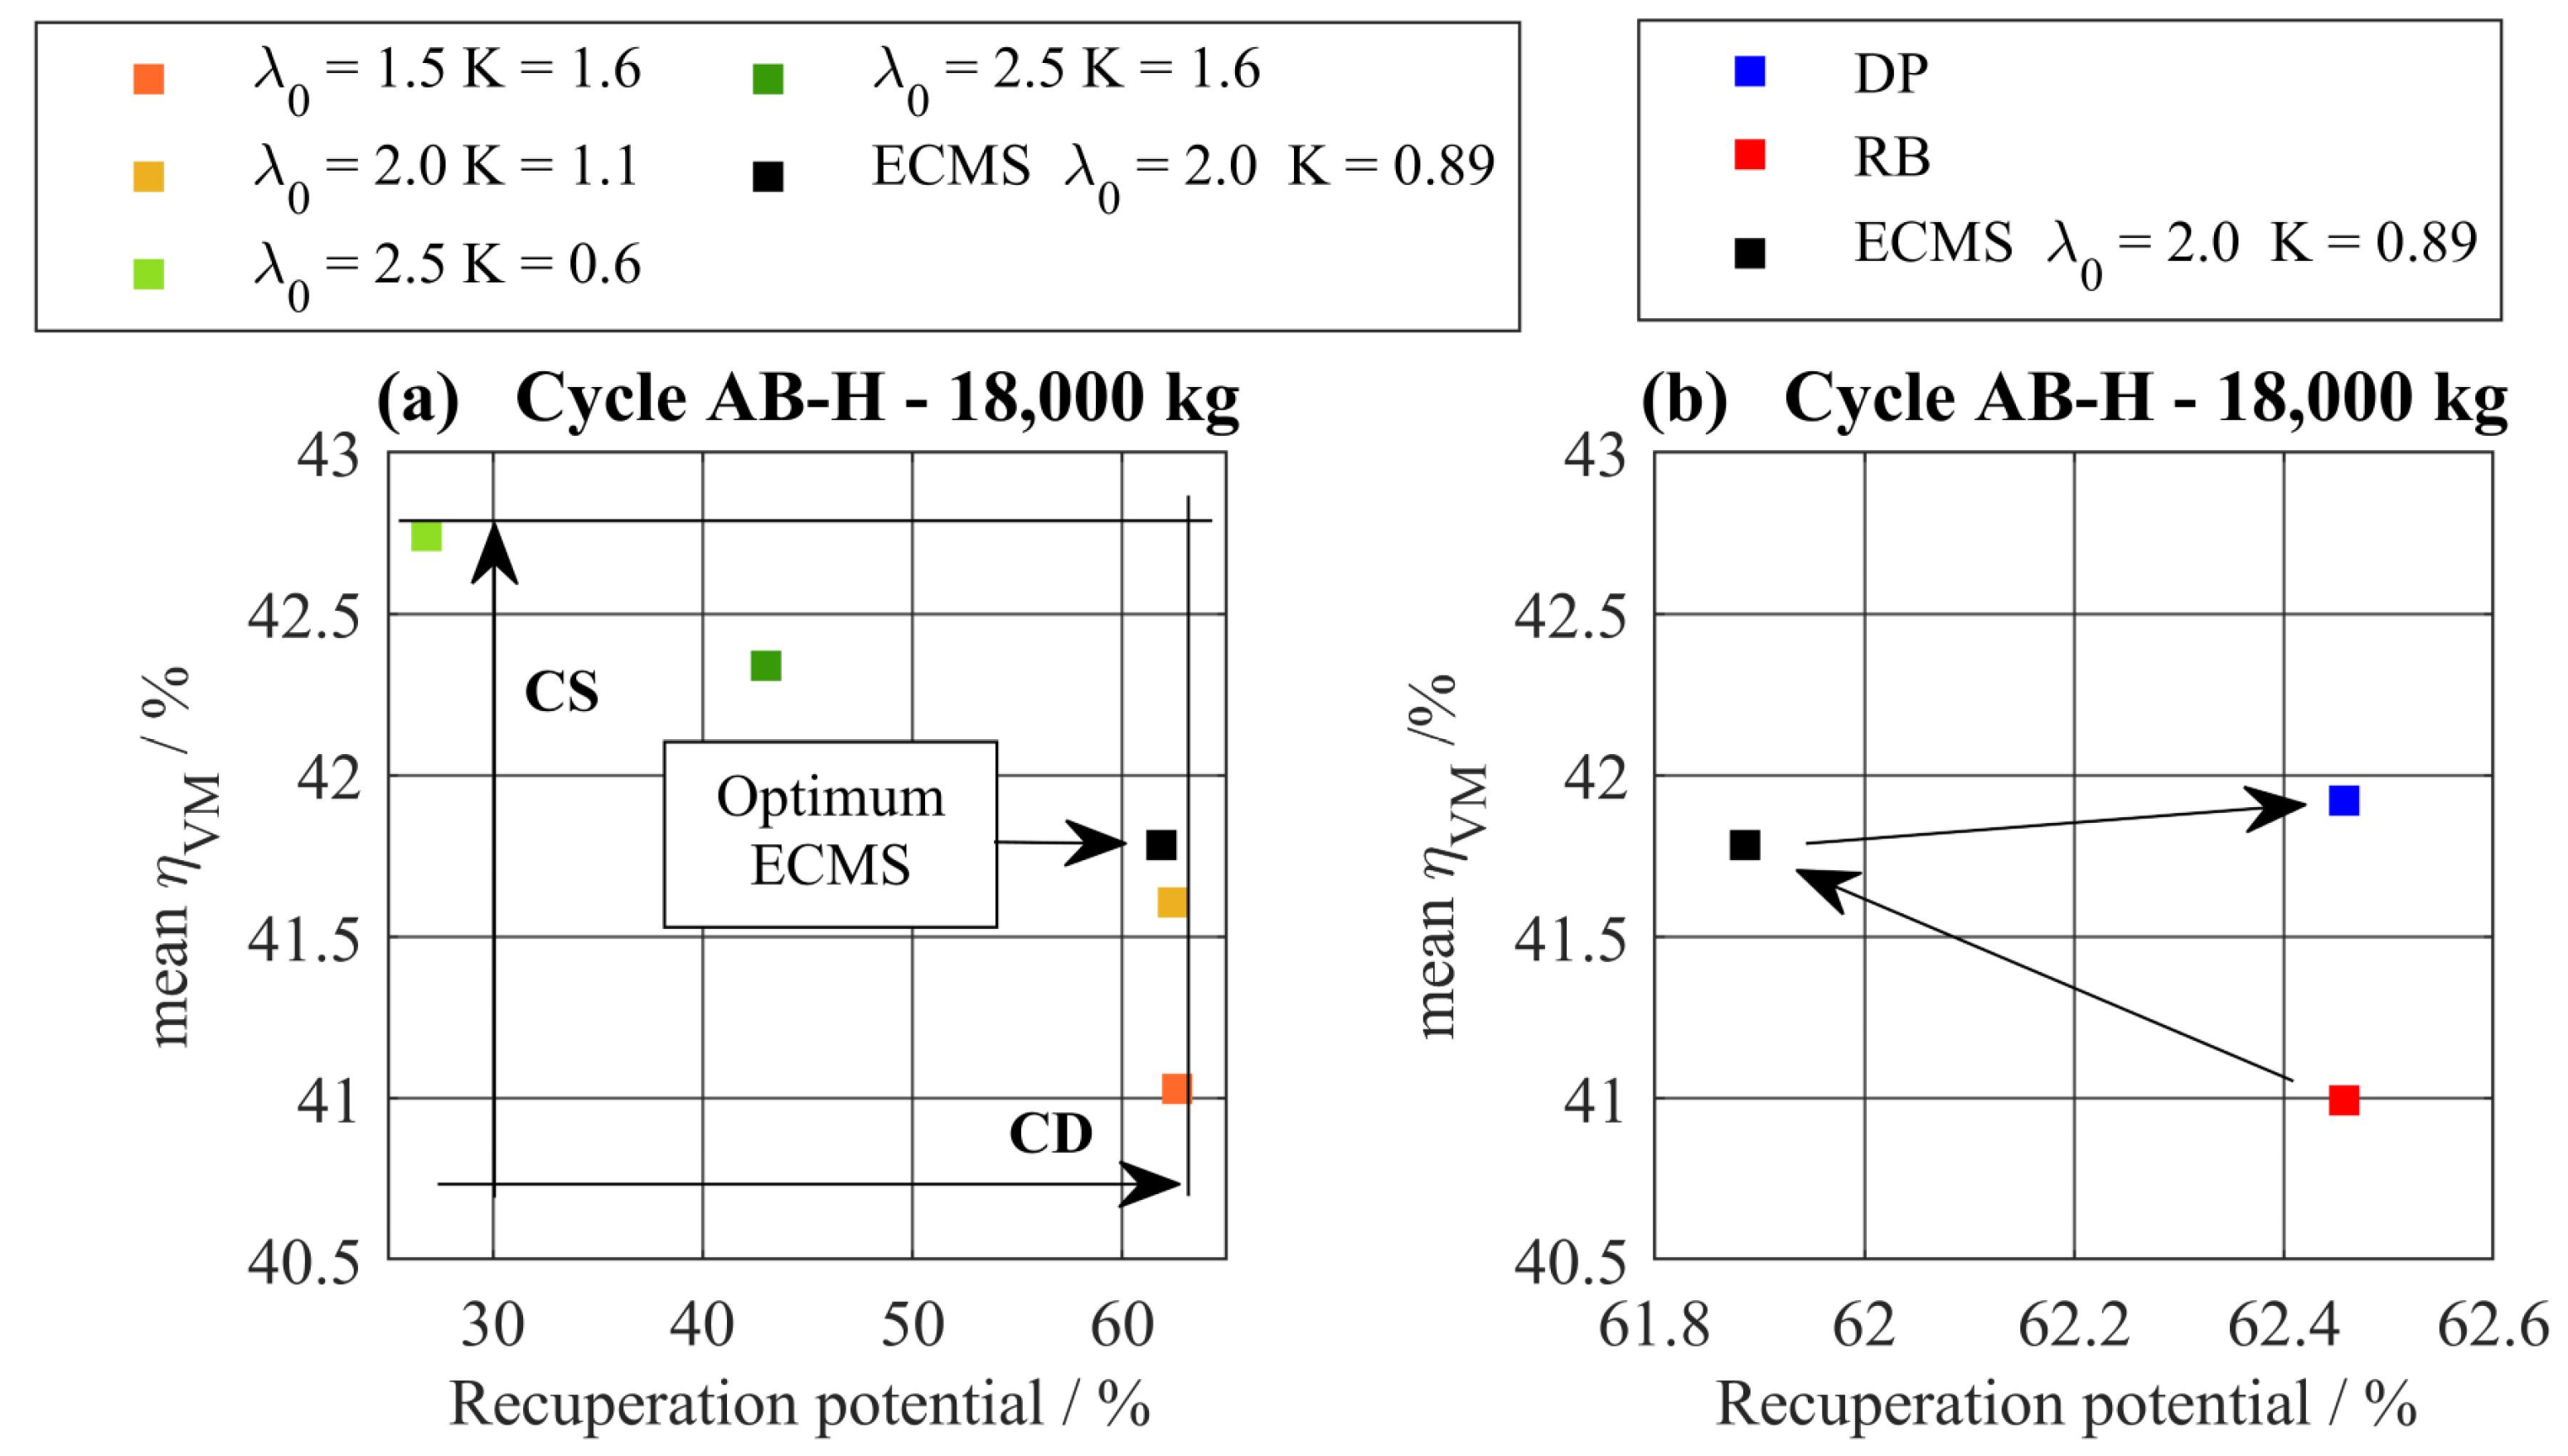
The impact of the different parameter sets regarding efficiency is plotted in Figure 12. To gain the optimal powertrain efficiency, the tradeoff between the recuperation potential and the average efficiency of the ICE must be solved. The recuperation potential is the amount of recuperated energy in relation to the available brake energy at the input shaft of the gearbox. In Figure 12a, the last grid iteration is plotted in comparison to the parameters set from the first iteration. A CS operating strategy leads to high efficiency of the ICE but low recuperation potential. A CD operating strategy leads to high recuperation potential but low average ICE efficiency. In Figure 12b, the ECMS is compared to RB and DP. It can be observed that the RB leads to the maximal recuperation potential due to the immediate discharge of the battery. This, however, leads to the lowest mean efficiency of the ICE. The local optimization of the ECMS leads to improved mean efficiency but reduces the recuperation potential. The DP represents to the global optimum in both directions. The aim of the proposed intelligent EMS is to replicate the operating strategy of the DP so that the tradeoff is solved in the best possible way without the complete a priori knowledge.
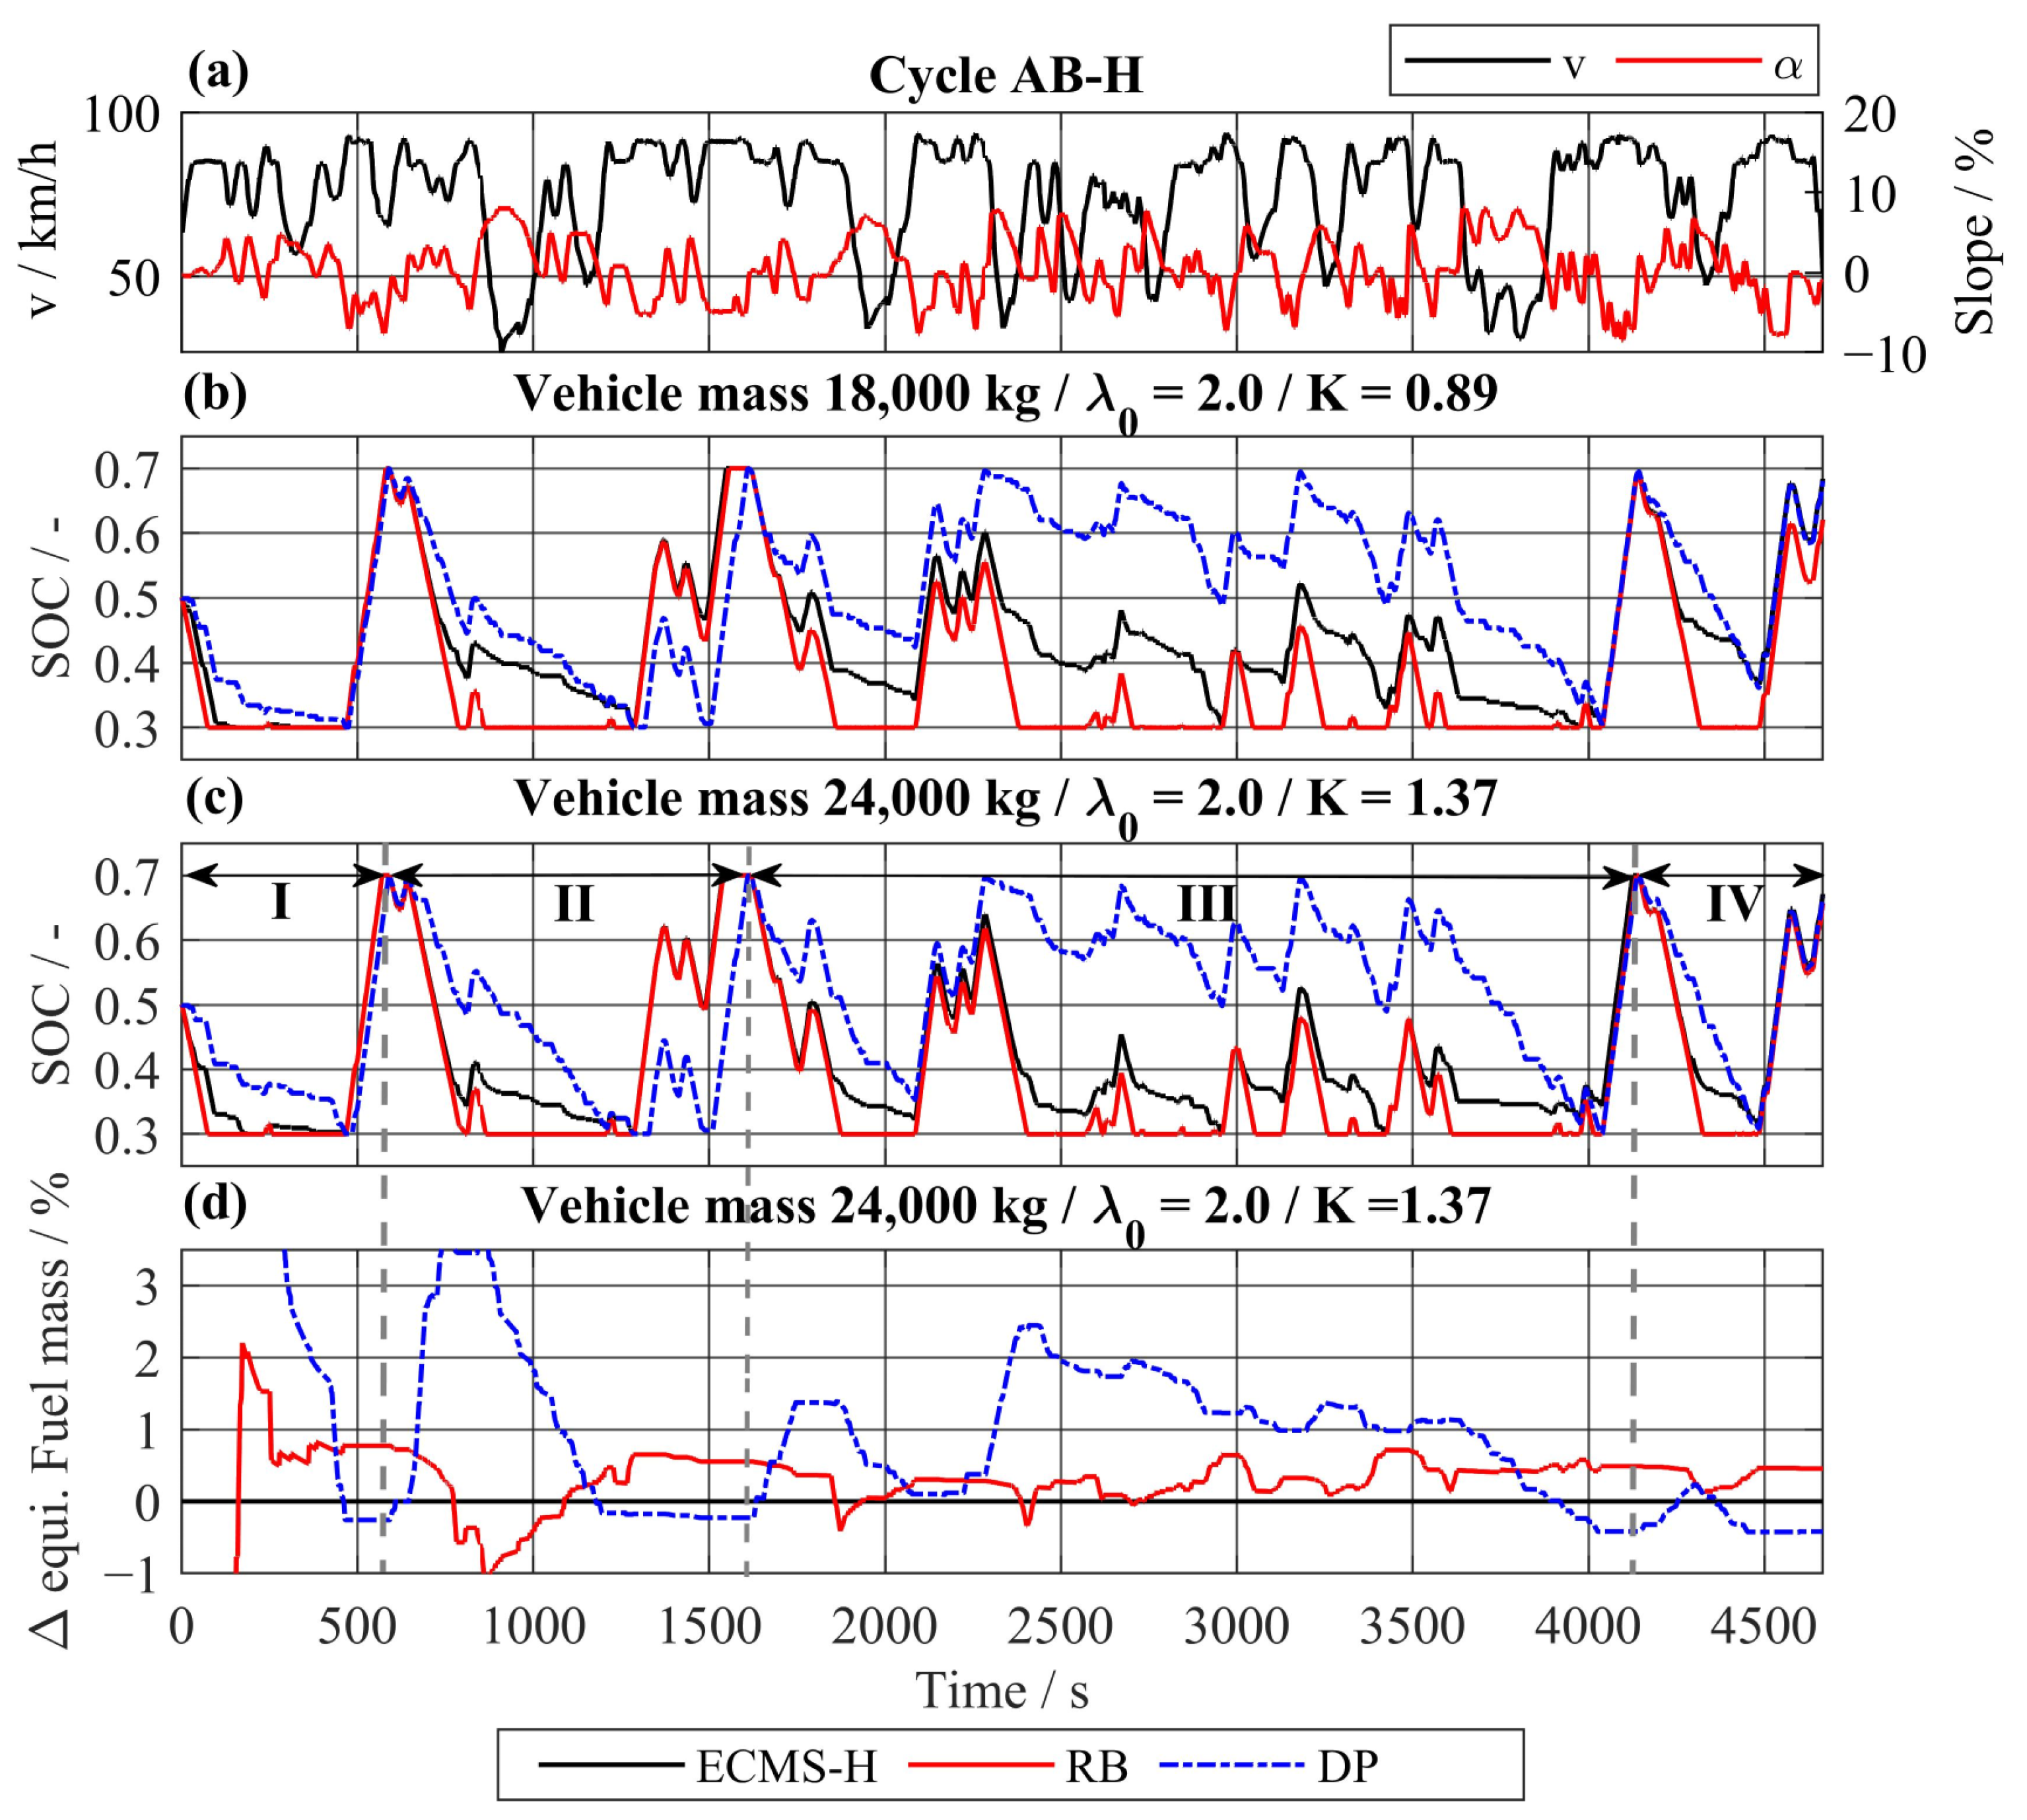
The SOC trajectories of the ECMS-H, RB and DP are compared to identify approaches which can solve the described tradeoff (see Figure 13). The analysis is done on the driving cycle AB-H with the vehicle speed and road slope plotted in Figure 13a. In Figure 13b,c, the SOC trajectories for a vehicle mass of 18,000 kg and 24,000 kg, respectively, are displayed. The cycle is divided into four periods based on the points where the battery can be fully recharged, as marked in Figure 13c. For a vehicle mass of 18,000 kg, the SOC trajectory of ECMS shows a similar operating strategy as the DP, especially in periods II and IV. In period III, the trajectories are similar but feature a SOC offset of about 20% of the usable energy. With increased payload, the operating strategy of the ECMS-H becomes more like the CD strategy of RB. The SOC offset towards DP widens as the K-value increases, which leads to a faster battery discharge. The advantage of the optimal control against the other EMSs regarding equivalent fuel consumption can be observed in Figure 13d. Until the end of period III, the RB shows better fuel consumption than the DP. The DP leads to a CS operating strategy over most of the section. The electric energy is only used during a steep hill climb at the end of the section. This flexible combination of a CS-CD operating strategy is not possible to achieve by the ECMS-H with a fixed parameter set of λ 0 and K . To counter this limitation, the intelligent EMS is extended by further parameters and a predictive battery discharge function prior to a long downhill section.

4. Development of Predictive Battery Discharge for ECMS

To match the observed operating strategy of DP, the basic ECMS is extended by a predictive functionality. The main objective of this predictive battery discharge (PBDis) is to deplete the battery just before an upcoming long downhill driving situation that leads to complete recharge of the battery. For shorter downhill driving situations, which only recharge the battery partially, a slow discharge to maximize overall efficiency of the ICE is desired.

4.1. Functional Requirements and Parameter Defintion

To achieve the flexible CS-CD operating strategy observed from DP, the discharging of the battery is split up in two sections. The new parameters and their intended impact within the two sections are shown in Figure 14. In Figure 14a, the speed profile and the road slope of the driving cycle AB-N are plotted. In addition to that, the Moving Average Window (MAW) of the road slope α is plotted for a time t p r d of 150 s Equation (21). The value of the M A W α is used as a trigger condition to switch between the two sections with different operating strategies Equation (22). While the value of M A W α is above a defined value α t r i g , a CS operation strategy is chosen. In period I in Figure 14b, a slow battery discharge is realized by the parameter K c o r r , which adjusts the basic K value. If the value drops below the trigger condition, an immediate and fast discharge is forced upon the battery by a comparatively high value of the parameter K d i s (see period II). This extension of the ECMS is realized by the parameter K p r d , which includes the case switch (23).
M A W α = 1 t p r d · k = 1 t p r d α k
K p r d = K c o r r ,                                                   M A W α >   α t r i g K d i s · K c o r r   ,                             M A W α     α t r i g  
λ ( t ) = λ 0 + K · ( S O C r e f   S O C ( t ) )   · K p r d ( t )

4.2. Impact and Tuning of the Paramters

The process of parameter definition for the described functionality was split up into two steps. First, a manual analysis of the impact of the single parameters was done for selected vehicle masses and certain sections of the driving cycles. Once the state space for the parameters was defined, a full factorial calculation was carried out to obtain the final parameters for the implemented EMS.
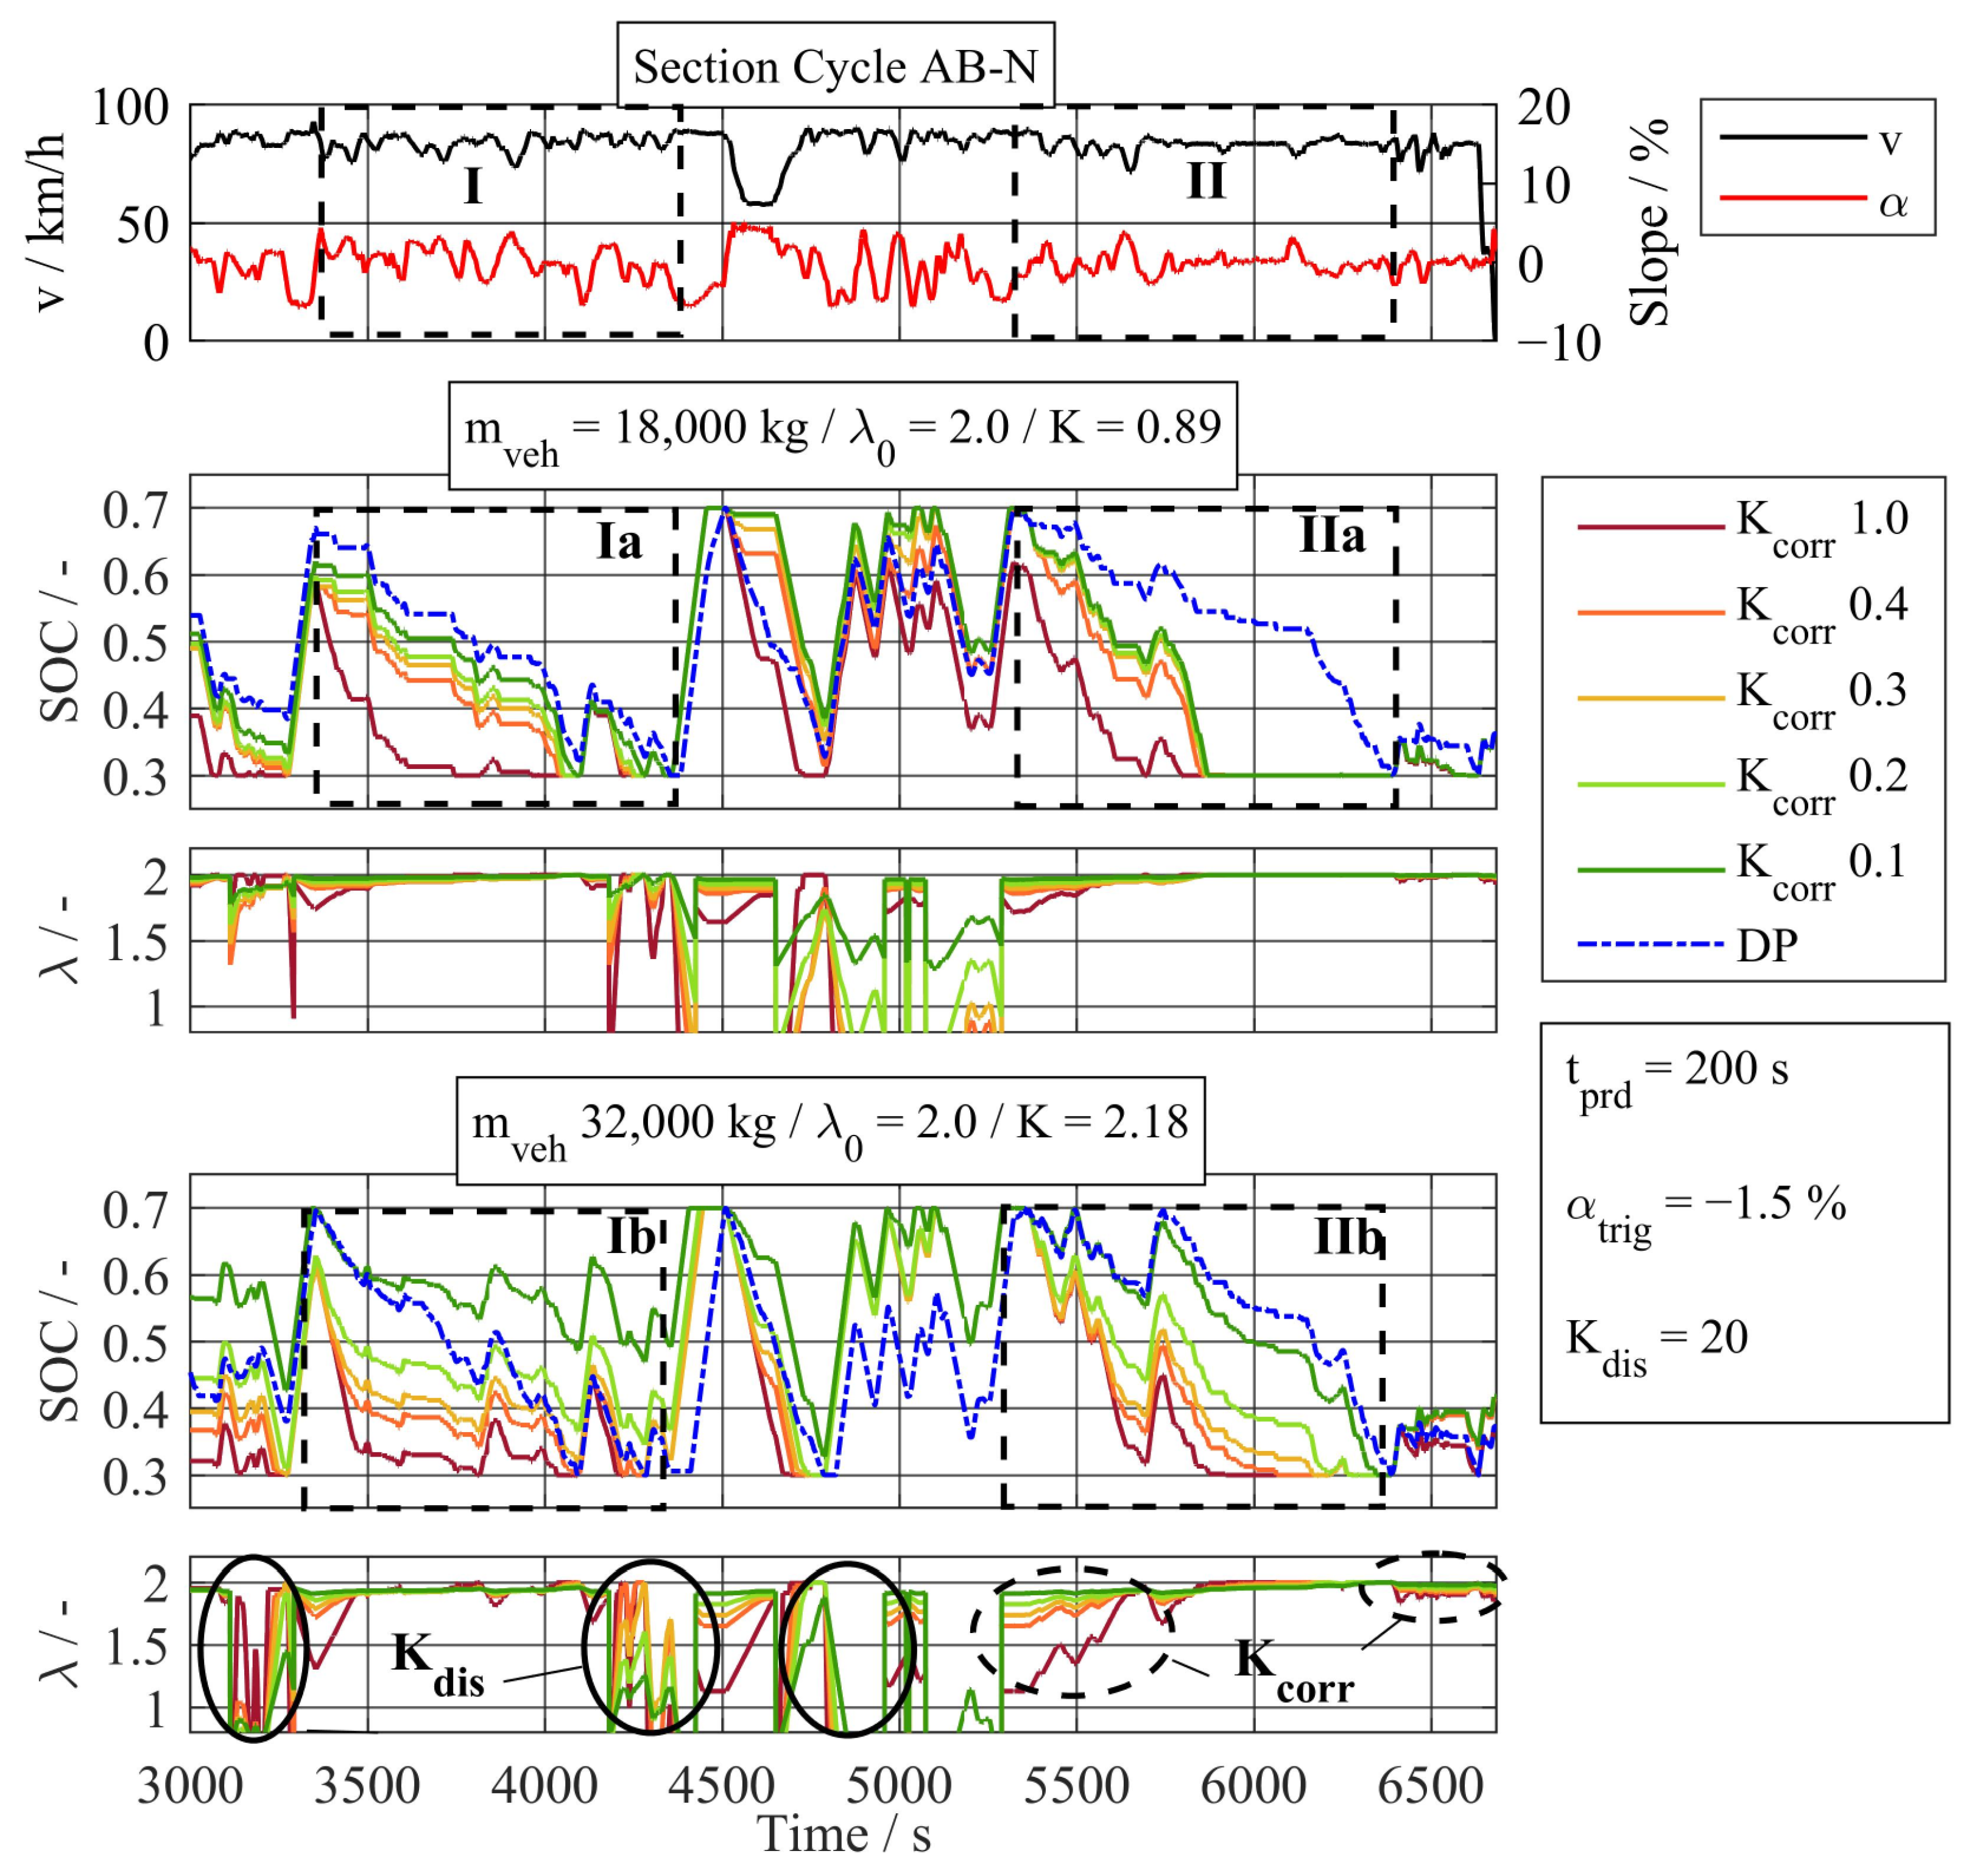
To gain a detailed understanding of the impact of the parameter K c o r r , a variation in the driving cycle AB-N for two different periods and two different vehicle masses is shown in Figure 15. These two periods were selected because of their difference in the occurring height profile. In the first period, the distinct height profile with slopes of up to 5% contrasts the height profile of the second period, where the slope oscillates around 0% for the last half of the period (see I and II in Figure 15). For the first period and a vehicle mass of 18,000 kg, a value of 0.1 for K c o r r   leads to a similar SOC trajectory to the global optimal solution based on DP (see Ia). However, the same value for K c o r r would lead to a suboptimal discharging trajectory for a vehicle mass of 32,000 kg (see Ib in Figure 15). Here, the SOC would still be at a value of 0.5 before the next recuperation phase where the battery is fully charged. This would lead to a reduced recuperation potential. Here, a value of 0.4 for K c o r r   imitates the discharging trajectory of the DP in the best possible way. For the second period and a vehicle mass of 18,000 kg, none of the values for K c o r r   lead to a similar SOC trajectory to the DP (see IIa). Here, a switch from the CD- to a CS-operating strategy is required, which is described in Section 5. For a vehicle mass of 32,000 kg, a value of 0.1 for K c o r r indicates the best matching between the SOC trajectory of the DP (see IIb). However, this contradicts the optimal value observed in the first period for 32,000 kg of 0.4 (comparison of Ib to IIb). The corresponding equivalent fuel masses for the shown parameter variations are shown in the Appendix C (see Figure A2).
The variation in the parameters K d i s   and α t r i g for the driving cycle AB-H is shown in Figure 16. The cycle AB-H was chosen for this analysis as here, the two step downhill sections were close to each other. To realize a fast discharge and a good efficiency of the ICE, the parameters were tuned manually to observe possible parameter sets that imitate the global optimal solution of the DP. It can be observed that a variation of K d i s   defines how fast the battery is discharged. While low values result in slow discharging, high values lead to an immediate discharge. The different discharging behavior results from the adjusted equivalence factor as highlighted (see period I). The parameter α t r i g influences the distance between the downhill section and the start of the predictive discharge of the battery. As the value of α t r i g functions as the trigger condition, low negative values lead to the earliest discharging of the battery (see period II). High negative values delay the predictive discharging. The parameter α t r i g and the predictive horizon t p r d stand in close interdependency, as the predictive horizon defines the earliest possible point for a predictive discharging of the battery. In general, all four parameters α t r i g , t p r d , K c o r r   and K d i s interdepend on each other. Therefore, a full factorial parameter variation was carried out to identify the optimal parameter sets regarding equivalent fuel mass.
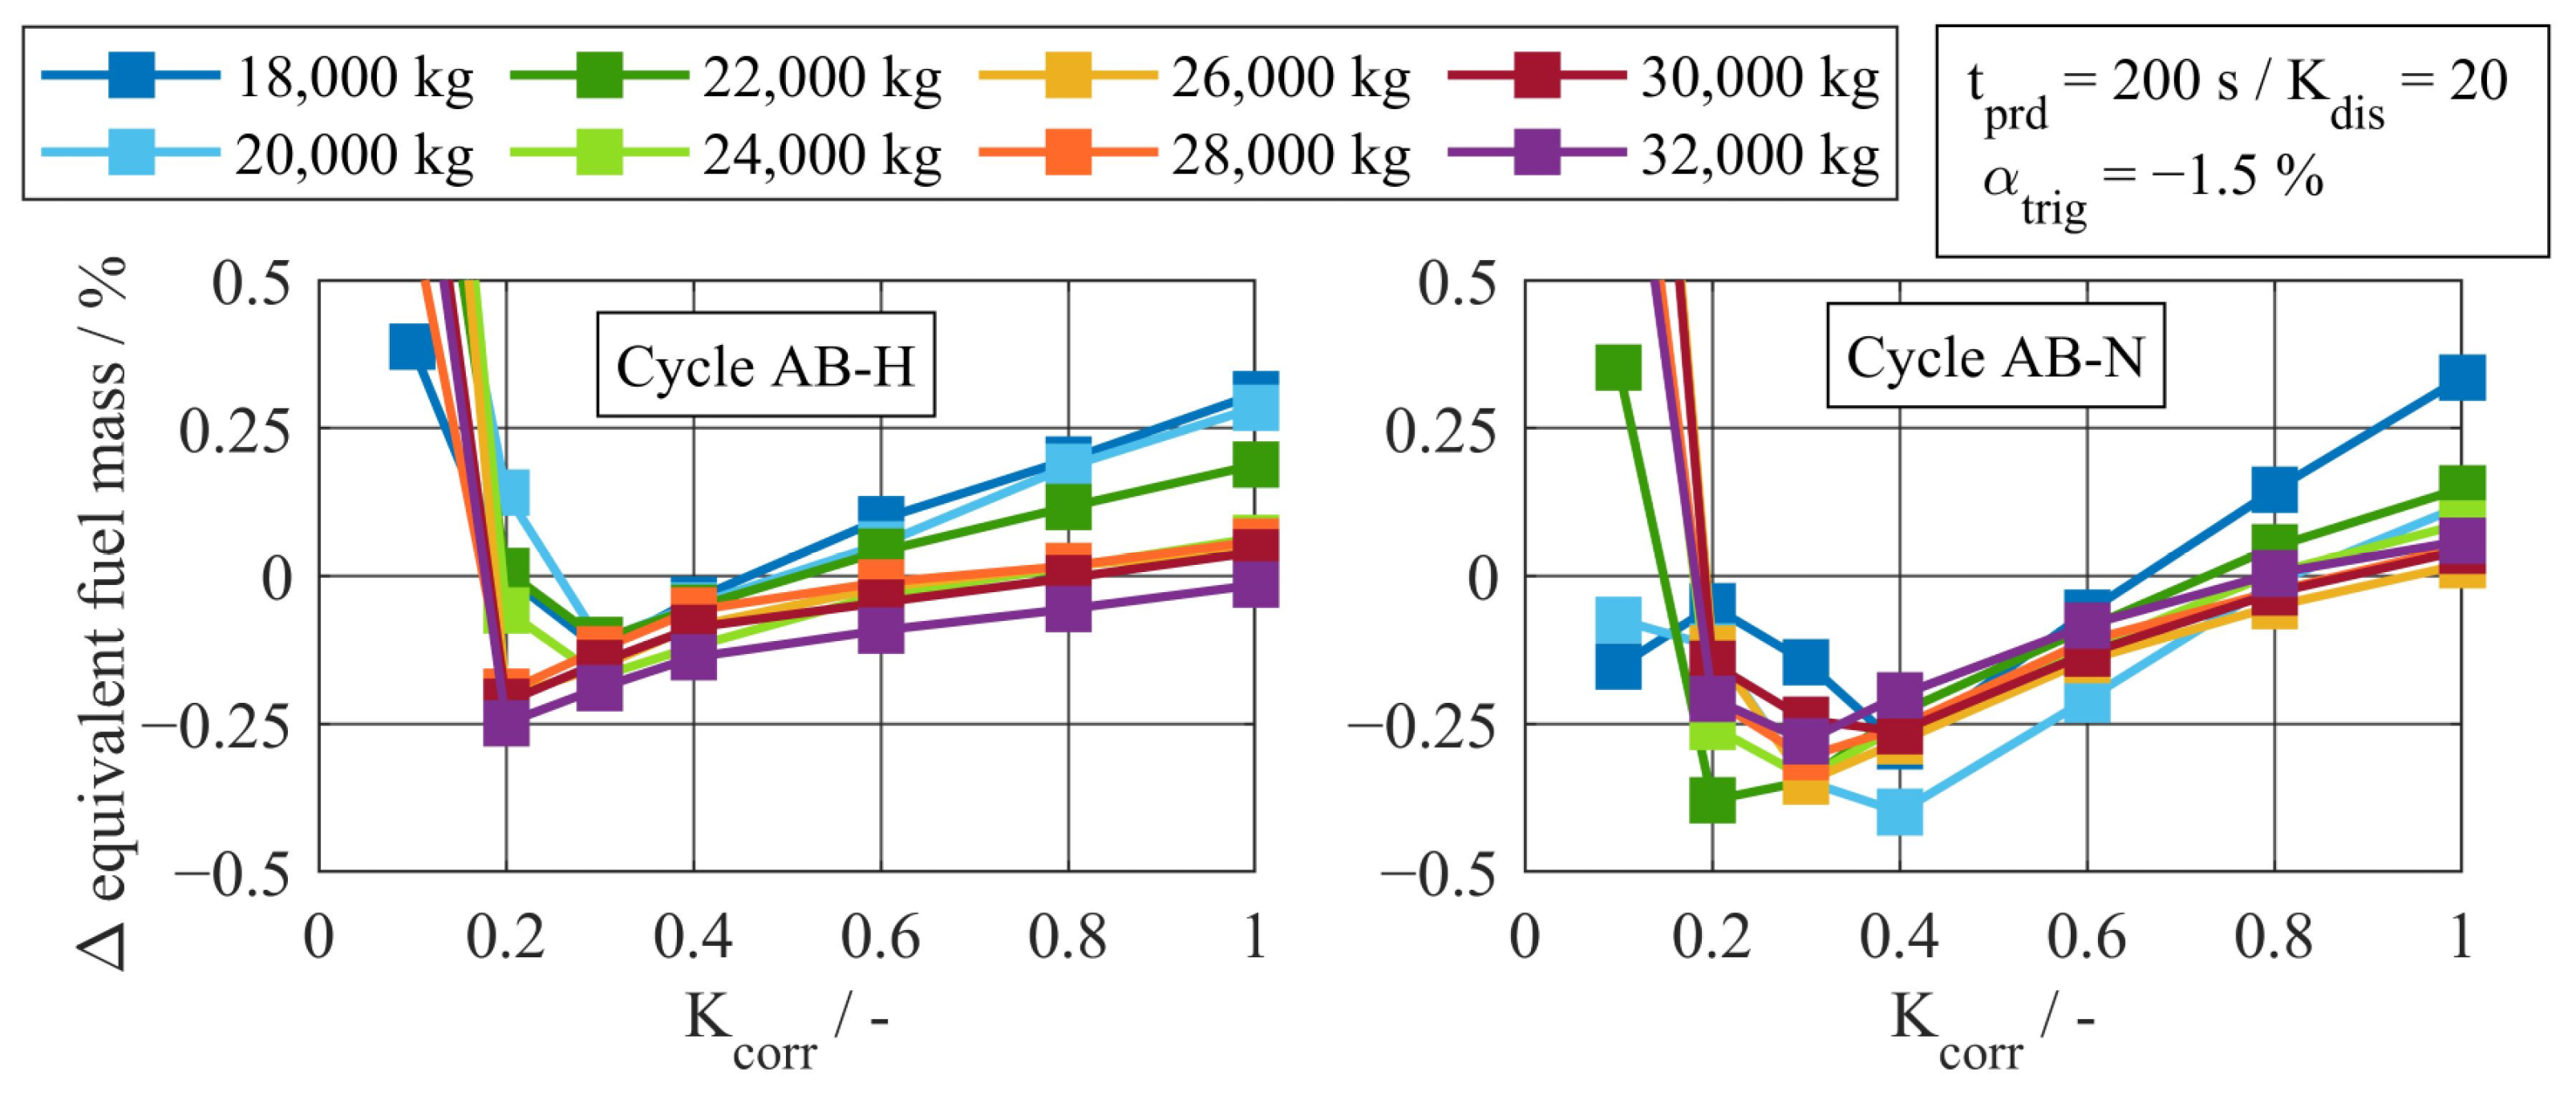
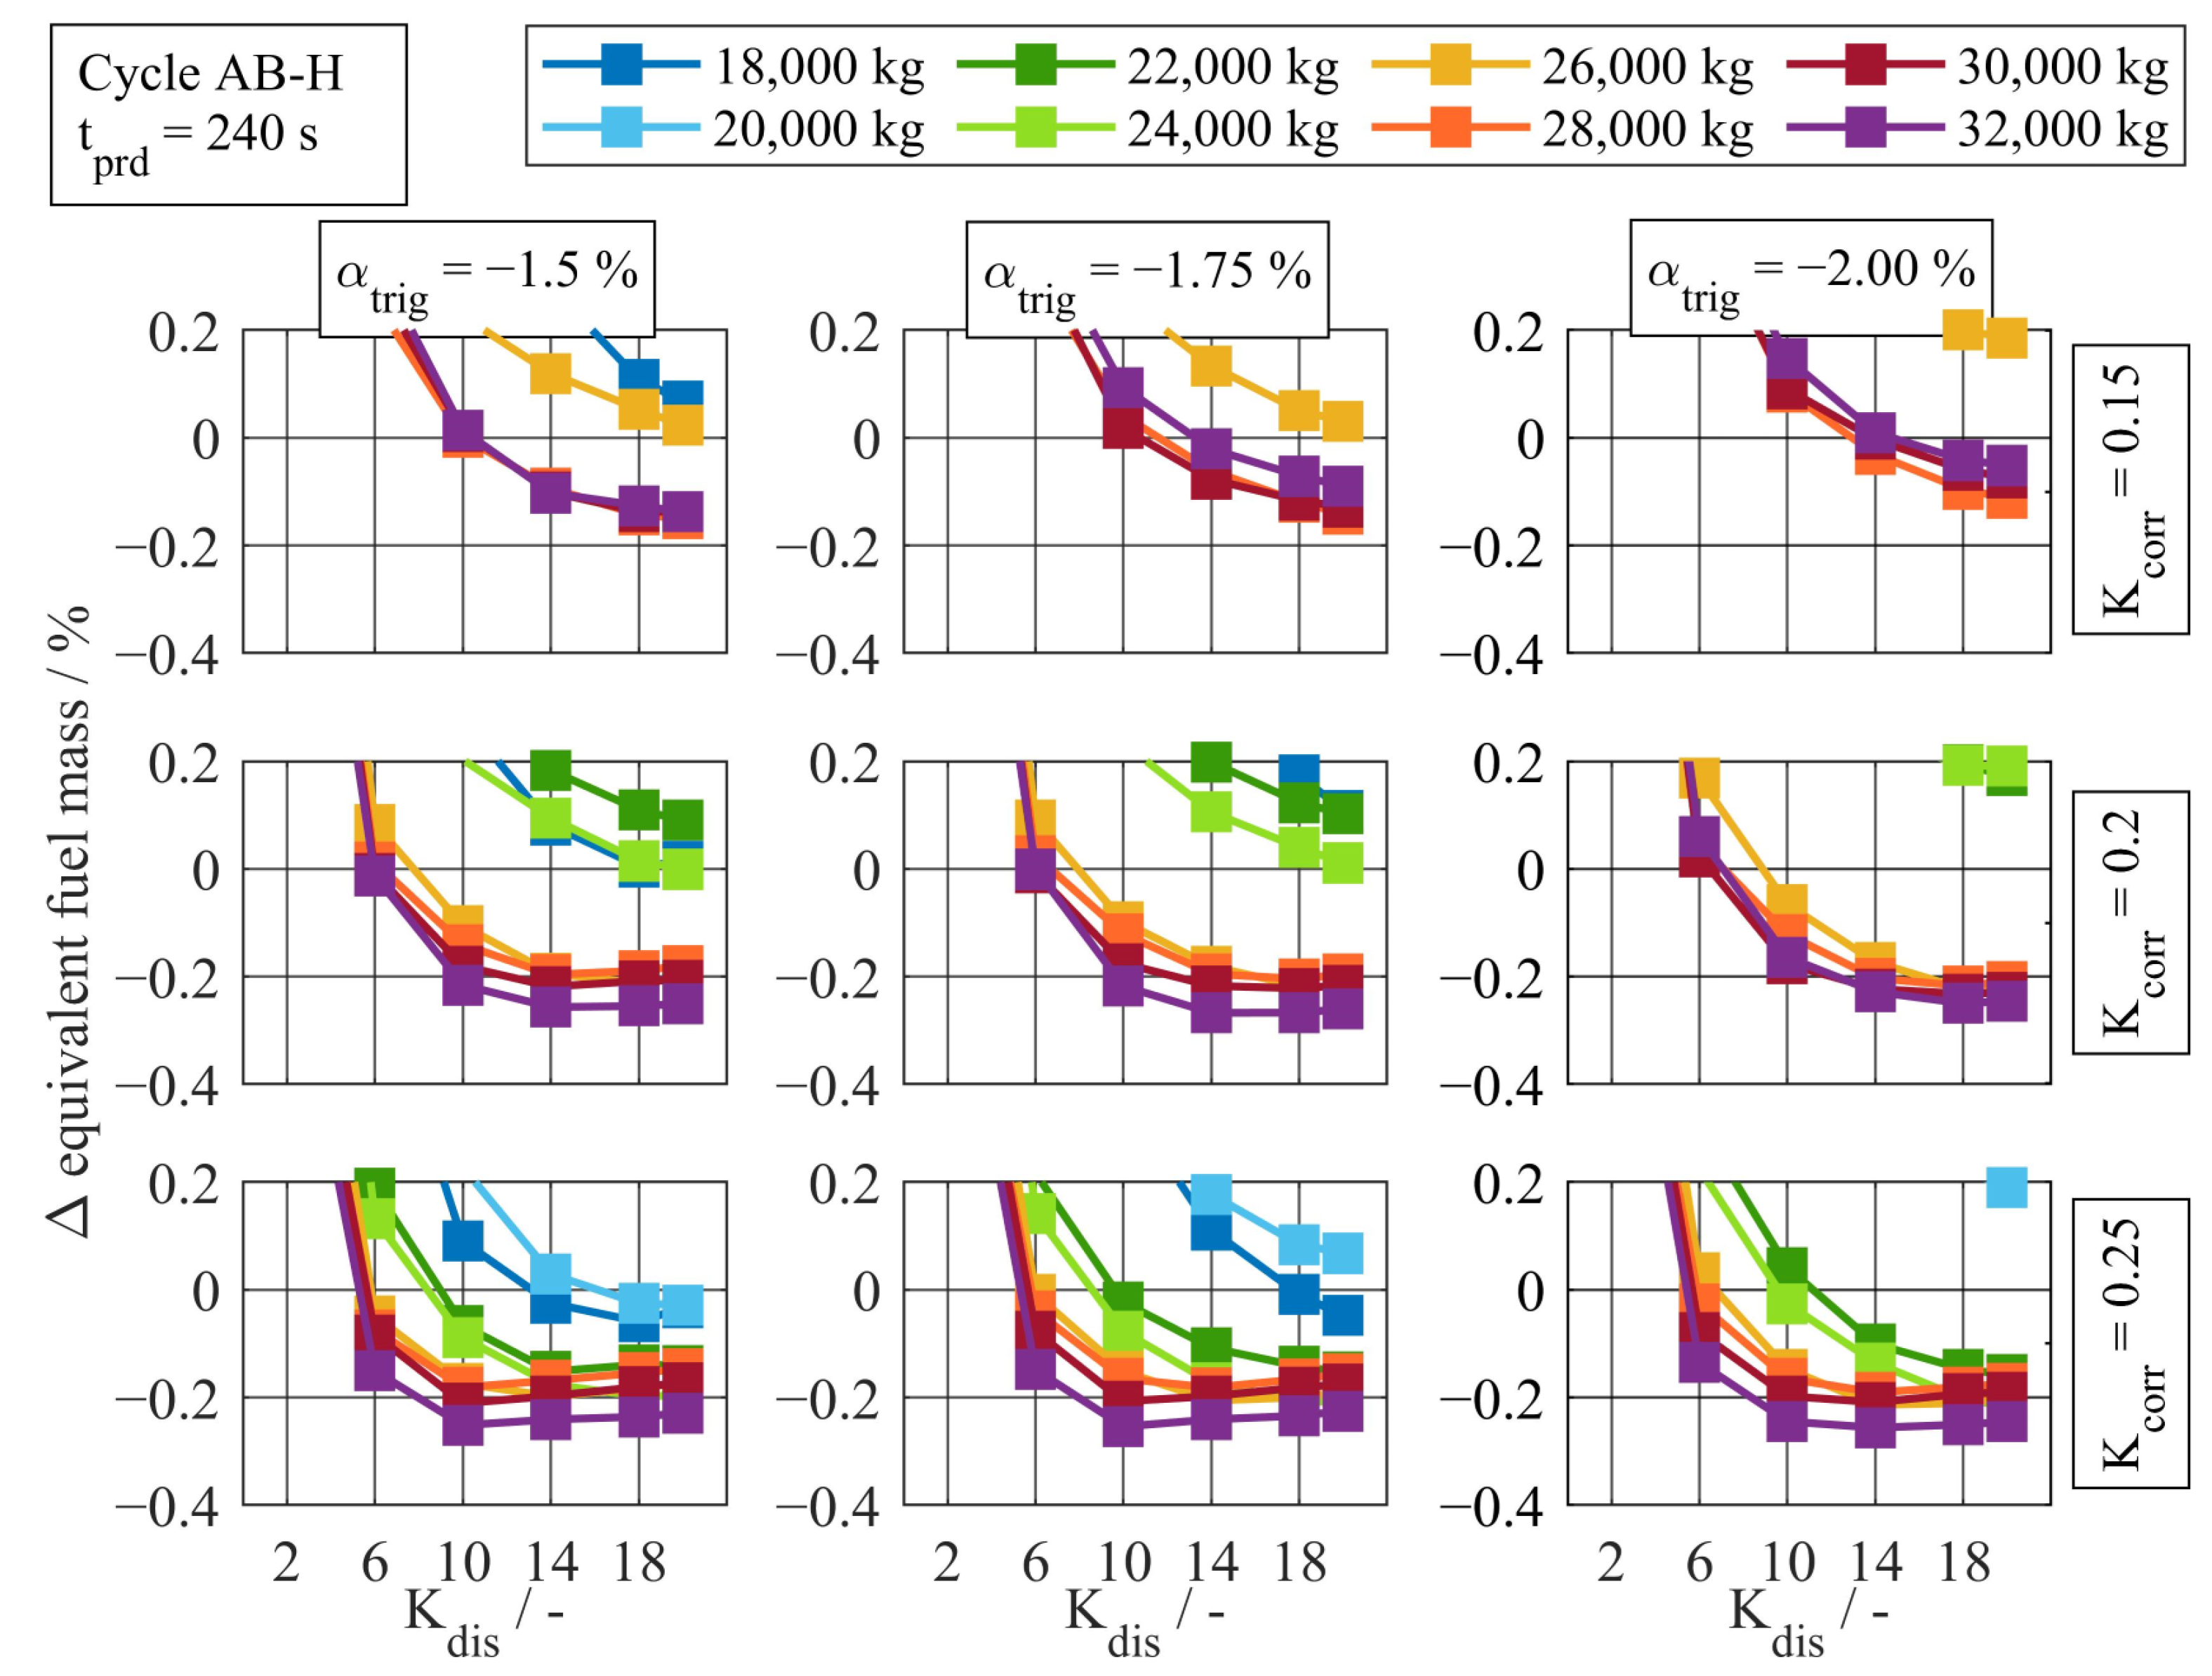
One exemplary part of this full factorial parameter variation is shown in Figure 17. As observed in the partial analysis (see Figure A2), the reduction of equivalent fuel mass is low for low values of K c o r r . Additionally, it can be observed that values of 0.25 for K c o r r increase the saving potential for heavy vehicles the most. The highest reduction potential for low vehicles is obtained with values of around 0.4. For the parameter α t r i g , small negative values are beneficial regarding equivalent fuel consumption. This observation is only true for the driving cycle AB-H due to its distinct height profile. For the height profile of the driving cycle AB-N, higher negative values of α t r i g are favorable (see Figure A2). Regarding the parameter K d i s ,   it can be stated that values lower that 6 lead to an increase of equivalent fuel mass as the predictive discharging is too slow. Here again, the cycle AB-H requires not only an earlier but also faster predictive discharging of the battery than the cycle AB-N. For the latter, the selected K d i s   values lie around 6 while the cycle AB-N requires values around 18 (see Figure A2). The final parameters for the predictive battery discharge functionality can be found in the Appendix C (see Figure A3).

4.3. Predictive Operating Strategy

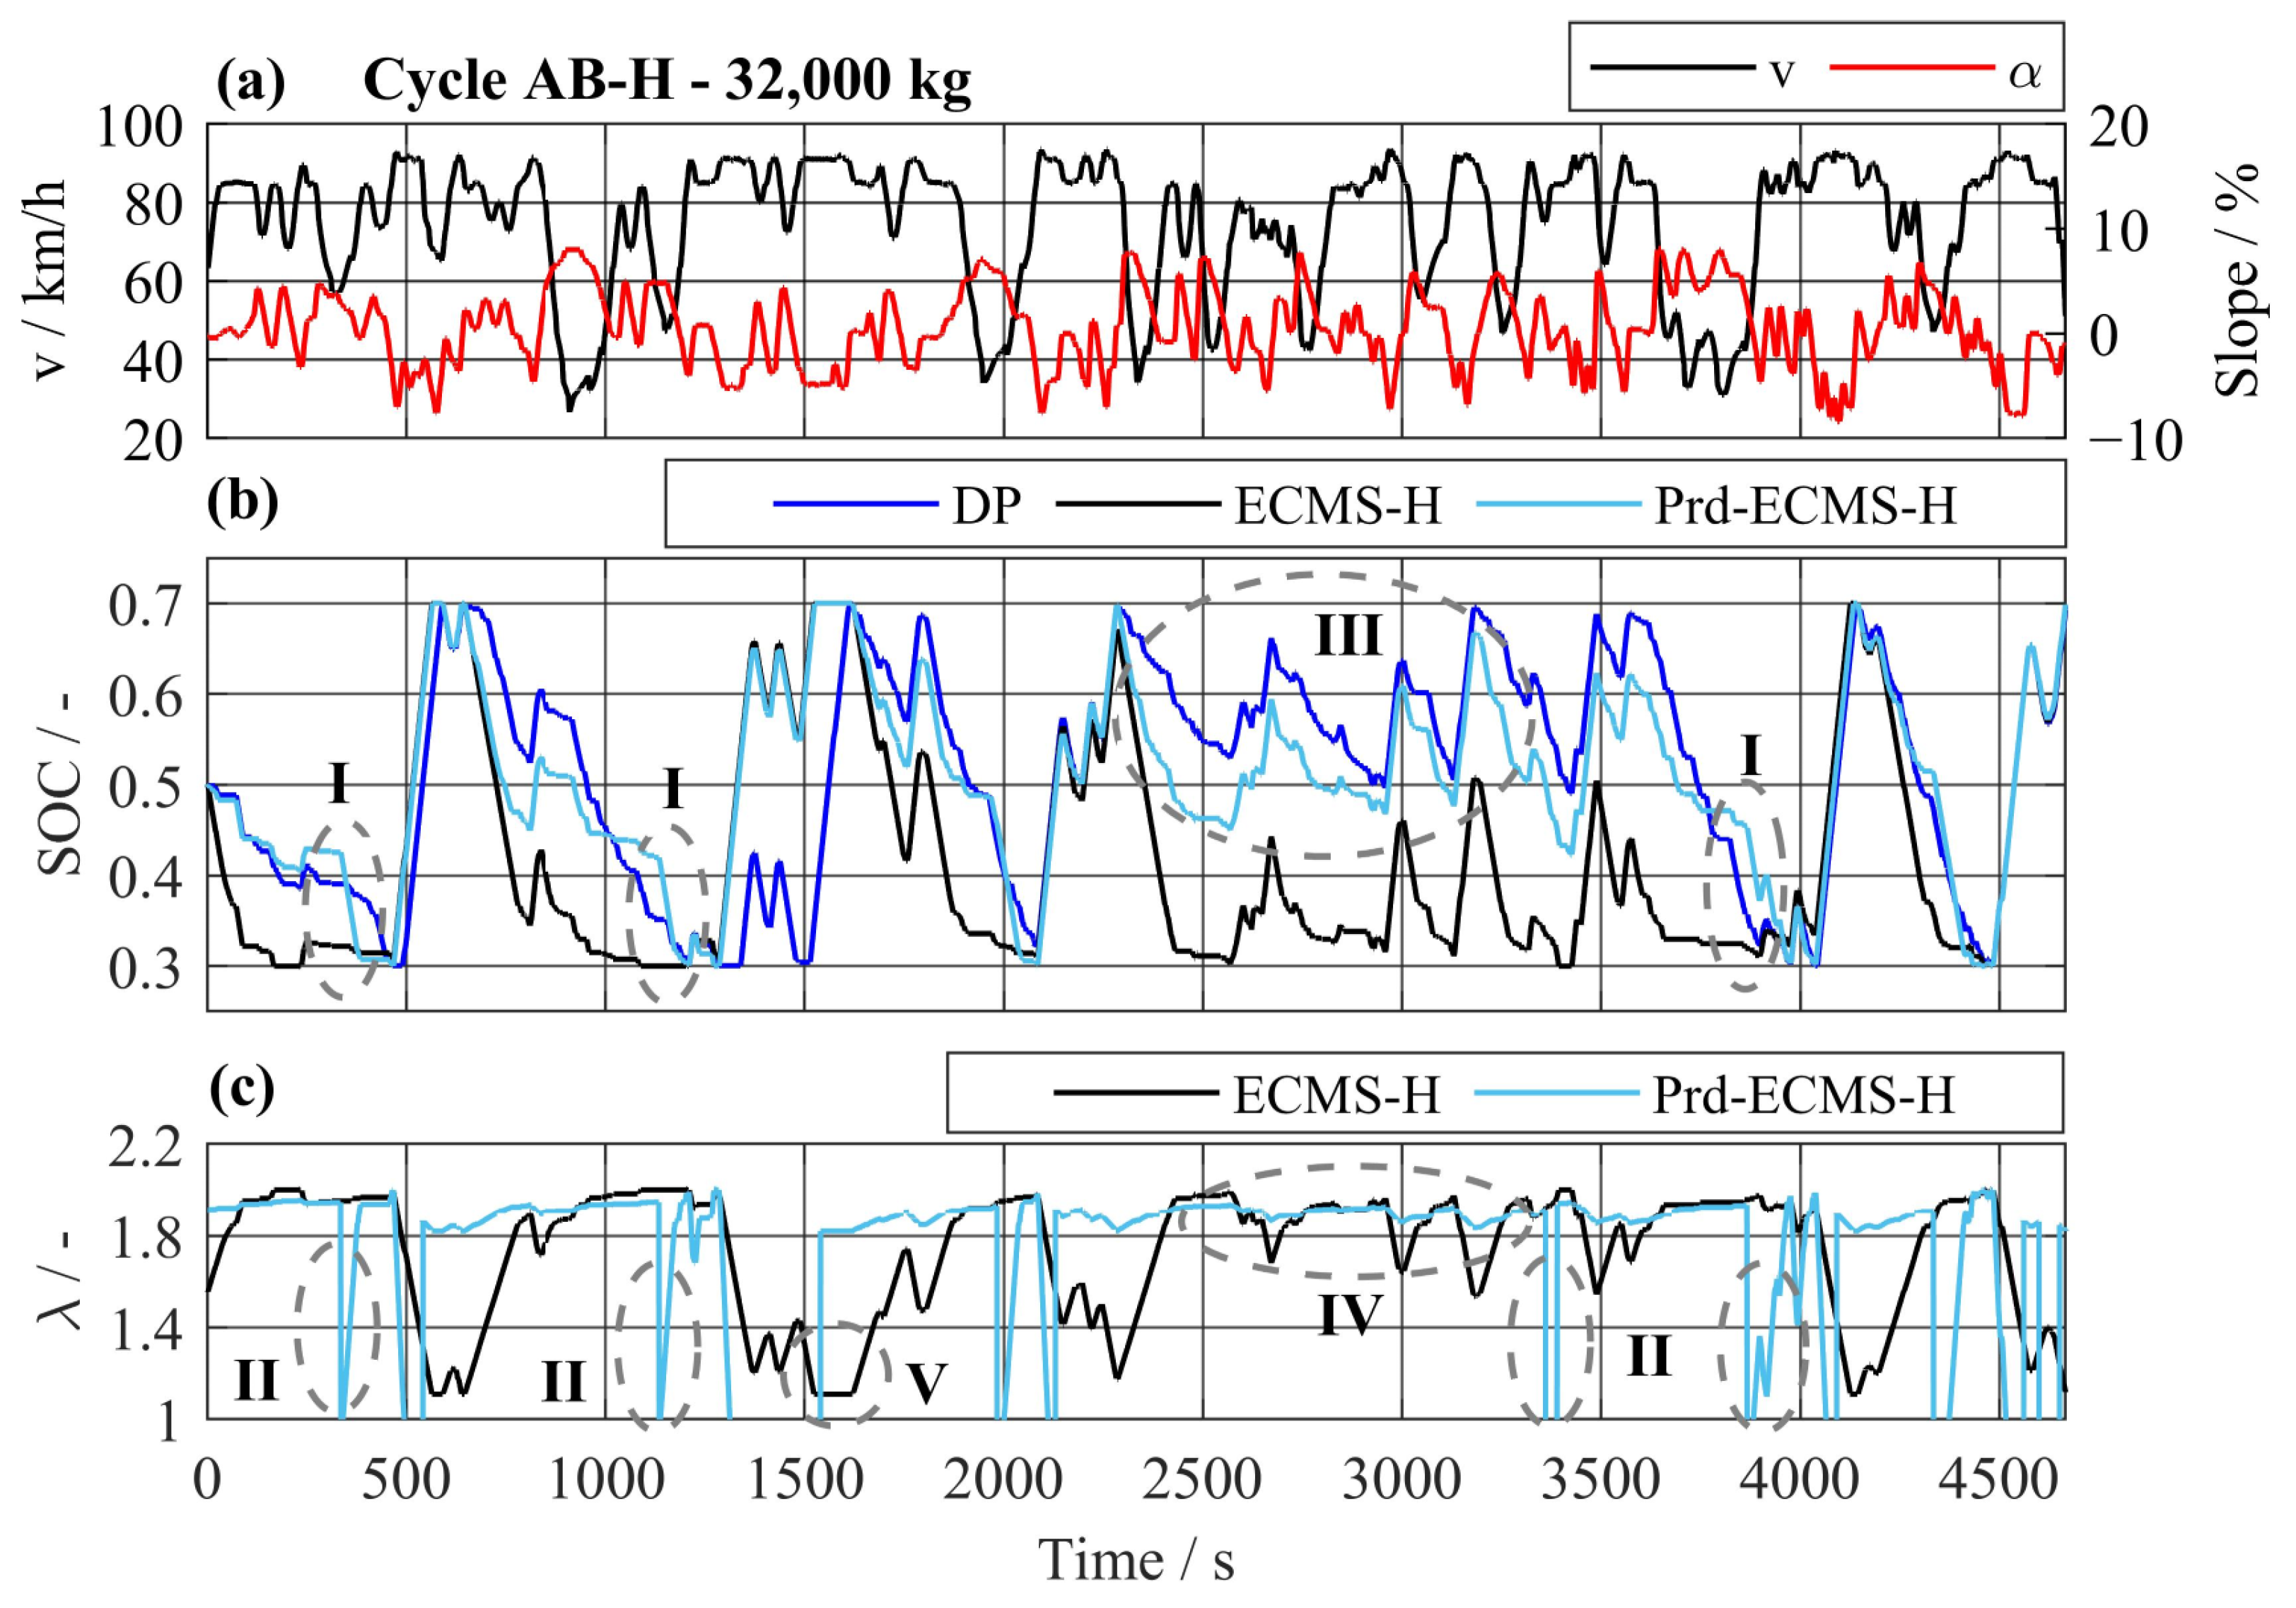
To evaluate how well the extension of ECMS by PBDis imitates the optimal operating strategy, the resulting SOC trajectory is compared to the one of DP in Figure 18. Next to the SOC trajectories in Figure 18b the corresponding dynamic EF λ is plotted in Figure 18c. The predictive discharge of the battery can be observed for the Prd-ECMS-H (I). The high value of K d i s leads to a drop of the dynamic EF λ (II) and therefore realizes an empty battery upfront of a complete charging of the battery. Like the DP, a CS operating strategy can be achieved over a long phase of the driving cycle (III). This is realized by the correction of the basic K values by K c o r r . This leads to a dynamic EF λ that is less sensitive to a change in SOC (IV) and lies in a range between 1.8 and 2.0 while the EF of the basic ECMS drops down to 1.1 for low SOC values (V). Overall, it can be observed that the implemented Prd-ECMS-H leads to the desired flexible CS-CD operating strategy.
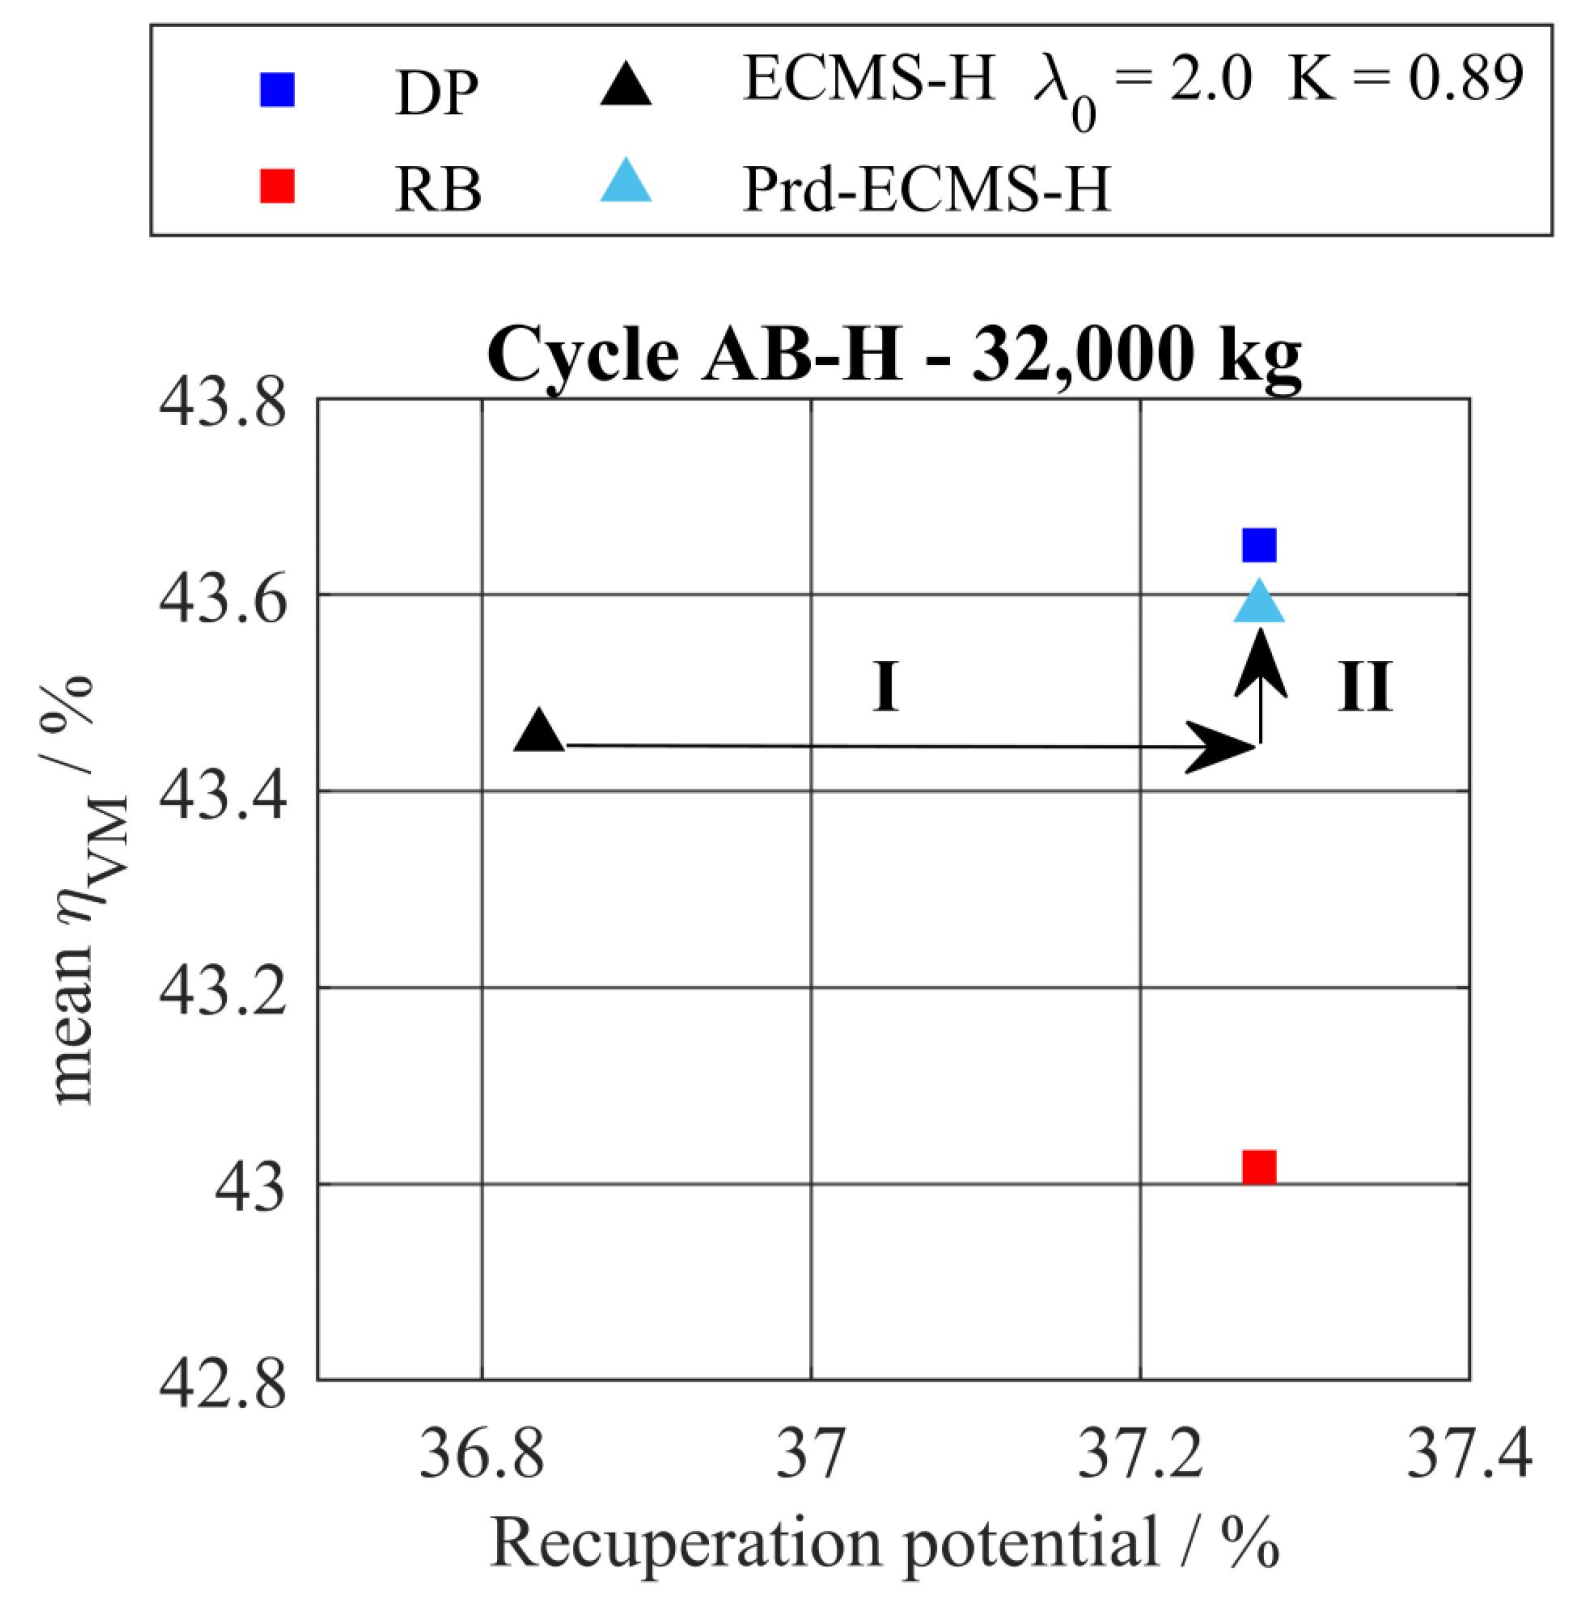
This flexible CS-CD operating behavior is plotted within the state space of the basic tradeoff (see Figure 19). It can be observed that the recuperation potential is maximized by the Prd-CD operating strategy evoked by the PBDis functionality (I). At the same time, the rapid discharge enables longer phases of a CS operating behavior. This leads to an increase in the mean efficiency of ICE (II). The Prd-ECMS-H eliminates the limiting factor of the ECMS-H by a flexible adjustment of the dynamic EF λ prior to long downhill driving situations. Therefore, the solution within the tradeoff delivers improvement in both directions. The remaining gap in the mean efficiency towards DP can be associated with the a priori knowledge of the DP. This leads to a higher degree of flexibility as observed from the SOC trajectories.

5. Advanced ECMS with Predictive Battery Discharge and Driving Condition Recognition

The second challenge in the development process of the intelligent EMS is the adaption of the operating strategy from CD to CS and vice versa. For the detection of the current boundary conditions, an existing concept of a driving cycle recognition is applied and adjusted to recognize not a cycle but the driving conditions. The resulting driving conditions recognition (DCR) function is integrated in the functional structure and combined with the presented PBDis functionality from the previous section.

5.1. Application and Adjustment of DCR for Adaptive Equivalent Factor Selection

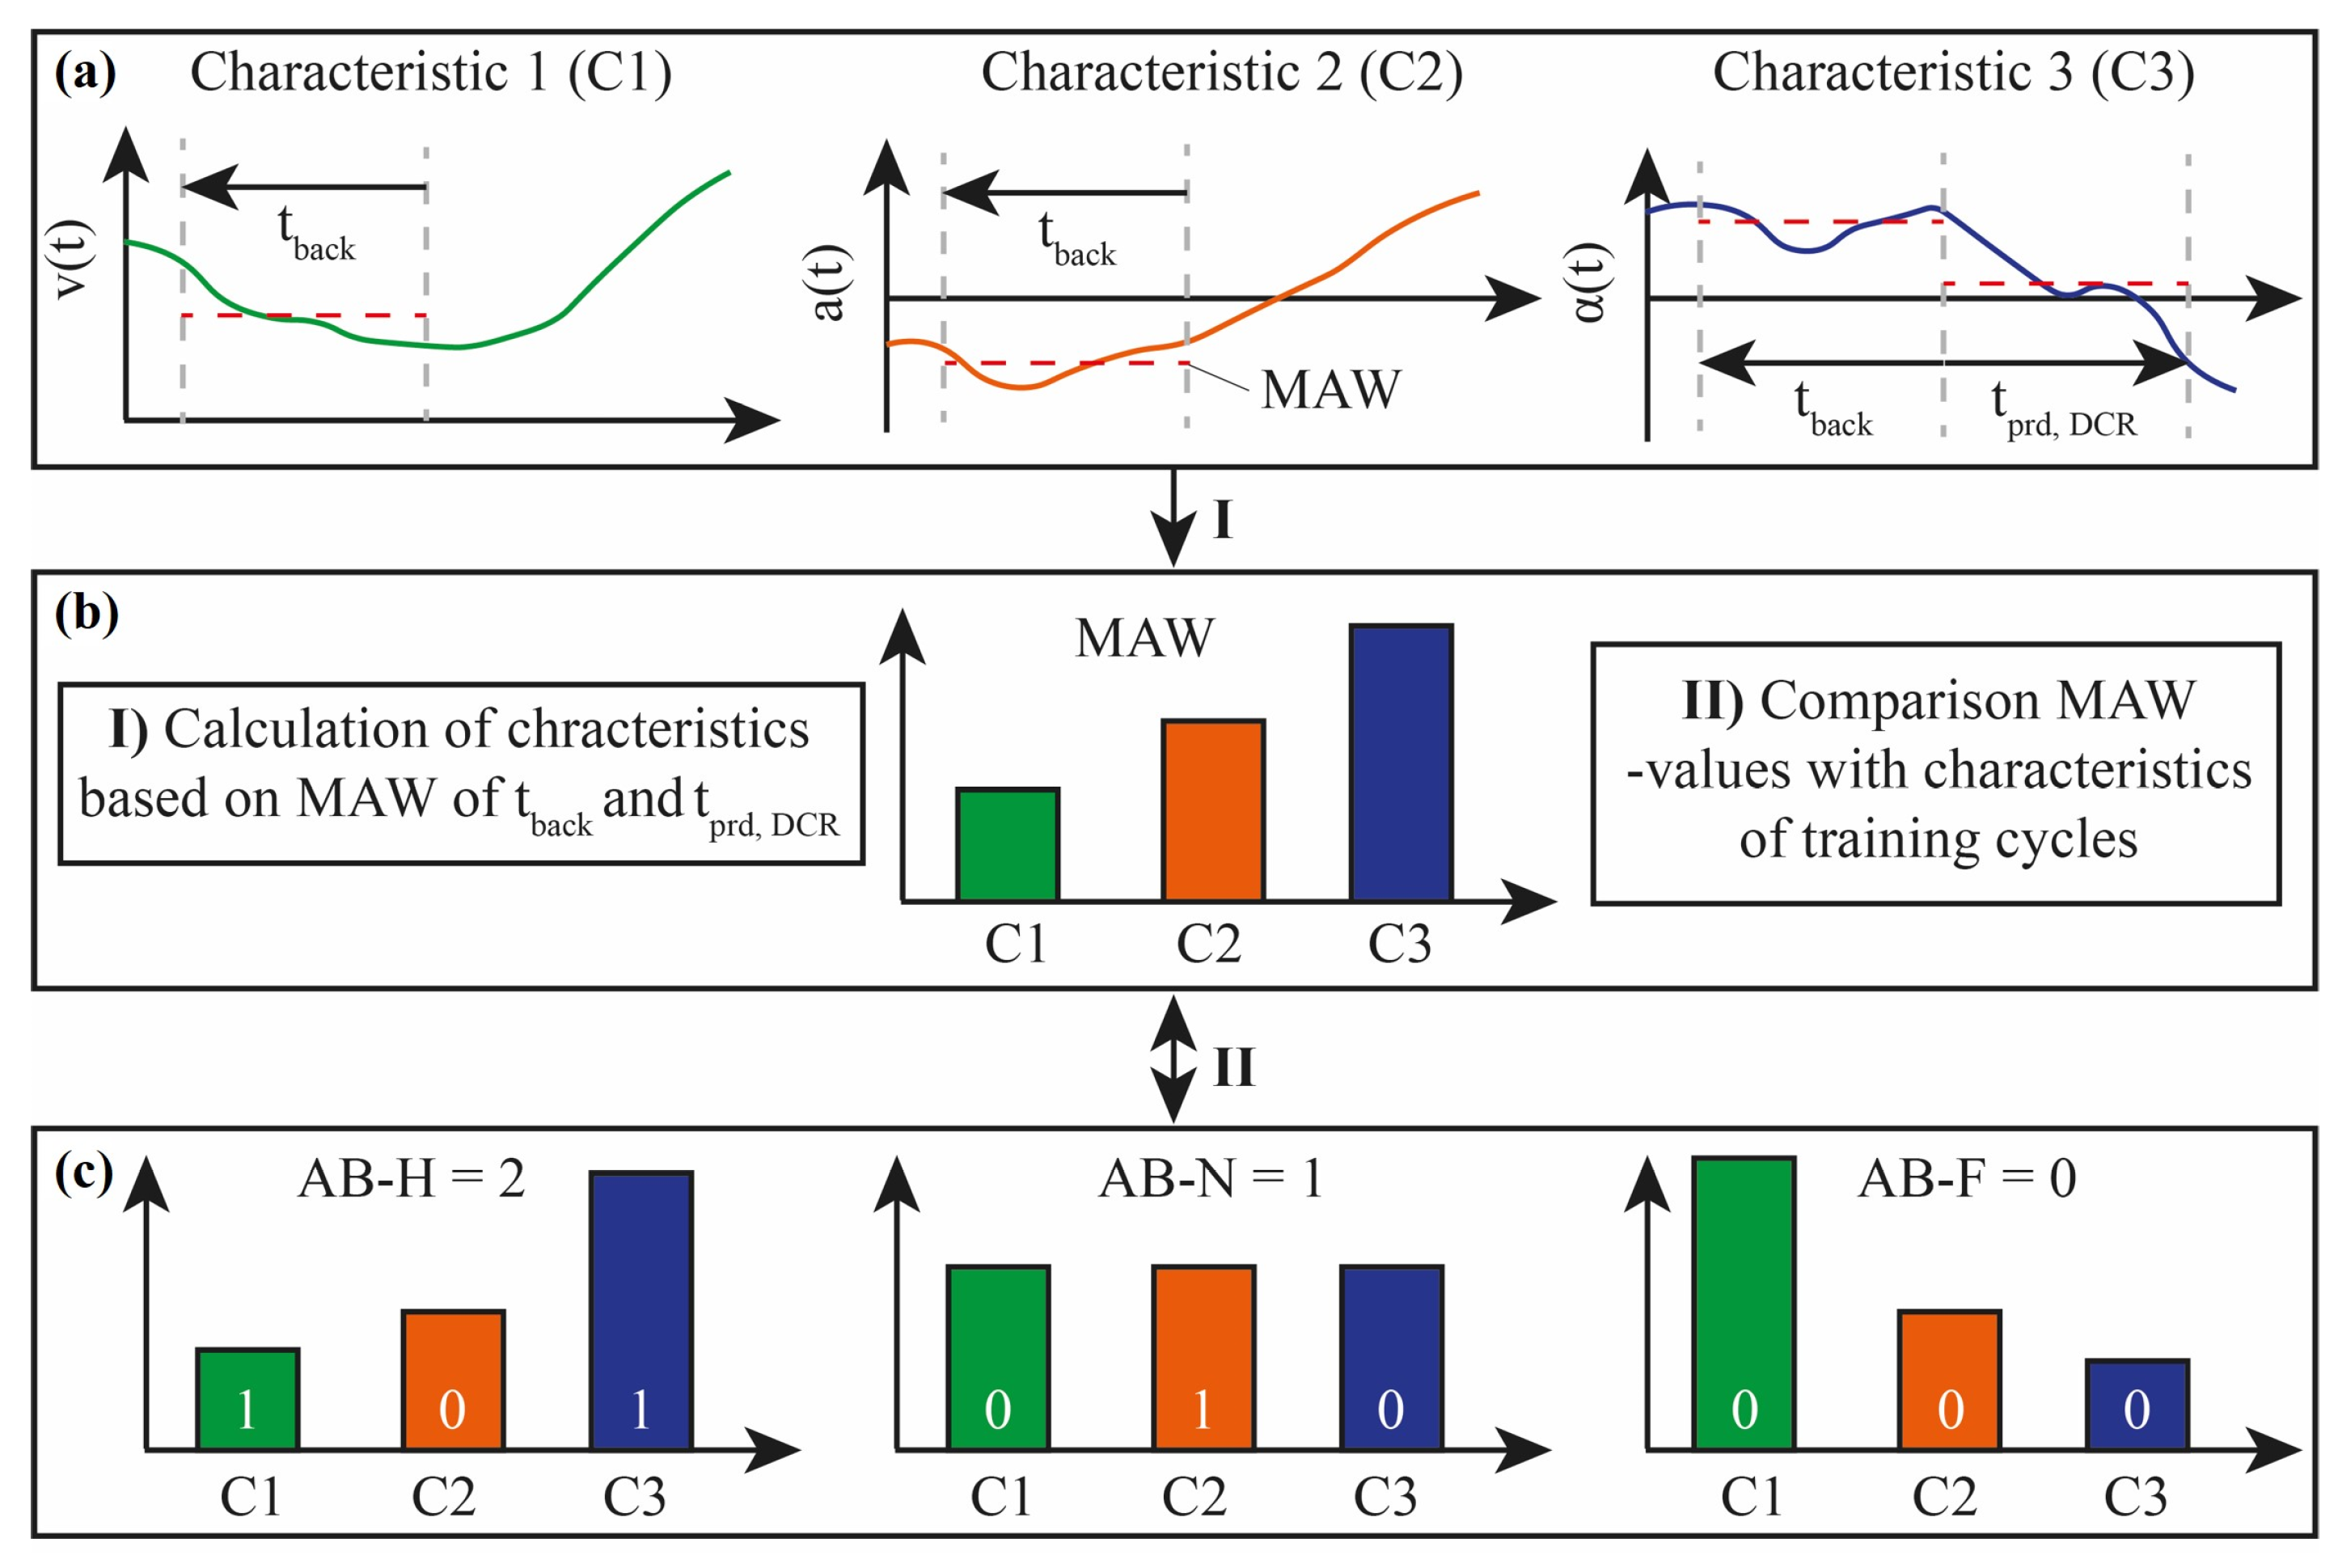
To realize a switching condition between CS and CD operating strategy, an adaption functionality is implemented based on DCR. This is based on the concept presented in [32] and was adjusted and extended for the application of long-haul highway driving. Originally, 24 characteristics of the driving cycle were defined but only considered for past driving situations. In this study, all parameters that contain the road slope (e.g., standard deviation of slope, max. slope, average slope) are also considered with a forward-looking MAW. The principle and the described extension of the DRC is shown for three characteristics of a driving cycle in Figure 20. In box (a), the speed, acceleration and slope of the cycle are sketched. To derive the characteristics of average speed (C1), average acceleration (C2) and average slope (C3) a backward locking MAW is applied. For the road slope a forward-looking MAW is added. This analysis leads to the values of the three characteristics for the considered time frame of the MAW, as shown in the box (b). For the matching of the current driving situation with one of the three training cycles, the nearest neighboring method is applied. All 24 characteristics of the current driving situation are compared to the overall characteristics of the training cycles. The training cycle where the characteristics are the closest gains a point. The cycle that scores the highest after all comparisons is allocated to the current driving situation, as shown in the bottom plot. Here, the values of C1 and C3 of the driving cycle AB-H match best to the characteristics of the current driving situation.

5.2. Structure of the Implemented ECMS

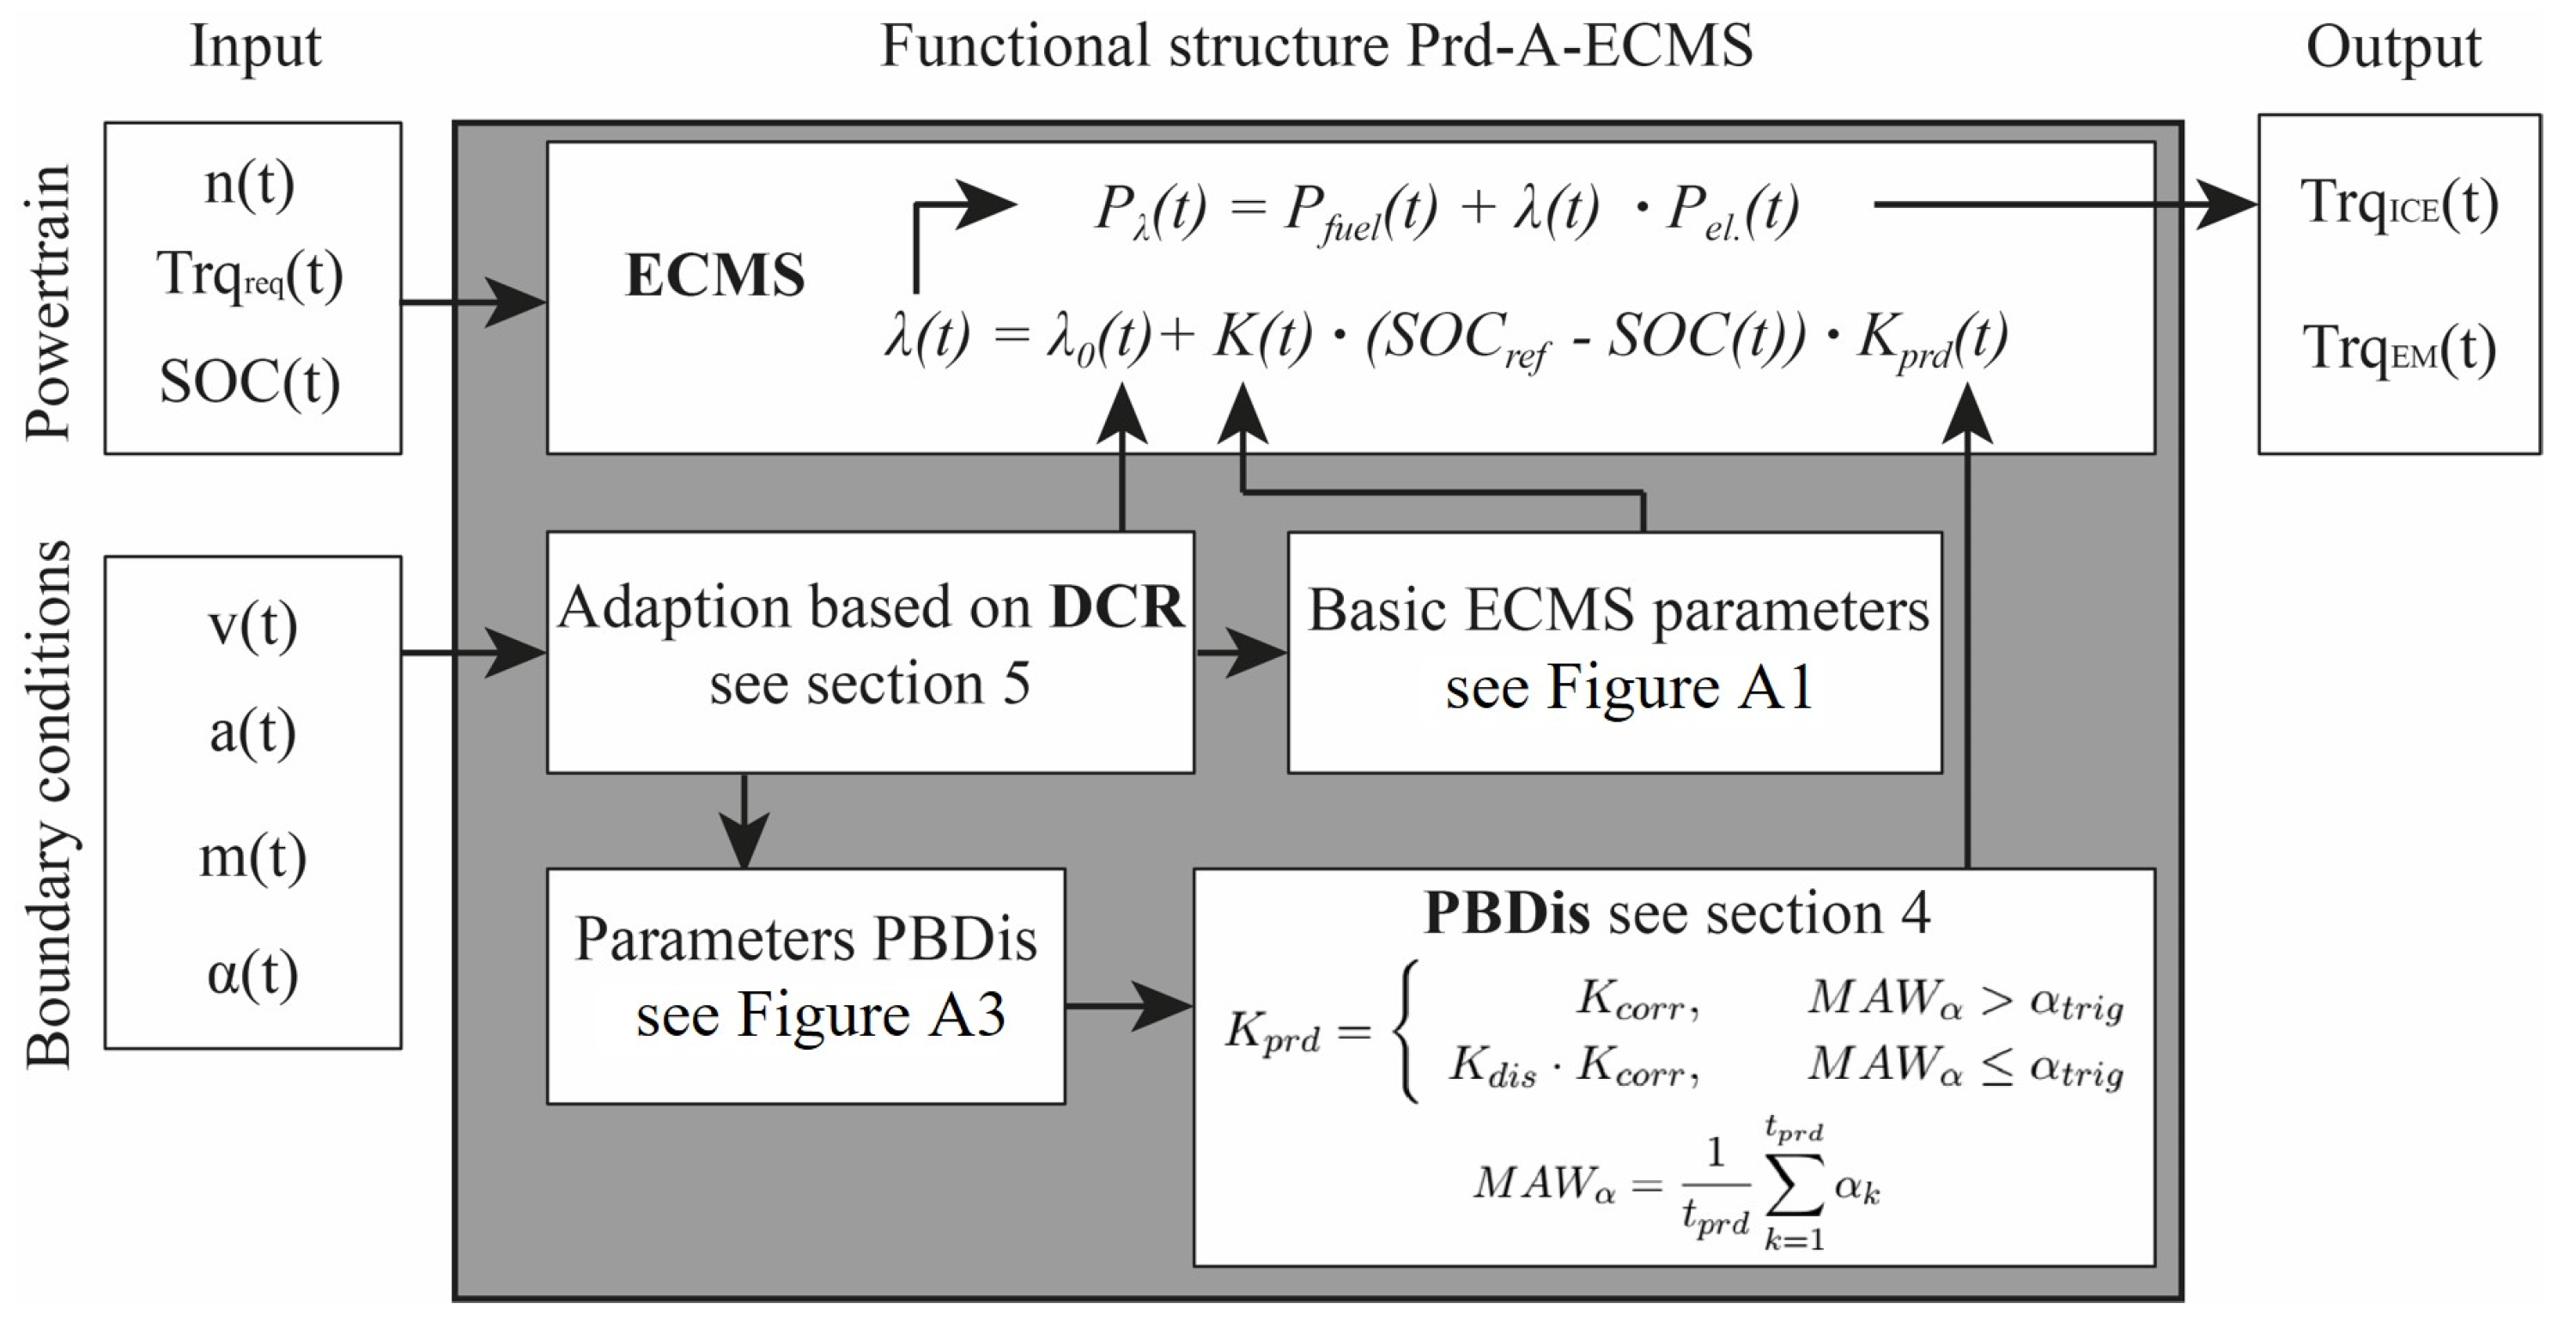
The comprehensive combination of the ECMS, the PBDis functionality and the DCR in one functional structure creates the Prd-AECMS, as shown in Figure 21. On the top layer is the ECMS where the calculation of the dynamic EF λ is carried out. Based on the input of powertrain parameters and boundary conditions, the torque of both power converters is defined as the output. On the second layer, the DCR is implemented to select the parameters for the calculation of the dynamic EF λ . Depending on the recognized driving conditions, it chooses the corresponding λ 0 and K values for the lookup tables (see Figure A1). Thus, either a CS or CD operating strategy is chosen. If a change in boundary conditions is detected by the DCR, an adaption of the operation strategy is realized. On the third level, the PBDis function also receives its parameter based on the recognized driving conditions and the derived look-up tables (see Figure A3). It feeds the resulting parameter K p r d up to the top level of the extended ECMS approach.

5.3. Analysis of Operating Strategy of Intelligent ECMS

The question is if the developed Prd-AECMS can improve the average efficiency of the ICE and the recuperation potential for an unknown driving cycle. To answer this, the resulting equivalent fuel mass of the Prd-AECMS is compared with the Prd-ECMS-N and DP on the test cycle AB-FNF (see Figure 22). The results from the grid iteration for this specific cycle are taken as the basis for this comparison. It can be observed that only the Prd-ECMS-N performs less well than the basic ECMS for low vehicle masses. On average, it can be observed that the Prd-AECMS reaches half of the saving potential of the global optimal approach of the DP. With increasing vehicle mass, the delta between the predictive Prd-ECMS-N and the intelligent Prd-AECMS becomes smaller. For the highest vehicle mass, these two EMSs lead to a similar effectiveness regarding equivalent fuel mass.
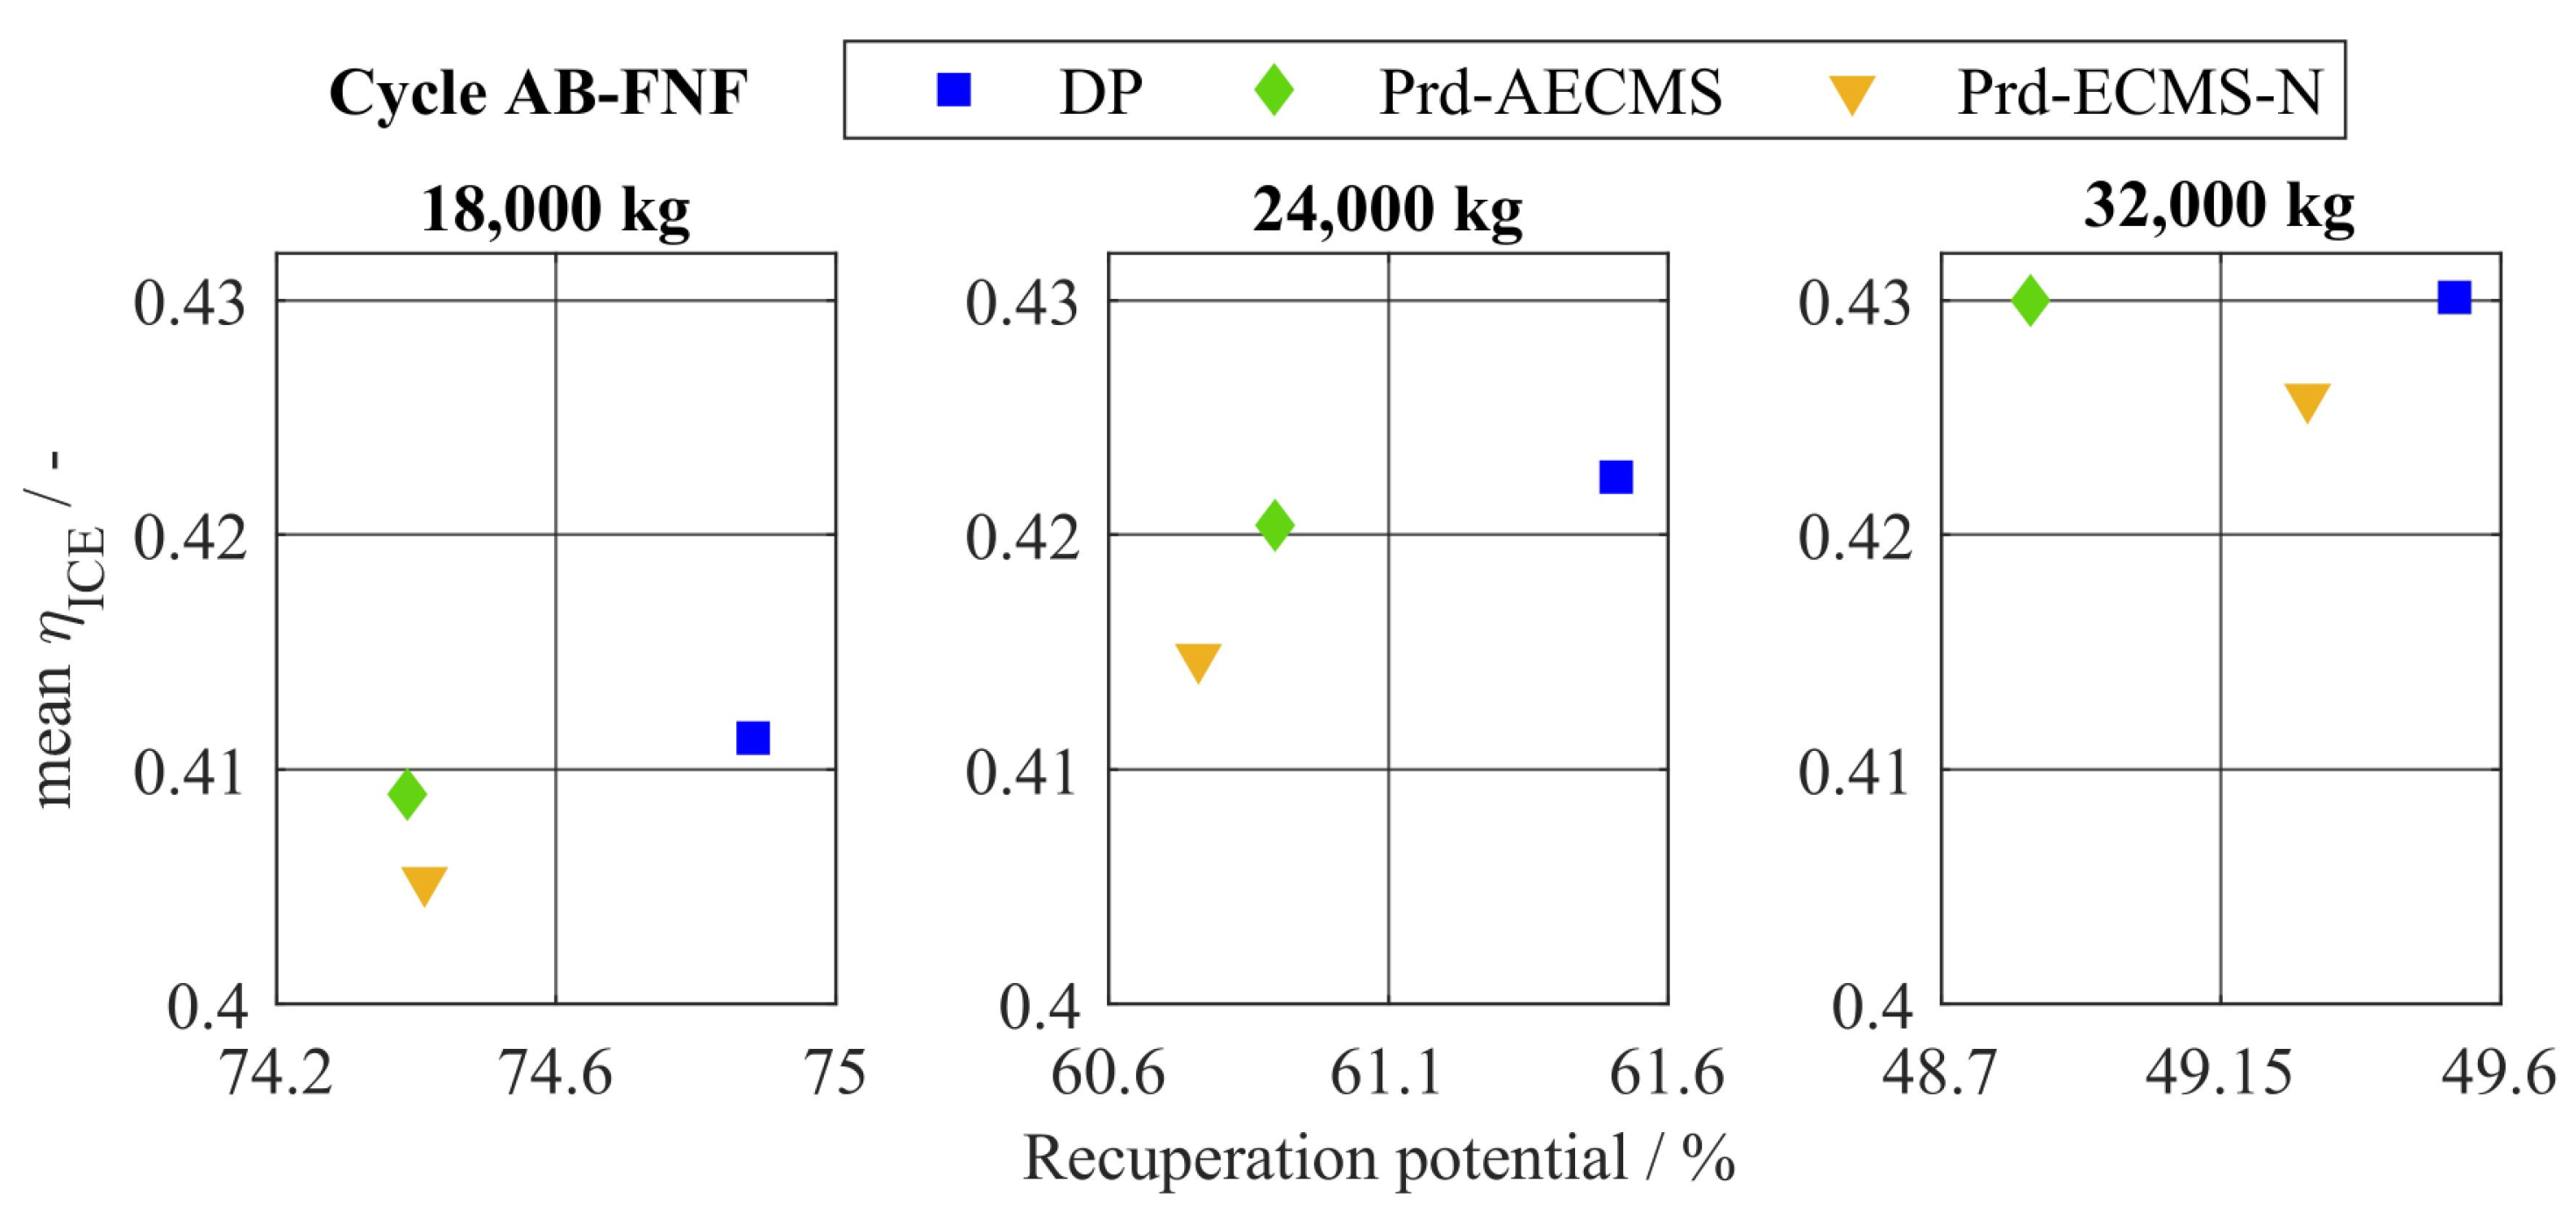
To investigate the effectiveness further, with focus on the highest vehicle mass, the tradeoff between average efficiency of ICE and recuperation potential is analyzed. The different EMSs are scattered within the state space of the tradeoff for three different vehicle masses as shown in Figure 23. For the vehicle masses of 18,000 kg and 24,000 kg, the Prd-AECMS can improve the average efficiency compared with the Prd-ECMS-N. As both EMSs are using the PBDis, the recuperation potential is almost the same. For a vehicle mass of 32,000 kg, the recuperation potential of the Prd-AECMS is the worst out of the three compared EMS. This could be caused by a negative effect of the combination of DCR and PBDis. Such a negative effect could be due to the usage of a suboptimal operating strategy due to an overly sensitive adaption. To identify the reasons for that negative impact, the SOC trajectories are analyzed in the next paragraph.
The SOC trajectory and the chosen operating strategy is displayed in Figure 24 for an extract of the driving cycle AB-FNF. In Figure 24a, the change of height profile and a corresponding change in the speed profile can be observed. While the vehicle speed is constant and the height profile is flat at the beginning (AB-F), it changes to a fluctuating height and speed profile in the section of AB-N. In Figure 24d, the chosen operating strategy of the Prd-AECMS is plotted. If a flat driving cycle is detected by the DCR, a λ 0 value of 2.5 is chosen to create a CS operating strategy. If a hilly driving cycle is recognized, a λ 0 value of 2.0 is selected, which leads to a CD operating strategy. A predictive discharge of the battery is labelled as Prd-CD. In Figure 24b, it is shown that the operation strategy of the Prd-AECMS leads to a similar SOC trajectory as the one of DP. The Prd-ECMS-N, which only uses PBDis but no DCR, leads to a CD operating strategy in the first half of the shown extract of the cycle AB-FNF (I). The Prd-AECMS is able to create a CS operating strategy due to switching conditions realized by the DCR. In the second half, it can be observed that the detection of the driving cycle by the DCR is sensitive. This sensitivity results in a CS operation strategy where a CD operation strategy is required. A too-late switch from a CS to a CD operating strategy (IIa) and the sensitivity (IIb) lead to a reduction of recuperation potential. Even the PBDis function cannot deplete the battery completely before the long downhill driving situation. This explains the negative impact on the recuperation potential for a high vehicle mass. The sensitivity of the DCR results from short sections of the driving cycle AB-N, where the speed profile and height profile are similar to driving cycle AB-F. A longer predictive horizon t p r d , D C R cloud reduces the sensitivity on this specific cycle. However, parameter variations have shown that a longer predictive horizon would reduce the effectiveness for a majority of other vehicle masses and cycles.

6. Comparison of EMS and Discussion of the Results

In this section, the simulation results of the Prd-AECMS are compared against the other EMSs for all driving cycles and the variation of vehicle mass. First, the fuel saving potential that is gained from the PBDis is evaluated against the basic ECMS. In a second step, the Prd-AECMS is evaluated against the Prd-ECMS-N, as this EMS is tuned for the mean height profile of the Autobahn network. By this two-stage analysis, the fuel saving potential can be allocated towards the predictive feature or the adaptive feature. In addition, the equivalent fuel mass is correlated with the boundary conditions of height profile and the vehicle mass. Finally, the Prd-AECMS is compared to the RB and the DP to quantify the fuel saving potential against the state-of-the-art and the global optimal solution.

6.1. Impact of Predictive Discharge—PBDis

To evaluate the fuel saving potential gained by the predictive functionality, the Pred-ECMS-N is compared to the ECMS-H, as shown as a scatter band in Figure 25a. The global optimum from DP is set as the reference. The impact of the predictive functionality for low vehicle weights is low and only results in minor fuel saving potential. The reason for that is that the operating strategy of the ECMS-N imitates that of the DP. For high vehicle loads, the ECMS-N leads to an operating strategy close to that of RB (see Figure 13). Hence, the potential for improvement is bigger at high vehicle loads. The analysis of the fuel saving potential regarding the height profile shows that the Prd-ECMS-N also yields saving potential on flat driving cycles compared to the ECMS-N. There is no Prd-CD operating strategy required, but the correction of the K values by K c o r r leads to a slower discharge of the battery and therefore increases the mean efficiency of the ICE (See Figure 24 period of driving cycle AB-F). This effect results in a fuel saving potential of up to 0.7% (Ia) for flat driving cycles and high vehicle masses. On driving cycles with distinct height profiles, the flexible CS-CD operating strategy enabled by the PBDis leads to a saving potential of 0.3% (IIa).

6.2. Adaption of Operating Strategy—DCR

The fuel saving potential resulting from Prd-AECMS is plotted as a scatter band in Figure 25b. It can be observed that the addition of the DCR and its possibility to adapt the operating strategy has no impact on driving cycles with a distinct height profile. A switching between CS and CD operating strategies is not required as the vehicle is operated mainly with a CD operating strategy due to the distinct height profile. The impact increases with a flattening of the height profile. For flat driving cycles, the Prd-AECMS leads to a fuel saving potential of 1% (IIb) and 0.5% (Ib) compared with the Prd-ECMS-N for a low and high vehicle mass, respectively. Compared with the RB, a total fuel saving potential of 2% (IIIb) can be achieved for a low vehicle mass. For a distinct height profile and a high vehicle mass, the Prd-AECMS still leads to 0.5% (IVb) fuel saving compared with RB. The reduced fuel saving potential for a distinct height profile and a high vehicle mass results from a different load spectrum of the ICE. The increased power demand shifts the operating points of the ICE close to, or even above, the sweet spot regarding efficiency. The advantage of the optimization-based EMS diminishes in these regions of operation, as shown in [25]. A final comparison of the Prd-AECMS against DP shows that only 0.3% (Vb) further fuel saving potential is achievable for high vehicle masses. Even for low vehicle masses, the DP performs only 0.5% better (VIb).

6.3. Discussion

The main question of how the full potential of HEV-HD trucks can be achieved was broken down into two main challenges. First, the tradeoff between the average efficiency of the ICE and the recuperation potential was solved. The PBDis functionality maximizes the recuperation potential on hilly driving cycles and thereby leads to a flexible operating strategy that solves the tradeoff in both directions. Secondly, a switch between a CD and CS operating strategy was necessary. The implementation of the DCR enables the adoption of the operating strategy to ensure high average efficiency of the ICE on flat driving cycles. To ensure that these challenges are met for real driving conditions, a variation of height profile and payload was considered. The combination of both features in the Prd-AECMS enables these benefits also for unknown and changing boundary conditions.
A comparison of the identified fuel saving potential with other published work shows alignment with the magnitude. Ref. [26] shows a fuel saving potential of up to 2% for an HEV-HD truck with predictive recuperation. Ref. [22] states a fuel saving potential of up to 3% for an HEV-MD truck. The trend of the fuel saving potential in dependency of the vehicle weight and height profile is confirmed. While the 3% fuel saving potential is observed for light road slope and low vehicle weight, the saving potential decreases with increasing road slope and vehicle weight. The higher fuel saving potential due to an intelligent EMS of 3% compared to 2% can be explained by the higher overall fuel savings of HEV-MD trucks. As shown in [33], the overall fuel saving potential of HEVs compared to conventional vehicles decreases with an increase of vehicle weight. However, in [23], a fuel saving potential of 3% to 14% for a HEV-HD truck is identified. That investigation is based on standardized driving cycles without height profiles, while this paper features real driving conditions with a focus on the height profile. Hence, a direct comparison is not valid.
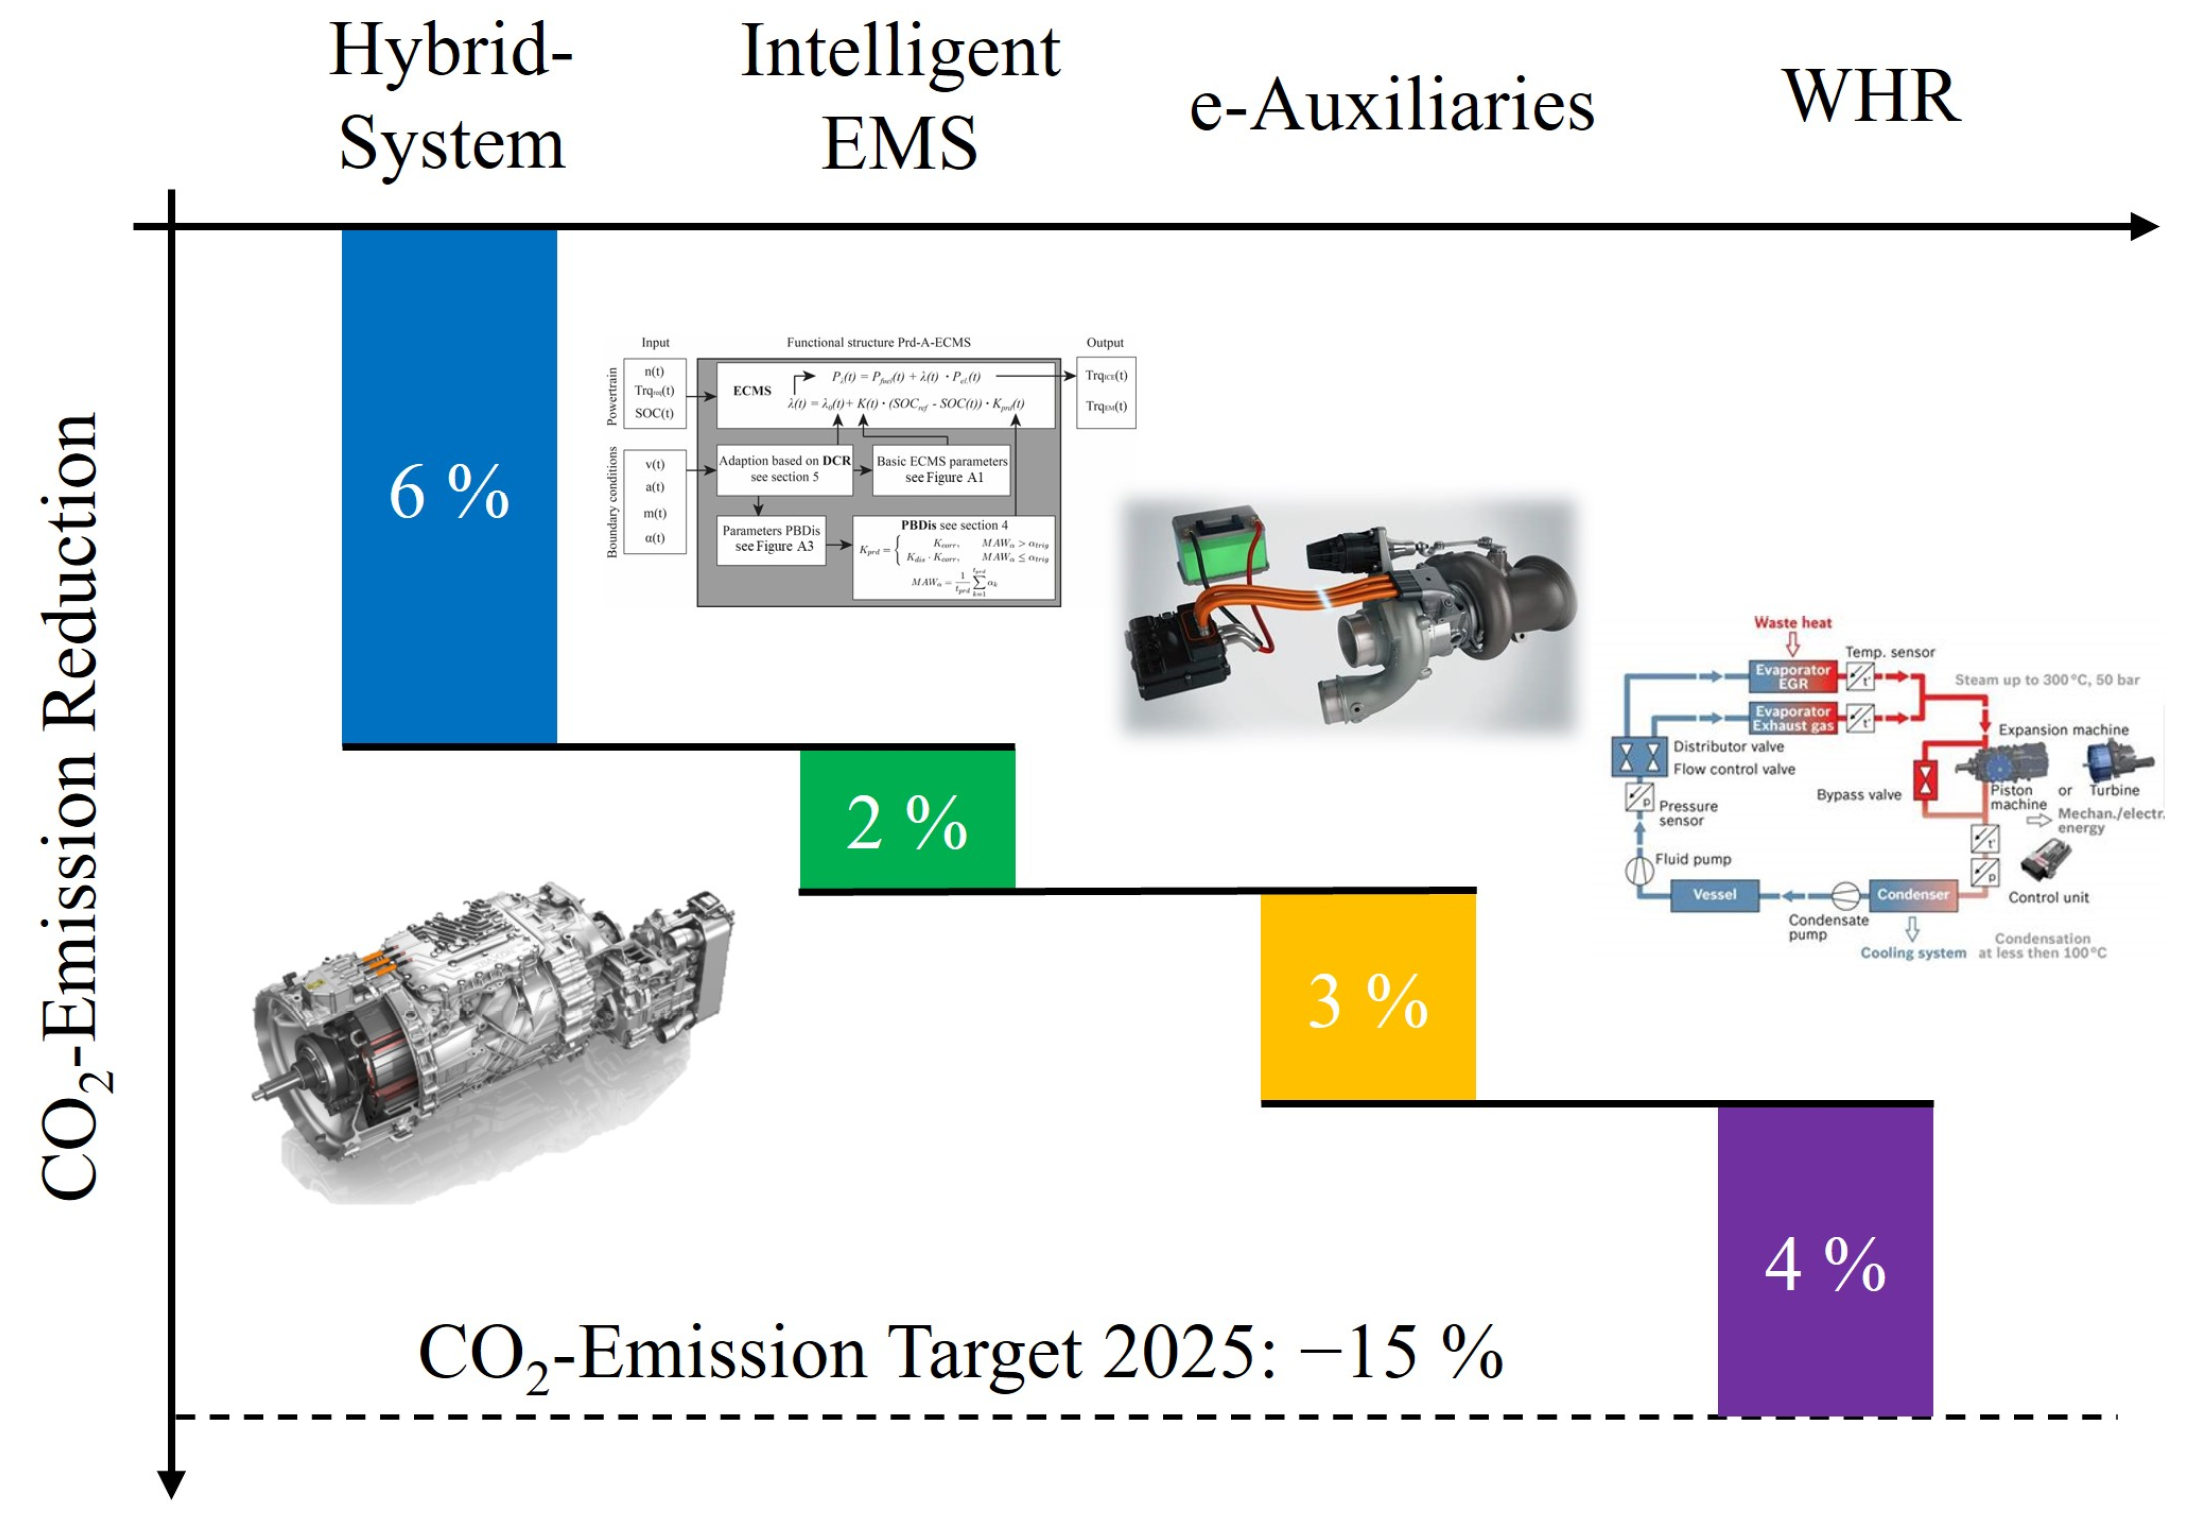
The identified fuel saving potential by an intelligent EMS under real driving conditions is valuable knowledge regarding future HD trucks that need to achieve lower CO2 emissions. The fuel saving potential of possible powertrain efficiency measures are plotted in Figure 26. While a hybrid system itself can lead to a fuel saving potential of 6–8% [33,34], an intelligent EMS can add up to 2% fuel saving. Further fuel saving measures such as e-components and a waste heat recovery (WHR) system can add another 3% [35,36] and 4–5% [37,38], respectively. The design of the powertrain and auxiliaries itself is of significance, as well as the control of the powertrain, as documented in [39,40]. The 2025 CO2 emission reduction target of 15% can only be achieved by a combination of all measures. However, the potential of these measures depends on the application and therefore can vary.
Hence, further research is suggested to increase the impact of intelligent EMSs regarding the CO2 emission targets for 2025 and 2030. As mentioned in Section 3.3, the recharging of the battery by load point shifting of the ICE is neglected in the proposed EMS. Preliminary investigations indicate that a further 0.5% of fuel saving potential can be yielded for low vehicle weights and flat driving cycles by the optimal control of DP. Another suggestion for further research is an extension of the investigated driving cycles. Next to pure highway cycles, cases such as regional delivery or hub-to-hub delivery should be included. Even though the number of driving cycles in this study was limited, the results are nevertheless quite clear and plausible. Another benefit of a broader set of training cycles would be that the adaption of the operation strategy would react less sensitively. To overcome this limitation in an effective way, ref. [41] presents an approach to synthesizing realistic driving cycles. The implementation of an intelligent gear shifting controller can also be included in further work [42]. The combination of the gear shifting controller and the EMS can yield another fuel saving potential.
The application of a flexible CS-CD can be used as a blueprint for future HD truck powertrain technologies. The availability of electric energy in the battery, especially in hilly driving conditions such as the Alps, becomes more and more important when there is no diesel engine in the powertrain anymore. This necessity becomes clear when the real driving data of [43] are analyzed. In over 1750 h of operation, fuel cell electric vehicle (FCEV) trucks were tested in a broad range over Europe, but not the Alps. The limiting factor is the high cooling demand of the fuel cell in long uphill driving situations. Here, a full battery prior to these long uphill driving situations could mitigate this limitation, as the battery can assist the fuel cell with the power supply. A possible application of the proposed EMS on FCEV trucks is the inversion of the predictive battery discharge to a predictive battery recharge, as sketched out in Figure 27. As a long hill climb approaches, a predictive battery charge function (PBChrg) could ensure that the battery is fully charged at the beginning of the climb. During the climb, the local efficiency optimization of the ECMS determines the operating strategy. The PBDis acts if the battery is not completely empty at the top of the mountain.
Therefore, the impact of the results is not only significant for fulfilling the first target of 15% reduced emissions by 2025, but also for technologies such as FCEV that will be available in the second half of the decade. The developed and applied EMS brings us closer not only to achieving the CO2 emission reduction targets, but also to zero-emission mobility of commercial vehicles by transferring the results onto future powertrain technologies.

7. Conclusions

The main challenge to optimizing the fuel saving potential of HEV-HD trucks is the intelligent use of the recuperated energy to assist the combustion engine during propulsion. This challenge is formulated as the tradeoff between the recuperation potential and the mean efficiency of the diesel engine. The proposed EMS solves this tradeoff by the intelligent combination of ECMS and predictive discharge of the battery. The further addition of an adaptive functionality to adjust the operating strategy considers changing boundary conditions. This leads to a fuel saving potential of up to 2% compared to a heuristic approach. The comprehensive analysis of saving potential in the dependence of vehicle mass and height profile deepens the knowledge about intelligent EMSs under real world driving conditions. This complements the existing research on this topic, as many research papers use synthetic driving cycles neglecting height profiles and a variation in the vehicle mass. The innovative combination of predictive battery discharging in combination with the presented DCR is new to the field of EMSs for heavy duty hybrid trucks, as its necessity only becomes obvious under real driving cycles. The resulting potential contributes to various efficiency measures to achieve the strict CO2 emission targets imposed by the EU. The proposed EMS can also be transferred on to future powertrain technologies in the HD-truck segment which goes beyond emission targets for 2030.

Author Contributions

Conceptualization, methodology, investigation, visualization, writing—original draft preparation, S.S.; resources, G.F.; writing—review and editing, supervision, funding acquisition, G.F. and S.P. All authors have read and agreed to the published version of the manuscript.

Funding

This research resulted from the program “ANFAHRT” (NRW Forschungskooperationen U & FH), which was funded by the Ministry of Innovation, Science, and Research of the State of North Rhine-Westphalia (Reference Number: 312-8.03.04.03-2012/01). The authors thank the Ministry for their generous support.

Data Availability Statement

The data are not publicly available due to involvement of a 3rd Party which includes a non-disclosure agreement.

Conflicts of Interest

The authors declare no conflict of interest.

Appendix A. Equivalent Fuel Mass

Not all EMSs have the same SOC at the end of each driving cycle. To compensate this SOC offset and to ensure a fair comparison, the equivalent fuel mass is used (A2). The calculation is based on the same approach as the static EF (18). The delta of energy in the battery is transferred into a delta energy of fuel and added to the real fuel mass used during the cycle:
Δ E f u e l = Δ E B A T ·   η ¯ B A T · η ¯ E M η ¯ I C E ,                           S O C ( t s ) <   S O C ( t e ) Δ E B A T η ¯ B A T · η ¯ E M · η ¯ I C E   ,                           S O C ( t s ) > S O C ( t e )  
m f u e l ,   e q u i . = m f u e l + Δ E f u e l H U

Appendix B. Parameters λ 0 and K for Training Cycles

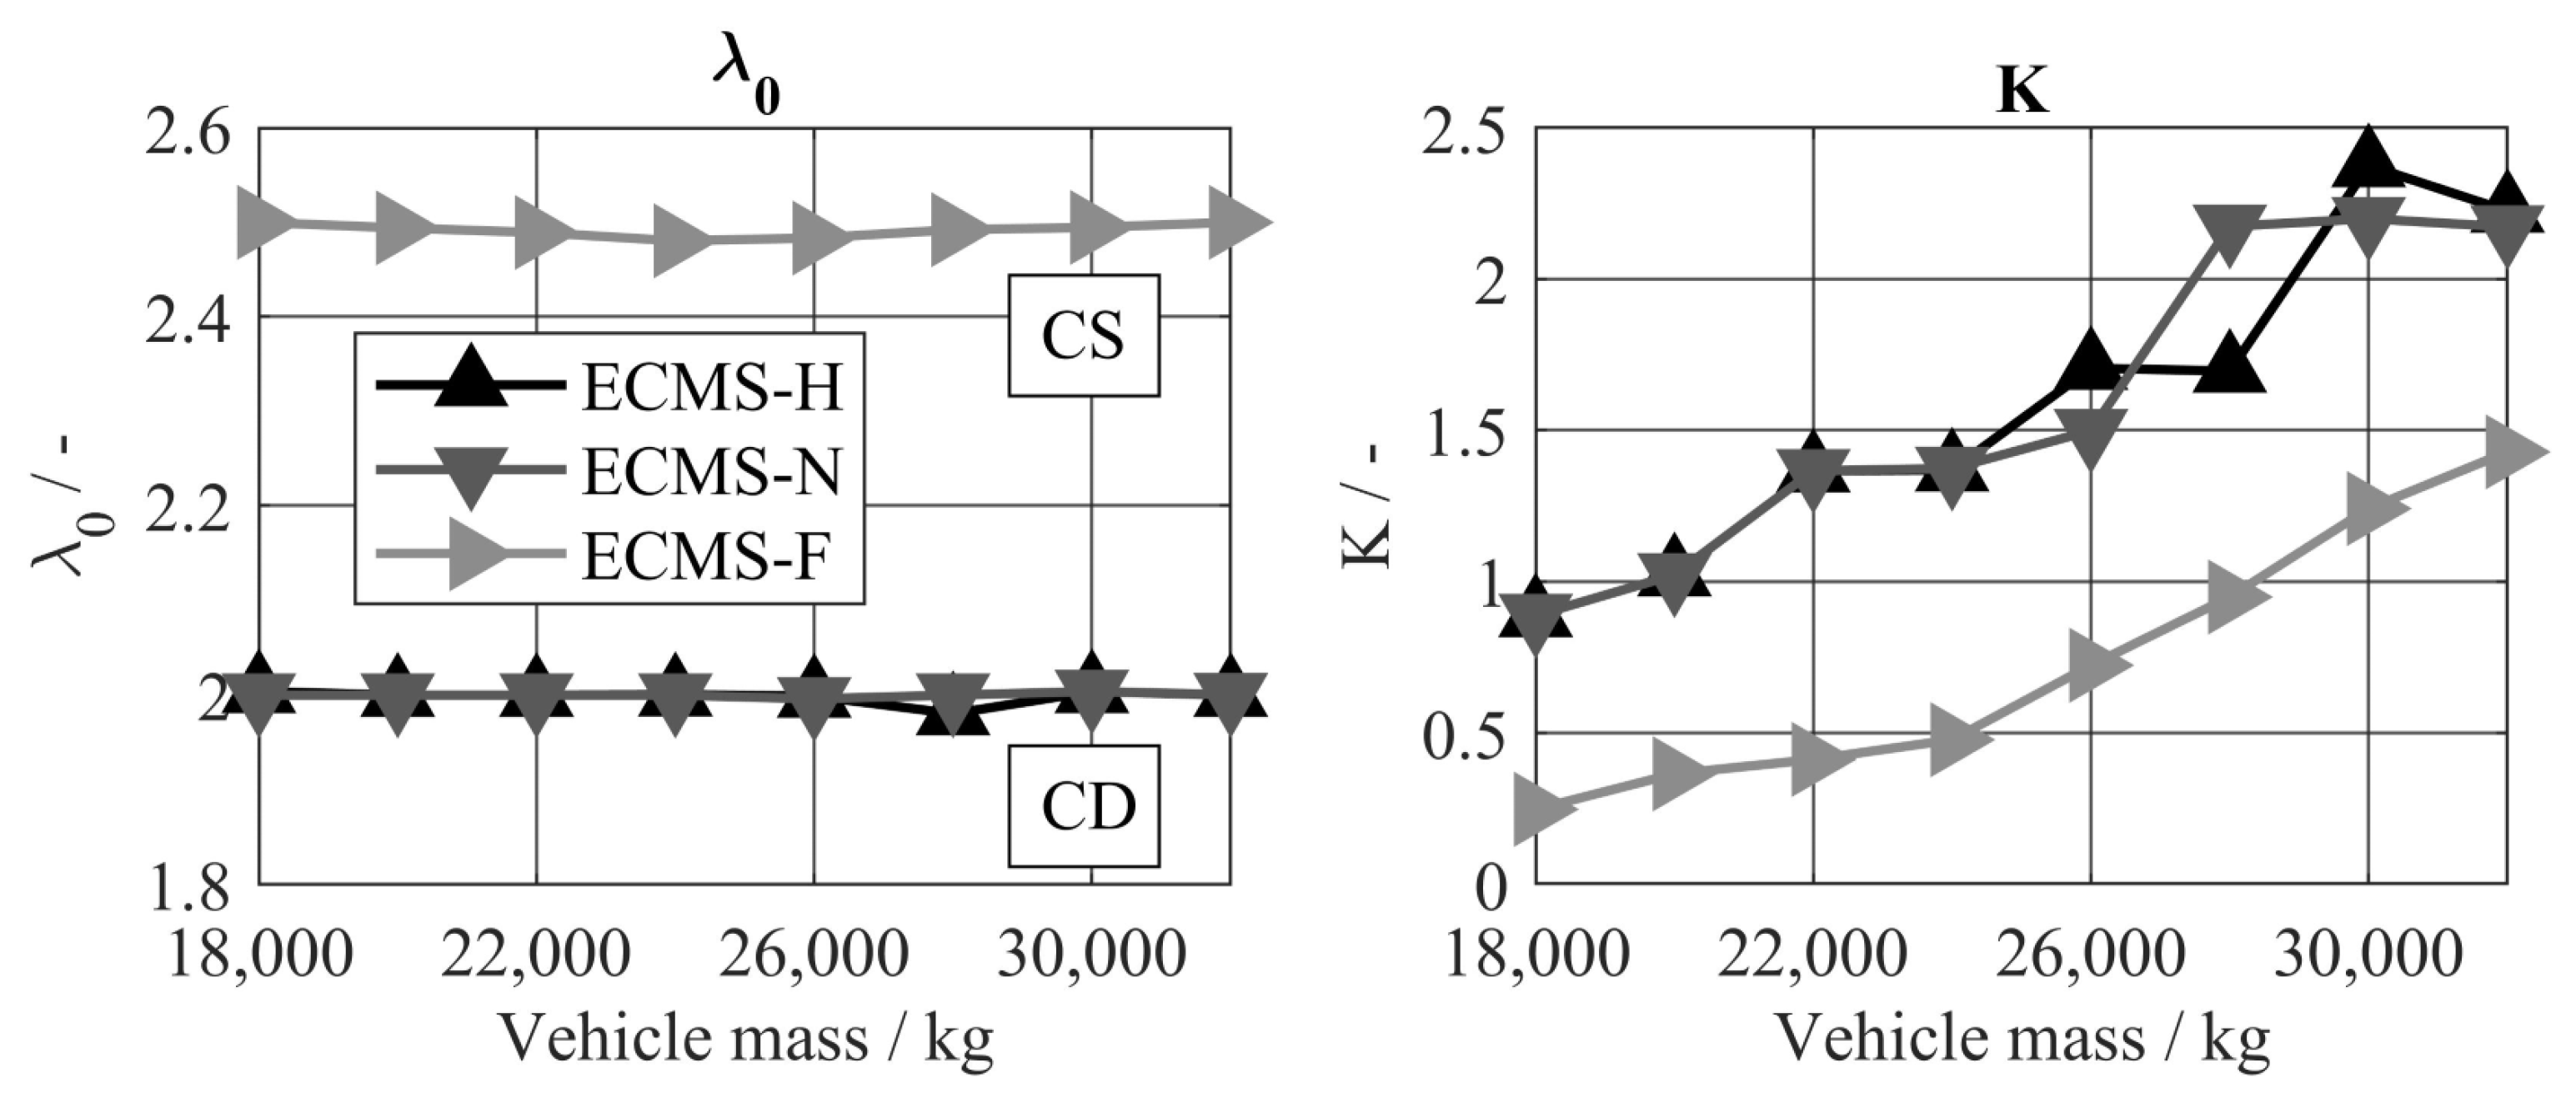
The identified parameter sets of λ 0 and K that lead to the minimal equivalent fuel mass on the three training cycles are shown in Figure A1. It can be observed that the driving cycles AB-H and AB-N require a CD operating strategy, as the basic EF λ 0 is 2, independent of the vehicle mass. This can be explained by the height profile, which requires a recharge over the whole DoD during downhill driving. In contrast to that, the flat height profile of the driving cycle AB-F requires a CS operating strategy for all vehicle masses to gain the minimal equivalent fuel mass. The impact of the vehicle mass can be observed in the trajectories of K . With increasing vehicle mass, the value of K increases, which leads to a faster discharge of the battery, as observed in Figure 13. As a heavier vehicle leads to a higher amount of potential energy, the amount of energy that can be recuperated increases. To ensure that the maximum amount of energy is recuperated, a faster discharge of the battery is realized by the increased K -values.
Figure A1. The basic calibration is done to identify the right operation strategy to the investigated boundary conditions—CD operating strategy for hilly and CS operating strategy for flat driving cycles.
Energies 16 05171 g0a1

Appendix C. Parameters α t r i g , t p r d , K c o r r and K d i s for Training Cycles

Figure A2. Influence of parameter variation of K c o r r on equivalent fuel mass for different driving cycles and different vehicle masses.
Energies 16 05171 g0a2
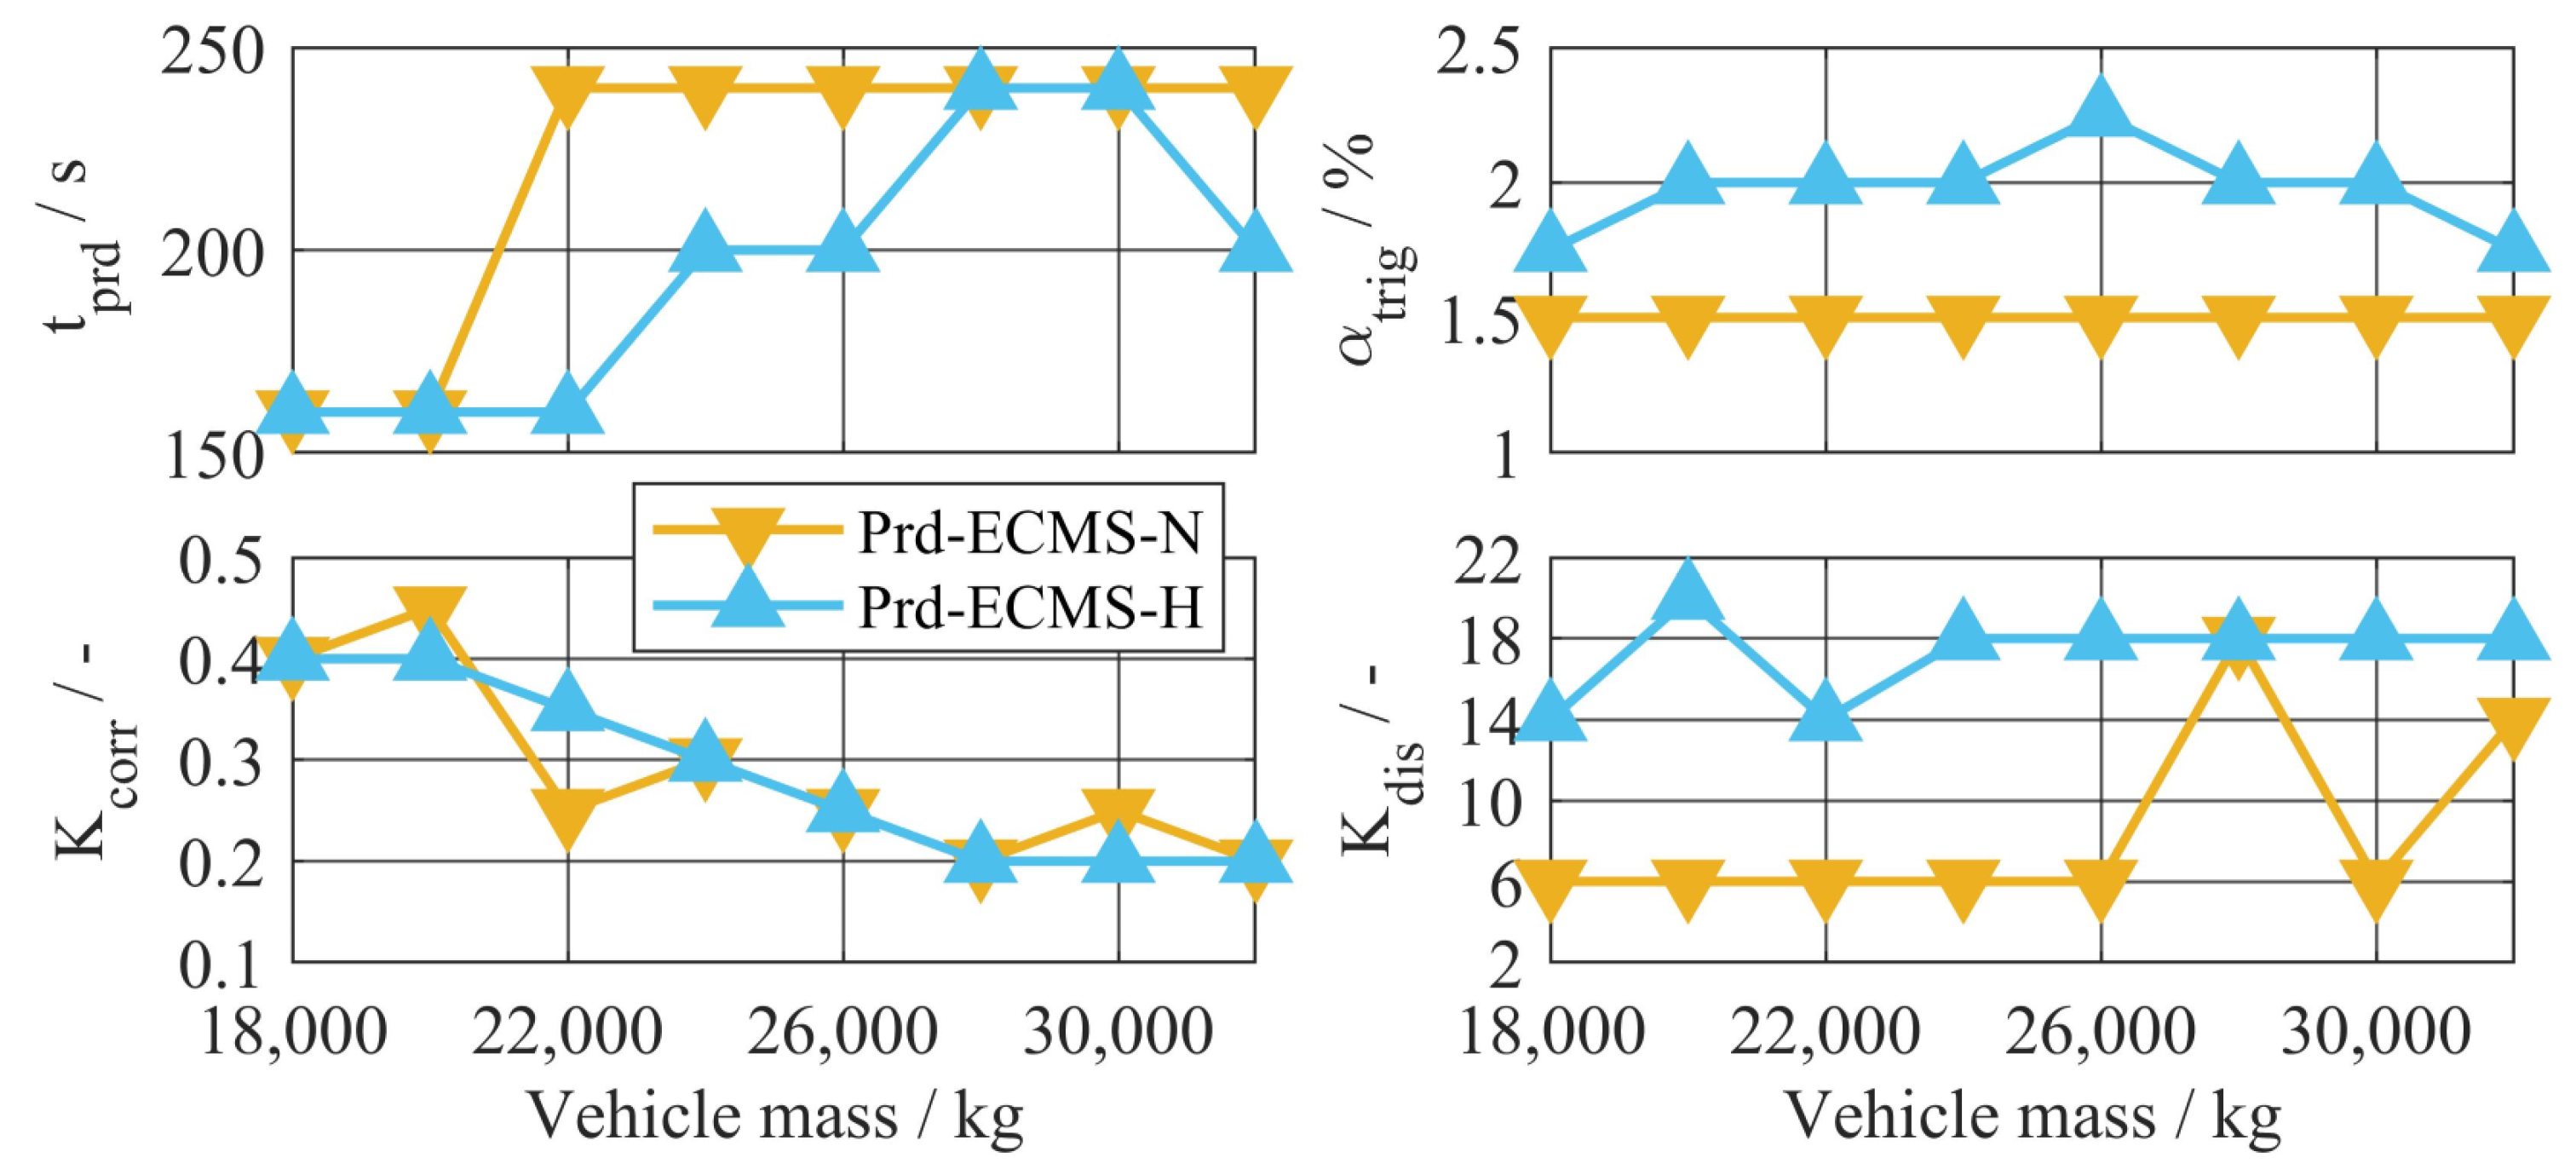
The final parametrization of α t r i g , t p r d , K c o r r and K d i s emphasizes the impact of the vehicle mass and the height profile on the predictive discharge (see Figure A3). The parametrization is based on the minimal equivalent fuel consumption on the driving cycles AB-H and AB-N. As not only these four parameters but also the basic parameters λ 0 and K (Figure A1) stand in direct interaction, observations regarding only one parameter are difficult to interpret. However, for the driving cycle AB-H, the combination of a short time t p r d and a high value of K d i s can be linked to a fast predictive discharge. This fast discharge allows a higher value of α t r i g , which corresponds to the more distinct height profile in comparison with the cycle AB-N. For the driving cycle AB-N, a combination of a higher time t p r d and lower values of K d i s is identified as most beneficial. The lower α t r i g again mirrors the height profile. The parameter t p r d not only impacts the magnitude of M A W α but also determines how far in advance a predictive discharge is possible.
Figure A3. Final parameters show the impact of the height profile regarding the predictive discharge and the impact of the payload for the correction of the equivalent factor.
Energies 16 05171 g0a3

Appendix D. Driving Cycles

Figure A4. Slope and speed profile of driving cycle AB-H.
Energies 16 05171 g0a4
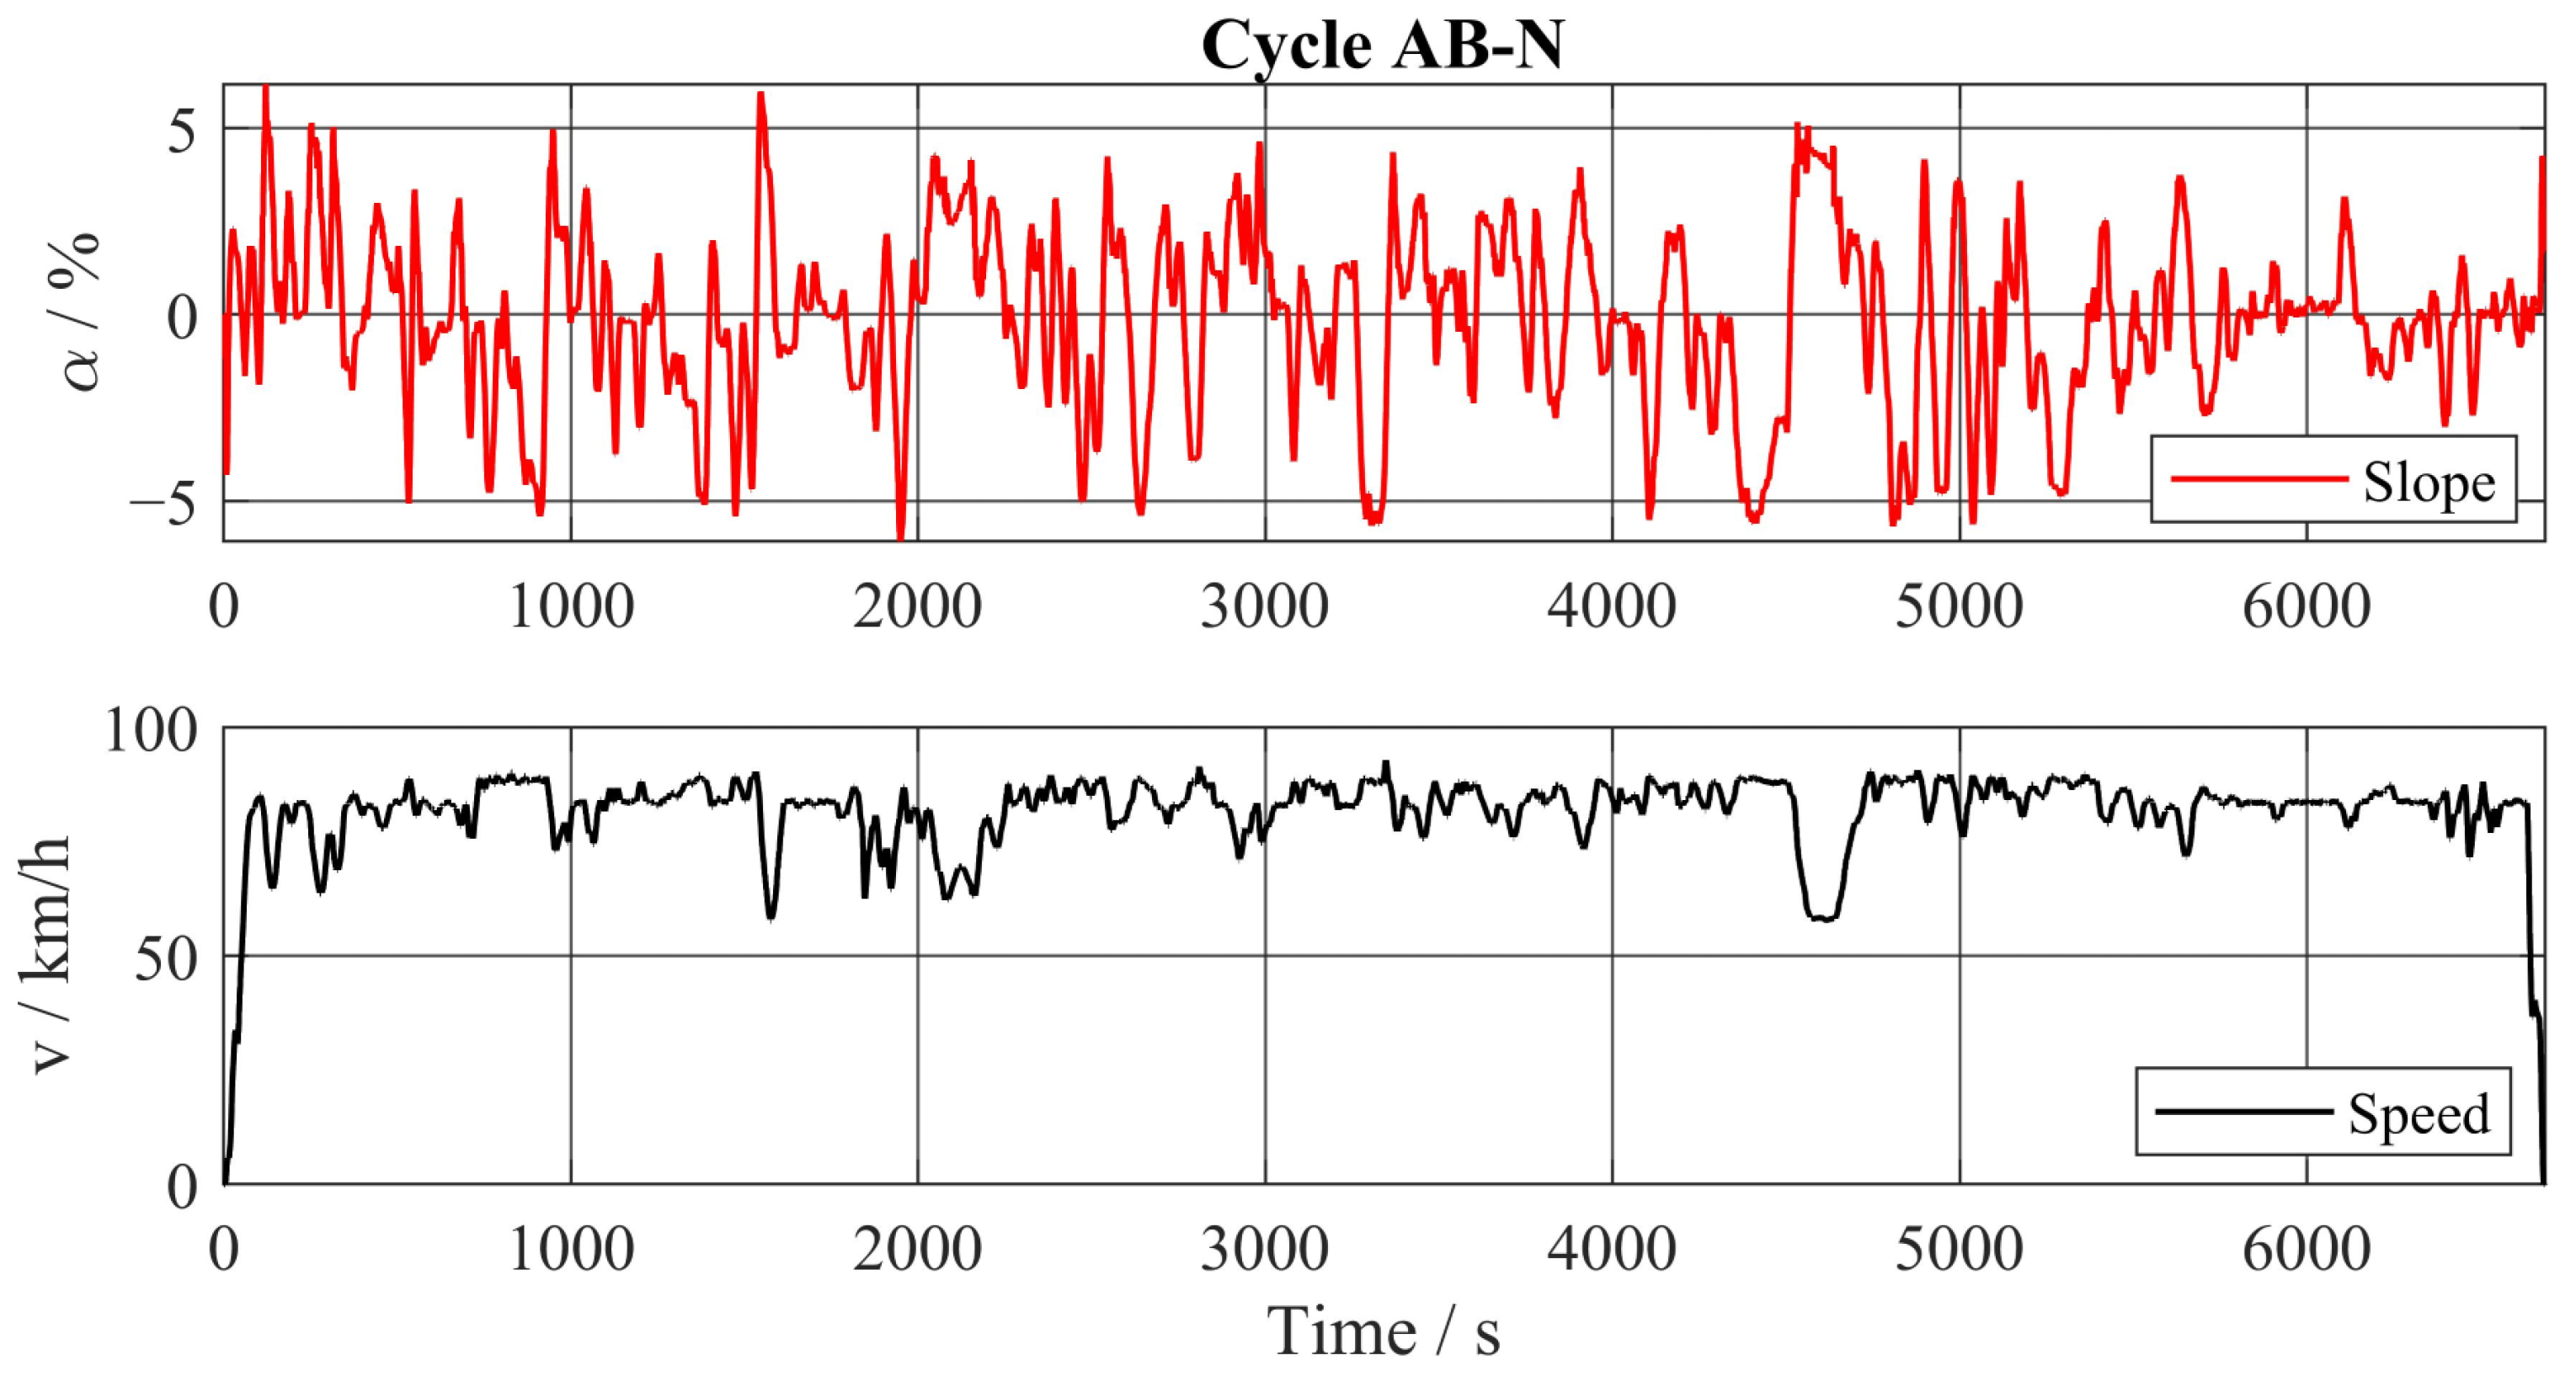
Figure A5. Slope and speed profile of driving cycle AB-N.
Energies 16 05171 g0a5
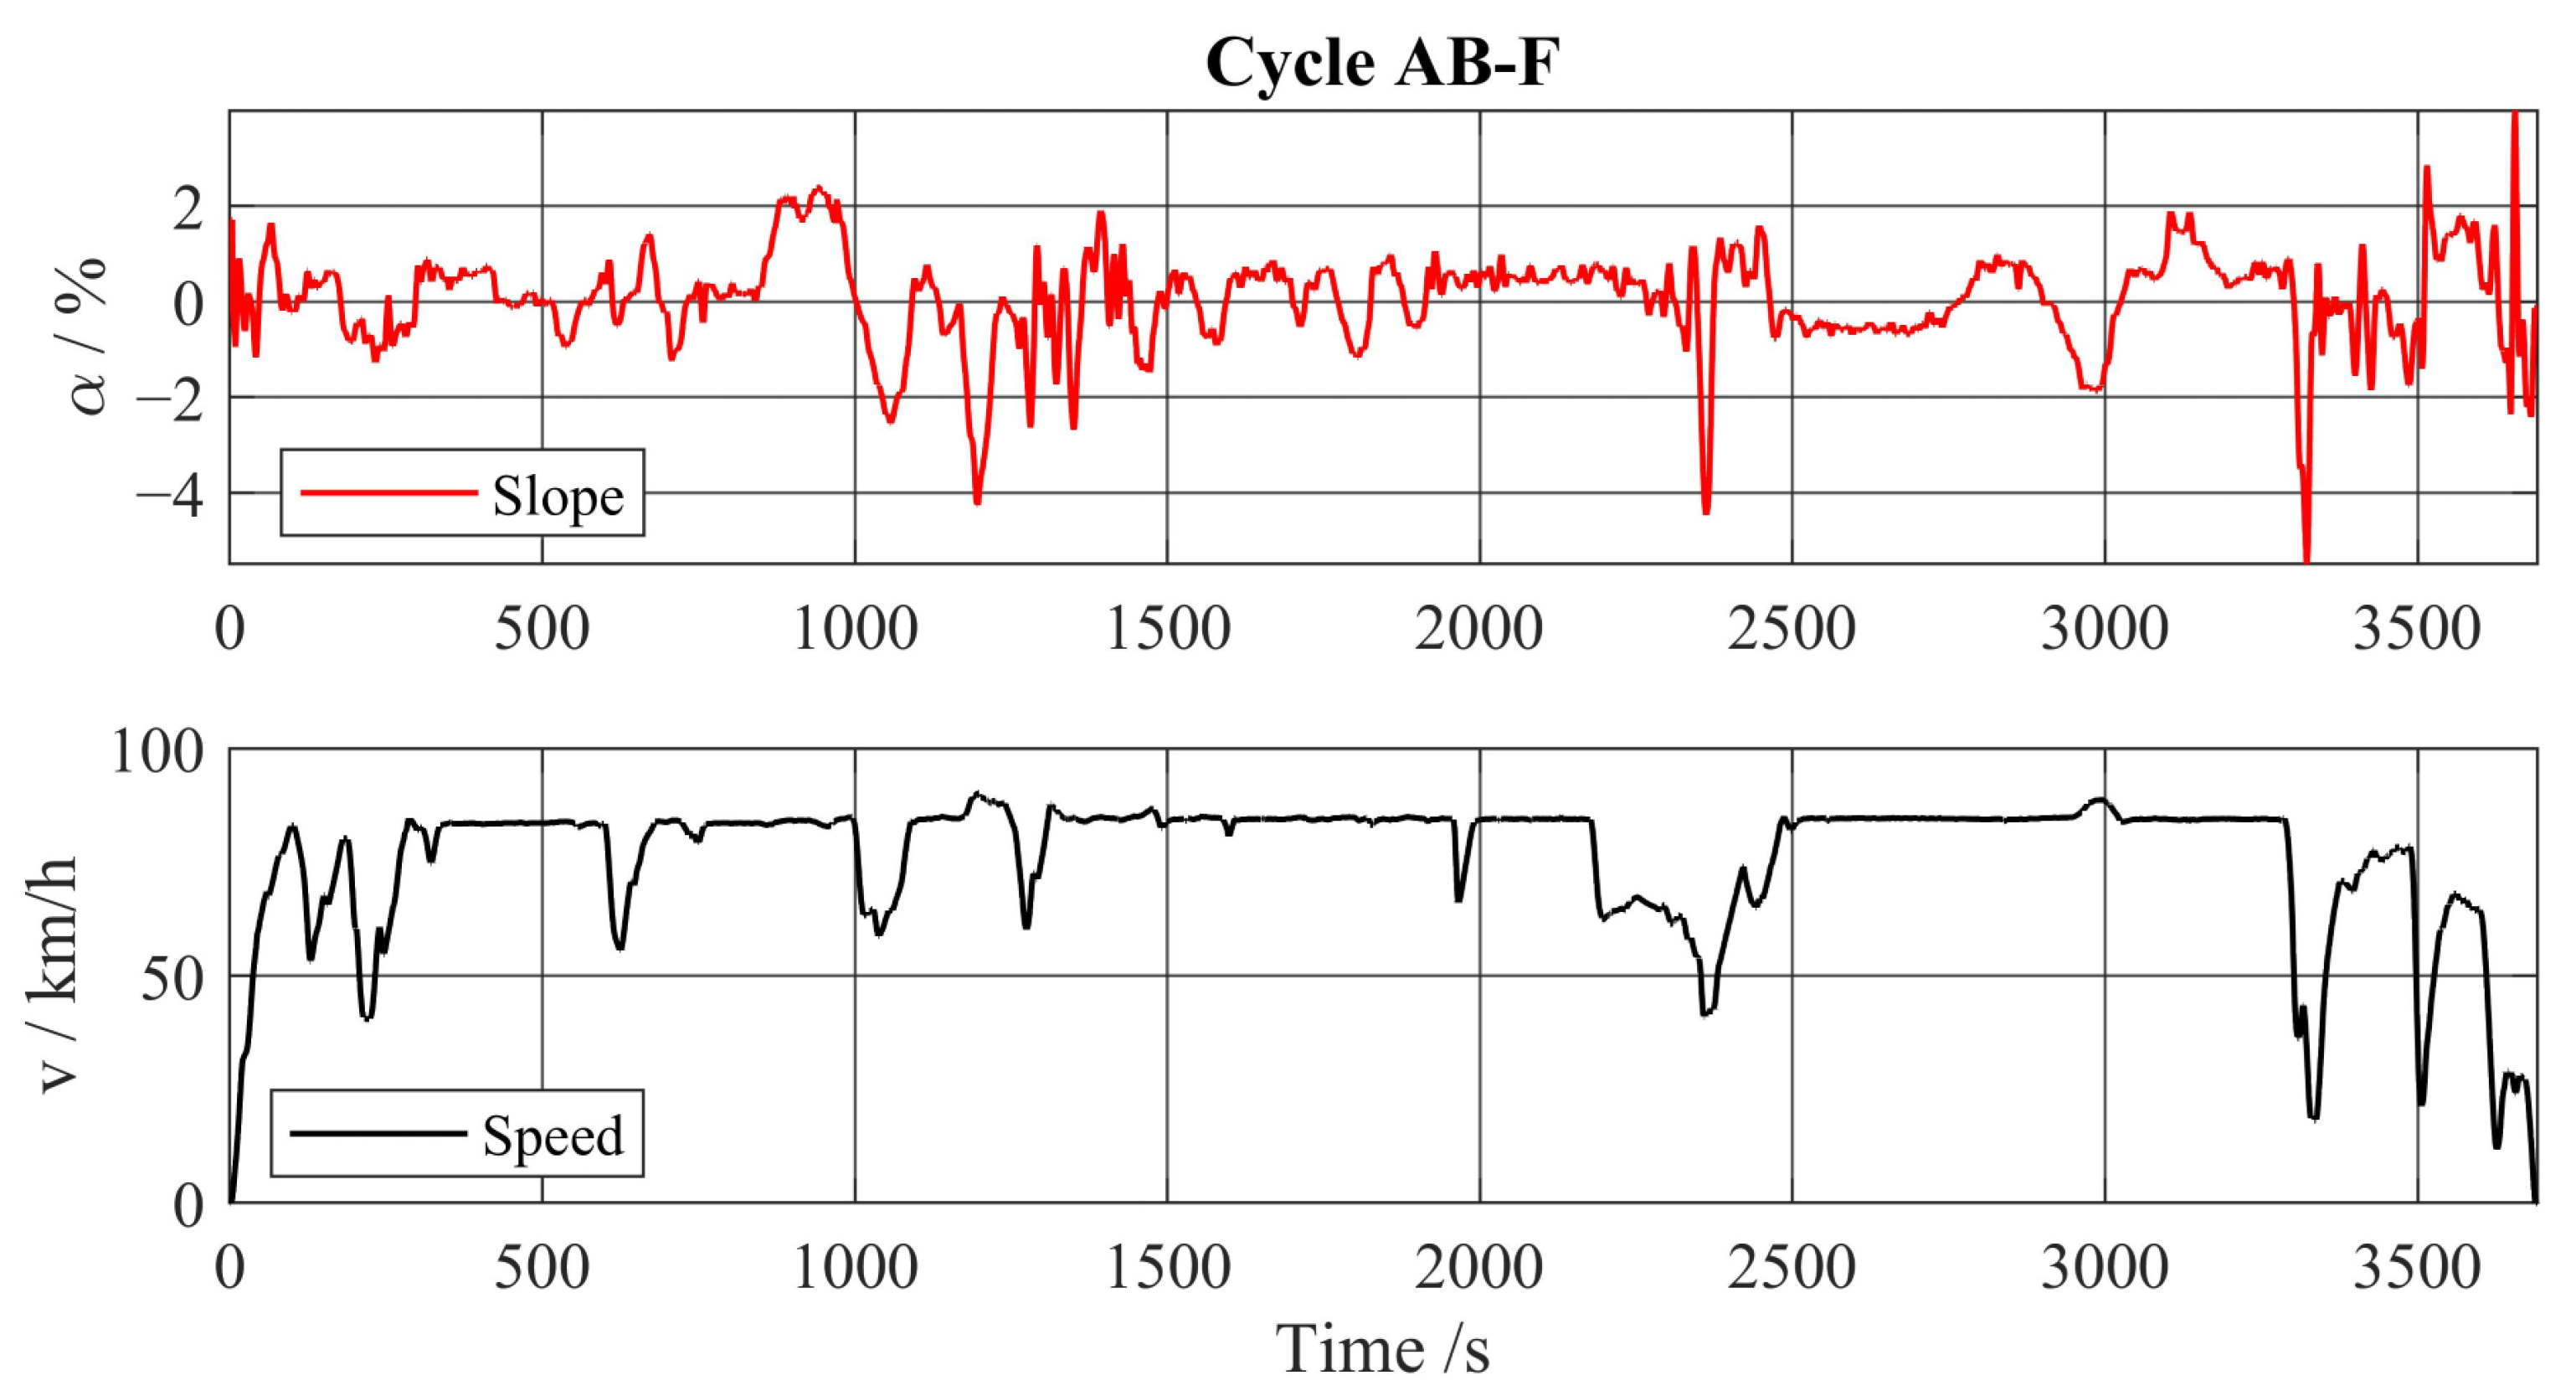
Figure A6. Slope and speed profile of driving cycle AB-F.
Energies 16 05171 g0a6

References

  1. Europäische Union. Verordnung (EU) 2019/des Europäischen Parlaments und des Rates Vom 20 Juni 2019 zur Festlegung von CO2-Emissionsnormen für Neue Schwere Nutzfahrzeuge und zur Änderung der Verordnungen (EG) Nr. 595/2009 und (EU) 2018/956 des Europäischen Parlaments und des Rates Sowie der Richtlinie 96/53/EG des Rates. Verordnung (EU) 2019/des Europäischen Parlaments und des Rates vom 20. Juni 2019 zur Festlegung von CO2-Emissionsnormen für Neue Schwere Nutzfahrzeuge und zur Änderung der Verordnungen (EG) Nr. 595/2009 und (EU) 2018/956 des Europäischen Parlaments und des Rates Sowie der Richtlinie 96/53/EG des Rates. 2019. Available online: https://eur-lex.europa.eu/legal-content/DE/TXT/PDF/?uri=CELEX:32019R1242&from=EN (accessed on 23 January 2020).
  2. European Automobile Manufacturers Association. VECTO: Bringing down CO2 Emissions and Fuel Costs of Heavy-Duty Vehicles by Promoting Transparency, Vehicle Comparability and Competition. Available online: http://www.acea.be/uploads/publications/VECTO_infographic.pdf (accessed on 8 September 2021).
  3. Helbing, M. Energiemanagement für eine Parallele Hybridarchitektur. Diploma Thesis, TU Dresden, Dresden, Germany, 2014. [Google Scholar]
  4. Bertsekas, D.P. Dynamic Programming and Optimal Control, 3rd ed.; Athena Scientific (Athena Scientific Optimization and Computation Series 3): Belmont, MA, USA, 2005. [Google Scholar]
  5. Sundström, O.; Guzzella, L. A Generic Dynamic Programming Matlab Function. In Proceedings of the 18th IEEE International Conference on Control Applications, St. Petersburg, Russia, 8–10 July 2009. [Google Scholar]
  6. Back, M. Prädiktive Antriebsregelung zum Energieoptimalen Betrieb von Hybridfahrzeugen. Ph.D. Thesis, Universität Karlsruhe, Karlsruhe, Germany, 2005. [Google Scholar]
  7. Serrao, L. A Comparative Analysis of Energy Management Strategies for Hybrid Electric Vehicles. J. Dyn. Sys. Meas. Control 2011, 133, 031012. [Google Scholar] [CrossRef] [Green Version]
  8. Paganelli, G.; Delprat, S.; Guerra, T.M.; Rimaux, J.; Santin, J.J. Equivalent consumption minimization strategy for parallel hybrid powertrains. In Proceedings of the Vehicular Technology Conference. IEEE 55th Vehicular Technology Conference. VTC Spring 2002 (Cat. No.02CH37367), Birmingham, AL, USA, 6–9 May 2002. [Google Scholar]
  9. Musardo, C.; Rizzoni, G.; Guezennec, Y.; Staccia, B. A-ECMS: An Adaptive Algorithm for Hybrid Electric Vehicle Energy Management. Eur. J. Control 2005, 11, 509–524. [Google Scholar] [CrossRef]
  10. Onori, S.; Serrao, L.; Rizzoni, G. Adaptive Equivalent Consumption Minimization Strategy for Hybrid Electric Vehicles. In Proceedings of the ASME 2010 Dynamic Systems and Control Conference, Cambridge, MA, USA, 12–15 September 2010. [Google Scholar]
  11. Lampe, A. A Rule-Based Operating Strategy for the Pre-Design of a Powertrain for Hybrid Electric Vehicles. ATZ Worldw. 2014, 116, 56–62. [Google Scholar] [CrossRef]
  12. Finesso, R.; Spessa, E.; Venditti, M. Robust equivalent consumption-based controllers for a dual-mode diesel parallel HEV. Energy Convers. Manag. 2016, 127, 124–139. [Google Scholar] [CrossRef]
  13. Görke, D.; Bargende, M.; Keller, U.; Ruzicka, N.; Schmiedler, S. Kraftstoffoptimale Auslegung Regelbasierter Betriebsstrategien für Parallelhybridfahrzeuge unter Realen Fahrbedingungen. 2014. Available online: https://docplayer.org/45190335-Kraftstoffoptimale-auslegung-regelbasierter-betriebsstrategien-fuer-parallelhybridfahrzeuge-unter-realen-fahrbedingungen.html (accessed on 20 May 2023).
  14. Sciarretta, A.; Guzzella, L. Control of Hybrid Elctric Vehicles. IEEE Control Syst. Mag. 2007, 27, 60–70. [Google Scholar]
  15. Rizzoni, G.; Onori, S. Energy Management of Hybrid Electric Vehicles: 15 years of development at the Ohio State University. Oil Gas Sci. Technol. Rev. D’ifp Energ. Nouv. 2015, 70, 41–54. [Google Scholar] [CrossRef] [Green Version]
  16. Salmasi, F.R. Control Strategies for Hybrid Electric Vehicles: Evolution, Classification, Comparison, and Future Trends. IEEE Trans. Veh. Technol. 2007, 56, 2393–2404. [Google Scholar] [CrossRef]
  17. Helbing, M.; Uebel, S.; Tempelhahn, C.; Bäker, B. An Evaluated Review of Powertrain Control Strategies for Hybrid Electrical Vehicles. ATZelektronik Worldw. 2015, 10, 46–51. [Google Scholar] [CrossRef]
  18. Pisu, P.; Rizzoni, G. A Comparative Study of Supervisory Control Strategies for Hybrid Electric Vehicles. IEEE Trans. Control. Syst. Technol. 2007, 15, 506–518. [Google Scholar] [CrossRef]
  19. Huang, Y.; Jiang, F.; Xie, H. Adaptive hierarchical energy management design for a novel hybrid powertrain of concrete truck mixers. J. Power Sources 2021, 509, 230325. [Google Scholar] [CrossRef]
  20. Feng, Y.; Dong, Z. Optimal energy management with balanced fuel economy and battery life for large hybrid electric mining truck. J. Power Sources 2020, 454, 227948. [Google Scholar] [CrossRef]
  21. Yang, C.; Du, S.; Li, L.; You, S.; Yang, Y.; Zhao, Y. Adaptive real-time optimal energy management strategey based on equivalent factors optimization for plug-in hybrid electric vehicle. Appl. Energy 2017, 203, 883–896. [Google Scholar] [CrossRef]
  22. van Keulen, T.; van Mullem, D.; de Jager, B.; Kessels, J.T.; Steinbuch, M. Design, implementation, and experimental validation of optimal power split control for hybrid electric trucks. Control. Eng. Pr. 2012, 20, 547–558. [Google Scholar] [CrossRef]
  23. Zhang, P.; Wu, X.; Du, C.; Xu, H.; Wang, H. Adaptive Equivalent Consumption Minimization Strategy for Hybrid Heavy-Duty Truck Based on Driving Condition Recognition and Parameter Optimization. Energies 2020, 13, 5407. [Google Scholar] [CrossRef]
  24. Schulze, S.; Feyerl, G.; Pischinger, S.; Mühleisen, M. Adaptive Energy Management Strategy for a Heavy-Duty Truck with a P2-Hybrid Topology. In 18. Internationales Stuttgarter Symposium: Automobil-und Motorentechnik; Bargende, M., Reuss, H., Wiedemann, J., Eds.; Springer: Berlin/Heidelberg, Germany, 2018. [Google Scholar]
  25. Schulze, S.; Feyerl, G. Sensitivity Study of an Adaptive Energy Management Strategy for Heavy Vehicle Application with a P2-Hybrid Topology. In Proceedings of the 4th Int. Diesel Powertrains 3.0 Conference, Coventry, UK, 3–4 July 2018. [Google Scholar]
  26. Sonntag, M.; Sawodny, O.; Kaufmann, F.; Gehring, O. Vorausschauendes HV-Batteriemanagement für E-Hybrid LKW im Fernverkehr. In Proceedings of the 6th VDI/VDE-Fachtagung Steuerung und Regelung von Fahrzeugen und Motoren, Baden-Baden, Germany, 5–6 June 2013. [Google Scholar]
  27. Arts, G.J.C.M. Analysis and Synthesis of Hybrid Truck Energy Management. Master’s Thesis, TU Eindhoven, Eindhoven, The Netherlands, 2007. [Google Scholar]
  28. Merker, G.P.; Teichmann, R. Grundlagen Verbrennungsmotoren: Funktionsweise, Simulation, Messtechnik, 7th ed.; Springer Fachmedien Wiesbaden: Wiesbaden, Germany, 2014. [Google Scholar]
  29. Kreyer, J.; Müller, M.; Esch, T. A Calculation Methodology for Predicting Exhaust Mass Flows and Exhaust Temperature Profiles for Heavy-Duty Vehicles. SAE Int. J. Commer. Veh. 2020, 13. [Google Scholar] [CrossRef]
  30. Quickert, M. Höhenprofile von Autobahnen. Höhenprofile von Autobahnen. 2014. Available online: http://www.ahph.de/ (accessed on 20 April 2020).
  31. ETH Zürich. Homepage Institue for Dynamic Systems and Control. Available online: http://www.idsc.ethz.ch/research-guzzella-onder/downloads.html (accessed on 8 September 2021).
  32. Jeon, S.-I.; Jo, S.-T.; Park, Y.-I.; Lee, J.-M. Multi-Mode Driving Control of a Parallel Hybrid Electric Vehicle Using Driving Pattern Recognition. J. Dyn. Syst. Meas. Control. 2000, 124, 141–149. [Google Scholar] [CrossRef]
  33. Beidl, C.; Schmitt, M.; Kluin, M.; Lenzen, B. Potenziale hybridisierter Nutzfahrzeuge. MTZ Mot. Z. 2011, 72, 432–437. [Google Scholar] [CrossRef]
  34. Treusch, S. Hybrid at Daimler Trucks—Technology for the World: Current Status and Working Direction (4. Fachtagung Hybridantriebe für Mobile Antriebsmaschinen). Karlsruhe, 20 February 2013. Available online: https://www.fast.kit.edu/download/DownloadsMobima/Veroeffentlichung_Hybridtagung_Daimler_Treusch_22022013.pdf (accessed on 20 April 2020).
  35. García, A.; Monsalve-Serrano, J.; Martinez-Boggio, S.; Gaillard, P. Emissions reduction by using e-components in 48 V mild hybrid trucks under dual-mode dual-fuel combustion. Appl. Energy 2021, 299, 117305. [Google Scholar] [CrossRef]
  36. García, A.; Monsalve-Serrano, J.; Martinez-Boggio, S.; Gaillard, P. Impact of the hybrid electric architecture on the performance and emissions of a delivery truck with a dual-fuel RCCI engine. Appl. Energy 2021, 301, 117494. [Google Scholar] [CrossRef]
  37. Feru, E.; Murgovski, N.; de Jager, B.; Willems, F. Supervisory control of a heavy-duty diesel engine with an electrified waste heat recovery system. Control. Eng. Pr. 2016, 54, 190–201. [Google Scholar] [CrossRef]
  38. Marlok, H.; Pfeifer, A.; Hötger; Bucher, M. Modulares Abwärmerückgewinnungssytem mit elektrischer Leistungsabgabe. MTZ Mot. Z. 2019, 80, 84–89. [Google Scholar]
  39. Verbruggen, F.J.R.; Rangarajan, V.; Hofman, T. Powertrain design optimization for a battery electric heavy-duty truck. In Proceedings of the 2019 American Control Conference, ACC 2019, Philadelphia, PA, USA, 10–12 July 2019; Institute of Electrical and Electronics Engineers: Piscataway, NJ, USA, 2019; pp. 1488–1493. [Google Scholar]
  40. Verbruggen, F.J.R.; Hofman, T. Design Sensitivity Analysis for Heavy-Duty Hybrid Electric Trucks with a Waste Heat Recovery System. In Proceedings of the 2017 IEEE Vehicle Power and Propulsion Conference (VPPC), Belfort, France, 11–14 December 2017; pp. 1–6. [Google Scholar] [CrossRef]
  41. Silvas, E.; Hereijgers, K.; Peng, H.; Hofman, T.; Steinbuch, M. Synthesis of Realistic Driving Cycles With High Accuracy and Computational Speed, Including Slope Information. IEEE Trans. Veh. Technol. 2016, 65, 4118–4128. [Google Scholar] [CrossRef]
  42. Banerjee, A.; Würthner, M.; Tudoise, C. Prevision GPS—Die Schaltstrategie für das Getriebesystem Traxon. ATZ 2013, 115, 490–493. [Google Scholar] [CrossRef]
  43. Ferrara, A.; Jakubek, S.; Hametner, C. Energy management of heavy-duty fuel cell vehicles in real-world driving scenarios: Robust design of strategies to maximize the hydrogen economy and system lifetime. Energy Convers. Manag. 2021, 232, 113795. [Google Scholar] [CrossRef]
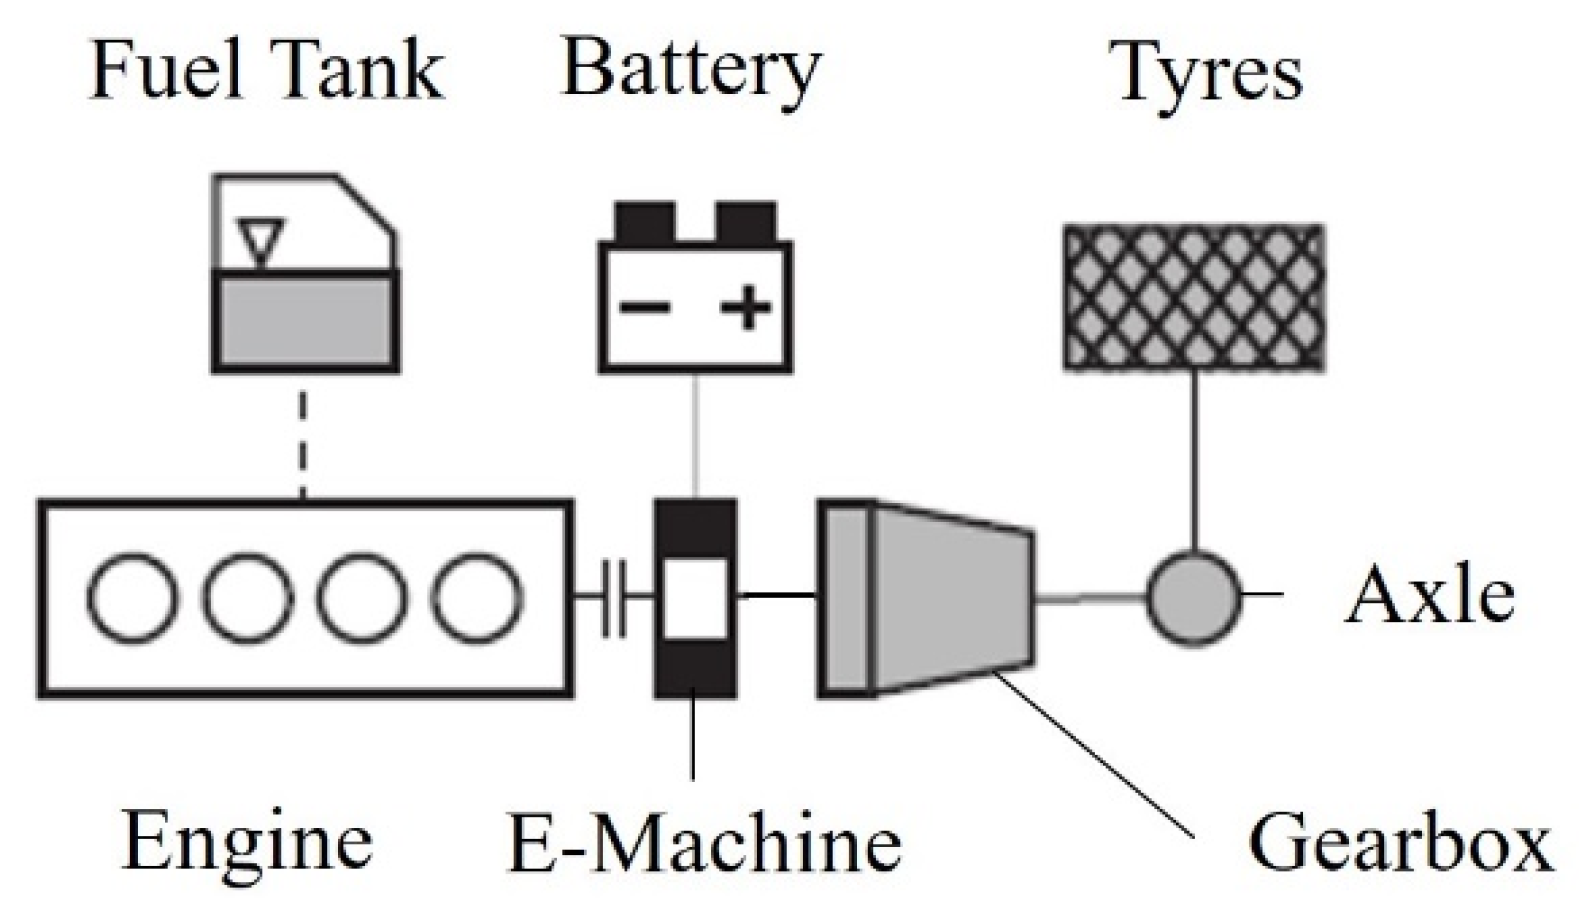
Figure 1. Powertrain topology of the investigated parallel-hybrid with electric machine position P2.
Energies 16 05171 g001
Figure 2. Longitudinal dynamics of the vehicle.
Energies 16 05171 g002
Figure 3. Efficiency map of combustion engine derived from data available in Ref. [28].
Energies 16 05171 g003
Figure 4. Efficiency map of the electric machine.
Energies 16 05171 g004
Figure 5. Equivalent circuit of the battery.
Energies 16 05171 g005
Figure 6. Characteristic curves of open circuit voltage U O C and internal resistance R i of battery.
Energies 16 05171 g006
Figure 7. Comparison of height profile of used driving cycles with main Autobahn sections in Germany.
Energies 16 05171 g007
Figure 8. Overview of development steps of intelligent EMS.
Energies 16 05171 g008
Figure 9. Comparison of SOC trajectories from RB and DP.
Energies 16 05171 g009
Figure 10. Peak and continuous limitations and their impact on the operating point.
Energies 16 05171 g010
Figure 11. The iterative determination of λ 0 and K demonstrates the impact on the EF λ: (a) SOC trajectories for the different parameter sets of λ 0 and K; (b) arrangement of parameter sets for grid iteration for first three generations; (c) impact of different parameters sets on the EF λ.
Energies 16 05171 g011
Figure 12. The key challenge of the tuning of the equivalence factor—tradeoff between recuperation potential and overall engine efficiency: (a) comparison of parameter sets of the first generation with the final parameter set of the grid iteration; (b) comparison of the resulting ECMS against DP and RB.
Energies 16 05171 g012
Figure 13. Impact of vehicle mass reveals limitations of basic ECMS approach as operation strategy becomes closer to RB with increasing vehicle mass: (a) speed profile and slope of the cycle; (b) SOC trajectories for different EMSs for a vehicle mass of 18,000 kg; (c) SOC trajectories for different EMS for a vehicle mass of 24,000 kg: (d) delta of equivalent fuel mass of the three different EMSs with DP as base.
Energies 16 05171 g013
Figure 14. The parameters α t r i g , t p r d , K c o r r , and K d i s are defined to split up the SOC trajectory in two sections: (a) speed profile and slope of driving cycle overlapped with MAW of the slope; (b) SOC trajectory of the desired CS-CD operating strategy.
Energies 16 05171 g014
Figure 15. Analysis of the impact of the parameter K c o r r for two sections of the driving cycle AB-N and two different vehicle masses.
Energies 16 05171 g015
Figure 16. Analysis of the impact of the parameters K d i s and α t r i g for the driving cycle AB-N.
Energies 16 05171 g016
Figure 17. Exemplary results of full factorial parameter variation regarding equivalent fuel mass.
Energies 16 05171 g017
Figure 18. Flexible CS-CD operating behaviour is obtained that matches one DP over long sections: (a) speed profile and slope of driving cycle; (b) comparison of SOC trajectories to validate the benefit of the predictive battery discharge functionality; (c) comparison of equivalent factors.
Energies 16 05171 g018
Figure 19. PBDis enables optimal recuperation potential and increases mean efficiency of the ICE.
Energies 16 05171 g019
Figure 20. Main principle of the DCR sketched for three characteristics of a driving cycle: (a) exemplary sketch of three characteristics used for the DCR; (b) explanation on how the calculated values of the characteristics for one driving situation can look like; (c) comparison of the calculated values of the characteristics with the pre-calculated values of the training cycles.
Energies 16 05171 g020
Figure 21. Functional structure of the developed and implemented Prd-AECMS with three main layers—ECMS, DCR and PBDis.
Energies 16 05171 g021
Figure 22. Comparison of equivalent fuel mass for all vehicle masses and different EMSs to analyze the effectiveness of the developed Prd-AECMS.
Energies 16 05171 g022
Figure 23. The proposed EMS can reduce the constraints within the presented tradeoff between recuperation potential and overall ICE efficiency.
Energies 16 05171 g023
Figure 24. Adaption of operating strategy can match behavior of DP on driving cycles with flat and hilly height profile, but the depletion of battery is challenging: (a) speed profile and slope of the cycle; (b) SOC trajectory for different EMS for a vehicle mass of 32,000 kg; (c) trajectory of the equivalence factor λ; (d) selected operating strategy.
Energies 16 05171 g024
Figure 25. Application of EMS on a broad spectrum of boundary conditions to quantify the holistic impact on fuel saving potential: (a) comparison of the basic ECMS against the predictive ECMS; (b) comparison of predictive ECMS against intelligent ECMS as well as RB and DP.
Energies 16 05171 g025
Figure 26. Fuel saving potential of powertrain measures for HD trucks.
Energies 16 05171 g026
Figure 27. Transfer of proposed EMS to FCEV trucks.
Energies 16 05171 g027
Table 1. Parameter sets and obtained equivalent fuel mass with grid iteration.
Generation λ 0 KEquivalent Fuel Mass/kgDelta to
Optimum/%
1st1.50.618.07711.1
1.51.618.07711.1
21.117.88030
2.50.619.842910.98
2.51.618.86365.5
2nd1.751.118.07031.09
20.8517.87630
21.3517.8970.12
2.251.118.50173.5
3rd–7th
8th1.99610.889117.86740.02
20.885217.86540.01
20.89317.86450
2.00390.889117.86570.1
Disclaimer/Publisher’s Note: The statements, opinions and data contained in all publications are solely those of the individual author(s) and contributor(s) and not of MDPI and/or the editor(s). MDPI and/or the editor(s) disclaim responsibility for any injury to people or property resulting from any ideas, methods, instructions or products referred to in the content.