Abstract
Energy imports and the transition to renewable energy sources are of critical importance in the current geopolitical context, which necessitates concrete actions to tackle the energy crisis at the European Union level. This study aimed to explore the impact of imported non-renewable energy resources on the EU-27 economy. It examined the correlations and causal relationships between the GDP, the GVA, R&D investments, and energy imports from 2000 to 2021. Data normality was assessed using the Shapiro–Wilk test, while Pearson’s test identified correlations between variables. Linear and multiple regression analyses were conducted to determine the effects of changes in independent variables on dependent variables. The study found a strong association between natural gas imports and the GDP, with increases in GDP leading to a more-than-fourfold rise in imports. Furthermore, a multiple regression analysis indicated that a 1% increase in R&D investments results in a 2.21% decrease in fossil fuel imports in 91.7% of cases. This suggests that R&D investments contribute to improved efficiency and the use of renewable energy sources.
1. Introduction
Global electricity consumption is expected to rise by 60% by 2030, partly due to the increased usage of equipment, appliances, lighting, and other energy-consuming devices [1]. The introduction of new products and technologies has expanded access to modern conveniences and improved the quality of life worldwide. However, the corresponding surge in energy demand presents challenges for governments striving to satisfy demand while addressing environmental pollution and fighting climate change.
Media coverage frequently portrays energy-import dependency negatively. Concurrently, one of the key objectives of the European Green Deal is to reduce energy dependency by 2050. A 2021 study highlights the geopolitical implications of the Green Deal, suggesting that moving away from fossil fuel dependency may economically and politically destabilize regional partners [2]. The current political context, marked by embargoes on fossil fuel imports and the RePowerEU plan to eliminate dependence on Russian imports by 2030 [3], raises questions about the economy’s impact. Recent studies indicate that the potential economic effects of energy-import embargoes range from low to significant [4,5].
This study aimed to explore the influence of the economy (GDP) and individual sectors (GVA) on different types of energy imports in the EU-27. While GDP represents the economy’s strength, GVA measures each sector’s contribution [6]. In the present study, the investments in research and development (R&D) sectors were also included.
The data show that Europe produced only 39% of the available energy in 2019, and the rest was imported [7]. As a result, the GDP can also be influenced by the prices of imported fuels in EU-27. The example of the Russian–Ukrainian conflict speaks for itself when studying the effects of energy imports over European economies. The decrease independency on non-renewable energy that comes with high carbon emissions is one of the main points of the Green Deal [8].
One study that comprises data from 23 developed and developing countries shows that a 1% increase in energy imports will increase the GDP by 1.171% in the long term [9]. Using panel cointegration, Granger causality analysis, and panel error correction tests, the authors studied the relations between the imports and GDP for a period of 26 years. When searching for the relations between GVA and energy imports, Mushet et al. (2020) found that energy imports influence the industrial and services sectors. The method used in the study was regression analysis for 48 observations [10]. In Israel, China, and South Korea, energy imports increase the economic growth. In their study, Bildirici and Kayikci (2022) used the Markov-Switching Bayesian Granger Causality test and traditional Granger causality test [11].
A study made in Brazil, China, Indonesia, India, Mexico, Russia, and Turkey shows that, for those countries, renewable energy can be used to reduce the energy imports. At the same time, imports cannot be completely replaced by renewables, so other solutions must be found [12].
An accurate assessment indicates that the decline in real income in Germany resulting from an energy import boycott would range between EUR 1500 and EUR 2000 per capita, approximately 5% of the GDP, surpassing the impact of the corona recession in 2020, and would adversely affect economic development in the Netherlands, France, and Belgium, consequently leading to negative repercussions for Germany [13].
If most of the imports of oil and coal from Russia can be replaced due to the world market capacity [14], the biggest challenge is linked with the imports of natural gas. An IEA report shows a 10-point plan to reduce the European Union’s reliance on Russian natural gas that includes measures ranging from the replacement of this resource with alternatives to the acceleration of the deployment of new wind and solar projects [15].
The available data show that natural gas is mostly used in the building sector (185 bcm), electricity (151 bcm), industry (116 bcm), and transport (4 bcm) [16]. The building sector is responsible for 38% of total gas consumption [16], but measures for decreasing the usage of this energy source are already being considered. One solution for partially replacing the natural gas from imports can come from the Black Sea. In 2018, in Romania, the concessors estimated 100–200 bcm natural gas resources, and the specialists from NAMR (National Agency for Mineral Resources) estimated over 300 [17]. The long-term solution for electricity generated from natural gas and its usage in the industry sector can be the use of hydrogen and biomethane [16]. According to another study, it is proposed that natural gas can be substituted by biogas due to their sharing similar properties, allowing for their distribution within the same system [18]. Replacing Russian natural gas in electricity and heating by 2028 requires a conducive policy environment, including faster permitting, secure supply chains, weatherization, and supportive subsidies [19]. Furthermore, Fedoseeva and Zeidan found that primary energy imports are affected by the natural gas imports fuel [20].
Another study investigated the links between petroleum imports, economic growth, and CO2 emissions in two African countries for 24 years [21]. Using simultaneous equation models and threshold regression analysis, the authors’ results indicate that, in Nigeria, aggregate and sectoral outputs increase when the imports of petroleum products are above a certain threshold. Russia’s crude oil exports have shifted from the EU to Asia, accompanied by significant price discounts, as one study highlights [22]. The same study states that the ban on crude oil sales to countries adhering to the price-cap mechanism could have further implications for global oil markets. In China, Zhao and Wu found that industry and transport sectors influence the oil imports, and not the price [23]. In their study, they used cointegration and VECM techniques for a period between 1995 and 2006, divided into quarters. Brutschin and Fleig found a positive and significant relationship between the oil price and R&D expenditures [24].
Over the past three decades, Europe has witnessed a steady decline in the use of coal, and it is projected to eventually phase out coal entirely under the new energy and climate policy of the European Union [25]. Fedoseeva and Zeidan show that economic growth and fossil fuel consumption are correlated in the EU, and this could be a drawback for reducing the consumption of energy from this fuel [20]. The findings of another study suggest that fossil fuel distributors should invest in research and development for clean and renewable fuel alternatives, while higher energy prices motivate energy consumers to explore energy-efficient methods through research [26]. While the literature lacks extensive research on the connection between fossil fuel imports and economic growth or R&D, numerous studies have explored the relationship between fossil fuel energy consumption and various economic variables. Additionally, the demand for energy imports from these resources is closely associated with economic factors. As shown in the Table 1, the findings indicate the relationship between fossil fuel consumption and economic growth, as well as the absence of a link between economic growth and energy in certain cases. The results highlight the importance of considering energy conservation policies in light of the impact of fossil fuel consumption on both the economy and climate change.

Table 1.
Review of the literature on the links between energy from fossil fuels and economy.
Numerous research studies have established connections and causal relationships between the GDP, the GVA, R&D, and energy consumption. However, the role of energy imports in the economy has received limited attention in these studies. Specifically, we have not found any relevant research that incorporates R&D investments when examining the impact of imports on the economy. Our study aimed to address these gaps and provide answers to emerging questions in the current economic and political landscape. Furthermore, we expanded the existing literature by investigating the effects of a wider range of fuel imports in the EU-27. The findings may not be entirely positive in light of the Green Deal targets, as they reveal a significant correlation between certain economic variables and imports. Considering the implications of these results for the EU-27’s geopolitical energy markets, potential solutions could involve substituting some imported resources with locally produced alternatives or imports that have lower CO2 emissions and are more economically viable.
2. Materials and Methods
After reviewing the literature, data about the variables of interest were gathered from the official database. EU-27 is considered a single entity due to the common agreement to become climate neutral, to increase the energy independency, and to help all the countries to achieve these objectives by 2050 [32]. For the data about energy imports, the GDP, the GVA, and R&D, we considered a period from 2000 to 2021. Table 2, which shows the source of data, the name of the variables, the unit of measurement, and the symbol, was used to find the answers to the research questions. For the present study, both raw and combined data were considered.
Table 2.
Variables.
The first step was to build a graphic representation of the imports in the EU to analyze the possible links with economy status. For answering the research questions, all the data were uploaded and tested using SPSS-28. The collected data cover 21 years (a size less than 50), so the Shapiro–Wilk test for the normality of the data was applied [37,38]. The data collected at a European level exhibited a normal distribution (significance > 0.05), and we employed the Pearson correlation coefficient to determine the relationships between the variables. For country-specific data, we utilized either the Spearman’s Rho or Pearson correlation, depending on the distribution characteristics of the data. As described in Fox and Levin’s work (2007), a coefficient value from −1 to −0.91 means a perfect negative correlation; −0.9 to −0.6 means a strong negative correlation; −0.59 to −0.3 means a moderate negative correlation; −0.29 to −0.1 means a weak negative correlation; −0.09 to 0.1 means no correlation; 0.11 to 0.3 means a weak positive correlation; 0.31 to 0.6 means a moderate positive correlation; 0.61 to 0.9 means a strong positive correlation; and 0.91 to 1 means a perfect positive correlation [39]. The value of significance (Sig. 2-tailed) was also followed. If Sig. is less or equal to 0.05, the correlations are significant. All the data were transformed into natural logarithms because of the high values in order to decrease the skewness and to increase the linearity of the regressions.
Linear regression and multiple regression were used to find how changes in the independent variable change the dependent variable. When using linear or multiple regression analysis, the data were tested for linear relationship, normal distribution (Shapiro–Wilk test), and autocorrelation (Durbin–Watson). The linear regression formula is as follows:
where Y = dependent variable, X = independent variable, a = intercept (constant), and B = regression coefficient [40].
Y = a + BX,
When both values are log-transformed, the regression equation becomes as follows:
Log10Y = a + BLog10X,
The coefficients can be interpretated as the elasticity of the Y variable compared to X variable [41]. One percent change in the independent variable changes with B percent of the dependent variable. For the multiple regression, the equation used was as follows:
where B1 to Bn are the regression coefficients.
Log10Y = a + B1 log10X + B2 log10Z + … Bn log10W
To find the effect of economic variable over the imports of nonrenewable energy resources, we used the backward method. Considering the links found in the literature and the correlations between variables, we found which economic variable best predicts a certain type of energy import. Knowing that this method has advantages but also is contested by some researchers [42], it was used because it is important to find the best fit by removing the least important variables. We considered the imports to be the dependent variable, and the independent variables were the ones with which we found a correlation with the GDP, R&D, and GVA sectors.
3. Results
The chosen data are for all imports, not linked with the country of origin or the price paid for transport. The official data found in the Eurostat database show that the EU imports the most oil and petroleum (Figure 1), followed by natural gas and solid fossil fuel. Those are obviously linked with the economic context. The effect of the financial crisis (2007–2009) and the COVID-19 pandemic on the imports of NRES can be observed.
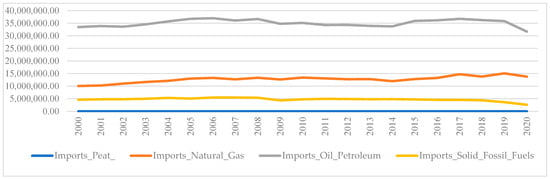
Figure 1.
Graphic illustration of evolution in energy imports. Source: EU Commission Database [36].
In order to have a complete overview of the data, it is important to know the links and the direction of correlation between the energy imports, the GDP, R&D, and the components of the GVA. After testing the distribution of data (Shapiro–Wilk test), we concluded that all of the data are normally distributed (Sig. > 0.05). The Pearson Correlation test shows that the total imports of energy are in moderate positive correlation with the GDP (r = 0.486, sig. = 0.026) and with some of economic sectors: GVA Manufacturing (r = 0.561, sig. = 0.009), GVA Constructions (r = 0.554, sig. = 0.003), and GVA Wholesale (r = 0.616, sig. = 0.005).
This resulted in an increased demand for energy, regardless of the source (renewable or nonrenewable). Due to the low prices paid for imported energy, even if investments were made to increase the RES, a high rate of energy came from imports. The relationship between total energy imports and the studied economic variables does not exhibit a predictable pattern. The literature suggests the opposite, [13,14], so further research is necessary to uncover the underlying reasons behind these findings and shed more light on the relationship between energy imports, the GDP, and R&D. Several factors may contribute to these findings. To begin with, it is evident that the EU’s GDP and GVA experienced a consistent increase throughout the period from 2000 to 2021, as depicted in Figure 2. Overall, while some variables showed clear trends, such as GDP_total, GVA_Industry, GVA_Manufacturing, GVA_Wholesale_Retail_Transport_Acc_Services, and RD_EU, others displayed more fluctuations or no significant trend. These observations provide insights into the dynamics of the EU-27 economy and specific sectors during the analyzed period.
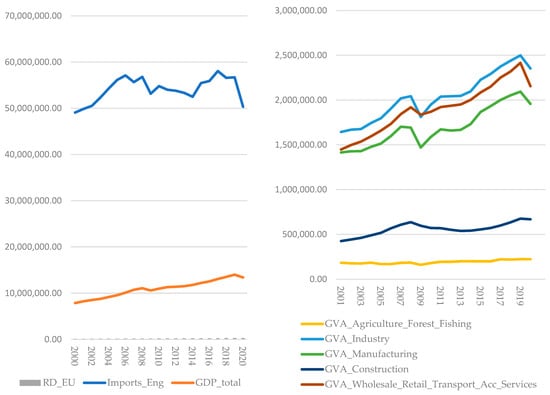
Figure 2.
Graphic illustration of evolution in total energy imports, GDP, R&D, and GVA. Source: EU Commission database [36].
The EU has actively pursued measures to diversify its energy sources; reduce dependence on imports; and promote renewable energy, energy efficiency, and domestic energy production. These efforts weaken the direct link between total energy imports and the GDP. Moreover, variations in economic structure across countries, with some having a higher concentration of energy-intensive industries and others relying more on services or technology sectors, can influence the correlation between energy imports and the GDP. Additionally, the implementation of energy efficiency measures in the EU has decoupled GDP growth from energy consumption in a few countries, allowing economic growth to occur without a proportional increase in energy imports. It is important to note that the GDP is influenced by a multitude of factors, including labor productivity, investment, innovation, and government policies, which can have a stronger impact than energy imports alone. In the EU, R&D activities have primarily focused on technological advancements, innovation, economic competitiveness, and societal well-being, with energy-related research and innovation being only a part of the overall R&D landscape. Consequently, the connection between total energy imports and R&D may not receive significant emphasis.
The most imported energy resources, oil and petroleum products, are not correlated with any of studied variables linked with economy in EU-27. This may happen due to the high spread of usage in all economic sectors. The lack of correlation between total energy imports and the studied economic variables aligns with findings from other studies. One author suggests that this absence of correlation can be attributed to factors such as derived demand, improved efficiency, and fuel substitution for oil and petroleum products [43].
A comprehensive examination of the EU-27 countries reveals valuable insights into the unique characteristics of each state and the intricate relationships between imports of oil and petroleum products with various economic sectors. By delving deeper into the data, we can gain a better understanding of the specific dynamics at play and identify key factors influencing the patterns of oil and petroleum imports in each country (Table 3).
Table 3.
Multiple regression analysis for imports of oil and petroleum products in EU_27 countries.
Belgium can decrease its imports of oil by focusing on several key factors. Firstly, there is a significant positive relationship between the variable “GVA_wholesale” and oil imports. Therefore, promoting domestic wholesale and retail trade, transport, accommodation, and food service activities and reducing dependence on foreign suppliers can help decrease oil imports. Additionally, the negative coefficient for “GVA_constr” suggests that investing in sustainable construction practices and energy-efficient infrastructure can contribute to a decrease in oil imports. The negative coefficient for “GVA_inf_comm” indicates that further enhancing the efficiency and sustainability of the information and communication sector and increasing the value added from this sector can also contribute to a decrease in oil imports. Promoting telecommuting and remote work options and adopting energy-efficient technologies can help reduce the overall demand for oil-based energy in this sector. The adjusted R-square value of 0.788 suggests that the predictors included in the analysis can explain approximately 78.8% of the variance in oil imports.
Encouraging economic growth and development is crucial for Bulgaria to reduce its reliance on oil imports. The positive coefficient for “GDP” implies that increasing this variable will also increase the dependence on oil and petroleum products. The negative coefficient for “GVA_inf_comm” underscores the significance of adopting sustainable and efficient practices in the information and communication sector. Diversifying the economy and reducing dependency on oil-dependent sectors is essential. By focusing on sectors with less oil dependence, Bulgaria can decrease its need for substantial oil imports. The high adjusted R-square value of 0.884 indicates that the selected predictors in the analysis explain around 88.4% of the variance in oil imports in Bulgaria. This suggests that the variables considered are highly relevant in comprehending the factors influencing oil import dynamics in the country.
Czechia can take steps to decrease its imports of oil based on the findings of the regression analysis. The negative coefficient for the variable “GVA_other” suggests that increasing the value added from professional, scientific, technical, administrative, support service, public administration, defense, education, human health, and social work activities can contribute to a decrease in oil imports. Additionally, the positive coefficient for “GVA_wholesale” indicates that developing domestic wholesale capabilities can help reduce oil imports. By focusing on enhancing the country’s wholesale capabilities and reducing dependence on foreign suppliers, Czechia can decrease its reliance on imported oil. The adjusted R-square value of 0.778 indicates that the predictors included in the analysis can explain approximately 77.8% of the variance in oil imports in Czechia.
Denmark can decrease its oil imports by focusing on several key factors. The positive coefficient for “GVA_ind” suggests that promoting growth and innovation in the industrial sector can lead to a reduction in oil imports. By investing in sustainable and energy-efficient practices in the industrial sector, Denmark can reduce its reliance on oil-based energy. The negative relation between the GDP and imports of oil and petroleum products shows the great importance of strengthening the economy in this country.
Estonia can decrease its oil imports by developing its domestic wholesale capabilities.
Finland can reduce its oil imports by promoting sustainable economic growth. The positive coefficient for “GDP” suggests that economic development without diversification can lead to an increase in oil and petroleum imports.
In Germany, the positive coefficient for “GVA_wholesale” indicates that developing robust domestic wholesale networks can help reduce oil imports. Additionally, the negative coefficient for “R_D_gov” suggests that investing in research and development from governmental sources can contribute to a decrease in oil imports.
In Hungary, the negative coefficient for “GVA_agr” and “GVA_inf_comm” suggests that increasing value added from agricultural and information sectors can contribute to a decrease in oil imports.
Ireland can decrease its oil imports by focusing on investments in R&D, especially in business and education sectors.
Latvia can decrease its oil imports by focusing on several key factors. The positive coefficient for “GDP” suggests that the two indicators are linked, and by increasing the GDP, the imports of oil will also increase. By fostering a strong and diversified economy, Latvia can potentially decrease its reliance on oil and petroleum products. The negative coefficients for “GVA_constr”, “GVA_ind”, and “GVA_inf_comm” indicate the importance of sustainable practices in the construction, industrial, and information and communication sectors.
The negative coefficients for “GVA_constr” and “R_D_bus” in the Netherlands suggest specific areas of focus. By promoting sustainable construction practices, reducing dependence on sectors heavily reliant on oil, and investing in research and development for sustainable business solutions, the Netherlands can decrease its reliance on imported oil and petroleum products.
The positive coefficient for “GVA_agr” indicates the importance of modernizing the agricultural sector, which often consumes significant amounts of oil-based energy, in Romania. Additionally, increasing the value added in the information and communication sector can contribute to a decrease in oil imports in Romania.
The negative coefficients for “R_D_bus” and “GVA_wholesale” suggest that by investing in research and development for sustainable business solutions and increasing the gross value added from wholesale, Slovakia can reduce its dependence on imported oil and petroleum products.
The dependency on imports of natural gas is one of the biggest problems that the EU faces at present. The collected data show a strong positive correlation between the quantity of imported natural gas and the GDP (r = 0.859, sig. < 0.001), GVA from industry (r = 0.840, sig. < 0.001), GVA from manufacturing (r = 0.810, sig. < 0.001), GVA from construction (r = 0.896, sig. < 0.001), GVA wholesale retail transport and services (r = 0.868, sig. < 0.001), GVA information and communication (r = 0.835, sig. < 0.001), and GVA real estate (r = 0.840 sig. < 0.001) and a moderate positive relation with GVA from agriculture, forest, and fishing (r = 0.600, sig. = 0.004).
The multiple regression (Table 4) shows that imports of natural gas can be predicted in 87.3% of cases by the GDP, investments in R&D, GVA manufacturing, and GVA real estate. A 1% increase in the European GDP will increase the imports of natural gases by 4.16%. The outcomes of the study align with those of the existing literature, as other authors have also discovered a positive relationship between the two variables in Korea [44]. Investments in research and development can be a solution for decreasing the natural gas dependency. The results show that a 1% increase in investments in R&D will decrease the natural gas imports by 0.80%. This is not surprising when considering that most of the organizations invest in increasing efficiency and decrease the energy consumption. If the value added from the real estate sector increases by 1%, the imports of natural gas will decrease by 1.5%. More than 40% of total gas demand in the EU was from the residential sector in 2020 [45]. There are also solutions for replacing the gas consumption with other more efficient energy resources, but this means more investments, which may be a barrier for many. The benefit is that, with the increased price of natural gas, many will consider a change. If governments will increase the funds for renewables through incentives, this might help in passing from traditional usage to other sources of energy that are renewable, more efficient, and have less emissions. Moreover, if the GVA from the manufacturing sector increases by 1%, the natural gas imports will decrease by 0.89%. The literature shows that manufacturing is the most gas-intensive sector, and investments to arrive at zero-emissions targets decrease this dependency [46].
Table 4.
Multiple regression analysis for imports of natural gas in EU-27, as a dependent variable.
The results indicate a drawback in EU independence from natural gas. At this moment, the EU cannot flourish without imported natural gas. Due to the imposed restrictions, namely the increased price and decreased of natural gas from Russia, the EU must find solutions. In the short term, the EU’s solution for the gas crisis was to replace imports of NG from the East with imports of liquified natural gas (LNG). However, this rases other problems. Many households or machines used in industry sectors do not work properly when the type of gas is changed or the amount of CO2 released into the atmosphere increases [8]. A medium-term solution can be the extraction of natural gases from the Black Sea. Romanians will already start the extraction this year, but due to the low capacities and the lack of investments, the gases are still going to be in small quantities. Another solution can be the replacement of imported natural gas with hydrogen converted from RES (solar and wind), as one study suggests [47]. This may be cheaper and easier to transport. Moreover, a hybrid solution of hydrogen, heat, and electric storage may be the answer to the problem if technological, societal, and legal barriers can be surpassed [48].
Based on the regression analysis (Table 5), several key factors can contribute to decreasing the imports of natural gas in different countries:
Table 5.
Multiple regression analysis for imports of natural gas by EU-27 country, as a dependent variable.
Belgium: The construction, information, and communication sectors play significant roles in increasing natural gas imports. Promoting energy-efficient construction practices and enhancing sustainable technologies in the information and communication sector can help decrease the reliance on natural gas.
Croatia: At the present, increasing the investments in the R&D business is followed by an increase in demand for natural gas from imports. Investing in innovative technologies, energy-efficient processes, and renewable energy sources can contribute to decreasing the demand for natural gas.
Estonia: The construction and other sectors are important considerations for decreasing natural gas imports. Implementing energy-efficient construction practices and increasing the added value from professional, scientific, technical, administrative, support service, public administration, defense, education, human health, and social work activities can help reduce the reliance on natural gas.
Greece: The agricultural, construction, and business sectors play crucial roles in reducing natural gas imports, accounting for 79% of the observed results. By increasing agricultural income, improving the construction sector, and redirecting investments in the business sector, it is possible to decrease reliance on natural gas imports. These factors contribute significantly to achieving this goal and should be prioritized in efforts to reduce the need for natural gas.
Poland: The construction, industrial, and government-led R&D sectors are important for decreasing natural gas imports. Implementing energy-efficient construction practices and governmental investments in R&D for clean and renewable energy sources can help decrease reliance on natural gas.
Portugal: The GDP and industrial sector are critical factors in reducing natural gas imports. An increase in economic growth, without any corresponding changes in the structure of the GDP, can lead to a greater reliance on natural gas. It is important to focus on strategies that promote sustainable industrial practices and diversify the energy mix to decrease dependence on natural gas.
Further, the Pearson’s test shows a negative correlation between fossil fuels imports and the mentioned economic variables. With the increase in the GDP (r = −0.532, sig. = 0.013); R&D (r = −0.643, sig. = 0.002); the GVA from agriculture, forests, and fishing (r = −0.601, sig. = 0.004); the GVA from industry (r = −0.502, sig. = 0.020); the GVA from wholesale, retail, and transport services (r = −0.482, sig. = 0.027); the GVA from information and communication (r = −0.678, sig. < 0.001); and the GVA from real estate (r = −0.533, sig. = 0.013), the imports of fossil fuels will decrease. The collected data about solid fossil fuels show the decreasing dependency of the EU on this source of energy. The major benefit is that the decrease in the transformation of this resource to energy will decrease the CO2 emissions (the transformation of fossil fuels into energy is linked with the highest CO2 emissions) [49].
The multiple regression analysis (Table 6) shows that, for 91.7% of cases, a 1% increase in investments in R&D will decrease the imports of fossil fuels by 2.21%. This result is not surprising knowing that investments in R&D increase the efficiency and the usage of renewables as an energy resource. Moreover, with the increase in the information and communication sector by 1%, the imports of fossil fuels will decrease by 2.77%. This is most likely because, in the service sector, the usage of energy is lower than in other economic sectors. The literature shows that, with the increase of services’ share in an economy, the share of energy decreases, and the usage of renewables sources increases [50]. On the other side, when the agriculture sector increases by 1%, the imports of fossil fuels increase by 0.82%. The links between the two variables are mainly because, in the production of chemicals for fertilizers, drying grain, and heat for glasshouses, the farmers use energy from fossil fuels [51]. When other GVA sectors increase by 1%, the imports of fossil fuels increase by 5.1%.
Table 6.
Multiple regression analysis for imports of fossil fuels as a dependent variable.
Based on the regression analysis (Table 7), the following insights can be derived regarding the reduction of fossil fuel imports:
Table 7.
Multiple regression analysis for imports of fossil fuels in EU_27 countries as dependent variable.
The adjusted R-square value of 0.787 suggests that R&D investments in education and the GVA from industry and the information and communication sectors explain approximately 78.7% of the variability in the imports of fossil fuels in Austria. Increasing investments in R&D in education and increasing the value added from information and communication sectors can help decrease the imports of fossil fuels. In Belgium, decreasing fossil fuel imports can be achieved by focusing on the information and communication sector and GVA other. In Croatia, R&D efforts in the business sector play a significant role in decreasing fossil fuel imports.
Agriculture, industry, and other sectors are crucial for reducing fossil fuel imports in Czechia. Promoting sustainable agricultural practices, optimizing industrial processes, and investing in alternative energy sources can contribute to decreasing the dependence on fossil fuels.
Focusing on construction, information and communication, and government investments in R&D sectors can help decrease fossil fuel imports in Denmark. Implementing energy-efficient construction practices and changing the actual trajectory of this sector, increasing the value added in communication, and increasing governmental investments in R&D can reduce the reliance on fossil fuels.
In Finland, economic factors, specifically the GDP, are important for reducing fossil fuel imports. The information and communication sector, wholesale trade, GDP, and industry are significant for decreasing fossil fuel imports in Ireland.
In Lithuania, the GDP plays a crucial role in reducing fossil fuel imports. By increasing the economy while decreasing the value added from industry and construction, Lithuania has great chances for reducing its dependence on imported fossil fuels. For Luxembourg, the construction, industry, and government-led R&D sectors are essential for reducing fossil fuel imports. The GDP and investments in business R&D are significant for reducing fossil fuel imports in Poland.
The construction and other sectors are important considerations for decreasing fossil fuel imports in Slovakia. In Slovenia, the agricultural sector plays a significant role in reducing fossil fuel imports. Promoting sustainable agricultural practices can contribute to decreasing reliance on fossil fuels. The increase of value added from the construction sector will decrease the fossil fuel imports by 0.23% in Sweden.
Based on the available data, the analysis reveals that the relationship between GDP and imports varies across different countries. In Austria, Finland, and Ireland, there is an inverse relationship, meaning that as the GDP increases, imports tend to decrease. This suggests that these countries rely less on imports as their economies grow. On the other hand, Poland shows a positive relationship, indicating that as the GDP increases, so do imports. This implies that Poland’s growing economy is accompanied by an increased demand for imported goods.
4. Conclusions
In order to achieve the targets set by the Paris Agreement, and considering the embargos against the imports from Russia, practical solutions must be implemented without relying on imported polluting energy sources.
The absence of a significant correlation indicates that variations in oil and petroleum product imports do not have a direct or linear influence on GDP, GVA sectors, or R&D when analyzing the data for EU-27. This suggests that factors other than oil imports play a role in shaping these economic indicators and the level of research and development activities. Analyzing each country, the variable that most commonly explains the imports of oil and petroleum products in various countries, based on the multiple regression from Table 3, is the wholesale gross value added. The variable appears in the multiple regression equations for Belgium, Czechia, Denmark, Estonia, Germany, Hungary, the Netherlands, Romania, and Slovakia. In these countries, an increase in wholesale activities is associated with higher imports of oil and petroleum products. However, it is important to highlight that promoting local sources for wholesale activities and decreasing the transport share can help reduce the reliance on imports for oil and petroleum products.
Notably, imports of natural gas are heavily linked to GDP, and a mix of solutions must be implemented to decouple the two indicators. Decreasing the investments in R&D, the gross value added from manufacturing and real-estate sectors, will increase the imports from natural gas when considering the EU as a single entity. Upon closer examination of Table 5, it becomes evident that the variable most common in explaining the power for the imports of natural gas across multiple countries is the gross value added in the construction sector. Notably, this variable exhibits a positive coefficient in Estonia, Greece, and Poland, implying that an upsurge in construction activities corresponds to an increase in natural gas imports. This finding suggests a potential link between the construction sector’s demand for energy and the need to import natural gas as a fuel source.
Considering the data from the entire EU-27 region, it becomes evident that investing in R&D plays a critical role in reducing dependence on fossil fuels. However, the positive coefficient for the GVA in the agriculture sector indicates a concerning trend of increased fossil fuel imports, suggesting a heavy dependence. Conversely, the negative coefficient for the GVA in the information and communication sector demonstrates the sector’s active contribution to reducing fossil fuel demand. Based on the data from each EU-27 country (Table 7), the analysis highlights the diverse nature of the relationship between the GDP and imports of fossil fuels. Austria, Finland, and Ireland exhibit an inverse relationship, wherein as the GDP rises, imports decline. This suggests that these countries experience a reduced reliance on imports as their economies expand. In contrast, Poland demonstrates a positive relationship, indicating that as the GDP increases, imports of fossil fuels also increase. This suggests that Poland’s growing economy is accompanied by a heightened demand for imported goods.
Author Contributions
Conceptualization, I.A.I. and P.H.; methodology, I.A.I.; software, I.A.I.; validation, D.D.M. and S.D.C.; formal analysis, I.A.I.; investigation, I.A.I.; resources, I.A.I. and S.D.C. data curation, D.D.M.; writing—original draft preparation, I.A.I.; writing—review and editing, I.A.I., P.H. and S.D.C.; visualization, D.D.M.; supervision, I.A.I.; project administration, I.A.I.; funding acquisition, I.A.I. All authors have read and agreed to the published version of the manuscript.
Funding
This research was funded by European Union’s Horizon 2020 research and innovation program, under the Marie Sklodowska-Curie Grant Number 801505.
Data Availability Statement
All the data is from the official EU database, as cited.
Conflicts of Interest
The authors declare no conflict of interest. The funders had no role in the design of the study; in the collection, analyses, or interpretation of data; in the writing of the manuscript; or in the decision to publish the results.
References
- ISO/IEC 25010:2011; Systems and Software Engineering—Systems and Software Quality Requirements and Evaluation (Square)—System and Software Quality Models. ISO: Geneva, Switzerland, 2011. Available online: https://www.iso.org/standard/35733.html (accessed on 1 February 2023).
- Leonard, M.; Pisani-Ferry, J.; Shapiro, J.; Tagliapietra, S.; Wolff, G. The Geopolitics of the European Green Deal. Policy Contribution. 2021. Available online: https://www.bruegel.org/wp-content/uploads/2021/02/PC-04-GrenDeal-2021-1.pdf (accessed on 15 June 2023).
- European Commission. “RePowerEU”, 18 May 2022. European Commission P. REPowerEU: A Plan to Rapidly Reduce Dependence on Russian Fossil Fuels and Fast forward the Green Transition. Available online: https://ec.europa.eu/commission/presscorner/detail/en/IP_22_3131 (accessed on 11 November 2022).
- Grekou, C.; Hache, E.; Lantz, F.; Massol, O.; Mignon, V.; Ragot, L. Guerre en Ukraine: Bouleversements et Défis Énergétiques en Europe”, Policy Brief CEPII. 2022. Available online: https://policycommons.net/artifacts/2459406/guerre-en-ukraine/3481203/ (accessed on 26 December 2022).
- David, B.; Benjamin, M.; Camille, L.; Philippe, M. The Economic Consequences of a Stop of Energy Imports from Russia, Conseil D’analyse Economique. Available online: https://www.energiesdelamer.eu/wp-content/uploads/2022/04/05-04-022-cae-focus84-Embargo-sur-les-importations-de-gaz-russe.pdf (accessed on 20 April 2022).
- Alison, O.; A Guide to Gross Value Added (GVA) in Scotland. 23 February 2018. Available online: https://sp-bpr-en-prod-cdnep.azureedge.net/published/2018/2/23/A-Guide-to-Gross-Value-Added--GVA--in-Scotland/SB%2018-15.pdf (accessed on 2 December 2022).
- European Commission. Where Does Our Energy Come from? Available online: https://ec.europa.eu/eurostat/cache/infographs/energy/bloc-2a.html (accessed on 9 March 2022).
- European Commission. Green Deal. Available online: https://ec.europa.eu/info/strategy/priorities-2019-2024/european-green-deal/energy-and-green-deal_en (accessed on 9 March 2022).
- Üzumcu, A.; Ülker, Ç.K.; Adem, K. Energy Import and Economic Growth: An Analysis on Some Energy Importer Countries; Cumhuriyet Üniversitesi İktisadi ve İdari Bilimler Dergis: 2019; Volume 20, 317–334. Available online: http://esjournal.cumhuriyet.edu.tr/en/pub/issue/50375/526582 (accessed on 15 March 2023).
- Murshed, M.; Mahmood, H.; Alkhateeb, T.; Bassim, M. The Impacts of Energy Consumption, Energy Prices and Energy Import-Dependency on Gross and Sectoral Value-Added in Sri Lanka. Energies 2020, 13, 6565. [Google Scholar] [CrossRef]
- Melike, B.; Fazıl, K. The relation between growth, energy imports, militarization and current account balance in China, Israel and South Korea. Energy 2022, 242, 122537. [Google Scholar] [CrossRef]
- Dinçer, H.; Yüksel, S.; Cabolat, Z.N. A Strategic Approach to Reduce Energy Imports of E7 Countries: Use of Renewable Energy. In Handbook of Research Anthology on Clean Energy Management and Solutions; Edited by Information Management Association; IGI Global: Hershey, PA, USA, 2021; pp. 1796–1816. [Google Scholar]
- Welfens, P.J.J. A Russian Energy Import Boycott by Germany or the EU as a Policy Option? In Russia’s Invasion of Ukraine; Palgrave Macmillan: Cham, Switzerland, 2023; pp. 95–98. [Google Scholar]
- Bachmann, R.; Kuhn, M.; Peichl, A.; Baqaee, D.; Löschel, A.; Pittel, K.; Bayer, C.; Moll, B.; Schularick, M. What if? The Economic Effects for Germany of a Stop of Energy Imports from Russia. EconTribute. Available online: https://www.econtribute.de/RePEc/ajk/ajkpbs/ECONtribute_PB_028_2022.pdf (accessed on 7 March 2022).
- IEA. A 10-Point Plan to Reduce the European Union’s Reliance on Russian Natural Gas; IEA: Paris, France, 2022. [Google Scholar]
- Cătut, M.; Egenhofer, C.; Elkerbout, M.H. Future of Gas in Europe: Review of Recent Studies on the Future of Gas; CEPS, Research Report, 2019; Volume 3. Available online: https://www.ceps.eu/wp-content/uploads/2019/08/RR2019-03_Future-of-gas-in-Europe.pdf (accessed on 11 February 2023).
- Calanter, P. Opportunities of Capitalizing Romania’s New Offshore Gas Reserves by Increasing Domestic Consumption and Creating a Regional Gas Hub; Institute for World Economy of the Romanian Academy: 2018; Volume 6, pp. 171–180. Available online: https://ideas.repec.org/a/ntu/ntugeo/vol6-iss2-18-171.html (accessed on 13 May 2023).
- Borjesson, M.; Ahlgren, O. Cost effective biogas utilization—A modeling assessment of gas infrastructural options in a regional energy system. Energy 2012, 48, 212–226. [Google Scholar] [CrossRef]
- Schumacher, J.; Bunting, T.; Shrimali, G.; Caldecott, B. The Race to Replace: The economics of Using Renewables to Free Europe from Russian Gas; Oxford Sustainable Finance Group: Oxford, UK, 2023. [Google Scholar]
- Svetlana, F.; Rodrigo, Z. How (a)symmetric is the response of import demand to changes in its determinants? Evidence from European energy imports. Energy Econ. 2018, 69, 379–394. [Google Scholar]
- Adewuyi, A.; Awodumi, O. Environmental pollution, energy import, and economic growth: Evidence of sustainable growth in South Africa and Nigeria. Environ. Sci. Pollut. Res. 2021, 28, 14434–14468. [Google Scholar] [CrossRef] [PubMed]
- Adolfsen, J.F.; Gerinovics, R.; Manu, A.-S.; Schmith, A. Oil price developments and Russian oil flows since the EU embargo and G7 price cap. ECB Econ. Bull. 2023, 2. Available online: https://www.ecb.europa.eu/pub/economic-bulletin/focus/2023/html/ecb.ebbox202302_02~59c965249a.en.html (accessed on 2 June 2023).
- Zhao, X.; Wu, Y. Determinants of China’s energy imports: An empirical analysis. Energy Policy 2007, 35, 4235–4246. [Google Scholar] [CrossRef]
- Brutschin, E.; Fleig, A. Innovation in the energy sector—The role of fossil fuels and developing economies. Energy Policy 2016, 97, 27–38. [Google Scholar] [CrossRef]
- Perdana, S.; Vielle, M.; Schenckery, M. European Economic impacts of cutting energy imports from Russia: A computable general equilibrium analysis. Energy Strategy Rev. 2022, 44, 101006. [Google Scholar] [CrossRef]
- Moosavian, S.F.; Borzuei, D.; Zahedi, R.; Ahmadi, A. Evaluation of research and development subsidies and fossil energy tax for sustainable development using computable general equilibrium model. Energy Sci. Eng. 2022, 10, 3267–3280. [Google Scholar] [CrossRef]
- Tugcu, C.T.; Ozturk, I.; Aslan, A. Renewable and non-renewable energy consumption and economic growth relationship revisited: Evidence from G7 countries. Energy Econ. 2012, 34, 1942–1950. [Google Scholar] [CrossRef]
- Bhattacharya, M.; Paramati, S.R.; Ozturk, I.; Bhattacharya, S. The effect of renewable energy consumption on economic growth: Evidence from top 38 countries. Appl. Energy 2016, 162, 733–741. [Google Scholar] [CrossRef]
- Shahbaz, M.; Loganathan, N.; Zeshan, M.; Zaman, K. Does renewable energy consumption add in economic growth? An application of auto-regressive distributed lag model in Pakistan. Renew. Sustain. Energy Rev. 2015, 44, 576–585. [Google Scholar] [CrossRef]
- Long, X.; Naminse, E.Y.; Du, J.; Zhuang, J. Nonrenewable energy, renewable energy, carbon dioxide emissions and economic growth in China from 1952 to 2012. Renew. Sustain. Energy Rev. 2015, 52, 680–688. [Google Scholar] [CrossRef]
- Salim, R.; Hassan, K.; Shafiei, S. Renewable and non-renewable energy consumption and economic activities: Further evidence from OECD countries. Energy Econ. 2014, 44, 350–360. [Google Scholar] [CrossRef]
- European Comission. EC Europa. Available online: https://ec.europa.eu/info/strategy/priorities-2019-2024/european-green-deal/finance-and-green-deal/just-transition-mechanism_en (accessed on 20 June 2022).
- Eurostat. GDP and Main Aggregates-International Data Cooperation Annual Data. 2022. Available online: https://ec.europa.eu/eurostat/databrowser/view/NAIDA_10_GDP__custom_2870267/default/table?lang=en (accessed on 7 June 2022).
- Eurostat. Data Browser, Eurostat. Available online: https://ec.europa.eu/eurostat/databrowser/view/RD_E_GERDTOT__custom_2837378/default/table?lang=en (accessed on 1 May 2022).
- Eurostat. Eurostat Data Browser. 2022. Available online: https://ec.europa.eu/eurostat/databrowser/view/NAMA_10_A10__custom_2568689/default/table (accessed on 7 June 2022).
- Eurostat. Data Browser, Eurostat. Available online: https://ec.europa.eu/eurostat/databrowser/view/NRG_BAL_S__custom_2562800/default/table (accessed on 1 May 2022).
- Elliott, A.; Woodward, W. Statistical Analysis Quick Reference Guidebook with SPSS Examples, 1st ed.; Sage Publications: London, UK, 2007. [Google Scholar]
- Ghasemi, A.; Zahediasl, S. Normality Tests for Statistical Analysis: A Guide for Non-Statisticians. Int. J. Endocrinol. Metab. 2012, 10, 486–489. [Google Scholar] [CrossRef]
- Levin, J.; Fox, J. Elementary Statistics in Social Research, 2nd ed.; Pearson Education: London, UK, 2007; ISBN 0-205-48493-X. [Google Scholar]
- Kafle, S.C. Correlation and Regression Analysis Using SPSS. OCEM J. Manag. Technol. Soc. Sci. 2019, 1, 126–132. [Google Scholar]
- Pedace, R. Econometrics for Dummies, 1st ed.; John Wiley and Sons, Inc.: Hoboken, NJ, USA, 2013. [Google Scholar]
- Ewout, W.S. Clinical Prediction Models: A Practical Approach to Development, Validation, and Updating; Springer New York: New York, NY, USA, 2008. [Google Scholar]
- Christof, R.; Titus, E. Oil Intensity: The Curiously Steady Decline of Oil in GDP; Columbia Center on Global Energy Policy: 2021. Available online: https://www.energypolicy.columbia.edu/wp-content/uploads/2021/09/LongTermOilIntensity_CGEP_Report_111122.pdf (accessed on 15 May 2023).
- Lim, H.; Yoo, S. Natural Gas Consumption and Economic Growth in Korea: A Causality Analysis. Energy Sources Part B Econ. Plan. Policy 2012, 7, 169–176. [Google Scholar] [CrossRef]
- ACER. 2021. Available online: https://acer.europa.eu/en/Gas/Documents/ACER_FACT-SHEETS_2021-07_02.pdf (accessed on 20 January 2023).
- OECD. How Vulnerable Is European Manufacturing to Gas Supply Conditions? 22 July 2022. Available online: https://www.oecd.org/ukraine-hub/policy-responses/how-vulnerable-is-european-manufacturing-to-gas-supply-conditions-01278ba3/ (accessed on 13 November 2022).
- Deme Group. Shipping Sun and Wind to Belgium Is Key in Climate Neutral Economy. January 2021. Available online: https://www.deme-group.com/sites/default/files/2021-01/Hydrogen%20Import%20Coalition%20Final%20Report.pdf (accessed on 25 August 2022).
- Federico, U.; Patrick, H.; Nicola, P. Development of Tools Enabling the Deployment and Management of a Multi-Energy Renewable Energy Community with Hybrid Storage. Chem. Eng. Trans. 2021, 86, 1423–1428. [Google Scholar]
- Kan, C.; Richard, C.W.; Michael, K.B. Carbon dioxide from fossil fuels. Adapting to uncertainty. Energy Policy 1980, 318–330. Available online: https://deepblue.lib.umich.edu/bitstream/handle/2027.42/23100/0000019.pdf?sequence=1 (accessed on 20 February 2023).
- Fotio, H.K.; Poumie, B.; Baida, L.A.; Nguena, C.L.; Adams, S. A new look at the growth-renewable energy nexus: Evidence from a sectoral analysis in Sub-Saharan Africa. Struct. Chang. Econ. Dyn. 2022, 62, 61–71. [Google Scholar] [CrossRef]
- Energy & Climate Intelligence Unit. Farming, Fertiliser, and Fossil Fuels. How the Gas Crisis Is Squeezing Britain’s Farmers. March 2022. Available online: https://ca1-eci.edcdn.com/Food-farming-fertiliser-March-2022-ECIU.pdf?v=1648124498 (accessed on 1 December 2022).
Disclaimer/Publisher’s Note: The statements, opinions and data contained in all publications are solely those of the individual author(s) and contributor(s) and not of MDPI and/or the editor(s). MDPI and/or the editor(s) disclaim responsibility for any injury to people or property resulting from any ideas, methods, instructions or products referred to in the content. |
© 2023 by the authors. Licensee MDPI, Basel, Switzerland. This article is an open access article distributed under the terms and conditions of the Creative Commons Attribution (CC BY) license (https://creativecommons.org/licenses/by/4.0/).