Abstract
The Ordovician Wulalike marine siliceous shale is a notable hydrocarbon source rock in the Northwestern Ordos Basin. However, the causes of quartz and organic matter enrichment are still a mystery to experts. In this study, the organic geochemistry (maceral compositions, Rbitu, and TOC) and elemental geochemistry (major and trace elements) with mineralogy (XRD) and petrography were jointly acquired to systematically investigate the quartz origins and the paleoenvironment, and the main controlling factors for organic matter enrichment in the Wulalike shale. The results show that the organic matter is type I kerogen with low TOC concentrations (average 0.51%), and that the thermal evolution has reached mature and high mature stages (mean Requ is 1.08%). Three types of quartz are developed in Wulalike shale: biogenic quartz (average 63%) is the most dominant, followed by clastic quartz (average 31%) and microcrystalline quartz (average 6%). Babio and Ba/Al values indicate the low paleoproductivity, which is the primary cause for the low TOC found throughout the area. Redox indexes show the anoxic or dysoxic to oxic conditions from the bottom to the top of the section. Paleoclimate and paleowater depth proxies also changed from the bottom to the top. Various paleoenvironments and sedimentological evidence show that Wulalike shale went through the changing environments, and the early sedimentary environments were conducive to organic matter enrichment, leading to a relatively high TOC. The paleoproductivity and preservation conditions have an impact on organic matter enrichment. Based on the results of biogenic quartz distribution and sedimentary environments, it is considered that the bottom of the Wulalike Formation is the most favorable for shale gas exploration and development.
1. Introduction
Shale gas exploitation went through a significant progress over the last decade and has emerged as the most important driver of the global gas supply. The Lower Paleozoic Wufeng–Longmaxi Formation in the Sichuan Basin, South China, has become important for the future increase in gas reserves and production in China [1]. The Middle–Upper Ordovician Wulalike organic-rich marine shale in the northwestern margin of the Ordos Basin, North China, has not received much attention as it is believed to form a non-commercial shale gas characterized by a high permeability, low porosity, low strata pressure, and low total organic carbon (TOC) concentration [2,3,4]. However, shale gas has been gradually discovered in several exploratory wells in the Wulalike shale recently, e.g., the gas production of the Zhong4 well and Zhongping1 well, reaching up to 4.18 × 10⁴ m3/day and 6.42 × 10⁴ m3/day, respectively. This is the first time obtaining shale gas in the Lower Paleozoic of the Ordos Basin, which has aroused great interest in researchers. Meanwhile, shale oil was recently discovered in the Wulalike Formation in the southwestern margin of the Ordos Basin [4], which proves that the Wulalike Formation has development potential and is expected to become one of the main relay targets for unconventional oil and gas resources in China in the future. Gas-bearing layers in the Sichuan Basin are mainly distributed in the quartz-rich organic-rich shales in the lower part of the Longmaxi Formation [5]. In contrast, the Wulalike shale has a high content of quartz (more than 45%) and numerous siliceous organisms, but a low TOC concentration (averaging 0.49%) [3,6].
Quartz is one of the most prevalent minerals in shale (usually greater than 30%) [6,7], and it is not only positively connected with TOC content [8,9], but it is also a major determinant of shale reservoir quality [10,11]. It is derived primarily from four sources: terrigenous clastic quartz, Si-bearing hydrothermal fluids input, conversion of smectite to illite formed quartz (S-I quartz), and biogenic quartz. Furthermore, scholars [10,12,13,14] discovered that when analyzing the brittleness of shale, it is not enough to merely consider the volume content of the quartz, but that it is also necessary to clarify the origins of the quartz, as different sources contribute differently to the reservoir attributes [12]. Biogenic quartz has a greater impact on the brittleness of shale than S-I quartz and terrigenous clastic quartz, and can easily produce more fractures during hydraulic fracturing [10,14,15,16]. Furthermore, it is worth noting that biogenic quartz protects reservoir pores from destruction, but S-I quartz does not [14,17]. Biogenic quartz is formed by dissolution and recrystallization of siliceous plankton, such as radiolarians, sponge spicules, and algae [6,14]. Siliceous plankton is not only a source of high-quality hydrocarbon parent rock, but it also has an interior cavity that can help preserve organic matter (OM) by providing an OM-hosted space, which is linked to OM enrichment [14]. The OM is the prerequisite for shale gas formation and its sedimentary environment is directly related to hydrocarbon generation. The factors controlling OM enrichment can be summarized into two categories: OM input factors (e.g., paleoproductivity, paleoclimate, and terrigenous detrital input) and preservation condition factors (e.g., redox conditions, paleowater depth, and sedimentation rates) [17,18,19,20]. Three modes of OM enrichment have been proposed: (1) the high productivity model [9]; (2) the anoxic preservation model [21,22]; and (3) superposition of the two models above [23,24]. The deposition of the OM in shales in different sedimentary environments is controlled by various factors. For example, both the marine shale of the Longmaxi Formation and the North American shale have high productivity and good preservation conditions [7,25]. The continental shale of the Yanchang Formation was controlled by high productivity [26]. Moreover, the marine–continental transitional shale of the Shanxi Formation was affected by terrigenous clastic input and redox conditions [27]. Thus, it can be seen that understanding the quartz origins and sedimentary environment can not only predict the high-quality reservoirs, but also provide valuable guidance for the generation and evaluation of shale gas.
In this study, an array of analyses including TOC content, bitumen reflectance (Rbitu), organic maceral, mineral composition (XRD), as well as major and trace element concentrations, along with petrographic observations, were jointly acquired for the outcrop profile of the Wulalike shale in the northwest margin of the Ordos Basin. The purpose of this study is: (1) to clarify the OM characteristics and shale lithofacies type; (2) to identify different quartz sources and calculate their contents; (3) to elaborate on the sedimentary environments and their effects on OM enrichment; and (4) to reconstruct the accumulation model of OM. This study is expected to provide some basis for further shale gas exploration in the northwestern margin of the Ordos basin.
2. Geological Setting
Located in the west of the North China Craton (NCC), the Ordos Basin is a significant hydrocarbon-bearing basin in China, with an area of about 25 × 104 km2 [4,28] (Figure 1A). The basin includes six sub-tectonic units: Tianhuan Sag, Yimeng Uplift, Western Thrust Zone, Jinxi Fold, Yishan Slope, and Weibei Uplift (Figure 1B), and has undergone multi-stage tectonic evolution [29,30,31]. Since the early Ordovician, it was affected by the closure of the Qinling sea and Qilian sea; thus, the sedimentary characteristics in the Ordos Basin are significantly different from those in North China [32]. In the mid–late Ordovician period, influenced by the expansion of the Helan trough, the main part of the Ordos Basin began to uplift, while the western and southern margins subsided substantially, forming an L-shaped marginal sea and depositing a suite of deep water facies shale [33]. The study area is situated in the Zhuozishan district in the northwestern margin of the Ordos Basin, and the Ordovician is composed of the Sandaokan Formation, Zhuozishan Formation, Kelimoli Formation, Wulalike Formation, and Lashizhong Formation in ascending order [6] (Figure 2A). The Wulalike Formation is the target layer characterized by the grey–black bearing graptolite shale and a small amount of limestone interlayers [34], which is distributed in the western and southern margins of the basin, with the thickness ranging from 20 to 120 m and the burial depths varying from 1500 to 4700 m, as well as a low TOC contents [3,4,5,6].
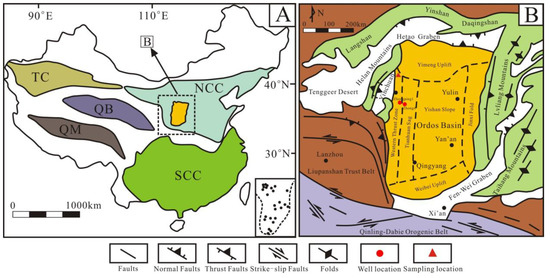
Figure 1.
(A) Map of major tectonic plates in China. NCC: North China Craton, SCC: South China Craton, TC: Tarim Craton, QB: Qaidam Block, QM: Qiangtang Massif. (B) Structural sketch of the Ordos basin and its adjacent areas. Modified from reference [29].
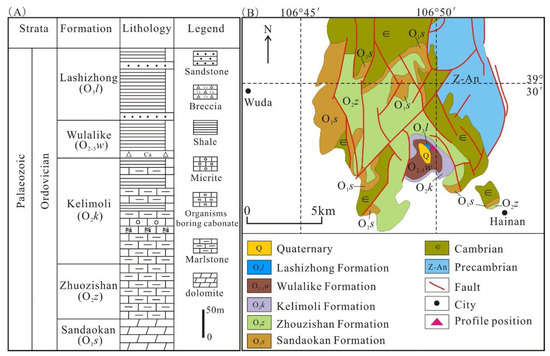
Figure 2.
(A) Ordovician stratigraphic histogram, northwest of the Ordos Basin. (B) Regional geological sketch map of the Zhuozishan area. Modified from reference [35].
3. Samples and Methods
To verify the integrity and representativeness of the sample distribution, the entire stratigraphic section of the Wulalike Formation in the Zhuozishan area was surveyed and sampled (Figure 1B and Figure 2B). All the samples were selected from the fresh, non-weathered surface. Thirty-two samples were chosen for TOC, major, and trace elements; 21 were prepared for XRD; and 9 samples for organic maceral compositions and Rbitu. Major and trace elements were measured in the Key Laboratory of Western Mineral Resources and Geological Engineering Ministry of Education, Chang’an University. TOC, XRD, maceral compositions, and Rbitu were conducted in the Key Laboratory of Oil and Gas Resources, Ministry of Education, Yangtze University.
For the major elements analysis, 0.5 g of powdered sample (200 mesh), 0.3 g of ammonium nitrate (oxidant), and 5 g of anhydrous lithium tetraborate (co-solvent) were weighed and mixed evenly. Next, 0.5 g of potassium permanganate release agent was added to the crucible. The mixed sample was placed in a crucible and heated at 1100 °C for 6 min in a molten furnace; the molten mixture was then poured out to form a translucent sheet after cooling. The elements were tested using the Shimadzu XRF-1800 spectrometer, and the relative error of detection was less than 5%. Another 1 g of sample was heated to 1000 °C in the molten furnace, and when cooled to room temperature, the sample was re-weighed to calculate the loss on ignition.
For the trace elements test, 50 mg of the 200 mesh powdered sample was firstly weighed in a solution tank, and 0.5 mL of HNO3 and 1 mL of HF were subsequently added. The mixture sample was heated in an oven at 190 °C for 48 h. After cooling, it was taken out and steamed in an electric heating plate at 140 °C to dry. Next, 2.5 mL of 40% HNO3 was added and heated in the cylinder liner at 140 °C for 4 h to dissolve the sample again. After re-melting, the solution was diluted to 50 g with 2% HNO3 in a polyethylene vial for analysis. The American Thermoelectric X-7 inductively coupled plasma mass spectrometer was used for testing. The relative error was less than 5%.
For the TOC analysis, 0.1 g of each 200 mesh sample was firstly weighed. The samples were thoroughly immersed in 10% diluted hydrochloric acid to eliminate inorganic carbon and dried at 70 °C. After treatment, the samples were washed with distilled water several times to eliminate any remaining acid. The pretreatment samples were thoroughly burnt in oxygen at 1200 °C to convert all organic carbon into carbon dioxide. The Leco CS-400 carbon analyzer was used to measure the volume of CO2 to estimate the TOC content with an analytical uncertainty of less than 0.1%.
The 200 mesh samples were mixed with ethanol for XRD analysis and then evenly coated onto slides. After the ethanol was evaporated, the samples were radiated using a PW1730 diffractometer with an operating voltage of 40 KV and a current of 100 mA. The minerals were identified based on the diffractograms using the Origin 8.5 software. Precipitation was used to separate the clay minerals, and then X-ray diffraction was used to determine the relative amount of each type of mineral. The analytical uncertainties were less than 5%.
To determine the microscopic components and Rbitu, the sample was cut into blocks of 2 cm × 2 cm along the vertical plane, placed in a fixed grinding tool, and poured into the epoxy resin for cold curing. After complete curing, automatic grinding and polishing machines and alumina polishing solutions were used for grinding and polishing. After observation under a 20× dry objective lens, the polished surface had no stains and scratches with a clear boundary between components. After the sample was completely dried, the macerals were identified under oil immersion reflected light and fluorescence conditions using a Leica DM4500 microscope with a 50 times objective. The Leica DM4500P polarizing microscope with the MPS200 photometer was used to measure the Rbitu.
4. Results
4.1. Petrographic Features
The Wulalike Formation is dominated by grey and black shale, with a weathered and brittle surface in the outcrop (Figure 3A). Graptolites can be observed on a bedding plane of shale, showing vein-like, short linear, and grid-like shapes, with sizes ranging from 20 μm to several centimeters (Figure 3B,C). Horizontal bedding is common in shale (Figure 3D), indicating a deep water sedimentary environment.
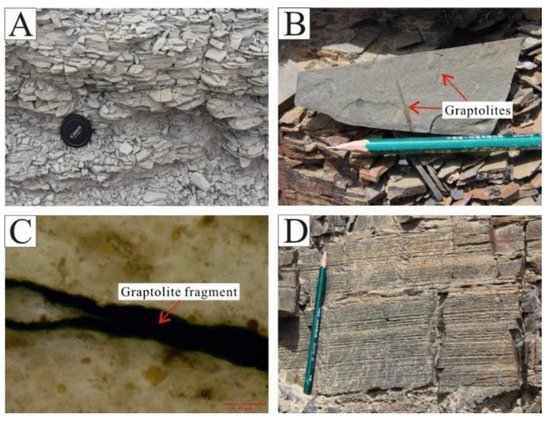
Figure 3.
Characteristics of the Wulalike Formation shale. (A) The weathered surface of shale developed foliation. (B) Graptolite fossils, occurring on the bedding plane of shale. (C) Fragment of graptolite under the microscope in plane polarized light. (D) Shale with vertical fractures and horizontal bedding.
4.2. Quartz Characteristics
Three kinds of quartz were recognized in the Wulalike shale under an optical microscope: biological skeletal quartz, microcrystalline quartz, and terrigenous quartz. Biological skeletal quartz refers to the quartz with biomorphic forms, mainly including radiolarians and sponge spicules. Radiolarian is marked by the central capsule and radial spines with spherical to ellipsoidal forms (Figure 4A,B). The capsules have a diameter of 50–300 μm filled with quartz and OM (Figure 4A,B). Sponge spicules have uniaxial and branching shapes with a length of 100 to 800 μm (Figure 4C,D); some of them only have spicules fragments due to poor preservation (Figure 4E). Microcrystalline quartz with an amorphous form appeared as siliceous cementation, which is the most common variety found in shale, a majority of which co-existed with OM (Figure 4F,G) and a few with clay minerals (Figure 4H). Terrigenous quartz is floating and dispersed throughout the shale matrix and is rarely in contact with other quartz grains (Figure 4I). The grains of terrigenous quartz are sub-circular to sub-angular in shape, and 20 to 80 μm in size (Figure 4I). It is worth mentioning that biological skeleton quartz is often found near the bottom of the Wulalike Formation. On the other hand, terrigenous quartz is mostly found at the top of the Wulalike Formation.
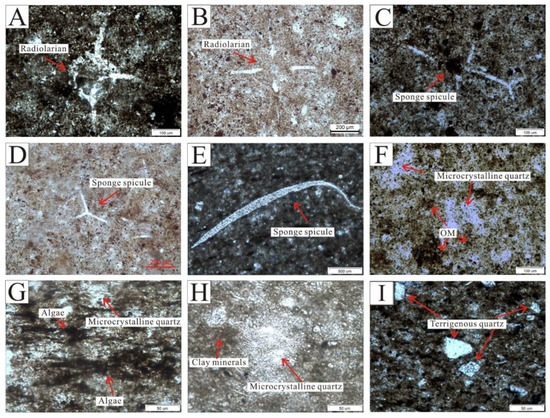
Figure 4.
Microscopic characteristics of quartz. (A) Radiolarian, showing poor preservation. Cross-polarized light. (B) Radiolarian with the complete morphology. Plane polarized light. (C,D) are the forked sponge spicules. (C) and (D) are plane polarized light and cross-polarized light, respectively. (E) Sponge spicule fragment. Plane polarized light. Microcrystalline quartz with an amorphous form is symbiotic with OM (F) and algae (G). Plane polarized light. (H) Microcrystalline quartz coexists with clay minerals. Plane-polarized light. (I) Terrigenous quartz, characterized by a subangular–subcircular shape, was mainly distributed at the top of the Wulalike Formation. Plane polarized light.
4.3. OM Features
The TOC is the most critical index to assess the quality of source rocks [34,36]. The TOC content of the Wulalike shale is generally low, varying from 0.14% to 0.90%, with an average of 0.51% (Table 1). In addition, the TOC pattern displays a decreasing trend from the bottom to the top of the Wulalike Formation (Figure 5).

Table 1.
TOC, Rbitu, and maceral composition of the OM in the shale samples.
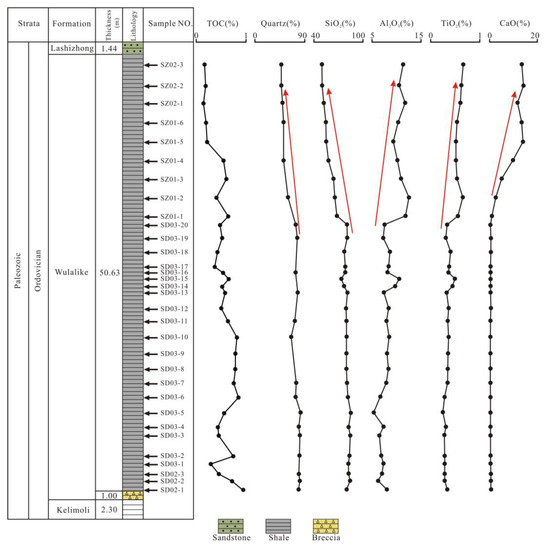
Figure 5.
Vertical content distribution of the selected minerals and major elements.
All the organic macerals of the samples are composed of sapropelinite, mainly including telalginite, lamalginite, and bituminite (Table 1). This study used the following formula to estimate the Type Index (TI) [27]:
where A, B, C, and D correspond with sapropelinite, liptinite, vitrinite, and inertinite, respectively [27].
TI = (100 × A + 50 × B − 75 × C − 100 × D)/100
The TI ranges from <0, 0–40, 40–80, and >80 represent type III, type II2, type II1, and type I, respectively [37]. All the TI values of the Wulalike shale are 100, indicating type Ⅰ kerogen (Table 1).
Vitrinite reflectance (Ro) is a common indicator of OM maturity [25]. Ro needs to be replaced by Rbitu to evaluate the OM maturity due to a lack of vitrinite in the Lower Paleozoic source rocks. The conversion formula is as follows [25]:
where Requ is equivalent to vitrinite reflectance, and Rbitu is bitumen reflectance.
Requ = 0.618 × Rbitu + 0.400
The Requ ranges from 0.89% to 1.40%, with an average of 1.08% (Table 1), suggesting that the thermal evolution of the Wulalike shale in the study area has reached the mature to high mature stages.
4.4. Mineralogical Compositions and Lithotypes
The Wulalike shale consists of quartz, clay, K-feldspar, plagioclase, calcite, and dolomite (Table 2, Figure 6). Quartz and clay minerals are the most abundant minerals in all samples, ranging from 47.1 to 81.6% (averaging 69.5%) and 14.8 to 33.1% (averaging 22.8%). Clay minerals are dominated by illite and illite/smectite, with an average content of 46.05% and 37.48%, respectively (Table 2, Figure 6). Evidently, the Wulalike Formation’s quartz content decreases from the bottom to the top, with the largest concentration at the bottom (Figure 5).
Table 2.
XRD mineralogy results of the shale samples.
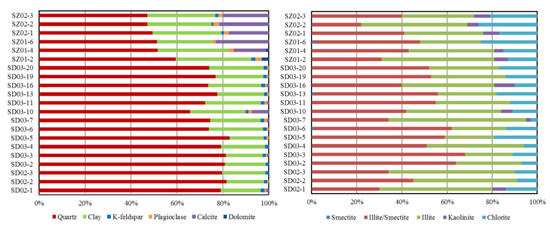
Figure 6.
Composition of the minerals and clay in the Wulalike shale samples.
Shale can be categorized into four kinds based on the concentration of the minerals: siliceous shale (SM), argillaceous shale (AM), calcareous shale (CM), and mixed shale [38] (Figure 7). According to the ternary diagram, the Wulalike shale belongs to the siliceous shale (Figure 7).
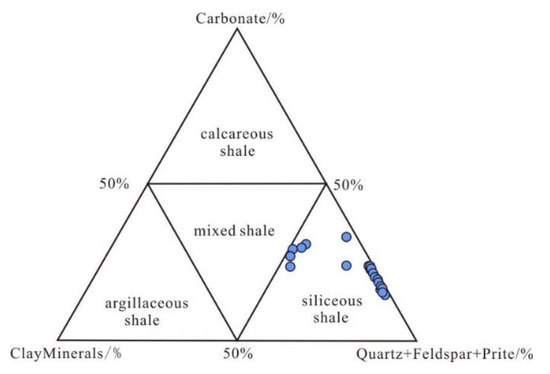
Figure 7.
Lithology discrimination map of shale. The base plot is from reference [38].
4.5. Elemental Geochemistry
4.5.1. Major Elements
The contents of the major elements are shown in Table 3. SiO2 is the dominant element in samples, varying from 50.21% to 85.51% (averaging 74.38%), which is significantly higher than the Upper Continental Crust (UCC) values [39]. The Al2O3 content ranges from 5.46% to 12.60%, with an average of 8.63%, which is lower than the UCC [39]. The other elements, including TiO2, TFe2O3, CaO, P2O5, K2O, Na2O, MnO, and MgO, have a relatively low content. The SiO2 content shows a trend of gradual decline from the bottom to the top of the Wulalike Formation, while Al2O3 is the opposite (Figure 5). The variation of TiO2 and CaO was consistent with that of Al2O3, and their contents gradually increased (Figure 7). When normalized to the UCC, most elements are in depletion, such as TiO2, MgO, TFe2O3, K2O, and P2O5, in which Al2O3, MnO, and Na2O are strongly depleted (Table 3, Figure 8A).
Table 3.
Major element content (wt%) in shale samples.
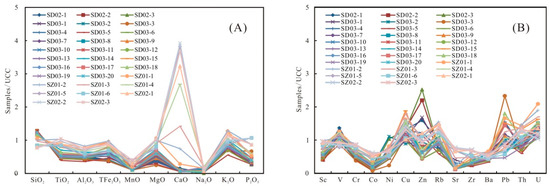
Figure 8.
Normalized diagram of (A) the major elements and (B) the trace elements of the shale samples.
4.5.2. Trace Elements
The contents of the selected trace elements are shown in Table 4. When normalized to the UCC, the elements Cr, Co, Sr, Zr, and Ba are strongly depleted, while Cu and U are slightly enriched (Table 4, Figure 8B). Sc, V, Ni, Zn, Rb, Pb, and Th are close to the UCC (Table 4, Figure 8B) [39].
Table 4.
Trace element content (ppm) in the shale samples.
5. Discussion
5.1. Origins of Quartz
The input of Si-bearing hydrothermal fluids into the ocean is an important source of quartz [40]. In marine sediments, the major elements Al, Fe, and Mn are generally not affected by diagenesis and weathering. Therefore, they are effective indicators for exploring the quartz origin [40]. The Al-Fe-Mn triangular plot shows that the Wulalike shale was not influenced by hydrothermal fluids (Figure 9A). According to Marchig et al. [41], the plotted data points for the shale samples are away from the modern hydrothermal trend line in the Cr-Zr scatter diagram (Figure 9B), indicating that hydrothermal fluids are negligible. Several geochemical criteria, such as Al/(Al+Fe+Mn) < 0.35, Fe/Ti > 20, and (Fe+Mn) × Ti > 25(±5), can also be used to determine the quartz origin, implying that hydrothermal fluids have no effect [42]. The average values of the above parameters are 0.67, 9.38, and 0.61, respectively (Table 5), implying that hydrothermal fluids are unlikely.
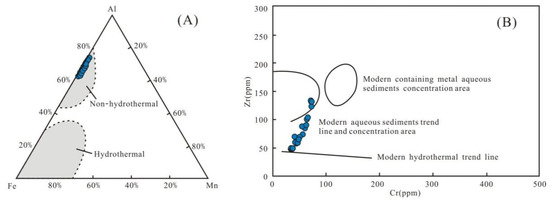
Figure 9.
Discriminate diagram of the siliceous origins. (A) All samples fall into the non-hydrothermal zone. Base polt is from reference [40], (B) All samples are far from the modern hydrothermal trend line. The base polt is from reference [41].
Table 5.
Geochemical indexes of the shale samples.
The element Ti usually represents the degree of terrestrial detrital influx [27]. The correlation diagram between TiO2 and SiO2 shows a conspicuous negative relationship (R2 is 0.84) (Figure 10A), indicating that terrigenous quartz is not a primary source of silica. Since zirconium (Zr) usually occurs in zircon, it is an effective substitute for terrigenous input [8,43]. A significant negative trend (R2 is 0.84) between SiO2 versus Zr of the samples suggests that clastic quartz was not the main contributor of silica (Figure 10B).
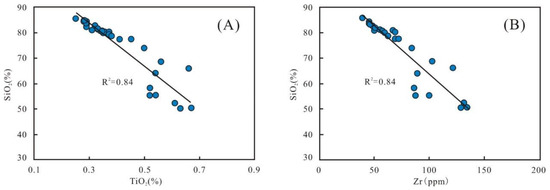
Figure 10.
Correlation diagrams of SiO2 with TiO2 (A) and Zr (B), respectively.
Rowe et al. [44] documented that the area above the illite Si/Al line represents a greater abundance of biogenic silica in the cross-plot of Si and Al (Figure 11). All the samples fall above the illite Si/Al line (Figure 11), similar to the Wufeng–Longmaxi shale and Barnett shale, implying that the quartz is mainly of biogenic origin. In addition, pure marine biogenic siliceous rocks tend to have values of Al/(Al+Fe+Mn) around 0.60 [45] and Si/(Si+Al+Fe+Ca) values generally higher than 0.85 [40]; the values in this study are 0.67 and 0.79, respectively, indicating that the quartz in the Wulalike shale predominantly originated from a biogenic source, and that other sources also contributed to quartz. Microscopic observation showed that the Wulalike shale is enriched in siliceous microorganism fossils, i.e., radiolarians and sponge spicules, which is credible evidence for biogenic quartz (Figure 4A–E).
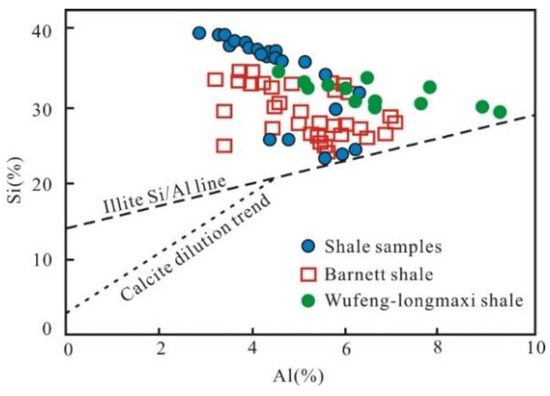
Figure 11.
Correlation diagram of Al and Si with the data of Barnett shale and Wufeng–Longmaxi shale from reference [44] and reference [46], respectively.
Another origin of silica is the transformation of clay minerals, which formed the microcrystalline quartz that co-existed with the clay minerals [47,48]. The type of quartz that commonly appears as siliceous cement can be observed under the microscope in the Wulalike shale (Figure 4H). The reaction formula is:
Smectite + K+ → Illite + SiO2 + H2O
The temperature at which conversion occurs is generally between 60 to 100 °C [49,50]. The Wulalike shale has reached mature to high mature stages (average Requ is 1.08%) (Table 1), suggesting that the reaction temperature has been reached. The clay minerals of Wulalike shale are dominated by illite and illite/smectite, and smectite contents are almost 0 (Table 2), indicating that smectite has been transformed into illite.
As discussed before, the quartz in the Wulalike Formation is formed from three quartz forms: terrigenous clastic quartz, biogenic quartz, and S-I quartz. Terrigenous detrital quartz transported to the basin is the product of parent rocks’ physical and chemical weathering, and is primarily floating in the shale matrix. Biogenic quartz refers to the dissolution and reprecipitation of siliceous organisms. Previous research has revealed that opal-A, an amorphous unstable mineral (SiO2∙nH2O), represents the initial constitution of siliceous organisms. As the diagenesis progresses, opal-A is converted into opal-CT and eventually to microcrystalline quartz [6,14]. Most siliceous organisms are dissolved due to the unsaturated silica in seawater [51]. The remaining biological skeletal quartz makes up a minor proportion of biogenic quartz, most of which is microcrystalline quartz; this is why microcrystalline quartz is significantly concentrated in siliceous organisms. Therefore, biogenic quartz, in this paper, includes biological skeletal quartz and a portion of microcrystalline quartz. The other part of microcrystalline quartz generated by S-I quartz is commonly surrounded by clay minerals and dispersed throughout shale matrix, acting as cement (Figure 4H).
5.2. Contents of Different Origins of Quartz
Excess Si is defined as Si unrelated to detrital Si and can be computed by subtracting Si connected to terrigenous detrital Al from total Si. The calculation formula is as follows [52]:
where Sisample and Alsample denote the concentrations of Si and Al in the sample, respectively; (Si/Al)background denotes the average Si/Al ratio in the shale, and 3.11 is used as the background value [40].
Excess Si = Sisample − Alsample × (Si/Al)background
According to the law of conservation of elements, the Si derived from S-I quartz is originally related to terrigenous detrital Al. Due to the exclusion of bearing-Si hydrothermal fluids in this study, the excess Si can only be biogenic and calculated by the Formula (4) above.
The S-I reaction equation is as follows [49]:
1.308{(Al3.15Mg0.85)(Si8.00)O20(OH)4(Na0.85)2H2O [smectite, 1101.1 g]
+ (0.06Fe2O3 + 0.56K2O + 0.02CaO)}
→[(Al4.12Fe0.1Mg0.56)(Si7.17)O20(OH)4(K1.47Na0.01Ca0.03)] [illite, 787.2 g]
+ 3.29SiO2 [197.7 g] + 0.56Na2O + 0.55MgO + 3.23H2O
+ (0.06Fe2O3 + 0.56K2O + 0.02CaO)}
→[(Al4.12Fe0.1Mg0.56)(Si7.17)O20(OH)4(K1.47Na0.01Ca0.03)] [illite, 787.2 g]
+ 3.29SiO2 [197.7 g] + 0.56Na2O + 0.55MgO + 3.23H2O
Converting clay minerals releases the SiO2 content (S-I SiO2), which may be determined using the Formula (5). The complete analysis and calculation process are presented in Yang et al. [13], and are not mentioned in this study. Finally, the terrigenous SiO2 content can be calculated by removing biogenic SiO2 and S-I SiO2 from the overall SiO2 content. Thus, the percentages of SiO2 from three different origins have been calculated (Table 6). The Wulalike shale samples contain an average of 62.52% biogenic SiO2, 31.01% terrigenous SiO2, and 6.46% S-I SiO2, indicating that biogenic quartz is the predominant source, subsidiary from terrigenous quartz, and S-I quartz may nearly be ignored.
Table 6.
Quartz percentage of different origins.
5.3. Paleoenvironments
5.3.1. Paleoproductivity
The total amount of OM generated per unit area and time is referred to as paleoproductivity [24]. In general, high productivity contributes to the formation of source rocks. Previous research has shown that siliceous plankton contributed to significant productivity; thus, biogenic SiO2 can indicate paleoproductivity [8,53]. As discussed in Section 5.2, the contents of biogenic SiO2 ranged from 14.88% to 68.53% (with an average of 48.48%) in the Wulalike Formation (Table 6), and are primarily developed at the bottom of the Formation and have an obvious tendency to decrease at the top, which is consistent with the petrographic observations (Figure 12).
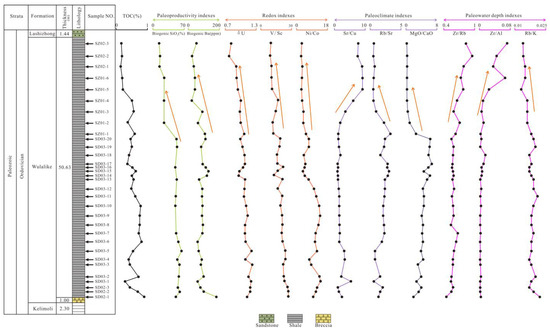
Figure 12.
Stratigraphic distribution of the TOC and other geochemical parameters of the Wulalike shale.
Barite (BaSO4) formed in the decomposition of plankton was well preserved and is more stable than OM; therefore, the content of Barium (Ba) can be referred to as paleoproductivity [27,54]. The calculation formula of biogenic Ba (Babio) is as follows [27]:
where Basample and Alsample represent the content of Ba and Al in the sample, and (Ba/Al)detrital represents the average Ba/Al value of the crustal rocks.
Babio = Basample − Alsample × (Ba/Al)detrital
(Ba/Al)detrital ranges from 0.0032 to 0.0046, and 0.0039 were commonly selected for the Babio calculation [43]. The Babio ranges < 200 μg/g, 200–1000 μg/g, and >1000 μg/g indicate low, intermediate, and high paleoproductivity, respectively [54]. The value of Babio in the Wulalike shale ranges from 30.06 μg/g to 181.82 μg/g (averaging 86.60 μg/g), indicating a lean paleoproductivity. Meanwhile, the content of Babio decreases gradually at the top of the Wulalike Formation. Additionally, Ba/Al can also reconstruct paleoproductivity [55]. Core samples from Central California (CCAL), USA, with Ba/Al values of 100–120, suggest that they were deposited under high paleoproductivity conditions [56]. The ratios of Ba/Al in the Wulalike shale vary from 44.57 to 81.56, with an average of 58.82, indicating low paleoproductivity. Babio and Ba/Al parameters indicate low paleoproductivity during the Wulalike stage. Furthermore, the paleoproductivity fell steadily at the top of the section.
5.3.2. Paleoclimate
Paleoclimate affects the weathering of parent rocks and the OM accumulation of source rocks [57]. Sr/Cu values can be used to assess the paleoclimate [58]. Generally, Sr/Cu values of 1–5 and >5 indicate humid and arid climates [58]. The Sr/Cu values range from 1.02 to 9.13 and increase gradually from the bottom to the top of the Wulalike Formation (Table 5, Figure 12), suggesting that the climate changed from humid to arid. The increase in Rb/Sr indicates the transition of the paleoclimate from relative drought to humidity, while the decrease in Rb/Sr is on the contrary [9]. The Rb/Sr ratios decrease gradually from the bottom to the top of the Wulalike Formation (Figure 12), revealing that the paleoclimate changed from relative humidity to drought. The ratio of MgO/CaO can reflect the paleoclimate [57]. The increase in the MgO/CaO ratio represents a warmer and humid paleoclimate. The MgO/CaO ratio is higher at the bottom of the Wulalike Formation and is lower at the top (Figure 12), indicating that the climate has changed from relative humidity to drought.
The above proxies of Sr/Cu, Rb/Sr, and MgO/CaO indicate that the paleoclimate was mainly warm and humid at the bottom of the Wulalike Formation, gradually turning to relatively arid at the top.
5.3.3. Redox Conditions
The redox condition is crucial for the preservation of OM. Generally, the anoxic condition is conducive to the preservation of OM [59]. Trace elements and their derived parameters can reflect the redox condition, such as V/Cr, δU, and Ni/Co [27,60].
Vanadium (V), not affected by diagenesis in sediments, is enriched in an anoxic environment [61]. Cr is preferentially gathered into an organic complex under a reducing atmosphere; therefore, V/Cr can be used as an ideal redox indicator. V/Cr < 2, 2.00–4.25, >4.25 indicate oxic, dysoxic, and anoxic conditions, respectively [27]. The V/Cr ratios of samples ranged from 1.24 to 3.59 (Table 5). Furthermore, the higher V/Cr ratios are largely found near the bottom of the Wulalike Formation and gradually decreased upward (Figure 12), indicating that the shale was deposited in anoxic conditions early on and steadily transitioned to oxic needs later on.
In addition, δU (δU = 2U/(U + Th/3)) is a conventional parameter to judge the sedimentary environment, with δU > 1 and <1 corresponding to an anoxic and oxic environment [62]. The δU values of the Wulalike shale vary between 0.78 and 1.22 (Table 5), suggesting an unstable redox environment, and are varied from anoxic to oxic conditions from the bottom to the top of the Wulalike Formation (Figure 12).
The Ni/Co ratio is another credible index for assessing redox conditions [60]. The specific criteria are shown in Table 7. The Ni/Co ratios range from 2.67 to 14.00, offering a changing trend from an anoxic condition at the bottom to an oxic state at the top of the Wulalike Formation (Table 5, Figure 12).
Table 7.
Table of differentiation criterion for redox conditions.
The above geochemical parameters, V/Cr, δU, and Ni/Co, show that the deposition environment has changed. The bottom of the Wulalike Formation is in an anoxic or dysoxic condition, and it gradually changes to the oxic state when it reaches the top.
5.3.4. Paleowater Depth
The sediment grain size (coarse or fine) can determine the paleowater depth by reflecting the hydrodynamic conditions [63]. Zr and Rubidium (Rb) are enriched in coastal and fine-grained sediments, respectively [63]; thus, Zr/Rb can reflect the paleowater depth. Zr/Al and Rb/K can also indicate the paleowater depth based on a similar principle, and the ratios of Zr/Rb and Zr/Al will increase as the water depth deepend, while the Rb/K ratio is the opposite [64]. The Zr/Rb and Zr/Al ratios are relatively low at the bottom of the Wulalike Formation and gradually increase going upward (Figure 12), suggesting that the water depth becomes shallower from the bottom to the top. The Rb/K ratio has the opposite trend compared with Zr/Rb and Zr/Al (Figure 12), indicating that the water depth becomes shallower from the bottom to the top.
Graptolites generally live in a deeper water environment [65]. The horizontal bedding and abundant graptolites developed at the bottom of the Wulalike Formation and a few at the top suggest that the water depth has changed (Figure 3). Therefore, it can be concluded that the water depth became shallower from the early to late stage of the Wulalike Formation.
5.4. Controlling Factors for Low TOC
The enrichment of OM is a complex process controlled by multiple factors. Generally, the flourishing growth of plankton indicates high paleoproductivity, and then promotes enrichment of the OM [17]. Biogenic SiO2, Babio, and Ba/Al with TOC show certain positive relationships (R2 = 0.41, 0.33, and 0.33, respectively) (Figure 13A–C), indicating that paleoproductivity plays a primary controlling factor for OM enrichment. However, the low paleoproductivity resulted in a low TOC content during the Wulalike deposition.
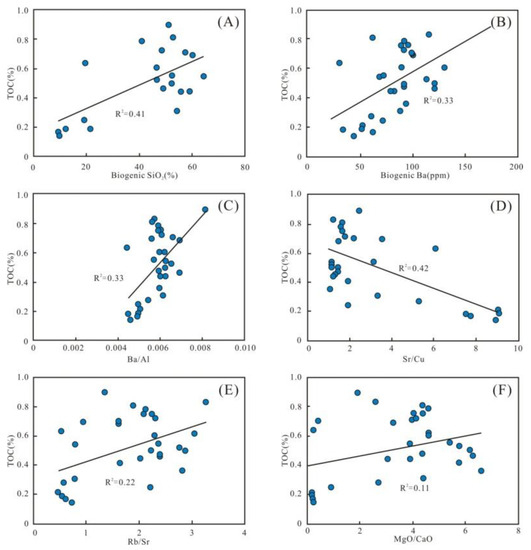
Figure 13.
Parameters of OM inputs. (A–C) Plots of paleoproductivity parameters; biogenic SiO2, biogenic Ba, and Ba/Al showing significant positive correlations with the TOC content. (D–F) Plots of paleoclimate parameters with TOC content, showing a negative correlation of TOC content with Sr/Cu and positive correlations with Rb/Sr and MgO/CaO.
In addition, the Sr/Cu is negatively correlated with TOC (R2 = 0.42) (Figure 13D), revealing that the paleoclimate contributed to the accumulation of OM. The positive correlation between Rb/Sr, MgO/CaO, and TOC further supports this view (R2 = 0.22 and 0.11, respectively) (Figure 13E,F). The warm and humid climate in the early stage of the Wulalike Formation accelerated weathering of the parent rocks. It facilitated more terrestrial nutrients entering the ocean, which are beneficial to the reproduction of marine organisms. In the late period, the arid climate and weakened weathering decreased the terrigenous nutrients input, resulting in the lean TOC.
The redox condition is a crucial factor in promoting the preservation of OM [21]. Multiple geochemistry proxies show that the Wulalike shale was deposited in anoxic to oxic environments. There are certain positive correlations in the V/Cr, δU, and Ni/Co versus TOC (R2 = 0.28, 0.24, and 0.28, respectively) (Figure 14A–C), indicating that OM accumulation was also controlled by the redox condition. Moreover, the shale formed under anoxic or dysoxic conditions has a relatively higher TOC content at the bottom of the Wulalike Formation, indicating that anoxic or dysoxic is conductive to OM preservation.
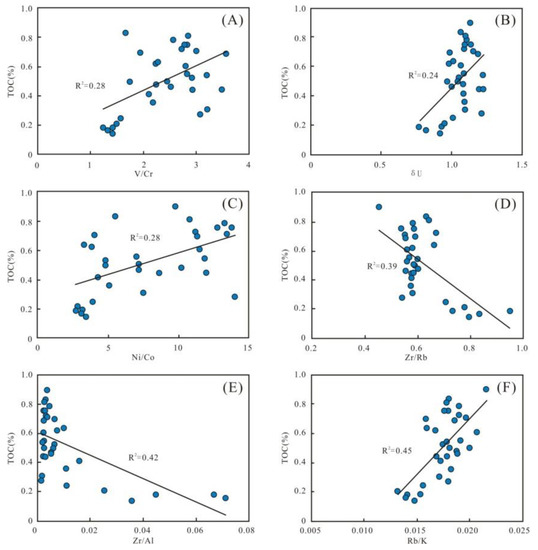
Figure 14.
Parameters of preservation conditions. (A–C) Plots of redox parameters V/Cr, δU, and Ni/Co with TOC content, respectively, indicating certain positive correlations. (D–F) Plots of paleowater depth parameters with TOC content, showing obvious negative correlations of Zr/Rb and Zr/Al and a positive correlation of Rb/K with TOC content.
Meanwhile, the water depth parameters of Zr/Rb and Zr/Al present clear negative correlations with TOC, as well as a positive correlation of Rb/K with TOC (R2 = 0.39, 0.42, and 0.45, respectively) (Figure 14D–F). These all suggest that water depth is a pivotal factor controlling OM enrichment. It could be due to the ocean’s increased reducibility in deep water, making more space accessible for the preservation of OM.
Based on the above discussion, we can conclude that the Wulalike marine shale is a typical superposition model of productivity and preservation conditions and can establish the OM accumulation mechanism (Figure 15). Under the influence of the Caledonian movement in the Middle–Late Ordovician period, the tectonic rift was developed in the west of the Ordos Basin, forming the deep water basin facies deposits found in the Wulalike Formation. Simultaneously, the eastern part of the basin was uplifted and denuded. Ma et al. [33] documented that a rapid transgression occurred, resulting in the maximum flooding surface in the early stage of Wulalike; after that, the sea level declined slowly, followed by the water depth becoming shallow. The water depth variation is consistent with the geochemical indexes (Zr/Rb, Zr/Al, and Rb/K) and petrographic observation results. Influenced by the transgression, on the one hand, the rising sea level led to the transformation of biota from benthos to plankton. The copious nutrients transported by the upwelling encouraged plankton blooming, providing a sufficient material basis for OM enrichment. However, as the sea depth increased rapidly, the water column changed into a dysoxic or anoxic environment, reducing OM decomposition. The hydrodynamic conditions weakened, allowing fine sediments, such as clay and organic matter, to precipitate, depositing the organic-rich shale of the Wulalike Formation. At the same time, the lipid components in the OM are preferentially preserved and enriched under the activity of anaerobic bacteria, tending the OM towards sapropel (type I kerogen), which has a better hydrocarbon generation potential. Zhai et al. [66] and Chen et al. [67] believed that the high water level under the transgressive system tract is favorable for OM enrichment. Thus, the early sedimentary environments of the Wulalike Formation are most conducive to organic accumulation (Figure 15A).
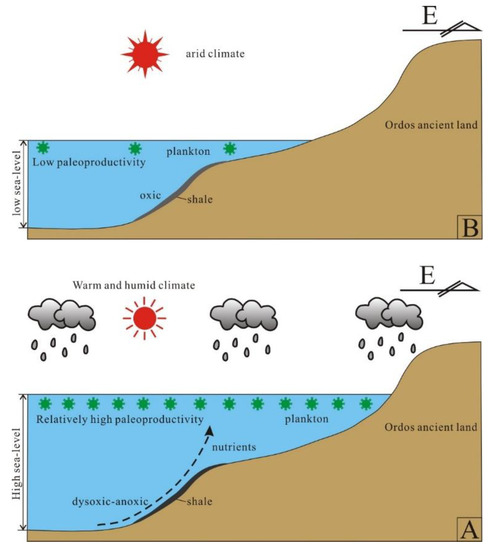
Figure 15.
Diagram of the organic matter enrichment mechanism of the Wulalike shale. (A,B) are the early and late stage of the sedimentary paleoenvironments, respectively.
On the other hand, the late sedimentary settings changed and were characterized by shallow water, decreasing paleoproductivity, and arid climates or oxic conditions, all of which were detrimental to the production and preservation of OM (Figure 15B). As a result, the next exploration target should be aimed at the bottom of the Wulalike Formation on the Ordos Basin’s western margin.
6. Conclusions
The OM characteristics, shale lithofacies type, origins of quartz, paleoenvironments, and OM enrichment mechanisms of the Ordovician Wulalike shale near the northwestern fringe of the Ordos Basin are studied in detail in this research.
- The Wulalike shale is characterized by a low TOC and type Ⅰ kerogen; the thermal evolution has reached the mature to highly mature stages; and the lithotype is siliceous shale.
- The origins of quartz in Wulalike shale are biogenic quartz (average 63%), terrigenous clastic quartz (average 31%), and S-I quartz (only 6%).
- The dominating factors affecting OM accumulation are paleoproductivity and redox conditions; in addition, paleoclimate and paleowater depth have a certain contribution.
- The OM enrichment mechanism is the typical superposition model of productivity and preservation conditions. Based on the results of biogenic quartz distribution and sedimentary environments, it is considered that the shale at the bottom of the Wulalike Formation is conducive to exploration, and the next exploration target should focus on this interval.
Author Contributions
Conceptualization, Y.Z.; methodology, Y.Z. and R.L.; software, Y.Z.; validation, L.C., H.H. and B.Z.; writing—original draft, Y.Z.; supervision, R.L. and H.H.; investigation, S.X., J.G. and A.K.; resources, L.C. and B.Z.; All authors have read and agreed to the published version of the manuscript.
Funding
This research was supported by the National Natural Science Foundation of China (No. 42273064), National Natural Science Foundation of China (No. 42202160), Shaanxi’s Natural Science Basic Research Program (No. 2021JQ226), Natural Science Foundation of Shandong Province (No. ZR2021QD057).
Data Availability Statement
The data used to support the findings of this study are included within the article.
Conflicts of Interest
The authors declare no conflict of interest.
References
- Wang, S. Shale gas exploitation: Status, problems and prospect. Nat. Gas Ind. B 2018, 5, 60–74. [Google Scholar] [CrossRef]
- Fu, S.; Fu, J.; Xi, S.; Huang, Z. Geological characteristics of Ordovician marine shale gas in the Ordos Basin and its prospects. China Pet. Explor. 2021, 26, 33–44, (In Chinese with English Abstract). [Google Scholar]
- Xi, S.; Mo, W.; Liu, X.; Zhang, L.; Li, J.; Huang, Z.; Wang, M.; Zhang, C.; Zhu, Q.; Yan, Y.; et al. Shale gas exploration potential of Ordovician Wulalike Formation in the western margin of Ordos Basin: Case study of Well Zhongping 1. Nat. Gas Geosci. 2021, 32, 1235–1246, (In Chinese with English Abstract). [Google Scholar]
- Xi, S.; Wei, J.; Zhang, C.; Wang, H.; Jing, X.; Yang, Y.; Liu, G.; Li, H.; Zhang, Y. Discovery and significance of marine shale oil exploration in Ordos Basin. Acta Pet. Sin. 2023, 44, 253–269, (In Chinese with English Abstract). [Google Scholar]
- Zheng, Y.; Liao, Y.; Wang, Y.; Xiong, Y.; Peng, P. Organic geochemical characteristics, mineralogy, petrophysical properties, and shale gas prospects of the Wufeng-Longmaxi shales in Sanquan Town of the Nanchuan District, Chongqing. AAPG Bull. 2018, 102, 2239–2265. [Google Scholar] [CrossRef]
- Zhang, Y.; Li, R.; Huang, H.; Gao, T.; Chen, L.; Zhao, B.; Wu, X.; Khaled, A. The Origin of Silica of Marine Shale in the Upper Ordovician Wulalike Formation, Northwestern Ordos Basin, North China. Front. Earth Sci. 2021, 9, 729710. [Google Scholar] [CrossRef]
- Loucks, R.G.; Ruppel, S.C. Mississippian Barnett Shale: Lithofacies and depositional setting of a deep-water shale-gas succession in the Fort Worth Basin, Texas. AAPG Bull. 2007, 91, 579–601. [Google Scholar] [CrossRef]
- Dong, T.; He, S.; Chen, M.; Hou, Y.; Guo, X.; Wei, C. Quartz types and origins in the paleozoic Wufeng-Longmaxi Formations, Eastern Sichuan Basin, China: Implications for porosity preservation in shale reservoirs. Mar. Pet. Geol. 2019, 106, 62–73. [Google Scholar] [CrossRef]
- Khan, M.Z.; Feng, Q.; Zhang, K.; Guo, W. Biogenic silica and organic carbon fluxes provide evidence of enhanced marine productivity in the Upper Ordovician-Lower Silurian of South China. Palaeogeogr. Palaeoclimatol. Palaeoecol. 2019, 534, 109278. [Google Scholar] [CrossRef]
- Milliken, K.L.; Olson, T. Silica diagenesis, porosity evolution, and mechanical behavior in siliceous mudstones, Mowry Shale (Cretaceous), Rocky Mountains, USA. J. Sediment. Res. 2017, 87, 366–387. [Google Scholar] [CrossRef]
- Chen, L.; Liu, K.; Jiang, S.; Huang, H.; Tan, J.; Zuo, L. Effect of adsorbed phase density on the correction of methane excess adsorption to absolute adsorption in shale. Chem. Eng. J. 2021, 420, 127678. [Google Scholar] [CrossRef]
- Xu, H.; Zhou, W.; Hu, Q.; Yi, T.; Ke, J.; Zhao, A.; Lei, Z.; Yu, Y. Quartz types, silica sources and their implications for porosity evolution and rock mechanics in the Paleozoic Longmaxi Formation shale, Sichuan Basin. Mar. Pet. Geol. 2021, 128, 105036. [Google Scholar] [CrossRef]
- Ilyushin, Y.V. Development of a process control system for the production of high-paraffin oil. Energies 2022, 15, 6462. [Google Scholar] [CrossRef]
- Ye, Y.; Tang, S.; Xi, Z.; Jiang, D.; Duan, Y. Quartz types in the Wufeng-Longmaxi Formations in southern China: Implications for porosity evolution and shale brittleness. Mar. Pet. Geol. 2022, 137, 105479. [Google Scholar] [CrossRef]
- Pershin, I.M.; Papush, E.G.; Kukharova, T.V.; Utkin, V.A. Modeling of Distributed Control System for Network of Mineral Water Wells. Water 2023, 15, 2289. [Google Scholar] [CrossRef]
- Chen, L.; Jiang, Z.; Liu, Q.; Jiang, S.; Liu, K.; Tan, J.; Gao, F. Mechanism of shale gas occurrence: Insights from comparative study on pore structures of marine and lacustrine shales. Mar. Pet. Geol. 2019, 104, 200–216. [Google Scholar] [CrossRef]
- Qiu, Z.; Liu, B.; Dong, D.; Lu, B.; Yawar, Z.; Chen, Z.; Schieber, J. Silica diagenesis in the Lower Paleozoic Wufeng and Longmaxi Formations in the Sichuan Basin, South China: Implications for reservoir properties and paleoproductivity. Mar. Pet. Geol. 2020, 121, 104594. [Google Scholar] [CrossRef]
- Kontakiotis, G.; Karakitsios, V.; Cornée, J.J.; Moissette, P.; Zarkogiannis, S.D.; Pasadakis, N.; Koskeridou, E.; Manoutsoglou, E.; Drinia, H.; Antonarakou, A. Preliminary results based on geochemical sedimentary constraints on the hydrocarbon potential and depositional environment of a Messinian sub-salt mixed siliciclastic-carbonate succession onshore Crete (Plouti section, eastern Mediterranean). Med. Geosc. Rev. 2020, 2, 247–265. [Google Scholar] [CrossRef]
- Kontakiotis, G.; Karakitsios, V.; Maravelis, A.G.; Zarkogiannis, S.D.; Agiadi, K.; Antonarakou, A.; Pasadakis, N.; Zelilidis, A. Integrated isotopic and organic geochemical constraints on the depositional controls and source rock quality of the Neogene Kalamaki sedimentary successions (Zakynthos Island, Ionian Sea). Med. Geosc. Rev. 2021, 3, 193–217. [Google Scholar] [CrossRef]
- Wang, Z.; Yu, F.; Wang, J.; Fu, X.; Chen, W.; Zeng, S.; Song, C. Palaeoenvironment evolution and organic matter accumulation of the Upper Triassic mudstones from the eastern Qiangtang Basin (Tibet), eastern Tethys. Mar. Pet. Geol. 2021, 130, 105113. [Google Scholar] [CrossRef]
- Khaled, A.; Li, R.; Xi, S.; Zhao, B.; Wu, X.; Yu, Q.; Zhang, Y.; Li, D. Paleoenvironmental conditions and organic matter enrichment of the Late Paleoproterozoic Cuizhuang Formation dark shale in the Yuncheng Basin, North China. J. Pet. Sci. Eng. 2022, 208, 109627. [Google Scholar] [CrossRef]
- Hetzel, A.; Böttcher, M.E.; Wortmann, U.G.; Brumsack, H. Paleo-redox conditions during OAE 2 reflected in demerara rise sediment geochemistry (ODP Leg 207). Palaeogeogr. Palaeoclimatol. Palaeoecol. 2009, 273, 302–328. [Google Scholar] [CrossRef]
- Gallego-Torres, D.; Martinez-Ruiz, F.; Paytan, A.; Jimenez-Espejo, F.J.; Ortega- Huertas, M. Pliocene-Holocene evolution of depositional conditions in the eastern Mediterranean: Role of anoxia vs. productivity at time of sapropel deposition. Palaeogeogr. Palaeoclimatol. Palaeoecol. 2007, 246, 424–439. [Google Scholar] [CrossRef]
- Pan, X.; Wang, Z.; Li, Q.; Gao, J.; Zhu, L.; Liu, W. Sedimentary environments and mechanism of organic matter enrichment of dark shales with low TOC in the Mesoproterozoic Cuizhuang Formation of the Ordos Basin: Evidence from petrology, organic geochemistry, and major and trace elements. Mar. Pet. Geol. 2020, 122, 104695. [Google Scholar] [CrossRef]
- Li, D.; Li, R.; Tan, C.; Zhao, D.; Xue, T.; Zhao, B.; Ahmed, K.; Liu, F.; Xu, F. Origin of silica, paleoenvironment, and organic matter enrichment in the Lower Paleozoic Niutitang and Longmaxi formations of the northwestern Upper Yangtze Plate: Significance for hydrocarbon exploration. Mar. Pet. Geol. 2019, 103, 404–421. [Google Scholar] [CrossRef]
- Wang, C.; Wang, Q.; Chen, G.; He, L.; Xu, Y.; Chen, L.; Chen, D. Petrographic and geochemical characteristics of the lacustrine black shales from the Upper Triassic Yanchang Formation of the Ordos Basin, China: Implications for the organic matter accumulation. Mar. Pet. Geol. 2017, 86, 52–65. [Google Scholar] [CrossRef]
- Zhao, B.; Li, R.; Qin, X.; Wang, N.; Zhou, W.; Khaled, A.; Zhao, D.; Zhang, Y.; Wu, X.; Liu, Q. Geochemical characteristics and mechanism of organic matter accumulation of marine-continental transitional shale of the Lower Permian Shanxi Formation, southeastern Ordos Basin, North China. J. Pet. Sci. Eng. 2021, 205, 108815. [Google Scholar] [CrossRef]
- Huang, H.; Li, R.; Jiang, Z.; Li, J.; Chen, L. Investigation of variation in shale gas adsorption capacity with burial depth: Insights from the adsorption potential theory. J. Nat. Gas Sci. Eng. 2020, 73, 103043. [Google Scholar] [CrossRef]
- Ritts, B.D.; Hanson, A.D.; Darby, B.J.; Nanson, L.; Berry, A. Sedimentary record of triassic intraplate extension in North China: Evidence from the nonmarine NW Ordos Basin, helan Shan and zhuozi Shan. Tectonophysics 2004, 386, 177–202. [Google Scholar] [CrossRef]
- Zhao, C. Division of the western Ordos thrust belt and its mechanism. In The Structures, Oil and Gas of Western Ordos Basin; Gansu Science and Technology Press: Lanzhou, China, 1990; pp. 40–53. [Google Scholar]
- Huang, H.; Li, R.; Xiong, F.; Hu, H.; Sun, W.; Jiang, Z. A method to probe the pore-throat structure of tight reservoirs based on low-field NMR: Insights from a cylindrical pore model. Mar. Pet. Geol. 2020, 117, 104344. [Google Scholar] [CrossRef]
- Qian, F.; Ai, Y. A study on seimoelectric response of VSP in FANGSHEN 901 well on Songliao Basin. J. Xi’an Eng. Univ. 2002, 24, 18–24, (In Chinese with English Abstract). [Google Scholar]
- Ma, Z.; Bai, H.; Liu, B.; Wang, H.; Chen, T. Lithofacies palaeogeography of the Middle-Late Ordovician Kelimoli and Wulalike ages in western Ordos area. J. Palaeogeogr. 2013, 15, 751–764, (In Chinese with English Abstract). [Google Scholar]
- Zhang, Y.; Li, R.; Xi, S.; Yao, J.; Huang, H.; Zhao, B.; Wu, X.; Yang, L. Sedimentary environments and organic matter enrichment mechanism of Ordovician Wulalike Formation shale, western Ordos Basin. J. Cent. South Univ. (Sci. Technol.) 2022, 53, 3401–3417, (In Chinese with English Abstract). [Google Scholar]
- Wu, S.; Zhang, Y.; Xing, E. Zircon U-Pb ages and Hf isotope characteristics and their geological significance of tuff in Wulalike Formation in the Northwestern Ordos Basin. Geol. Rev. 2017, 63, 1309–1327, (In Chinese with English Abstract). [Google Scholar]
- Fetisov, V.; Ilyushin, Y.V.; Vasiliev, G.G.; Leonovich, I.A.; Müller, J.; Riazi, M.; Mohammad, A.H. Development of the automated temperature control system of the main gas pipeline. Sci. Rep. 2023, 13, 3092. [Google Scholar] [CrossRef] [PubMed]
- Zhang, S.; Liang, D.; Zhang, D. Evaluation criteria for Paleozoic effective hydrocarbon source rocks. Petrol. Explor. Dev. 2002, 29, 8–12, (In Chinese with English Abstract). [Google Scholar]
- Han, C.; Jiang, Z.; Han, M.; Wu, M.; Lin, W. The lithofacies and reservoir characteristics of the upper Ordovician and lower Silurian black shale in the southern Sichuan Basin and its periphery, China. Mar. Pet. Geol. 2016, 75, 181–191. [Google Scholar] [CrossRef]
- Mclennan, S.M. Relationships between the trace element composition of sedimentary rocks and upper continental crust. Geochem. Geophys. Geosyst. 2001, 2, 203–236. [Google Scholar] [CrossRef]
- Wedepohl, K.H. Environmental influences on the chemical composition of shales and clays. Phys. Chem. Earth 1971, 8, 307–331. [Google Scholar] [CrossRef]
- Marchig, V.; Gundlach, H.; Möller, P.; Schley, F. Some geochemical indicators for discrimination between diagenetic and hydrothermal metalliferous sediments. Mar. Geol. 1982, 50, 241–256. [Google Scholar] [CrossRef]
- Murray, R.W. Chemical criteria to identify the depositional environment of chert: General principles and application. Sediment. Geol. 1994, 90, 213–232. [Google Scholar] [CrossRef]
- Dong, T.; Harris, N.B.; Ayranci, K. Relative sea-level cycles and organic matter accumulation in shales of the Middle and Upper Devonian Horn River Group, northeastern British Columbia, Canada: Insights into sediment flux, redox conditions, and bioproductivity. Geol. Soc. Am. Bull. 2018, 130, 859–880. [Google Scholar] [CrossRef]
- Rowe, H.D.; Loucks, R.G.; Ruppel, S.C.; Rimmer, S.M. Mississippian Barnett Formation, Fort Worth Basin, Texas: Bulk geochemical inferences and Mo-TOC constraints on the severity of hydrographic restriction. Chem. Geol. 2008, 257, 16–25. [Google Scholar] [CrossRef]
- Adachi, M.; Yamamoto, K.; Suigiski, R. Hydrothermal chert and associated siliceous rocks from the Northern Pacific: Their geological significance as indication of ocean ridge activity. Sediment. Geol. 1986, 47, 125–148. [Google Scholar] [CrossRef]
- Zhao, J.; Jin, Z.; Jin, Z.; Win, X.; Geng, Y.; Yan, C. The genesis of quartz in Wufeng-Longmaxi gas shales, Sichuan Basin. Nat. Gas Geosci. 2016, 27, 377–386, (In Chinese with English Abstract). [Google Scholar]
- Peltonen, C.; Marcussen, Ø.; Bjørlykke, K.; Jahren, J. Clay mineral diagenesis and quartz cementation in mudstones: The effects of smectite to illite reaction on rock properties. Mar. Pet. Geol. 2009, 26, 887–898. [Google Scholar] [CrossRef]
- Thyberg, B.; Jahren, J. Quartz cementation in mudstones: Sheet-like quartz cement from clay mineral reactions during burial. Petrol. Geosci. 2011, 17, 53–63. [Google Scholar] [CrossRef]
- Van de Kamp, P.C. Smectite-illite-muscovite transformations, quartz dissolution, and silica release in shales. Clays Clay Miner. 2008, 56, 66–81. [Google Scholar] [CrossRef]
- Chen, L.; Zuo, L.; Jiang, Z.; Jiang, S.; Liu, K.; Tan, J.; Zhang, L. Mechanisms of shale gas adsorption: Evidence from thermodynamics and kinetics study of methane adsorption on shale. Chem. Eng. J. 2019, 361, 559–570. [Google Scholar] [CrossRef]
- Williams, L.; Parks, G.; Crerar, D. Silica diagenesis; I, Solubility controls. J. Sediment. Res. 1985, 55, 301–311. [Google Scholar]
- Tribovillard, N.; Algeo, T.; Lyons, T.; Riboulleau, A. Trace metals as paleoredox and paleoproductivity proxies: An update. Chem. Geol. 2006, 232, 12–32. [Google Scholar] [CrossRef]
- Jiang, T.; Jin, Z.; Liu, G.; Liu, Q.; Gao, B.; Liu, Z.; Nie, H.; Zhao, J.; Wang, R.; Zhu, T.; et al. Source analysis of siliceous minerals and uranium in Early Cambrian shales, South China: Significance for shale gas exploration. Mar. Pet. Geol. 2019, 102, 101–108. [Google Scholar] [CrossRef]
- Algeo, T.J.; Kuwahara, K.; Sano, H.; Bates, S.; Lyons, T.; Elswick, E.; Hinnov, L.; Ellwood, B.; Moser, J.; Maynard, J.B. Spatial variation in sediment fluxes, redox conditions, and productivity in the Permian-Triassic Panthalassic Ocean. Palaeogeogr. Palaeoclimatol. Palaeoecol. 2011, 308, 65–83. [Google Scholar] [CrossRef]
- Averyt, K.B.; Paytan, B. A comparison of multiple proxies for export production in the equatorial Pacific. Paleoceanography 2004, 19, 4003–4016. [Google Scholar] [CrossRef]
- Luo, Q.; Zhong, N.; Zhu, L.; Wang, Y.; Qin, J.; Qi, L.; Zhang, Y.; Ma, Y. Correlation of burial organic carbon and paleoproductivity in the Mesoproterozoic Hongshuizhuang Formation, northern North China. Chin. Sci. Bull. 2013, 58, 1299–1309. [Google Scholar] [CrossRef]
- Yang, Z.; Shen, W.; Zheng, L. Elements and isotopic geochemistry of Guadalupian-Lopingian boundary profile at the Penglaitan section of Laibin, Guangxi province and its geological implications. Acta Geol. Sin. 2009, 83, 1–15, (In Chinese with English Abstract). [Google Scholar]
- Li, D.; Li, R.; Zhu, Z.; Xu, F. Elemental characteristics of lacustrine oil shale and its controlling factors of palaeo-sedimentary environment on oil yield a case from Chang 7 oil layer of Triassic Yanchang Formation in southern Ordos Basin. Acta Geochim. 2018, 37, 228–243. [Google Scholar] [CrossRef]
- Jones, B.; Manning, D.A.C. Comparison of geochemical indices used for the interpretation of paleoredox conditions in ancient mudstones. Chem. Geol. 1994, 111, 111–129. [Google Scholar] [CrossRef]
- Crusius, J.; Calvert, S.; Pedersen, T.; Sage, D. Rhenium and molybdenum enrichments in sediments as indicators of oxic, suboxic and sulfidic conditions of deposition. Earth Planet. Sci. Lett. 1996, 145, 67–78. [Google Scholar] [CrossRef]
- Lézin, C.; Andreu, B.; Pellenard, P.; Bouchez, J.L.; Emmanuel, L.; Fauré, P.; Landrein, P. Geochemical disturbance and paleoenvironmental changes during the Early Toarcian in NW Europe. Chem. Geol. 2013, 341, 1–15. [Google Scholar] [CrossRef]
- Kimura, H.; Watanabe, Y. Ocean anoxia at the Precambrian-Cambrian boundary. Geology 2001, 29, 995–998. [Google Scholar] [CrossRef]
- Dypvik, H.; Harris, N.B. Geochemical facies analysis of fine-grained siliciclastics using Th/U. Zr/Rb and (Zr+Rb)/Sr ratios. Chem. Geol. 2001, 181, 131–146. [Google Scholar] [CrossRef]
- Cao, L.; Zhang, Z.; Li, H.; Zhong, N.; Xiao, L.; Jin, X.; Li, H. Mechanism for the enrichment of organic matter in the Liushagang Formation of the Weixinan Sag, Beibuwan Basin, China. Mar. Pet. Geol. 2020, 122, 104649. [Google Scholar] [CrossRef]
- Chen, X.; Fan, J.; Wang, W.; Wang, H.; Nie, H.; Shi, X.; Wen, Z.; Chen, D.; Li, W. Stage-progressive distribution pattern of the Lungmachi black graptolitic shales from Guizhou to Chongqing, Central China. Sci. China Earth Sci. 2017, 60, 1133–1146. [Google Scholar] [CrossRef]
- Zhai, G.; Wang, Y.; Liu, G.; Lu, Y.; He, S.; Zhou, Z.; Li, J.; Zhang, Y. Accumulation model of the Sinian-Cambrian shale gas in western Hubei Province, China. J. Geomech. 2020, 26, 696–713, (In Chinese with English Abstract). [Google Scholar]
- Chen, L.; Jiang, S.; Chen, P.; Chen, X.; Zhang, B.; Zhang, G.; Lin, W.; Lu, Y. Relative sea-level changes and organic matter enrichment in the Upper Ordovician-Lower Silurian Wufeng-Longmaxi Formations in the Central Yangtze area, China. Mar. Pet. Geol. 2021, 124, 104809. [Google Scholar] [CrossRef]


Disclaimer/Publisher’s Note: The statements, opinions and data contained in all publications are solely those of the individual author(s) and contributor(s) and not of MDPI and/or the editor(s). MDPI and/or the editor(s) disclaim responsibility for any injury to people or property resulting from any ideas, methods, instructions or products referred to in the content. |
© 2023 by the authors. Licensee MDPI, Basel, Switzerland. This article is an open access article distributed under the terms and conditions of the Creative Commons Attribution (CC BY) license (https://creativecommons.org/licenses/by/4.0/).