Abstract
Natural rocks are highly heterogeneous due to various geological processes that constantly alter their properties. The accumulation, deposition, and cementation of mineral and organic particles continuously modify the spatial characteristics of rock properties. Property variability or anisotropy is commonly observed in most rock types and influences strength, transport, and thermal conductivity behavior. This unpredictability presents a significant challenge for laboratory testing. Binder-jet additive manufacturing (3D printing) has emerged as a valuable technology for characterizing rock properties in geoscience and engineering. This study proposes a novel methodology to evaluate the variability and repeatability of mechanical properties of 3D-printed sandstones during binder-jet additive manufacturing. The mechanical properties were analyzed statistically for samples located in various parts of the 3D printer build volume. The results showed that the 3D-printed sandstones exhibited significant variations in their strength and stiffness properties when measured from samples produced within the same build volume during binder-jet additive manufacturing. The uniaxial compressive strength (UCS) varied from 23 to 38 MPa, with an average value of 29 MPa. Young’s modulus, on the other hand, ranged from 1.5 to 4.05 GPa, with an average value of 2.33 GPa. The variability of the mechanical properties, quantified by the standard deviation, decreased when the entire population of 3D-printed sandstones was divided into smaller samples situated at different elevations of the build platform. These findings offer valuable insights into improving the reliability and predictability of 3D-printed sandstone properties, a critical factor for various applications in fields like petroleum engineering and construction.
1. Introduction
Experimental studies play a crucial role in the development of numerous projects in geoscience and engineering. Laboratory testing of geomechanical and transport properties is essential for validating numerical analyses during the project design stage. However, experiments conducted on core samples from reservoir formations typically involve a degree of uncertainty due to the heterogeneous characteristics of rock samples [1]. Additionally, core sampling from wellbores, core handling, and laboratory testing procedures can increase uncertainty and introduce inherent property variability. Previous studies have demonstrated that uniaxial compressive strength (UCS) tests for homogeneous rocks may result in standard deviations ranging from 2 to 25 MPa, while those for heterogeneous rocks range from 33 to 53 MPa [2]. The UCS test is one of the most commonly used rock engineering parameters for strength determination in geomechanical studies. The broad range of standard deviation values for natural rocks encompasses a variety of failure modes that impact the prediction of the rock’s mechanical behavior. To account for the variability in rock properties, the standard deviation is often used to characterize the reliability of the rocks’ mechanical properties. For instance, studies focused on the mechanical properties of sedimentary rocks extracted from various depths have found that the standard deviation from UCS tests approximates 24 MPa for Fell sandstones [3]. Furthermore, UCS tests conducted on commonly studied sandstones revealed standard deviation values of 9.7 MPa for Berea, 41.1 MPa for Rockwell, and 60.4 MPa for Tuscarora sandstones [4]. This broad range of standard deviation values underscores the anisotropic nature of natural rocks, which introduces challenges in replicating experimental results and poses questions regarding the feasibility of validating numerical analyses.
Binder-jet additive manufacturing (3D printing) has emerged as a promising technology for characterizing rock properties across diverse engineering fields, such as petroleum and geothermal reservoirs, mining, and underground tunnels [5,6,7,8,9,10,11,12]. This technology allows for the creation of 3D-printed proxy models that serve as analogues to natural rock, offering greater control over properties and boundaries during experimental testing. The capability to create analogues of natural porous media with high repeatability, homogeneity, and low manufacturing costs offers a promising avenue for geosciences and engineering. Considering that natural rocks consist of mineral grains and cement, binder-jet technology provides the ability to manufacture rock analogues using similar components: mineral grains and organic binders. In a binder-jet system, a liquid binder is dispensed onto the powder, forming a two-dimensional pattern on a layer. These layers are subsequently stacked to produce a 3D volume. This system can adapt to nearly any powder type with high production rates [10], with material options ranging from sand and polymers to metals and ceramics. Silica sand, in particular, enables an accurate reproduction of porous media, with a resolution comparable to natural sandstones. Three-dimensional-printed sandstones, which possess physical and chemical properties similar to natural sandstones, serve as excellent models for laboratory experiments and numerical modeling calibration [7,9]. Previous studies have investigated the use of 3D-printed sandstones and their implications for geomechanics. Primkulov et al. [6] demonstrated that 3D-printed sandstones, when cured at an optimal temperature of 80 °C, could achieve a consistent UCS of 19.0 MPa. They further provided guidelines on the minimal number of UCS test repetitions required for reliable results. Gomez et al. [9] explored the utility of 3D-printed sandstones in emulating the behavior of natural rocks, particularly under consolidated drained triaxial tests. Their conclusions indicated that while the 3D-printed analogues closely mirrored the mechanical behavior of natural rocks, they were more compressible and permeable than commonly studied natural reservoirs such as Berea Sandstone.
Perras and Vogler [13] created 3D-printed sandstone analogues using sand and furan binders. These analogues exhibited mechanical behavior closely resembling that of natural, particularly weak, sandstone in terms of compressive and tensile strength ratios, as well as stiffness. This finding suggests the potential for these 3D-print materials to effectively replicate the behavior of natural rock specimens in geomechanical testing. Song et al. [14] explored the potential of 3D-printed rocks for simulating geomechanical and transport properties of natural rocks. These 3D-printed rocks, produced using binder jetting and selective laser curing, underwent uniaxial and triaxial compression tests. Their microstructural characteristics were comparable to natural sandstones, although they exhibited higher permeability. Yu et al. [15] investigated the mechanical properties and crack propagation modes of 3D-printed sandstone under high-temperature conditions. Their study revealed that both mechanical properties and crack propagation modes of 3D-printed sandstone significantly change under such conditions, primarily due to changes in the furan resin. The maximum UCS and splitting tensile strength were achieved at 150 °C when the resin transitions from a solid to a liquid state. However, the furan resin’s bonding capability and the sandstone’s structural integrity deteriorated significantly when heated to 300 °C.
Hodder et al. [16] explored the densification of 3D-printed sandstones. By adjusting printing parameters and using compaction rollers, the authors increased the samples’ density by approximately 15% and the UCS by around 65%. Song et al. [17] examined the heterogeneous mechanical properties of 3D-printed samples made from silica sand (SS), gypsum powder (GP), and coated silica beads (CSB), using binder jetting and selective laser curing technologies. Their findings suggested that the strength of the 3D-printed samples was significantly lower compared to natural rock, resulting in distinct regional fracture bands during failure, and the onset of failure at weak cementing points. The research also reported heterogeneity in mechanical properties due to inconsistent cementing conditions, with measurements of Young’s modulus and peak strength showing slight discrepancies from experimental data.
Although 3D-printed materials are generally considered to be homogeneous and isotropic, the physical properties of a single 3D-printed specimen may exhibit variability when compared to other specimens printed from the same batch [18,19]. Prior studies have examined the average values of the mechanical properties of 3D-printed sandstones, located randomly within the 3D-printing build volume [5,6,7,8,9,10,11,12,13,14,15,16,17]. However, the statistical spatial distribution of sandstone strength has not been thoroughly explored. The present study introduces a methodology to quantify the inherent property variability during binder-jet additive manufacturing. The experiment forming the basis of this study focuses on how sample location affects the strength of 3D-printed sandstones. During the experiments, other parameters were held constant, such as grain size distribution, porosity, binder content, bedding orientation, and sample dimensions.
2. Materials and Methods
2.1. 3D Printing Process and Post-Processing
The 3D-printed sandstones utilized in the laboratory experiments were manufactured using an M-Flex™ 3D printer (ExOne, North Huntingdon, PA, USA). The experiments were conducted at the GeoPRINT facilities at the University of Alberta. The M-Flex™ printer is a versatile tool, capable of printing with sand, metal, ceramics, or various composites. The machine has a build volume of 400 × 250 × 250 mm (L × W × H). The primary components of the 3D printer are the print-head system, the job box (build volume), the vibrating spreader (recoater), and the compacting roller (see Figure 1). The 3D-printing process involves mixing silica sand (D50 = 175 μm) with p-toluene sulfonic acid (activator) to coat the sand grains. The silica sand, purchased from ExOne (ExOne, North Huntingdon, PA, USA), serves as the printer’s standard sand. According to vendor datasheets, the sand consists of approximately 99% quartz silica, and the D50 value was determined via sieving. The acid-coated sand is then added to a hopper at the top of the M-Flex™ printer. The hopper deposits the sand into the vibrating spreader, which moves along the x-axis parallel to the job box, spreading a thin layer of 250 μm-thick silica sand. Following the vibrating spreader, a roller is employed to even out and compact the sand layer. Finally, the print-head system jets furfuryl alcohol (binder) onto the sand layer while moving along the x-y axis, adhering to the pattern of the digital file pre-loaded onto the M-Flex™ computer. This process is repeated layer by layer until the 3D volume is complete.
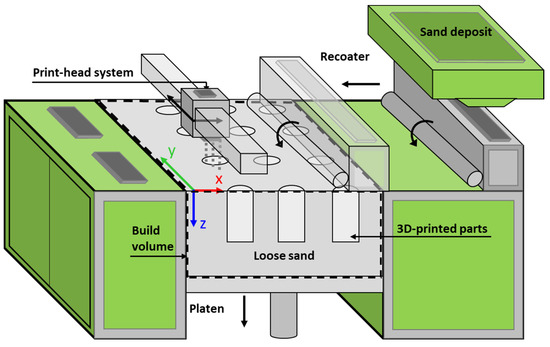
Figure 1.
Schematic of the M-Flex™ 3D printer illustrating its principal components and the main 3D-printing process.
All samples were subjected to a set binder saturation of 20%, given that this factor considerably impacts the strength properties of the printed sandstones [6,16]. Binder saturation refers to the volume of binder occupying the pore space. To achieve full strength, the 3D-printed sandstones were thermally cured at 80 °C for 24 h. This step helped to reduce the moisture in the samples resulting from the polymerization reaction between the binder and the activator [6,20]. The polymerization is an exothermic reaction that releases energy in the form of heat and creates the bonds or binder necks between the sand particles. Figure 2 displays the grain morphology of the 3D-printed sandstone under UV light at high magnification. The binder necks between sand particles are identified by the darker regions, while the porous space appears in areas back-filled with fluorescent epoxy (gradient blue). Further descriptions of the 3D-printing process can be found in previous studies [6,9,11,16].
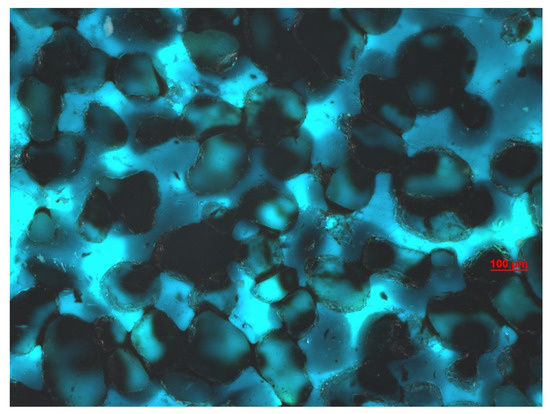
Figure 2.
High-magnification, optically transmitted bright field image of the microstructure of the 3D-printed sandstone.
2.2. Microstructure
The microstructure of the 3D-printed sandstones was analyzed using the Zeiss Xradia Versa 620 X-ray Microscope located in the nanoFAB laboratories at the University of Alberta. This advanced imaging system employs X-rays to generate high-resolution images, capable of rendering voxel sizes as small as 50 nanometers. The microscope was employed to investigate the anisotropy of the pore network within the 3D-printed rocks and to understand its potential impact on the rock strength. The specimen analyzed had a diameter of 22.29 mm and a 0.5:1 height-to-diameter ratio. Figure 3 illustrates the Micro-CT image of the cross-sectional area of the rock. This image was used to estimate the aspect ratio of the pores and the orientation of the pore network through a Python routine. The microstructure exhibits a degree of anisotropy, as evidenced by an average pore shape that is elliptical, with an aspect ratio predominantly around 1.7. The pore network is oriented in two main directions that reflect the layering during printing. Generally, an aspect ratio close to 1 would denote nearly spherical (or circular in 2D) pores, suggesting greater isotropy. For comparison, the aspect ratio of a carefully selected Berea sandstone ranges between 1.11 and 4.90 and can reach up to 12.7 for other commonly used sandstones [21]. The porosity was also calculated to be 41.6%. The microstructural analysis is crucial, as the pore structure may undergo changes during the printing process. The 3D printer can create samples with different pore networks, depending on the compaction effectiveness, thereby influencing the strength of the rocks.
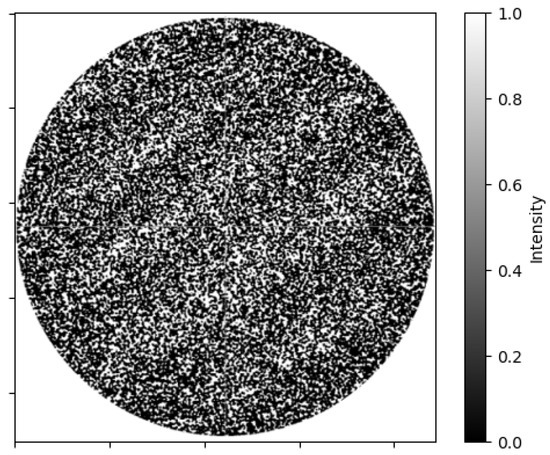
Figure 3.
Cross-sectional Micro-CT image of a 3D-printed sandstone sample, captured using the Zeiss Xradia Versa 620 X-ray Microscope, highlighting the internal microstructure and pore network of the sample.
2.3. Repeatability Testing
The experiment aimed to investigate the inherent variability and repeatability during binder-jet additive manufacturing. The laboratory testing program involved manufacturing 3D-printed sandstones uniformly distributed within the build volume of the M-Flex™ 3D printer. The specimens were printed vertically, with sand layering parallel to the powder bed (see Figure 1). For each specimen, the location inside the printer build volume was marked using x, y, and z coordinates. During the experiment preparation, the .STL digital files of the parts to be printed were imported into the 3D-printer software according to the predefined x, y, and z coordinates (see Figure 4). The x–y direction represents the coordinates or areas of interest in the powder bed, while the z-direction represents the printed samples in the lower (z1), middle (z2), and upper (z3) sections of the build volume. For each elevation (z1, z2, and z3), a total of 15 specimens were evenly distributed in the x-y direction of the build platform. The layout configuration was printed three times, one above the other, resulting in a total of 45 specimens. Figure 4 illustrates the distribution of the 3D-printed samples in the build volume.
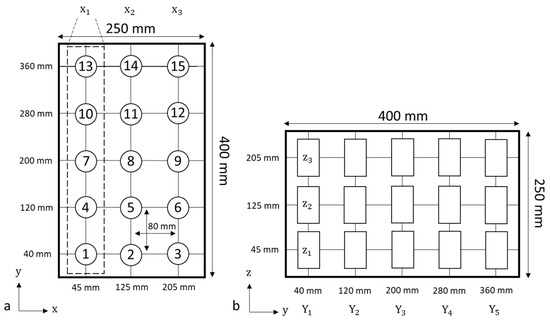
Figure 4.
Distribution of 3D-printed samples in the M-FlexTM 3D printer build volume: (a) top view illustrating the x-y plane distribution, and (b) lateral view demonstrating the layered elevation (z-axis) distribution.
2.4. Uniaxial Compressive Strength Testing
During compressive testing, the specimen is loaded axially with no radial stress until it fails, at which point the failure value is defined as the uniaxial compressive strength (UCS). Failure in compression occurs when the stresses acting on the rock exceed its compressive strength. The failure of rock in compression is a complex process involving microscopic failures, which manifest as the creation of small tensile cracks that eventually coalesce into a through-going shear plane [22]. In this study, a 50 kN loading frame system (Digital Tritest, ELE International, Loveland, CO, USA) was employed to determine the UCS of 3D-printed sandstones. The samples were manufactured with a recommended height-to-diameter ratio of 2:1—76.2 mm and 38.1 mm, respectively [23]. The printed samples were preloaded to 0.5 kN to establish contact between the specimen and the loading platens. Subsequently, the 3D-printed sandstones were compressed axially until failure. The loading rate was fixed at 0.25 mm/min, resulting in an average time-to-failure of seven minutes. The strain was measured using an external linear variable differential transformer (LVDT) mounted on two parallel rigid metallic discs. Young’s modulus, E, was determined using the slope of the straight-line portion of the stress–strain curve. The average slope was calculated by dividing the change in stress by the change in strain [23].
3. Results
Binder-jet additive manufacturing can accurately reproduce rock sandstone analogues, controlling sample-to-sample heterogeneity with a resolution equivalent to their natural counterparts. However, spatial distribution and variability of sandstone strength are consistently observed in specimens printed in the same build volume during binder-jet additive manufacturing. Variability describes data dispersion or how far apart data points lie from each other and from the center of a normal distribution [24]. Repeatability expresses the degree of identity of two specimens produced and measured under identical conditions [23]. The experiments focused on assessing the mechanical properties (UCS, Young’s modulus and bulk density) of samples printed simultaneously and under the same conditions. This workflow clarified the inherent variability during binder-jet additive manufacturing. The quantitative investigation was based on how the mechanical properties diverged from the mean values and how the resulting uncertainty can be reduced.
3.1. Strength and Stiffness Properties
The mechanical properties of rocks play a crucial role in characterizing rock masses for diverse engineering applications. Generally, natural rocks exhibit variability in their strength and stiffness properties, which is attributable to the natural processes implicated in their formation [25]. An example of this is the influence of weak bedding planes, a phenomenon often identified as strength anisotropy [22]. Compared to natural rocks, 3D-printed sandstones are generally more isotropic and homogeneous. However, the existence of property variability among specimens printed in the same batch has been noted, though often overlooked as average values are typically employed for analyses. To quantify this variability during the 3D-printing process, measurements of UCS, Young’s modulus, and bulk density were collected from a population of 45 3D-printed sandstones produced in a single batch. These 3D-printed sandstones were subjected to axial compression without confining stress until failure occurred. This failure mechanism, governed by a brittle mode, involved a sudden loss of cohesion. The material’s compressive strength was compromised when the shear fracture formed. The failure mode for most samples was characterized by two phenomena: the formation of a cone-shaped structure at one end of the specimen and axial splitting from the cone’s apex. This behavior aligns with the findings reported in previous studies [5,6,7,8,9,16].
The experimental results, illustrated in Figure 5, highlight significant variations in the strength and stiffness properties of 3D-printed sandstones. The UCS ranged from a minimum of 23 MPa to a maximum of 38 MPa, with an average value of 29 MPa. Young’s modulus varied from 1.50 GPa to 4.05 GPa, with an average value of 2.33 GPa. The dry bulk density showed a strong correlation with the UCS results, suggesting a non-uniformity in the 3D printer’s compaction mechanism across the building volume. A higher bulk density was generally associated with increased strength. The range of results highlights the critical need for improved homogeneity in 3D printing. While 3D-printed sandstones offer numerous advantages, careful control and deeper exploration of the printing process are necessary to reduce variability and optimize these specimens’ potential for applications in rock mechanics and engineering.
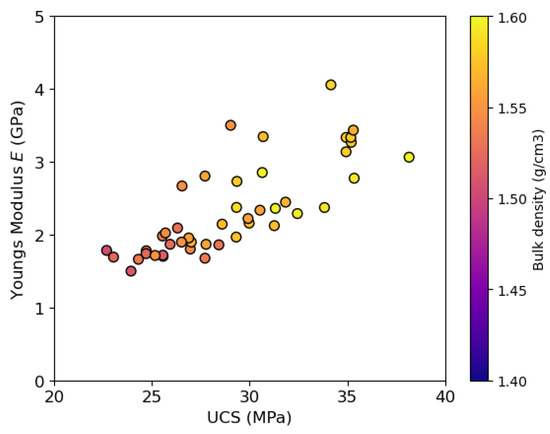
Figure 5.
Variability of strength and stiffness among 3D-printed sandstones produced in a single batch.
3.2. Variability of Uniaxial Compressive Strength, Young’s Modulus, and Bulk Density
To develop a deeper understanding of the variability observed during 3D printing, the experimental results were divided into distinct groups drawn from the entire population of samples. Figure 6 illustrates the mechanical properties of the 3D-printed samples, highlighting their variability across the build platform area, with color intensity representing variation in magnitude. The samples were divided by their level in the build volume (platform elevation, denoted as z1, z2, and z3). Subsequently, each level was discretized to represent the left (x1), center (x2), and right (x3) sections of the powder bed. This categorization enabled the identification of areas where significant changes were observed.
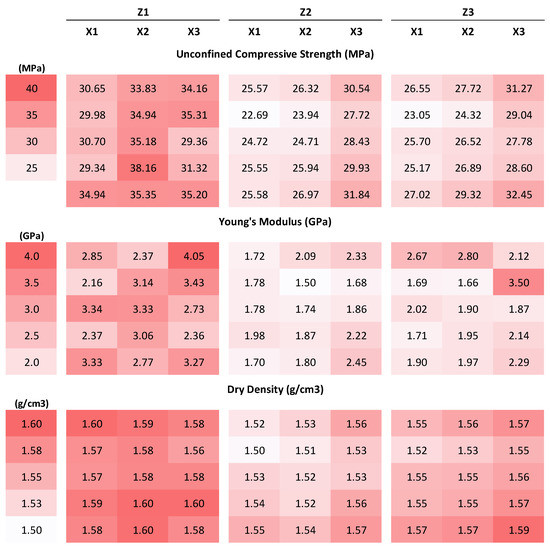
Figure 6.
Variability of strength and stiffness among 3D-printed sandstones at different locations in the build volume.
The results indicated that the sandstones printed on the lower elevation of the build box (level z1) exhibited superior mechanical properties (UCS, Young’s modulus, and bulk density) compared to the sandstones printed on the higher levels (z2 and z3). Moreover, samples located at z1-x2 (the center of the powder bed on level 1) displayed higher mechanical properties than those in areas z1-x1 and z1-x3 (refer to Figure 6). This trend could possibly be due to the higher compaction of the roller in that particular area, which would lead to a reduction in the pore volume of the samples, thereby increasing their bulk density. Interestingly, when the same configuration was replicated on levels z2 and z3, the 3D-printed sandstones exhibited higher mechanical properties on the right side of the powder bed (areas z2-x3 and z3-x3). This pattern could be interpreted as a rightward shift in the roller’s compacting force as the platform elevation increased. A similar pattern was observed for Young’s modulus values, where samples from level z1 exhibited stiffer properties than those from z2 and z3. The dry density showed a correlation directly proportional to the UCS results, which can be attributed to the fact that the strength of the specimen was determined by the compaction performance during 3D printing. Greater compaction density facilitated superior grain packing arrangements, leading to the generation of stronger specimens.
The influence of property variability was further explored using statistical analysis. Frequency distribution, mean, and standard deviation were calculated for the entire set of 3D-printed sandstone samples. The data, depicting the total population of 3D-printed sandstones, yielded a histogram indicative of a normal distribution (Figure 7a). The mean and standard deviations of the UCS values were computed to be 29.11 MPa and 3.85 MPa, respectively. When dividing the complete population of 3D-printed sandstones into smaller subgroups, a significant decrease in variability (as quantified by the standard deviation) was observed. The sample groups representing the elevation of the build platform (z1, z2, and z3) exhibited narrower normal distributions (delineated by dashed lines) than the total population, with standard deviations of 2.65 MPa, 2.47 MPa, and 2.40 MPa, respectively (refer to Figure 7). Further division of these samples, based on each elevation into smaller groups located in the left, center, and right sections of the printing area (e.g., z1-x123, z2-x123, z3-x123), resulted in an additional decrease in standard deviation. Figure 7b–d illustrate the normal distribution of UCS values for the lower, middle, and upper elevations of the build platform, respectively. For the lower and middle elevations of the build platform, the center of the powder bed had minimal property variability. Conversely, the higher elevation showed reduced variability on the left side of the powder bed (z3-x1). Overall, the optimal location for minimizing property variability is at the center of the powder bed at the middle elevation (z2-x2).
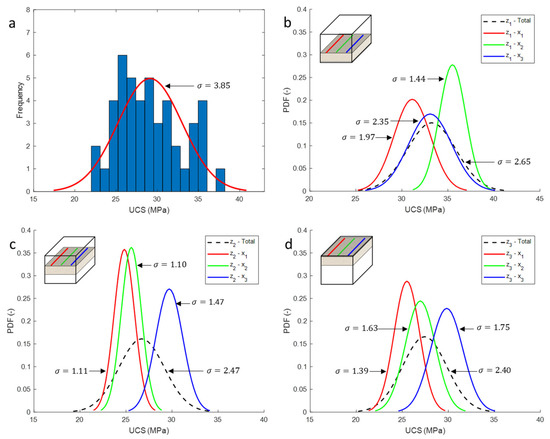
Figure 7.
Distribution and variability of UCS in 3D-printed sandstones: (a) illustrates the normal distribution of the total population, (b) displays the normal distribution at the lower elevation (z1), emphasizing maximum compaction in the platform’s center (z1-x2), (c) portrays the normal distribution at the middle elevation (z2), where samples exhibited reduced variability, and (d) presents the normal distribution at the higher elevation (z3), both (c,d) highlight enhanced compaction in the right section of the powder bed.
These graphs expose changes in the compacting performance of the M-FlexTM 3D printer as the building platform transitioned along the z-axis. For samples printed at the lower elevation of the printer build volume (z1), the highest strength specimens were observed in the center of the platform (e.g., sample z1-x2 (green curve)), where compaction reached its maximum (Figure 7b). As the platform’s elevation increased to z2 and z3, the samples on the right section of the powder bed exhibited higher compaction (e.g., samples z2-x3 and z3-x3 (blue curves)). The alteration in compaction might result in samples with different pore networks or aspect ratios, potentially affecting the flow properties of the rock. As such, it underscores the necessity of acknowledging and adjusting for these variations when utilizing 3D-printed sandstones in reservoir geomechanical studies, as these differences can have significant implications for both predictive modeling and empirical data analysis.
Figure 8 illustrates the normal distribution of Young’s modulus values for each group of 3D-printed sandstone samples. The displayed graphs exhibit a clear pattern. The modulus values of the samples from the lower elevation (z1) were noticeably higher than those from levels z2 and z3. Notably, the stiffest specimens were consistently located in the right section of the powder bed across all three elevations (z1, z2, and z3). The observed trends in Young’s modulus across the build platform are significant as they suggest that the printing process may result in spatial variability in material stiffness. This could have implications for the design and the use of 3D-printed sandstone structures, as different regions of the build platform may produce parts with different mechanical properties.
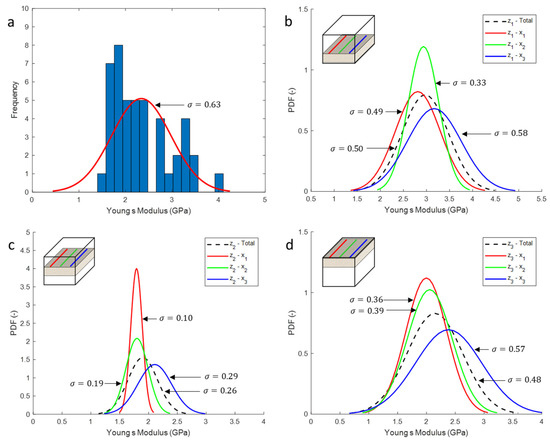
Figure 8.
Distribution and variability of Young’s modulus in 3D-printed sandstones: (a) normal distribution for the total population, (b) normal distribution at lower elevation (z1), (c) normal distribution at middle elevation (z2), and (d) normal distribution at higher elevation (z3).
4. Discussion
The implications of these findings are considerable, particularly when comparing the quality and consistency of 3D-printed sandstones to their natural counterparts. If a specimen is selected from a random area within the 3D printer’s build volume, both the quality (as indicated by the number of flaws) and the repeatability of strength in the 3D-printed sandstones exceed that of natural sandstones. For instance, data from natural sandstones reveal that the standard deviation of UCS varies considerably among different types: 17.9 MPa for Berea sandstone, 23.5 MPa for Red Jacket sandstone, 24 MPa for Fell sandstone, and 36.9 MPa for Island Creek sandstone [2]. From a geomechanical perspective, these results are significant as they underscore the potential of 3D-printed sandstones to provide more consistent and reliable geomechanical properties than natural sandstones. This offers potential benefits for a range of applications, from petroleum engineering to construction, where the predictability of material performance is crucial. Furthermore, this research underscores the importance of understanding spatial variability within the 3D printer’s build volume, which can further enhance the predictability and optimization of 3D-printed sandstone properties.
5. Conclusions
The primary objective of this study was to assess the inherent variability of mechanical properties in binder-jet additive manufacturing. Although 3D-printed sandstones exhibit isotropy and homogeneity at an individual level, there is noticeable variability in sandstone strength among specimens printed within the same batch.
The variability, quantified by the standard deviation, decreased when the entire population of 3D-printed sandstones was segmented into smaller sample groups located at different elevations of the build platform. This variability was further diminished when these samples were further subdivided into specific regions within the powder bed, as evidenced by narrower normal distributions.
Sandstones printed at the lower elevation of the build box exhibited greater strength and stiffness compared to those printed at higher elevations. Furthermore, samples situated at the center of the powder bed at the lower level demonstrated superior mechanical properties relative to samples in the peripheral regions. Interestingly, 3D-printed sandstones exhibited higher mechanical properties on the right side of the powder bed when the same configuration was applied at higher elevations.
The center of the build volume at the middle elevation was identified as the optimal location to minimize property variability.
From a geomechanical standpoint, understanding this variability is vital as it provides valuable insights for optimizing 3D-printing processes for sandstone structures. This understanding also significantly enhances the predictability of material performance, thereby unlocking new possibilities in fields like petroleum engineering and construction, where the reliability and predictability of material properties are of utmost importance.
Author Contributions
Conceptualization, A.S.-B., G.Z.-N. and R.C.; Data curation, A.S.-B.; Formal analysis, A.S.-B. and G.Z.-N.; Funding acquisition, G.Z.-N. and R.C.; Investigation, A.S.-B. and G.Z.-N.; Methodology, A.S.-B. and G.Z.-N.; Supervision, R.C.; Writing—original draft, A.S.-B. and G.Z.-N.; Writing—review and editing, G.Z.-N. and R.C. All authors have read and agreed to the published version of the manuscript.
Funding
The authors gratefully acknowledge the financial support for this project from Consejo Nacional de Ciencia y Tecnología (CoNaCyT), the Natural Sciences and Engineering Research Council of Canada (NSERC), and the Energi Simulation Industrial Research Consortium on Reservoir Geomechanics for Unconventional Resources.
Data Availability Statement
The data presented in this study are available upon request from the corresponding author.
Acknowledgments
The authors also wish to acknowledge Kevin Hodder for sectioning and photographing of the specimens’ grain morphology under UV light, and the staff from the nanoFAB laboratories at the University of Alberta for CT scanning the 3D-printed sandstones.
Conflicts of Interest
The authors declare that they have no known competing financial interests or personal relationships that could have appeared to influence the work reported in this paper.
References
- Hodder, K.J.; Nychka, J.A.; Chalaturnyk, R.J. Process Limitations of 3D Printing Model Rock. Prog. Addit. Manuf. 2018, 3, 173–182. [Google Scholar] [CrossRef]
- Bewick, R.P.; Amann, F.; Kaiser, P.K.; Martin, C.D. Interpretation of UCS Test Results for Engineering Design. In Proceedings of the 13th ISRM International Congress of Rock Mechanics, Montreal, Canada, 10 May 2015; pp. 1–14. [Google Scholar]
- Bell, F.G. The Physical and Mechanical Properties of the Fell Sandstones, Northumberland, England. Eng. Geol. 1978, 12, 1–29. [Google Scholar] [CrossRef]
- Hale, P.A.; Shakoor, A. A Laboratory Investigation of the Effects of Cyclic Heating and Cooling, Wetting and Drying, and Freezing and Thawing on the Compressive Strength of Selected Sandstones. Environ. Eng. Geosci. 2003, 9, 117–130. [Google Scholar] [CrossRef]
- Osinga, S.; Zambrano-Narvaez, G.; Chalatumyk, R.J. Study of Geomechanical Properties of 3D Printed Sandstone Analogue. In Proceedings of the 49th US Rock Mechanics/Geomechanics Symposium 2015, San Francisco, CA, USA, 29 June–1 July 2015; Volume 4, pp. 3137–3142. [Google Scholar]
- Primkulov, B.; Chalaturnyk, J.; Chalaturnyk, R.; Narvaez, G.Z. 3D Printed Sandstone Strength: Curing of Furfuryl Alcohol Resin-Based Sandstones. 3D Print. Addit. Manuf. 2017, 4, 149–156. [Google Scholar] [CrossRef]
- Vogler, D.; Walsh, S.D.C.; Dombrovski, E.; Perras, M.A. A Comparison of Tensile Failure in 3D-Printed and Natural Sandstone. Eng. Geol. 2017, 226, 221–235. [Google Scholar] [CrossRef]
- Ardila, N.; Zambrano-Narvaez, G.; Chalaturnyk, R.J. Wettability Measurements on 3D Printed Sandstone Analogues and Its Implications for Fluid Transport Phenomena. Transp. Porous Media 2018, 129, 521–539. [Google Scholar] [CrossRef]
- Gomez, J.S.; Chalaturnyk, R.J.; Zambrano-Narvaez, G. Experimental Investigation of the Mechanical Behavior and Permeability of 3D Printed Sandstone Analogues Under Triaxial Conditions. Transp. Porous Media 2018, 129, 541–557. [Google Scholar] [CrossRef]
- Ziaee, M.; Crane, N.B. Binder Jetting: A Review of Process, Materials, and Methods. Addit. Manuf. 2019, 28, 781–801. [Google Scholar] [CrossRef]
- Hodder, K.; Ishutov, S.; Sanchez, A.; Zambrano, G.; Chalaturnyk, R. 3D Printing of Rock Analogues in Sand: A Tool for Design and Repeatable Testing of Geomechanical and Transport Properties. In Proceedings of the 2nd International Conference on Energy Geotechnics (ICEGT 2020), La Jolla, CA, USA, 20–23 September 2020; Volume 205. [Google Scholar] [CrossRef]
- Santiago, V.; Zabala, F.G.; Sanchez-Barra, A.J.; Deisman, N.; Chalaturnyk, R.J.; Zhong, R.; Hurter, S. Experimental Investigation of the Flow Properties of Layered Coal-Rock Analogues. Chem. Eng. Res. Des. 2022, 186, 685–700. [Google Scholar] [CrossRef]
- Perras, M.A.; Vogler, D. Compressive and Tensile Behavior of 3D-Printed and Natural Sandstones. Transp. Porous Media 2019, 129, 559–581. [Google Scholar] [CrossRef]
- Song, R.; Wang, Y.; Ishutov, S.; Zambrano-Narvaez, G.; Hodder, K.J.; Chalaturnyk, R.J.; Sun, S.; Liu, J.; Gamage, R.P. A Comprehensive Experimental Study on Mechanical Behavior, Microstructure and Transport Properties of 3D-Printed Rock Analogs. Rock Mech. Rock Eng. 2020, 53, 5745–5765. [Google Scholar] [CrossRef]
- Yu, C.; Tian, W.; Zhang, C.; Chai, S.; Cheng, X.; Wang, X. Temperature-Dependent Mechanical Properties and Crack Propagation Modes of 3D Printed Sandstones. Int. J. Rock Mech. Min. Sci. 2021, 146, 104868. [Google Scholar] [CrossRef]
- Hodder, K.J.; Sanchez-Barra, A.J.; Ishutov, S.; Zambrano-Narvaez, G.; Chalaturnyk, R.J. Increasing Density of 3D-Printed Sandstone through Compaction. Energies 2022, 15, 1813. [Google Scholar] [CrossRef]
- Song, R.; Wu, M.; Wang, Y.; Liu, J.; Yang, C. In-Situ X-CT Scanning and Numerical Modeling on the Mechanical Behavior of the 3D Printing Rock. Powder Technol. 2023, 416, 118240. [Google Scholar] [CrossRef]
- Cone, J.A.; Martin, T.M.; Marcellin-Little, D.J.; Harrysson, O.L.A.; Griffith, E.H. Accuracy and Repeatability of Long-Bone Replicas of Small Animals Fabricated by Use of Low-End and High-End Commercial Three-Dimensional Printers. Am. J. Vet. Res. 2017, 78, 900–905. [Google Scholar] [CrossRef] [PubMed]
- Ardila, N. Hydraulic Properties Characterization of 3D Printed Sandstone Analogues. Master’s Thesis, University of Alberta, Edmonton, AB, Canada, 2018. [Google Scholar]
- Hodder, K. Fabrication, Characterization and Performance of 3D-Printed Sandstone Models. Ph.D. Thesis, University of Alberta, Edmonton, AB, Canada, 2017. [Google Scholar]
- Sui, W.; Quan, Z.; Hou, Y.; Cheng, H. Estimating Pore Volume Compressibility by Spheroidal Pore Modeling of Digital Rocks. Pet. Explor. Dev. 2020, 47, 603–612. [Google Scholar] [CrossRef]
- Zoback, M.D. Reservoir Geomechanics; Cambridge University Press: Cambridge, UK, 2007. [Google Scholar] [CrossRef]
- ASTM Standard D7012-14; Standard Test Methods for Compressive Strength and Elastic Moduli of Intact Rock Core Specimens under Varying States of Stress and Temperatures. ISO: West Conshohocken, PA, USA, 2014.
- Mann, P.S. Introductory Statistics; Wiley: New York, NY, USA, 2007. [Google Scholar]
- Vogler, D.; Settgast, R.R.; Annavarapu, C.; Madonna, C.; Bayer, P.; Amann, F. Experiments and Simulations of Fully Hydro-Mechanically Coupled Response of Rough Fractures Exposed to High-Pressure Fluid Injection. J. Geophys. Res. Solid Earth 2018, 123, 1186–1200. [Google Scholar] [CrossRef]


Disclaimer/Publisher’s Note: The statements, opinions and data contained in all publications are solely those of the individual author(s) and contributor(s) and not of MDPI and/or the editor(s). MDPI and/or the editor(s) disclaim responsibility for any injury to people or property resulting from any ideas, methods, instructions or products referred to in the content. |
© 2023 by the authors. Licensee MDPI, Basel, Switzerland. This article is an open access article distributed under the terms and conditions of the Creative Commons Attribution (CC BY) license (https://creativecommons.org/licenses/by/4.0/).