Article

Research on Mathematical Model of Shale Oil Reservoir Flow

1
College of Engineering Science, University of Chinese Academy of Sciences, Beijing 100049, China
2
Institute of Porous Flow and Fluid Mechanics, Langfang 065007, China
3
Research Institute of Petroleum Exploration & Development, Beijing 100083, China
*
Author to whom correspondence should be addressed.
Energies 2023, 16(14), 5452; https://doi.org/10.3390/en16145452
Submission received: 29 March 2023 / Revised: 2 July 2023 / Accepted: 10 July 2023 / Published: 18 July 2023
(This article belongs to the Section H: Geo-Energy)

Abstract

:
There are complex pore structures in shale reservoirs, and the nonlinear flow characteristics of shale reservoirs are complicated by stress sensitivity and boundary layer effects. In this research, a new flow mathematical model was established based on capillary model, stress sensitivity and boundary layer effect. The model was verified by the experimental results of Jilin shale oil reservoir, and the influencing factors of flow characteristics were analyzed. The results show that the new shale oil flow model has good fitting and high reliability with the experimental results. The boundary layer effect and stress sensitivity are the main factors affecting the seepage characteristics. With the increase in the pressure gradient, the influence of the boundary layer effect on the flow is gradually enhanced, and the influence of the stress sensitivity on the flow is gradually weakened. At the same time, this study developed a method for the evaluation of effective displacement distance of shale oil reservoir with CO2 injection through the limited injection-production well spacing method, and obtained the nonlinear flow curve of displacement distance with reservoir permeability under different injection and production pressure difference. This research deeply studies the flow characteristics of shale oil reservoir and provides a theoretical basis for the enhanced oil recovery of shale oil with CO2 injection.

1. Introduction

Domestic and foreign scholars generally believe that shale oil reservoirs have complex lithology composition, small size, strong heterogeneity, and strong stress sensitivity [1,2,3,4,5]. Among them, Jilin Oilfield can be regarded as a typical reservoir. Due to the characteristics of pore-fracture dual medium in its reservoir space, micronano pores and microfractures are widespread [6,7,8], which leads to the influence of medium deformation and the boundary layer effect on micronano pores in the process of crude oil flow, thus increasing the difficulty of researching the reservoir flow mechanism. Therefore, it is necessary to conduct an in-depth study on the flow law and its influencing factors of the reservoir. At present, there are numerous studies on the boundary layer effect and stress sensitivity effect on the flow process of low permeability and shale oil reservoir at home and abroad. Dejam [9] et al. show that the flow of low permeability cores is concave and nonlinear. Zhang Rui [10] et al. used pulse emission to study the effect of stress sensitivity on the permeability of shale reservoirs. The results show that the stress sensitivity of shale reservoirs is one order of magnitude higher than that of tight reservoirs. Xu Shaoliang et al. [11] studied the influence of boundary layer effect on fluid flow in micropipe by using micropipe experiments. The results show that the smaller the pipe radius, the more obvious the boundary layer effect, and the thickness of the fluid boundary layer decreases exponentially with the decrease of the pressure gradient at both ends of the fluid. Song Fuquan et al. [12] also proposed a new exponential motion equation for low permeability reservoirs based on the boundary layer theory and verified it by experimental data. Based on the capillary model, Lei Hao et al. [13] established a new flow model of shale oil reservoir by combining the theory of boundary layer and stress sensitivity without considering the influence of crude oil viscosity on the boundary layer. Without considering the stress sensitivity, Li Yanze et al. [14] defined the expression form of the nonlinear flow law by starting the quantitative characterization experiment of pressure gradient and boundary layer and deduced the nonlinear flow model suitable for the ultra-low permeability and tight sandstone reservoir in Jidong Oilfield. In conclusion, it is difficult to test the flow characteristics of unconventional oil and gas reservoirs, and research on the boundary layer effect and stress sensitivity on the flow process of shale oil reservoirs has not been in-depth. In this research, starting from the basic concept of capillary model, the influence of fluid viscosity on boundary layer effect was taken into account, and the mathematical formula of fluid flow considering stress sensitivity and boundary layer effect was established. The influencing factors of flow characteristics were analyzed, and the formula was verified and fitted through combination with the experimental results of typical shale oil reservoir. Secondly, since the previous effective utilization coefficient method and numerical simulation method need a large amount of data to accurately calculate the limited well spacing [15,16], this research adopted the limited injection-production well spacing method to establish an evaluation method for the effective displacement distance of CO2 injection in shale oil reservoirs, solved the problem of displacement distance in the actual exploitation of shale oil reservoirs, and provided a theoretical basis for the enhanced oil recovery of shale oil with CO2 injection.

2. Derivation and Construction of Nonlinear Flow Model of Shale Oil Reservoir

Starting from the basic concept of capillary model, this study made the following assumptions: ① the flow in the tube is one-dimensional; ② the heat conduction along the flow direction in the tube was not considered; ③ the flow is adiabatic; ④ the flow in the tube is uniform; ⑤ the micronano flow of gas in the process of CO2 displacement was not considered. This study did not consider the micronano flow of CO2 in the displacement process, and the micronano flow in shale is briefly introduced below. Klinkenberg [17] considered the empirical model of gas slippage effect based on experimental data. Ma et al. [18] considered the effect of real gas on the basis of the Javadpour model. Wu Keliu et al. [19] considered slip, Knudsen diffusion, and stress sensitivity. On the basis of the Javadpour model, Huang et al. considered surface diffusion. Zhang Yizhong et al. [20] considered slippage, Knudsen diffusion, surface diffusion, stress sensitivity, real gas effect, and effective flow area and established a more reasonable and perfect shale gas nano-organic pore migration model. Chen Lei et al. [21] studied the influence of nanoscale pore distribution on gas production of fractal shale by using the FHH equation to calculate two fractal dimensions D1 and D2, with the gas production performance of shale increasing with the increase of D1 and D2. By introducing the Langmuir isothermal adsorption formula and permeability modulus, combined with dual medium model, stress sensitivity, and hydraulic vertical fracture properties, Xiong Ye et al. [22] established an unstable flow mathematical model of hydraulic fractured vertical well in a stress-sensitive two-hole single-permeability shale gas reservoir. Based on the traditional fracture-matrix dual medium model, Cai Hua et al. [23] considered the production decline model of fractured shale gas reservoirs under the influence of stress sensitivity and the adsorption effect.

2.1. Permeability Characterization Equation Considering Stress Sensitivity

According to the study of Zhang Rui et al. [10], the change in shale reservoir permeability and effective stress shows an exponential relationship.
K = K 0 e β σ C  
In which  K  is the permeability,  mD K 0  is the initial permeability,  mD C    is the pore compression coefficient of the rock,   MPa 1 ; σ is the effective stress,  MPa . The value of  β  is the pore-permeability power index and it is related to the pore morphology of the rock. The value of  β  is two for the capillary model and three for the fracture.
The confining pressure (overlying rock pressure) is generally kept constant during the experiment and actual production process. In porous media, the pore pressure is different at different distances from the inlet (producing well) due to the production pressure difference. Therefore, the effective stress in the porous medium at different distances from the injection end (producing well) can be expressed as follows.
σ x = P c P x  
In which  σ x  is the effective stress at a spacing of  x  from the production well,  MPa P c  is the confining pressure,  MPa ; P x  is the pore pressure of  x  away from the producing well,  MPa .
Equation (1) of the permeability of shale oil reservoir with effective stress can be rewritten as follows.
K = K 0 e β C P c P x
Therefore, the reservoir fluid motion equation, considering the stress sensitive effect, is as follows.
v = K 0 e β C P c P μ d P d x  
where, v is the flow velocity, cm/s.
The boundary conditions can be obtained from the physical model as follows.
x = L ,   P = P 1 ;   x = 0 ,   P = P 2    
The boundary conditions were substituted into Equation (4) and both sides were integrated as follows.
v = K 0 μ β C L e β C P c P 2 e β C P c P 1  
 In which  P 1  is the bottom pressure,  MPa P 2  is the injection pressure,  MPa ; μ is the fluid viscosity,  mPa · s .
When the fluid flow reaches a constant state, the difference between the injection end and the confining pressure is constant.  β C    is replaced by  a , and Equation (6) is rewritten as follows.
v = K 0 e a b μ a L 1 e a P    
 In which  b  is the difference between confining pressure and injection pressure,  MPa P  is the pressure difference between the two ends of the flow,  MPa .
Therefore, the reservoir permeability expression considering stress sensitivity can be obtained as follows.
K = K 0 e a b a P 1 e a P    

2.2. Derivation of Nonlinear Flow Model Considering Boundary Layer Effects

Crude oil has a complex composition, does not belong to a single Newtonian fluid, and has yield stress. The micro pore throat of shale oil reservoir makes non-Newtonian properties not negligible. The mechanical equilibrium equation of fluid passing through capillary tube at uniform velocity is as follows.
P π r 2 τ 0 + μ d v d r 2 π r L = 0    
 In which  r  is the capillary radius,  μ m τ 0  is the yield stress,  MPa v  is the fluid flow velocity,  cm / s L  is the length of the capillary,  μ m P π r 2  is the driving force, MPa;  τ 0 + μ d v d r 2 π r L  is the internal friction force, MPa. The flow equation of the fluid is obtained as follows.
v = P r 2 4 μ τ 0 μ r    
where,  P  is the pressure gradient,  MPa / m .
The solid surface of the flow channel adsorbs the polar components of the crude oil, so there is a boundary layer. A shale oil reservoir has a micropore throat and large specific surface area, so the influence of the boundary layer effect cannot be ignored, as shown in Figure 1. After considering the boundary layer effect, the flow rate can be calculated as follows.
q = π r δ 4 8 μ P 8 τ 0 3 r δ  
In which  q  is the flow rate of a single capillary,  cm 3 δ  is the boundary layer thickness,  μ m .
δ  shows the influence between solid and liquid and liquid and liquid on the flow. The core of the experiment simulates a single parallel capillary with radius  r  placed in a solid. Assuming that there are  N  sets of such capillaries placed perpendicular to the unit cross-sectional area of the fluid flow direction, the flow equation of porous media is as follows [24,25,26].
v = K μ 1 δ r 4 1 8 τ 0 3 r 1 δ r P L P L  
Equation (12) is more in line with the actual flow of a shale reservoir than the Darcy flow if  a 1 . =  8 τ 0 / 3 r , when  P = 0 ,   v = 0 . Equation (12) can be obtained as follows.
a 1 = 0  
In addition, domestic scholars have analyzed the influence of the boundary layer effect on the flow law of low permeability and tight reservoirs. Long Teng et al. [27] determined the relationship between the flow rate of deionized water and the pressure gradient in the micro and analyzed the relationship between the thickness of the microtubule boundary layer and the pressure gradient. Yan Qinglai et al. [28] showed that the boundary layer thickness decreases exponentially with the pressure gradient. Therefore, the boundary layer thickness in a single capillary tube has a power function relationship with the pressure gradient and a linear relationship with the viscosity.
δ r = c μ P d
In which  c  and  d . are fitting coefficients, the constants.
According to Li Yanze et al. [14], Equation (14) is highly nonlinear and has poor generalization and practicability for the model. Therefore, the inverse function was used to express the pressure gradient, and the calculation results show that the error of the converted inverse function expression is not large compared with the power function expression. Therefore, the simplified boundary layer thickness expression was adopted in the subsequent derivation.
δ r = c μ d P   .  
By substituting Equations (13) and (15) into Equation (12), the flow equation is as follows.
v = K μ 1 c μ d P 4 P L .  
By substituting Equation (8) into Equation (16), the differential equation of shale oil flow considering stress sensitivity and boundary layer effect was established as follows.
v = K 0 e a b a μ L 1 e a P 1 c μ d P 4   .  
At the same time, considering the difference between the experimental core and the theoretical model, the correction coefficient  ξ . is introduced, which has the following expression.
ε = ξ e a b a .  
By plugging in Equation (18) into Equation (17), the following formula was obtained.
v = ε K 0 μ L 1 e a P 1 c μ d P 4 .  
If
c d = a 2   .
Equation (19) can be simplified as follows.
v = ε K 0 μ L 1 e a P 1 a 2 μ P 4 .  
In which  ε  is a constant related to permeability and initial effective stress, power, pore compressibility, cores connectivity, and pore structure.

2.3. Validation of a New Flow Model for Shale Oil

(1)
Experimental procedures and methods. In this study, the HXS-100 high-temperature and high-pressure long core displacement system was used, and the experimental device diagram is shown in Figure 2. The experimental steps and methods are as follows.
(i.)
The core after oil washing is dried to measure porosity and permeability.
(ii.)
The preparation of vacuum saturated simulated formation water (simulated formation water was prepared by using manganese water based on actual formation water data). After placing it in a vacuum container, the core was evacuated using a vacuum pump for at least 24 h and then saturated with simulated formation water.
(iii.)
Saturated oil of the core. The core was loaded into the core gripper, and the confining pressure was maintained 2.0 MPa higher than the injection pressure. The temperature was increased to the experimental design temperature of 82 °C, and the formation crude oil was injected into the core for more than 3 PV until no water came out.
(iv.)
Saturated live oil of the core. The core was loaded into the core gripper, the confining pressure was maintained 2.0 MPa higher than the injection pressure, and the back pressure was gradually increased to 21 MPa. The temperature was increased to the experimental design temperature of 82 °C. After a stable period of time, more than 1 PV of compound live oil was injected into the core.
(v.)
CO2 flooding. After the saturated oil is completed, it is allowed to sit for a period of time until the pressure at the inlet and outlet of the core is balanced. The displacement experiment was carried out with carbon dioxide as the displacement medium. The experiment was carried out in the order of pressure rise, and each pressure was stable for 20 min. The outlet fluid flow Q and the actual value P corresponding to the pressure gauge at this time were recorded. The accumulated fluid output and other relevant parameters were also recorded.
(2)
Fitting of new seepage mathematical model to experimental results
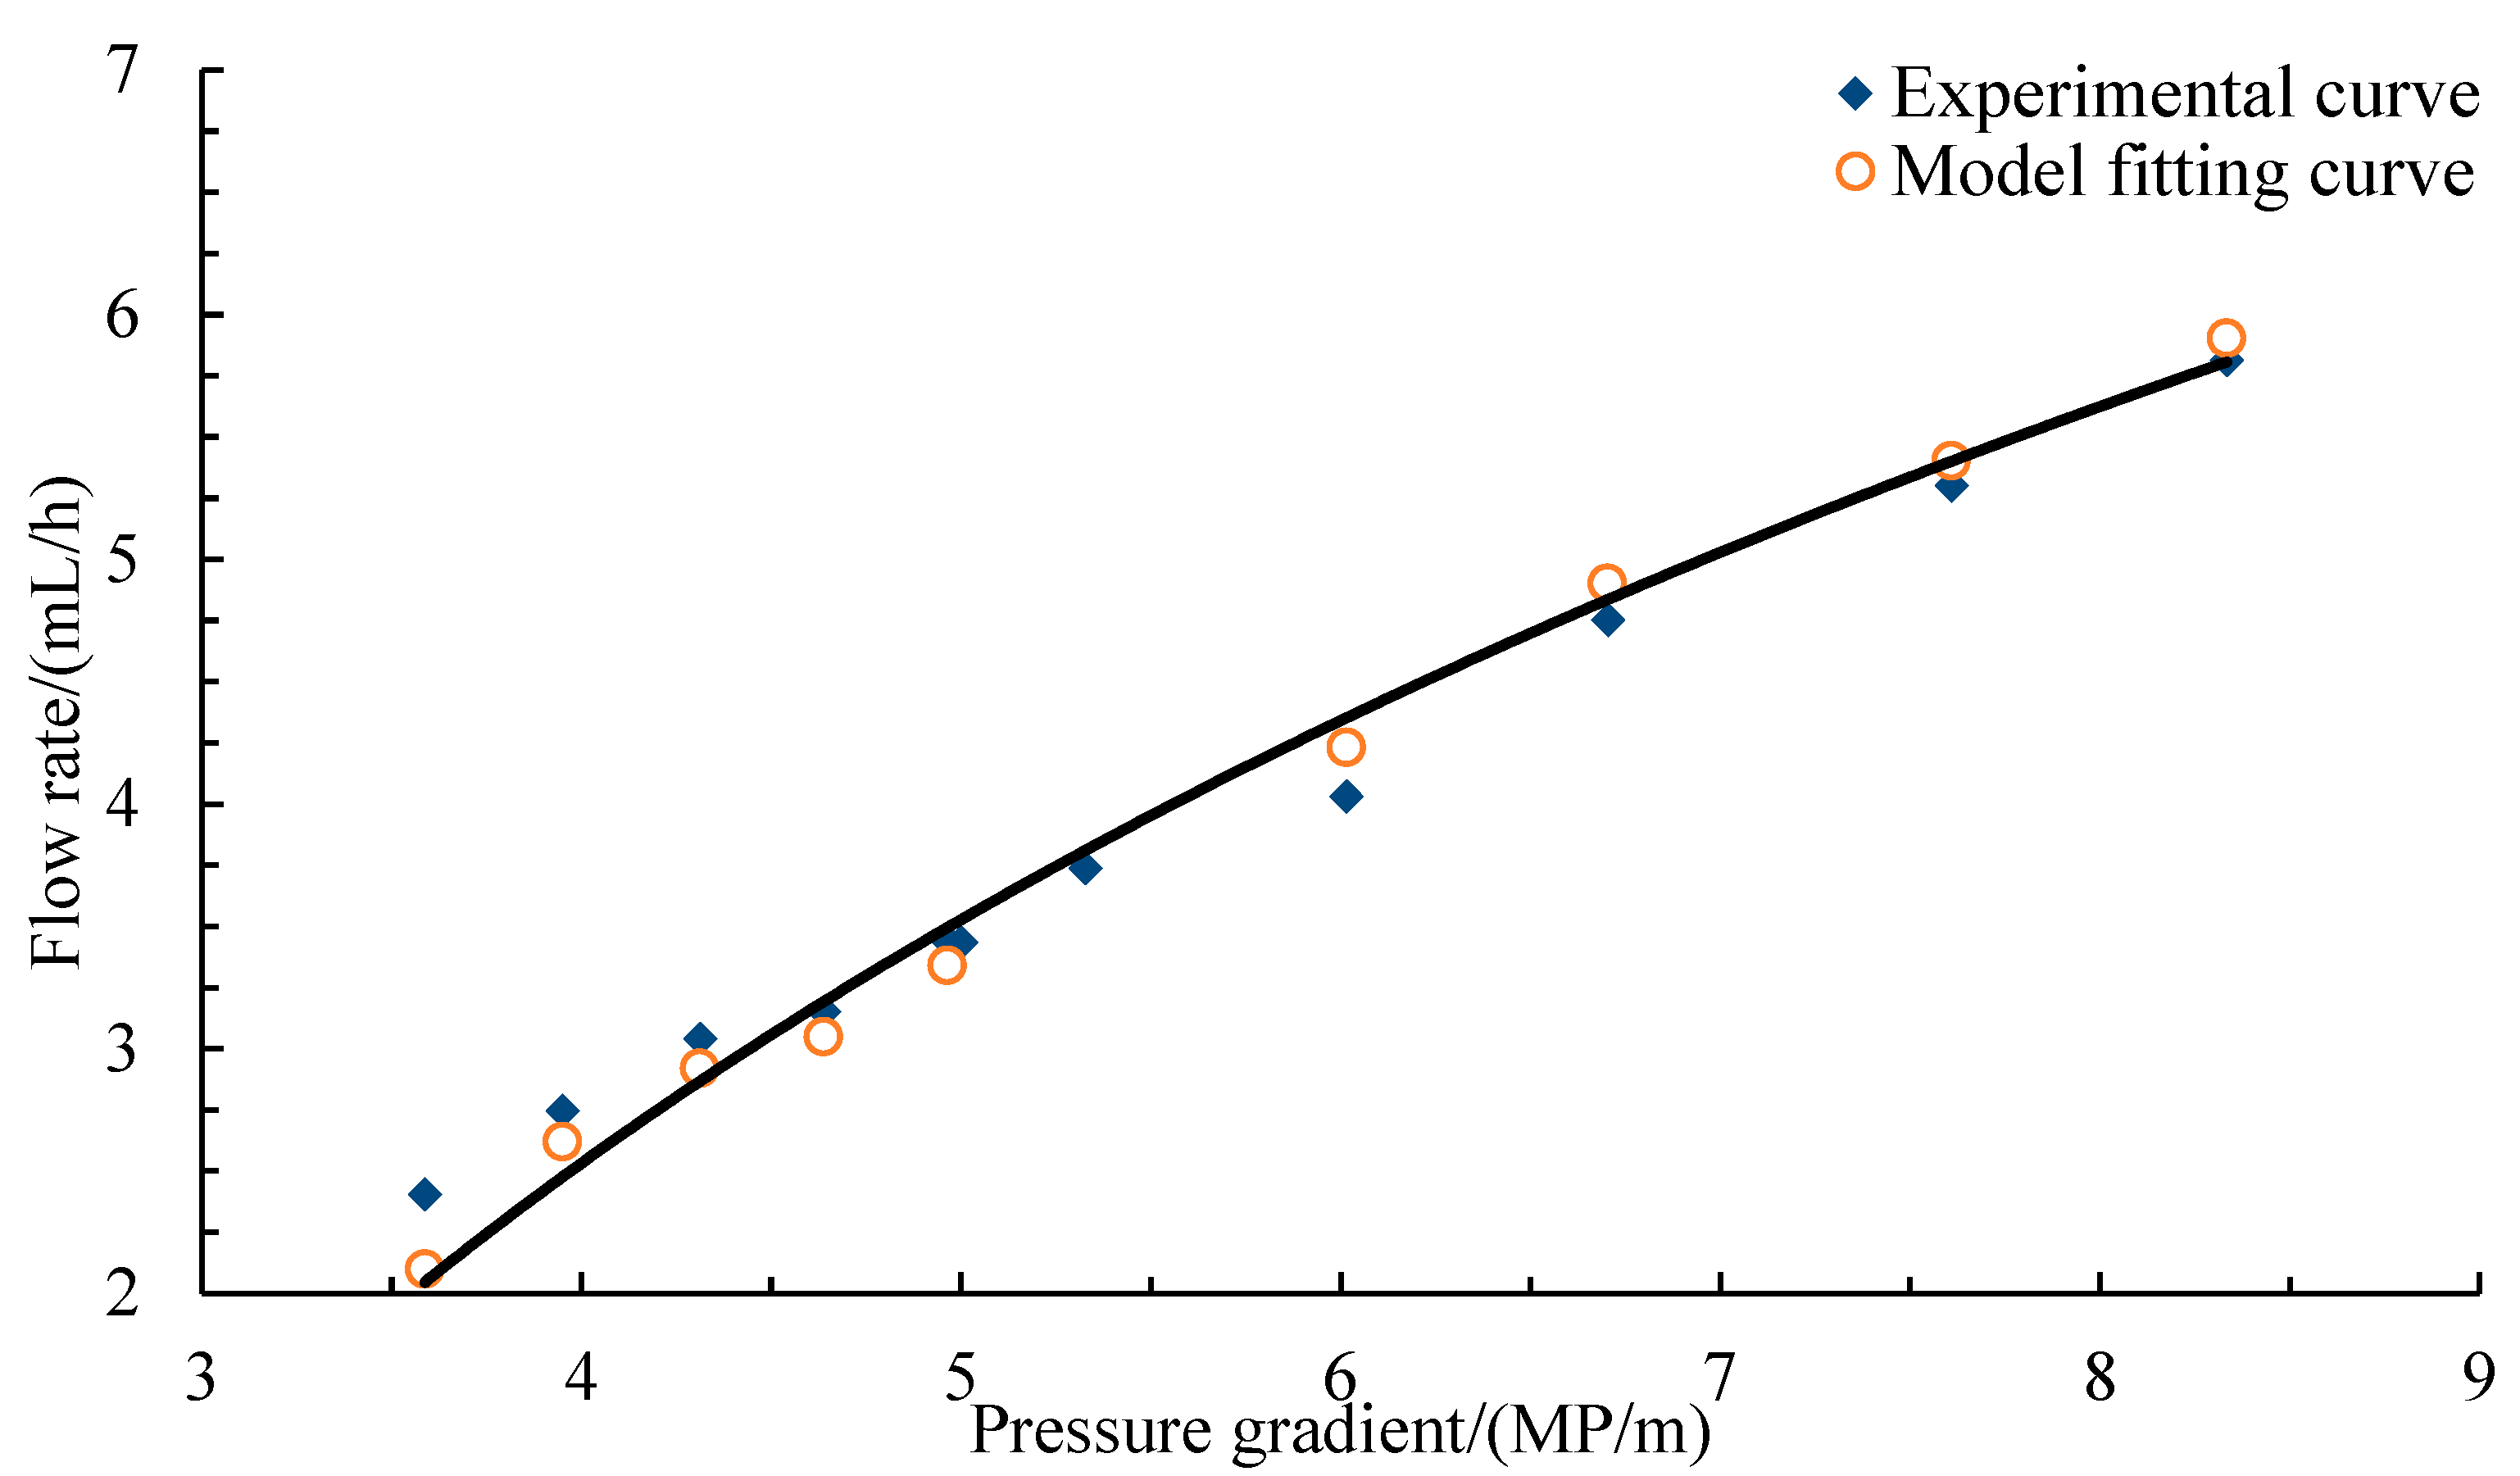
A high-precision displacement device was used to study the relationship between pressure difference and flow rate of shale oil reservoirs in Jilin Oilfield, and the flow characteristic curve was obtained. The flow results were fitted to Equation (21). The values of the relevant parameters are obtained after fitting. The fitted values are as follows.
ε = 0.1240 ,   a = 1.7800 ,   a 2 = 0.1202
The correlation coefficient of  R 2  is 0.9566. Figure 3 shows that the flow model established by considering stress sensitivity and boundary layer effect can better conform to the actual percolation situation with high reliability, which proves that the model can characterize well the fluid flow at micro and nano scales. The mathematical model can better reflect the flow law of shale oil reservoirs in Jilin Oilfield. In addition, it is also possible to analyze the related factors affecting the flow.

3. Nonlinear Flow Characteristics of Shale Oil Reservoir

Based on the new flow mathematical model of shale oil reservoirs established in Equation (21), the experimental parameters related to nonlinear flow of carbon dioxide flooding were selected to analyze the influence of stress sensitivity and boundary layer effect on flow characteristics. The relevant parameters of the test are as follows. The permeability measured with nitrogen is 0.93 mD. The porosity measured with helium is 13.55%. The experimental temperature is 82 °C. The outlet pressure is maintained at 21 MPa and the inlet pressure is 22 MPa. The viscosity of crude oil is 1.3 mPa s.

3.1. Influence of Boundary Layer Effect on Flow Characteristics

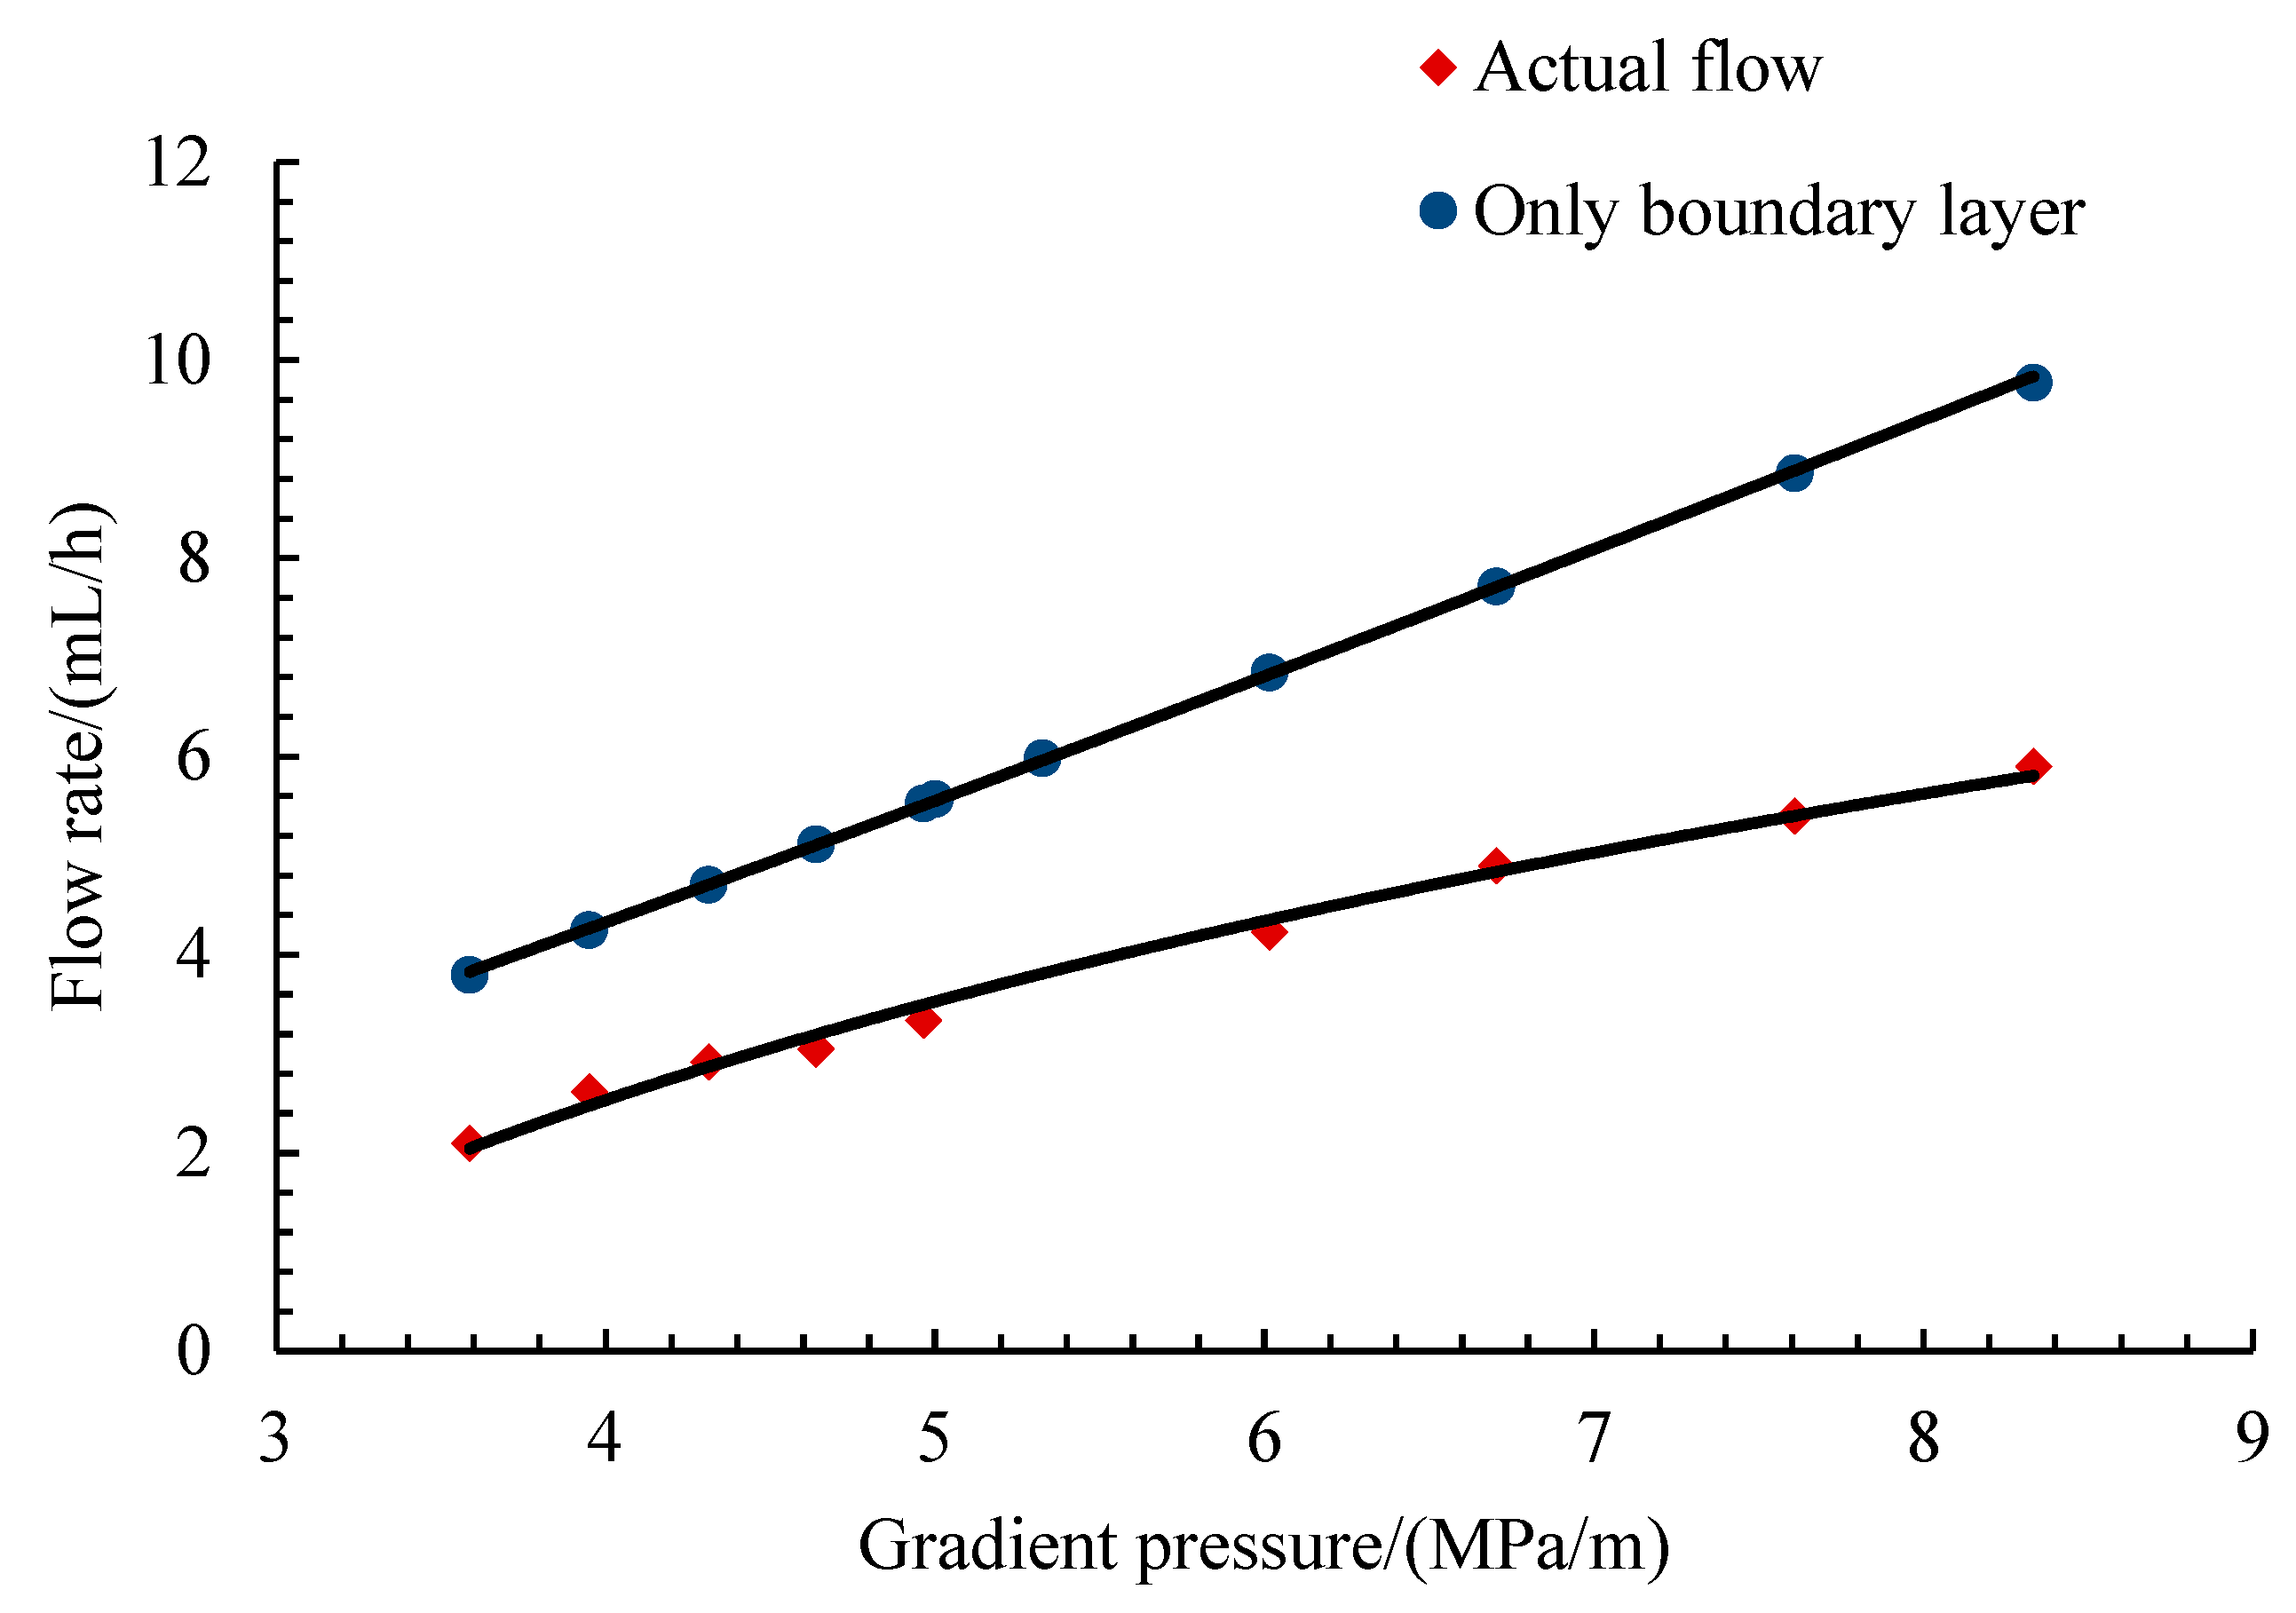
The influence of stress sensitivity effect is not considered, and the relevant boundary layer coefficient is selected from the calculation results in Section 2.3, where  a 2 = 0.1202 . According to Equation (16), the relationship curve between flow rate and pressure gradient difference was analyzed and compared with the actual flow characteristics. The results are shown in Figure 4. When only the boundary layer effect of the reservoir liquid–solid interface is considered, the influence of the boundary layer on the flow characteristics of the reservoir reflects the typical nonlinear flow characteristics, which are similar to the results of previous studies and are all spoon-shaped characteristics [29,30,31,32]. The reason for the existence of the spoon-shaped nonlinear flow characteristics is the generation of the boundary layer of the reservoir liquid–solid interface [33,34,35,36]. Under normal circumstances, the smaller the pore radius of the reservoir, the larger the boundary layer thickness and the more obvious the nonlinear flow characteristics caused by the boundary layer effect [37,38,39,40]. By comparing the actual flow curve with the flow curve considering only the boundary layer effect, it is found that the actual flow curve shows a nonlinear inverse spoon type characteristic. With the increase of the pressure gradient, the displacement pressure of the reservoir increases. The pores are compressed and become smaller; the thickness of the boundary layer also increases and the nonlinear flow characteristics are more obvious. In addition, as the pressure gradient increases, the flow rate considering only the boundary layer also increases; the influence of the boundary layer effect on the flow characteristics also increases.

3.2. Influence of Stress Sensitivity on Seepage Characteristics

The influence of the boundary layer effect is not considered, and the relevant fitting value is selected from the calculation results in Section 2.3, where a = 1.78. According to Equation (7), the flow curve considering only the stress sensitivity effect is obtained, as shown in Figure 5, and compared with the actual flow curve. It can be seen that the influence of stress sensitivity on flow characteristics weakens with the increase of the pressure gradient. In addition, the flow characteristic curve considering only the stress sensitivity shows an obvious reverse spoon type, which is consistent with the characteristic performance of the actual flow curve. This indicates that the reverse spoon type characteristic of the curve in the actual flow process is caused by the stress sensitive effect. Due to the boundary layer effect on the selected target block, the actual nonlinear flow shows less obvious reverse spoon characteristics than the curve considering only stress sensitivity.

3.3. Method for the Evaluation of Effective Displacement Distance for Nonlinear Flow

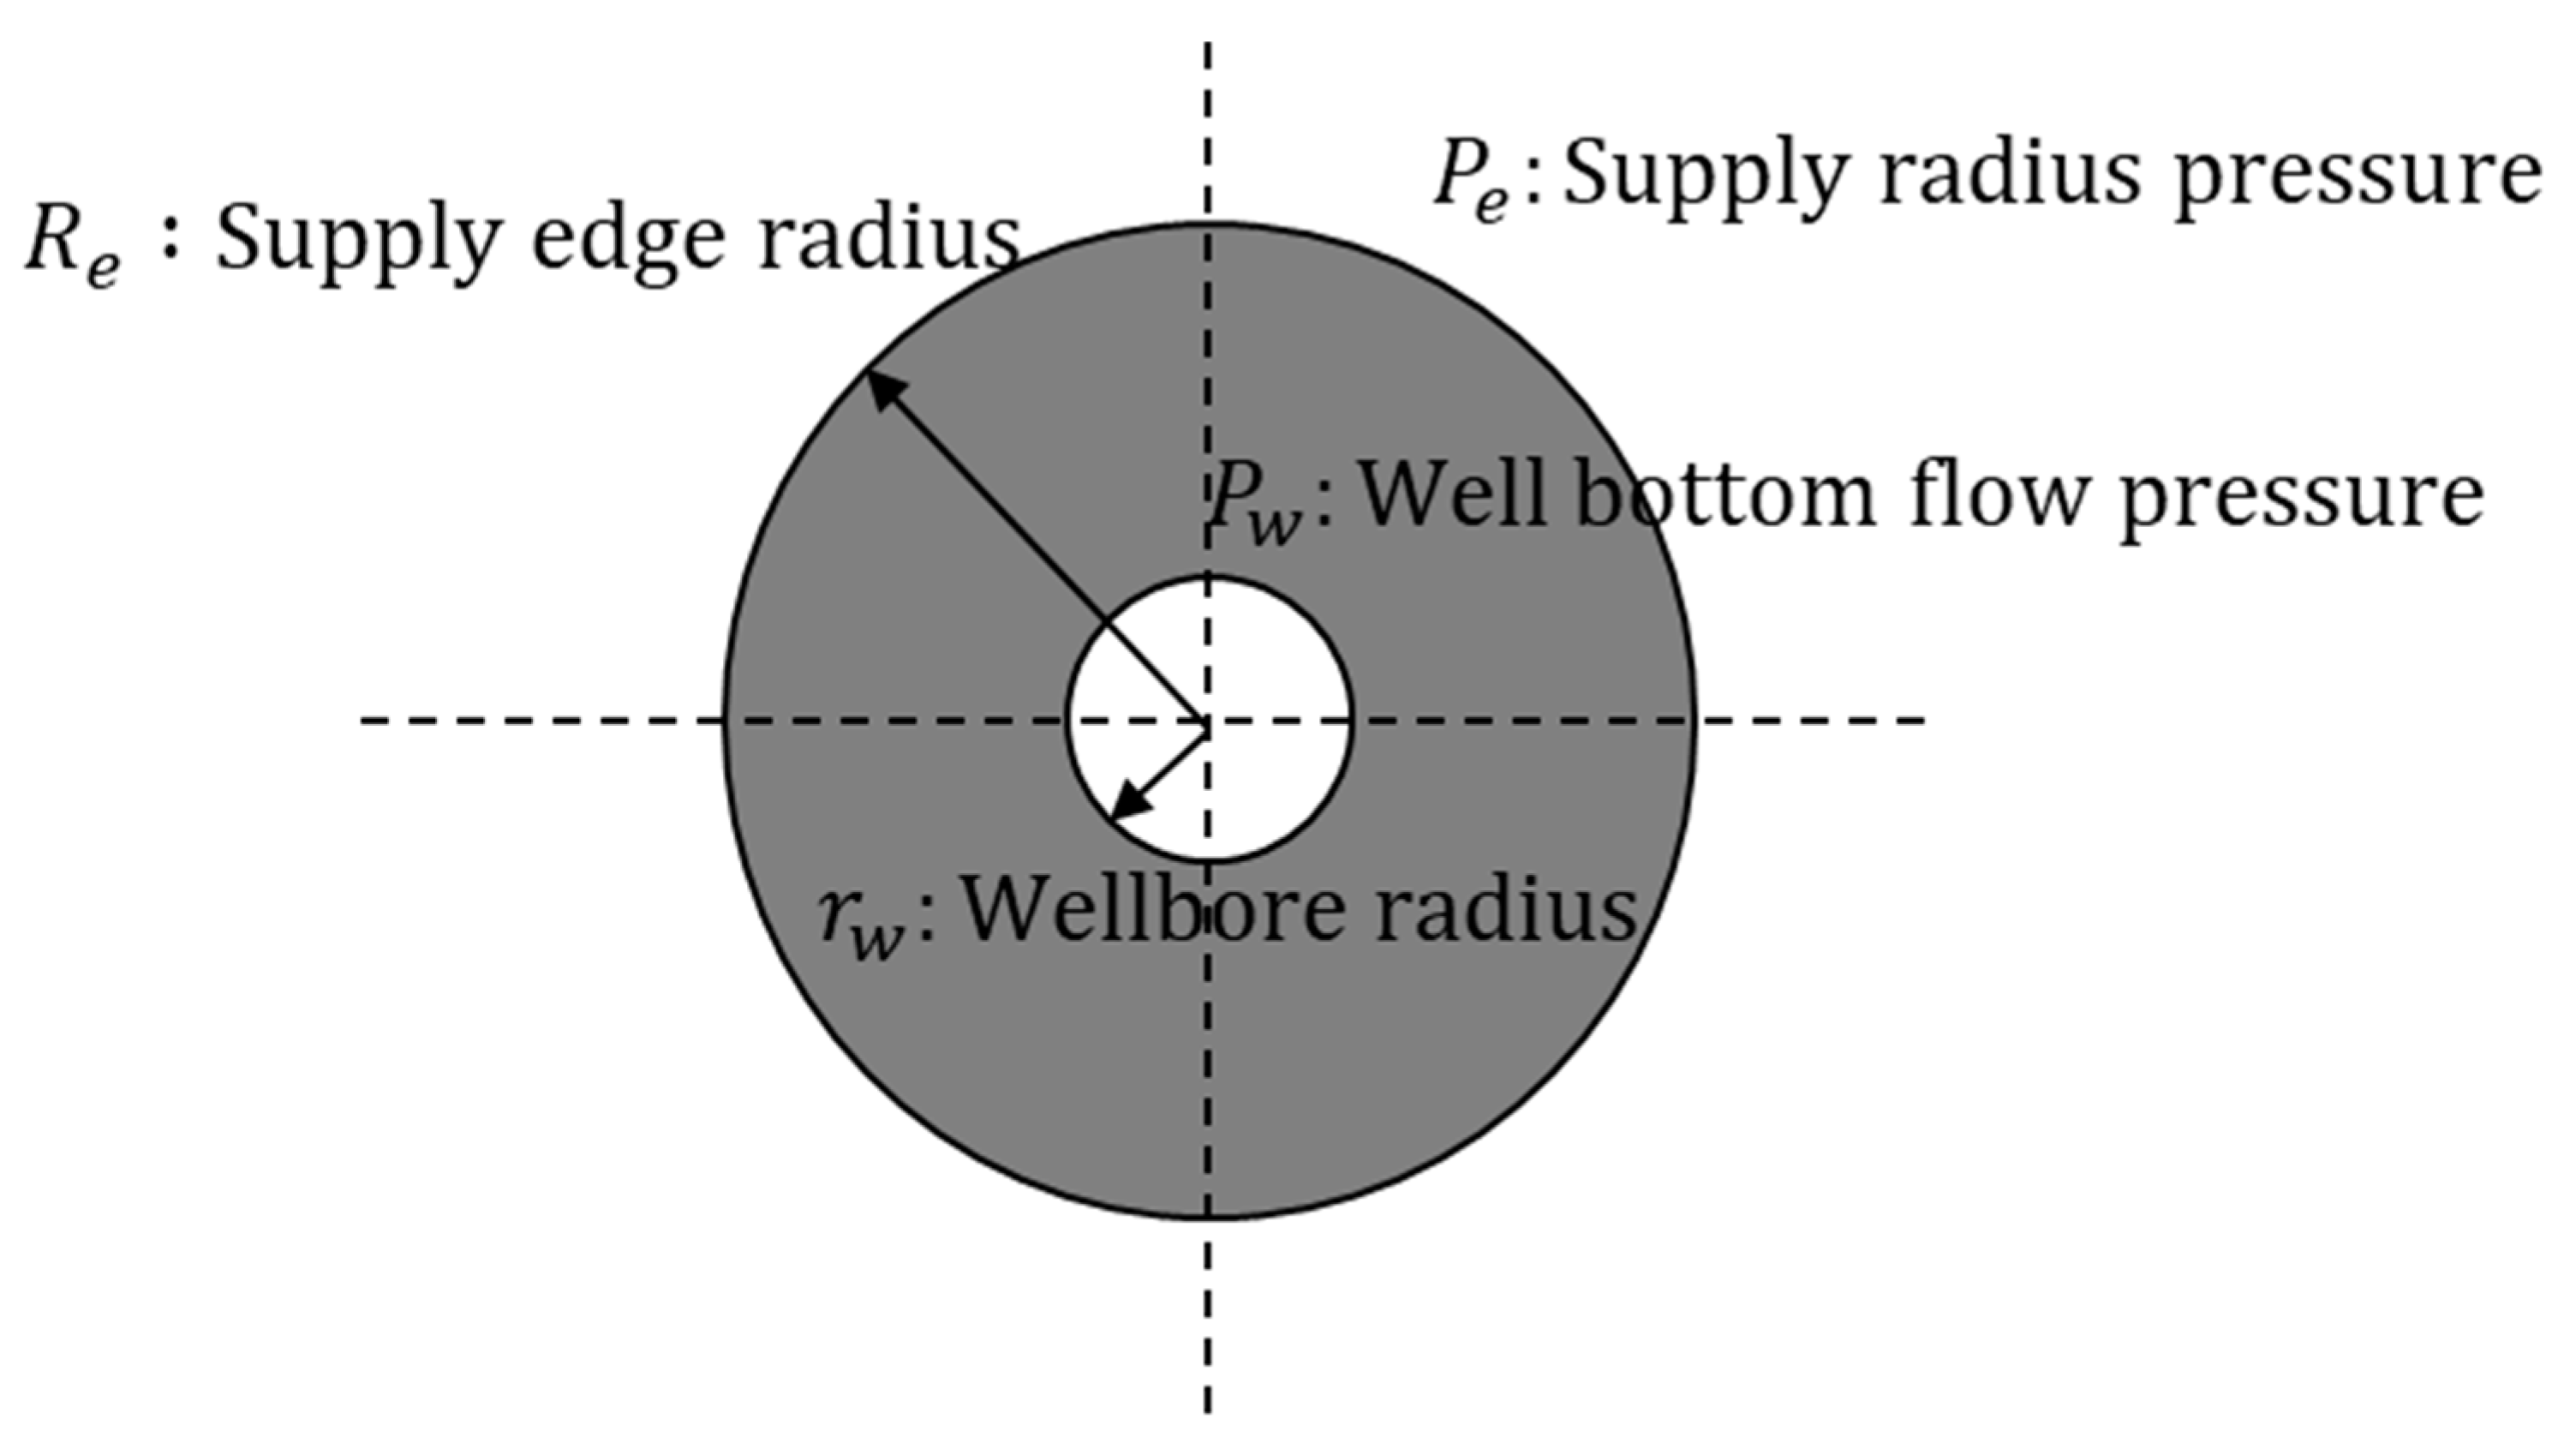
The effective utilization coefficient method and numerical simulation method can calculate the limited well spacing more accurately, but they require a lot of data. Therefore, this research used the limited well spacing method to calculate the limited spacing of fluid flow. The advantage of this method is that it is simple and fast to compute and requires few basic parameters. Figure 6 shows a plane radial flow formation model, and its specific theoretical basis is as follows.
The flow theory of steady radial flow at source and sink with equal production shows that the flow velocity on the main flow line is the largest among all streamlines [41,42,43]. On the same streamline, the flow velocity is minimal at equidistant points from the source and sink.
In steady flow,  Q = v A , which is a constant, and the flow velocity can be expressed as follows.
v = Q A = Q 2 π r h
The following is the formula for planar radial flow yield.
Q = 2 π K h p e p w λ R e r w μ ln R e r w
where  λ . represents the starting pressure gradient,  MPa / m ; h represents the stratigraphic thickness,  m P e  represents pressure at the supply radius,  MPa ; P w   . represents well bottom flow pressure, MPa;  R e . represents the supply edge radius,  m ; r w  represents the wellbore radius, m.
Substituting the yield formula into the flow velocity formula, the following can be obtained.
v = k p e p w λ R e r w μ ln R e r w 1 r
According to the flow velocity formula, the pressure gradient at any point in the formation can be expressed as follows.
d p   d r λ = p e p w λ ( R e r w ) ln R e r w 1 r
Therefore, the pressure gradient at the midpoint of equal production, source, and sink is as follows.
d p d r = λ + p H p w λ R r w ln R r w 2 R
where  P H  represents bottom flow pressure of injection well, MPa and R represents injection-production well spacing,  m .
If oil is to flow at the midpoint of the mainstream line, the driving pressure gradient at that point must be greater than the starting pressure gradient; then, the limited injection-production well spacing with different injection-production pressure differences can be calculated under a certain permeability condition.
R = r w + p H p w λ
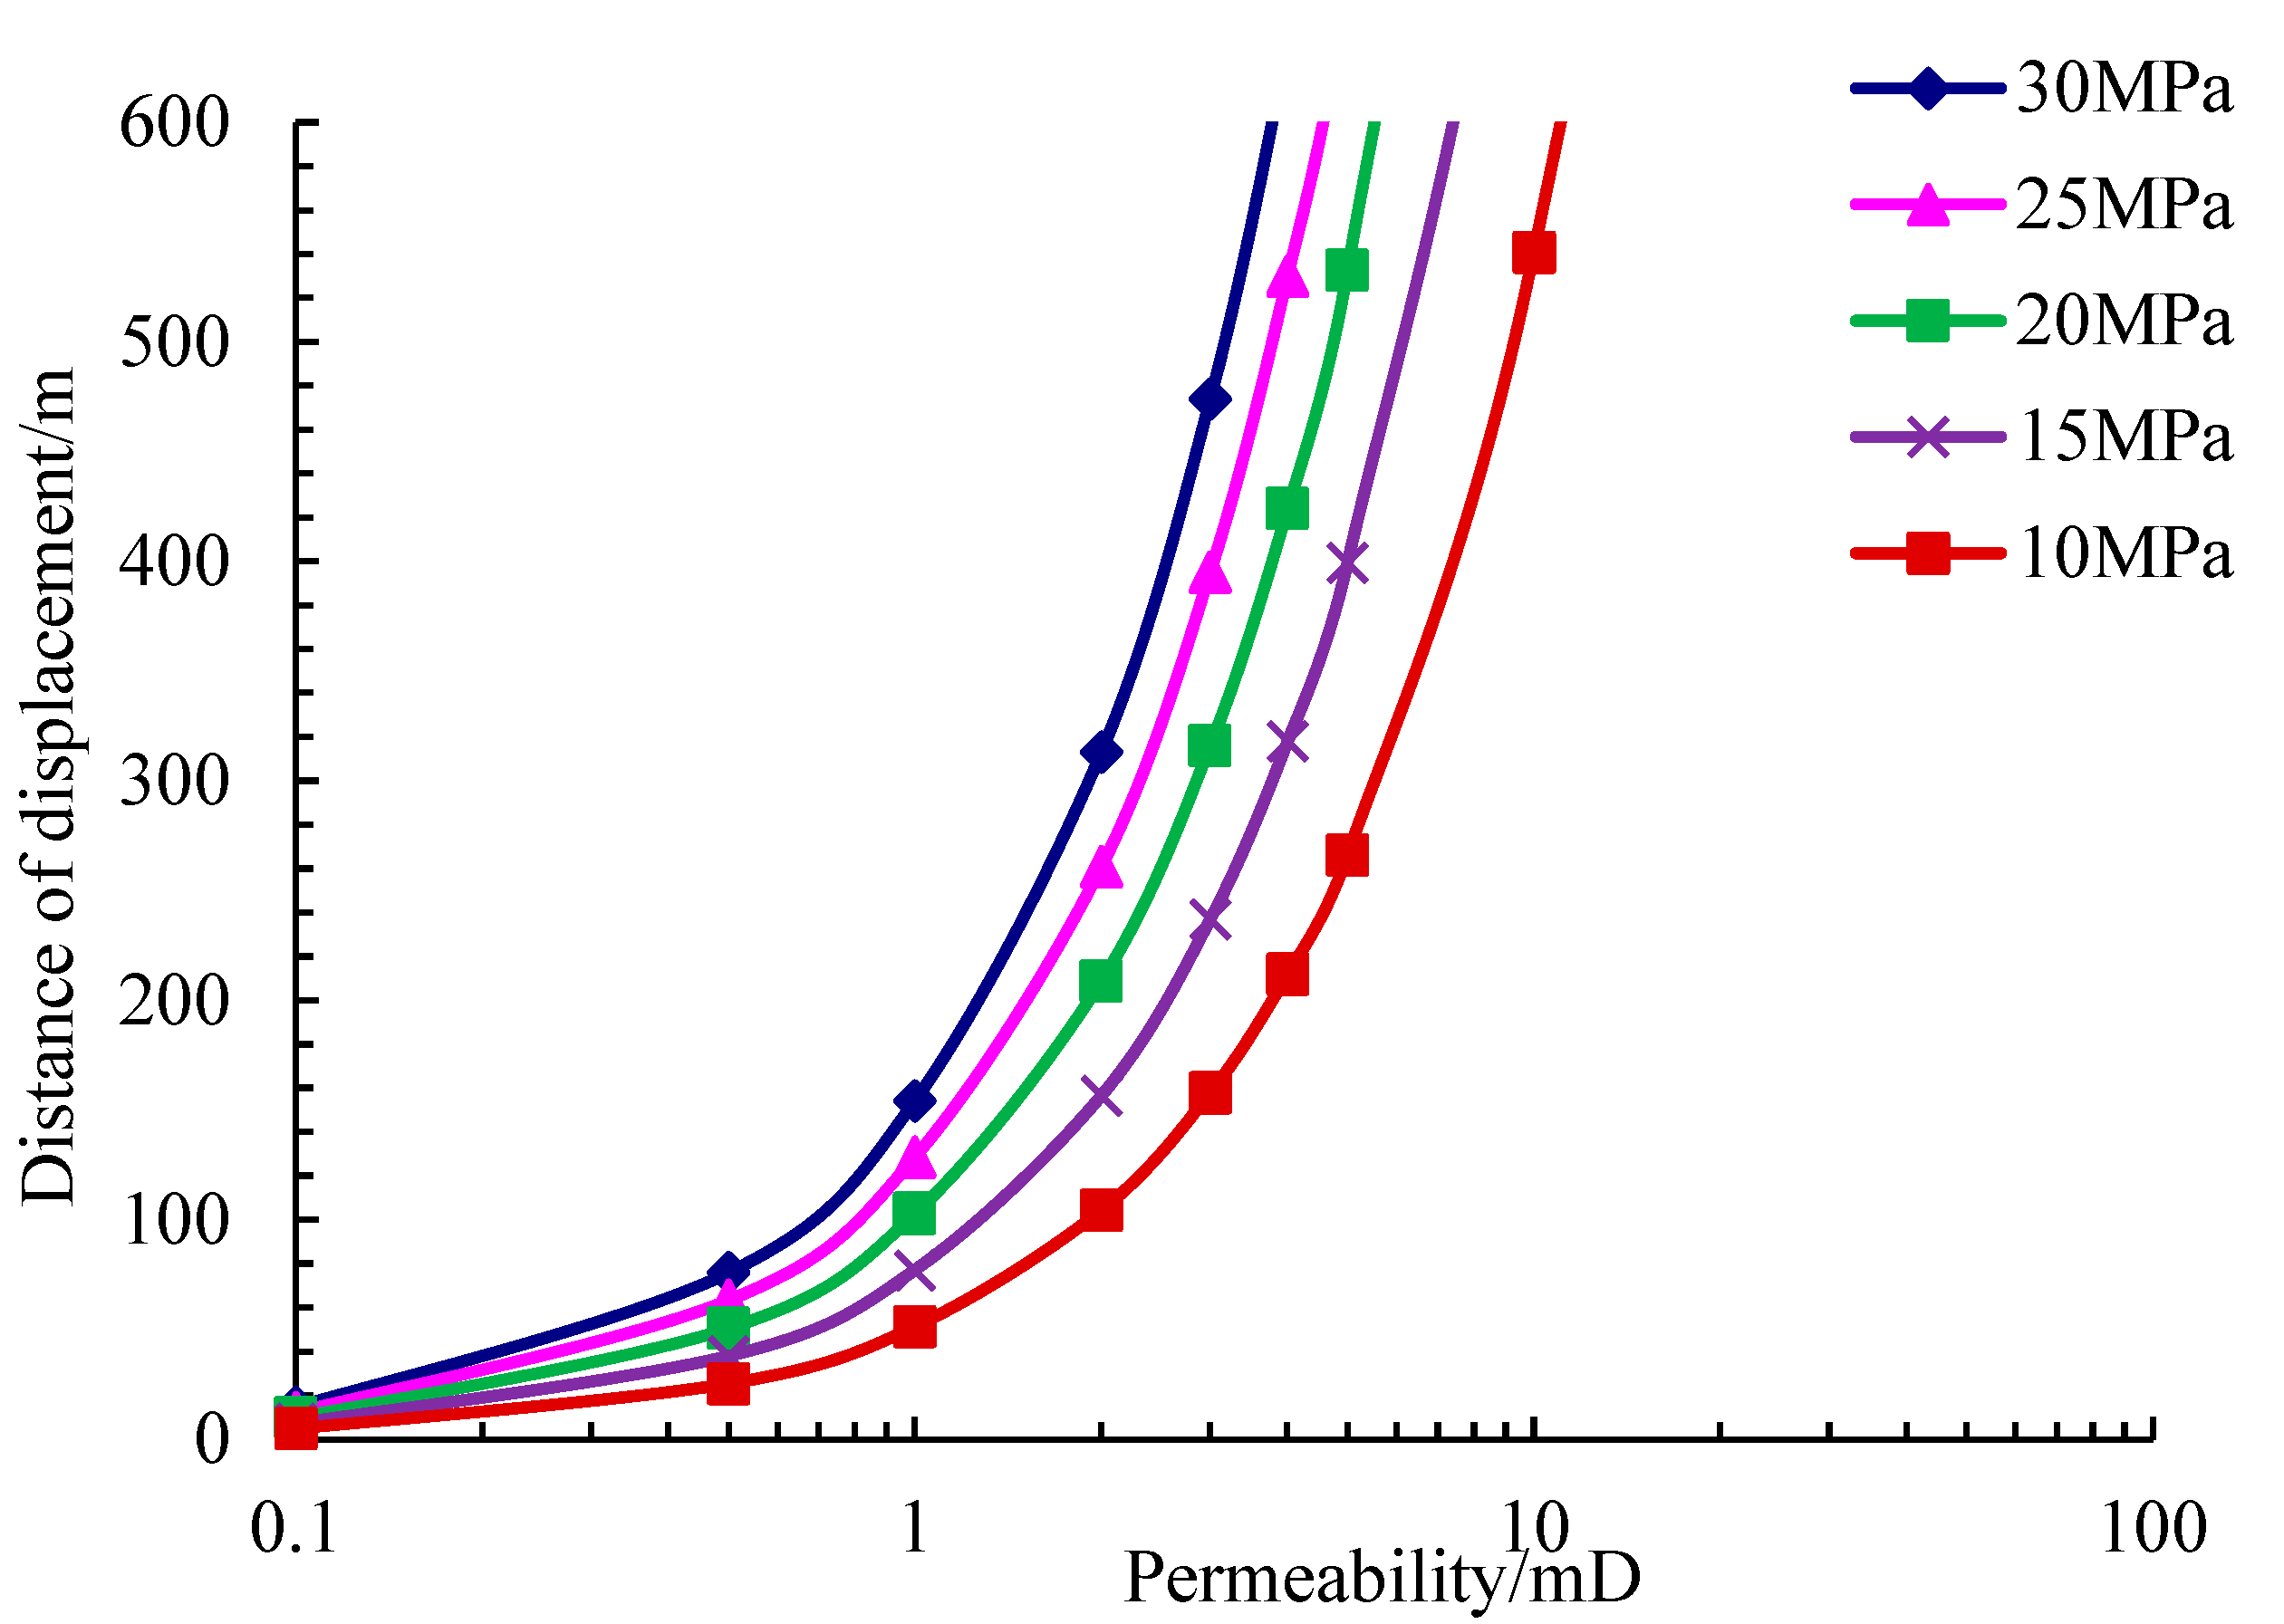
Ignoring the wellbore radius, the limited spacing of fluid flow was calculated by using the average real starting pressure gradient at different permeability intervals and in different states. The calculation results are shown in Figure 7. From Figure 7, the displacement distances of rock samples with different permeability under different displacement pressure differentia can be obtained. As it can be seen, when the injection and production pressure difference is 10 MPa, 15 MPa, 20 MPa, 25 MPa, and 30 MPa, the displacement distance of the reservoir with a permeability of 0.5 mD is 25.3 m, 38.0 m, 50.6 m, 63.3 m, and 76.0 m, respectively. The greater the injection and production pressure difference, the greater the displacement distance. There is a nonlinear flow relationship between permeability and displacement pressure difference. When the permeability increases, the displacement distance also increases, and the increasing rate of displacement distance also increases. When the reservoir permeability is less than 2 mD, the displacement distance increases at a relatively slow rate, and when the reservoir permeability is greater than 2 mD, the displacement distance increases at a faster rate.

4. Conclusions

  • In this study, a mathematical model of shale oil seepage is developed considering the stress sensitivity and boundary layer effect. Not only the influence of pressure gradient was considered, but also the influence of fluid viscosity, so that the mathematical model is more accurate. In addition, a method to evaluate the effective displacement distance of CO2 injection in shale reservoirs was established by using the limited injection-production well spacing method, solving the problem of displacement distance in the actual exploitation. The method is simpler to calculate than other evaluation approaches and provides a theoretical basis for the enhancement of oil recovery by CO2 injection and production.
  • The results show that the new flow mathematical model can be well fitted to the experimental data of Jilin shale reservoir. The reverse spooning-type characteristic of shale reservoirs is caused by stress sensitivity, and the nonlinear flow characteristic is caused by the boundary layer effect. The main factors that affect the flow characteristics of shale reservoirs in blocks include stress sensitivity and boundary layer effect. With the increase of pressure gradient, the influence of stress sensitivity on flow characteristics is weakened, and the influence of the boundary layer effect on flow characteristics is enhanced.
  • The evaluation method of effective displacement distance for CO2 injection in shale reservoirs developed in this research can show the nonlinear flow curve of displacement distance with reservoir permeability under different injection and production pressure differences, which indicates that, with the increase of reservoir permeability, displacement distance and the rate of displacement distance increase.

Author Contributions

Methodology, T.Z. and Y.Z.; Investigation, M.D.; Writing—original draft, L.Y.; Supervision, Z.Y. and H.L. All authors have read and agreed to the published version of the manuscript.

Funding

This research received no external funding.

Data Availability Statement

The data used to support the findings of this study are included within the article.

Conflicts of Interest

The authors declare no conflict of interest.

References

  1. Zhang, K. The Implications of US Energy Independence and Shale Gas Revolution. Sino-Global Energy 2012, 12, 1–16. [Google Scholar]
  2. Wang, Q.; Tao, S.; Guan, P. Progress in research, exploration and development of shale oil in continental basins in China. Nat. Gas Geosci. 2020, 31, 417–427. [Google Scholar]
  3. Zou, C.; Pan, S.; Jing, Z.; Gao, J.; Yang, Z.; Wu, S.; Zhao, Q. Shale oil and gas revolution and its impact. Acta Pet. Sin. 2020, 41, 1–12. [Google Scholar]
  4. He, W.; Meng, Q.; Feng, Z.; Zhang, J.; Wang, R. In-situ accumulation theory and exploration & development practice of Gulong shale oil in Songliao Basin. Acta Pet. Sin. 2020, 43, 1–14. [Google Scholar]
  5. Zou, C.; Zhu, R.; Bai, B.; Yang, Z.; Hou, L.H.; Zha, M. Significance, geologic characteristics, resource potential and future challenges of tight oil and shale oil. Bull. Mineral. Petrol. Geochem. 2015, 34, 3–17. [Google Scholar]
  6. Jin, X.; Li, G.; Meng, S.; Wang, X.; Liu, C.; Tao, J.; Tao, H. Microcomprehensive evaluation of the availability of continental shale oil. Pet. Explor. Dev. 2021, 48, 222–232. [Google Scholar] [CrossRef]
  7. Song, M.; Liu, H.; Wang, Y.; Liu, Y. Enrichment rules and exploration practices of Paleogene shale oil in Jiyang Depression, Bohai Bay Basin, China. Pet. Explor. Dev. 2020, 47, 225–235. [Google Scholar] [CrossRef]
  8. Pu, W.; Wang, C.; Li, Y. Nuclear Magnetic Resonance (NMR) Experimental Study of CO2 Flooding in Tight Reservoir. Sci. Technol. Eng. 2017, 17, 30–40. [Google Scholar]
  9. Dejam, M.; Hassanzadeh, H.; Chen, Z.X. Pre-Darcy flow in porous media. Water Resour. Res. 2017, 53, 8187–8210. [Google Scholar] [CrossRef]
  10. Zhang, R.; Ning, Z.; Yang, F.; Zhao, H.; Du, H.; Zhou, X. Shale stress sensitivity experiment and mechanism. Acta Pet. Sin. 2015, 36, 224–231. [Google Scholar]
  11. Xu, S.; Yue, X.; Hou, J.; Wang, B. Influence of boundary-layer fluid on the seepage characteristic of low-permeability reservoir. J. Xi’an Pet. Univ. 2007, 22, 26–28. [Google Scholar]
  12. Song, F.; Bo, L.; Zhang, S.; Sun, Y. Non-linear flow in low permeability reservoirs: Modelling and experimental verification. Adv. Geo-Energy Res. 2019, 3, 76–81. [Google Scholar] [CrossRef]
  13. Lei, H.; He, J.; Hu, Z. Shale considering stress sensitivity and boundary layer effect study on percolation model of oil reservoir. Sci. Technol. Eng. 2019, 19, 90–95. [Google Scholar]
  14. Li, Y.; Duan, B.; Shang, L.; Sun, Y.; Gong, L.; Xin, C.; Xing, J. Nonlinear seepage numerical simulation method for ultra-low permeability and tight reservoirs and its application in Jidong oilfield. Pet. Geol. Dev. Daqing 2022, 41, 153–158. [Google Scholar]
  15. Adamczuk, A.; Kolodynska, D. Utilization of Fly Ashes from the Coal Burning Processes to Produce Effective Low-Cost Sorbents. Energy Fuels 2017, 31, 2095–2105. [Google Scholar] [CrossRef]
  16. Wang, X.; Zhang, Q.; Gu, X. Fractal-based Effective Utilization Coefficient of Irrigation Water Space Scale Variability. Acta Geogr. Sin. 2012, 67, 1201–1212. [Google Scholar]
  17. Klinkenberg, L.J. The permeability of porous media to liquids and gases. Socar Proc. 2012, 2, 57–73. [Google Scholar] [CrossRef]
  18. Ma, J.; Couples, G.D.; Zhao, X. Assessing impact of shale gas adsorption on free-gas permeability via a pore network flow model. In Proceedings of the SPE/AAPG/SEG Unconventional Resources Technology Conference, Virtual, 16–18 November 2015. [Google Scholar]
  19. Wu, K.; Li, X.; Chen, Z. A model for gas transport through nanopores of shale gas reservoirs. Acta Pet. Sin. 2015, 36, 837–848. [Google Scholar]
  20. Zhang, Y.; Zhang, M.; Bin, J.; Guo, P.; Tang, T.; Mei, H.; Shen, J.; Liao, R. Real gas migrating model for shale organic nanopores with modified flow area. Pet. Geol. Oilfield Dev. Daqing 2020, 39, 151–158. [Google Scholar]
  21. Chen, L.; Jiang, Z.; Wen, N.; Gao, F.; Wang, P.; Ji, W.; Jiang, J. Fractal characteristics of nanopores and their effect on methane adsorption capacity in shales. Sci. Technol. Eng. 2017, 17, 31–39. [Google Scholar]
  22. Xiong, Y.; Zhang, L.; Zhao, Y.; Liu, Q. Pressure transient analysis of hydraulic fratured vertical well in stress-sensitive shale gas reservoirs. Sci.Technol. Eng. 2014, 14, 221–225. [Google Scholar]
  23. Cai, H.; Fu, S.; Cheng, S. Production decline mode for fractured shale gas reservoirs with stress sensitivity. Sci. Technol. Rev. 2013, 31, 51–54. [Google Scholar]
  24. Jiang, R.; Yang, R.; Ma, Y.; Zhuang, Y.; Li, L. Nonlinear percolation theory and numerical simulation method for low permeability reservoir. Res. Dev. Hydrodyn. 2011, 26, 444–452. [Google Scholar]
  25. Jiang, R.; Yang, R. Nonlinear flow theory and numerical simulation technology in low permeability reservoirs. Hydrodyn. Res. Prog. Ser. A 2011, 4, 444–452. [Google Scholar]
  26. Jiang, R.; Li, L.; Xu, J. A nonlinear model for low-permeability reservoirs and well-testing analysis. Acta Pet. Sin. 2012, 33, 264–268. [Google Scholar]
  27. Long, T. Development of a Numerical Simulation System for Non-Darcy Flow in Low Permeability Reservoirs; Tsinghua University Department of Hydraulic and Hydropower Engineering: Beijing, China, 2005. [Google Scholar]
  28. Yan, Q.; He, Q.; Wei, L. A laboratory study on percolation characteristics of single phase flow in low-permeability reservoirs. J. Xi’an Pet. Inst. 1990, 5, 1–6. [Google Scholar]
  29. Huang, S.; Yao, Y.; Zhang, S. A fractal model for oil Transport in tight porous media. Transp. Porous Med. 2018, 121, 725–739. [Google Scholar] [CrossRef]
  30. Wu, B.; Chen, X.; Tian, K.; Qiao, X.; Wang, Y.; Xin, C. Fractal permeability model of dense porous media considering microscopic effects. Daqing Pet. Geol. Dev. 2022, 44, 56–62. [Google Scholar]
  31. Zhang, X. Pore scale production rule of heavy oil chemical flooding based on 2D NMR spectrum. Chinese Sci. Technol. Papers 2020, 15, 131–136. [Google Scholar]
  32. Ning, C.; Zhou, M.; Cheng, J. Application of 2D NMR logging in fluid identification of glutenite reservoir. Lithol. Reserv. 2021, 33, 267–274. [Google Scholar]
  33. Liu, J.; Yang, S.; Zhang, C. Constitutive equation for fluid flowing through tight reservoirs. Oil Drill. Prod. Technol. 2017, 39, 112–118. [Google Scholar]
  34. Wang, X.; Sheng, J.J. Effect of low-velocity non-Darcy flow on well production performance in shale and tight oil reservoirs. Fuel 2017, 190, 41–46. [Google Scholar] [CrossRef] [Green Version]
  35. Bai, L.; Liu, B.; Chi, Y. Application of two-dimensional nuclear magnetic resonance technique to characterize fluid in shale: A case study of organic-rich shale in Qingshankou Formation, Songliao Basin. Oil Gas Geol. 2021, 42, 1389–1400. [Google Scholar]
  36. Jiang, Q.; Li, X. Application of Nuclear Magnetic Resonance in Petroleum Logging. Petrochem. Technol. 2022, 29, 161–163. [Google Scholar]
  37. Sheng, J.J.; Chen, K. Evaluation of the EOR potential of gas and water injection in shale oil reservoirs. J. Unconven. Oil Gas Resour. 2014, 5, 1–9. [Google Scholar] [CrossRef]
  38. Zhang, A.; Wang, J.; Wang, Y. Reservoir Space Type and Oil Occurrence State of Gulong Shale in Songliao Basin. Daqing Pet. Geol. Dev. 2021, 40, 68–77. [Google Scholar]
  39. Luo, K. Study on the occurrence characteristics of intersalt shale oil in Qianjiang sag. J. Jianghan Pet. Staff Univ. 2020, 33, 38–40. [Google Scholar]
  40. Wang, M.; Ma, R.; Li, J. Occurrence mechanism of lacustrine shale oil of Paleogene Shahejie Formation in Jiyang Depression. Petr. Explor. Dev. 2019, 46, 789–802. [Google Scholar]
  41. Kang, C.; Yoshikawa, H.N.; Ntarmouchant, Z.; Prigent, A.; Mutabazi, I. Solitary-like and modulated wavepackets in the Couette-Taylor flow with a radial temperature gradient. Philos. Trans. A Math. Phys. Eng. Sci. 2023, 381, 20220117. [Google Scholar] [CrossRef]
  42. Grnman, A.; Uusitalo, A. Analysis of radial-outflow turbine design for supercritical CO2 and comparison to radial-inflow turbines. Energy Convers. Manag. 2022, 252, 115089. [Google Scholar] [CrossRef]
  43. Lacis, U.; Pellegrino, M.; Sundin, J.; Amberg, G.; Zaleski, S.; Hess, B.; Bagheri, S. Nanoscale sheared droplet: Volume-of-fluid, phase-field and no-slip molecular dynamics. J. Fluid Mech. 2022, 940, A10. [Google Scholar] [CrossRef]
Figure 1. Schematic diagram of the occurrence of seepage fluid in the pore.
Energies 16 05452 g001
Figure 2. High-temperature and high-pressure long core displacement device.
Energies 16 05452 g002
Figure 3. Fitting curve between flow model and experimental data.
Energies 16 05452 g003
Figure 4. Curve of boundary layer effect on flow.
Energies 16 05452 g004
Figure 5. Curve of stress sensitivity effect on flow.
Energies 16 05452 g005
Figure 6. Planar radial flow formation model.
Energies 16 05452 g006
Figure 7. Relationship between displacement distance and permeability.
Energies 16 05452 g007
Disclaimer/Publisher’s Note: The statements, opinions and data contained in all publications are solely those of the individual author(s) and contributor(s) and not of MDPI and/or the editor(s). MDPI and/or the editor(s) disclaim responsibility for any injury to people or property resulting from any ideas, methods, instructions or products referred to in the content.