Abstract
Transcritical carbon dioxide waste heat recovery systems and the construction of scroll expanders have recently been hot topics. The flank clearance, located between the orbiting and fixed scroll, has a vital impact on the scroll expander performance. This paper estimates the effect of the flank clearance on the expander’s thermodynamic performance (first-law efficiency) based on computational fluid dynamics (CFD) simulations. The manufacturing cost of different flank clearances is also considered to enhance the feasibility of the machinery design. The computational cost for different flank clearance cases is significantly reduced with a surrogate-assisted multi-objective optimisation algorithm (SAMOA), which also supports modelling the trade-off relationship between manufacturing cost and machinery efficiency. The results indicated that an increasing flank clearance negatively affects the first-law thermal efficiency. The efficiency decreased from 87.41% to 44.83% moving from 20 to 200 μm flank clearances. The SAMOA successfully reduced the computational cost of the dynamic mesh CFD model from 90 h to 15 s with 0.6% discrepancy. The final Pareto solutions presented a clear trade-off relationship between the first-law efficiency and manufacturing cost and promised a diversity of optimum solutions. The “knee points” for the relationship were 25, 55, and 127 μm, which provided flexible clearance choices based on the importance of either machinery efficiency or manufacturing cost.
1. Introduction
The design of scroll expanders has gained attention in recent years, especially in small to micro-scale waste heat recovery systems [1,2]. Carbon dioxide () is a promising working fluid to match the requirements of small to micro-scale power systems because of its unique thermo-physical properties [3,4]. The main advantage of above the critical point is to reduce the size of the power system components and keep a reasonable efficiency, possibly leading to lower construction costs. However, a significant problem with this kind of application is the irreversibilities occurring in the expansion process. This issue would be more significant under transcritical (T-CO2) conditions. Therefore, there is an urgent need to optimise the expander design.
Previous research has confirmed the feasibility of scroll machinery applied to T-CO2 [5]. However, a small body of literature focuses on specific designs for T-CO2 scroll expanders. Thus, the optimisation strategies of the organic Rankine cycle (ORC) scroll machinery are also to be included because of the similar working fundamentals. Most of the current literature on optimisation strategies pays particular attention to the scroll geometry design, such as flank/radial clearance, inlet port positions, and variable wall thickness. Chen et al. [6] determined the linear function of the pressure ratio to predict the flank and radial gaps, which are the two significant leakages for scroll machinery. Iglesias and Favrat [7] developed a numerical model for the co-rotating scroll compressor–expander. They also claimed that reducing the internal gaps between the fixed and rotating scrolls would benefit the performance.
It is hard to obtain the flow characteristics with sample tests or mathematical models. Therefore, computational fluid dynamics (CFD) has become one of the most popular methods to bridge the gap. Song et al. [8] conducted a novel symmetric discharge configuration for the ORC scroll expander. The symmetric discharge structure efficiently reduced the level of non-uniform pressure distributions. Fatigati et al. [9] demonstrated a similar dual-intake-port (DIP) design to maintain a high inlet pressure and mass flow rate. This unique design presented a nearly 25% power and 37% mass flow rate increment. To better understand the mechanisms of scroll profiles and reduce the imbalance pressure inside expansion chambers, Emhardt et al. [10,11] compared the performance between variable and constant wall thicknesses for the scroll expander. The studies set two flank clearances (200/75 µm) as the comparison groups. The results indicated that the variable thickness design still suffered from a pressure imbalance, but the smaller flank clearance positively impacted the isentropic efficiency. In an analysis of T-CO2 scroll machinery, Rak and Pietrowicz [12] built a two-dimensional scroll model considering the heat transfer phenomenon. The study found that the flank leakage also had a negative impact on the discharge temperature and thermal efficiency. In another major project, Zheng et al. [13,14,15] performed comprehensive work concentrating on the sealing issues of the T-CO2 scroll compressor. There were two significant contributions from this project: (1) a three-dimensional and unsteady model was firstly generated for high-pressure working conditions and successfully validated using numerical methods and experimental data; (2) it optimised the flank and radial leakage by micro-grooves. The data also found an asymmetric pressure distribution for the T-CO2 working conditions, and it was even more severe inside the high-pressure chambers.
Considering the existing literature, it seems that it is still a challenge to determine the essential parameters for T-CO2 scroll expanders, especially related to leakage. The design of the scroll machinery for this high-pressure ratio working condition is still at the very start point. Although the existing literature suggests that reducing the flank clearance would strengthen the performance, there is no quantitative or qualitative transient CFD analysis concentrated on the effect of the gap size. In addition, a smaller size requires higher manufacturing accuracy and net cost [16], and the cost is not usually considered in simulations. There is a trade-off relationship between performance and manufacturing cost, but it is hard to define an invariant weight function between the two factors. Therefore, a multi-objective optimisation algorithm could be a suitable choice to solve the above difficulties, which can produce a Pareto optimal solution set instead of setting objective weights in advance.
For the last thirty years there has been a widespread acknowledgement of the effectiveness of evolutionary algorithms (EAs) in solving multi-objective optimisation problems. Consequently, significant effort has been invested in the development of multi-objective optimisation (EMO) algorithms, e.g., elitist non-dominated sorting genetic algorithm (NSGA-II), multi-objective EA based on decomposition (MOEA/D), and indicator-based EA (IBEA) [17]. A growing body of literature has used these approaches in the energy conversion fields. Bekiloğlu et al. [18] identified the optimum design parameters for an ORC radial inflow turbine using NSGA-II. The primary objective was to ascertain the temperature ranges of heat sources from an economic standpoint. The study employed 28 different working fluids and the results claimed groups of ideal working fluids specifically for three specific heat source temperatures. Li et al. [19] set the exergy efficiency and total cost per unit net power output as the multi-objectives. The main optimisation target was the ORC turbine. This study compared the Pareto optimum solutions with constant and variable turbine efficiency. It also presented a sensitivity analysis of the heat source temperatures. The results confirmed that R245ca was the optimal working fluid for the specific turbine design. Xia et al. [20] utilised the genetic algorithm (GA) to design a supercritical carbon dioxide cycle (S-CO2) large-scale centrifugal compressor using CFD simulation data. The isentropic efficiency improved by 5% based on the optimisation of five essential parameters. The evidence presented in the above literature suggests that multi-objective optimisation could be well associated with either a thermodynamic or a CFD model, where the results also keep an acceptable accuracy. However, very few papers integrate dynamic mesh CFD models with EAs. It is well-known from previous studies that NSGA-II usually performs very well when solving bi-objective optimisation problems. Therefore, this paper selected NSGA-II to optimise the performance and clearance manufacturing cost of the T-CO2 scroll expander. The performance data from CFD is computationally costly. Hence, a data-driven surrogate model was chosen to speed up the optimisation process of NSGA-II.
Surrogate models have been proved to be an effective way to solve expensive engineering optimisation problems, especially for CFD [21]. Commonly used surrogate models include the Gaussian process regression (GPR) model, artificial neural networks (ANNs) model, support vector regression (SVR) model, and probability of detection (POD) model, etc. [22]. The choice of the GPR model in this research was motivated by the following factors. Firstly, given the limited number of training samples, the GPR model can maintain good generalization ability by using the posterior variance prediction function to quantify uncertainty. Secondly, the GPR model offers the flexibility of incorporating expert knowledge through the selection of a suitable kernel. Thirdly, the GPR model can provide confidence intervals for the predicted results, which helps researchers quantify the uncertainty in the trade-off between performance and manufacturing costs. These features have made the GPR model particularly attractive in the energy field. For example, Duan et al. [23] used the GPR model as the primary approach to evaluate the agreement between experimental and CFD outputs. The author also emphasised its fitness to the experimental data. The study demonstrated the evaluations by comparing four different turbulence models. The results indicated that data models should precisely reproduce the level of physics-related CFD model precision. Ringstad et al. [24] carried out a novel CFD-machine learning approach for a two-phase ejector configuration. By employing this methodology, it was possible to provide a comprehensive mapping of performance for any combination of parameters and scenarios. The results indicated high accuracy between the CFD model and the trained GPR model. The GPR model also contributed to the final design of the ejector, with a 43% efficiency under certain working conditions.
Previous research has confirmed the possibility of combining CFD models and synthetic data models. The majority of these novel attempts focused on energy fields and turbine applications. There is a shortage of research that analyses and optimises volumetric expanders in relation to various leakage sizes and economic perspectives. In addition, CFD models with a dynamic mesh have not been confirmed with synthetic data models. The dynamic mesh is commonly used in volumetric machinery modelling because the leakage model needs to match the actual working conditions. Therefore, the current study selects the scroll expander as a specific case to identify the above research gaps. It is expected that the novel methodology will be applied to other volumetric machinery applications and the three primary objectives of this research are shown below:
- Evaluate the thermodynamic performance (first law) of different flank clearances on a T-CO2 scroll expander.
- Build a GPR model to surrogate the relationship between the size of the flank clearance and the scroll expander efficiency and apply the NSGA-II to optimise the clearance manufacturing cost and the scroll expander efficiency that is predicted by GPR.
- Build a piecewise polynomial regression model to represent the trade-off relationship between the scroll expander efficiency and clearance manufacturing cost.
2. Methodology
Figure 1 simplifies the four main processes of the methodology in this paper. They are geometry design, CFD validations, data science, and machine learning. Detailed descriptions of the geometry design, numerical methods, and CFD validations can be found in Du et al. [25]. The following subsections briefly introduce the data science and machinery learning process, while the geometry and CFD settings are briefly introduced.
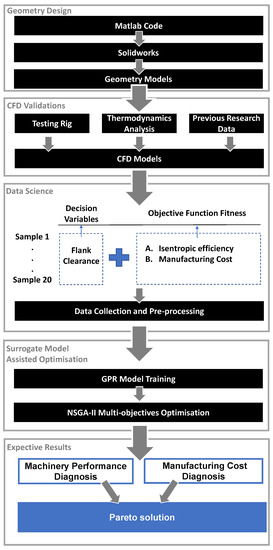
Figure 1.
Main process of the methodology for the project.
2.1. Geometry Design
The Matlab code generates the dual arc tip scroll geometry based on Bells’ fundamental theory [26], as shown in Figure 2. The orbiting and fixed scrolls are essential components of the machinery. The perfect shape for the orbiting scroll wrap is defined by an orbiting radius in the mathematical model. However, to prevent an orbiting lock in the actual machinery, there is a small gap between the orbiting and fixed scrolls, namely, the flank clearance. The flank clearance plays an important role in the design and operation of the scroll expander. A well-designed and controlled flank clearance size is beneficial to reduce the leakages from the high-pressure chamber to the low-pressure chamber, which also helps to guarantee energy conversion and machinery performance. In order to investigate the effect of the flank clearance size, flank clearances ranging from 20 to 200 µm were set and Table 1 shows the other essential parameters for the scroll expander.
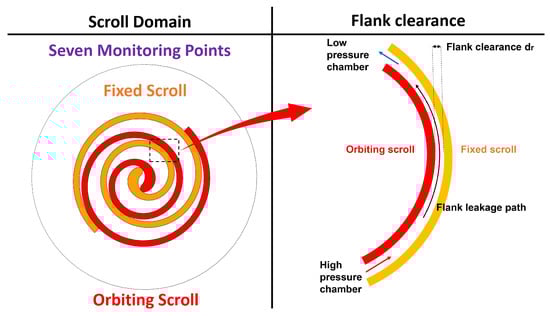
Figure 2.
Schematic diagram of the scroll expander and flank clearance.

Table 1.
Design parameters of scroll profile.
2.2. CFD Design
Figure 3 illustrates the five independent domains with the structured mesh and the four rotating angles when the expander works. The structured mesh is created using the software, except for the rotating domain. As the solver only accepts the “CDB format”, the “uns” mesh file is transferred into the workbench static structure. This process is shown in Appendix A. Using the scroll template of the solver, it generates a structured mesh domain with the dynamic rotating algorithm. The CFD model is carried out with unsteady Reynold’s-averaged Navier–Stokes equations (URANS) with the RNG turbulence model and solver. The pressure–velocity coupling and discretisation schemes are set as SIMPLEC and second-order upwind, respectively. The inlet boundary condition is 8 MPa total pressure and 400 K temperature, while the static pressure for the outlet is 2.5 MPa. The rotational speed is 4000 rpm with a 4.17 × 10⁻⁵ s time step. The properties of are input using look-up tables generated by the code with . The tables specify the density, viscosity, enthalpy, and thermal conductivity, responding to the 3000 × 3000 size of the temperature and pressure variations.
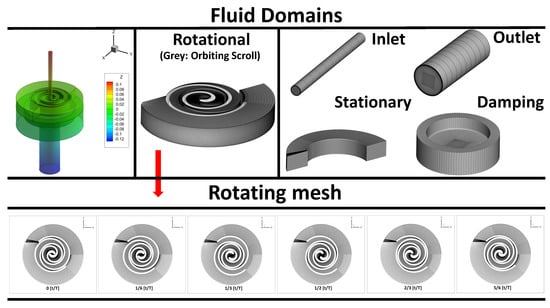
Figure 3.
Schematic image of the computational grids.
2.3. Surrogate-Assisted Multi-Objective Optimisation
The SAMOA is developed and applied to solve the balance problem between the manufacturing cost and machinery performance. The flow chart of the SAMOA is shown in Figure 4. Two objectives are defined as (isentropic efficiency) and (manufacturing cost). The reason to choose isentropic efficiency as an objective is that it is the key parameter to reflect the machinery’s performance and its trend is similar to the second-law efficiency from the thermodynamic analysis [25]. To simplify the equations, and replace and . The following subsections first start from the definitions of the multi-objective optimisation problem. Then, the definitions of the two objectives are presented, where includes the surrogate model. Finally, the multi-objective optimisation methodology with NSGA-II is introduced in detail. It should be noted that there was only one input for this study. This study can be the preliminary case to apply SAMOA to scroll expander dynamic mesh simulations. It can act as the reference for other parameters or multiple inputs in future studies, such as scroll geometrical parameters, different working fluids, and variable working conditions.
2.3.1. Multi-Objective Optimisation Problem Definition
The fundamental principle of volumetric machinery is to turn low-grade heat or waste heat into mechanical work by expanding a working fluid at a high pressure-to-volume ratio. As the shaft begins to rotate, the volume of each chamber, i.e., the suction chamber, expansion chamber, and discharge chamber, changes continuously. In addition, the flank leakage point also varies because of the contact points between the rotating and fixed parts. To simulate the actual working process of volumetric machinery, a dynamic mesh and transient settings are the standard methodologies to capture the internal flow characteristics by volume change. The flank clearance significantly impacts the machinery performance, and the existing studies fail to resolve its quantitative analysis. The fact is that CFD computations are very costly, and it is a challenge to accomplish accurate measurements inside the scroll expander during the working process. Regarding the above difficulties, a two-objective optimisation problem is required with objectives related to the and , where the size of flank clearances influence the decision. This is described by:
where is the decision variable, i.e., the size of flank clearance (), defines the search space, constitutes m conflicting objective functions, and is the objective space. A set of Pareto optimal solutions (PS) enables both solutions to improve objectives without sacrificing one another. The definition is to give two feasible solutions and is said to Pareto dominate (denoted as ) if and only if and such that . A solution is Pareto-optimal with respect to (1) if such that . In addition, is called the Pareto-optimal front. The following paragraphs describe the definitions of each objective function.

Figure 4.
The framework of the proposed SAMOA.
Figure 4.
The framework of the proposed SAMOA.

2.3.2. Objective Function Definitions for
The above problem requires a realistic relationship between / and the flank clearance size. The manufacturing tolerance is the amount of acceptable variation in the dimension or shape of a product that is produced by a manufacturing process. As the size of the flank clearance is minimal, the tolerances can be an alternative way to reflect the manufacturing price. The tolerance versus standard manufacturing price is derived by Ullman [27] in Figure 5. These tolerances reflect the price variations, where the tighter tolerance indicates a higher price. The flank clearances in this study range from 20 to 200 (7.8 × 10 to 7.8 × 10 inches), which is also the gap between the orbiting and fixed scrolls. Therefore, the tolerances of the orbiting and fixed scroll manufacturing affect the dimensions of the gap. The cost relations for the tolerances can reflect the price of machining the gap, as the cost is the relative percentage value in Figure 5. To simplify the relationship, relationships are adopted between the tolerance and cost into the relationship between the flank clearance and cost. In addition, piecewise functions are applied to fit the final relationship, as shown in Equation (2). The three-dimensional CFD model solutions () based on the variable flank gaps are also related to the second function, which will be discussed in the next section.
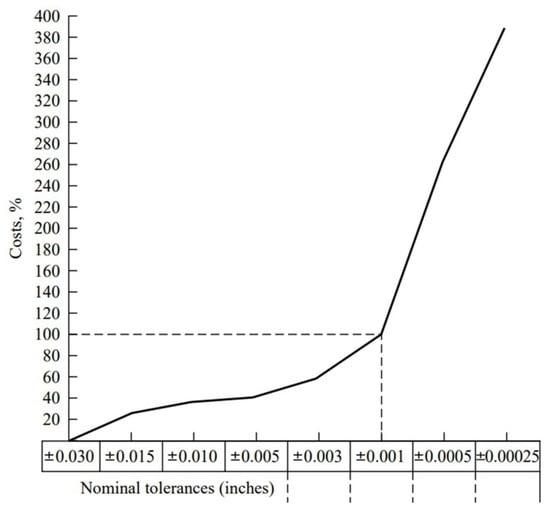
Figure 5.
Tolerance versus manufacturing costs [27].
2.3.3. Objective Function Definitions for
The previous sections described how three-dimensional CFD models with a dynamic mesh require significant computational resources. Surrogate models could be one of the most efficient methods to reduce the optimisation time and guarantee accuracy at the same time. In this study, the trained GPR model is applied as the objective function to surrogate the /. The GPR is a kind of non-parametric model which generally sets a GP prior over the latent function as [28]. Given a set of training data , the GPR model aims to learn a latent function g(x) by assuming , where is an independently and identically distributed Gaussian noise. For each testing input vector , the posterior mean and variance of the target can be predicted as:
where K is a covariance function, also known as a kernel, which is used to measure the similarity between a pair of data samples. This paper uses the Matérn without loss of generality, and it is defined as:
where is the Euclidean distance between and , and l are both the hyper-parameters of the covariance function. As recommended in [29], the hyper-parameters are learned by maximizing the log marginal likelihood function defined as:
A significant motivation for choosing the GPR model is that this model provides predictions at testing samples (e.g., the ) and estimates the associated prediction uncertainty (e.g., the ). According to these properties, predictive mean values (), the upper confidence bound (), and lower confidence bound () of GPR are applied to obtain the Pareto-optimal front with confidence intervals. Among them, is a hyper-parameter that is controlled by the confidence level .
2.3.4. Multi-Objective Optimisation
The situation described by and is a multi-objective optimisation problem. Here, NSGA-II [30] is applied to obtain the Pareto-optimal solutions. The NSGA-II uses non-dominated sorting techniques to drive populations to move toward the Pareto-optimal front. It also uses crowding distance techniques to maintain the diversity of populations. The steps of the NSGA-II algorithm are described in:
- Step 1: Initialize a population of solutions .
- Step 2: Use crossover and mutation to generate a population of offspring from .
- Step 3: Use non-dominated sorting to divide into several non-domination fronts
- Step 4: Starting from , solutions are stored in a temporary archive till its size for the first time equals or exceeds N, where . In particular, is the last acceptable non-domination front. If the size of equals N, then let and go to Step 6; otherwise go to Step 5.
- Step 5: Calculate the crowding distance of solutions in and sort them in a descending order. Remove the last solutions from and let .
- Step 6: If the stopping criterion is met, then stop and output ; otherwise, go to Step 2.
3. Results and Discussion
3.1. First Law of Thermodynamics Analysis
The scroll expander, a type of heat engine, is typically evaluated using the laws of thermodynamics. The first law describes the energy conservation of the scroll expander, as shown below:
where Q is the heat absorbed by the whole system, W is the work done by the system, and , , and are the change in internal energy, kinetic energy, and potential energy of the system. The simulation was assumed to be an adiabatic process, and the potential energy was not considered. Therefore, the equation has been simplified to:
The isentropic efficiency is defined as:
where and specify the calculated and ideal power output (W); and denote the beginning and endpoint of every revolution (s); m defines the average mass flow rate per revolution (kg/s); indicates the total enthalpy, and represents the ideal expansion outlet total enthalpy (kJ/kg). The isentropic efficiency reflects the ratio of actual specific work to isentropic specific work. The results obtained from the isentropic efficiency of 20 to 200 µm flank clearance over one expansion ratio can be compared in Figure 6. Increasing the flank clearance adversely affects the scroll expander performance. The isentropic efficiency changed from 87.41% to 44.83% as the flank clearance varies from 20 to 200 µm. The declining trend of isentropic efficiency was divided into four stages, represented by dashed lines as Q1→Q3. From 20 to 40 µm, the decreasing rate of isentropic efficiency was 0.56%/, the steepest among the four stages. The following two stages responded to 0.29%/µm and 0.26%/µm, respectively. The reduced rate (0.13%/µm) stays steady when the flank clearance rises to 130 µm. This intriguing finding might be explained by the fact that the larger flank clearance sizes represented higher leakages. With the increase in leakage, it was difficult for the expansion ratio to reach the designed ratio and this phenomenon was defined as under-expansion. Consequently, the isentropic efficiency continuously dropped down. The isentropic efficiency was also sensitive to the flank clearance size, with the trend divided into four trends. The four regions may be advantageous to the selection of flank clearance when related parameters such as pressure balance and manufacturing cost are considered. In addition, the R123 ORC scroll expander with 75 and 200 µm flank clearances was set as the comparison group, shown as the violet points. The isentropic efficiency values of were higher than R123 by 20.84% and 28.81%. Various flank gaps led to different pressure gradients between each chamber, forming the major thermodynamic irreversible losses and variable mass flow rates.
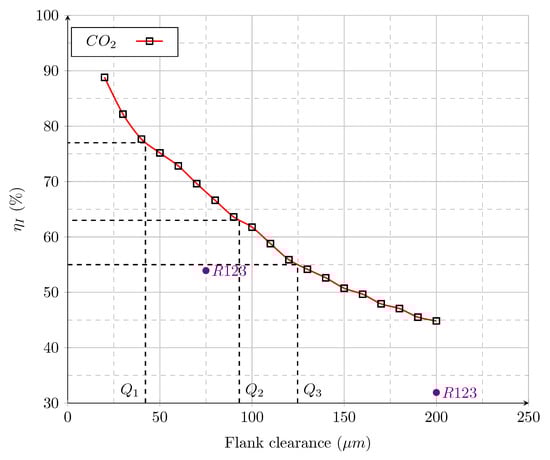
Figure 6.
Effect of flank clearance on the scroll expander’s isentropic efficiency and comparison with R123 [10] under the same pressure ratio.
Figure 7 provides the intercorrelations between the different flank clearances of mass flow rate and power output. and define the revolution average mass flux and power output. The 20 µm gap case was set as the reference, corresponding to a 0.107 kg/s revolution average mass flux () and a 6280 W () revolution average power output. A previous study [31] has identified that leakages may result in larger output power but lower isentropic effectiveness in the ORC volumetric expanders due to the significant mass flow rate growth. A similar trend has been found in scroll applications. The revolution mass flux rate increased from 1 to 2.31, whereas the revolution power output only rose from 1 to 1.18. The increase in mass flux showed a linear tendency as more internal flank leakage occurred for more extensive flank clearance.
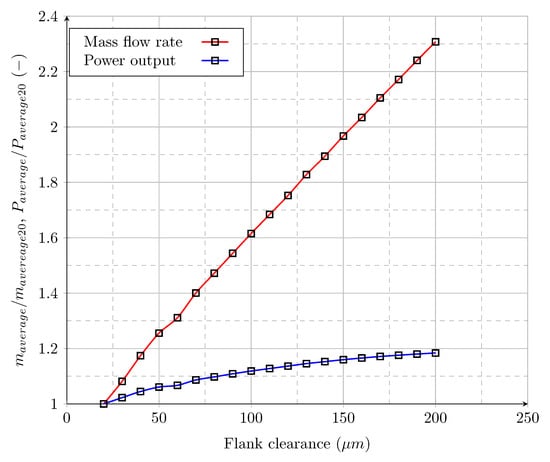
Figure 7.
Effect of flank clearance on the scroll expander’s mass flow rate and power output.
3.2. Pareto-Optimal Front
The thermodynamic analyses have determined the negative effect of a larger flank clearance. The first law also identified four stages by increasing the flank clearances. However, the 20 points were insufficient to specify the unique relations between flank clearance and isentropic efficiency, which required massive CFD cases. Based on the above considerations, GPR was applied to reach the target. Furthermore, in the real world, the flank clearances are also related to the manufacturing cost. Therefore, the problem is transferred into a two-objective optimisation problem. By using the upper and lower confidence bounds of GPR as the consecutively, a Pareto-optimal front can be obtained with a confidence interval, which helps the Pareto-optimal front to consider the prediction uncertainty caused by the GPR while analysing the trade-off relationship between and . In the following paragraphs, this study delineates the results of the Pareto-optimal front with a confidence interval under a confidence level and analyses the PF that was obtained by using the posterior mean function of GPR as .
3.2.1. Pareto-Optimal Front Confidence Interval and Validations
The upper and lower confidence bounds of GPR are the intervals that contain a specified percentage of the function’s possible values at a particular location, depending on the posterior mean and standard deviation of the Gaussian process. They represent the prediction’s level of uncertainty or confidence. As shown in Figure 8, the Pareto confidence interval (yellow area) gave every defective point a Gaussian distribution to quantify the uncertainty. For each Gaussian distribution, the upper and lower confidence bounds with 95% level were selected and then used in the optimisation algorithm. As a result, the data achieved the final Pareto-optimal front with a confidence interval (the yellow region), which provided a visible approach to describe the uncertainty in the relationship between and . In the following section, the final Pareto-optimal front and set were obtained by using the posterior mean function of the GPR as the .
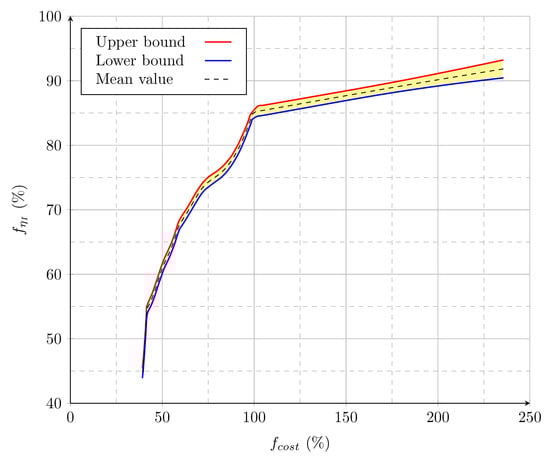
Figure 8.
Pareto confidence interval of and .
It is essential to validate the accuracy of GPR, which is directly related to the credibility of the final Pareto-optimal front. Regarding the computational time and linear trends of both objectives, the number of identical groups was set to six. To select representative solutions from the Pareto-optimal set, six averaged divided weights from 0 to 1 were used to construct validation groups, which corresponded to 15, 18, 21, 32, 65, and 185 flank clearances. Then, these flank clearances were used to generate new CFD cases and processed until convergence. Figure 9 compares the predictive results from the posterior mean function of GPR and the simulation results from validation CFD cases. It is clear to see that the GPR showed a remarkably consistent trend with the CFD validation cases. The isentropic efficiency ranged from 46.73% to 90.08% for CFD and from 46.26% to 91.82% for GPR, respectively. The deviations of all six validation cases were below 1%. The deviations gradually reduced when increasing the flank clearance, which led to lower isentropic efficiency. In general, the GPR was successfully validated based on the numerical model. The computational cost was also significantly reduced, with the optimisation process of SAMO requiring only 15 s to determine the isentropic efficiency of 2000 clearance sizes, whereas the CFD dynamic mesh model needed 90 h to obtain a single clearance size.
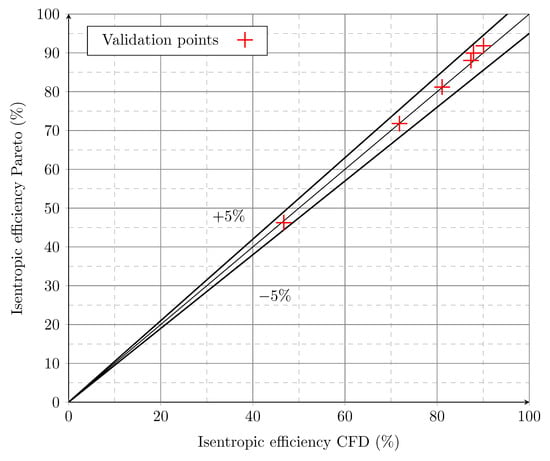
Figure 9.
Pareto-optimal front validations.
3.2.2. Pareto-Optimal Front Results
The final Pareto-optimal front set related to the manufacturing cost () and machinery isentropic efficiency () is displayed in Figure 10. The number of data points in the final Pareto-optimal front was 100. The data showed a clear trend of increasing isentropic efficiency when enlarging the manufacturing budget. The lowest efficiency related to a 39.24% relative cost, while the maximum price reached 235.81% with a 91.81% isentropic efficiency. Interestingly, the variation trend could also be divided into four stages by three knee points (i.e., Q1, Q2, and Q3 in Figure 10). For the first stage, the isentropic efficiency rose sharply from 44.81% to 55.64%, while the cost only increased from 39.24% to 41.26%. The second stage slowed down the rising trend but still showed a linear trend, where the efficiency increased to 74.38% with a 0.59% per cost rate. Turning to the third stage, it delivered a non-linear variation trend; the increasing efficiency rate continued to speed up the manufacturing cost. The average rate of this stage was 0.44% per cost rate. In the final stage, the isentropic efficiency increased smoothly with the price and corresponded to the lowest growth rate (0.05%). To better describe the complex relationship between and , this study generated a combination of polynomial models with different orders and ranges, as shown in Equation (10). The additional parameters defining the polynomial model, such as the coefficients and goodness of fit, are presented in Appendix B. With the help of the polynomial model, the trade-off relationship became more accurate and clear.
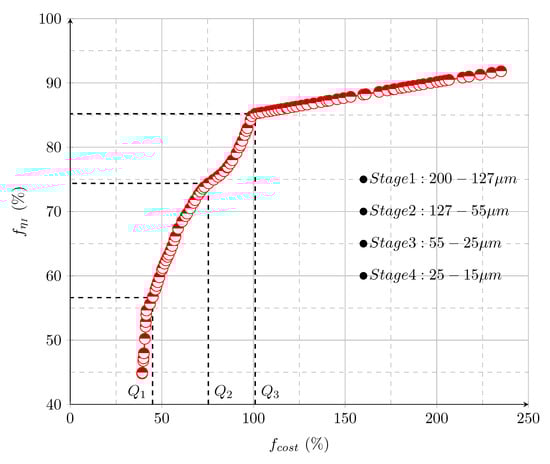
Figure 10.
Final Pareto-optimal front based on SAMO (GP).
Each solution of the Pareto-optimal set represents one flank clearance, and four stages were identified for the Pareto-optimal front. As a result, the flank clearance was also divided into four parts based on the Pareto-optimal front, where stage one ranged from 200 to 127 µm; stage two ranged from 127 to 55 µm; stage three varied from 55 to 25 µm; and stage four ranged from 25 to 15 µm. The final Pareto-optimal front can provide researchers with Pareto-optimal front information about selecting the flank clearance, as different projects have different objectives and tolerances regarding the isentropic efficiency and manufacturing cost, as shown in Figure 11.
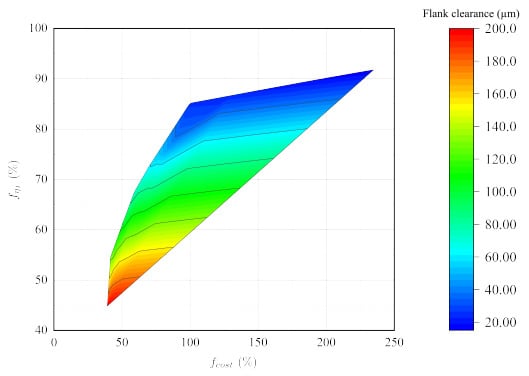
Figure 11.
Contour map showing the relations between flank clearance, , and .
The trade-off between the machinery efficiency and manufacturing cost is significant because it influences the profitability of the system. This can be one of the final objectives of the preliminary study in T-CO2 scroll expander design. It is ideally desired to achieve a higher efficiency with a relatively lower price. Therefore, the most suitable clearance range for further optimisation is from 127 to 200 µm. In addition, if the project has a particular requirement for the scroll expander performance and there is also some flexibility with cost, this Pareto-optimal front can also provide information about the trade-off value, which is a crucial advantage of the current methodology.
4. Conclusions
The main objective of the current study was to determine the effect of flank clearance on the performance () and manufacturing cost () of the T-CO2 scroll expander through CFD simulations. A trade-off relationship between the two objectives was expected to build and provide a reference for future optimisation. However, the required the thermodynamic results from transient CFD simulations, resulting in computational difficulties in predicting the performance. Therefore, the SAMO (GP) model was applied and the methodology was successfully validated. The novel methodology has the potential to be applied to other volumetric machinery simulations, as this type of machinery has difficulties in leakage design and computational costs due to the dynamic mesh. The potential limitations of the methodology could be that there is only set one additional parameter (manufacturing cost) as a multi-objective target and it is also limited to high-dimensional decision variables. In the future, this could be expanded to more objectives and high-dimensional parameters, such as temperature range, pressure range, and some specific design parameters. In general, this study presents the special case of a scroll expander, and the main conclusions are summarised below.
- For thermodynamic analysis, the flank clearance made a significant impact on the isentropic efficiency. The isentropic efficiency dropped from 87.41% to 44.83%, with the increase in flank clearance from 20 to 200 µm. Although the isentropic efficiency decreased, the power output rate increased to 1.18 due to the mass flux rate rising to 2.31. The flank clearance has a significant negative impact on the performance of the machinery, and it is a critical point that needs to be solved.
- The SAMO (GP) algorithm contributes a final Pareto-optimal front considering the two objectives. The area between the upper and lower bounds represents all the potential solutions. The final Pareto-optimal front using the mean value provided the trade-off solutions between the two objectives. It also indicated that flank clearances from 127 to 200 µm have the most potential for the sealing design.
- The SAMO (GP) was successfully applied to the T-CO2 scroll expander transient dynamic mesh CFD model. It significantly reduced the computational cost, from 90 h to 15 s, and showed consistent reliability. For the development of expander or similar machinery CFD simulations, this methodology can be applied to speed up the calculations and also consider more objectives. For the development of an optimisation algorithm, learning to optimise by using synthetic data could be a future direction. For example, given two objective functions, if the evaluation cost of one is much cheaper than the other and the trade-off relationship between them can be used as prior knowledge, it is possible to evaluate the cheaper objective function to obtain training data and try to train a generative model based on the trade-off relationship to generate synthetic data for the more expensive objective function.
Author Contributions
Writing—original draft, Y.D. and S.L.; writing—review and editing, M.P.; supervision and funding acquisition, G.T.; resources, W.L. All authors have read and agreed to the published version of the manuscript.
Funding
This research was funded by China Scholarship Council (CSC) grant grant number 201908510171.
Data Availability Statement
Data available on request from the authors.
Conflicts of Interest
The authors declare no conflict of interest.
Nomenclature
The following abbreviations are used in this manuscript:
| Acronyms/Abbreviations | |
| ANNs | Artificial Neural Networks |
| CFD | Computational Fluid Dynamics |
| DIP | Dual Intake Port |
| EMO | Evolutionary Multi-objective Optimisation |
| GPR | Gaussian Process Regression |
| IBEA | Indicator Based EA |
| KE | Kinetic Energy |
| MOEA/D | Multi-objective EA Based on Decomposition EA |
| NSGA-II | Non-dominated Sorting Genetic Algorithm |
| ORC | Organic Rankine Cycle |
| PE | Potential Energy |
| PF | Pareto-optimal Front |
| POD | Probability of Detection |
| RNG | Re-normalisation Group |
| S-CO2 | Supercritical Carbon Dioxide Cycle |
| SAMOA | Surrogate-assisted Multi-objective Optimisation Algorithm |
| SIMPLEC | Semi-implicit Method for Pressure Linked Equations Consistent |
| SVR | Support Vector Regression |
| T-CO2 | Transcritical Carbon Dioxide Cycle |
| URANS | Unsteady Reynold’s-averaged Navier–Stokes Equations |
| Greek Symbols | |
| Efficiency (%) | |
| Involute angle (rad) | |
| h | Enthalpy (kJ/kg) |
| Roman Symbols | |
| Flank clearance (mm) | |
| h | Height (mm) |
| m | Mass per revolution (kg) |
| Q | Heat (J) |
| Base circle radius (mm) | |
| Design ratio (-) | |
| t | Time (s) |
| th | Thickness (mm) |
| U | Internal energy (J) |
| W | Watt (W) |
| Subscripts | |
| 1 | Start point of rotating |
| 2 | End point of rotating |
| end | Ending state of involute |
| h | Work done by enthalpy |
| i0 | Initial state of inner involute |
| I | First law |
| ideal | Work done by ideal process |
| in | Inlet |
| is | Starting state of inner involute |
| o0 | Initial state of outer involute |
| os | Starting state of outer involute |
| out | Outlet |
| t | Total enthalpy |
Appendix A. ICEM Mesh to .CDB File
- Open ANSYS Workbench.
- Select Static Structural in Analysis Systems.
- Select ICEM CFD in the Component Systems.
- Connect the ICEM CFD to the Model component in the Static Structural.
- Generate mesh in ICEM CFD.
- Open Model in Static Structural.
- Create name selection to the mesh domain, e.g., body1.
- Click Commands (APDL) and insert following commands:/PREP7cmsel,s,body1cdwrite,db,mesh_body1,cdbALLSEL/SOLUTION/EOF
- Click solve
- Right click solutions and open solver files directory. The .cdb file would be generated here.
Appendix B. Polynomial Equation Parameters
Table A1.
Stage 1 means , stage 2 means , stage 3 means , stage 4 means .
Table A1.
Stage 1 means , stage 2 means , stage 3 means , stage 4 means .
| Parameter | Stage 1 | Stage 2 | Stage 3 | Stage 4 |
|---|---|---|---|---|
| p1 | 0.005439 | −2.193 × 10 | 4.108 × 10 | 0.0004951 |
| (0.004764, 0.006114) | (−3.59 × 10, −7.963 × 10) | (3.32 × 10, 4.896 × 10) | (0.0004932, 0.0004971) | |
| p2 | −0.3984 | 0.0002961 | −0.0009216 | 0.8024 |
| (−0.4529, −0.344) | (6.003 × 10, 0.0005322) | (−0.001123, −0.0007201) | (0.8021, 0.8027) | |
| p3 | 7.708 | −0.005686 | 0.07097 | - |
| (6.611, 8.805) | (−0.01883, 0.007456) | (0.05386, 0.08808) | - | |
| p4 | - | 0.4251 | −1.13 | - |
| - | (0.1841, 0.6661) | (−1.611, −0.6481) | - | |
| SSE | 1.355 × 10 | 7.108 × 10 | 5.351 × 10 | 2.873 × 10 |
| R-squared | 0.9999 | 0.9991 | 0.9997 | 0.9998 |
| Adjusted R-squared | 0.9998 | 0.9989 | 0.9997 | 0.9998 |
| RMSE | 0.00044 | 0.001797 | 0.0005973 | 0.0002615 |
References
- Emhardt, S.; Tian, G.; Chew, J. A review of scroll expander geometries and their performance. Appl. Therm. Eng. 2018, 141, 1020–1034. [Google Scholar] [CrossRef]
- Song, P.; Wei, M.; Shi, L.; Danish, S.N.; Ma, C. A review of scroll expanders for organic Rankine cycle systems. Appl. Therm. Eng. 2015, 75, 54–64. [Google Scholar] [CrossRef]
- Guo, J.Q.; Li, M.J.; He, Y.L.; Jiang, T.; Ma, T.; Xu, J.L.; Cao, F. A systematic review of supercritical carbon dioxide (S-CO2) power cycle for energy industries: Technologies, key issues, and potential prospects. Energy Convers. Manag. 2022, 258, 115437. [Google Scholar] [CrossRef]
- Crespi, F.; Gavagnin, G.; Sánchez, D.; Martínez, G.S. Supercritical carbon dioxide cycles for power generation: A review. Appl. Energy 2017, 195, 152–183. [Google Scholar] [CrossRef]
- Du, Y.; Tian, G.; Pekris, M. A comprehensive review of micro-scale expanders for carbon dioxide related power and refrigeration cycles. Appl. Therm. Eng. 2022, 201, 117722. [Google Scholar] [CrossRef]
- Chen, Y.; Halm, N.P.; Groll, E.A.; Braun, J.E. Mathematical modeling of scroll compressors—Part I: Compression process modeling. Int. J. Refrig. 2002, 25, 731–750. [Google Scholar] [CrossRef]
- Iglesias, A.; Favrat, D. Innovative isothermal oil-free co-rotating scroll compressor—Expander for energy storage with first expander tests. Energy Convers. Manag. 2014, 85, 565–572. [Google Scholar] [CrossRef]
- Song, P.; Wei, M.; Zhang, Y.; Sun, L.; Emhardt, S.; Zhuge, W. The impact of a bilateral symmetric discharge structure on the performance of a scroll expander for ORC power generation system. Energy 2018, 158, 458–470. [Google Scholar] [CrossRef]
- Fatigati, F.; Di Giovine, G.; Cipollone, R. Feasibility Assessment of a Dual Intake-Port Scroll Expander Operating in an ORC-Based Power Unit. Energies 2022, 15, 770. [Google Scholar] [CrossRef]
- Emhardt, S.; Tian, G.; Song, P.; Chew, J.; Wei, M. CFD modelling of small scale ORC scroll expanders using variable wall thicknesses. Energy 2020, 199, 117399. [Google Scholar] [CrossRef]
- Emhardt, S.; Tian, G.; Song, P.; Chew, J.; Wei, M. CFD analysis of the influence of variable wall thickness on the aerodynamic performance of small scale ORC scroll expanders. Energy 2022, 244, 122586. [Google Scholar] [CrossRef]
- Rak, J.; Pietrowicz, S. Internal flow field and heat transfer investigation inside the working chamber of a scroll compressor. Energy 2020, 202, 117700. [Google Scholar] [CrossRef]
- Zheng, S.; Wei, M.; Song, P.; Hu, C.; Tian, R. Thermodynamics and flow unsteadiness analysis of trans-critical CO2 in a scroll compressor for mobile heat pump air-conditioning system. Appl. Therm. Eng. 2020, 175, 115368. [Google Scholar] [CrossRef]
- Zheng, S.; Wei, M.; Hu, C.; Song, P.; Tian, R.; Li, Y.; Sun, J.; Wu, D. Impact of micro-grooves in scroll wrap tips on the performance of a trans-critical CO2 scroll compressor. Int. J. Refrig. 2021, 131, 493–504. [Google Scholar] [CrossRef]
- Zheng, S.; Wei, M.; Zhou, Y.; Hu, C.; Song, P. Tangential leakage flow control with seal-grooves on the static scroll of a CO2 scroll compressor. Appl. Therm. Eng. 2022, 208, 118213. [Google Scholar] [CrossRef]
- Scallan, P.G. 9—Economics of process planning. In Process Planning; Butterworth-Heinemann: Oxford, UK, 2003. [Google Scholar]
- Jin, Y.; Wang, H.; Sun, C. Data-Driven Evolutionary Optimization; Springer: Berlin/Heidelberg, Germany, 2021. [Google Scholar]
- Bekiloğlu, H.E.; Bedir, H.; Anlaş, G. Multi-objective optimization of ORC parameters and selection of working fluid using preliminary radial inflow turbine design. Energy Convers. Manag. 2019, 183, 833–847. [Google Scholar] [CrossRef]
- Li, P.; Mei, Z.; Han, Z.; Jia, X.; Zhu, L.; Wang, S. Multi-objective optimization and improved analysis of an organic Rankine cycle coupled with the dynamic turbine efficiency model. Appl. Therm. Eng. 2019, 150, 912–922. [Google Scholar] [CrossRef]
- Xia, W.; Zhang, Y.; Yu, H.; Han, Z.; Dai, Y. Aerodynamic design and multi-dimensional performance optimization of supercritical CO2 centrifugal compressor. Energy Convers. Manag. 2021, 248, 114810. [Google Scholar] [CrossRef]
- Jin, Y.; Wang, H.; Chugh, T.; Guo, D.; Miettinen, K. Data-driven evolutionary optimization: An overview and case studies. IEEE Trans. Evol. Comput. 2018, 23, 442–458. [Google Scholar] [CrossRef]
- Athavale, J.; Yoda, M.; Joshi, Y. Comparison of data driven modeling approaches for temperature prediction in data centers. Int. J. Heat Mass Transf. 2019, 135, 1039–1052. [Google Scholar] [CrossRef]
- Duan, Y.; Cooling, C.; Ahn, J.S.; Jackson, C.; Flint, A.; Eaton, M.D.; Bluck, M.J. Using a Gaussian process regression inspired method to measure agreement between the experiment and CFD simulations. Int. J. Heat Fluid Flow 2019, 80, 108497. [Google Scholar] [CrossRef]
- Ringstad, K.E.; Banasiak, K.; Ervik, Å.; Hafner, A. Machine learning and CFD for mapping and optimization of CO2 ejectors. Appl. Therm. Eng. 2021, 199, 117604. [Google Scholar] [CrossRef]
- Du, Y.; Tian, G.; Pekris, M. Unsteady and three-dimensional computational fluid dynamics modelling of scroll expander for low-grade waste heat recovery transcritical carbon dioxide micro-scale power system. Energy Convers. Manag. 2023, 282, 116857. [Google Scholar] [CrossRef]
- Bell, I.H. Theoretical and Experimental Analysis of Liquid Flooded Compression in Scroll Compressors. Ph.D. Thesis, Purdue University, West Lafayette, IN, USA, 2011. [Google Scholar]
- Ullman, D. EBOOK: The Mechanical Design Process; McGraw Hill: New York, NY, USA, 2009. [Google Scholar]
- Seeger, M. Gaussian processes for machine learning. Int. J. Neural Syst. 2004, 14, 69–106. [Google Scholar] [CrossRef]
- Liu, H.; Ong, Y.S.; Shen, X.; Cai, J. When Gaussian process meets big data: A review of scalable GPs. IEEE Trans. Neural Netw. Learn. Syst. 2020, 31, 4405–4423. [Google Scholar] [CrossRef]
- Deb, K.; Pratap, A.; Agarwal, S.; Meyarivan, T. A fast and elitist multiobjective genetic algorithm: NSGA-II. IEEE Trans. Evol. Comput. 2002, 6, 182–197. [Google Scholar] [CrossRef]
- Lemort, V.; Legros, A. Positive displacement expanders for Organic Rankine Cycle systems. In Organic Rankine Cycle (ORC) Power Systems; Elsevier: Amsterdam, The Netherlands, 2017; pp. 361–396. [Google Scholar]


Disclaimer/Publisher’s Note: The statements, opinions and data contained in all publications are solely those of the individual author(s) and contributor(s) and not of MDPI and/or the editor(s). MDPI and/or the editor(s) disclaim responsibility for any injury to people or property resulting from any ideas, methods, instructions or products referred to in the content. |
© 2023 by the authors. Licensee MDPI, Basel, Switzerland. This article is an open access article distributed under the terms and conditions of the Creative Commons Attribution (CC BY) license (https://creativecommons.org/licenses/by/4.0/).