Article

PhloVer: A Modular and Integrated Tracking Photovoltaic Shading Device for Sustainable Large Urban Spaces—Preliminary Study and Prototyping

by
Federico Minelli
1,
Diana D’Agostino
1,
Maria Migliozzi
2,
Francesco Minichiello
1,* and
Pierpaolo D’Agostino
3
1
Department of Industrial Engineering (DII), University of Naples Federico II, 80125 Naples, Italy
2
Independent Researcher, 81054 San Prisco, Italy
3
Department of Civil, Building and Environmental Engineering (DICEA), University of Naples Federico II, 80125 Naples, Italy
*
Author to whom correspondence should be addressed.
Energies 2023, 16(15), 5786; https://doi.org/10.3390/en16155786
Submission received: 29 June 2023 / Revised: 25 July 2023 / Accepted: 30 July 2023 / Published: 3 August 2023

Abstract

:
In this work, a flower-shaped shading system with integrated tracking photovoltaic, suitable for sustainable extensive urban coverages, is designed. Detailed photovoltaic energy yield simulations with a single-diode model approach are performed to disclose the potential of the proposed tracking photovoltaic shading device (PVSD). Simulations are performed with reference to a case study. A double-layer space truss is used to house the innovative modular photovoltaic tracking system, and the first application is envisaged for the coverage of a public market area of a sunny municipality in Southern Italy. By comparing it with the traditional photovoltaic fixed system, the results of the simulations show a steadier energy generation of the new PVSD, and it also provides better coverage with renewable energy during the hours of the day when the traditional system produces low electric energy. Lastly, an early interactive prototype of the PVSD system is presented. The tracking mechanism is carefully designed, 3D-printed at a small scale and tested with a motorized dynamic system controlled by a microcontroller board. The realization of the physical prototype and the engineering of the movement mechanism confirmed the feasibility and the correct functioning of the conceived system opening to real-scale applications.

1. Introduction

New sustainable paradigms in the generation of clean and renewable energy are required in light of the recent energy crisis and the compelling demand for decarbonization of energy supply.
The energy policy of the European Union, in order to both maintain the functionality of the internal energy market and preserve the environment, is essentially based on four lines of action: security of supply, to ensure a reliable supply of energy when and where needed; ensure the efficiency of the energy market and therefore its competitiveness, to guarantee reasonable prices for all users; promote energy saving, energy efficiency and the development of new and renewable energy sources (RES), through the decrease in greenhouse gas emissions and the reduction in dependence on fossil fuels; promote the interconnection of energy networks.
The legislative package adopted by the European institutions between the end of 2018 and the first half of 2019—the so-called “Winter package” or “Clean energy package”—establishes the regulatory framework of the governance of the Union for energy transition and against climate changes to achieve the mid-term European objectives for 2030 [1] on the matter of the decarbonization target to be obtained by 2050.
With reference to greenhouse gas emissions, the European Regulation 2018/842 [2] based on the 2016 Paris Agreement—sets mandatory levels of emission reductions by 2030 for each Member State. The target for the EU is an internal reduction of at least 40% of emissions compared to 1990 levels, to be achieved by 2030.
Concerning renewable energy, the Directive 2018 establishes that the member States collectively ensure that the share of energy from renewable sources in the Union’s gross final energy consumption in 2030 is at least equal to 32%. At the same time, starting from 1 January 2021, the share of energy from renewable sources in the gross final consumption of energy of each Member State must be higher than the given limits.
The construction sector has a high potential for reduction in CO2 emissions [3]. Researchers are, therefore, expected to look for new design alternatives to develop more sustainable cities [4], communities [5] and buildings [6], improving on-site renewable energy production systems [7,8] and also considering on-site consumption of clean energies [9].
Studies about the exploitation of solar and wind resources for energy harvesting are very common for electricity generation, like PV-wind [10], sun-tracking PV-micro wind [11] and building-integrated PV-micro wind [12] hybrid systems, and for combined thermal and electric energy production, like photovoltaic thermal [13] and concentrated photovoltaic thermal [14]. Furthermore, the effects of these technologies on conventional generation are also studied [15].
In [16], the integration of renewable energy sources is considered in the global optimization of the building plant system with a multi-objective approach. The environmental impact of several photovoltaic (PV) plant typologies is assessed and compared in [17]. In [18], the attainment of high energy efficiency buildings using PVs on the roof is addressed, underlining the problem of the low useful surface for the installation of PVs in high-density urban areas. In [19], the benefits of using solar tracking devices are investigated in order to maximize on-site self-consumption of produced electricity, within the optimal design of a Net Zero Energy Building (NZEB). Indeed, the spread of distributed energy resources is of primary importance for sustainability and decarbonization goal attainment [20], and new ways to integrate renewable energy production in urban areas should be investigated.
PVs are already the most widespread renewable energy system in cities. Building-applied photovoltaic (BAPV) [21] and building-integrated photovoltaic (BIPV) systems are gaining momentum [22] as technologies are able to increase the useful surface for PV installation.
Photovoltaic shading device (PVSD) systems serve the same purpose also integrating the function of solar shading both for energy efficiency and people comfort. Natural [23] and artificial [24] shading systems are, indeed, of utmost importance for people’s comfort both in internal [25] and external spaces, like urban greenery [26] or shading devices [27].
Although these technologies are usually applied to buildings, this study aims to extend the concept to large urban coverages. Large urban areas have the potential to extensively accommodate PV systems in order to maximize decentralized renewable energy harvesting in cities, with the opportunity to integrate solar tracking devices to guarantee more steadiness to electric energy generation [19].
In addition, PV systems have a very short carbon payback period (the time in which the embodied carbon emissions are fully offset by the reduction in carbon emissions from system operation), equal to a few years. This is very important when considering the sustainability of new urban constructions, in line with Sustainable Development Goal 11 “Sustainable Cities and Communities” [28].
In this study, the design, the energy simulation referred to as a case study and an early prototyping of a modular tracking PV system technology suitable for large urban coverages are protracted. The bi-weekly market of the municipality of Santa Maria Capua Vetere (in Southern Italy) is chosen for the analyses of an application case. A detailed estimation of the production of the PV panels is carried out. Lastly, the layout of the tracking mechanism is studied in detail and prototyped on a small scale.
The innovation of the study can be summarized as below reported.
  • An innovative flower-shaped design for a modular tracking PVSD system intended for integration in coverages of large urban spaces is proposed.
  • The flower shape (opened flower petals) increases the electric production of a fixed PV system and has a shade function for the crowded location, not neglecting the architectural aspects.
  • Its applicability to a real case study is verified.
  • Detailed simulation of the tracking PVSD system is performed using:
    -
    single-diode model for PV module simulation;
    -
    De Soto’s “5 parameter approach” for the characterization of the PV module from the manufacturer datasheet [29];
    -
    Faiman model for the dynamic simulation of cell temperature [30];
    -
    typical meteorological year (TMY) climate data generated, according to ISO 15927-4 [31], from 2005–2020 satellite hourly meteorological dataset provided by PVGIS-SARAH2 database [32].
  • A comparison of the proposed tracking PVSD system with equivalent fixed systems is provided in terms of electricity generation.
  • The first small-scale interactive prototype of the system is presented.

2. Literature Review

A brief literature review is proposed in this paragraph, to delineate the context in which the work of the authors is held, underlining the gaps that the present study aims to address.

2.1. Photovoltaics

PV technology is expected to play a significant role in the decarbonization of the future global energy system [33]. Given the variety of applications it is involved in, PV technology has made significant progress in the last years [34]. There are several kinds of available solar PV systems, and the effectiveness of these technologies has been validated under hot [35], temperate [36] and cold [37] climatic conditions and for several applications [38,39].
The building sector is taking large advantage of PV installation on building roofs, and many approaches have arisen to optimize its integration and efficient coupling with building plants systems, such as the one proposed in [40], which follows a procedural approach, and the ones reported in [16,41] that use an automated routine based on genetic algorithm.
Building PV systems are in most cases grid-connected, allowing to transfer to the public energy grid the excess electricity production. Nevertheless, self-consumption remains a key aspect of PV energy production [42], especially when sustainable development of buildings [43] and districts [44] is considered. Time mismatch between building energy consumption and PV power plant electricity production may, indeed, lead to overloads of the public energy grid. Most of the approaches that aim to maximize self-consumption in residential households [45,46], commercial buildings [47] and standalone facilities [48] rely on energy storage devices such as lithium-ion batteries or electrolysis with hydrogen tanks. Even though optimal results are obtained under the point of view of self-consumption maximization, the implementation of such technologies may imply higher environmental impact or high extra cost for the user, so increasing payback periods of the investment.
In this context, sun-tracking PV systems are proven to provide a more steady energy production during the day and the also during the year [19], contributing to an increase in site energy self-consumption and sustainability of cities. This is especially true for residential consumers who exhibit peak demands both in the early and the last hours of the day, as it is deducible from studies about electric energy storage in households [49] and load profile analysis [50].

2.2. Solar Tracking Photovoltaics

Although the most of installed PV systems are still fixed, the usage of solar tracking devices is increasing [51]. Fixed PV systems are characterized by production losses caused by shading and non-ideal orientation. Solar tracker technology allows to overcome these restrictions and losses and increase energy production [52]. Numerous usage scenarios have extensively shown how effective tracking systems are preferable [53], both by simulative [54] and experimental [55] approaches.
The tracking devices can be substantially of two types: with one degree of freedom or with two degrees of freedom [56]. Trackers with a single degree of freedom are characterized by a rotation axis which varies the angle of inclination with respect to the horizontal (tilt angle) or which varies the azimuth angle from East to West during the day [57]. In this case, the increase in electricity production compared to a fixed system ranges from 15 to 25% [58].
The most advanced sun trackers have two degrees of freedom, aiming to align the vector normal to the photovoltaic panel surface with the sun rays in real time [59]. The tracking process is performed using two electric motors and a more complex mechanical structure [60]. With these trackers, there are increases in electricity production that even reach 35–40% compared to a fixed system [61,62].
Still, some drawbacks of tracking systems should be mentioned. These reside mostly in the higher costs for plant construction, operation and maintenance [63], maintenance management [64] and in larger technical spaces needed for installation [19].

2.3. Building-Integrated Photovoltaic (BIPV)

The search for alternative renewable energy sources, especially from solar energy, is growing in the construction sector in order to reach sustainability standards and zero energy building (ZEB) targets [65], such as nearly zero energy building (nZEB), net zero energy building (NZEB) and positive energy building (PEB). BIPV, therefore, appears to be an ideal solution, as it converts building envelopes into local power plants. BIPV systems are in continuous development [66] and, in some recent studies, are also integrated with phase change materials (PCM) in order to provide latent thermal heat storage, improving the energy efficiency of the building. For these innovative systems, a power prediction model is provided and validated in [67], while in [68,69], thermodynamic and climate responses of these facades are respectively analyzed.
The integration of PV systems is a strategy for the exploitation of solar radiation in line with international sustainability criteria [70] and the policy on the use of renewable energy sources.
Several studies have emphasized that successful PV integration applications require strong collaboration between agents involved in the design and construction processes. A proper design strategy should strike a balance between geometry and power generation needs. During the design process of BIPV systems, the greatest possible amount of solar radiation should always be exploited, through the best angle of inclination and orientation of the PV surfaces, avoiding self-shading. In this context, the application of solar tracking to integrated PV systems has great unexploited potential, even though some approaches to large-scale application of this technology are emerging [71].

2.4. Photovoltaic Shading Devices (PVSDs)

A peculiar and interesting kind of BIPV system is photovoltaic shading devices (PVSDs) [72]. The purpose of a shading device is essentially to protect against unwanted solar radiation, especially in severe conditions and orientations [73]. The mechanism of a shading system works as the conversion of direct solar radiation into scattered light and modulation of the solar radiation penetration [74].
Dynamic shading systems respond to external data through rule-based automation, which incorporates hardware and software layers comprising a variety of devices, such as sensors, controllers and logic units, along with a control system, which sends commands to the mechanism responsible for performing the desired action. Designing a control system requires comprehensive knowledge of the targeted process and mechanism of involved sensors and actuators, which are mostly connected to a communication network.
The control system can be divided into two main parts: inputs and controllers. The inputs provide all the data required to fulfil the purpose of the system, detect information from the surrounding environment and convert it into instructive signals, taking different forms, such as manual input method, sensors, reset information, manual programming or real-time data from the Internet. The controller acts as an interface between the input media and the actuators and is driven by computation, a software unit or a computer [75].
PVSDs allow to obtain the benefits both of dynamic shading systems [74] and PV energy production. A review of energy savings by solar control techniques and optimal building orientation for the strategic placement of facade shading systems is available in [72,76]. The twofold positive effect of PVSDs on energy efficiency is reported in [77,78] through an analysis of the energy production of such a system.
In [79], an experimental study is presented for the performance evaluation of a PV-blind-embedded double-skin façade. The tilt angle of PVSDs, however, is crucial for the cost optimization of such systems as evidenced in [80] for European cities. The integration of adaptive control strategies is, therefore, highly desirable, but only a few approaches exist in this regard [81]. Also in [82], a movable PVSD is presented but, even though it offers many benefits in terms of electricity production and sun shading, it is not operated as a tracking system.
It is evident from the suggested literature that research methodologies that examine tracking PV systems rarely offer interaction with shading systems. Vice versa, studies that go deep into BIPV and PVSDs do not employ solar tracking technology. This is probably due to the difficulties in the combined management of tracking PVs and the peculiar shading needs of buildings.
Furthermore, in [83], the integration of architectural quality and aesthetical features of solar PVSDs with high energy generation performance is evidenced as a key trait of tomorrow’s innovative systems.
For this reason, in this paper, the design of an innovative flower-shaped tracking PV-integrated shading device is addressed, coupling aesthetic and energy efficiency instances. The shading device, in this case, is not dedicated to a building but to a large urban area, used as a public market, and it is integrated into a structural steel framework. This allows to take advantage of even large public spaces to integrate the already available surface of buildings for PV system exploitation. Furthermore, thanks to the distance from adjacent buildings, this solution minimizes the shading of PV modules, increasing the energy yield.
As for the already existing dynamic roofing elements, these are usually limited to screening open spaces or are used for stadiums, shopping centers and internal courtyards. The integrated PV energy systems are mostly static and not dynamic. To the best of the authors’ knowledge, the design of a flower-shaped shading system with integrated tracking photovoltaic system for large urban spaces considering also the architectural aspect has never been proposed.
Ultimately, the authors of [84] compared simplified and detailed simulations of PVSDs and conclude that, for systems characterized by complex geometries, models that take into account real manufacturer data of PV modules are the most reliable. For this reason, a detailed simulation approach is used in this paper.

3. Methodology and Case Study

In this section, the parametric design process of the modular tracking PV system for the coverage of large urban spaces is exposed and the definition of the methodology for the detailed PV performance simulation and the early prototyping is protracted.
The early design stage is managed by the tool Grasshopper [85], a visual programming suite embedded in the 3D modeling software Rhinoceros. The design of the tracking PV system is defined with the aid of the Grasshopper plug-in, Ladybug [86], that allowed to quickly verify the effectiveness of the new system, through a PV performance simulation achieved using EnergyPlus Weather files [87,88]. Another Grasshopper plug-in, Firefly [89], is leveraged to realize an interactive 3D-printed prototype, powered by an Arduino [90] development board.
The detailed PV system is modeled by the programming language Python. Detailed PV performance simulation is performed upon a case study application of the modular system in a municipality located in Southern Italy. Flexibility and interoperability of Python programming language allowed hourly energy simulation, dialog with climatic database and easy sharing of the results. Furthermore, the open-source nature of this programming language provides reproducibility of the study and easy development of future stages of this research. In detail, the PV simulation is performed considering the single-diode model [91] of the PV cell. This is a widespread model that allows the simulation of PV modules through the knowledge of a few parameters. The I/V relationship representing the behavior of the PV module under real circumstances (solar radiation, cell temperature) is obtained with the “5-parameter” approach proposed by De Soto [29]. Absorbed irradiance of the PV system is evaluated by plane of array (POA) irradiance, applying air mass influence [92] and incident angle modifiers for direct (ASHRAE model [93]) and diffuse (Martin and Ruiz model [94]) irradiances, which take into account reflection phenomena of direct and diffuse radiation on the surface of the PV module. The temperature of the cell is evaluated with the Faiman model, which relies on empirical coefficients to consider radiative and convective heat exchange phenomena of the PV module for given irradiance, air temperature and wind speed. The DC/AC inverter is modeled using the PVWatts model proposed by the National Renewable Energy Laboratory (NREL) of the U.S. Department of Energy (DOE). This model is obtained by fitting inverter efficiency data from a California Energy Commission (CEC) database to a quadratic loss model [95]. The obtained DC PV generation data are then used to validate the early evaluation of the proposed system performance.
In Figure 1, a schematic diagram of the workflow is reported.
This paragraph is structured as follows. Section 3.1 reports the conceptualization and the first design of the modular tracking PV system. In Section 3.2, climate data used for the performance assessment of the PV system are described. Section 3.3 is devoted to the illustration of the mathematical model used for the simulation of the solar tracking modules. Details about the parameter extraction procedure from the manufacturer datasheet of the PV module are reported in Section 3.4. In Section 3.5, the model used for the simulation of PV module temperature during operation is reported. This is of utmost importance, since PV performance is influenced by the microclimate of the place in which it is located [96]. Section 3.6 illustrates the model used to simulate the DC/AC inverters used in the simulations. Section 3.7 reports the technical specifications of the PV modules employed in the study. The case study area used for the first application of the innovative PV solution is shown in Section 3.8. In Section 3.9, the development of a small-scale prototype of the PV device is presented.

3.1. Design of a Modular Tracking PV System Integrated in Coverages of Large Urban Spaces

The basic requirements of PV integration can influence the engineering and architectural project in different ways, from the orientation and spatial positioning of the infrastructure to its shape and construction system. Different design strategies regarding materials, innovative technological components and energy harvesting strategies have been developed in the search for optimal architectural and engineering sustainable design solutions for PV integration in civil structures.
Previous studies that addressed similar tasks like BIPV envelopes [97] and PV integration into membrane structures [98] leveraged parametric–algorithmic modeling with the aid of software like Rhinoceros and Grasshopper [85]. Parametric–algorithmic modeling refers to the parameter-based automated generation of design elements [99]. Namely, the generation and variation of geometric elements within a certain design are controlled with specific numeric parameters linked to multiple sets of rules often generated by algorithms. These are powerful 3D modeling tools that allow for analyzing complex geometries. Grasshopper is a visual algorithm editor integrated with Rhinoceros 3D modeling software. Since it is a parametric–algorithmic modeler linked to 3D rendering software, the plug-in is widely used in the field of design and architectural modeling. The software is suitable to create 3D models and comes with the Ladybug plug-in [86] that is useful for early simulations of the availability of solar resources, based on climate data retrieved from EnergyPlus Weather (EPW) files. This plug-in is used in this study, along with the Rhinoceros/Grasshopper environment, only for the early design of the PV tracking system and it is replaced by the models reported in the next sections of this paragraph for the detailed PV performance simulation, using Python programming language.
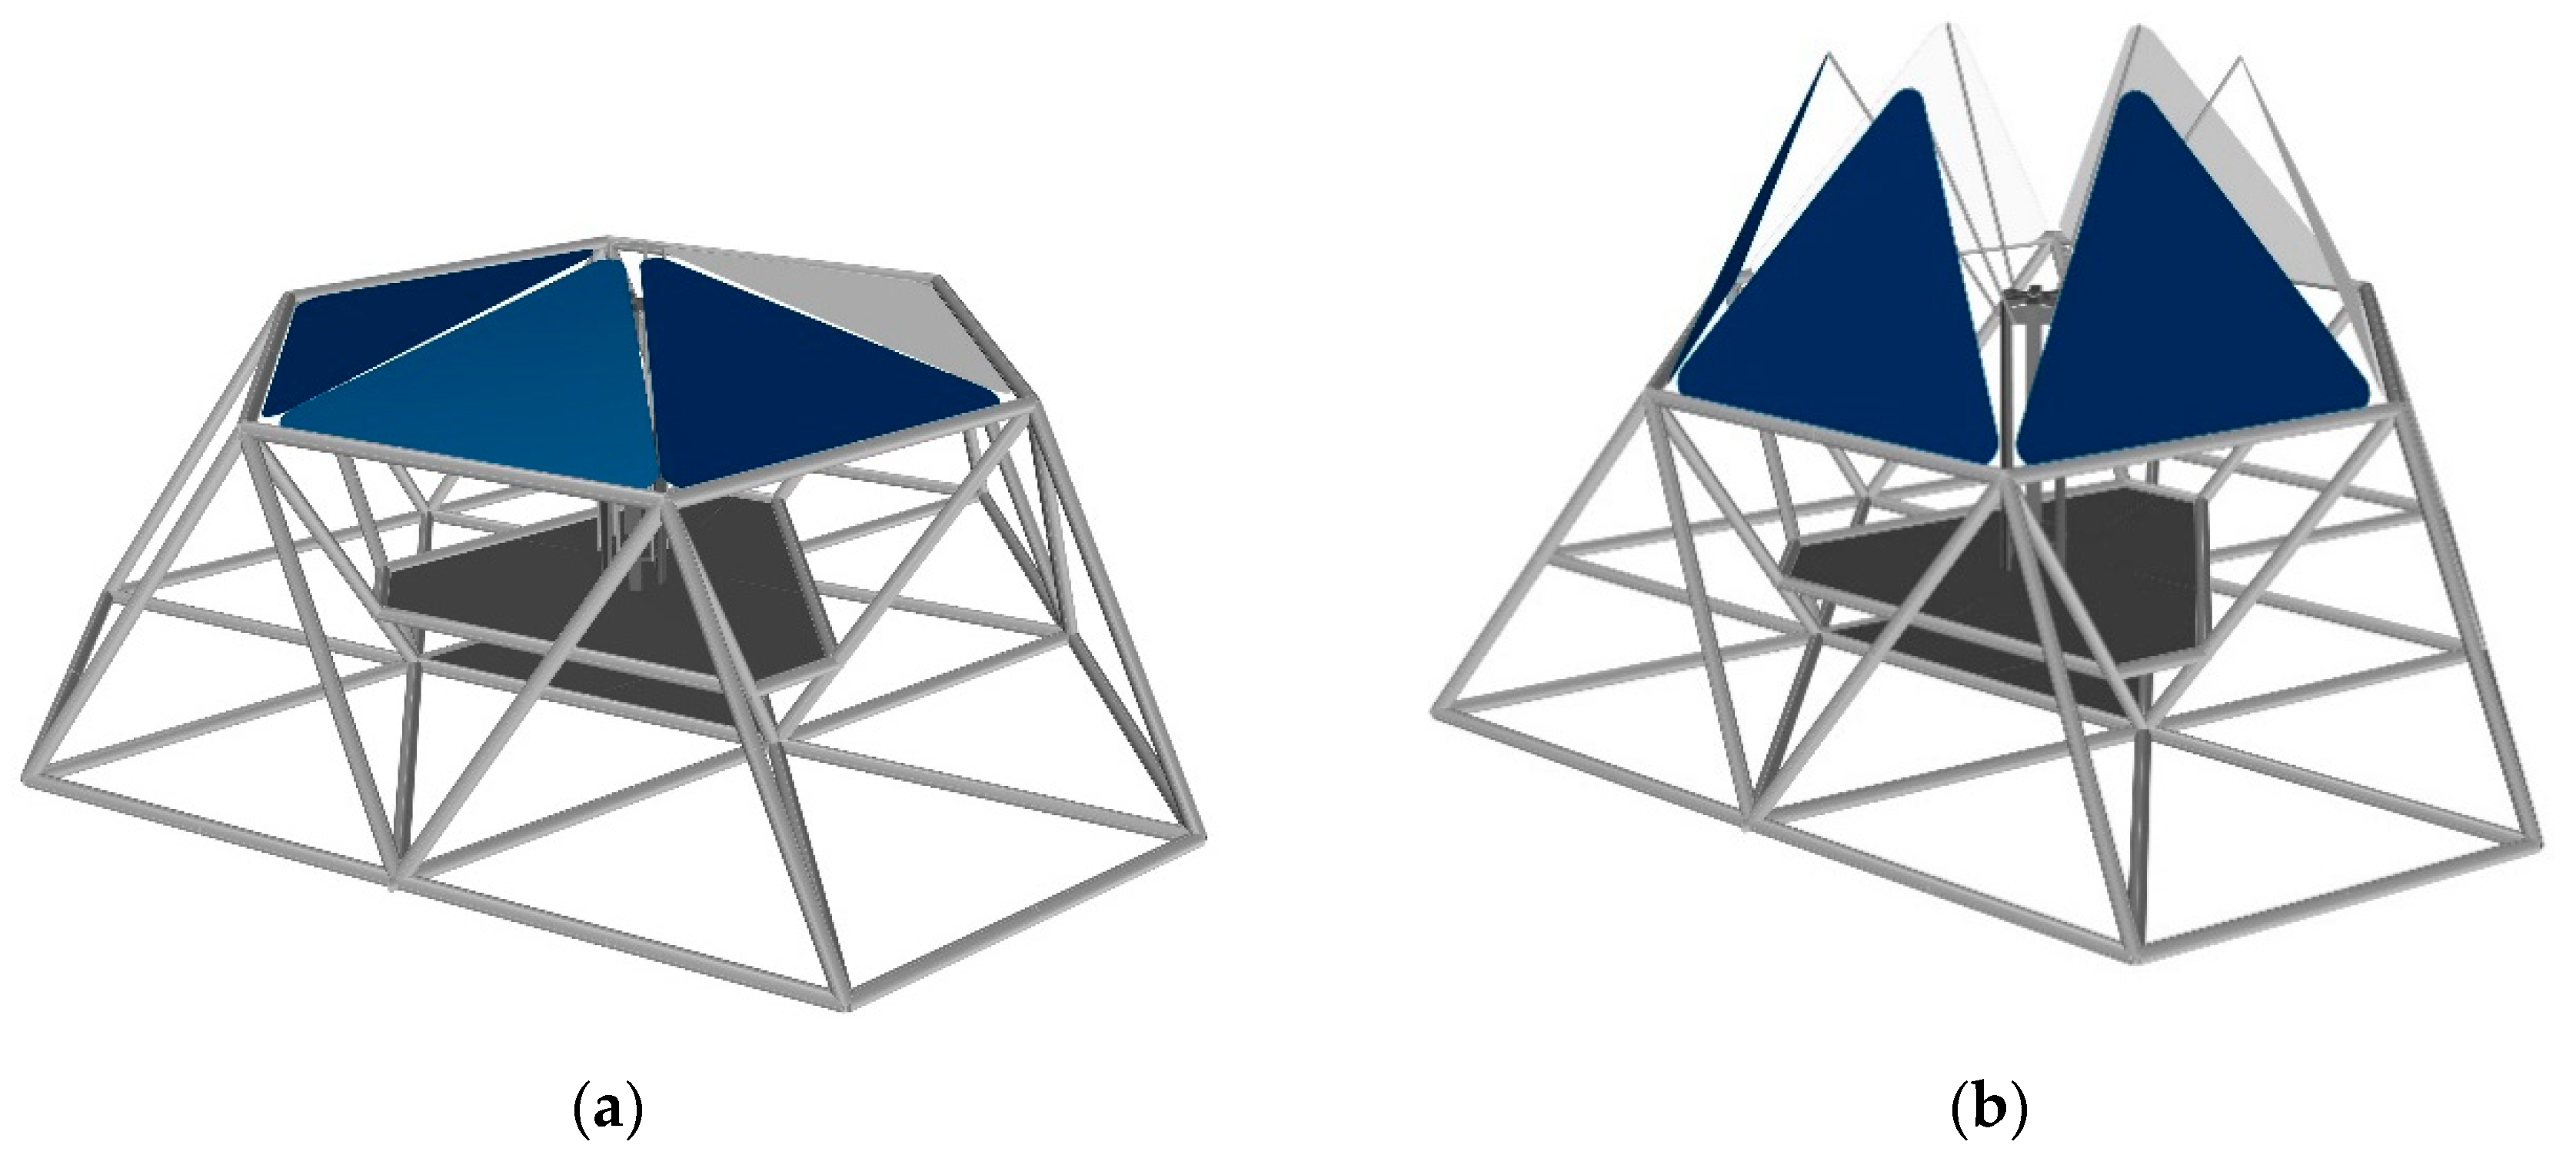
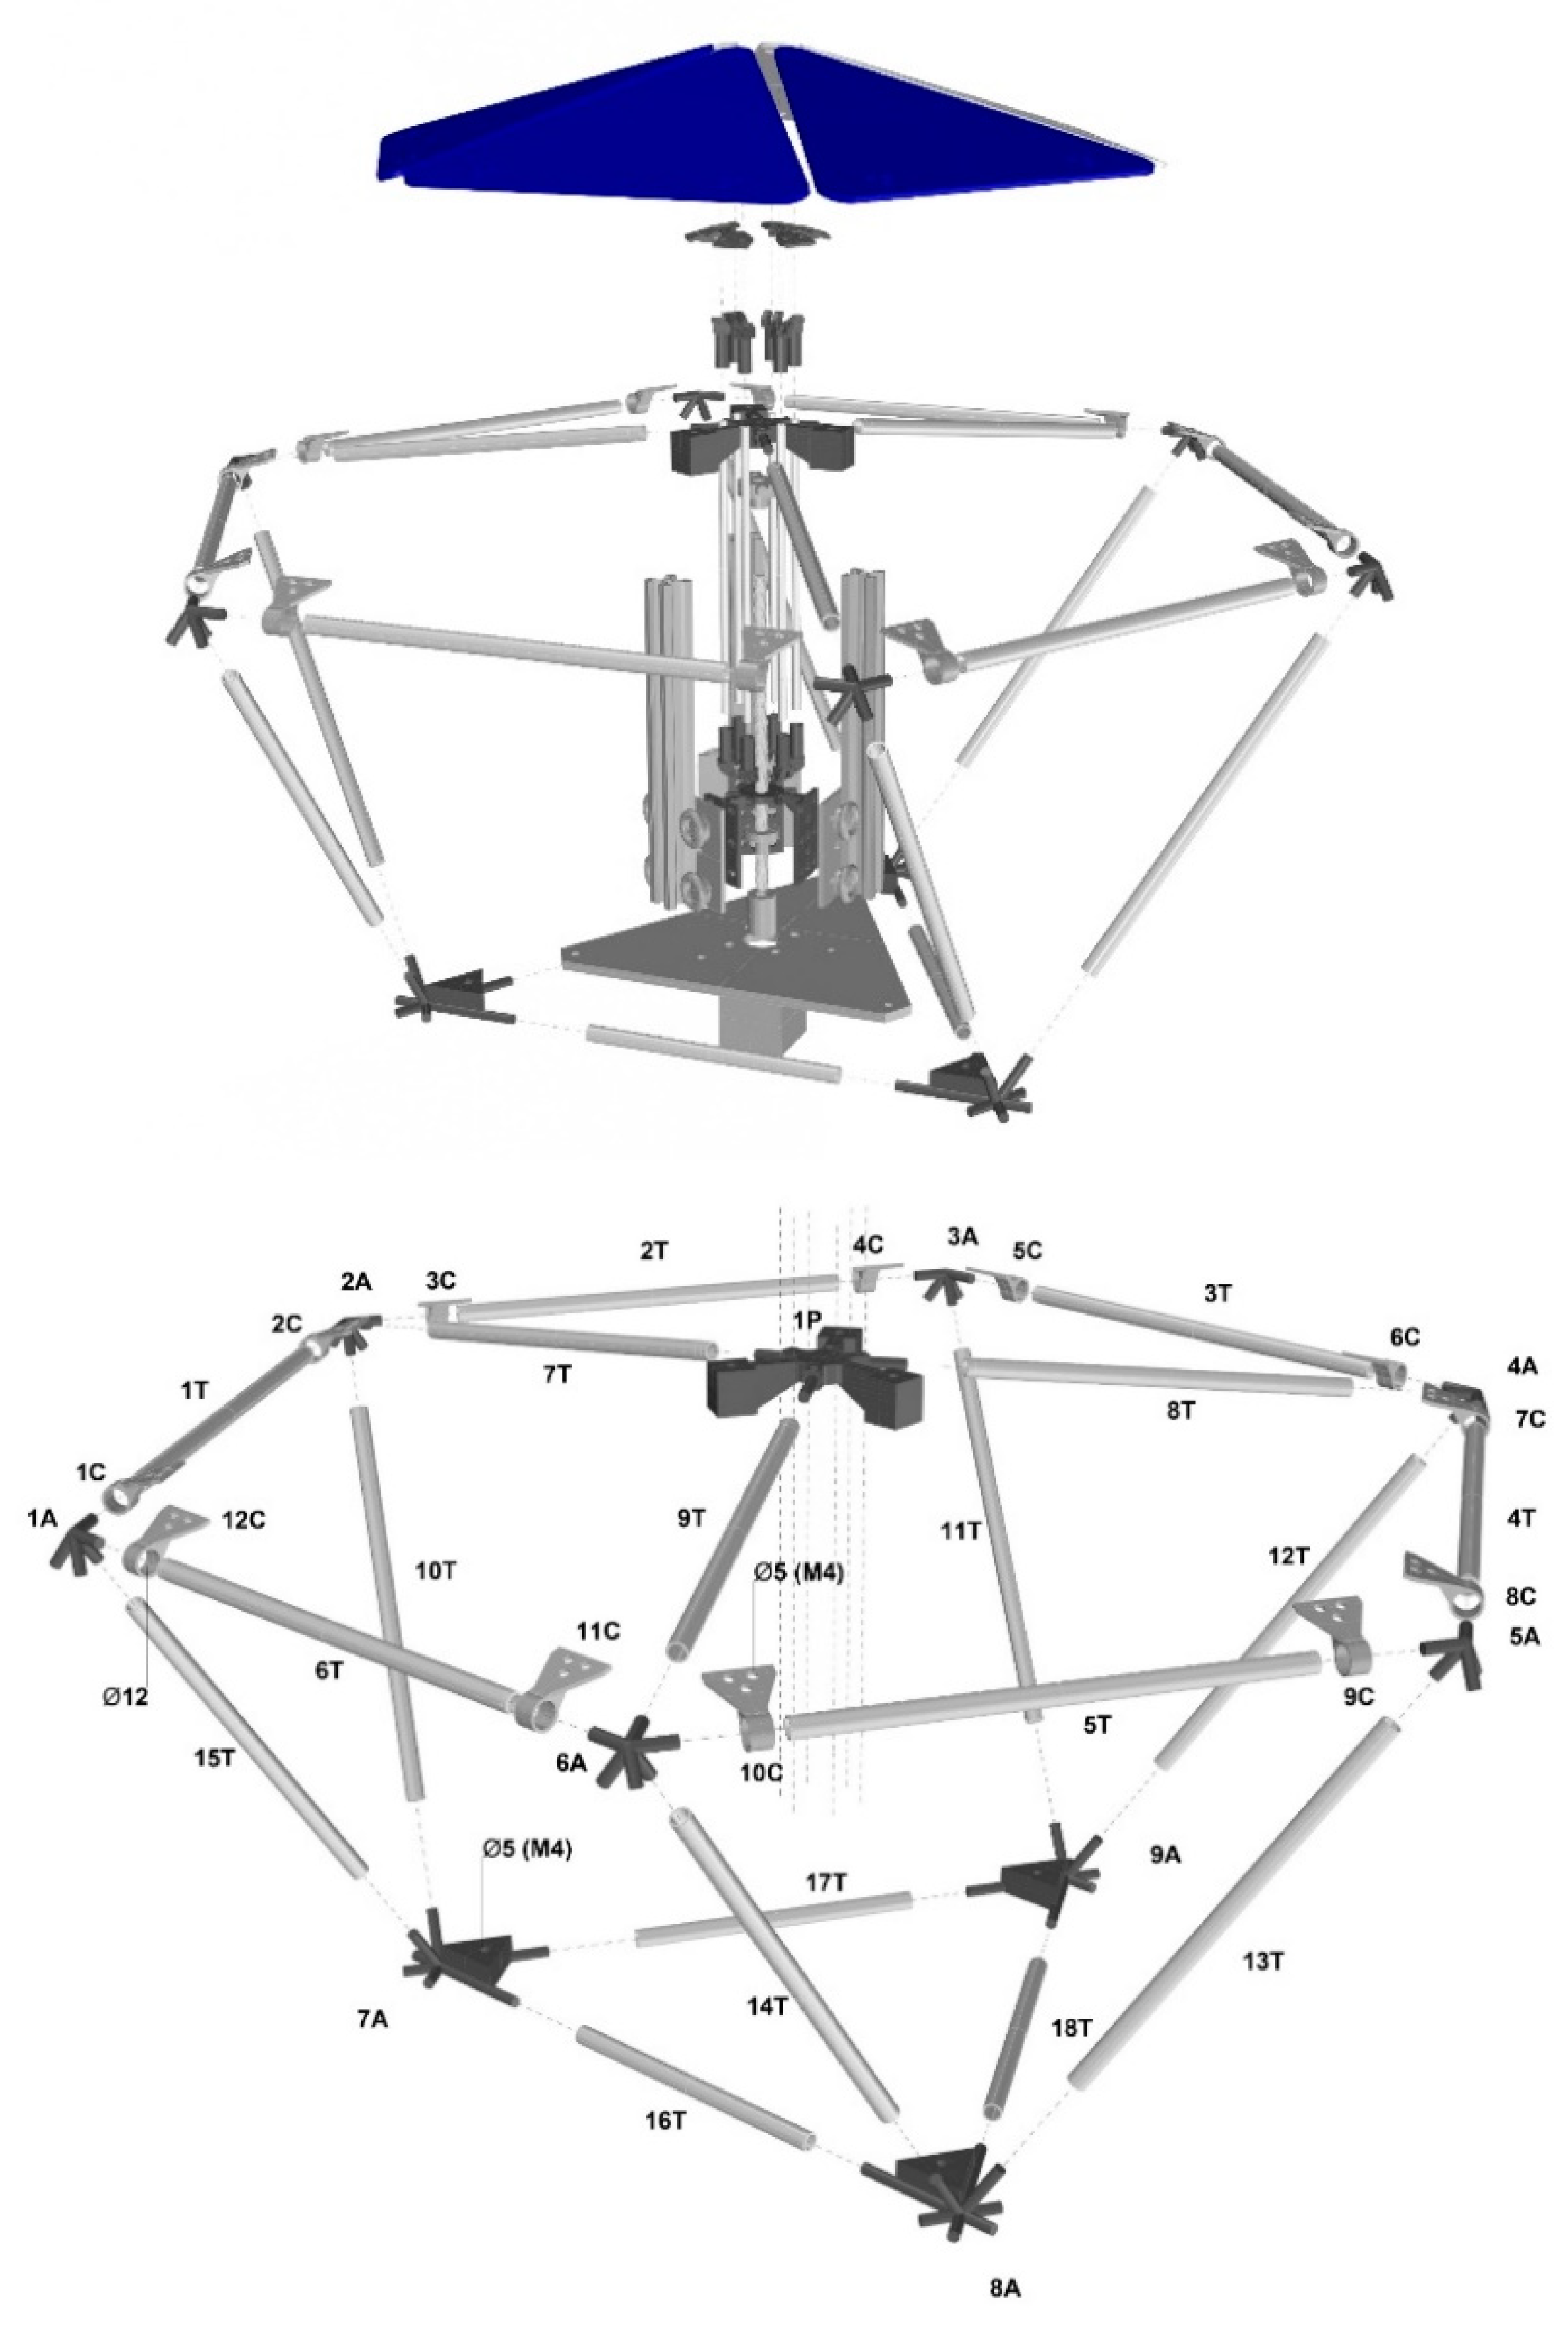
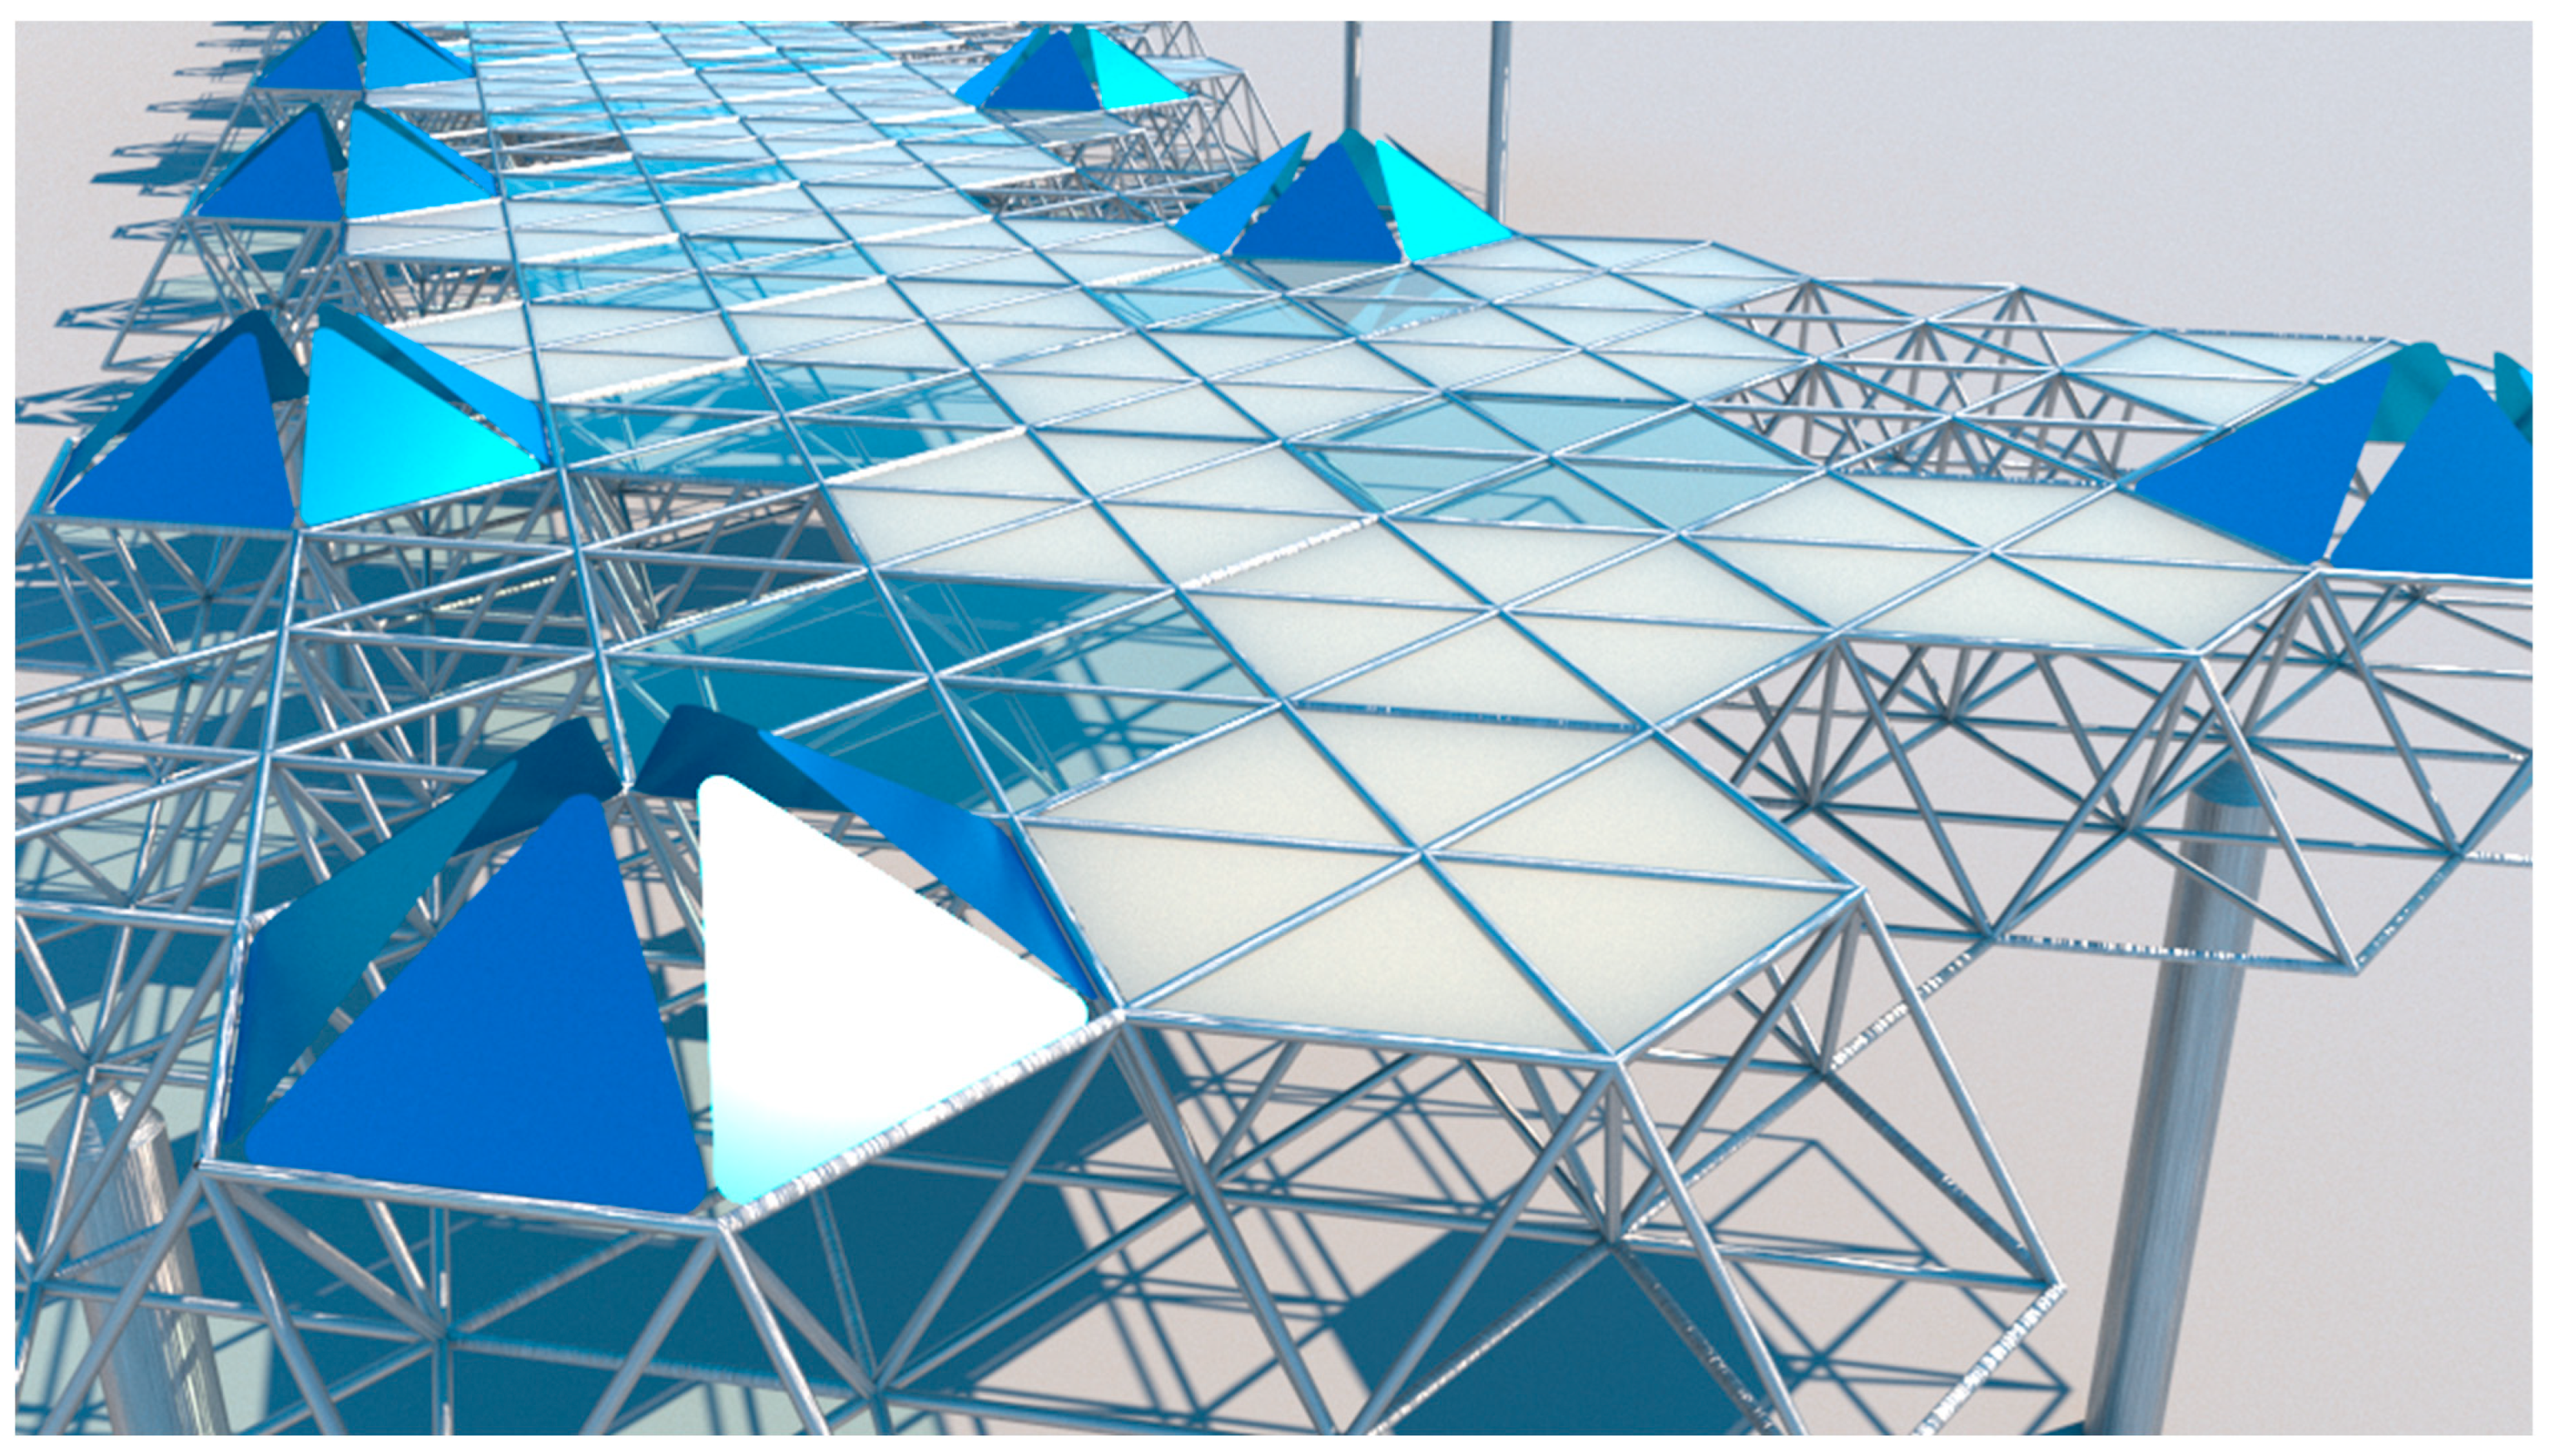
A double-layer space truss [100] is used for the definition of the structural framework that will host the solar tracker. Space trusses are, indeed, very popular for the coverage of large open areas, requiring few internal supports [101]. The modularity of its design, moreover, matches the modularity of the proposed tracking PV shading device. The PV solar tracker is configured as a 3-panel system, with South, Southeast and Southwest orientation, respectively (blue color). The other 3 panels facing North, North-East and North-West (white color) have the only function of shading and completing the design of the hexagonal module (Figure 2).
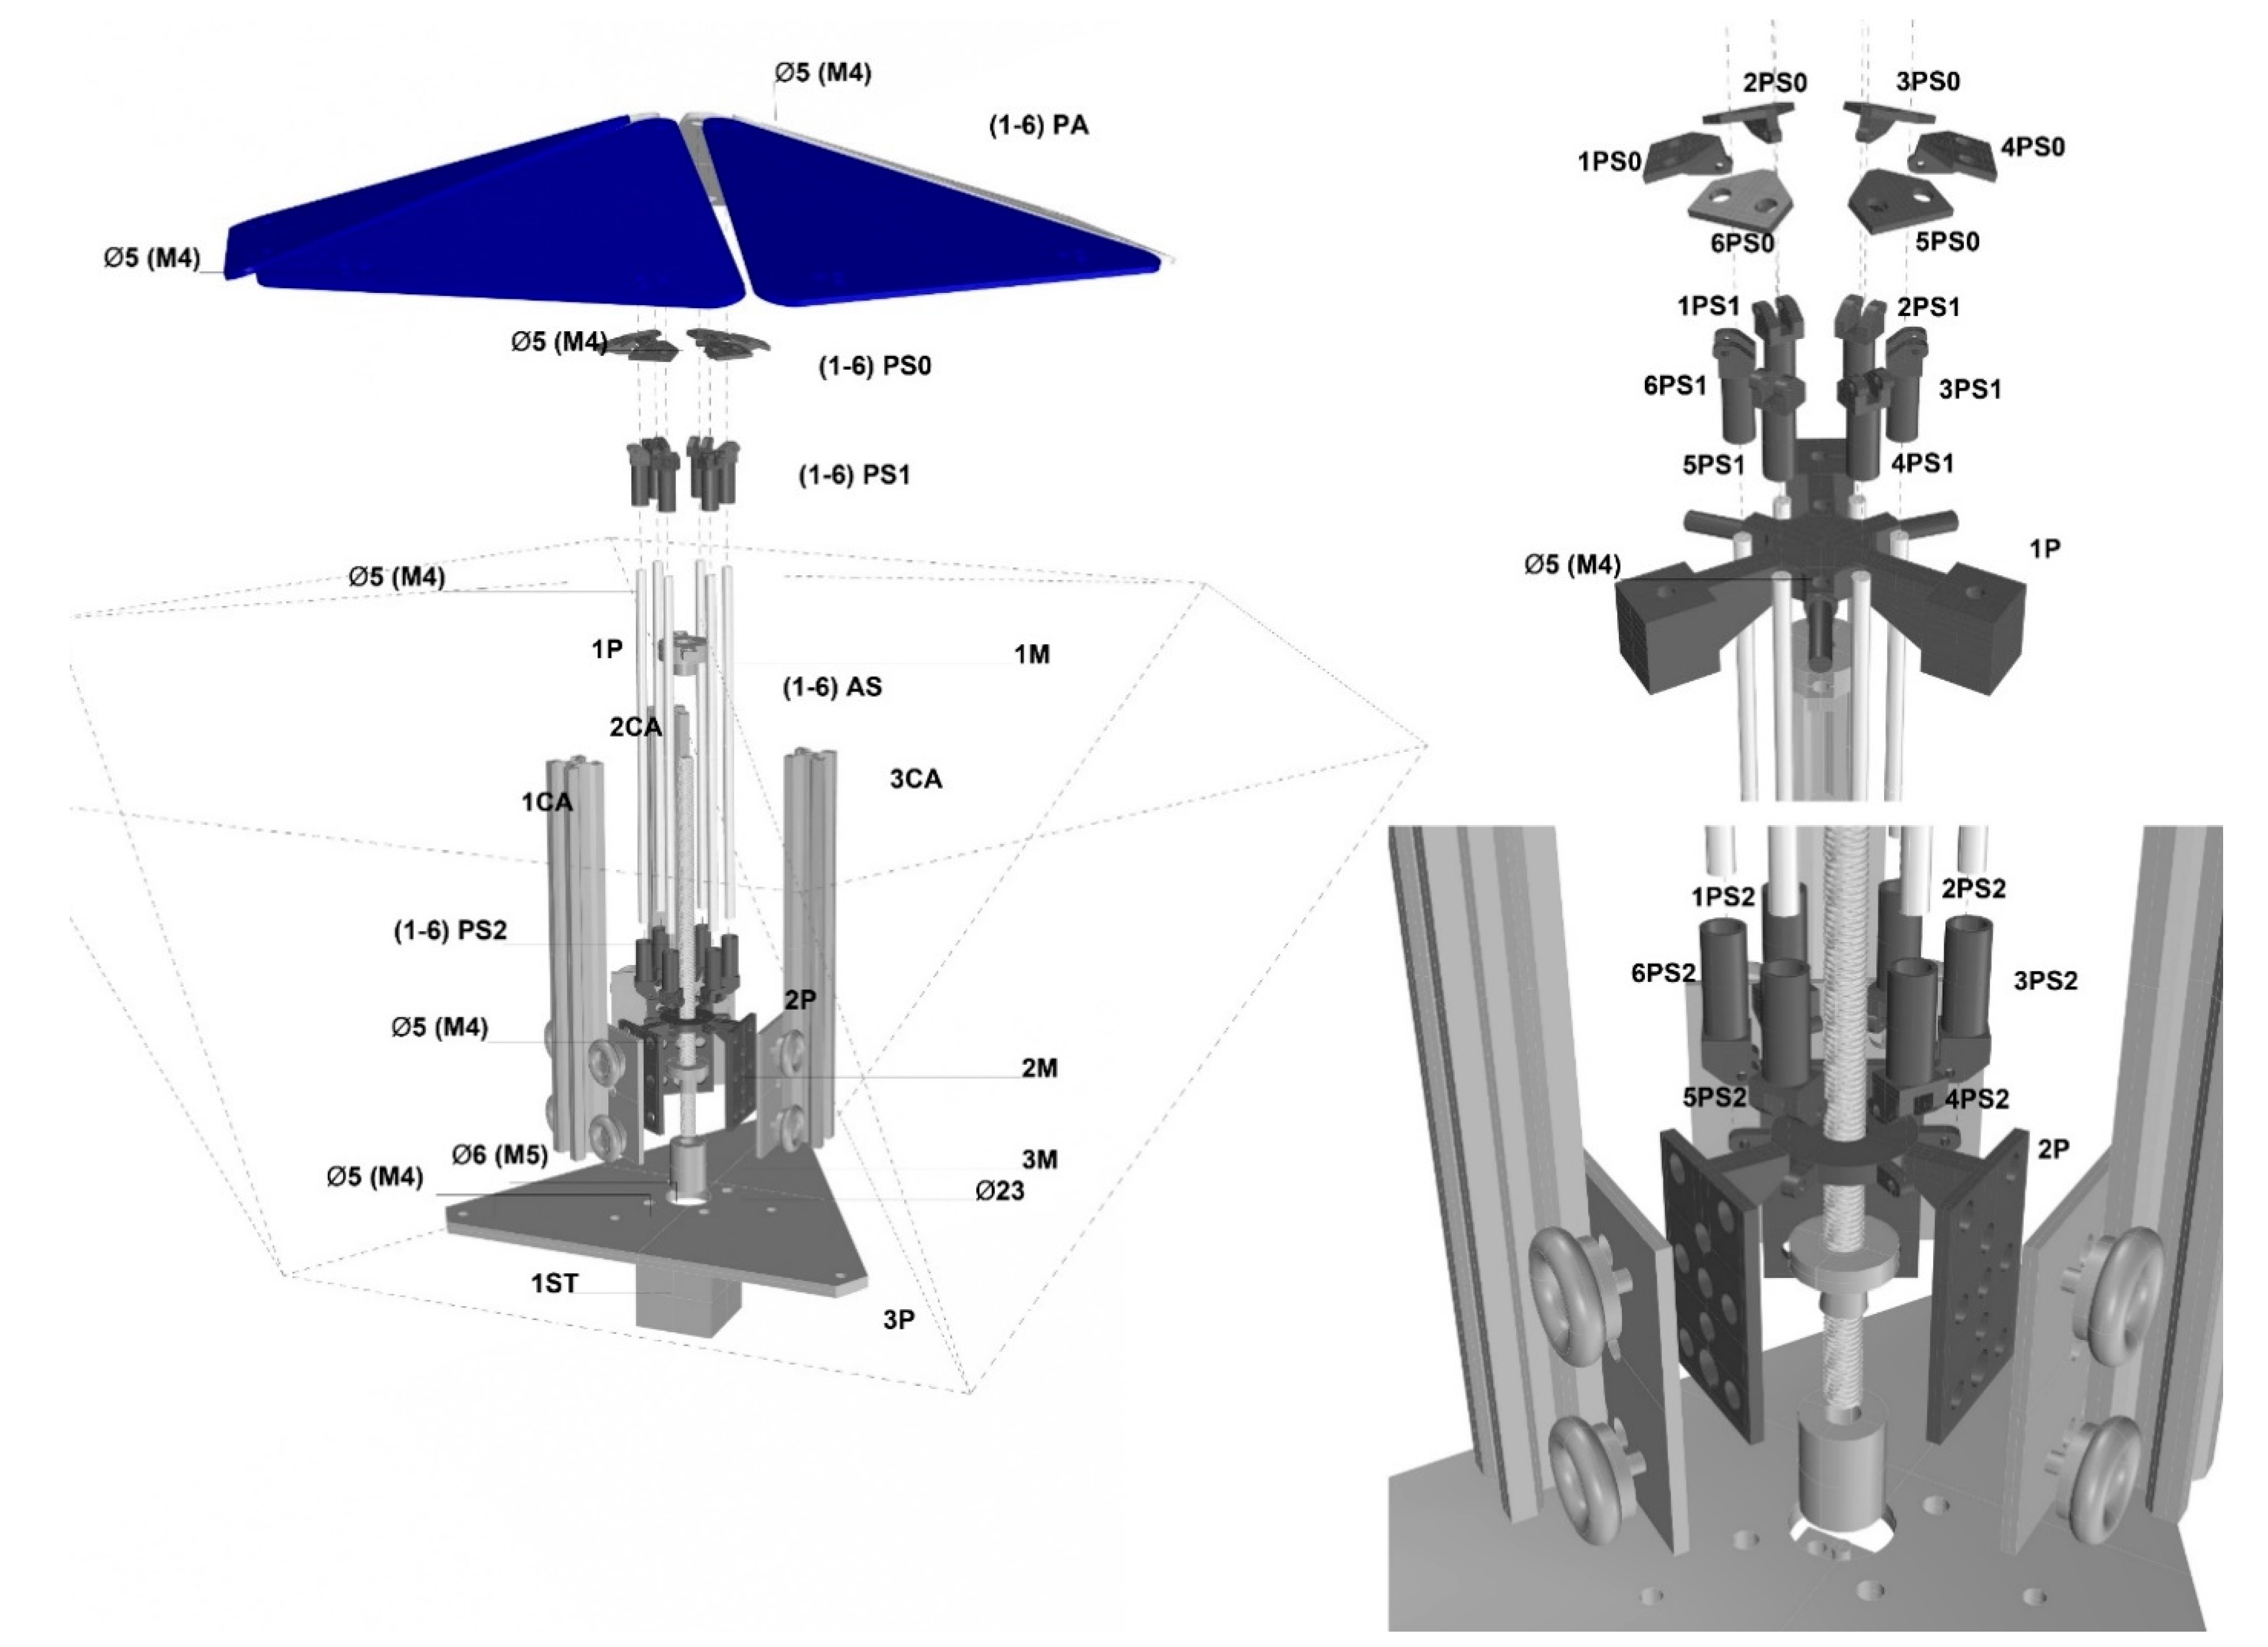
The system is set upon the double-layer truss and integrated with it. The pipes of the truss act as a hinge for each module and a common central device operates the panels simultaneously, varying the tilt angle from 10° to 70°, as shown in Figure 3.
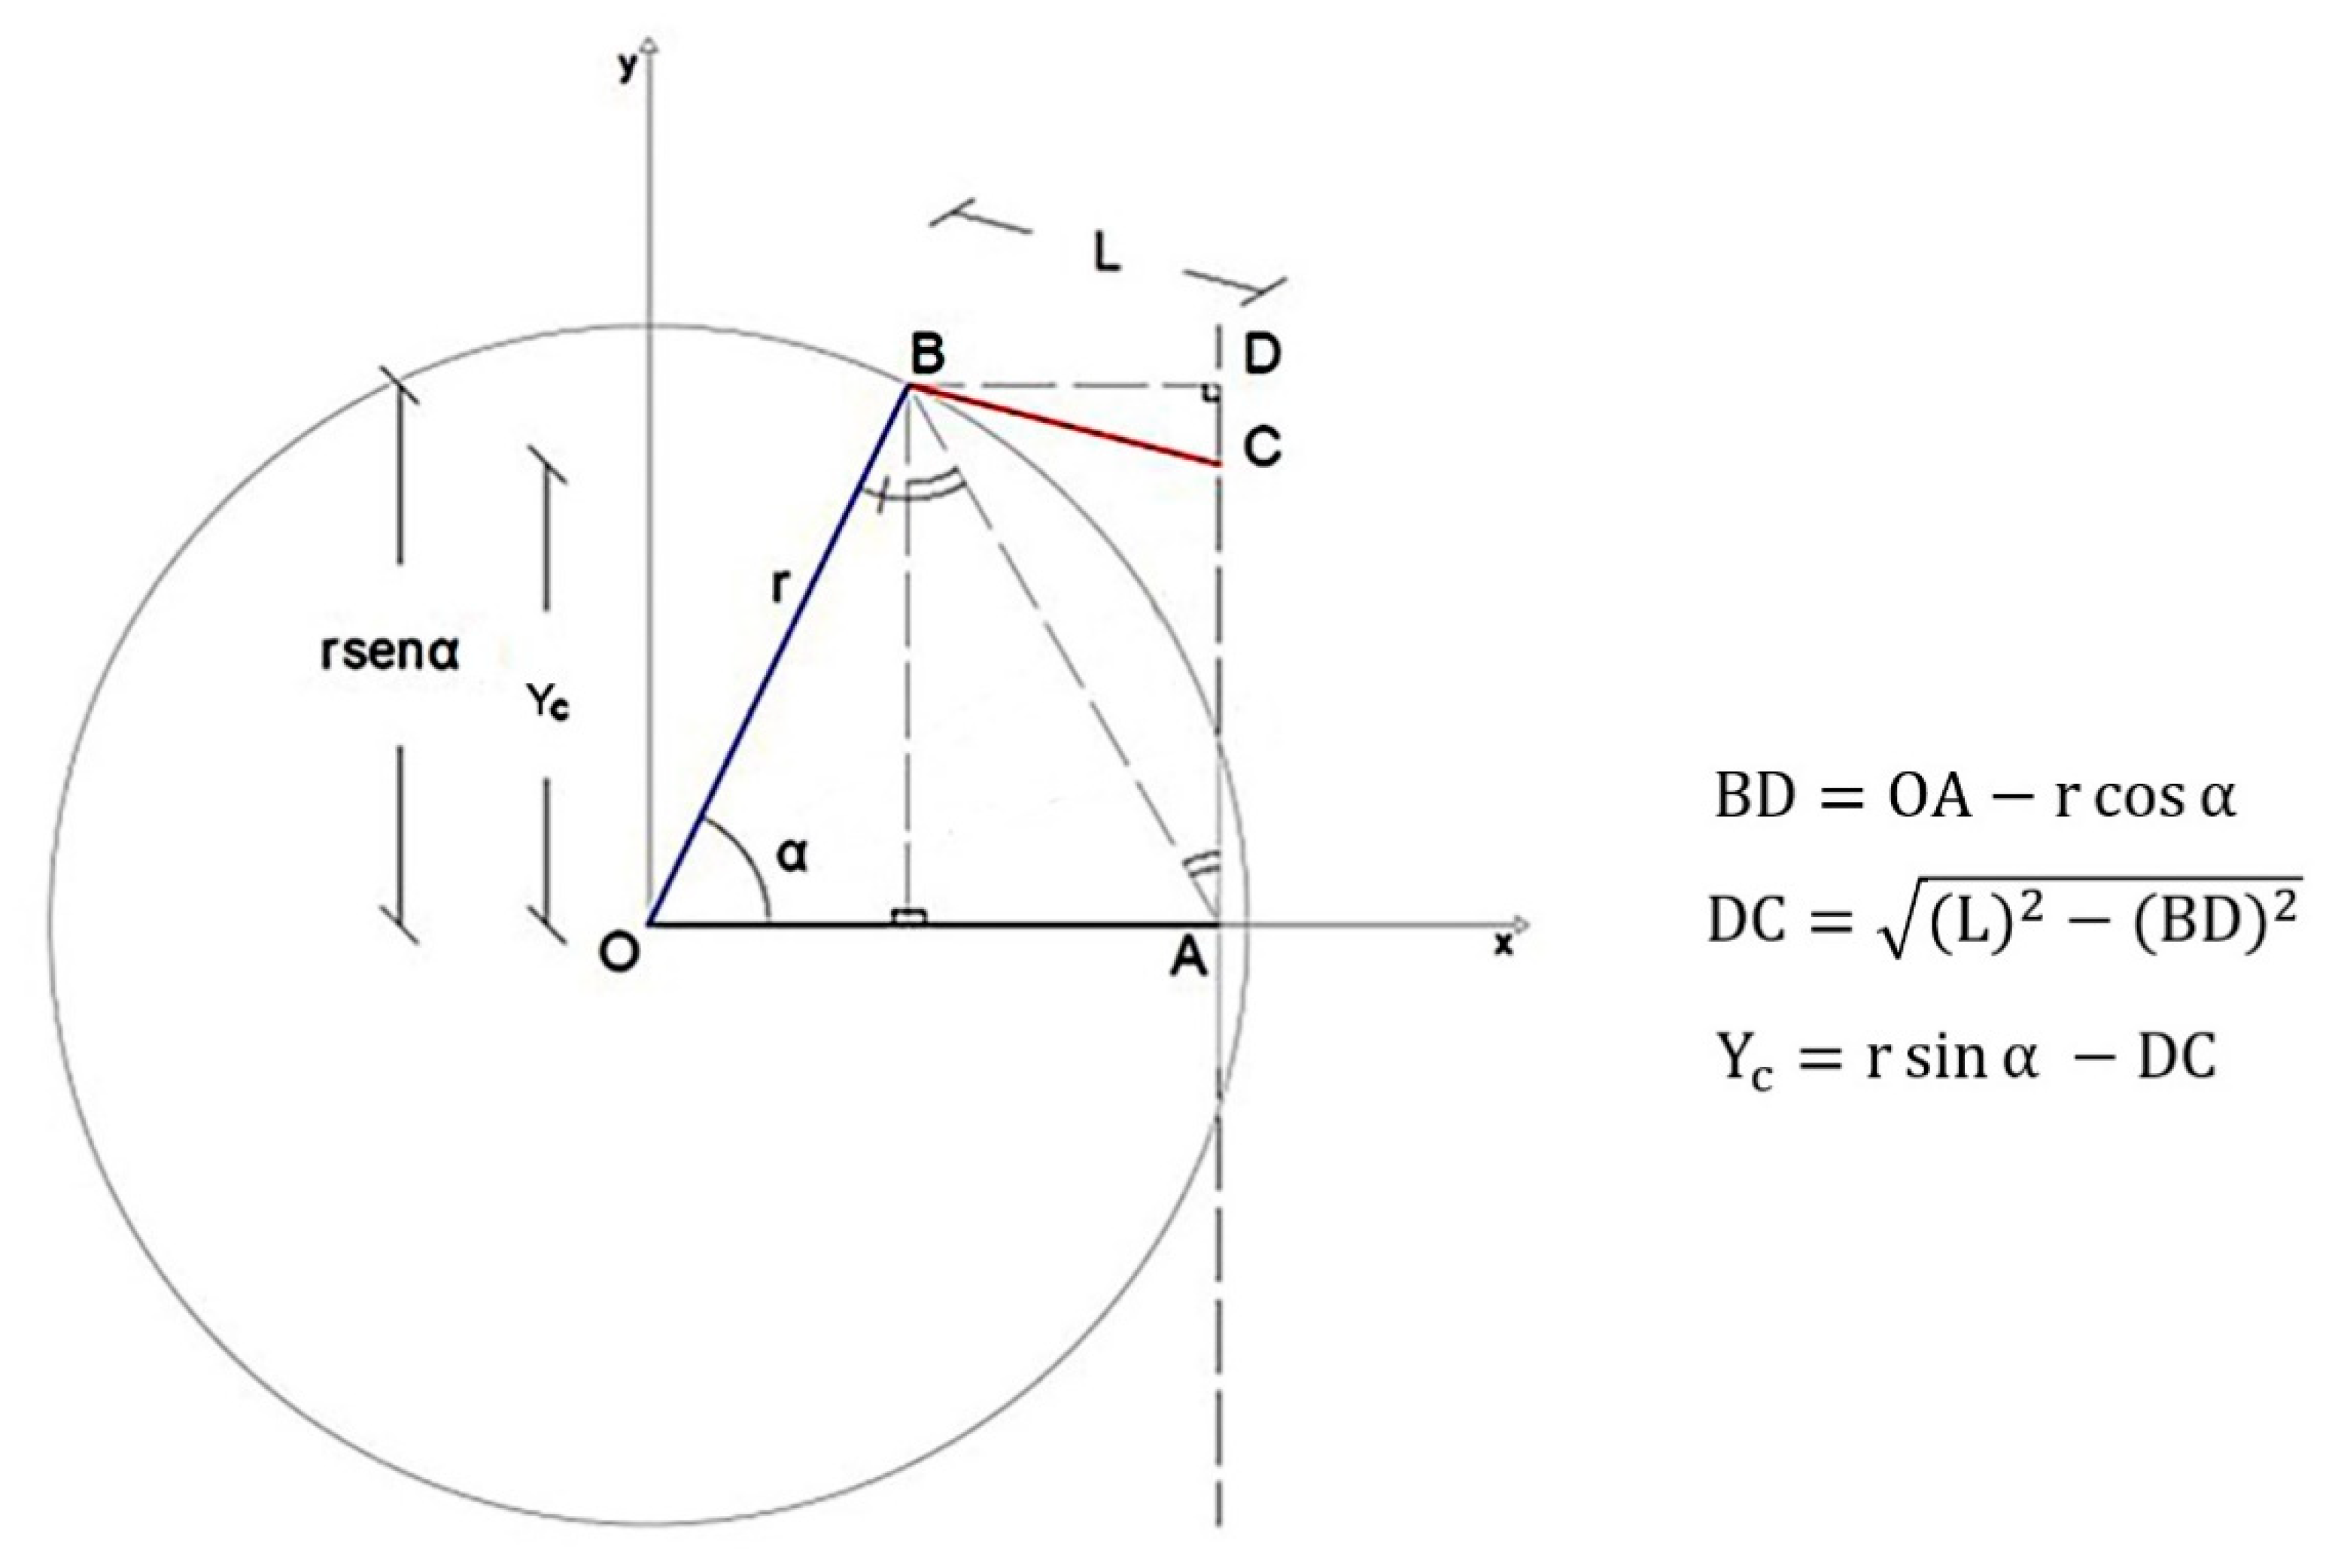
The obtained design can provide both shading and PV production in an adaptive way. In order to enable the tracking of the path of the sun, defined by the variation of the solar tilt and azimuth angles, the movement mechanism of the panels is defined similarly to the opening of the petals of a flower. Panels are rotated thanks to a system of rods connected to a central rotating threaded bar by a support ring.
The relationship between the variation of the angle α of the PV module with respect to the horizontal plane, the translation movement of the central ring Yc and the roto-translation of the intermediate rod BC is geometrically obtained, as shown in Figure 4, in order to rotate the PV panels to the best angle to collect sun direct irradiance.
Since PV panels are arranged with three distinct orientations (South, Southeast and Southwest), the system obtained by the combination of multiple hexagonal modules has to be controlled by multiple inverters [102]. The usage of three separate inverters is required to gather modules with equal orientation.
The system has been called “PhloVer”.

3.2. Climate Data

Hourly climate data used in this study are chosen to simulate the Typical Meteorological Year (TMY) of the locality, in order to provide reliable predictions in terms of PV energy generation.
TMY is a collection of selected weather data for a specific location, for example, hourly values of solar radiation and other meteorological elements for a one-year period. The values are generated from a data bank much longer than a year in duration, at least 12 years.
As shown in studies that examined the sources of uncertainty in yearly global horizontal radiation data [103], satellite measurements are the most accurate source of information for predicting PV production. For this reason, PVGIS [32,104], a tool that uses irradiance maps obtained by satellite observations and validated in numerous studies in a variety of climates [105], is chosen in this study for accurate climate-related data gathering.
TMY is generated according to ISO 15927-4 [31]. More information about the process is provided in [106]. Meteorological data are retrieved from the PVGIS-SARAH2 database. Years from 2005 to 2020 are selected for the generation of the TMY.
Climate data used for the prediction of the PV performances are the following:
  • Air temperature (°C)
  • Wind speed (m/s)
  • Direct normal irradiance (DNI) (W/m2)
  • Diffuse horizontal irradiance (DHI) (W/m2)
  • Global horizontal irradiance (GHI) (W/m2)
DNI represents the amount of solar radiation received per unit area by a surface that is always held perpendicular to the rays that come from the sun at its position in the sky dome.
DHI represents the amount of radiation received per unit area by a surface (not subject to any shadow or shade) that does not arrive on a direct path from the sun but has been scattered by the atmosphere and comes in equal measure from all directions.
GHI represents the total amount of solar radiation received from above by a horizontal surface (relative to the ground). This value is of specific interest to PV systems and includes both DNI and DHI, according to the equation:
G H I = D N I cos θ z + D H I
where   θ z is the sun zenith angle (°).
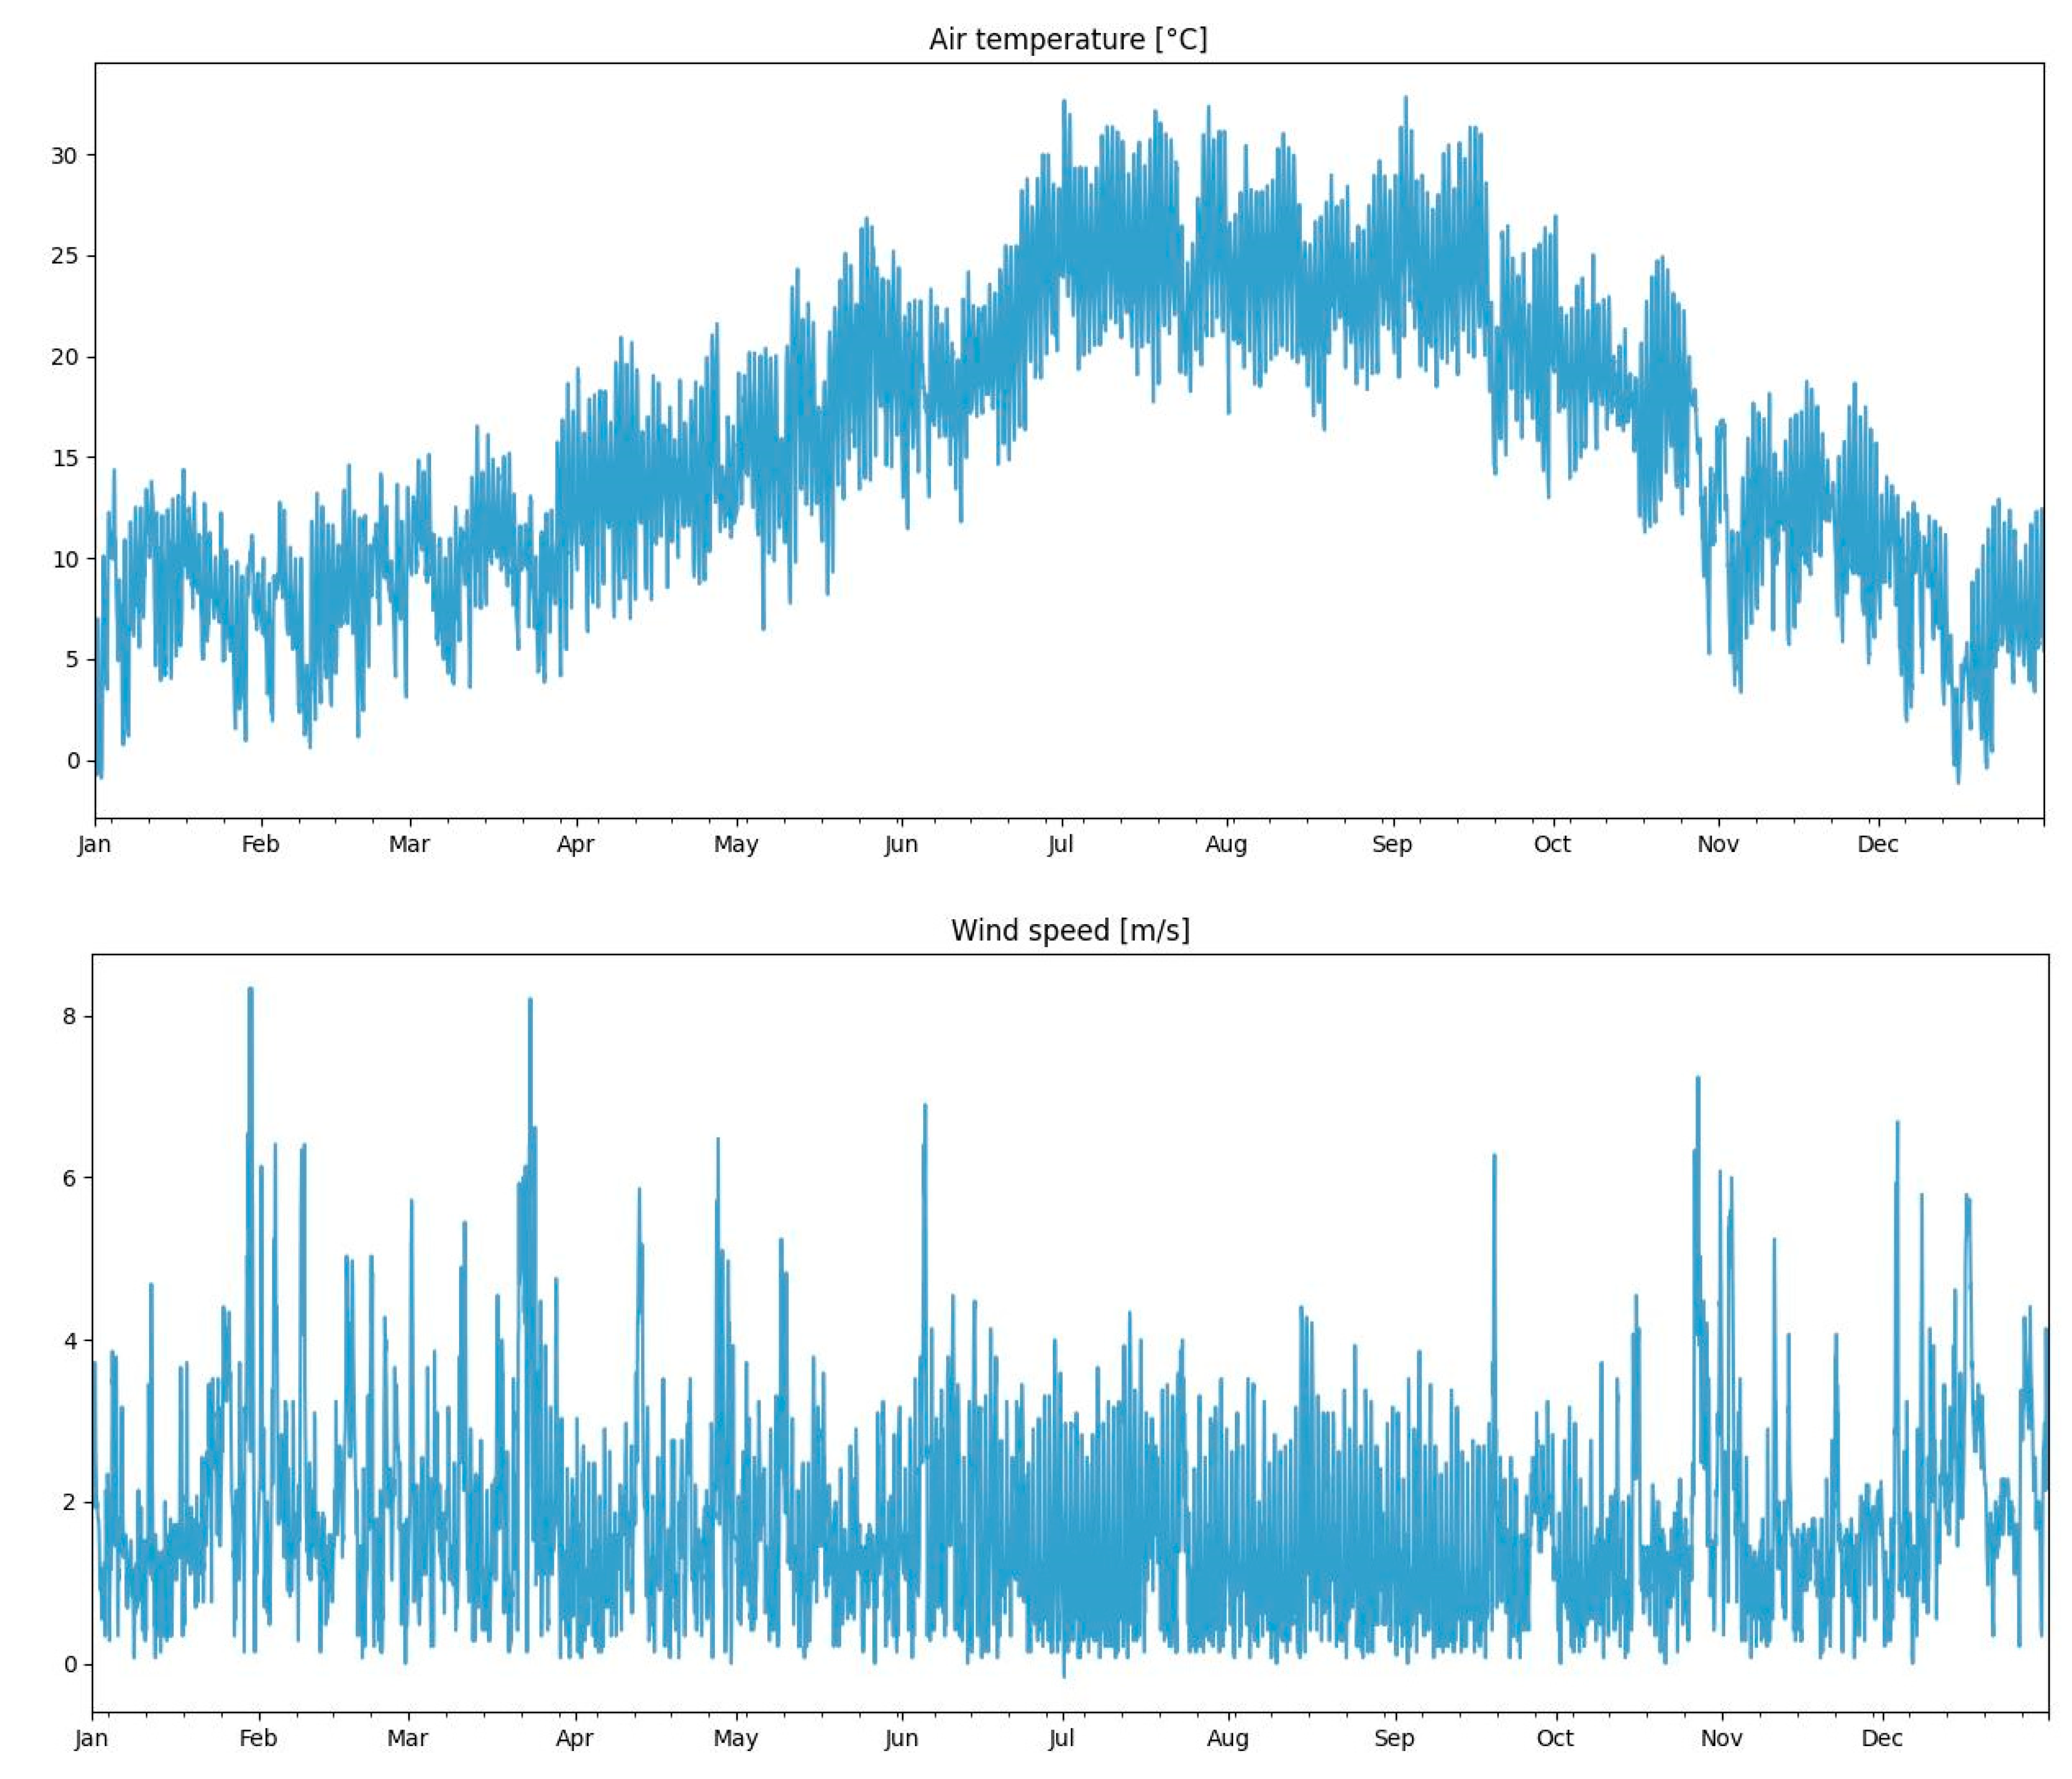
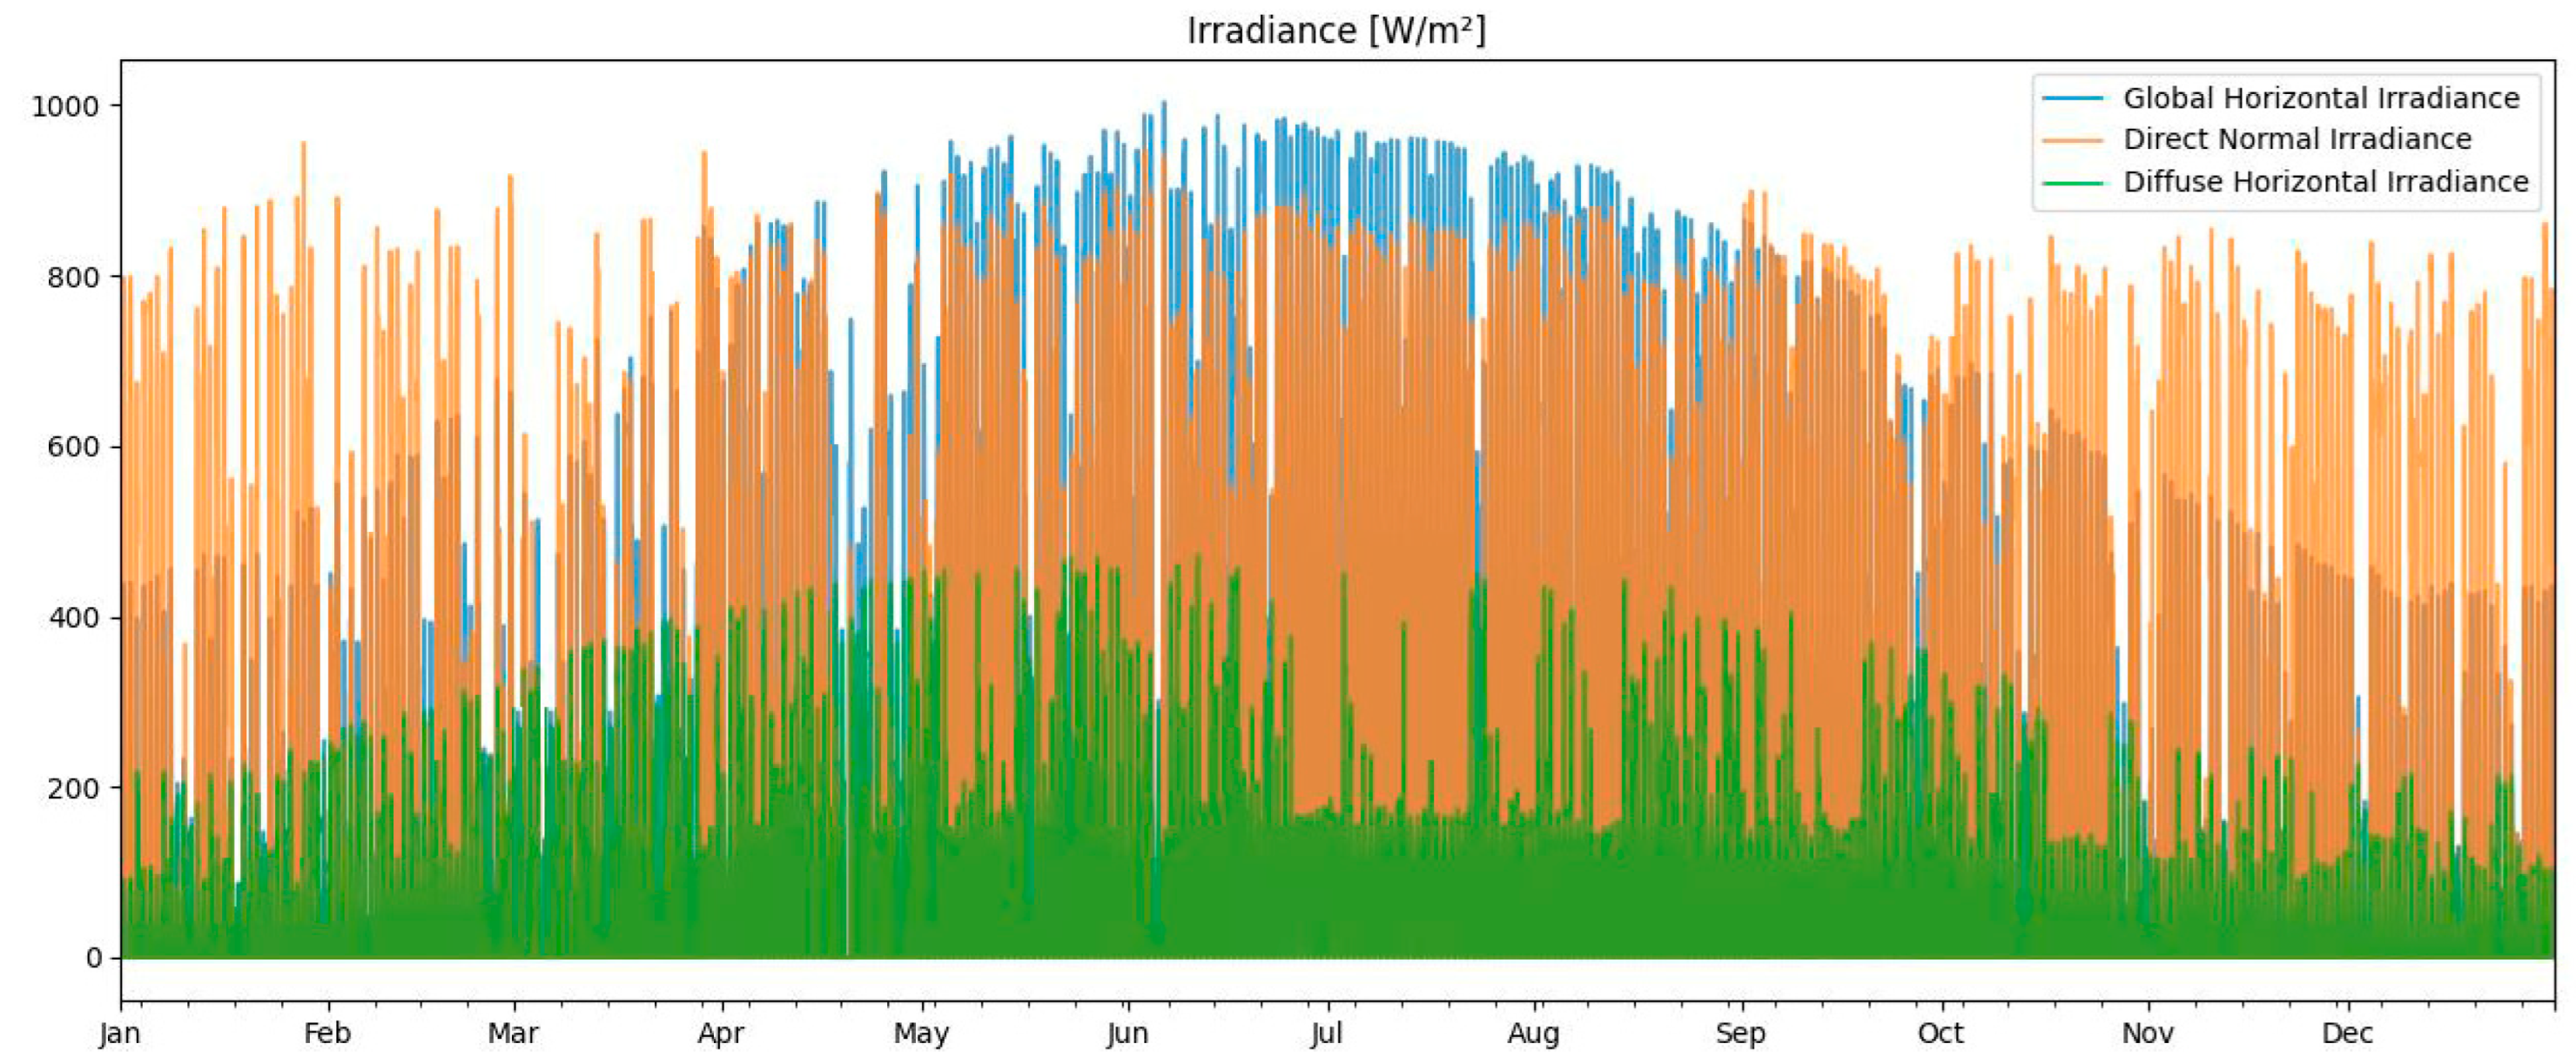
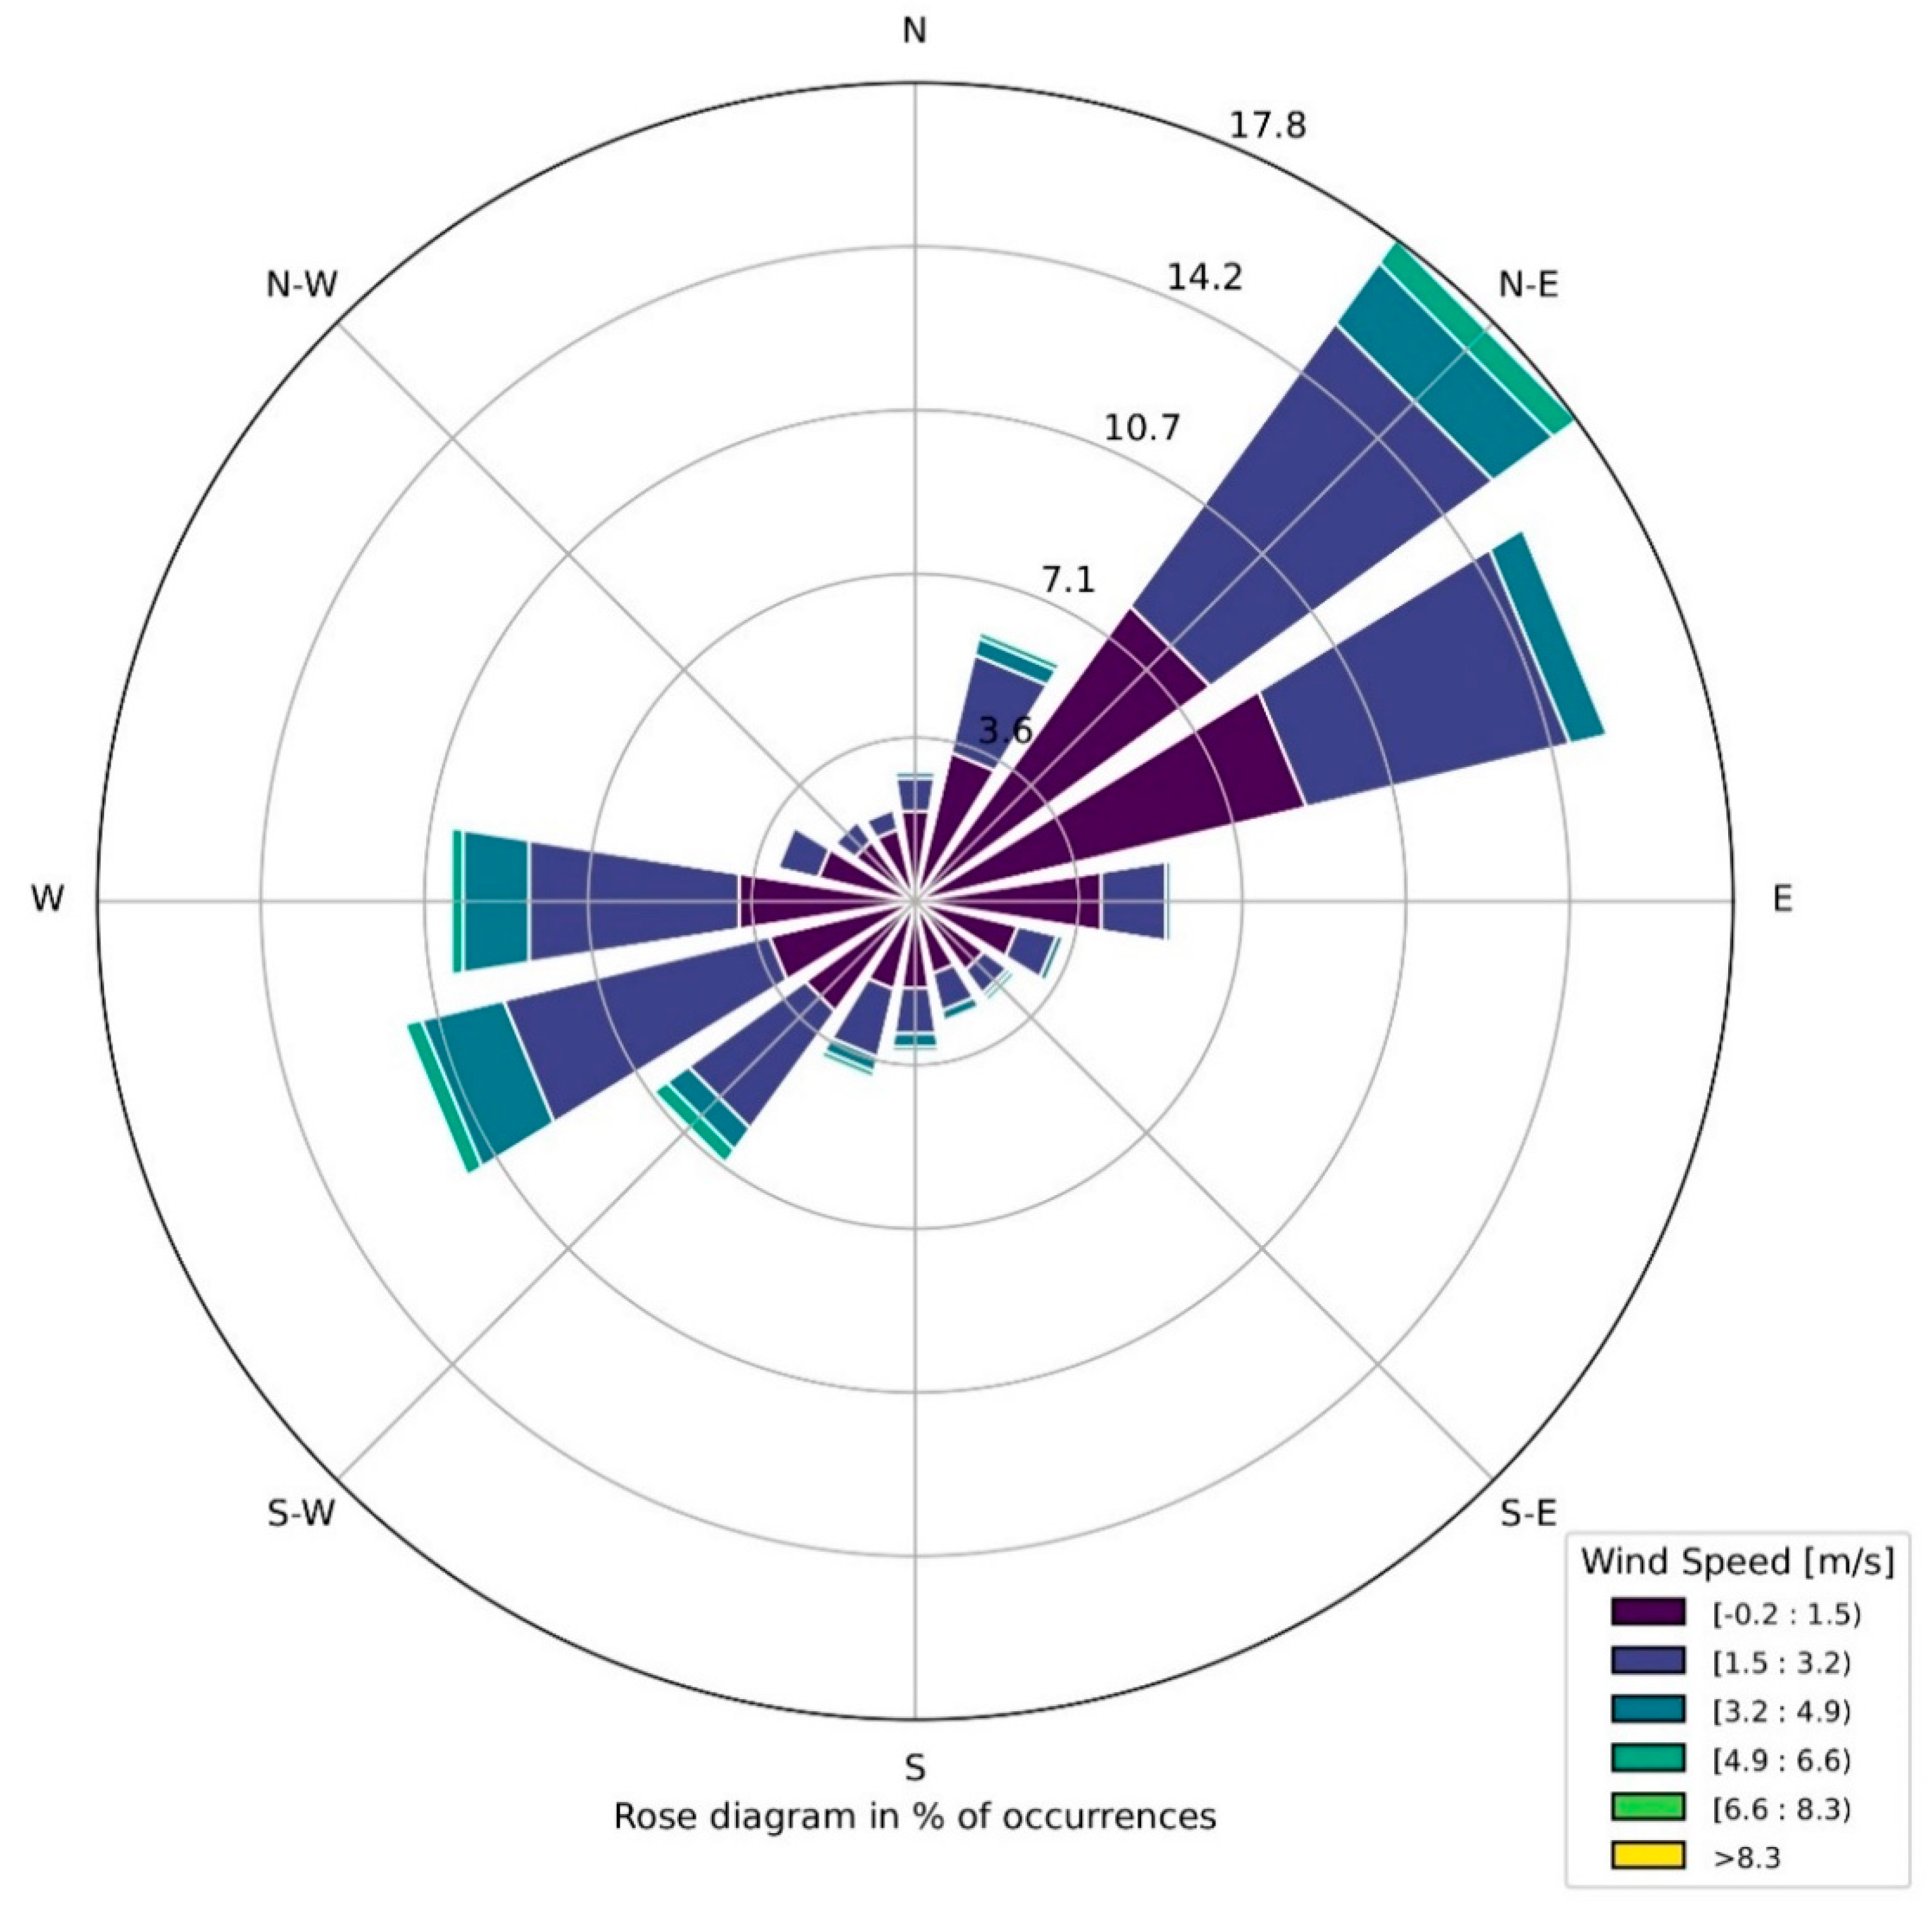
In Figure 5, hourly climate data of the generated TMY for Santa Maria Capua Vetere (Southern Italy) are displayed, as well as the wind rose diagram in Figure 6. The months selected for the creation of the TMY are January 2015, February 2015, March 2008, April 2009, May 2011, June 2020, July 2012, August 2014, September 2011, October 2012, November 2006 and December 2007.

3.3. PV Performance Simulation

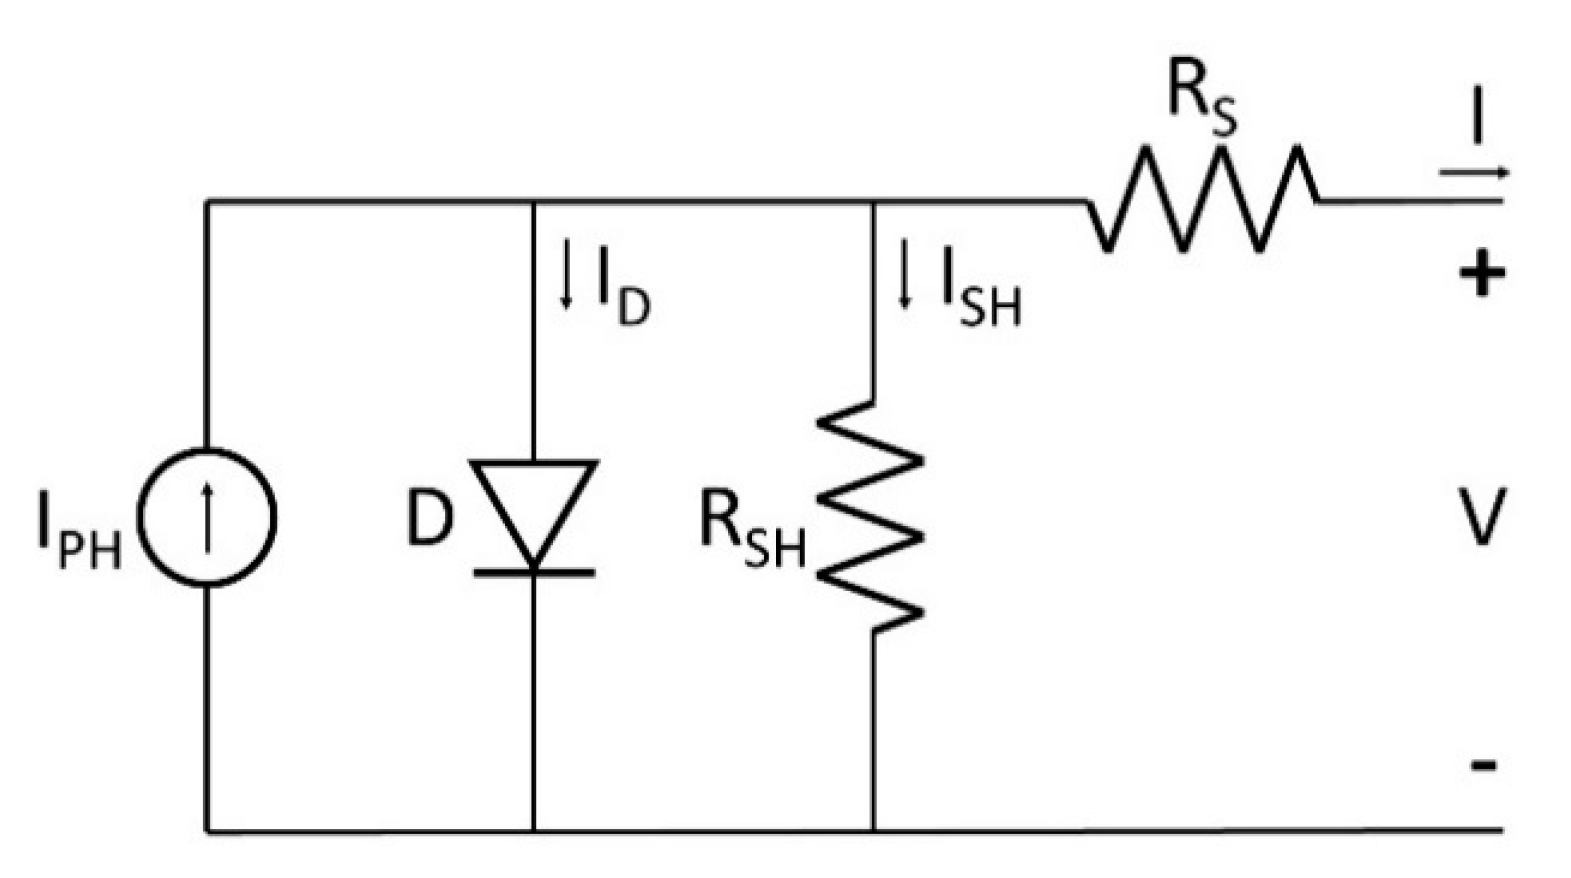
Several mathematical models exist to simulate the performance of PV systems [107] starting from the characterization of the single PV cell. PV cell characterization entails measuring the electrical properties of the cell to ascertain the critical equivalent circuit parameters and the efficiency of solar radiation conversion. The behavior of the cell is represented by the I–V (current–voltage) relationship that must be known for different operating conditions, in order to forecast the PV energy generation of a system. The most widespread approach to simulate PV performance is the single-diode model [91,108] which is based on the equivalent circuit reported in Figure 7. This model considers both losses due to series resistance (RS) that accounts for the ohmic loss at the cell’s front surface and shunt resistance (RSH) that represents the power dissipation due to the internal resistance of the PV cell caused by the diode leakage currents.
Considering the single-diode equivalent circuit reported in Figure 7, for the Kirkoff current law, it can be stated that:
I = I P H I D I S H
where,
  • I : current of the cell (A)
  • I P H : current generated by photovoltaic effect (A)
  • I D : current lost due to recombination (A)
  • I S H : current lost due to shunt resistances (A).
The current–voltage relationship of p-n junction diodes is given by the Shockley ideal diode equation:
I d i o d e = I 0 e q V D n k T 1
where,
  • I 0 : diode reverse saturation current (A)
  • q : elementary charge (1.602 × 10⁻¹⁹ C)
  • V D : diode voltage (V)
  • n : diode ideality factor
  • k : Boltzmann constant (1.381 × 10⁻²³ J/K)
  • T : temperature [K]
The terms k, T and q can be combined as follows:
k T q = V T
where V T is the thermal voltage (V).
Considering Equations (3) and (4) for our circuit, where V D = V + I R S , I D can be modeled as:
I D = I 0 e V + I R S n V T 1
where,
  • V : potential of the cell (V)
  • R S : series resistance (Ω).
Considering that V S H = V D = V + I R S , I S H can also be written as:
I S H = V + I R S R S H
where   R S H is the shunt resistance (Ω).
Considering Equations (3) and (6), Equation (2) becomes:
I = I P H I 0 e V + I R S n V T 1 V + I R S R S H
Equation (7) is the main equation to model the current–voltage (I–V) relationship of the PV cell using the single-diode equivalent circuit. I P H , I 0 , R S , R S H and n are parameters specific for each PV module.
For a PV module composed of an array of N S equal photovoltaic cells, under uniform and equal irradiance and temperature, Equation (7) becomes:
I M = I P H I 0 e V M + I M N S R S n N S V T 1 V M + I M N S R S N S R S H
where,
  • I M : current of the module (A)
  • V M : voltage of the module (V)
  • N S : number of cells in series.

3.4. I–V Parameter Extraction: 5 Parameter Model

Commercial PV modules are usually characterized by the manufacturer with electrical parameters only at standard test conditions (STCs). This information alone is not sufficient to directly characterize the performance of the module under real operating conditions. For an accurate prediction of the PV module performance, the information provided by the manufacturer is used to derive the parameters of the single-diode equation. De Soto’s model [29] describes the extraction of current–voltage (I–V) curves to analytically explain the performance of PV panels, using standardized data from manufacturer datasheets.
De Soto modifies Equation (7) by introducing the modified ideality factor a (eV), as follows:
I = I P H I 0 e V + I R S a 1 V + I R S R S H
where,
a = n N S k T C q
with T C , the cell temperature.
In this way, five parameters must be known to define the I–V relationship: I P H , I 0 , R S , R S H and a .
De Soto’s “Five-Parameter” model [29] uses Equations (11)–(15) to express these five parameters as a function of cell temperature T C and solar irradiance G :
I P H = S S r e f M M r e f I P H , r e f + α I s c T C T C , r e f
where,
  • S : total absorbed irradiance (W/m2)
  • S r e f : total absorbed irradiance at STC (W/m2)
  • M : air mass modifier
  • M r e f : air mass modifier at STC
  • I P H , r e f : photocurrent at reference conditions (A)
  • α I s c : temperature coefficient of short-circuit current (%/°C)
  • T C : temperature of the cell (K)
  • T C , r e f : temperature of the cell at reference conditions (K).
I 0 = I 0 , r e f T C T C , r e f 3 e 1 k   E g , r e f T C , r e f E g , T c T C
where,
  • I 0 , r e f : diode reverse saturation current (A)
  • E g , T c : temperature-dependent bandgap at T C (eV)
  • E g , T c , r e f : temperature-dependent bandgap at reference conditions T C , r e f (eV).
Bandgap can be referred to as the energy required to promote an electron from the valence band to the conduction band, expressed in electron volts.
R S = R S ,   r e f = c o n s t a n t
where   R S ,   r e f is the series resistance at reference conditions (Ω)
R S H = R S H , r e f G r e f G
where,
  • R S H ,   r e f : shunt resistance at reference conditions (Ω)
  • G : total irradiance on the horizontal surface (W/m2).
a a   r e f = T C T C , r e f
where a   r e f is the ideality factor at STC (eV).
In Equations (11)–(15), known parameters, which can be directly found in the manufacturer datasheet, are G r e f , T r e f and α I s c . Other unknown parameters can be obtained as follows.
E g , T c is the temperature-dependent bandgap of the cell. An empirical constant of 0.0002677 can be used to characterize silicon cells at typical operating temperature, as follows:
E g , T c = E g , T c , r e f 1 0.0002677 T C T r e f
where   E g , T c , r e f is the temperature-dependent bandgap at reference conditions (1.121 eV for silicon cells).
The ratio S S r e f in Equation (11) is evaluated as:
S S r e f = G b G r e f R b e a m K τ α , b + G d G r e f K τ α , d 1 + cos β 2 + G G r e f ρ K τ α , g 1 cos β 2
where,
  • G r e f : irradiance at STC (W/m2)
  • G b : beam component of total irradiance on the horizontal surface (W/m2)
  • G d : diffuse component of total irradiance on the horizontal surface (W/m2)
  • R b e a m : ratio of beam radiation on a tilted surface to that on a horizontal surface (W/m2)
  • K τ α , b : incidence angle modifier at beam incidence angle θ
  • K τ α , d : incidence angle modifier for the diffuse component
  • K τ α , g : incidence angle modifier for ground reflected component
  • θ : angle of incidence between the module normal vector and the sunbeam vector (°)
  • β : tilt angle of the panel (°)
  • ρ : ground albedo (in this study equal at the albedo of asphalt 0.12).
The incidence angle modifier ( K τ α , b ) is evaluated in this study with the ASHRAE method, as follows:
K τ α , b = 1 b sec θ 1
where,
  • b : constant parameter (0.05)
  • θ : angle of incidence between the module normal vector and the sunbeam vector (°).
The incidence angle modifier for diffuse K τ α , d and reflected K τ α , g components is evaluated with the Martin and Ruiz approach [94], as follows:
K τ α , d = e 1 a r c 1 sin β + π β sin β 1 + cos β + c 2 sin β + π β sin β 1 + cos β 2
K τ α , g = e 1 a r c 1 sin β + β sin β 1 cos β + c 2 sin β + β sin β 1 cos β 2
where,
  • a r : angular losses coefficient (typical value for a monocrystalline silicon module is 0.17)
  • c 1 : fitting parameter 4 3 π
  • c 2 : fitting parameter (for a r = 0.17 , c 2 = 0.069 ).
The ratio M M r e f in Equation (11) is evaluated as:
M M r e f = i = 0 4 a i A M i
AM is the air mass and it is evaluated as proposed by [92], as follows:
A M = 1 cos θ z + 0.5057 96.080 θ z 1.634
where,
  • θ z : zenith angle
  • a 0 , a 1 , a 2 , a 3 , a 4 : constants available for different PV cell types from Sandia National Laboratories [109].
The five unknown parameters in Equations (11)–(15), n   r e f , R S ,   r e f , I P H , r e f , I 0 , r e f and R S H , r e f , can be found using open-circuit voltage ( V O C ,   r e f ); short-circuit current ( I S C ,   r e f ); voltage ( V M P ,   r e f ) and current ( I M P ,   r e f ) at maximum power and the absolute temperature coefficient of the open-circuit voltage ( β V o c ), with the five equations reported by De Soto in [29], and here not proposed for brevity.

3.5. Module Temperature Modeling

The module temperature in operative conditions is evaluated from ambient air temperature, incident irradiance on the plane of array (POA) and wind speed by using the Faiman [30] model. The Faiman module temperature model is derived from the Hottel–Whillier–Bliss equation for flat-plate solar–thermal collectors [110] by introducing two coefficients fitted by Faiman using measured data.
The model can be expressed as follows:
T C = T a + E P O A U 0 + U 1 W S
where,
  • T C : cell temperature (K)
  • T a : ambient air temperature (K)
  • E P O A : incident irradiance on the plane of array (W/m2)
  • U 0 : constant heat transfer component (W/(m2K))
  • U 1 : convective heat transfer component (Ws/(m3K))
  • W S : wind speed (m/s).
The values of U 0 and U 1 were fitted by Faiman based on empirical measurements of irradiance, module temperature and wind speed on seven different PV module types ( U 0 = 25 W/m2K, U 1 = 6.84 Ws/(m3K)). Temperature differences between PV cells of the same module are considered negligible. Module temperature is therefore equal to cell temperature T C .

3.6. DC/AC Inverter Model

A DC/AC inverter with maximum power point tracking (MPPT) technology [111] is considered. MPPT is a technique, based on an optimization algorithm, that allows to get the most power from a PV array [112]. The DC/AC inverter is simulated using the PVWatts inverter model, provided by the National Renewable Energy Laboratory (NREL) of the U.S. Department of Energy. The model calculates inverter efficiency ( η ) as a function of the direct current (DC) power ( P D C ) as follows:
η = η n o m η r e f 0.0162   ζ 0.0059 ζ + 0.9858
where,
  • η n o m : nominal inverter efficiency
  • η r e f : reference inverter efficiency (0.9637)
  • and
ζ = P D C P D C 0
where,
  • P D C : DC power (W)
  • P D C 0 : DC power limit of the inverter (W)
  • and
P D C 0 = P A C 0 η n o m
where   P A C 0 is the AC power limit of the inverter (W).
The output alternate current (AC) power ( P A C ) of the inverter is defined as:
P A C = η P D C           i f   P A C < P A C 0   P A C 0           i f   P A C   P A C 0
DC power limit and nominal efficiency of the inverters employed in this study are equal to 11,000 W and 0.961, respectively.

3.7. PV Module Parameters

The triangular PV module employed in this study is composed of 36 monocrystalline silicon PV cells of 3.33 Wp. Each module has, therefore, a maximum power of 120 Wp. PV module is modeled starting from declared manufacturer parameters at STC. The parameters utilized in the simulation are reported in Table 1.
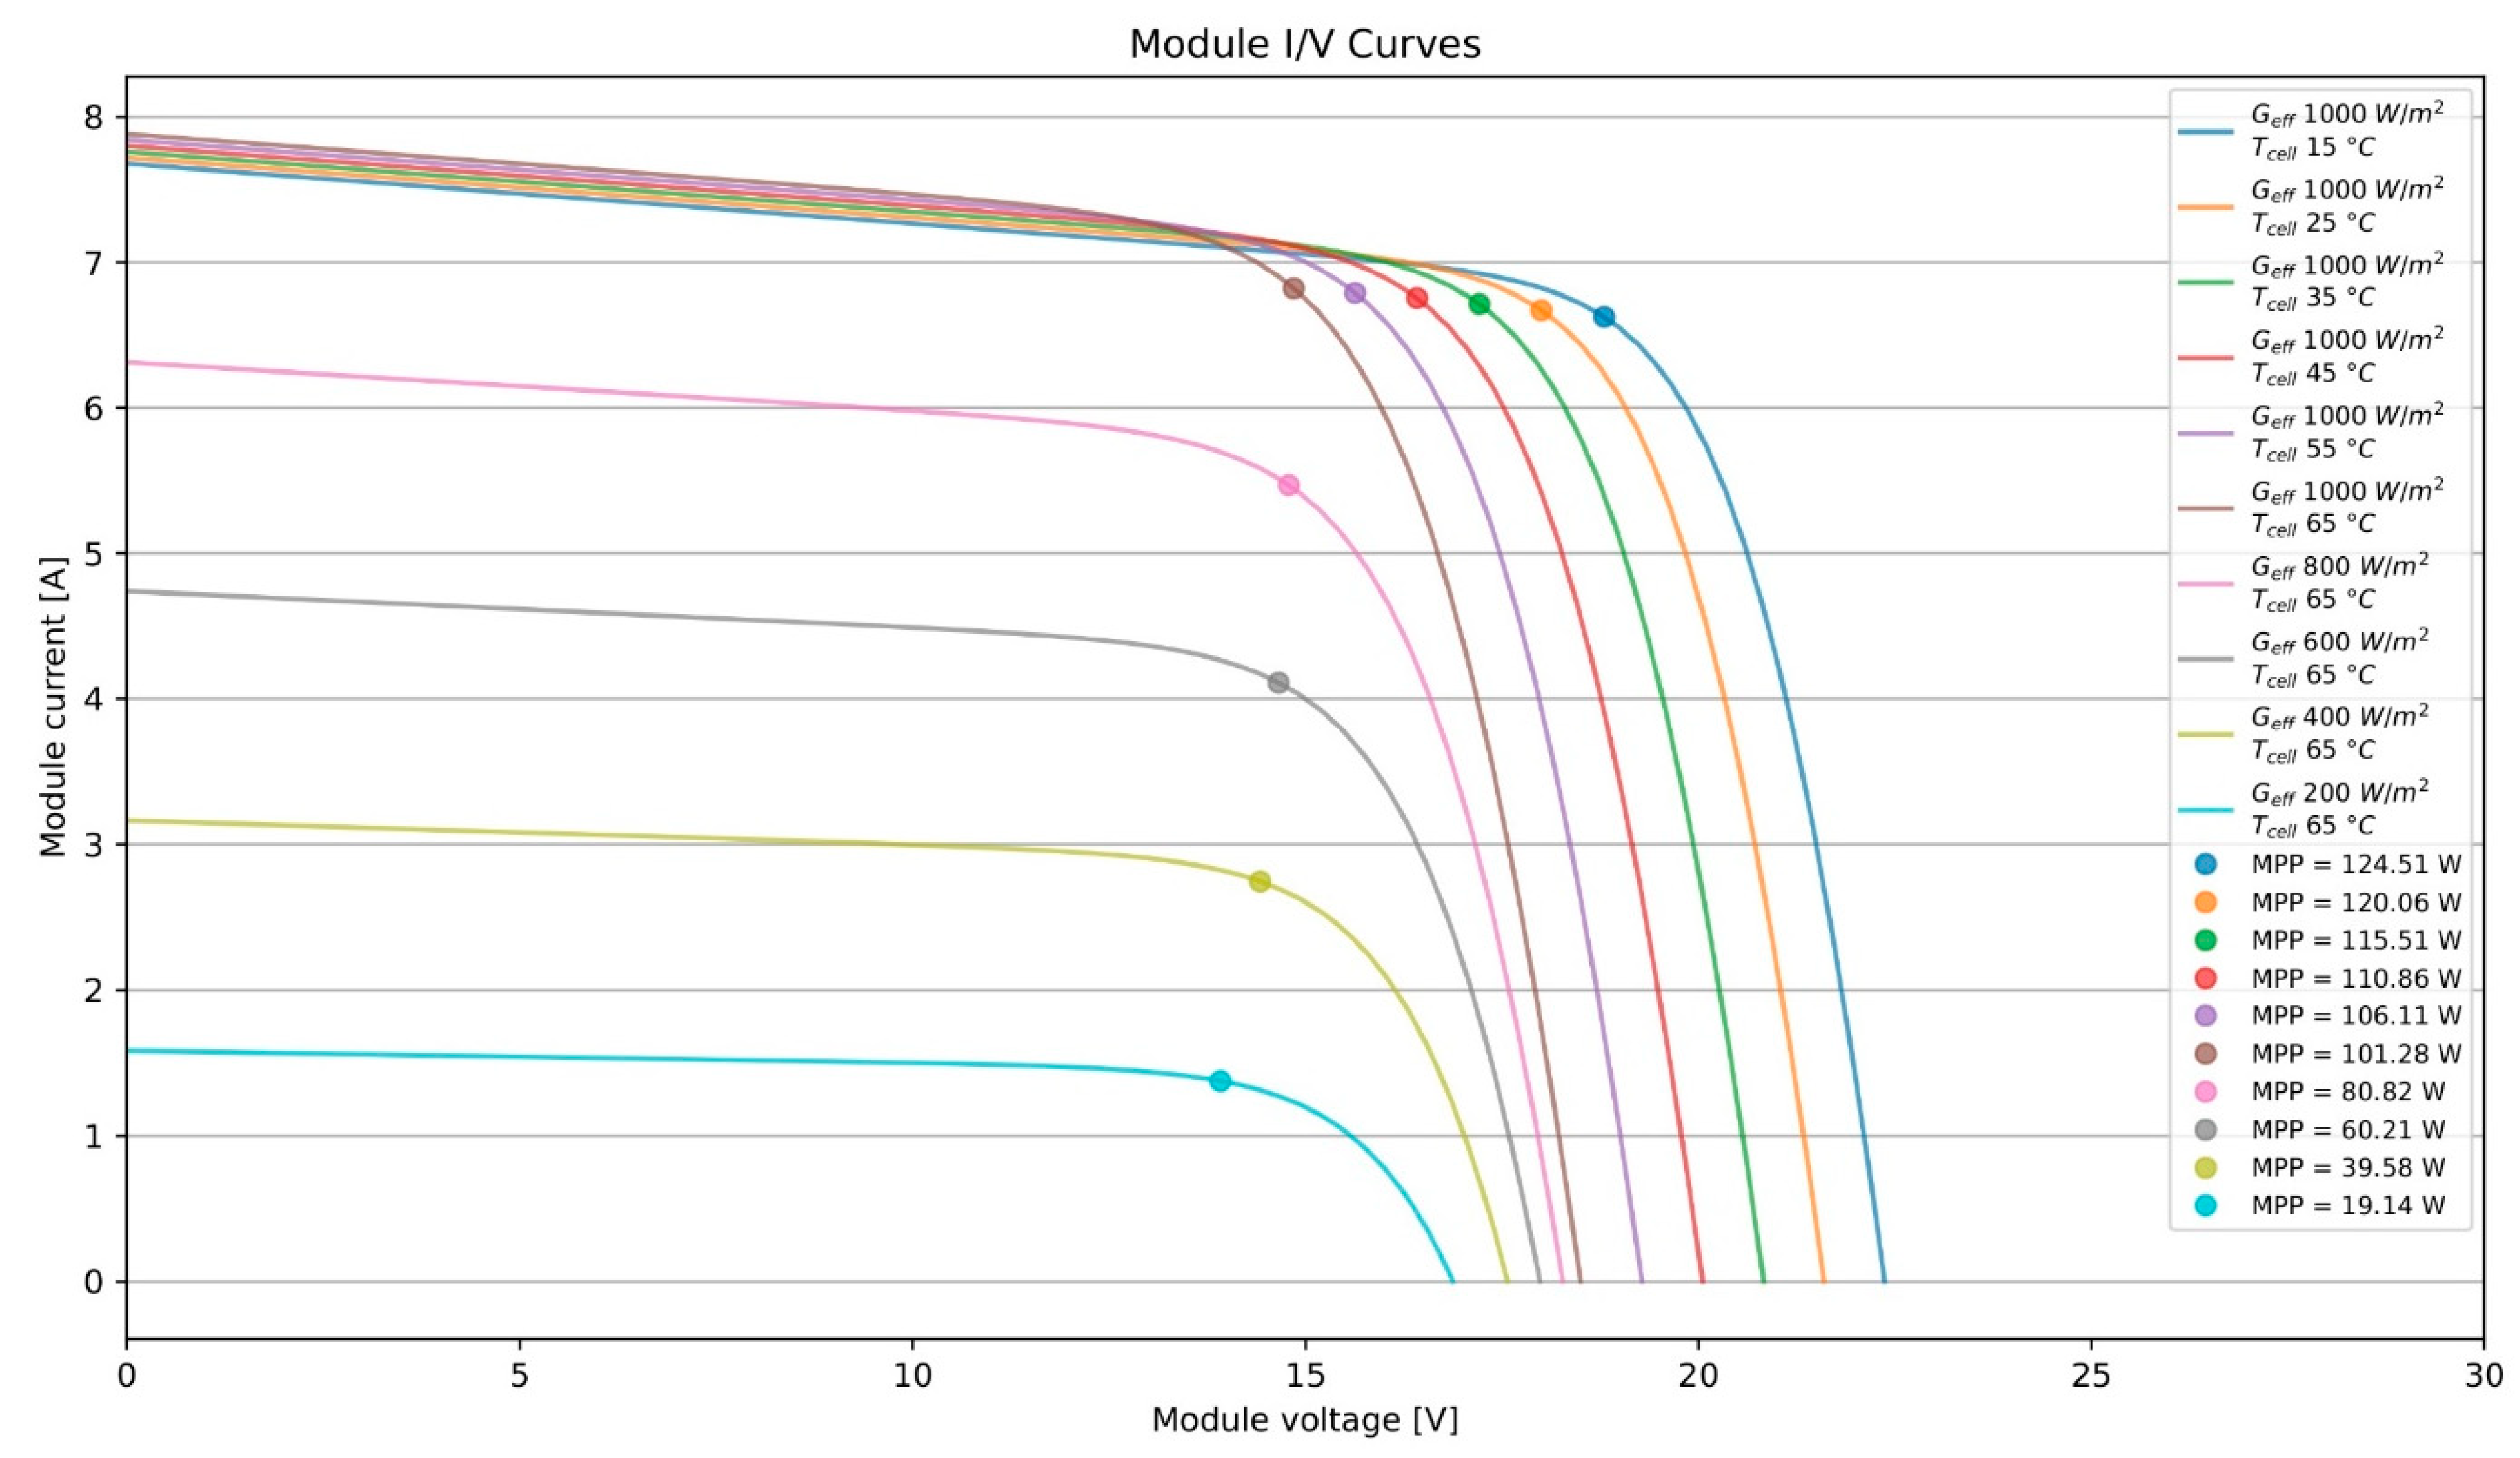
The I/V (current/voltage) curves, calculated for the PV module at several operative conditions of effective irradiance G e f f and cell temperature T c e l l , are shown in Figure 8, along with maximum power points, MPP, at given conditions.

3.8. Case Study

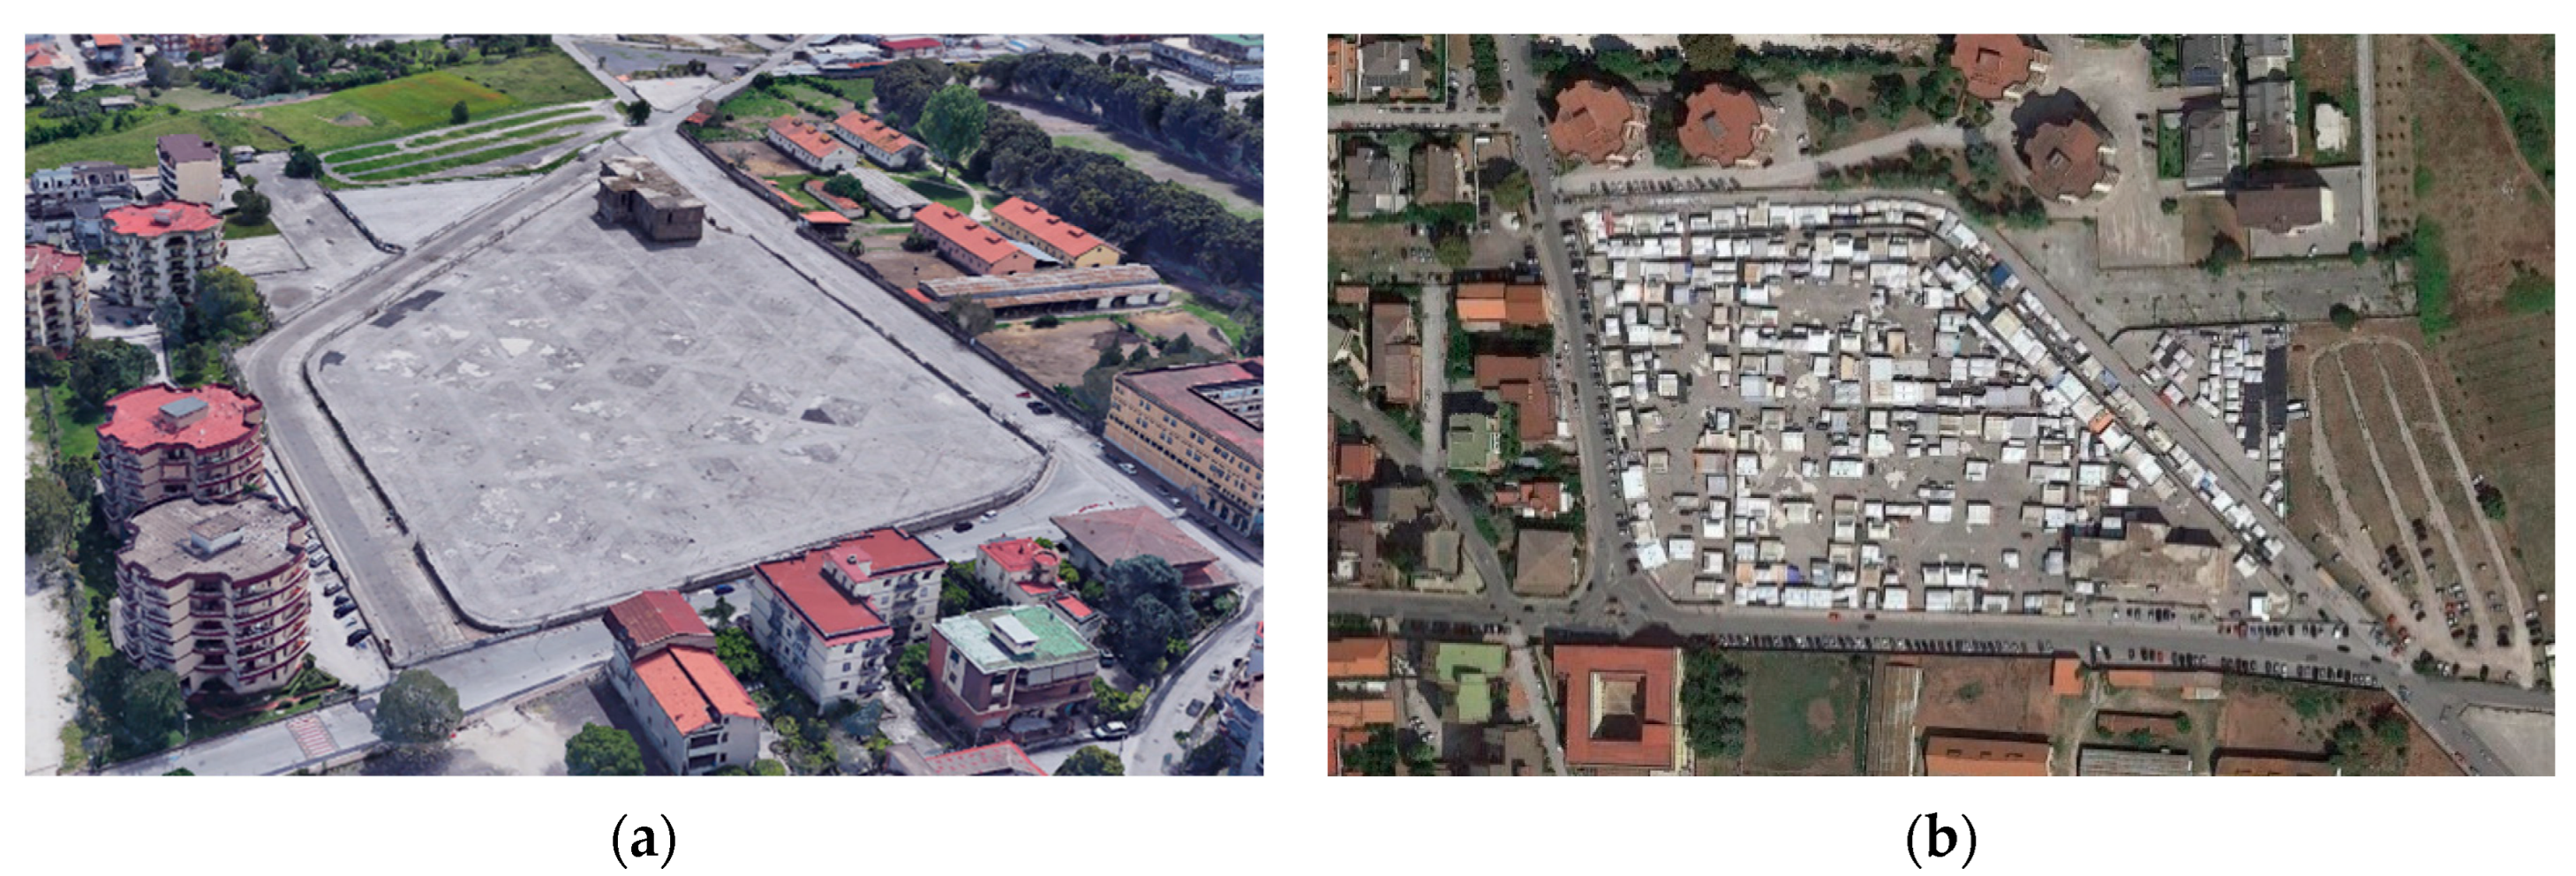
The area of interest (Lat: 41.084, Long: 14.265) is located near the historic center of Santa Maria Capua Vetere, a city in Southern Italy, in an area of recent urban expansion (Figure 9).
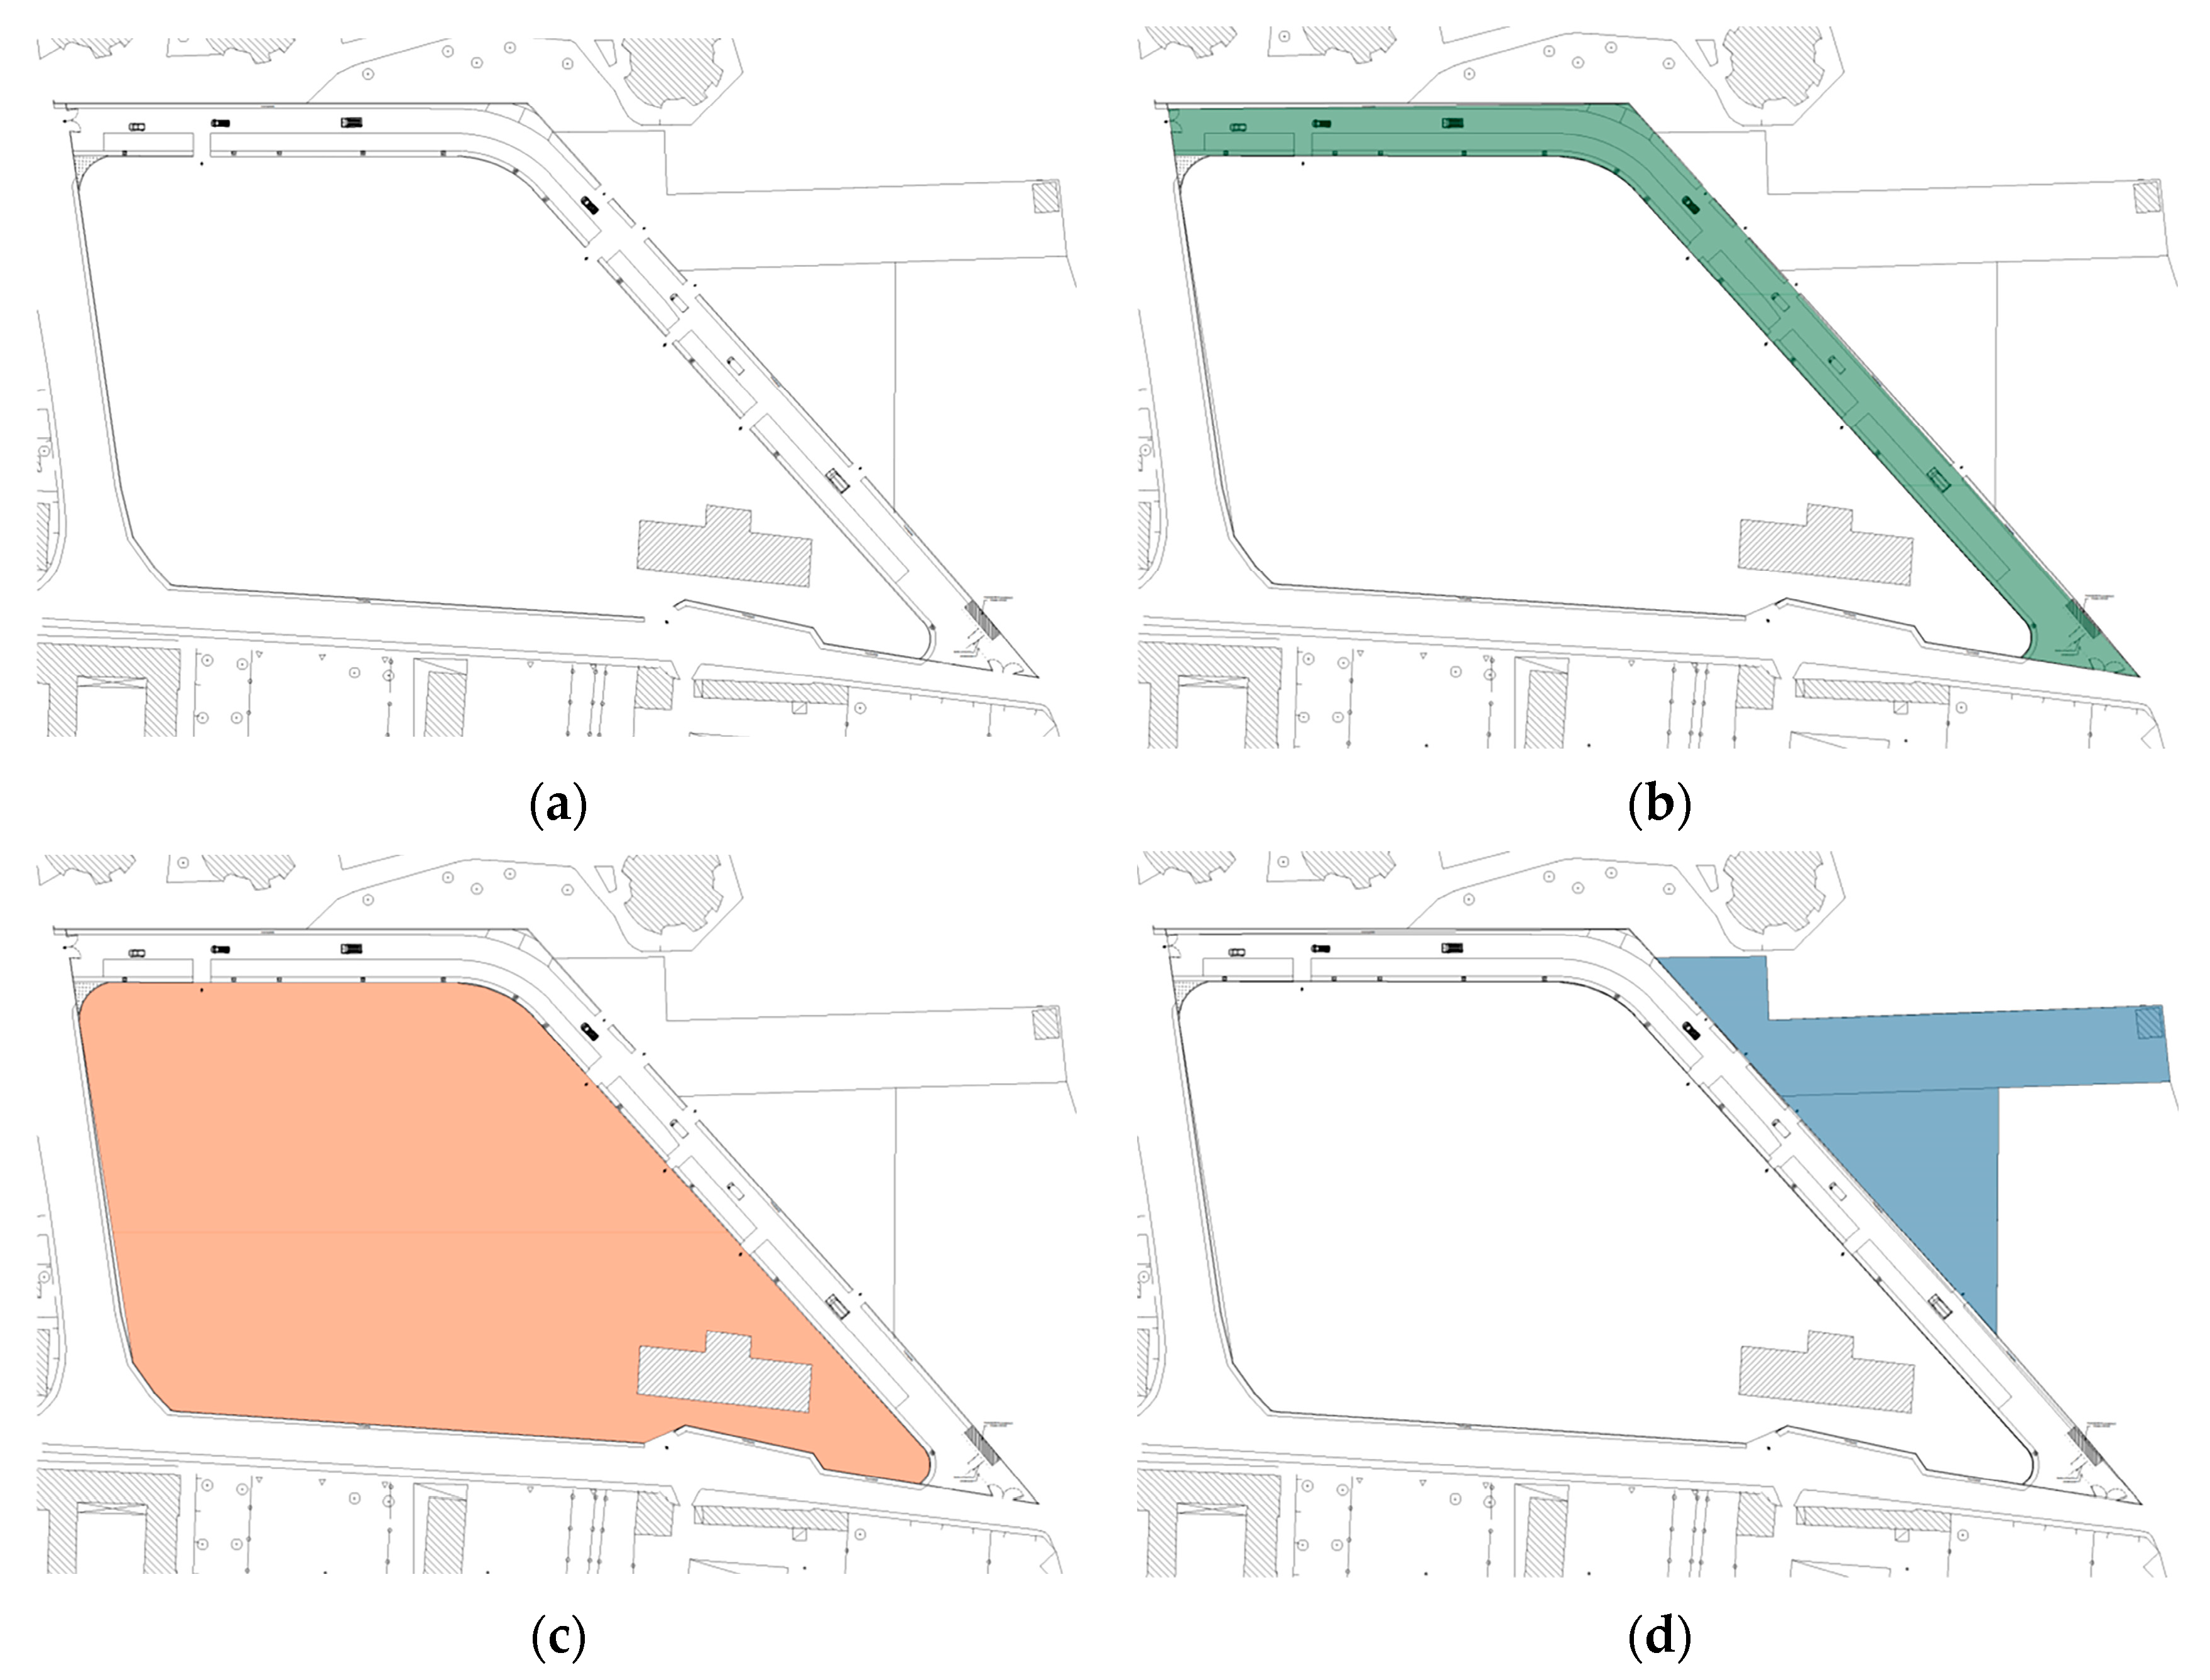
The case study zone has an area of about 28,000 m2, and it is used for the bi-weekly market and for any trade fairs and events. The area is divided into three zones (Figure 10): market, second-hand market and fruit and vegetable market and street food.
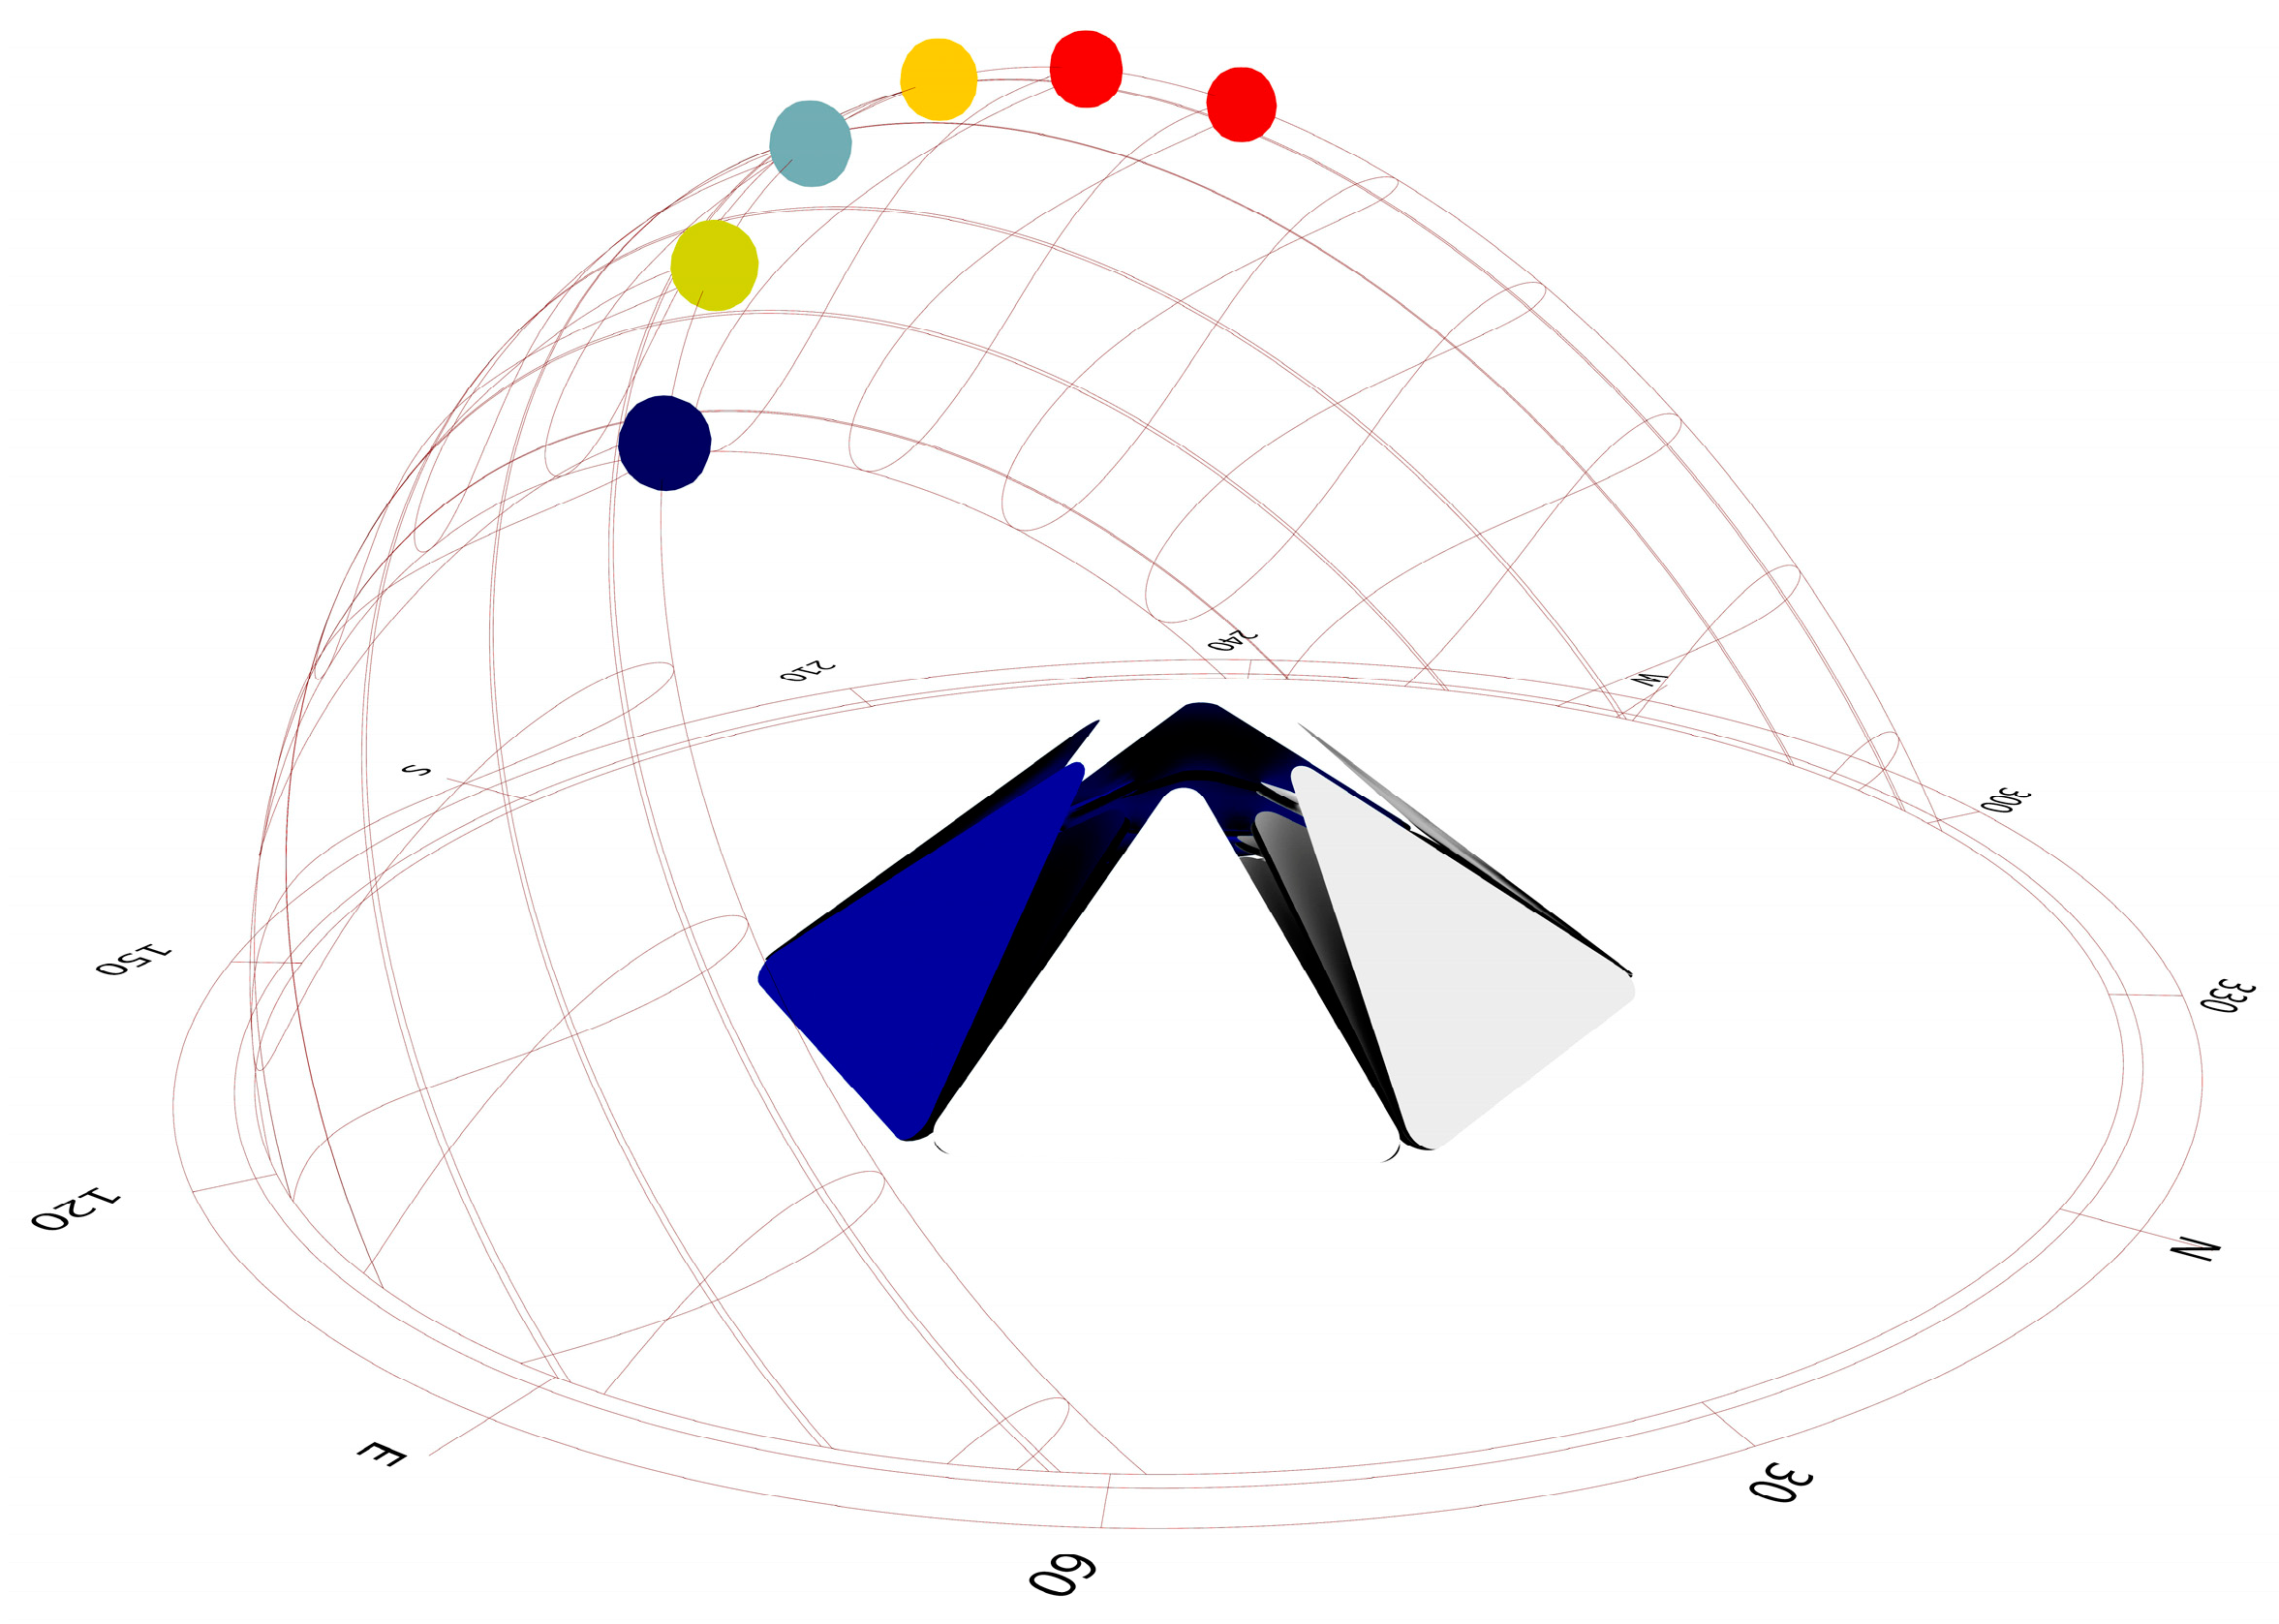
The area taken into consideration for the installation of the active PV shading device is that of the fruit and vegetable market and street food, being the sunniest one as can be seen from the analysis of the number of hours of direct solar radiation calculated for four significative dates (Figure 11).
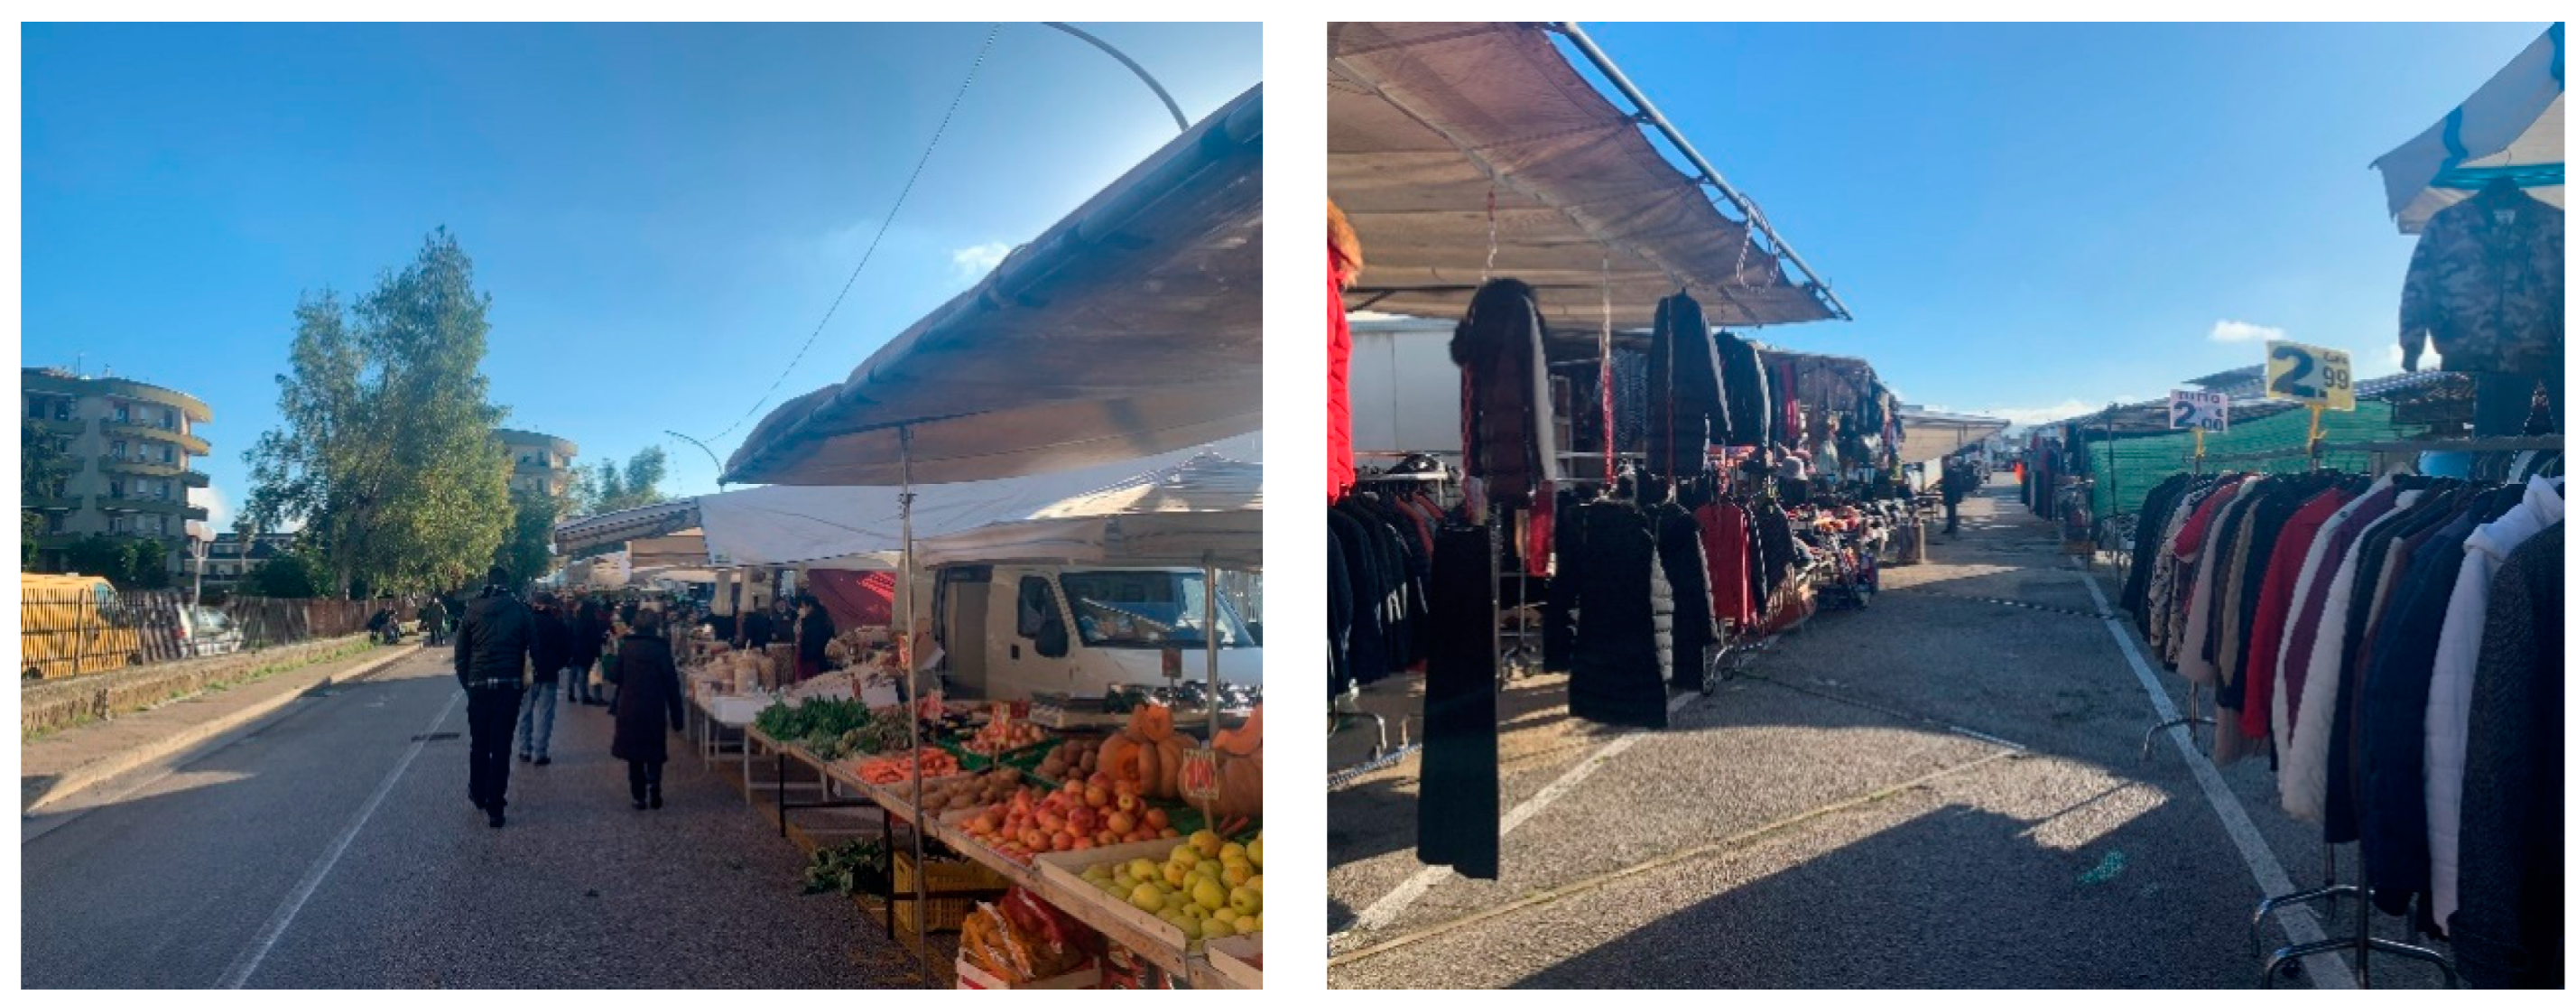
Currently, the market does not have fixed shading systems, and heterogeneous removable sunshades are put into place by market dealers (Figure 12).
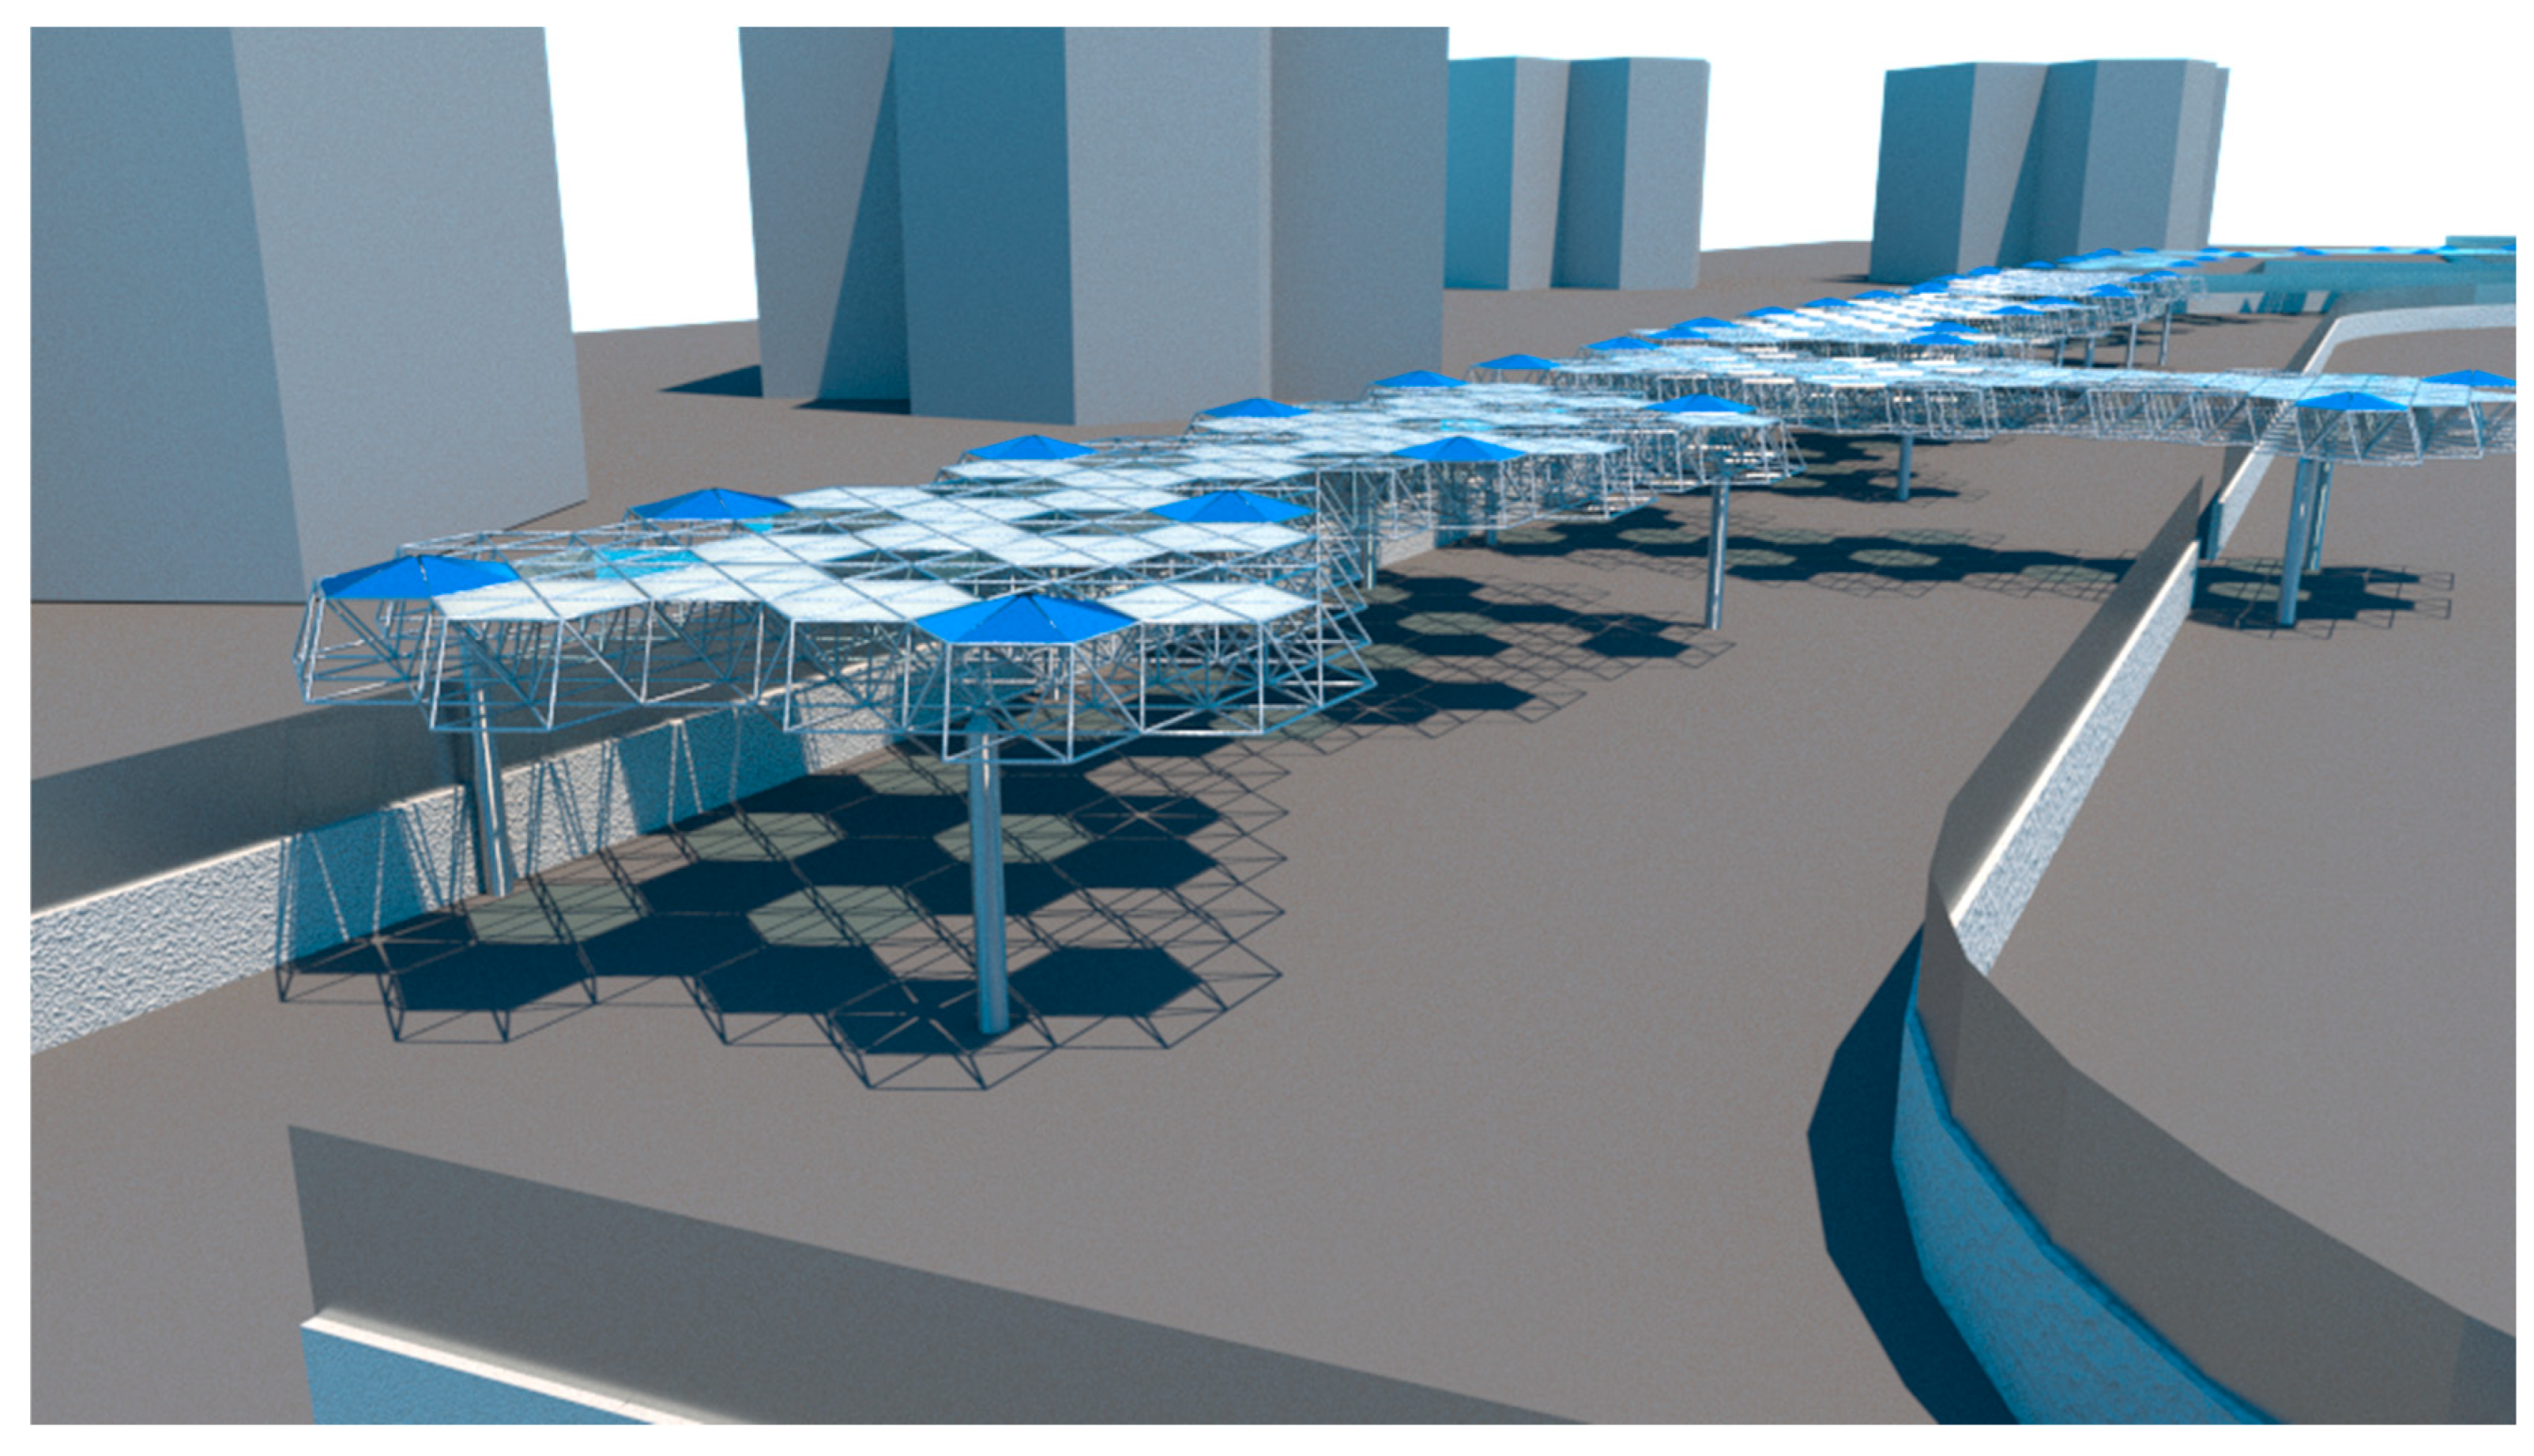
The large coverage structure introduced in the market area is shown in Figure 13. It hosts 90 modular tracking PV-integrated shading devices, for a total of 270 PV panels. The total peak power of the system is therefore estimated at 32.4 kWp.

3.9. Prototype

Prototyping has always been an integral part of the engineering design process. Prototypes give designers the ability to test and simulate the performance of a particular design under a variety of conditions.
Designers in the future will increasingly be called to create construction systems that are computationally enhanced and interconnected. Therefore, new tools are being developed to improve the design process for interactive and responsive capabilities, enabling a shift towards “interactive prototyping environments” (IPEs) [113], which enable new creative and technical opportunities by enhancing the design and prototyping process.
The typical design process for interactive prototypes usually involves the use of several different software applications and programming languages and necessitates a variety of very specific skills.
In this work, for the prototyping of the innovative integrated solar tracking PV system, a visual-scripting-oriented IPE called Firefly [89], an extension of the Grasshopper plug-in for Rhinoceros, is used.
Firefly bridges the gap between the digital and the physical world and simplifies the prototyping process for interactive and responsive designs. It combines a dedicated set of components with a new communication protocol (called Firefly Firmata), which together allow real-time feedback between hardware devices, such as microcontroller development boards and the Rhinoceros/Grasshopper modeling environment. In this way, Firefly’s toolset gives the designer the ability to rapidly test the performance of a design against a variety of real-world environmental conditions.
Firefly also provides the capability of controlling prototypes using a range of real-time data, producing “live models” whose parameters can be iteratively verified until a chosen set of outcomes is attained. This completes the feedback loop of communication by allowing users to send data from Grasshopper to hardware devices to activate real-world movements. The workflow leverages Grasshopper’s visual programming environment as a new method for microcontroller programming, making it ideal for vision-oriented specialists such as designers who prefer to create programs by operating on elements graphically rather than specifying them as a programming code.
In this prototype project, Arduino [90], an open-source electronic platform, has been deployed for the control of a single stepper motor that, connected to the central threaded bar (see Section 3.1 and Figure 14), enables the movement of the panels. The UNO is the version of the Arduino board employed in this study. The development board is powered by an Atmega328 microcontroller operating at 16 MHz, has 32 KB of program memory, 1 KB of EEPROM and 2 KB of RAM, 14 digital I/O inputs, 6 analog inputs and 5 V and 3.3 V power rails. Very low power consumption is the main advantage of microcontroller boards of this kind.
For the subsequent construction of the prototype, a scale model of the portion of the structure was created in Rhinoceros, to provide the geometries for 3D printing. The first step is the detailed modeling of the movement mechanism. In particular, the fundamental system is formed by a stepper motor connected by means of a coupler shaft to a threaded rod, while a ball bearing holds the mechanism in axis and a threaded rod allows the movement of translation. Figure 12 shows the geometries ready for the final 3D printing phase.
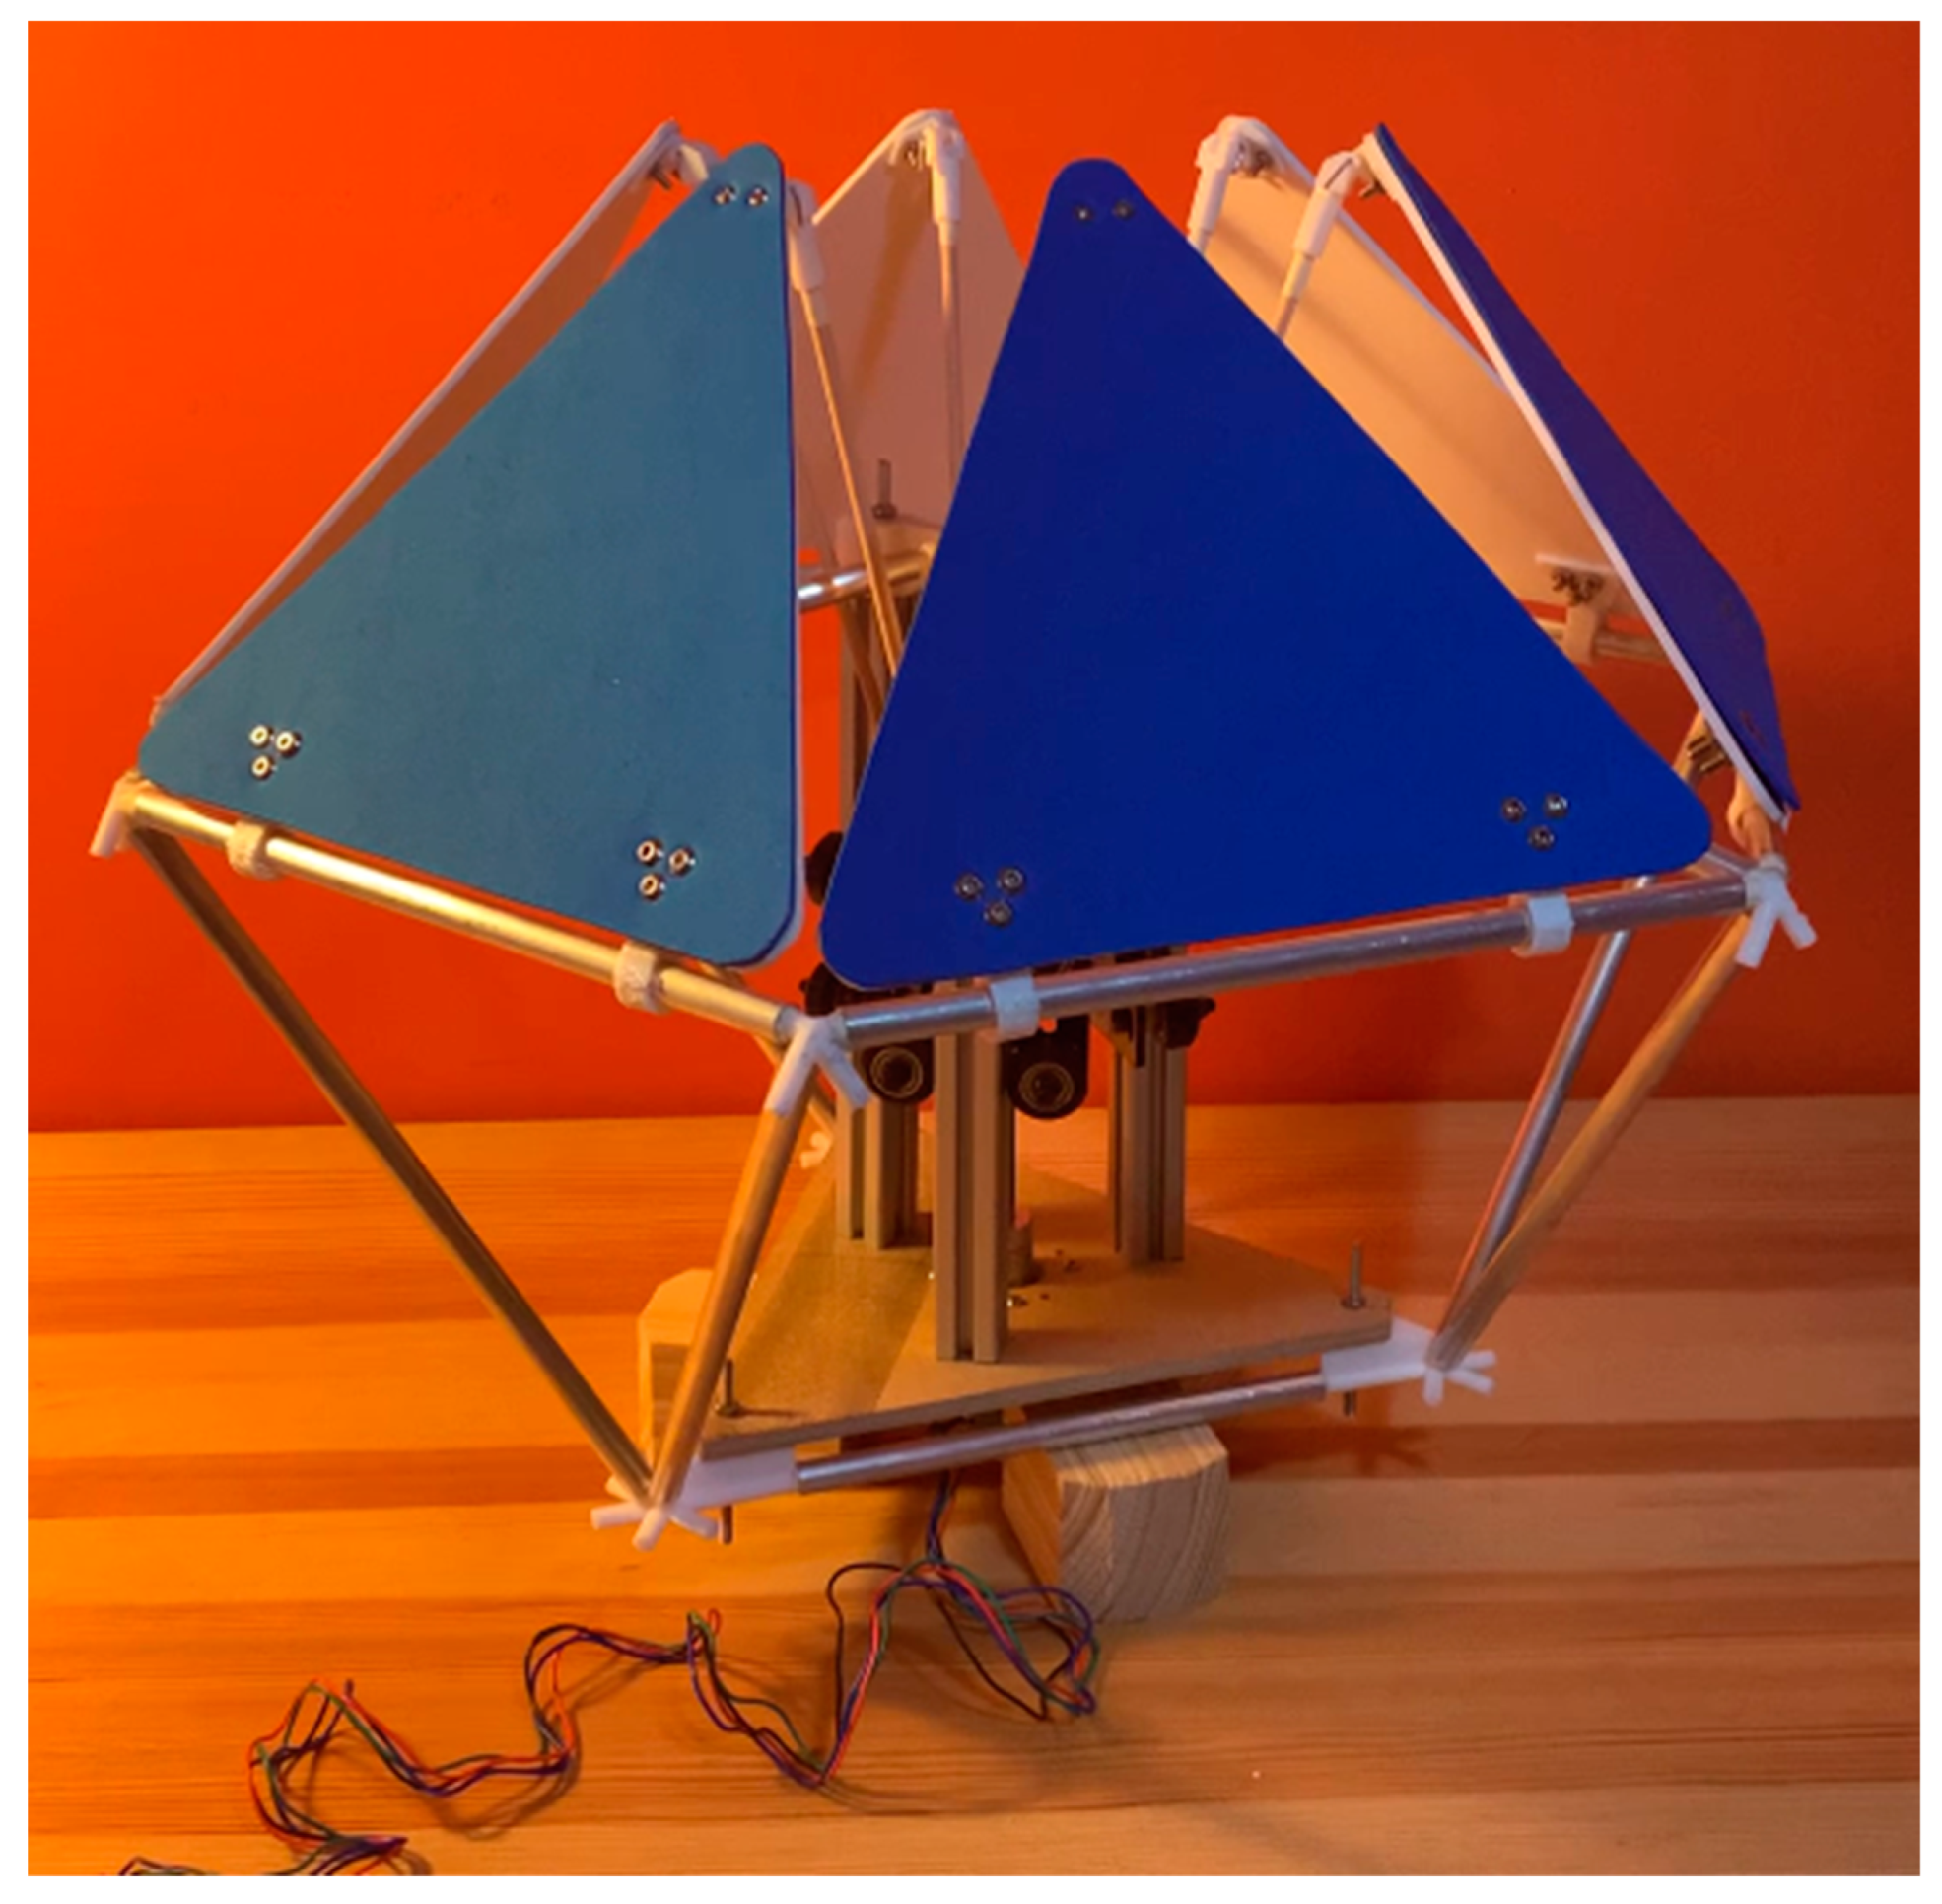
With reference to the external structure, this is made up of hollow profiles coupled together by means of a 3D-printed angle junction that simulates the hinge joints of the truss structure. Only a portion of the truss is reproduced in the prototype (Figure 15).
The material chosen for 3D printing is polylactic acid (PLA), a thermoplastic polymer. PLA combines the advantages of low printing temperature and good mechanical resistance.
The G-codes of the individual components are then created and the 3D print is prepared thanks to the Ultimaker Cura [114] software. An open-chamber 3D print is used for printing the components. In Figure 16, a rendered image of the prototype is reported.

4. Results and Discussion

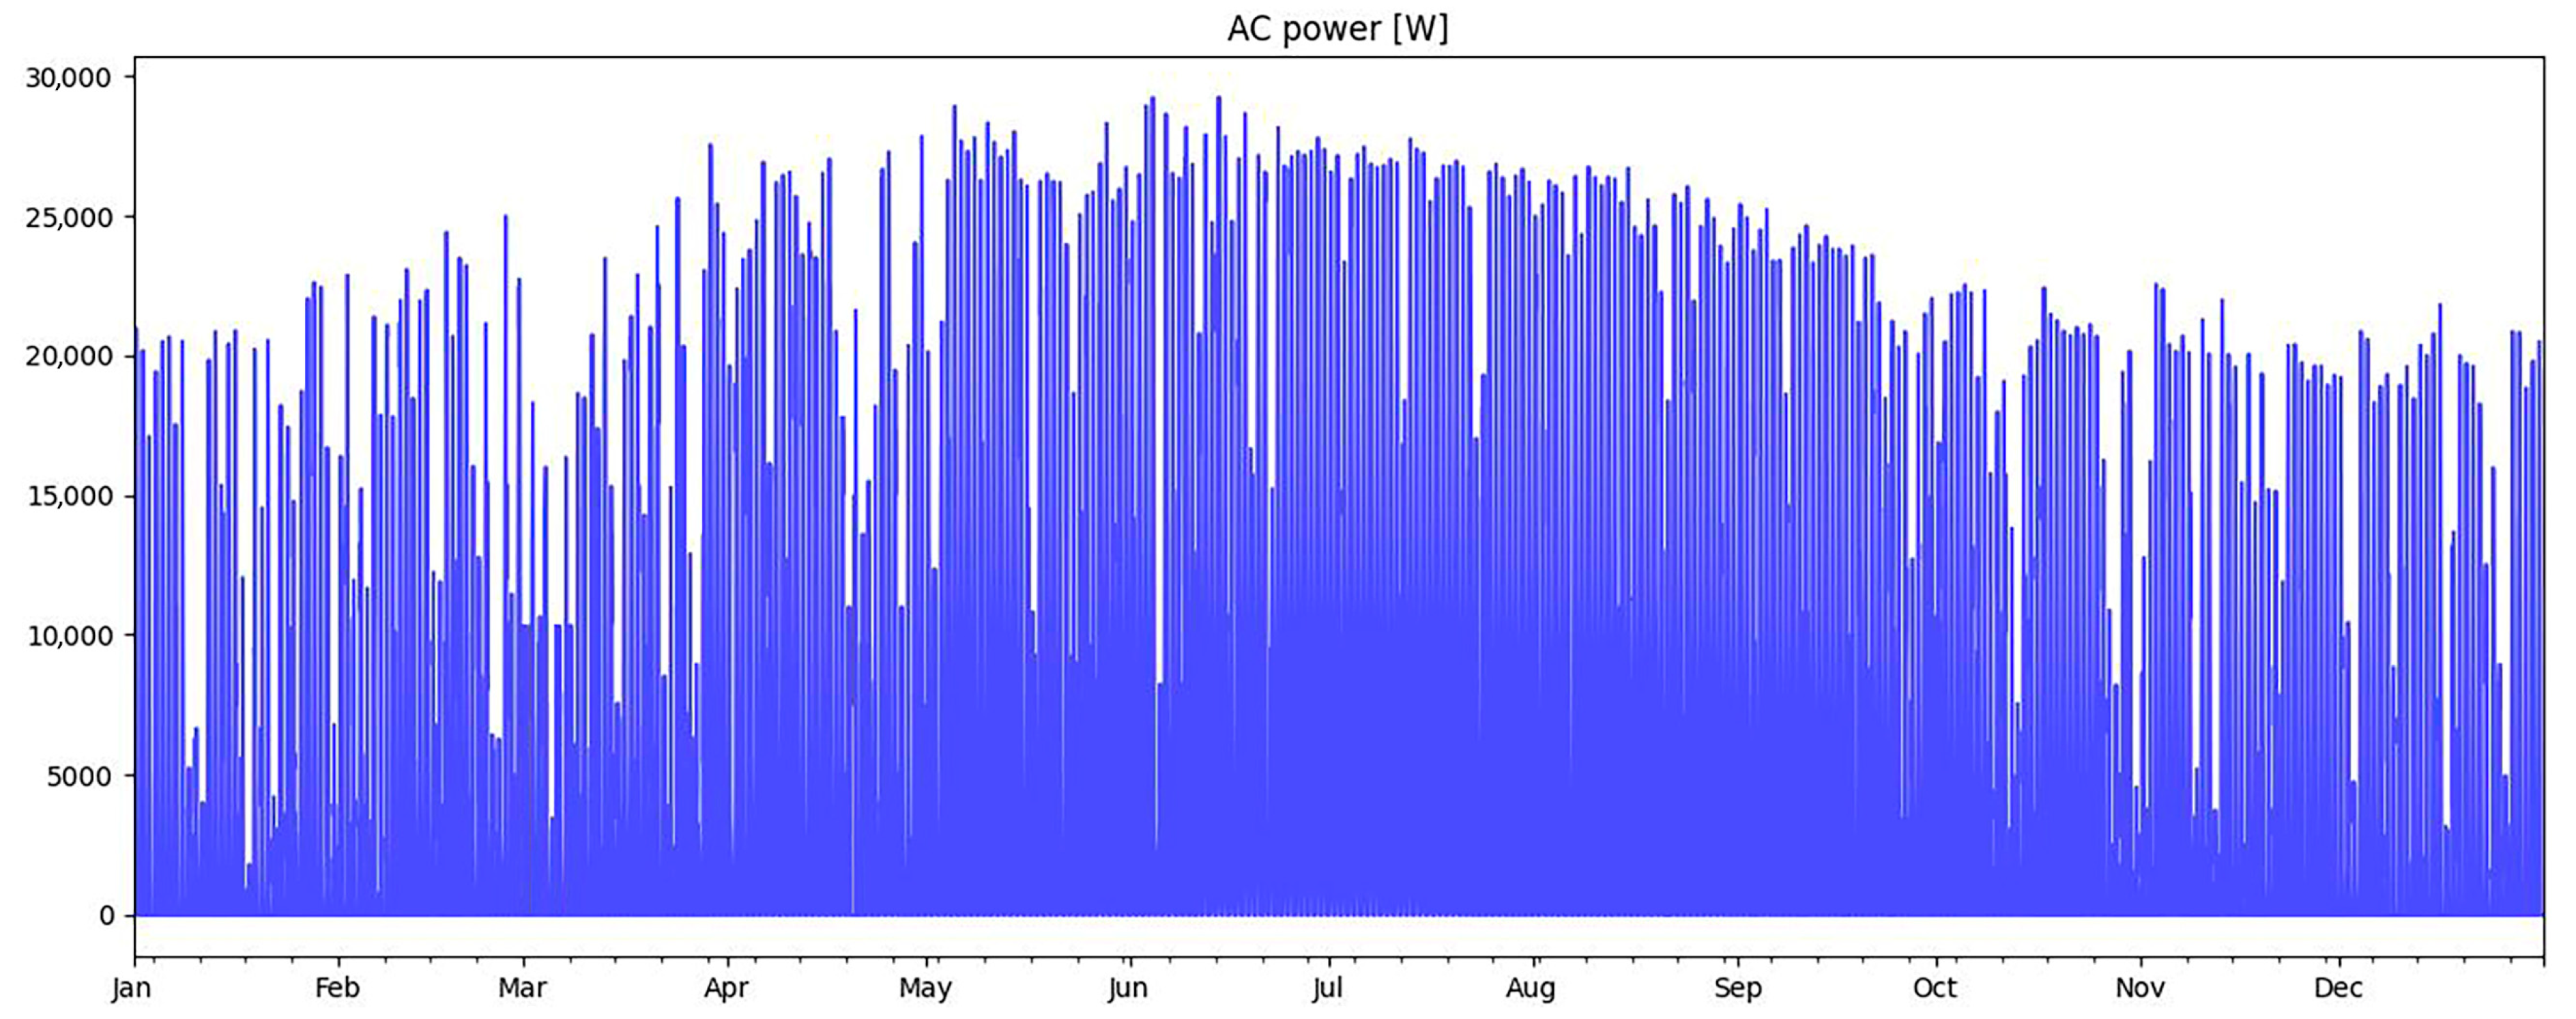
The results of the PV performance simulation are reported in this paragraph. In Figure 17, the AC energy generation of the power plant is reported on a monthly basis. The PV plant’s yearly electricity production is about 45′593 kWh. Figure 18 reports the total AC power generation of the PV system on an hourly basis.
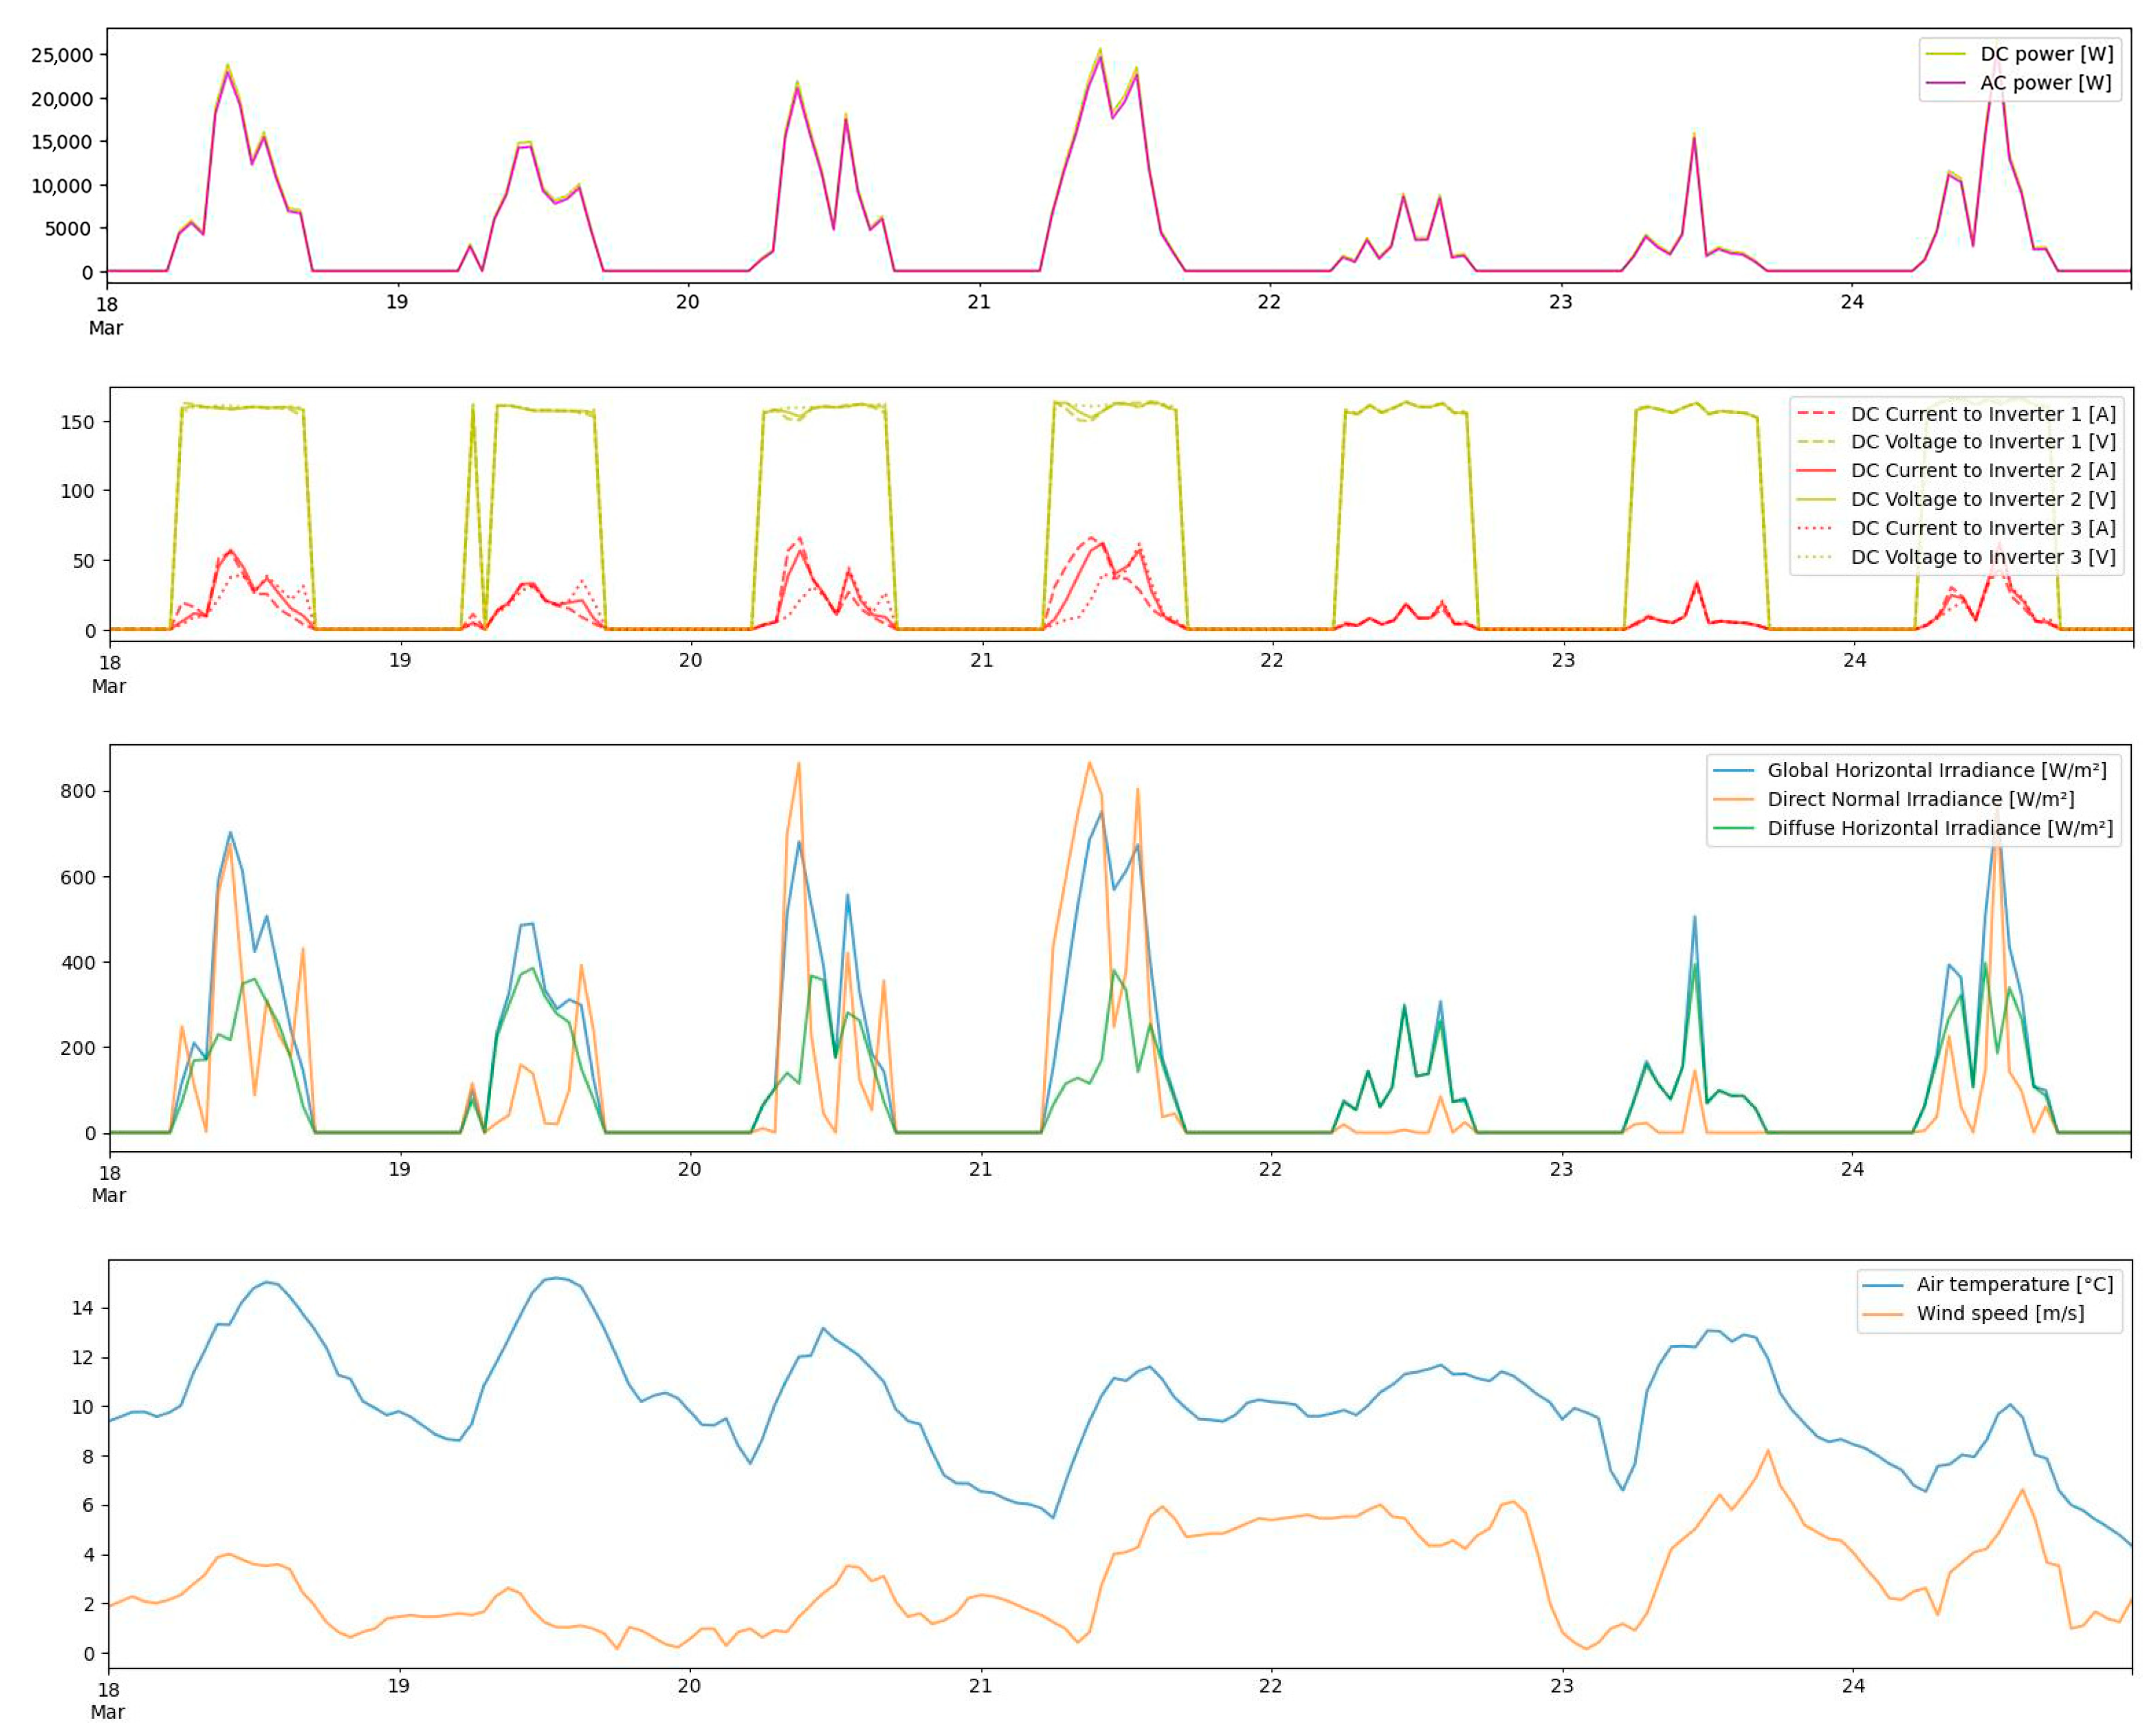
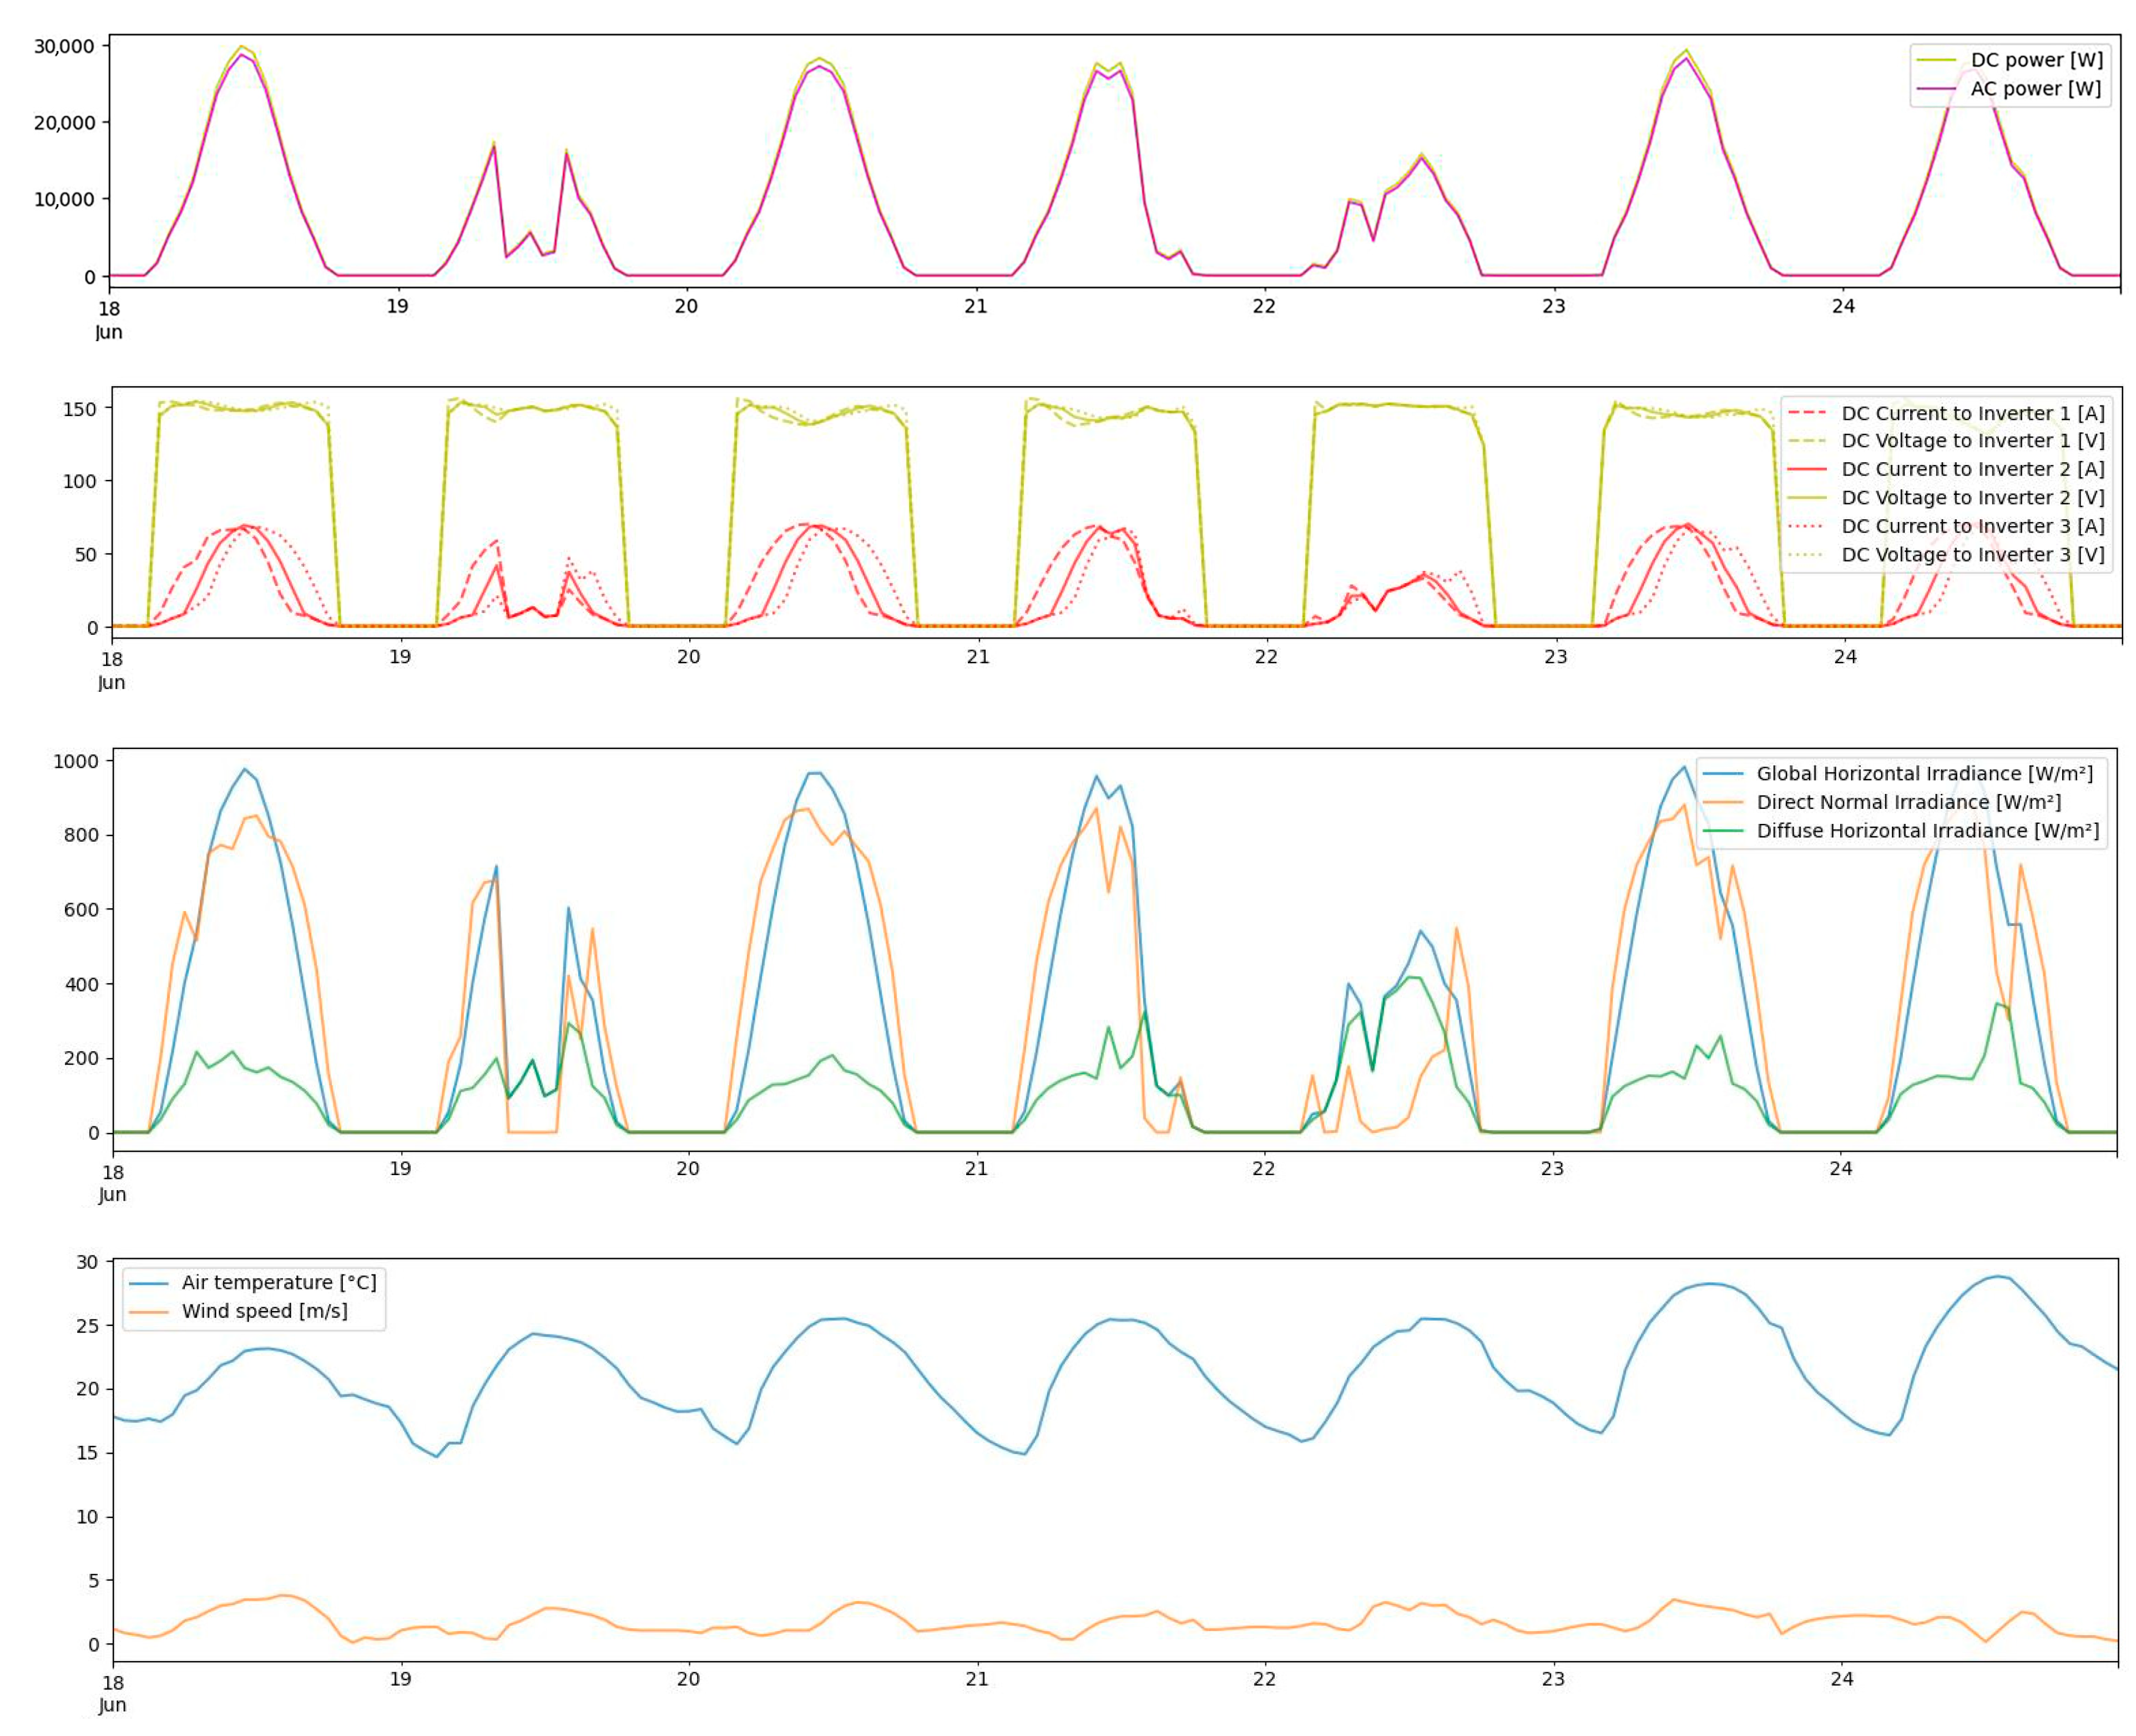
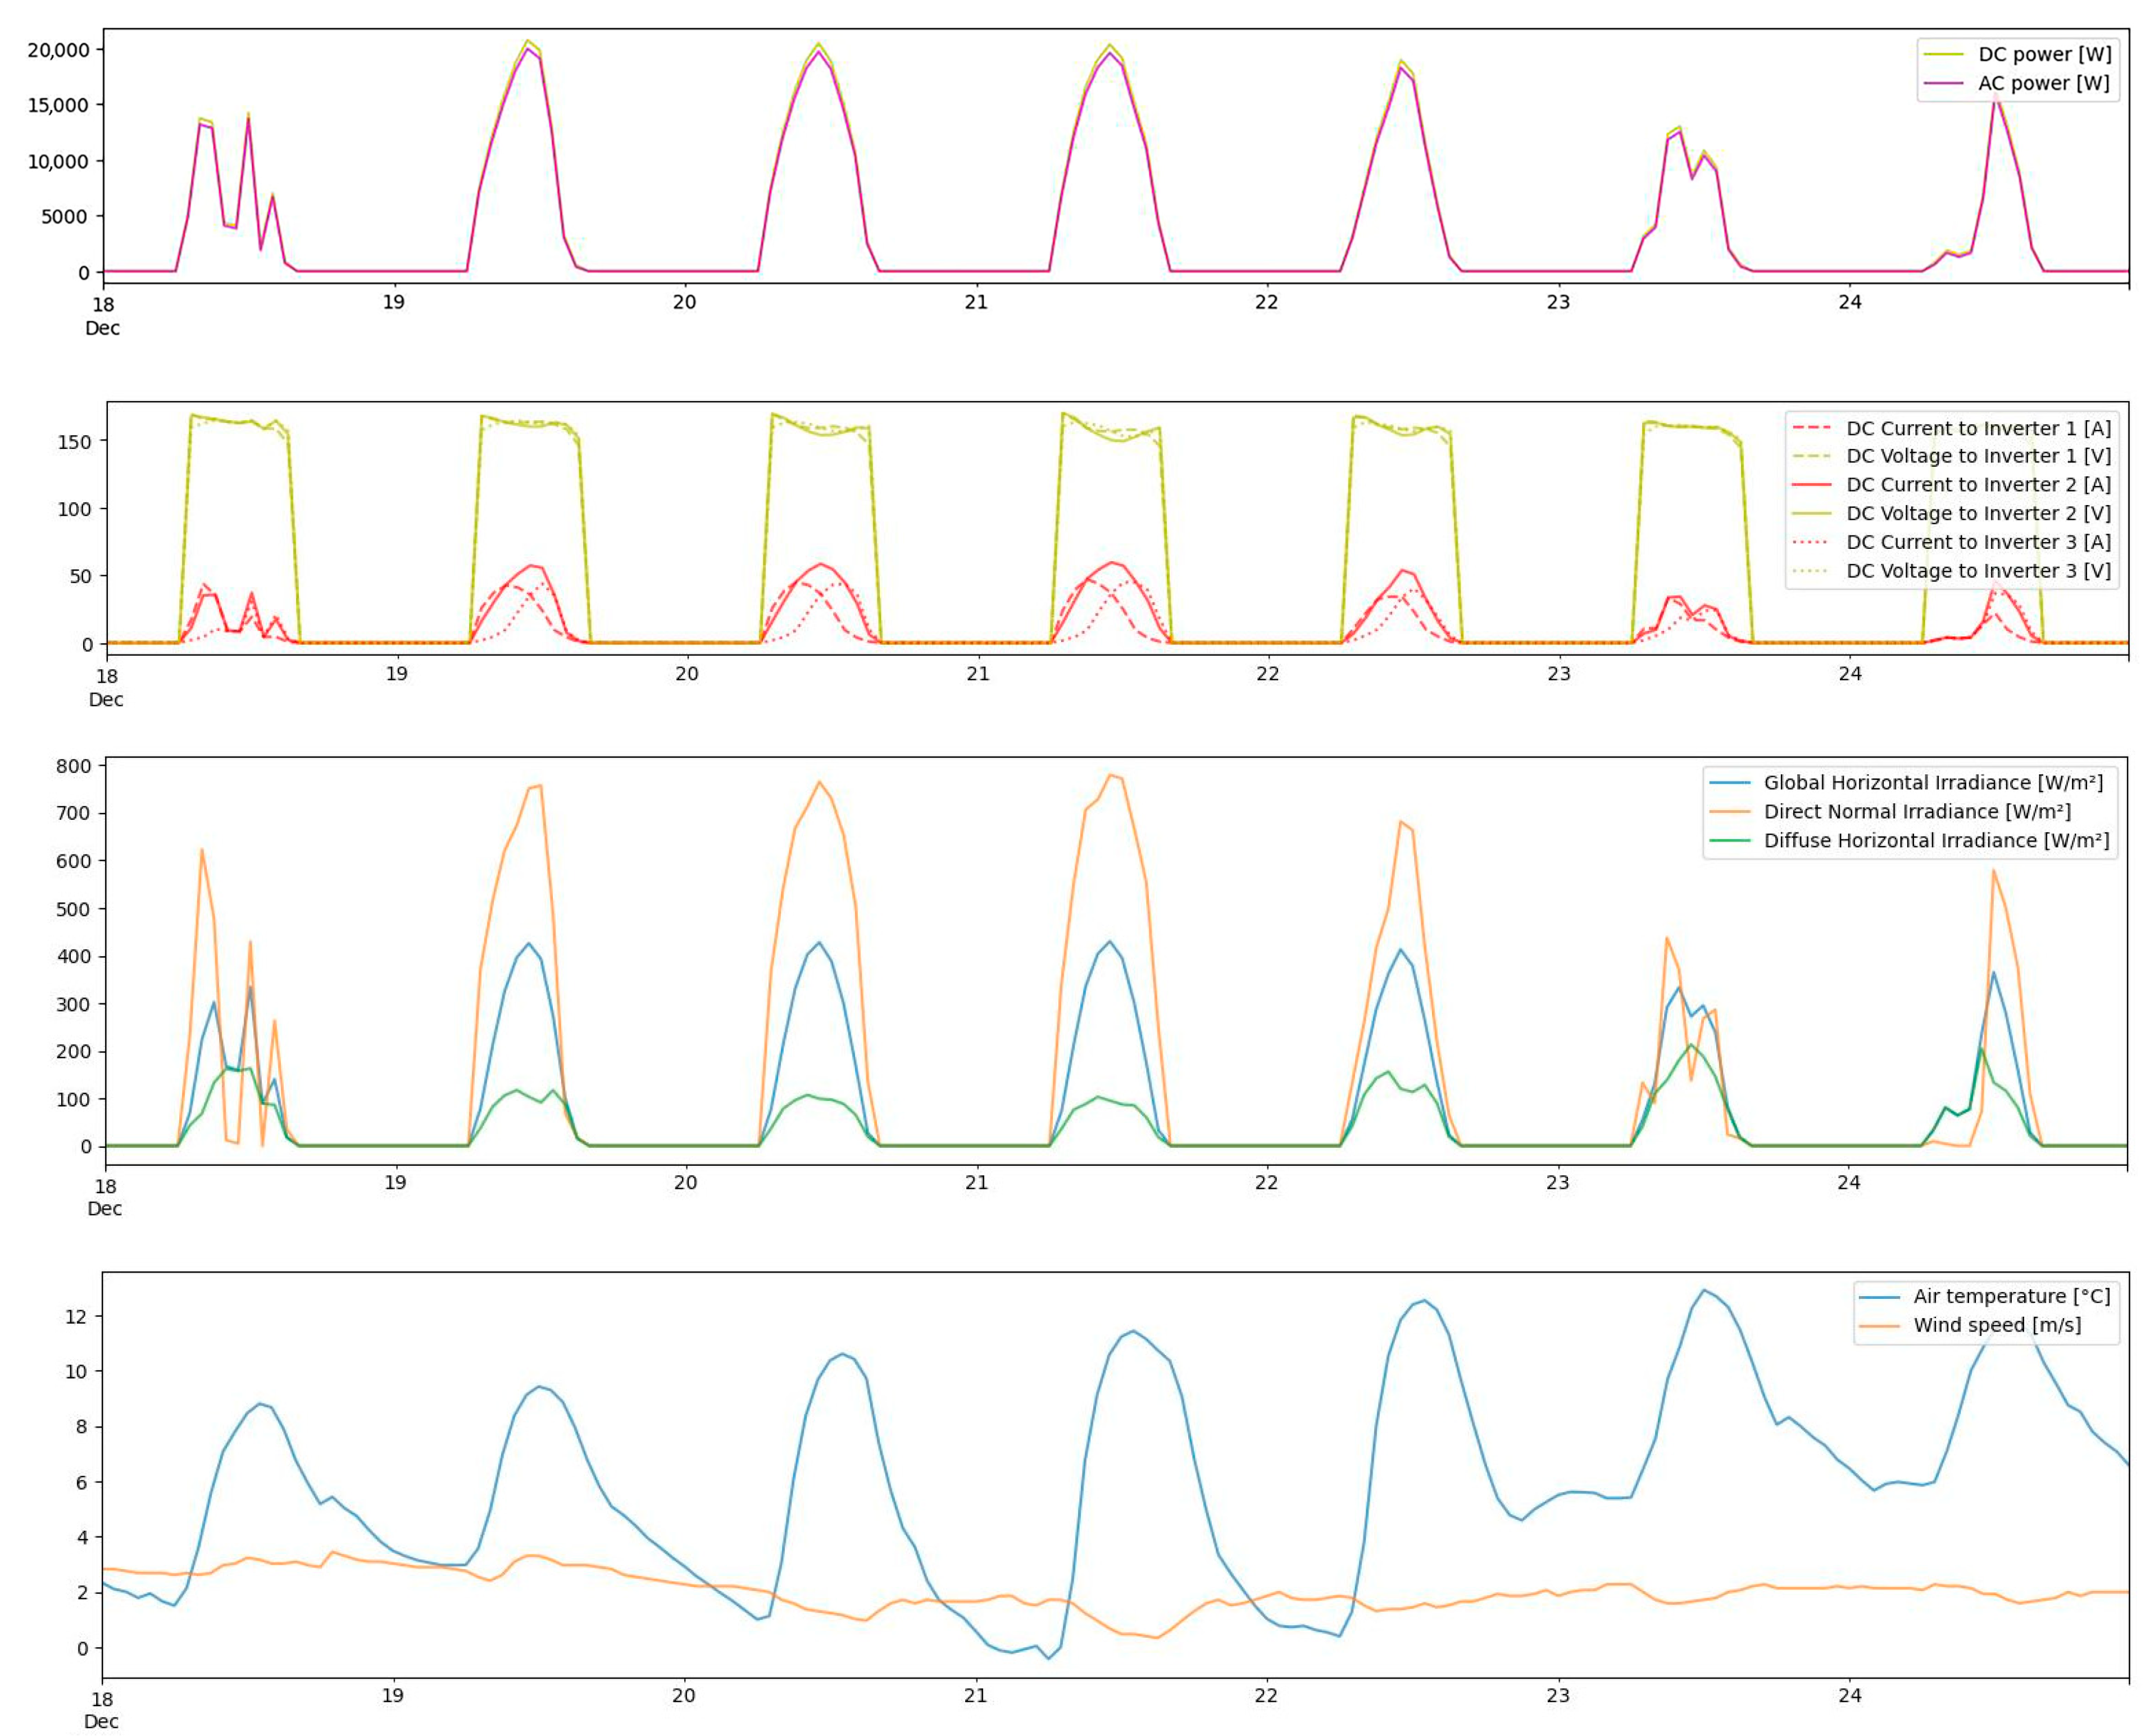
In Figure 19, Figure 20, Figure 21 and Figure 22, the results of the simulations of the PV power plant are reported in more detail for four significant weeks of the year. Namely, the days from the 18th to the 24th of March, June, September, and December.
Analyzing the power plant simulations (Figure 18), it can be seen that peak electric power achievable in the central hours of the day is equal to 20 kW during the month of December (Figure 22), 25 kW during the months of June and September (Figure 20 and Figure 21) and 30 kW during the month of July (Figure 19). Considering the early and late hours of the day, it can be seen that peak power of 10 kW or more can be already achieved at 8:00 a.m. and retained even up to nearly 5:00 p.m. during clear sky days of March and June. In September, this value is even higher, while in December (the most unfavorable month) it is near 7.5 kW.
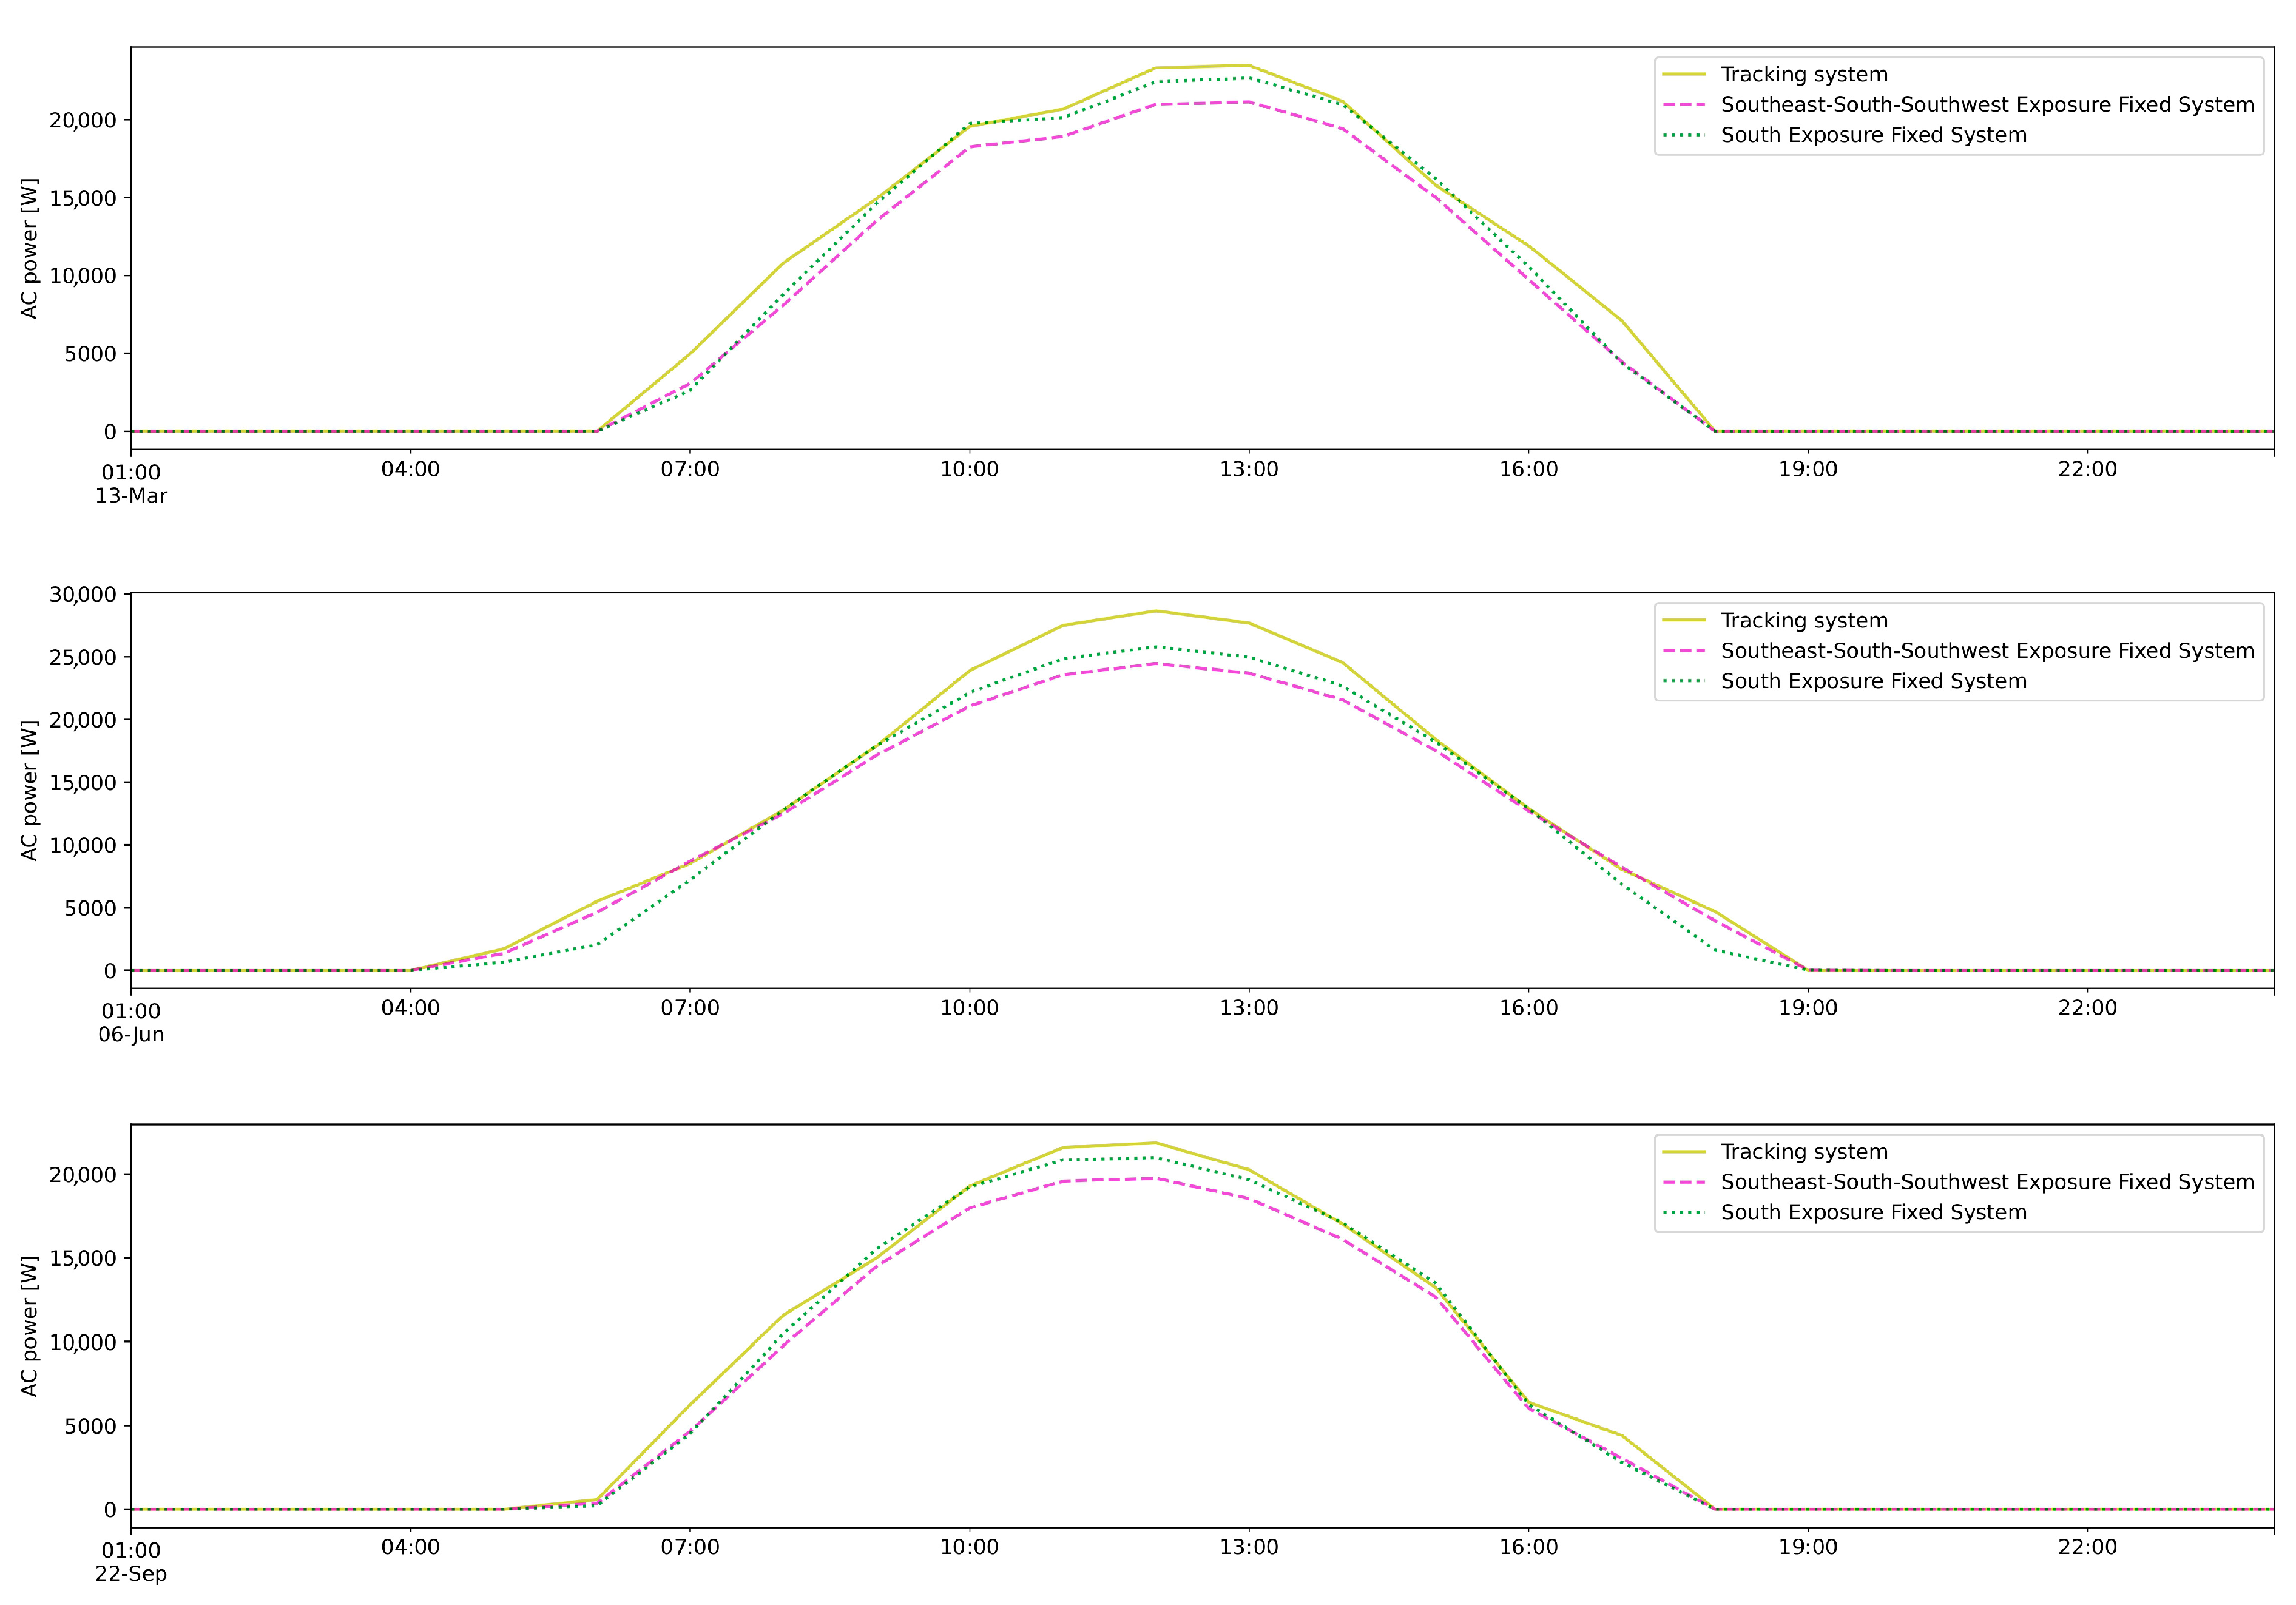
Peak power of nearly 5 kW is achieved at 7:00 a.m. and retained until 4:00 p.m. in March, June and September. However, in December, this value is very low due to the late sunrise time. As can be also seen from Figure 23, these values are higher compared to the equivalent fixed systems, after analysis.
In [115], typical load profiles of Italian households are reported in terms of electricity usage probability. These data are retrieved from monitoring campaigns and therefore are very reliable. According to this study, which analyzed different clusters of buildings, the morning electric energy demand has its peak values at around 7:00–8:00 a.m. for some clusters and around 9:00–10:00 a.m. for others. The evening peak demand occurs between 5:00 and 10:00 p.m.
Considering the detailed energy results of the proposed tracking system (Figure 19, Figure 20, Figure 21, Figure 22 and Figure 23), the information about the PV energy generation can be compared with these residential load profiles, which the PV system is expected to match in order to maximize on-site consumption of the renewable energy [116,117].
A higher energy yield is available in the hours of the day in which early morning peak demand is expected (7:00–10:00 a.m.) and also during the first hours of the early evening peak demand occurrence (5:00–6:00 p.m.). This results in a higher chance of on-site self-consumption of the renewable electric energy generated by the PV system, also decreasing the impact on the public network and energy losses due to excess electric energy dispatch.
In order to provide a comparison of the proposed tracking system with fixed PVs, the following analyses are made. The tracking system is compared with two equivalent systems (Figure 23). The first equivalent system has the same number of PV panels oriented with the same azimuth as the proposed tracking system but with a fixed tilt angle of 22°. The second system has the same number of PV panels but with a common South orientation and fixed tilt angle of 22°.
From Figure 23, it can be also stated that for almost all the analyzed days, the PV energy yield of the proposed system is higher compared to the two fixed systems. This is especially favorable during the early and late hours of the day, but the energy generation is also high during the central hours due to the tracking device.
As also shown in several scientific papers [11,19,56,61], compared with a fixed system of the same power, the integrated tracking system performs considerably better also during the first and last hours of the day. This results in a steadier energy generation during the day, better covering with renewable energy the hours of the day in which traditional fixed systems produce less electricity. Therefore, the proposed PV system should be more suitable for the application in residential neighborhoods, where high peak demand is achieved in the morning and in the late afternoon.
On-site consumption aids PV systems to obtain shorter carbon payback periods (i.e., the time embodied carbon is fully matched by the reduction in carbon emissions due to the system operation). This is very important when considering the sustainability of new urban architectures, in accordance with Sustainable Development Goal 11—“Sustainable cities and communities” [28].
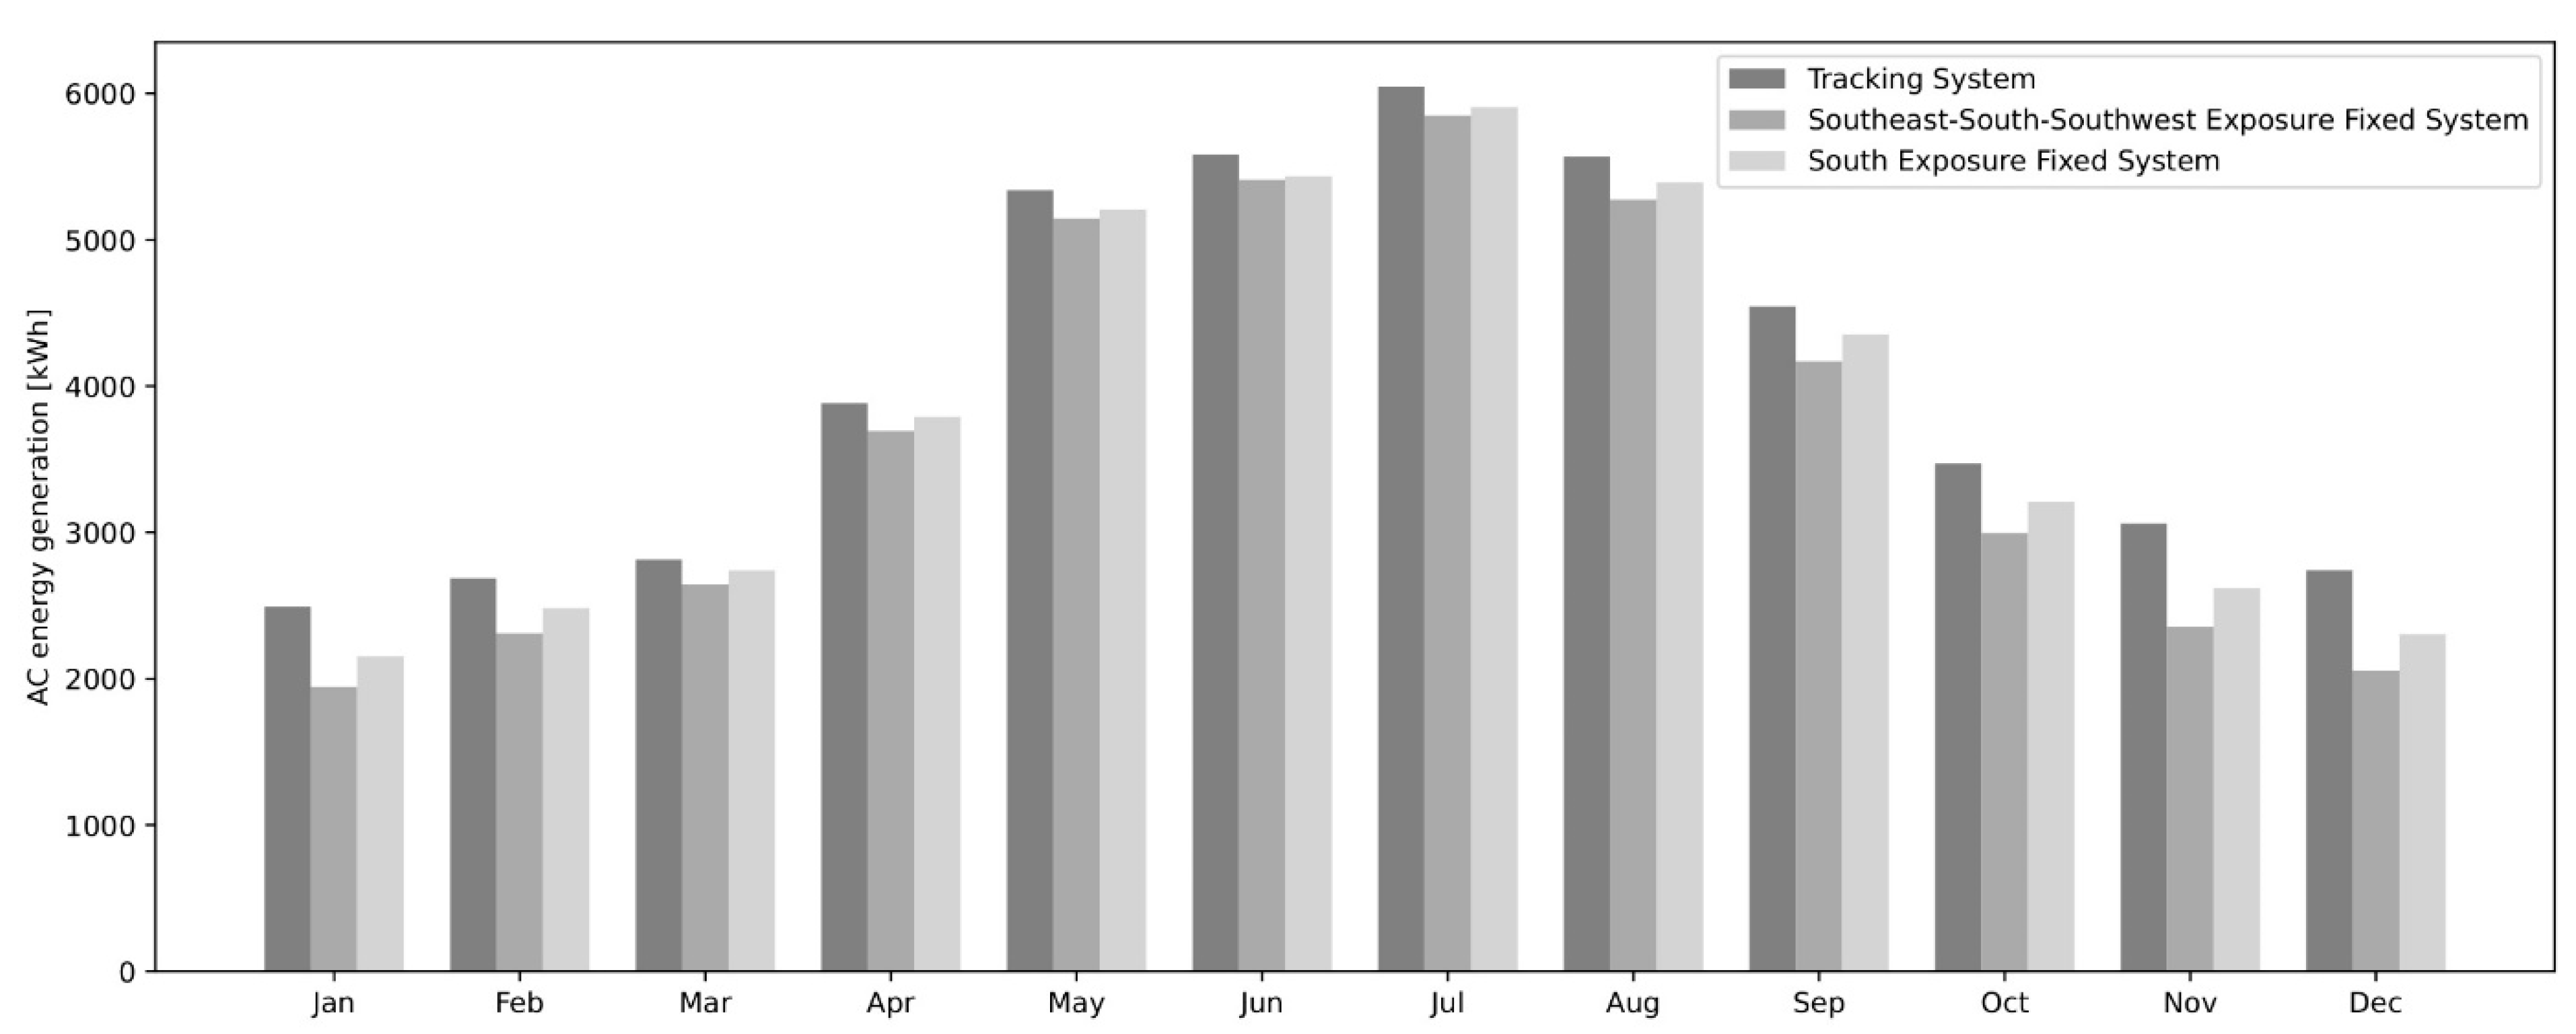
In Figure 24, a comparison in terms of monthly electric energy generation is reported, between the proposed tracking PV system and the two equivalent fixed systems dimensioned as previously reported.
Energy yields for the three systems are equal to 48,236 kWh per year for the tracking system, 43,965 kWh per year for the mixed-orientation fixed system and 45,865 kWh per year for the South-oriented one. The tracking system allows also a greater energy yield in winter months, when solar radiation is scarcer and fixed systems produce less electricity.
Considering that the proposed system is in its first stages, only general considerations can be made about the payback time of the analyzed technology, by looking at previous studies on the subject.
In [19], the authors provide an economic analysis of comparable fixed and tracking systems implemented at latitudes similar to the one analyzed in this paper. The analysis shows a longer Discounted Payback Period (DPB) for the tracking version of the PV systems, and this is highlighted as the main drawback of its usage. The aforementioned study, however, considered a mounting structure and tracking device that highly influenced the initial investment.
A detailed cost analysis of the modular system proposed in this study will be only possible when a full-scale model and manufacturer cost projections of the components will be available. The higher PV yield compared to fixed systems, the savings related to the exploitation of a supporting structure devoted to sun shadings and scale economies due to the joint construction workflow of the structural supporting frame and the PV system suggest that an economic convenience can be achievable. More detailed cost analyses will be the object of the authors’ future work.
In Figure 25, a rendered image of the case study area is reported in order to show an early-stage representation of the possible exploitation of the developed modular tracking PV shading devices. One of the strengths of the proposed PV system is its modularity. This means that the density of sun-tracking shading devices can be varied thanks to the modular nature of the system that makes it suitable for several applications. The proposed case study application is only one of the many possible configurations that can also present a higher density and number of PV panels.
With reference to the prototype, in Figure 26, a picture of the small-scale functioning assembly is shown. The physical prototype has shown the feasibility and functioning of the designed model and the possibility of making technological improvements to the real scale.
Further improvements will concern the scaling up of the prototype and the integration of real PV panels in order to provide validation of the results obtained through the simulation of the system.

5. Conclusions

In a historical moment still characterized by the increase in energy demand and greenhouse gas emissions, the architectures of the future should be capable of improving the quality of life of its users while at the same time fostering a more sustainable world. In this context, renewable energy integration in civil structures is one of the most relevant themes.
Although many studies addressed the integration of PVs in new and existing buildings, the exploitation of interbuilding areas for PV energy harvesting is poorly addressed in the literature.
This work presents the new design, the detailed simulation and a first prototyping of a modular tracking PV-integrated shading device suitable for sustainable large urban spaces.
The use of a solar tracking system allows for the generation of more electricity in about the same space needed for a fixed inclination system, making it ideal for optimizing the use of the available area. At the same time, the system can guarantee shading to the covered area. The modularity of the proposed design facilitates the integration with a double-layer space truss, a widespread structural system for the coverage of large open areas and allows the scalability of the system. Finally, the flower shape gives pleasant architectonical characteristics to the system.
Even though the design is in its early stages, the first results show that the financial convenience of the proposed system may be possible, as evidenced by the higher PV yield in comparison to fixed systems, savings associated with the use of a supporting structure dedicated to sun shadings and scale economies brought about by the joint construction of the structural supporting frame and the PV system.
Finally, the first small-scale prototype of the modular tracking PV system, created with 3D-printed parts and driven by a microcontroller board, is presented. The realization of the physical prototype and the engineering of the movement mechanism confirmed the feasibility and functioning of the conceived system which, with appropriate modifications, can also be applied to other types of structures. On the other hand, it highlighted possible technological improvements that could offer greater energy performance on a real scale.
The main achievement of this paper is the definition, the detailed simulation and the early-stage prototyping of an innovative PVSD system, characterized by modular proportions, pleasant architectural features and high integration with a steel space truss, devoted to coverage of public spaces. The focus of the authors’ future work will be the real-scale design of the system components and a more in-depth cost–benefit analysis of the profitability of the system.

Author Contributions

Conceptualization, F.M. (Federico Minelli), D.D., M.M., F.M. (Francesco Minichiello) and P.D.; Software, F.M. (Federico Minelli), D.D., M.M., F.M. (Francesco Minichiello) and P.D.; Validation, F.M. (Federico Minelli), D.D., M.M., F.M. (Francesco Minichiello) and P.D.; Formal analysis, F.M. (Federico Minelli), D.D., M.M., F.M. (Francesco Minichiello) and P.D.; Investigation, F.M. (Federico Minelli), D.D., M.M., F.M. (Francesco Minichiello) and P.D.; Data curation, F.M. (Federico Minelli), D.D., M.M., F.M. (Francesco Minichiello) and P.D.; Writing—original draft, F.M. (Federico Minelli), D.D., M.M., F.M. (Francesco Minichiello) and P.D.; Writing—review & editing, F.M. (Federico Minelli), D.D., M.M., F.M. (Francesco Minichiello) and P.D.; Visualization, F.M. (Federico Minelli), D.D., M.M., F.M. (Francesco Minichiello) and P.D.; Supervision, F.M. (Federico Minelli), D.D., M.M., F.M. (Francesco Minichiello) and P.D. All authors have read and agreed to the published version of the manuscript.

Funding

This research received no external funding.

Data Availability Statement

Data available upon request.

Acknowledgments

The paper is the result of the joint research work of the authors, as the development of the prototyping design and ideation as activities of the REMLab (Laboratory of Surveying and Modeling, scientific coordinator: Pierpaolo D’Agostino) of the Department of Civil, Building and Environmental Engineering of the University of Naples Federico II. Moreover, the authors gratefully acknowledge the support of projects: “Sustainable Energy Systems for High Efficiency Buildings” CUP E65F21003190003 and “Programma Operativo Nazionale Ricerca e Innovazione 2014–2020—Azione IV.5 Dottorati su tematiche Green”.

Conflicts of Interest

The authors declare no conflict of interest.

Nomenclature

Acronyms
BAPVBuilding Applied Photovoltaic
BIPVBuilding Integrated Photovoltaic
EPBDEnergy Performance of Buildings Directive
HVACHeating Ventilation and Air Conditioning
IPEInteractive Prototyping Environment
KPIKey Performance Indicator
MPPTMaximum Power Point Tracking
nZEBNearly Zero Energy Building
NZEBNet Zero Energy Building
POAPlane of Array
PVSDPhotovoltaic Shading Device
PVPhotovoltaic
RESRenewable Energy Sources
STCStandard Test Conditions
TMYTypical Meteorological Year
ZEBZero Energy Building
Parameters
ACAlternating current (A)
DCDirect current (A)
DHIDiffuse horizontal irradiance (W/m2)
DNIDirect normal irradiance (W/m2)
GHIGlobal horizontal irradiance (W/m2)

References

  1. European Commission. Fit for 55—Delivering the EU’s 2030 Climate Target on the Way to Climate Neutrality; European Commission: Brussels, Belgium, 2021; p. 15. [Google Scholar]
  2. European Parliament. Regulation (eu) 2018/842 of the european parliament and of the council of 30 May 2018 on binding annual greenhouse gas emission reductions by Member States from 2021 to 2030 contributing to climate action to meet commitments under the Paris Agreement and amending Regulation (EU) No 525/2013 (Text with EEA relevance). Off. J. Eur. Union 2018, 156, 26–42. [Google Scholar]
  3. International Energy Agency (IEA). Buildings. A Source of Enormous Untapped Efficiency Potential. [Online]. Available online: https://www.iea.org/topics/buildings (accessed on 25 June 2023).
  4. Austin, M.C.; Solano, T.; Tejedor-Flores, N.; Quintero, V.; Boya, C.; Mora, D. Bio-inspired Approaches for Sustainable Cities Design in Tropical Climate. In Bionics and Sustainable Design; Palombini, F.L., Muthu, S.S., Eds.; Springer: Berlin/Heidelberg, Germany, 2022; pp. 333–365. [Google Scholar]
  5. Selvan, S.U.; Saroglou, S.T.; Mosca, F.; Tyc, J.; Joschinski, J.; Calbi, M.; Vogler, V.; Weisser, W.; Grobman, J.Y.; Barath, S. Multi-species Building Envelopes: Developing a multi-criteria design decision-making methodology for cohabitation. In Proceedings of the Human-Centric, Proceedings of the 28th International Conference of the Association for Computer-Aided Architectural Design Research in Asia (CAADRIA), Ahmedebad, India, 18 March 2023; pp. 645–654. [Google Scholar]
  6. Ciardiello, A.; Dell’Olmo, J.; Rosso, F.; Pastore, L.M.; Ferrero, M.; Salata, F. An Innovative Multi-objective Optimization Digital Workflow for Social Housing Deep Energy Renovation Design Process. In Technological Imagination in the Green and Digital Transition; Arbizzani, E., Cangelli, E., Clemente, C., Cumo, F., Giofrè, F., Giovenale, A.M., Palme, M., Paris, S., Eds.; Springer International Publishing: Berlin/Heidelberg, Germany, 2023; pp. 111–121. [Google Scholar]
  7. Gálvez, D.M.; Kerdan, I.G.; Carmona-Paredes, G. Assessing the Potential of Implementing a Solar-Based Distributed Energy System for a University Using the Campus Bus Stops. Energies 2022, 15, 3660. [Google Scholar] [CrossRef]
  8. Kalyan, S.; Sun, Q. Interrogating the Installation Gap and Potential of Solar Photovoltaic Systems Using GIS and Deep Learning. Energies 2022, 15, 3740. [Google Scholar] [CrossRef]
  9. Dong, J.; Jiang, Y.; Liu, D.; Dou, X.; Liu, Y.; Peng, S. Promoting dynamic pricing implementation considering policy incentives and electricity retailers’ behaviors: An evolutionary game model based on prospect theory. Energy Policy 2022, 167, 113059. [Google Scholar] [CrossRef]
  10. Barakat, S.; Ibrahim, H.; Elbaset, A.A. Multi-objective optimization of grid-connected PV-wind hybrid system considering reliability, cost, and environmental aspects. Sustain. Cities Soc. 2020, 60, 102178. [Google Scholar] [CrossRef]
  11. Sinha, S.; Chandel, S.S. Analysis of fixed tilt and sun tracking photovoltaic-micro wind based hybrid power systems. Energy Convers. Manag. 2016, 115, 265–275. [Google Scholar] [CrossRef]
  12. Calise, F.; Cappiello, F.L.; D’accadia, M.D.; Vicidomini, M. Dynamic modelling and thermoeconomic analysis of micro wind turbines and building integrated photovoltaic panels. Renew. Energy 2020, 160, 633–652. [Google Scholar] [CrossRef]
  13. Abdul-Ganiyu, S.; Quansah, D.A.; Ramde, E.W.; Seidu, R.; Adaramola, M.S. Techno-economic analysis of solar photovoltaic (PV) and solar photovoltaic thermal (PVT) systems using exergy analysis. Sustain. Energy Technol. Assess. 2021, 47, 101520. [Google Scholar] [CrossRef]
  14. Renno, C.; Petito, F.; D’agostino, D.; Minichiello, F. Modeling of a CPV/T-ORC Combined System Adopted for an Industrial User. Energies 2020, 13, 3476. [Google Scholar] [CrossRef]
  15. Bhat, R.; Begovic, M.; Kim, I.; Crittenden, J. Effects of PV on conventional generation. In Proceedings of the Annual Hawaii International Conference on System Sciences, Waikoloa, HI, USA, 6–9 January 2014; pp. 2380–2387. [Google Scholar]
  16. D’Agostino, D.; Minelli, F.; Minichiello, F. New genetic algorithm-based workflow for multi-objective optimization of Net Zero Energy Buildings integrating robustness assessment. Energy Build. 2023, 284, 112841. [Google Scholar] [CrossRef]
  17. Zarzavilla, M.; Quintero, A.; Abellán, M.A.; Serrano, F.L.; Austin, M.C.; Tejedor-Flores, N. Comparison of Environmental Impact Assessment Methods in the Assembly and Operation of Photovoltaic Power Plants: A Systematic Review in the Castilla—La Mancha Region. Energies 2022, 15, 1926. [Google Scholar] [CrossRef]
  18. D’Agostino, D.; Mazzella, S.; Minelli, F.; Minichiello, F. Obtaining the NZEB target by using photovoltaic systems on the roof for multi-storey buildings. Energy Build. 2022, 267, 112147. [Google Scholar] [CrossRef]
  19. D’Agostino, D.; Minelli, F.; D’Urso, M.; Minichiello, F. Fixed and tracking PV systems for Net Zero Energy Buildings: Comparison between yearly and monthly energy balance. Renew. Energy 2022, 195, 809–824. [Google Scholar] [CrossRef]
  20. Stadler, M.; Groissböck, M.; Cardoso, G.; Marnay, C. Optimizing Distributed Energy Resources and building retrofits with the strategic DER-CAModel. Appl. Energy 2014, 132, 557–567. [Google Scholar] [CrossRef]
  21. Almutairi, H.H.; Alajmi, A.F.; Ahmed, N.A. A techno-economic analysis of PV solar modules attached to vertical facades of a residential building in a hot arid climate. J. Eng. Res. 2022, 10, 108–123. [Google Scholar] [CrossRef]
  22. Kumar, N.M.; Sudhakar, K.; Samykano, M. Performance comparison of BAPV and BIPV systems with c-Si, CIS and CdTe photovoltaic technologies under tropical weather conditions. Case Stud. Therm. Eng. 2019, 13, 100374. [Google Scholar] [CrossRef]
  23. D’Agostino, P.; Minelli, F. Robustness Assessment of a Low Poly Modeling Strategy for Performance Simulation of Double-Skin Green Facades. In Proceedings of the ICGG 2020—Proceedings of the 19th International Conference on Geometry and Graphics—Advances in Intelligent Systems and Computing, São Paulo, Brazil, 9–13 August 2020; pp. 615–625. [Google Scholar]
  24. Nicoletti, F.; Carpino, C.; Cucumo, M.A.; Arcuri, N. The Control of Venetian Blinds: A Solution for Reduction of Energy Consumption Preserving Visual Comfort. Energies 2020, 13, 1731. [Google Scholar] [CrossRef] [Green Version]
  25. Bellia, L.; Diglio, F.; Fragliasso, F. Lighting Quality Self-assessment in Italian Home Offices. J. Daylighting 2022, 9, 177–196. [Google Scholar] [CrossRef]
  26. Badura, T.; Duchkov, H.; Horv, E. Urban Forestry & Urban Greening The value of the shading function of urban trees: A replacement cost approach. Urban For. Urban Green. 2021, 62, 127166. [Google Scholar]
  27. Nasrollahi, N.; Namazi, Y.; Taleghani, M. The effect of urban shading and canyon geometry on outdoor thermal comfort in hot climates: A case study of Ahvaz, Iran. Sustain. Cities Soc. 2020, 65, 102638. [Google Scholar] [CrossRef]
  28. Alawneh, R.; Ghazali, F.; Ali, H.; Sadullah, A.F. A Novel framework for integrating United Nations Sustainable Development Goals into sustainable non-residential building assessment and management in Jordan. Sustain. Cities Soc. 2019, 49, 101612. [Google Scholar] [CrossRef]
  29. De Soto, W.; Klein, S.; Beckman, W. Improvement and validation of a model for photovoltaic array performance. Sol. Energy 2006, 80, 78–88. [Google Scholar] [CrossRef]
  30. Faiman, D. Assessing the outdoor operating temperature of photovoltaic modules. Prog. Photovolt. Res. Appl. 2008, 16, 307–315. [Google Scholar] [CrossRef]
  31. ISO 15927-4:2005; Hygrothermal Performance of Buildings—Calculation and Presentation of Climatic Data—Part 4: Hourly Data for Assessing the Annual Energy Use for Heating and Cooling. ISO: Geneva, Switzerland, 2005.
  32. Huld, T.; Müller, R.; Gambardella, A. A new solar radiation database for estimating PV performance in Europe and Africa. Sol. Energy 2012, 86, 1803–1815. [Google Scholar] [CrossRef]
  33. Hernández-Callejo, L.; Gallardo-Saavedra, S.; Alonso-Gómez, V. A review of photovoltaic systems: Design, operation and maintenance. Solar Energy 2019, 188, 426–440. [Google Scholar] [CrossRef]
  34. Sinke, W.C. Development of photovoltaic technologies for global impact. Renew. Energy 2019, 138, 911–914. [Google Scholar] [CrossRef]
  35. Yaouba; Bajaj, M.; Welba, C.; Bernard, K.; Kitmo; Kamel, S.; El-Naggar, M.F. An Experimental and Case Study on the Evaluation of the Partial Shading Impact on PV Module Performance Operating Under the Sudano-Sahelian Climate of Cameroon. Front. Energy Res. 2022, 10, 1–13. [Google Scholar] [CrossRef]
  36. Aste, N.; Del Pero, C.; Leonforte, F. PV technologies performance comparison in temperate climates. Sol. Energy 2014, 109, 1–10. [Google Scholar] [CrossRef]
  37. Mussard, M. Solar energy under cold climatic conditions: A review. Renew. Sustain. Energy Rev. 2017, 74, 733–745. [Google Scholar] [CrossRef]
  38. Liu, F.; Bergh, J.C.V.D. Differences in CO2 emissions of solar PV production among technologies and regions: Application to China, EU and USA. Energy Policy 2020, 138, 111234. [Google Scholar] [CrossRef]
  39. Guzmán, A.B.; Vicencio, R.B.; Ardila-Rey, J.A.; Ahumada, E.N.; Araya, A.G.; Moreno, G.A. A Cost-Effective Methodology for Sizing Solar PV Systems for Existing Irrigation Facilities in Chile. Energies 2018, 11, 1853. [Google Scholar] [CrossRef] [Green Version]
  40. Skandalos, N.; Karamanis, D. An optimization approach to photovoltaic building integration towards low energy buildings in different climate zones. Appl. Energy 2021, 295, 117017. [Google Scholar] [CrossRef]
  41. Ciardiello, A.; Dell’Olmo, J.; Ferrero, M.; Pastore, L.M.; Rosso, F.; Salata, F. Energy Retrofit Optimization by Means of Genetic Algorithms as an Answer to Fuel Poverty Mitigation in Social Housing Buildings. Atmosphere 2023, 14, 1. [Google Scholar] [CrossRef]
  42. Luthander, R.; Widén, J.; Nilsson, D.; Palm, J. Photovoltaic self-consumption in buildings: A review. Appl. Energy 2015, 142, 80–94. [Google Scholar] [CrossRef] [Green Version]
  43. Erba, S.; Pagliano, L.; Shandiz, S.C.; Pietrobon, M. Energy consumption, thermal comfort and load match: Study of a monitored nearly Zero Energy Building in Mediterranean climate Energy consumption, thermal comfort and load match: Study of a monitored nearly Zero Energy Building in Mediterranean climate. IOP Conf. Ser. Mater. Sci. Eng. 2019, 609, 062026. [Google Scholar] [CrossRef]
  44. Erba, S.; Pagliano, L. Combining Sufficiency, Efficiency and Flexibility to Achieve Positive Energy Districts Targets. Energies 2021, 14, 4697. [Google Scholar] [CrossRef]
  45. Weniger, J.; Tjaden, T.; Quaschning, V. Sizing of Residential PV Battery Systems. Energy Procedia 2014, 46, 78–87. [Google Scholar] [CrossRef] [Green Version]
  46. Abdolmaleki, L.; Berardi, U. Comparative analysis among three solar energy-based systems with hydrogen and electrical battery storage in single houses. Energy Proc. 2021, 19, 321. [Google Scholar]
  47. Talent, O.; Du, H. Optimal sizing and energy scheduling of photovoltaic-battery systems under different tariff structures. Renew. Energy 2018, 129, 513–526. [Google Scholar] [CrossRef]
  48. Khatib, T.; Ibrahim, I.A.; Mohamed, A. A review on sizing methodologies of photovoltaic array and storage battery in a standalone photovoltaic system. Energy Convers. Manag. 2016, 120, 430–448. [Google Scholar] [CrossRef]
  49. Mason, K.; Reno, M.J.; Blakely, L.; Vejdan, S.; Grijalva, S. A deep neural network approach for behind-the-meter residential PV size, tilt and azimuth estimation. Solar Energy 2019, 196, 260–269. [Google Scholar] [CrossRef]
  50. Linssen, J.; Stenzel, P.; Fleer, J. Techno-economic analysis of photovoltaic battery systems and the influence of different consumer load profiles. Appl. Energy 2017, 185, 2019–2025. [Google Scholar] [CrossRef]
  51. Singh, R.; Kumar, S.; Gehlot, A.; Pachauri, R. An imperative role of sun trackers in photovoltaic technology: A review. Renew. Sustain. Energy Rev. 2018, 82, 3263–3278. [Google Scholar] [CrossRef]
  52. Racharla, S.; Rajan, K. Solar tracking system—A review. Int. J. Sustain. Eng. 2017, 10, 72–81. [Google Scholar]
  53. Awasthi, A.; Shukla, A.K.; Manohar, S.R.M.; Dondariya, C.; Shukla, K.N.; Porwal, D.; Richhariya, G. Review on sun tracking technology in solar PV system. Energy Rep. 2020, 6, 392–405. [Google Scholar] [CrossRef]
  54. Antonanzas, J.; Urraca, R.; Martinez-De-Pison, F.J.; Antonanzas, F. Optimal solar tracking strategy to increase irradiance in the plane of array under cloudy conditions: A study across Europe. Sol. Energy 2018, 163, 122–130. [Google Scholar] [CrossRef]
  55. Tina, G.M.; Gagliano, S.; Graditi, G.; Merola, A. Experimental validation of a probabilistic model for estimating the double axis PV tracking energy production. Appl. Energy 2012, 97, 990–998. [Google Scholar] [CrossRef]
  56. Sumathi, V.; Jayapragash, R.; Bakshi, A.; Akella, P.K. Solar tracking methods to maximize PV system output—A review of the methods adopted in recent decade. Renew. Sustain. Energy Rev. 2017, 74, 130–138. [Google Scholar] [CrossRef]
  57. Hafez, A.Z.; Yousef, A.M.; Harag, N.M. Solar tracking systems: Technologies and trackers drive types—A review. Renew. Sustain. Energy Rev. 2018, 91, 754–782. [Google Scholar] [CrossRef]
  58. Vieira, R.; Guerra, F.; Vale, M.; Araújo, M. Comparative performance analysis between static solar panels and single-axis tracking system on a hot climate region near to the equator. Renew. Sustain. Energy Rev. 2016, 64, 672–681. [Google Scholar] [CrossRef]
  59. Ruelas, J.; Muñoz, F.; Lucero, B.; Palomares, J. PV Tracking Design Methodology Based on an Orientation Efficiency Chart. Appl. Sci. 2019, 9, 894. [Google Scholar] [CrossRef] [Green Version]
  60. Lim, B.-H.; Lim, C.-S.; Li, H.; Hu, X.-L.; Chong, K.-K.; Zong, J.-L.; Kang, K.; Tan, W.-C. Industrial design and implementation of a large-scale dual-axis sun tracker with a vertical-axis-rotating-platform and multiple-row-elevation structures. Sol. Energy 2020, 199, 596–616. [Google Scholar] [CrossRef]
  61. Safan, Y.M.; Shaaban, S.; Abu El-Sebah, M.I. Performance evaluation of a multi-degree of freedom hybrid controlled dual axis solar tracking system. Sol. Energy 2018, 170, 576–585. [Google Scholar] [CrossRef]
  62. Hohne, P.; Kusakana, K.; Numbi, B. Model validation and economic dispatch of a dual axis pv tracking system connected to energy storage with grid connection: A case of a healthcare institution in South Africa. J. Energy Storage 2020, 32, 101986. [Google Scholar] [CrossRef]
  63. Muñoz-Cerón, E.; Lomas, J.C.; Aguilera, J.; de la Casa, J. Influence of Operation and Maintenance expenditures in the feasibility of photovoltaic projects: The case of a tracking pv plant in Spain. Energy Policy 2018, 121, 506–518. [Google Scholar] [CrossRef]
  64. Gonzalo, A.P.; Marugán, A.P.; Márquez, F.P.G. Survey of maintenance management for photovoltaic power systems. Renew. Sustain. Energy Rev. 2020, 134, 110347. [Google Scholar] [CrossRef]
  65. Jaysawal, R.K.; Chakraborty, S.; Elangovan, D.; Padmanaban, S. Concept of net zero energy buildings (NZEB) - A literature review. Clean. Eng. Technol. 2022, 11, 100582. [Google Scholar] [CrossRef]
  66. Curpek, J.; Cekon, M.; Hraska, J. PCM Integrated in BiPV Ventilated Facąde Concepts: Experimental Test Cell Platform and Initial Full-Scale Measurements. IOP Conf. Ser. Earth Environ. Sci. 2019, 290, 2019. [Google Scholar] [CrossRef]
  67. Čurpek, J.; Čekon, M. Building performance simulation of a photovoltaic façade enhanced with latent heat storage: Model validation and power generation prediction. J. Energy Storage 2022, 56, 106143. [Google Scholar] [CrossRef]
  68. Čurpek, J.; Čekon, M.; Šikula, O.; Slávik, R. Thermodynamic responses of adaptive mechanisms in BiPV façade systems coupled with latent thermal energy storage. Energy Build. 2023, 279, 112665. [Google Scholar] [CrossRef]
  69. Čurpek, J.; Čekon, M. Climate response of a BiPV façade system enhanced with latent PCM-based thermal energy storage. Renew. Energy 2020, 152, 368–384. [Google Scholar] [CrossRef]
  70. PØstergaard, P.A.; Duic, N.; Noorollahi, Y.; Mikulcic, H.; Kalogirou, S. Sustainable development using renewable energy technology. Renew. Energy 2020, 146, 2430–2437. [Google Scholar] [CrossRef]
  71. Shono, K.; Yamaguchi, Y.; Perwez, U.; Ma, T.; Dai, Y.; Shimoda, Y. Large-scale building-integrated photovoltaics installation on building façades: Hourly resolution analysis using commercial building stock in Tokyo, Japan. Sol. Energy 2023, 253, 137–153. [Google Scholar] [CrossRef]
  72. Zhang, X.; Lau, S.K.; Lau, S.S.Y.; Zhao, Y. Photovoltaic integrated shading devices (PVSDs): A review. Solar Energy 2018, 170, 947–968. [Google Scholar] [CrossRef]
  73. Settino, J.; Carpino, C.; Perrella, S.; Arcuri, N. Multi-Objective Analysis of a Fixed Solar Shading System in Different Climatic Areas. Energies 2020, 13, 3249. [Google Scholar] [CrossRef]
  74. Al-Masrani, S.M.; Al-Obaidi, K.M. Dynamic shading systems: A review of design parameters, platforms and evaluation strategies. Autom. Constr. 2019, 102, 195–216. [Google Scholar] [CrossRef] [Green Version]
  75. Kirimtat, A.; Tasgetiren, M.F.; Brida, P.; Krejcar, O. Control of PV integrated shading devices in buildings: A review. Build. Environ. 2022, 214, 108961. [Google Scholar] [CrossRef]
  76. Valladares-Rendón, L.G.; Schmid, G.; Lo, S.-L. Review on energy savings by solar control techniques and optimal building orientation for the strategic placement of façade shading systems. Energy Build. 2017, 140, 458–479. [Google Scholar] [CrossRef]
  77. Budhiyanto, A.; Suryabrata, J.A.; Saragih, S. Study of shading device building-integrated photovoltaic performance on energy saving. J. Urban Environ. Eng. 2017, 11, 202–208. [Google Scholar]
  78. Ibraheem, Y.; Piroozfar, P.; Farr, E.R.P.; Ravenscroft, N. Energy Production Analysis of Photovoltaic Shading Devices (PVSD) in Integrated Façade Systems (IFS). Front. Built Environ. 2020, 6, 1–12. [Google Scholar] [CrossRef]
  79. Luo, Y.; Zhang, L.; Liu, Z.; Xie, L.; Wang, X.; Wu, J. Experimental study and performance evaluation of a PV-blind embedded double skin façade in winter season. Energy 2018, 165, 326–342. [Google Scholar] [CrossRef]
  80. Baghoolizadeh, M.; Nadooshan, A.A.; Raisi, A.; Malekshah, E.H. The effect of photovoltaic shading with ideal tilt angle on the energy cost optimization of a building model in European cities. Energy Sustain. Dev. 2022, 71, 505–516. [Google Scholar] [CrossRef]
  81. Liu, J.; Bi, G.; Gao, G.; Zhao, L. Optimal design method for photovoltaic shading devices (PVSDs) by combining geometric optimization and adaptive control model. J. Build. Eng. 2023, 69, 106101. [Google Scholar] [CrossRef]
  82. Akbari Paydar, M. Optimum design of building integrated PV module as a movable shading device. Sustain. Cities Soc. 2020, 62, 102368. [Google Scholar] [CrossRef]
  83. Custódio, I.; Quevedo, T.; Melo, A.; Rüther, R. A holistic approach for assessing architectural integration quality of solar photovoltaic rooftops and shading devices. Sol. Energy 2022, 237, 432–446. [Google Scholar] [CrossRef]
  84. Mandalaki, M.; Papantoniou, S.; Tsoutsos, T. Assessment of energy production from photovoltaic modules integrated in typical shading devices. Sustain. Cities Soc. 2014, 10, 222–231. [Google Scholar] [CrossRef]
  85. Tedeschi, A. AAD_Algorithms-Aided Design. Parametric strategies using Grasshopper; Le Penseur: Potenza, Italy, 2018. [Google Scholar]
  86. Roudsari, M.S.; Pak, M. Ladybug: A parametric environmental plugin for grasshopper to help designers create an environmentally-conscious design. In Proceedings of the BS 2013: 13th Conference of the International Building Performance Simulation Association, Chambery, France, 25–28 August 2013; pp. 3128–3135. [Google Scholar]
  87. ASHRAE. International Weather files for Energy Calculations (IWEC weather files). User’s manual and CD-ROM; American Society of Heating, Refrigerating and Air-Conditioning Engineers: Atlanta, GA, USA, 2017. [Google Scholar]
  88. Jentsch, M.F.; James, P.A.B.; Bourikas, L.; Bahaj, A.B.S. Transforming existing weather data for worldwide locations to enable energy and building performance simulation under future climates. Renew. Energy 2013, 55, 514–524. [Google Scholar] [CrossRef]
  89. Firefly. Available online: http://www.fireflyexperiments.com (accessed on 25 June 2023).
  90. Arduino. Available online: http://arduino.cc/en/ (accessed on 25 June 2023).
  91. Duffie, J.A.; Beckman, W.A. Solar Engineering of Thermal Processes, 4th ed.; John Wiley & Sons Inc.: Hoboken, NJ, USA, 2013. [Google Scholar]
  92. King, D.; Kratochvil, J.; Boyson, W.; Bower, W. Field Experience with a New Performance Characterization Procedure for Photovoltaic Arrays. In Proceedings of the 2nd World Conference and Exhibition on Photovoltaic Solar Energy Conversion, Vienna, Austria, 6–10 July 1998. [Google Scholar]
  93. Standard 93-77; Methods of Testing to Determine the Thermal Performance of Solar Collectors. ASHRAE: New York, NY, USA, 1977.
  94. Martin, N.; Ruiz, J.M. Calculation of the PV modules angular losses under field conditions by means of an analytical model. Sol. Energy Mater. Sol. Cells 2001, 70, 25–38. [Google Scholar] [CrossRef]
  95. Driesse, A.; Jain, P.; Harrison, S. Beyond the curves: Modeling the electrical efficiency of photovoltaic inverters. In Proceedings of the Conference Record of the IEEE Photovoltaic Specialists Conference, San Diego, CA, USA, 11–16 May 2008. [Google Scholar]
  96. Berardi, U.; Graham, J. Investigation of the impacts of microclimate on PV energy efficiency and outdoor thermal comfort. Sustain. Cities Soc. 2020, 62, 102402. [Google Scholar] [CrossRef]
  97. Freitas, J.d.S.; Cronemberger, J.; Soares, R.M.; Amorim, C.N.D. Modeling and assessing BIPV envelopes using parametric Rhinoceros plugins Grasshopper and Ladybug. Renew. Energy 2020, 160, 1468–1479. [Google Scholar] [CrossRef]
  98. Ibrahim, H.; Wagdy, A.; Beccarelli, P.; Carpenter, R.; Chilton, J. Applicability of Flexible Photovoltaic Modules onto Membrane Structures Using Grasshopper Integrative Model. Procedia Eng. 2016, 155, 379–387. [Google Scholar] [CrossRef] [Green Version]
  99. D’Agostino, P.; Minelli, F. Automated design process for cost-effective sustainable architecture. A performance based approach. Sustain. Mediterr. Constr. 2020, 11, 111–116. [Google Scholar]
  100. Hamid, Y.S.; Rahim, N.N.A. Optimization on Geometry Design of Double-Layer Space Trusses. In Proceedings of the 5th International Conference on Sustainable Civil Engineering Structures and Construction Materials; Springer Nature: Singapore, 2022; pp. 895–910. [Google Scholar]
  101. Formisano, A.; Mazzolani, F.M. Numerical Investigation of a New Aluminium Alloy Reticular Space Structure. In Proceedings of the Ninth International Conference on Computational Structures Technology, Athens, Greece, 2–5 September 2008. [Google Scholar]
  102. Bakhshi, R.; Sadeh, J.; Mosaddegh, H.R. Optimal economic designing of grid-connected photovoltaic systems with multiple inverters using linear and nonlinear module models based on Genetic Algorithm. Renew. Energy 2014, 72, 386–394. [Google Scholar] [CrossRef]
  103. Urraca, R.; Huld, T.; Lindfors, A.V.; Riihelä, A.; Martinez-de-Pison, F.J.; Sanz-Garcia, A. Quantifying the amplified bias of PV system simulations due to uncertainties in solar radiation estimates. Sol. Energy 2018, 176, 663–677. [Google Scholar] [CrossRef] [Green Version]
  104. Huld, T.; Súri, M.; Dunlop, E.D.; Albuisson, M.; Wald, L. Integration of HELIOCLIM-1 Database Into PV-GIS to Estimate Solar Electricity Potential in Africa. In Proceedings of the 20th European Photovoltaic Solar Energy Conference and Exhibition, Barcelona, Spain, 6–10 June 2005; p. 2989. [Google Scholar]
  105. Psiloglou, B.E.; Kambezidis, H.D.; Kaskaoutis, D.G.; Karagiannis, D.; Polo, J.M. Comparison between MRM simulations, CAMS and PVGIS databases with measured solar radiation components at the Methoni station, Greece. Renew. Energy 2020, 146, 1372–1391. [Google Scholar] [CrossRef]
  106. Huld, T.; Paietta, E.; Zangheri, P.; Pascua, I.P. Assembling Typical Meteorological Year Data Sets for Building Energy Performance Using Reanalysis and Satellite-Based Data. Atmosphere 2018, 9, 53. [Google Scholar] [CrossRef] [Green Version]
  107. Sumathi, S.; Kumar, L.A.; Surekha, P. Models Used to Assess the Performance of Solar PV Systems. In Solar PV and Wind Energy Conversion Systems, Green Energy and Technology; Springer: Berlin/Heidelberg, Germany, 2015; pp. 651–790. [Google Scholar]
  108. Ramalingam, K.; Indulkar, C. Solar Energy and Photovoltaic Technology; Elsevier Inc.: Amsterdam, The Netherlands, 2017. [Google Scholar]
  109. Sandia National Laboratories. Available online: https://www.sandia.gov/ (accessed on 25 June 2023).
  110. Hottel, H.; Whillier, A. Evaluation of flat plate collector performance. In Transactions of the Conference on the Use of Solar Energy; University of Arizona Press: Tucson, AZ, USA, 1955; Volume 2, p. 74. [Google Scholar]
  111. Li, W.; Zhang, G.; Pan, T.; Zhang, Z.; Geng, Y.; Wang, J. A Lipschitz Optimization-Based MPPT Algorithm for Photovoltaic System under Partial Shading Condition. IEEE Access 2019, 7, 126323–126333. [Google Scholar] [CrossRef]
  112. Kitmo; Djidimbélé, R.; Kidmo, D.K.; Tchaya, G.B.; Djongyang, N. Optimization of the power flow of photovoltaic generators in electrical networks by MPPT algorithm and parallel active filters. Energy Rep. 2021, 7, 491–505. [Google Scholar] [CrossRef]
  113. Dey, A.K.; Sohn, T.; Streng, S.; Kodama, J. iCAP: Interactive Prototyping of Context-Aware Applications. In Proceedings of the Pervasive Computing, Pervasive 2006, Lecture Notes in Computer Science, Sydney, Australia, 19–22 May 2006; pp. 254–271. [Google Scholar]
  114. Ultimaker Cura. Available online: https://ultimaker.com/ (accessed on 25 June 2023).
  115. Besagni, G.; Vilà, L.P.; Borgarello, M. Italian household load profiles: A monitoring campaign. Buildings 2020, 10, 217. [Google Scholar] [CrossRef]
  116. Guarino, F.; Cassarà, P.; Longo, S.; Cellura, M.; Ferro, E. Load match optimisation of a residential building case study: A cross-entropy based electricity storage sizing algorithm. Appl. Energy 2015, 154, 380–391. [Google Scholar] [CrossRef]
  117. Cao, S.; Hasan, A.; Sirén, K. On-site energy matching indices for buildings with energy conversion, storage and hybrid grid connections. Energy Build. 2013, 64, 423–438. [Google Scholar] [CrossRef]
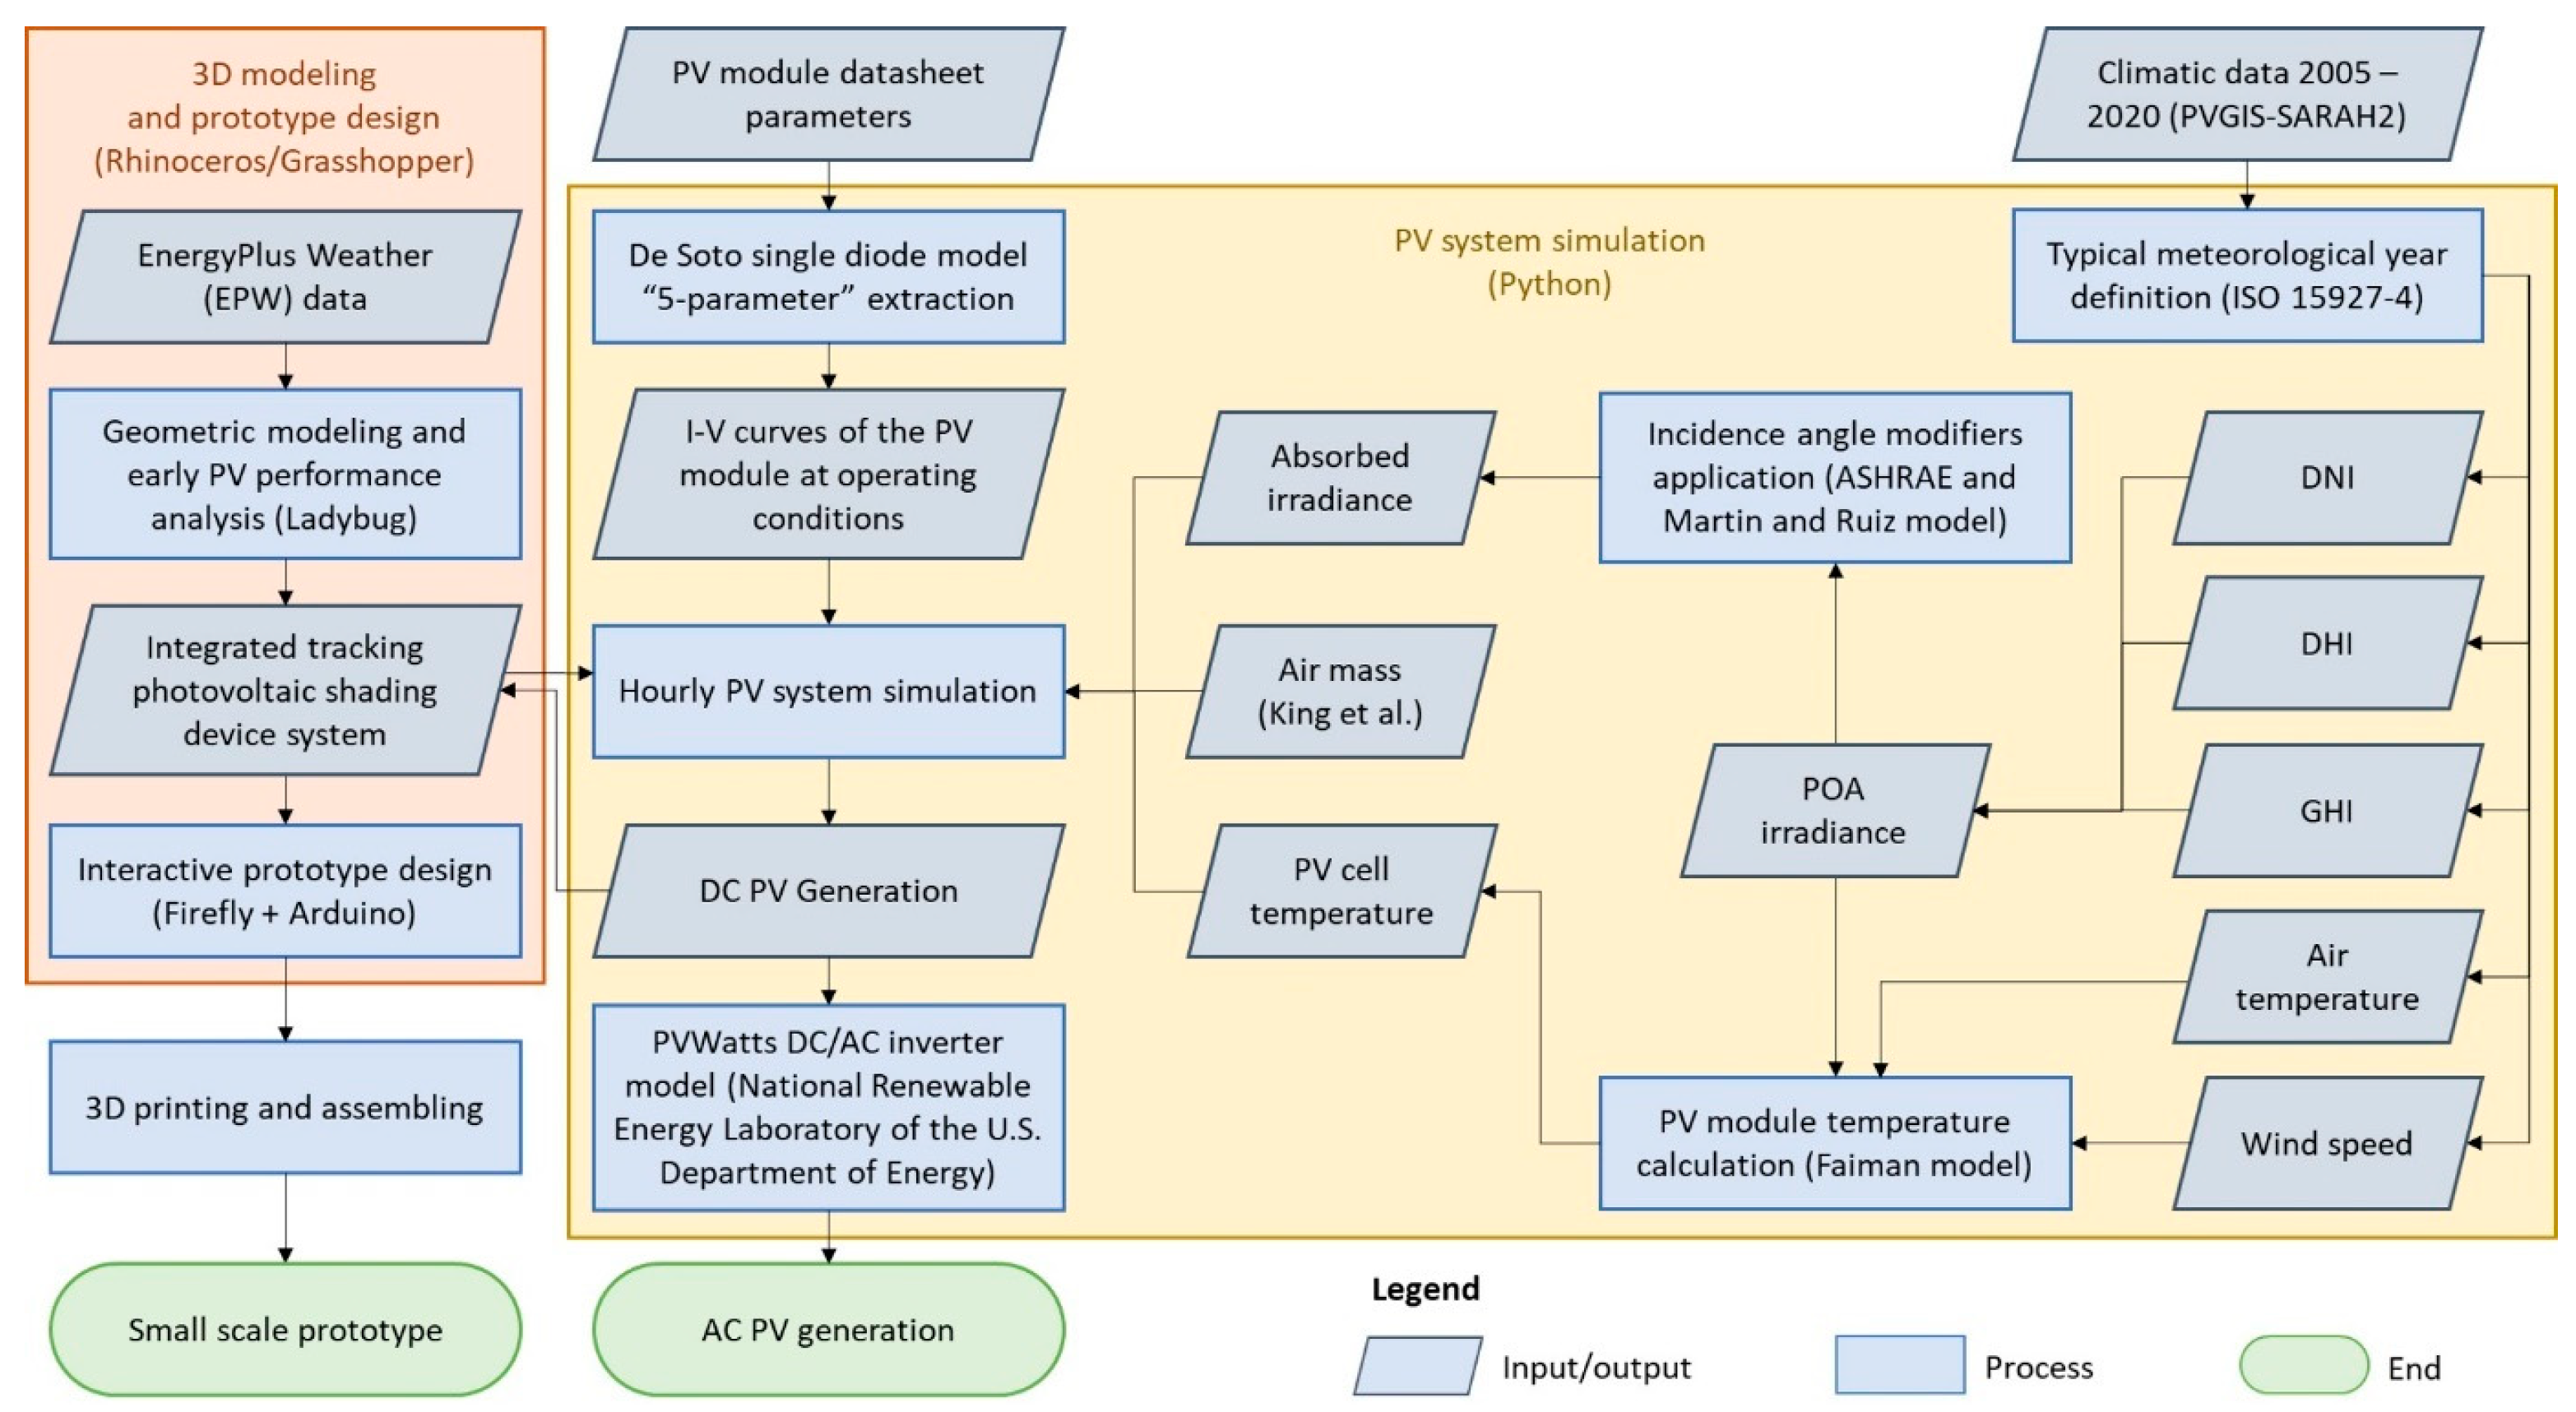
Figure 1. Workflow of the design and the detailed performance simulation of the modular and integrated tracking PV shading device [92].
Energies 16 05786 g001
Figure 2. The layout of the hexagonal modular solar tracking PV panels.
Energies 16 05786 g002
Figure 3. Integration of modular solar tracking PV panels into the structural framework: (a) minimum tilt angle equal to 10° and (b) maximum tilt angle equal to 70°.
Energies 16 05786 g003
Figure 4. Geometrical study of the tracking system mechanism.
Energies 16 05786 g004
Figure 5. Climate data from TMY for Santa Maria Capua Vetere (Southern Italy).
Energies 16 05786 g005aEnergies 16 05786 g005b
Figure 6. The wind rose diagram of TMY for Santa Maria Capua Vetere (Southern Italy).
Energies 16 05786 g006
Figure 7. Single-diode equivalent circuit.
Energies 16 05786 g007
Figure 8. PV module I/V (current/voltage) curves.
Energies 16 05786 g008
Figure 9. (a) Aerial view of the case study area and (b) satellite view of the case study area when used as a market.
Energies 16 05786 g009
Figure 10. (a) The layout of the case study area. The different market areas are highlighted in color: (b) in green, general purpose market; (c) in orange, second-hand market; (d) in blue, fruit and vegetable market and street food.
Energies 16 05786 g010
Figure 11. Analysis of the hours of direct solar radiation: (a) 21 March, (b) 21 June, (c) 21 September and (d) 21 December.
Energies 16 05786 g011
Figure 12. Ground-level images of the market area. The existing traditional shading devices can be seen.
Energies 16 05786 g012aEnergies 16 05786 g012b
Figure 13. Rendered overview of the case study area with the deployment of several modular tracking PV-integrated shading devices.
Energies 16 05786 g013
Figure 14. Exploded view of the solar tracking mechanism.
Energies 16 05786 g014
Figure 15. Exploded view of the solar tracking module.
Energies 16 05786 g015
Figure 16. Rendered images of the prototype.
Energies 16 05786 g016
Figure 17. AC energy generation of the PV power plant.
Energies 16 05786 g017
Figure 18. Total AC power of the PV power plant (hourly resolution).
Energies 16 05786 g018
Figure 19. PV simulation results for the days between 18 and 24 March.
Energies 16 05786 g019
Figure 20. PV simulation results for the days between 18 and 24 June.
Energies 16 05786 g020
Figure 21. PV simulation results for the days between 18 and 24 September.
Energies 16 05786 g021aEnergies 16 05786 g021b
Figure 22. PV simulation results for the days between 18 and 24 December.
Energies 16 05786 g022
Figure 23. Daily comparison of the PV yield of the three analyzed systems (proposed modular tracking system, Southeast–South–Southwest exposure fixed system and South exposure fixed system) for the months of March, June, September, and December.
Energies 16 05786 g023aEnergies 16 05786 g023b
Figure 24. Comparison between monthly energy generation of tracking and fixed PV systems.
Energies 16 05786 g024
Figure 25. Rendered image of the case study application of the modular PV system.
Energies 16 05786 g025
Figure 26. Picture of the actual small-scale prototype.
Energies 16 05786 g026
Table 1. PV module parameters at STC.
PV Module Manufacturer Parameters
Cell TypeMonocrystalline Silicon
Maximum power (PMAX) (W)120
Voltage at maximum power point (VMPP) (V)18
Current at maximum power point (IMPP) (A)6.67
Open circuit voltage (VOC) (V)21.6
Short circuit current (ISC) (A)7.72
Temperature coefficient of ISC (%/°C)0.035
Temperature coefficient of VOC (%/°C)0.37
Cells in series4 × 9
STC cell temperature (°C)25
STC irradiance (W/m2)1000
STC air mass1.5
Disclaimer/Publisher’s Note: The statements, opinions and data contained in all publications are solely those of the individual author(s) and contributor(s) and not of MDPI and/or the editor(s). MDPI and/or the editor(s) disclaim responsibility for any injury to people or property resulting from any ideas, methods, instructions or products referred to in the content.