Article

Hydrodynamic and Electrochemical Analysis of Compression and Flow Field Designs in Vanadium Redox Flow Batteries

by
Snigdha Saha
1,
Kranthi Kumar Maniam
2,
Shiladitya Paul
2,3 and
Venkata Suresh Patnaikuni
1,*
1
Department of Chemical Engineering, National Institute of Technology Warangal, Warangal 506004, Telangana, India
2
Materials Innovation Centre, School of Engineering, University of Leicester, Leicester LE1 7RH, UK
3
Materials Performance and Integrity Group, TWI, Granta Park, Cambridge CB21 6AL, UK
*
Author to whom correspondence should be addressed.
Energies 2023, 16(17), 6311; https://doi.org/10.3390/en16176311
Submission received: 20 July 2023 / Revised: 19 August 2023 / Accepted: 24 August 2023 / Published: 30 August 2023
(This article belongs to the Special Issue Advances in Power Electronics Technologies)

Abstract

:
This numerical study investigates compression and flow field design effects on electrode behaviour in vanadium redox flow batteries (VRFBs). Through 3D simulations and analysis of various flow field designs, including conventional, serpentine, interdigitated, and parallel configurations, this study investigates three compression scenarios: uncompressed, non-homogeneously compressed, and homogeneously compressed electrodes. Hydrodynamic and electrochemical analyses reveal the impact on velocity, pressure, current density, overpotential, and charge–discharge performance. Interdigitated flow field is found to display the lowest charging potential and highest discharging potential among all flow fields under all three compression scenarios. Moreover, uncompressed electrode condition shows the conservative estimates of an average charging potential of 1.3647 V and average discharging potential of 1.3231 V in the case of interdigitated flow field, while compressed electrode condition and the non-homogeneously compressed electrode condition show an average charging potential of 1.3922 V and 1.3777 V, and an average discharging potential of 1.3019 V and 1.3224 V, respectively. Results highlight the significance of non-uniform compression while modelling and analysing the performance of VRFBs as it is a more realistic representation compared to the no-compression or homogeneous compression of the electrodes. The findings of this work provide insights for optimising VRFB performance by considering compression and flow field design.

Graphical Abstract

1. Introduction

The pursuit of efficient and sustainable energy solutions has spurred interest in advanced energy storage technologies. Among them, vanadium redox flow batteries (VRFBs) have emerged as highly promising options due to their impressive energy storage capacity, extended cycle life, design flexibility, and scalability. VRFBs offer grid-scale energy storage capabilities, allowing independence from geographical constraints and facilitating the integration of energy from renewable sources into the electrical grid [1,2,3]. This paper explores the potential of VRFBs as reliable and sustainable solutions for meeting the increasing demand for efficient energy storage.
A typical VRFB system consists of stacks connected to electrolyte storage tanks and pumps for electrolyte circulation, as shown in Figure 1. The stacks comprise multiple cells with electrodes separated by a proton exchange membrane, along with bipolar plates (BPP) for efficient transmission of electricity [3]. The performance of VRFBs is influenced by various factors, including electrode design and operating environment. The flow field design of VRFBs plays a crucial role in uniform electrolyte distribution across the electrode surface, promoting efficient mass transfer and minimising concentration gradients [4]. Achieving an optimal flow field design is essential to enhance the overall flow battery cell performance and efficiency of the VRFBs [5].
Another critical aspect of electrode behaviour that affects the overall performance of VRFBs is the compression of the electrodes [6,7]. When the cell is assembled, the membrane electrode assembly comprising the electrodes and membrane are tightly pressed at the peripheral area by gaskets to avoid leakage of electrolytes and compressed by BPPs to have minimum contact resistance with the electrodes. Due to the absence of the flow field channels in the electrodes with conventional flow field, compression is homogeneous. On the contrary, the electrodes are compressed non-homogeneously in the case of flow fields with different design configurations. The region beneath the ribs of the distributor is completely compressed to the given extent, but part of the electrodes falling under the channel region are not compressed as much and a portion of them intrudes into the channel, thereby reducing the channel flow area [8,9]. Since the pressures exerted on the rib, channel, and intruded region differ, they influence the electrode compression and can often lead to changes in the porous matrix properties of electrodes. Therefore, electrode compression plays a vital role in optimising mass transport and electrolyte flow in the porous electrodes, ultimately influencing the fluid flow, electrochemical reactions within the cell, and efficiency and performance of the redox flow battery [7,10,11].
Different compression scenarios, such as homogeneous and non-homogeneous compression, as shown in Figure 2, have been investigated to understand their effects on performance [7,12]. Studies have shown that optimised compression can improve cell performance by increasing the active reaction area and mass transport while minimising current density and overpotential [6,13]. However, excessive compression can lead to reduced electrolyte transport, longer charge/discharge times, and increased cell resistance, negatively impacting the VRFB’s overall performance [14]. However, the influence of compression on the flow field and its subsequent impact on the electrochemical performance of VRFBs is not yet fully understood. Therefore, understanding the effect of compression on electrode behaviour in VRFBs is crucial for enhancing their overall performance and efficiency. Computational fluid dynamics (CFD) models are essential for understanding the physical phenomena associated with flow field design configurations and optimising the performance of VRFB systems [15].
Numerous studies have focused on CFD-based modelling to investigate the performance of VRFBs with different flow field configurations. Xu et al. [16] simulated three types of flow field configurations (conventional, serpentine, and parallel) and assessed their suitability based on power-based efficiency calculations. Yin et al. [17] studied and compared the performance of conventional, interdigitated, and serpentine flow field configurations in terms of convective mass transport, pump power consumption, and sealing pressure demand. Messaggi et al. [18] analysed the effect of two different flow field designs: single serpentine and interdigitated on the pressure drop, electrochemical performance, and flow distribution patterns. These studies demonstrated the impact of flow field design on the performance of VRFBs. Tugrul et al. [19] investigated the impact of convection on electrochemical performance using strip cell structure and reported that electrolyte flow velocity in electrodes is directly proportional to the total current in the cell, but no correlation exists between velocity in the channel and current. To simplify the assembling process, Chih et al. [20] integrally molded a bipolar plate and performed a simulation to study the impact of the gate position to reduce air traps. Wei et al. [21] modified the conventional serpentine flow field into a convection-enhanced serpentine flow field with repatterned flow path. This design induces a high pressure drop between adjacent channels, thus improving under the rib convection. they also concluded that there is a critical flow rate beyond which energy efficiency becomes constant for the given current density. Pan et al. [22] also improved the design of conventional serpentine flow field with gradient channel depth along the flow path from inlet to outlet for VRFB. The convections gradually became better, making up for the drop in active species concentration. The maximum voltage efficiency at the pump was achieved with the 25% optimised gradient.
In a series of studies, researchers have investigated the effect of compression on the performance of flow battery cells, specifically focusing on the flow field designs on the bipolar plate of the cells. Su et al. [12] constructed a 3D model of a fuel cell to simulate the compression scenarios of uncompressed, homogeneously compressed, and non-homogeneously compressed gas diffusion layers (GDLs) in the case of PEM fuel cells. Their results showed that cell performance followed the trend of uncompressed > non-homogeneously compressed > homogeneously compressed, highlighting the influence of GDL transport properties on compression. Other studies examined the impact of compression ratios on various aspects of cell performance. Jyothi Latha and Jayanti [23] studied the flow field hydrodynamics in a single VRFB cell and found that compression affected pressure drop and permeability. Park et al. [14] observed improved energy efficiency in VRFB cells with up to 20% compression, but performance deteriorated beyond that point. Chang et al. [7] studied the effects of compression employing different electrode materials and demonstrated positive impacts on durability and performance. Other studies also explored the influence of compression on resistance, porosity, hydraulic permeability, and electrode morphology. Wang et al. [13] investigated the mechanical, hydrodynamic, and performance characteristics of VRFBs with different compression ratios. Chin et al. [24] demonstrated that an increase in compression ratio decreased the ohmic and concentration overpotential up to a particular percentage of compression for given system. Beyond the threshold, it only contributes to lower ohmic overpotential. Overall, these studies provide insights into the relationship between compression and cell performance, suggesting optimal compression ratios and strategies for improving performance.
Although previous studies have individually explored the influence of different flow field configurations and electrode compression on VRFB performance, there is a lack of comprehensive comparisons involving both factors simultaneously. In this study, a full-scale 3D computational model with a comparative assessment of the performance of VRFBs with different flow field configurations (conventional, parallel, serpentine, and interdigitated) and three compression scenarios (uncompressed, homogeneously compressed, and non-homogeneously compressed) is presented.
The novelty of this work lies in its comprehensive approach that simultaneously considers the interplay between flow field configurations and electrode compression; a combination that has not been extensively explored in previous studies. This approach allows for a holistic assessment of their combined impact on VRFB behaviour. The study employs computational models and simulation techniques to analyse the intricate interplay between compression, mass transport, and electrochemical reactions within the VRFB system. Moreover, it compares the 3D numerical characterisation of non-homogeneously compressed electrodes on different flow field configurations employing coupled fluid flow and electrochemistry. To assess the effectiveness of VRFB for four different flow field configurations: (i) conventional (no flow field), (ii) parallel, (iii) serpentine, and (iv) interdigitated, a full-scale 3D computational model is presented through the integration of multiphysics models of hydrodynamics and electrochemical reactions.

2. Model Development

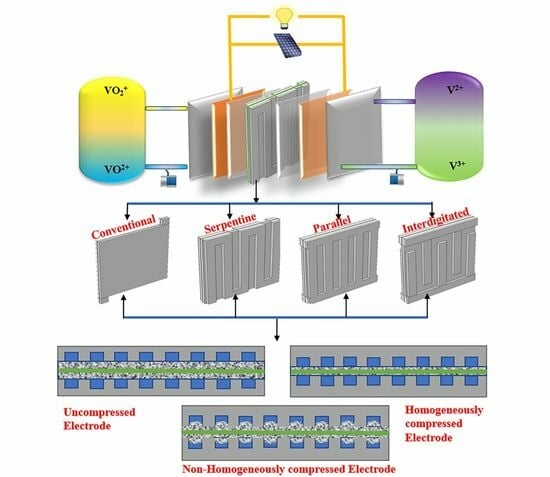
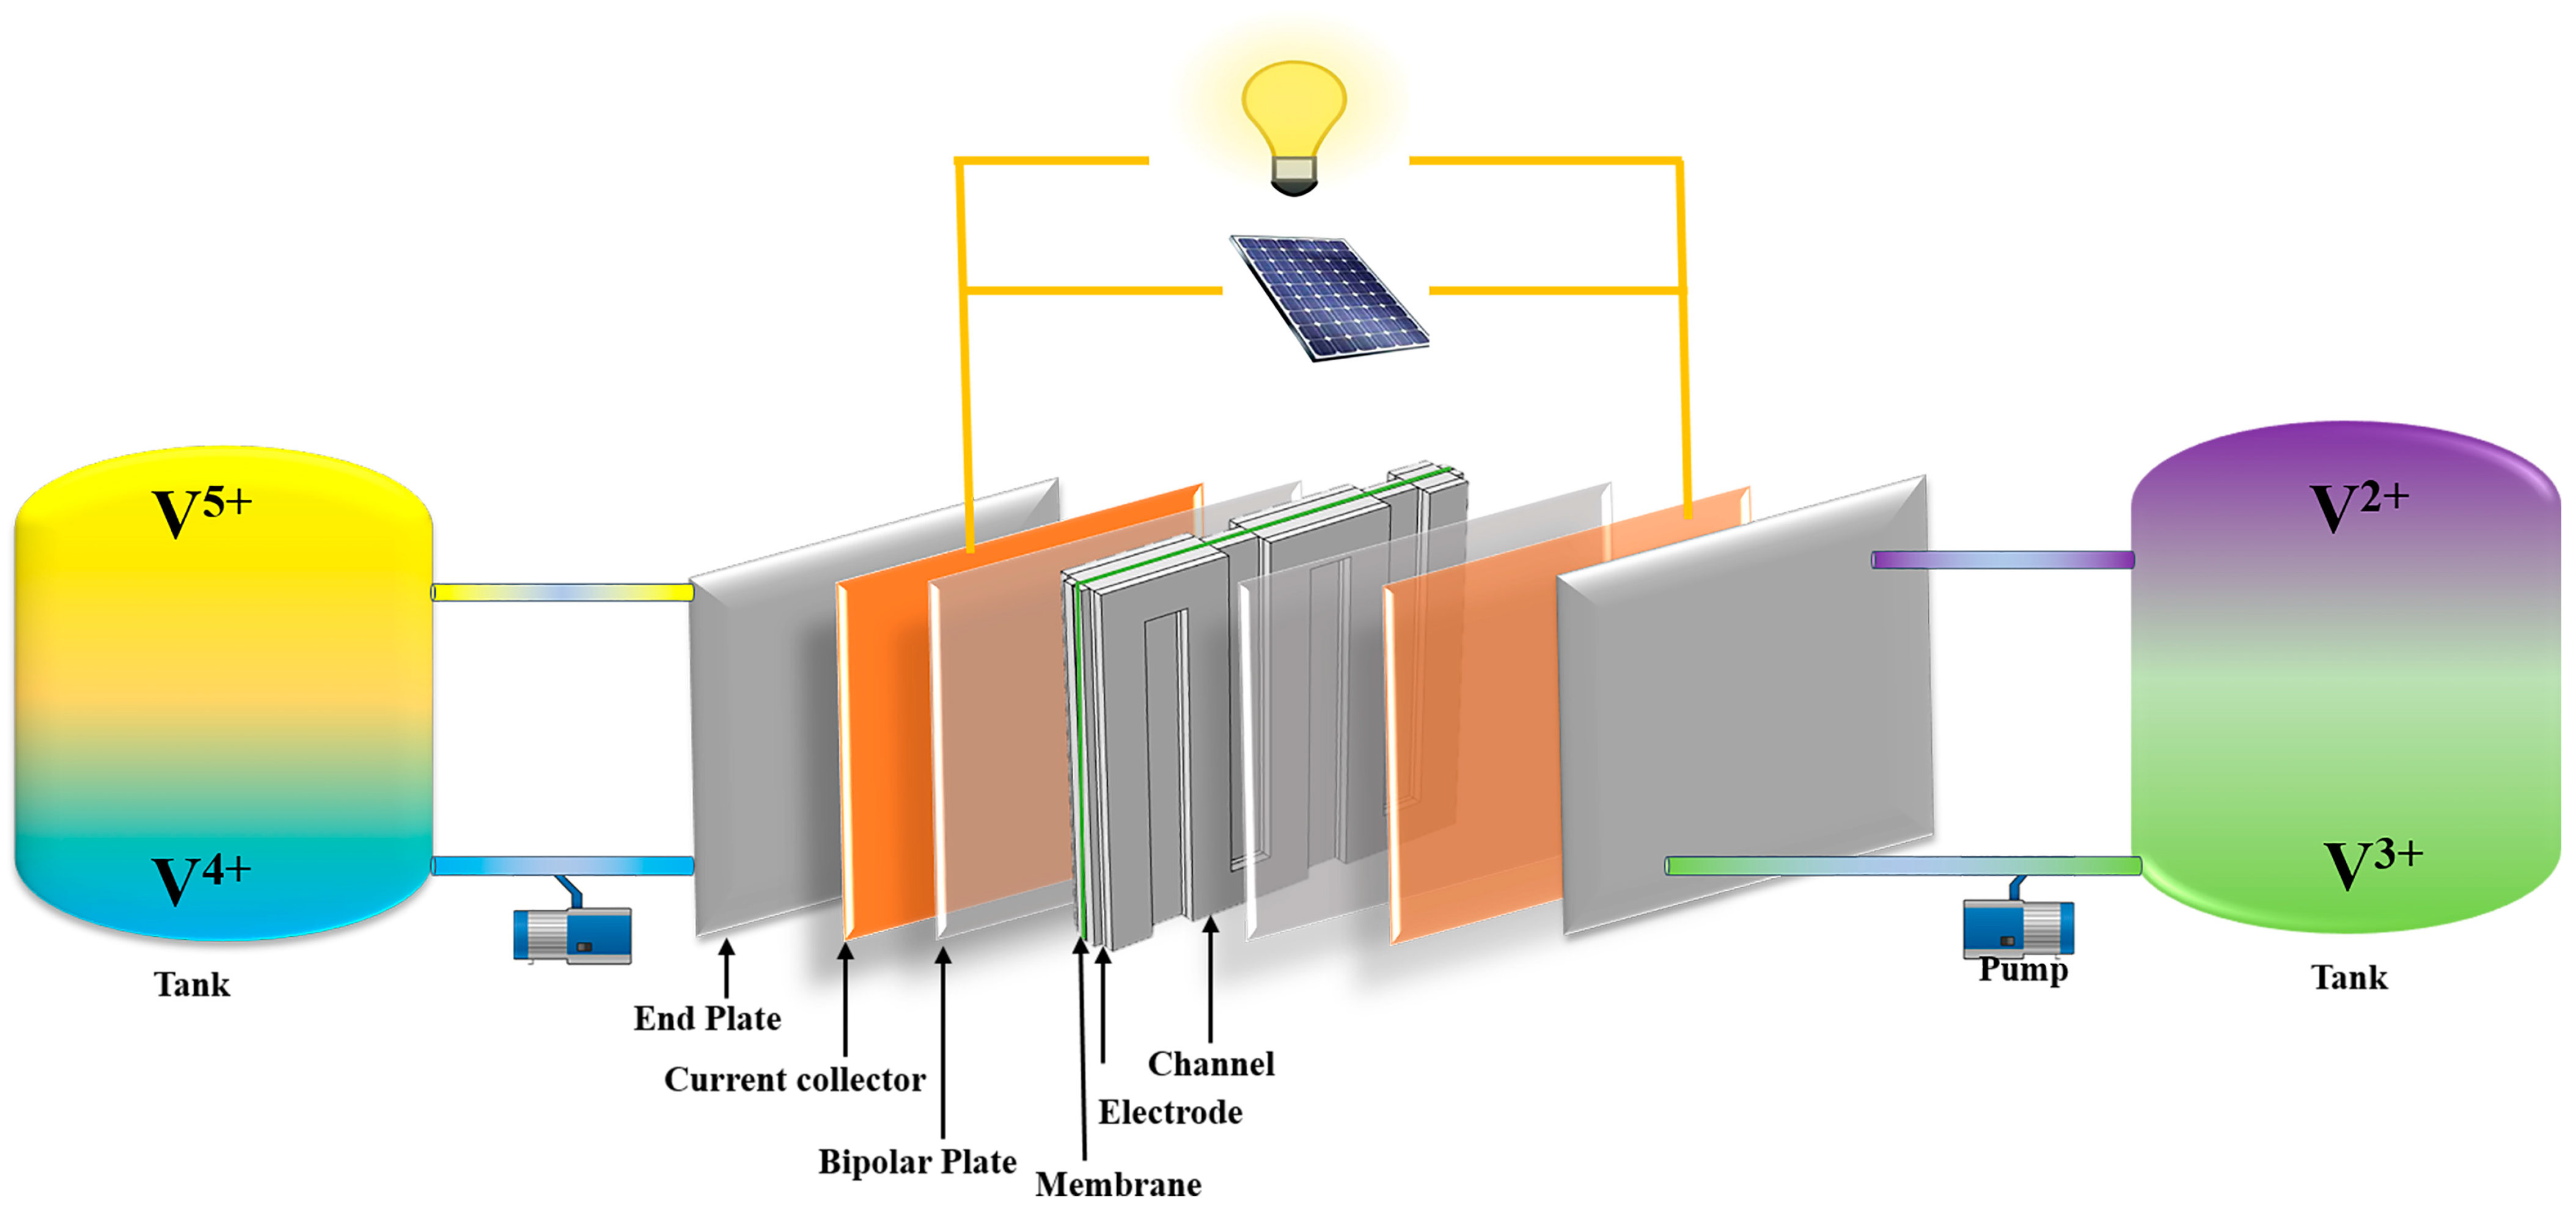
2.1. Model Outline and Methodology

In this study, we present a detailed model development for a single VFRB cell. The cell dimensions are as follows: height of 50 mm and width of 50 mm. The VFRB cell consists of two electrodes separated by an anion exchange membrane. Each electrode is connected to a current collector on either side. To investigate the performance of the VRFB, we considered four different flow field configurations along with three types of electrode compression.
The numerical simulations were performed using state-of-the-art computational fluid dynamics (CFD) and electrochemical modelling techniques. The coupling of fluid flow and electrochemical reactions is explored in this study, and the representative flow field geometries generated using COMSOL are illustrated in Figure 3. The geometries depicted in the figure correspond to the conventional, parallel, serpentine, and interdigitated configurations (a), (b), (c), and (d), respectively. These models captured the complex interplay between fluid flow, species diffusion, and electrochemical reactions, providing insights into the effect of compression on electrode behaviour in VRFBs. The presented model was simulated for three different carbon-felt electrode compression scenarios: (i) uncompressed, (ii) homogeneously compressed to 50% of its original thickness, and (iii) non-homogeneously compressed to 50% of its original thickness. Finally, the polarisation curve for the matrix involving three different compression scenarios and four different flow field configurations was obtained. The compression levels were systematically varied and the resulting flow field characteristics were analysed. Further, the optimal compression levels that maximise mass transport and electrochemical efficiency were identified.
This 3D computational-coupled multiphysics modelling study involving the comparison of four different flow field configurations and three different compression modes is expected to contribute towards obtaining an optimum balance between pressure loss and electrochemical performance, helping to finally regain the pace in the commercialisation of the VRFBs. Through our numerical study, we aim to bridge this knowledge gap by investigating the influence of compression on the flow field distribution and electrochemical behaviour of VRFBs. By employing sophisticated computational models using a COMSOL Multiphysics approach, the underlying fluid dynamics, species transport, and electrochemical reactions occurring within the vanadium redox flow battery system under different compression levels are simulated and analysed.
Table 1 provides an overview of the flow field configurations and the corresponding electrode compression types considered in this study. The configurations include conventional, serpentine, parallel, and interdigitated. Each configuration is associated with different types of electrode compression: uncompressed, homogeneously compressed, and non-homogeneously compressed.
A domain framework is developed based on the flow field configuration and the compression scenario in order to create a three-dimensional numerical model that integrates computational fluid dynamics and electrochemical reactions. For the uncompressed electrode system, the geometry model consists of five domains: a negative porous electrode (3 mm thick), an ion-exchange membrane (0.2 mm thick), a positive porous electrode (3 mm thick), and flow channels attached to each electrode (2 mm thick). The cell also includes inflow and outflow channels, operating in a counter-current manner. In the case of non-homogeneously compressed electrode systems, the geometric configuration differs slightly and comprises three distinct domains with varying porous matrix characteristics: the rib region, the region beneath the channel with an intruded electrode, and the remaining hollow part of the channel. The cross-section and rib width of the channels are consistent across all cases. The geometric models representing the three different compression scenarios for each flow field configuration are presented in Figure 4. It is worth noting that the conventional configuration, which lacks a flow field, is not depicted in Figure 4.
The liquid electrolyte, comprising vanadium redox couple and sulfuric acid, is introduced into the inlet channels and flows through the porous electrodes. The liquid electrolyte enters the cell from the bottom and top of the negative and positive electrodes, respectively, flowing constantly at a rate of 40 mL.min−1. In this study, the current is assumed to be withdrawn from the positive electrode at a rate of 60 mA.cm−2, while the negative electrode is grounded. The computational geometry is meshed using the COMSOL Multiphysics® package (version 5.6) with physics-controlled meshing. As shown in Figure 5, a higher mesh density is implemented close to the membrane where the electrochemical reaction takes place.

2.2. Model Assumptions

  • The dilute solution is approximated using the principles of dilute solution theory.
  • The flow is assumed to be single phase, specifically laminar and incompressible, since the majority of the liquid involved is water.
  • The electrodes and membrane are considered to be isotropic (having uniform properties in all directions) and homogeneous (having uniform composition throughout).
  • The system is assumed to be isothermal, meaning that there are no temperature variations, and no side reactions occur (such as the O2 and H2 gas evolution at the anode and cathode).
  • Charged species are transported through the system via convection, migration, and diffusion.
  • It is assumed that the reactant or charged ions do not leak through the cell’s outer surfaces.
  • With the exception of protons, the membrane is impermeable/impervious to all other ions resulting from the reaction.
  • The model accounts for the first dissociation of H+ ions but does not consider the second dissociation, as it is assumed to be consumed by the concentration of sulfate.
  • The effect of gravity is neglected.

2.3. Governing Equations

The governing equations for the system involve species equations, mass equations, momentum equations, and electrochemical reaction equations, as described below. These equations are solved to analyse the multiphysics phenomena present in the system.

2.3.1. Fluid Flow and Mass Transport

To simulate the flow of the electrolyte through the porous electrode and couple-free and porous flow media in incompressible single-phase flow (with the electrode as a porous medium and the flow field as a free medium), the Brinkman equations are utilised. These equations combine Darcy’s law and the Navier–Stokes equations to describe the velocity of the electrolyte. The flow equations are represented by Equations (1)–(4).
ρ ( v . ) v = p + μ v + v T
ρ . v = 0
ρ v . v = p + . μ v + v T 2 μ 3 . v μ K + Q v
ρ . v = Q
The permeability of the compressed electrode in the rib, channel, and intrusion regions is determined using local porosities and fibre diameter. The Kozeny–Carman equation, described by Equation (5), is employed to calculate the local permeabilities (K) of these three regions.
K = d f 2 K C K 2 ( 1 ) 2
Conservation of mass equation for species i is given by Equation (6), and the source terms for species i are listed in Table 2.
t C i + . N i = S i
The Nernst–Planck equation is used to determine ion flux and charge transport resulting from convection, migration, and diffusion at the porous electrode, and is given by Equation (7).
N i = D i , e f f C i Z i u m o b , i F C i φ l + C i v
The effective diffusion coefficient is calculated using the Bruggeman equation given by Equation (8).
D i , e f f = 3 / 2 D i
To determine the concentration of ions satisfying the electrical neutrality condition, Equation (9) is employed for a given valency of z.
Z i C i = 0

2.3.2. Electrochemical Reactions

The electrochemical reactions occurring at the electrode surface, along with the involved ionic species, are presented in Table 3.

Reaction Kinetics

The volumetric transfer current density is modelled using the Butler–Volmer equation. This equation describes the rates of vanadium redox reactions taking place on the porous carbon electrode surface. It utilises the surface concentration of vanadium redox species and is defined by Equations (10) and (11).
i n e g = A i 0 , n e g c V 3 + c 0 V 3 + e x p 1 α n e g F ƞ n e g R T c V 2 + c 0 V 2 + e x p α n e g F ƞ n e g R T
i 0 , n e g = F k n e g c V 2 + 1 α n e g c V 3 + α n e g
The overpotential (ƞ) for both electrodes is expressed as:
η p o s = φ s , p o s φ l , p o s E e q , p o s
η n e g = φ s , n e g φ l , n e g E e q , n e g

Electrolyte

The concentration of chemically active species in the electrolyte is related to the reduction potential of the electrodes using the Nernst equation. This relationship assumes that the ions are highly diluted in the solution, with negligible interactions between them. The activity coefficient of the species is assumed to be one. Equations (14)–(16) describe the equilibrium potential against each electrode.
E e q , n e g = E 0 , n e g + R T F ln c V 3 + c V 2 +
E e q , p o s = E 0 , p o s + R T F ln c V O 2 + × c H 2 c V O 2 +
E r e v = E e q , p o s E e q , n e g
The state of charge (SOC) of the VRFB is determined using Equation (17).
SOC = C V 2 + C V 2 + + C V 3 + = C V O 2 + C V O 2 + + C V O 2 +

Membrane

The membrane is constructed using a polymer electrolyte, where all negative ions are confined within the polymer matrix, indicating a constant concentration. Only positive hydrogen ions (H+) are present in the membrane. The shift in potential caused by the proton concentration gradient gives rise to the Donnan potential. Mathematically, the Donnan potential (Emem) is expressed as:
E m e m = R T F ln c H , p o s + c H , n e g +
The flux of ions across the membrane can be described using Fick’s first law of diffusion. However, for non-permeable ions, the flux is zero. At the interface between the membrane and the electrode walls, a slip boundary condition is applied, while a no-slip condition is applied within the membrane.
i l = u m i F 2 C i φ l

Current Collector

Similar to the description of current in the electrode, the current collector also plays a role in facilitating electron flow. However, in this case, the porosity of the current collector is assumed to be zero, meaning there is no space for ion transport.
i s = σ s e f f 2 φ s
The cell voltage (Ecell) of the battery is calculated by subtracting the total overpotential (Etot) from the reversible voltage (Erev) during discharging and added during charging. The total overpotential accounts for the electrochemical losses in the battery and comprises three components:
  • Activation overpotential (Eact): this overpotential arises from the electrochemical reactions occurring at the porous electrode.
  • Concentration overpotential (Econ): this overpotential is a result of concentration changes within the battery.
  • Ohmic overpotential (Eohm): this overpotential arises from the internal resistance of the battery.
Mathematically, the cell voltage can be expressed as:
E c e l l = E r e v ( E t o t )
E c e l l = E r e v ( E a c t E o h m E c o n )
The mobility of ions in the electrolyte generates a current due to external charges. This ionic transport is explained by Faraday’s law. By summing up the currents from all species, the ionic current in the electrolyte is given by:
i l = i i = F Z i D i e f f C i F 2 Z i 2 C i μ i φ s
The conservation of charge in each domain is the primary model coupling, represented by Equation (23), which states that the divergence of the total current density (considering both the liquid electrolyte and solid porous electrode) is zero.
i s = i l = i ( B u t l e r v o l m e r )
Ohm’s law describes the current in the electrode and is represented by Equation (25).
i s = σ s e f f 2 φ s
Similarly, Ohm’s law describes the ionic current in the electrolyte, as expressed by Equation (26).
i l = σ l 2 φ l

2.4. Boundary Conditions

The boundary conditions for the membrane, electrodes, and current collector are defined in Table 4.

2.5. Numerical Method and Parameters

The model equations were solved using the finite-element method implemented in COMSOL Multiphysics® version 5.6. The convergence criteria are set to a relative tolerance of 10−3 for the simulations. It took 15 iterations to reach the convergence criteria. The 3D numerical model of VRFB was simulated in an HP XEON CPU @ 2.00 GHz Workstation with eight cores and 128 GB RAM. Computational time for each charge or discharge curve (cell voltage verses SOC) or polarisation curve (cell voltage verses current density) was 50–55 h. To ensure grid independence, a grid study was conducted by varying the number of grids and evaluating the resulting pressure drop. The simulation employed elements ranging from 208,117 to 254,882 for all flow fields. Table 4 presents the electrochemical properties, operating parameters, and dimensions utilised in the simulations. The temperature was kept constant at 298 K throughout the numerical investigation. The Newton–Raphson algorithm with an iterative solver was employed to find the solution.
In the context of pressure differentials between adjacent channels, convection becomes the dominant mechanism, with the permeability of the electrode playing a crucial role. Conversely, when there is no pressure difference, diffusion takes precedence, and the phenomenon relies on the porosity of the electrode [12]. To perform computational fluid dynamics (CFD) simulations on compressed electrode domains, the channels and ribs were divided into three zones: (i) the rib region under compression, (ii) the region under the channel with intruded electrode, and (iii) the hollow channel region, as depicted in Figure 4. The calculation of the compression ratio, depth of intrusion, and permeability is determined by Equations (27)–(30) [8].
C R r i b = 1 t c t o
C R c h = 1 t c + d t o
d [ t ( 1 C R ) ] = 0.67 0.058     t     ( 1 C R )
K = 8.63 5.02   C R 12.74   C R 2     10 11
Permeability is a function of the compression ratio, resulting in different values for the channel and rib regions. Both the depth of intrusion and permeability correlations are derived from experimental data [8]. The calculated values of porosity and permeability for the three cases being studied are presented in Table 5. The parameters that are used for simulation and calculation are represented in Table 6.

3. Results and Discussion

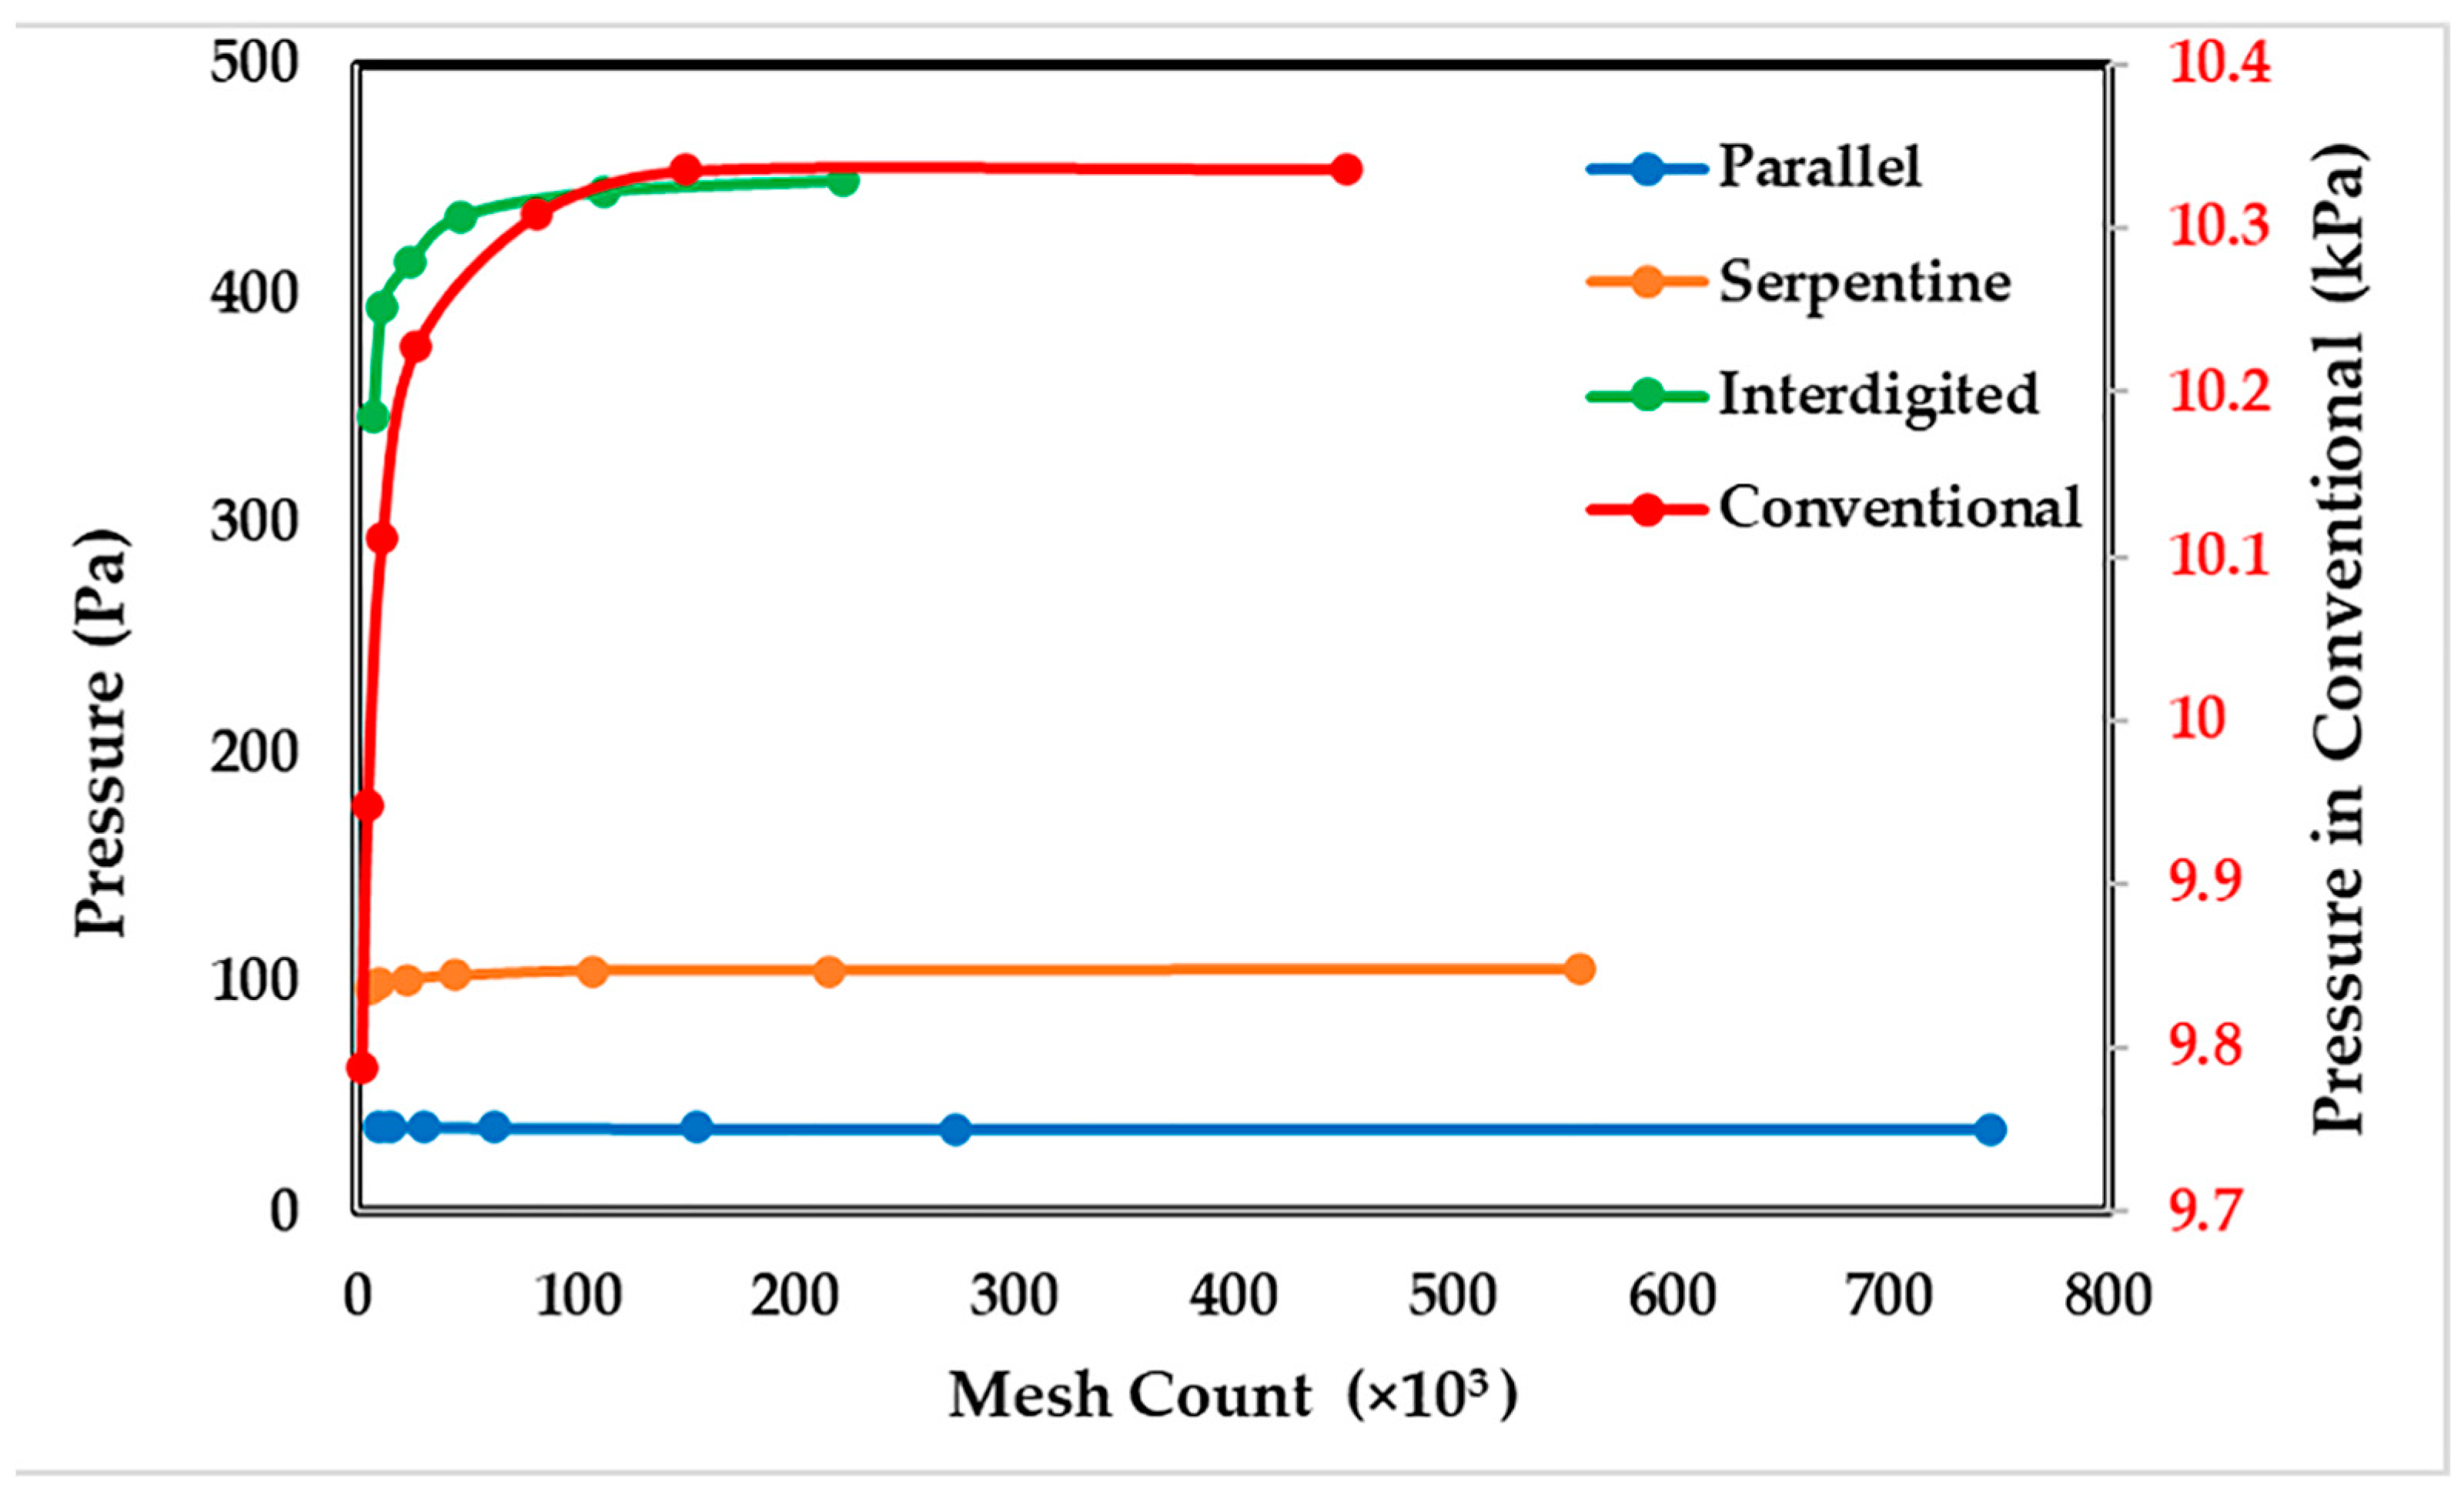
3.1. Grid Convergence Study

To ensure the robustness of the results and establish grid independence, a grid convergence study was conducted. The study involved varying the number of computational mesh size elements within the range of 208,117 to 254,882, depending on the geometry of the flow field. The pressure drop across the cell, calculated as the difference between the inlet and outlet pressures, was analysed for four different flow field configurations considered in this study. The obtained results are illustrated in Figure 6.
The analysis revealed that the maximum percentage change in pressure drop was below 1% when the number of computational mesh elements reached 224,028. Consequently, a computational mesh consisting of 224,028 domain elements and 49,574 boundary elements, corresponding to the grid-sensitive solution, was employed for subsequent simulations in this study.

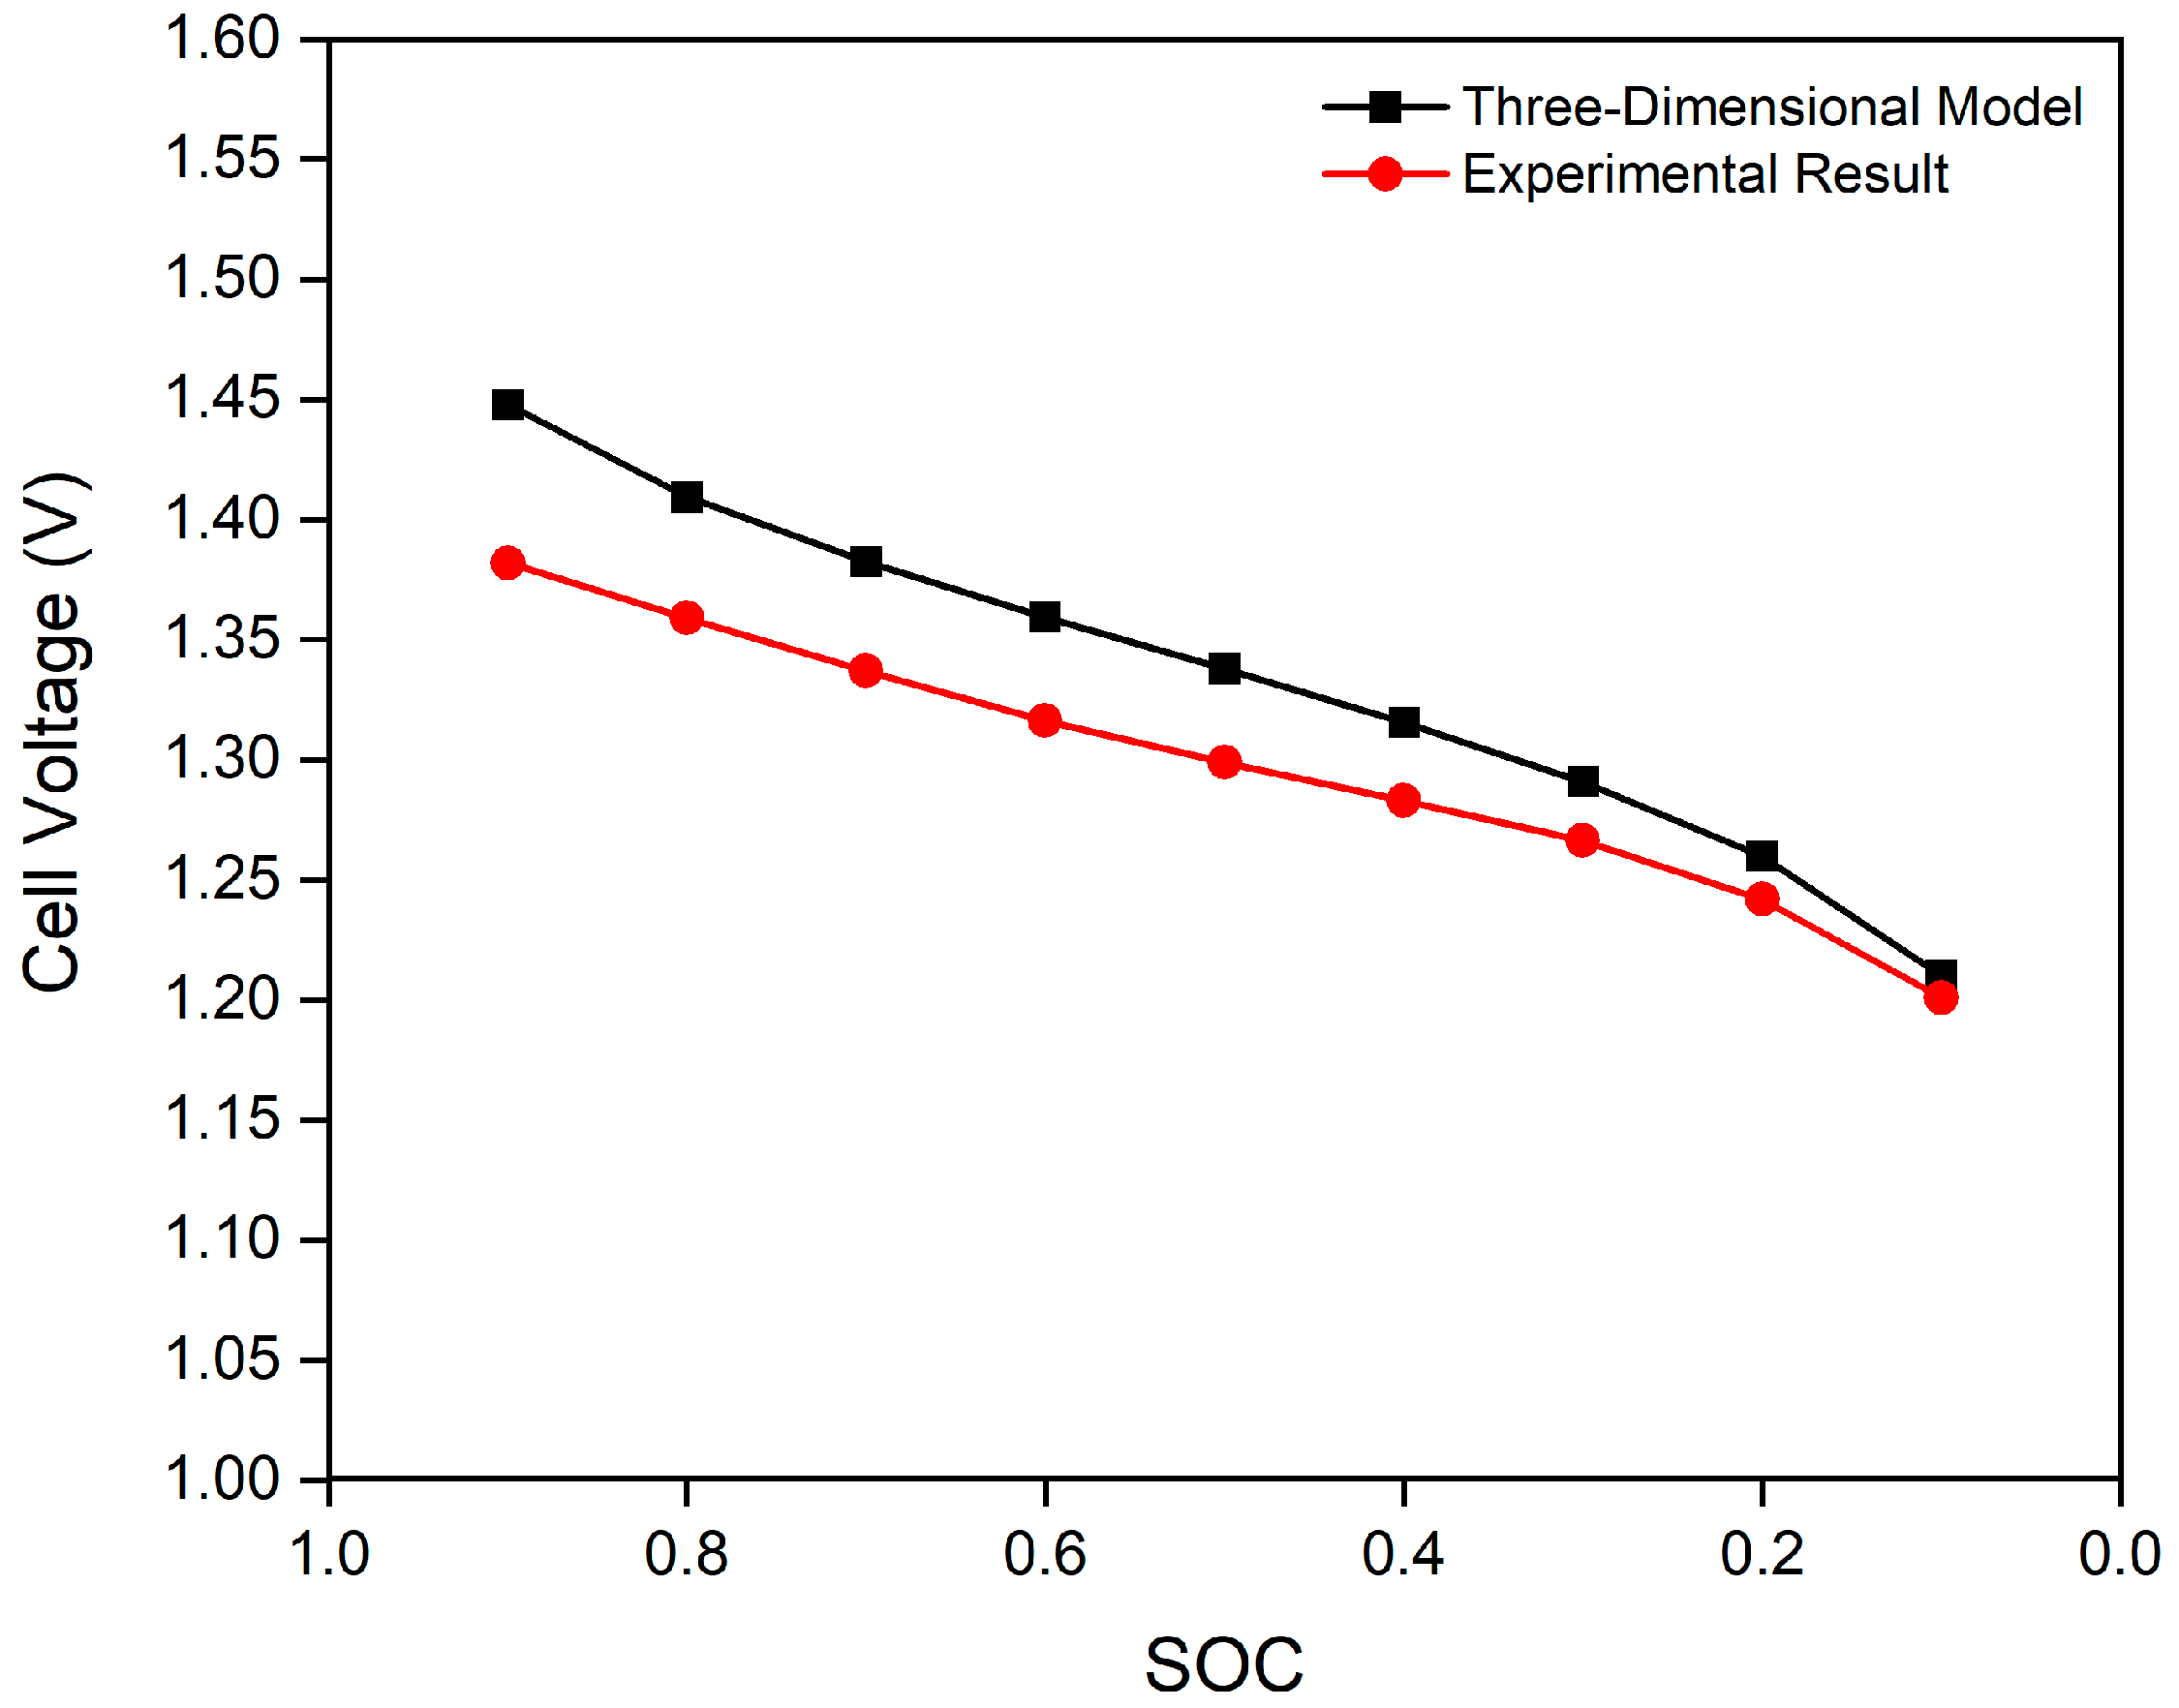
3.2. Model Validation

The proposed model is subjected to validation using experimental data obtained from a previous study [5]. In Figure 7, the simulated cell voltage is depicted at various state of charge (SOC) levels and with an applied current density of 60 mA.cm−2. It is evident from the figure that the model exhibits a commendable level of accuracy in capturing the trend observed in the experimental data when the SOC ranges from 0.1 to 0.9. The average relative error between the model predictions and the experimental measurements is found to be less than 3%, with a maximum error of 4.7% at a SOC of 0.9. This small discrepancy (slight overprediction by the model) could be attributed to side reactions occurring at the electrodes, such as hydrogen/oxygen evolution, or the presence of electrolyte contamination on either side of the membrane due to the crossover of ions, phenomena that are not accounted for in the proposed model. Despite this minor relative error, the model’s reliability remains high, leading to its adoption for further investigations into cell behaviour.

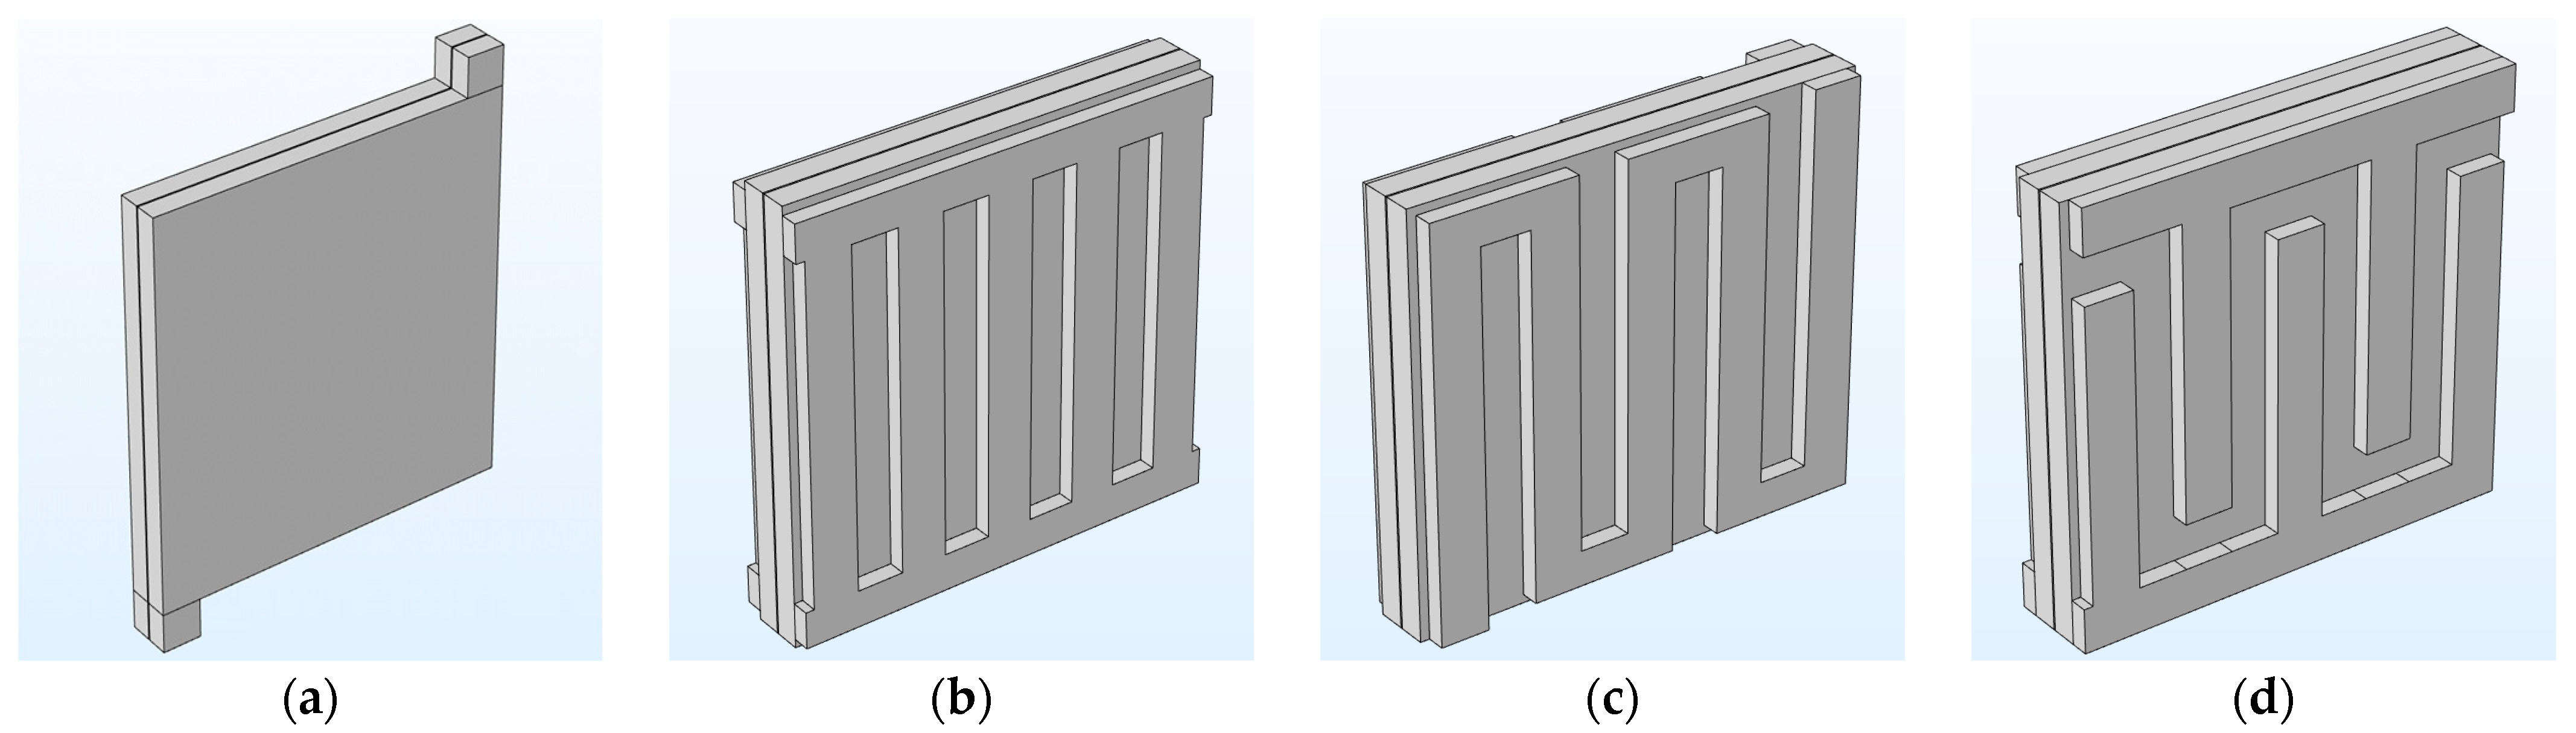
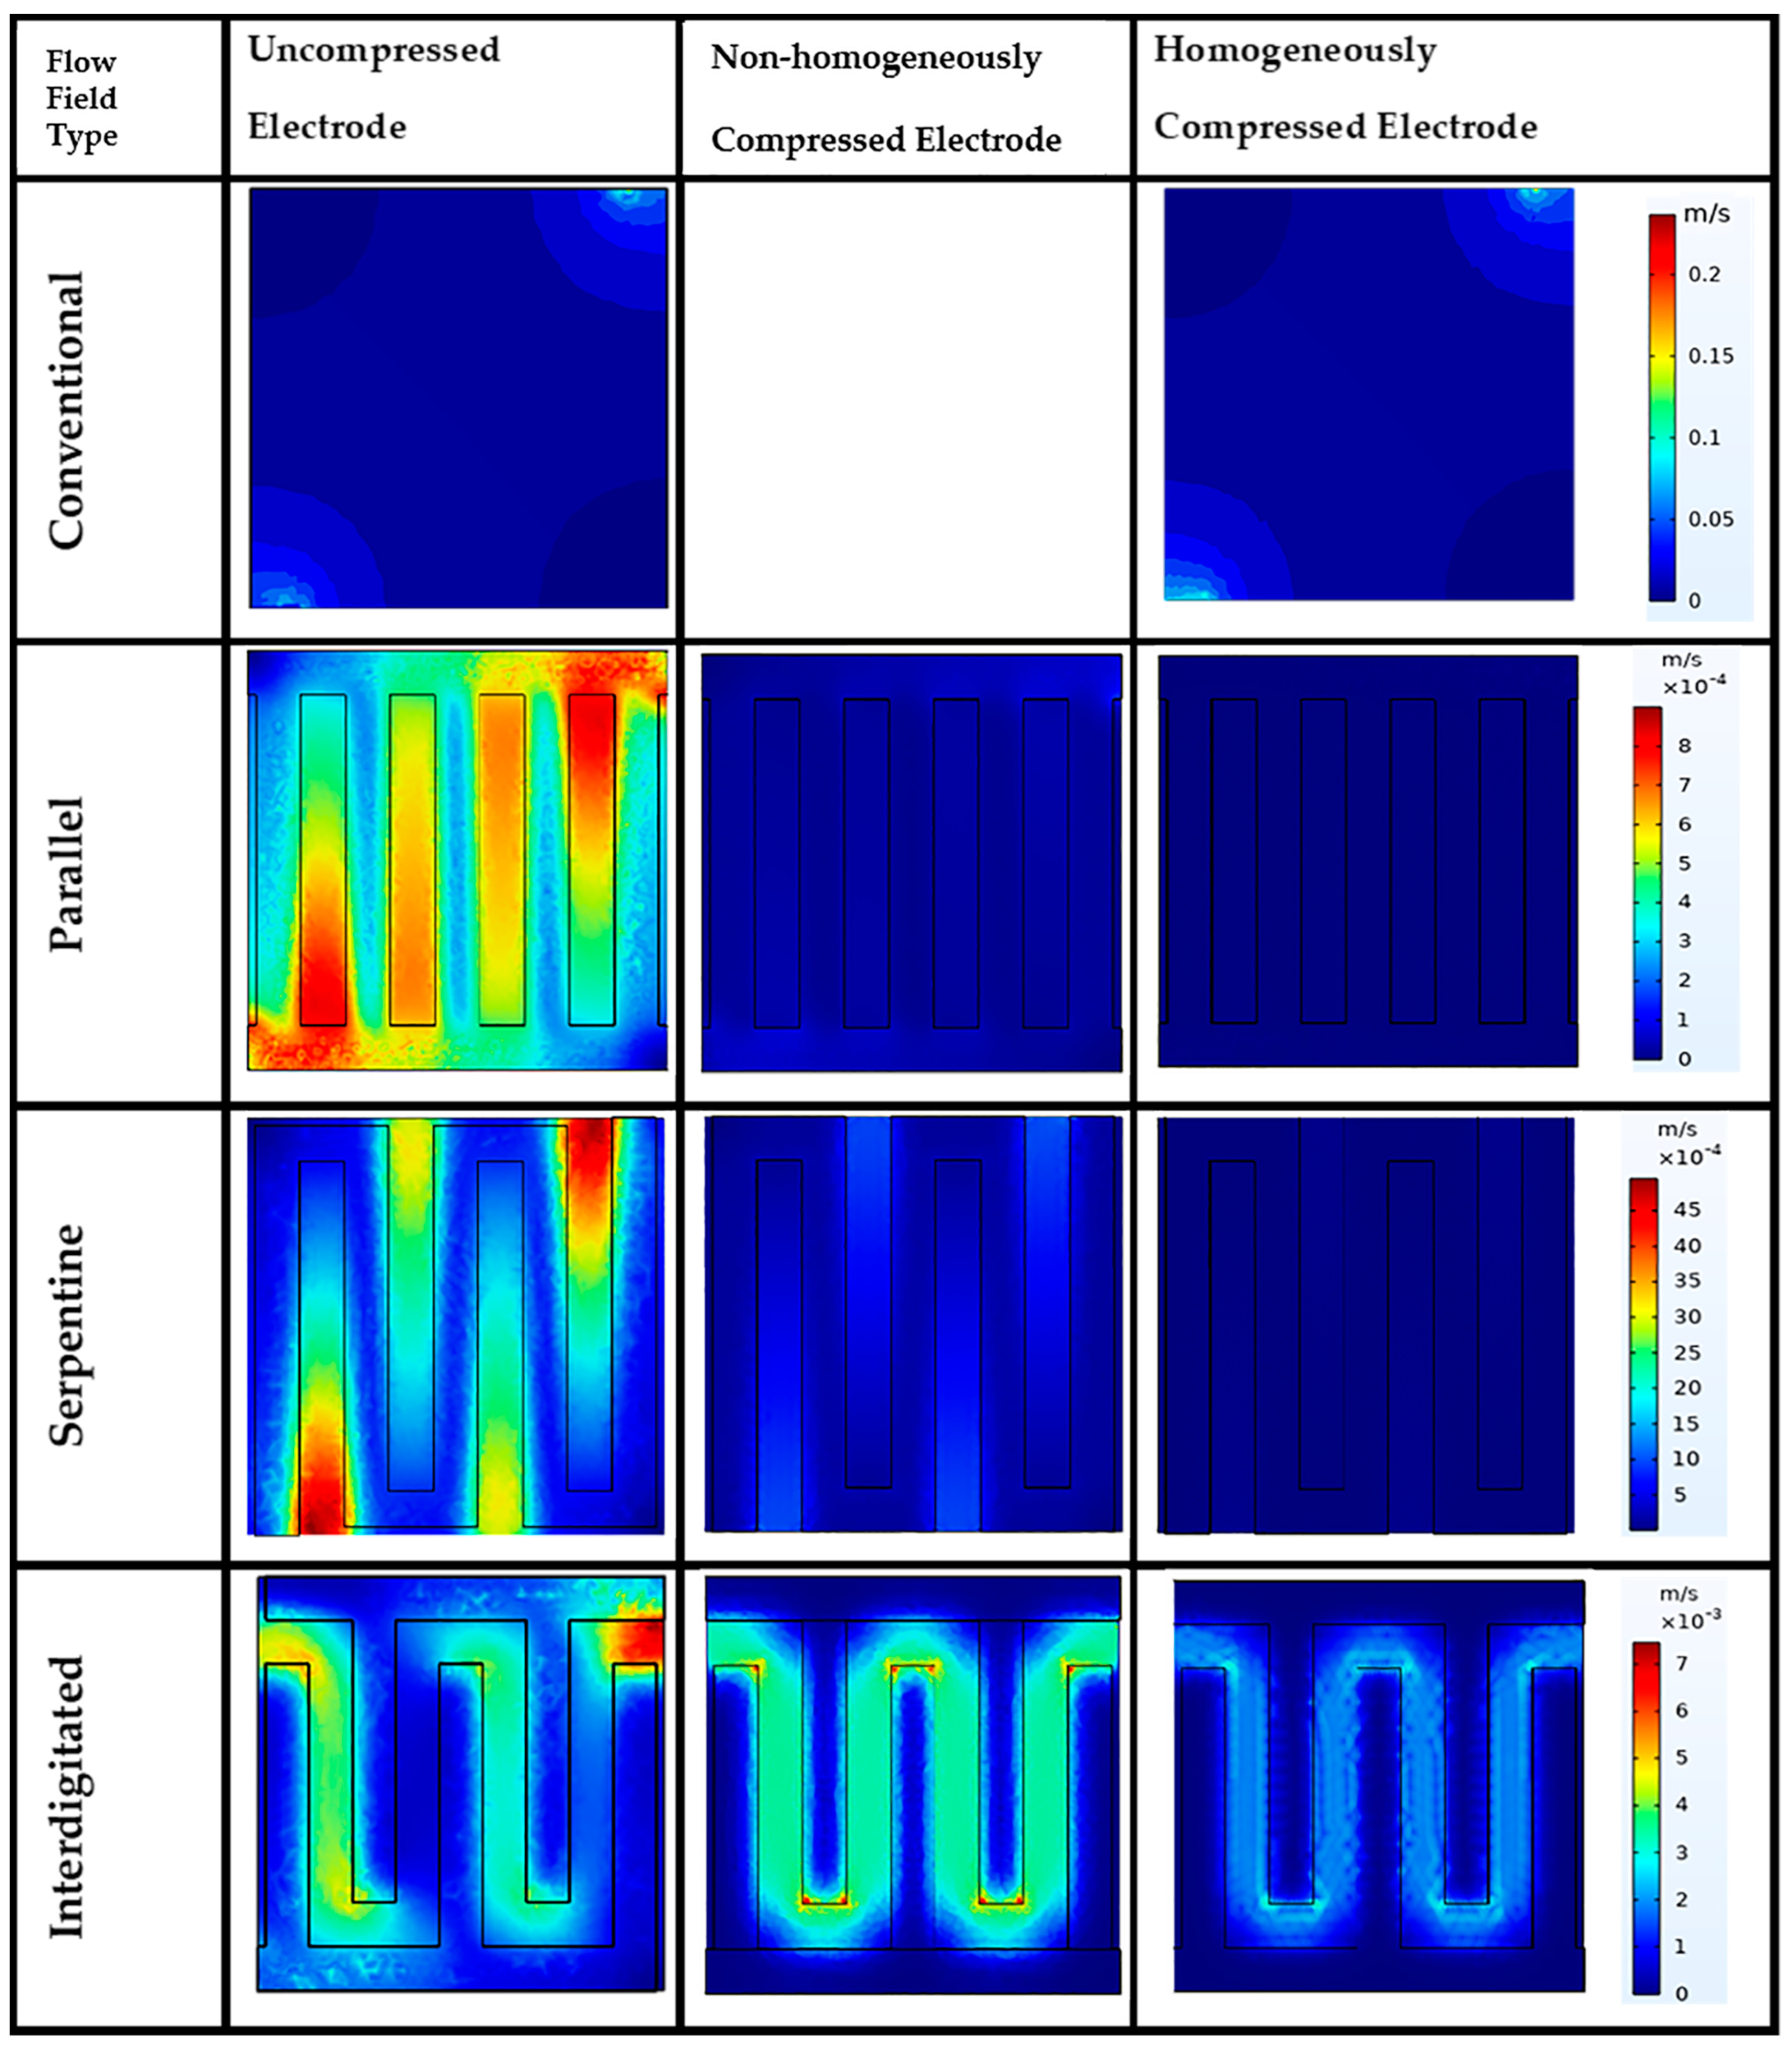
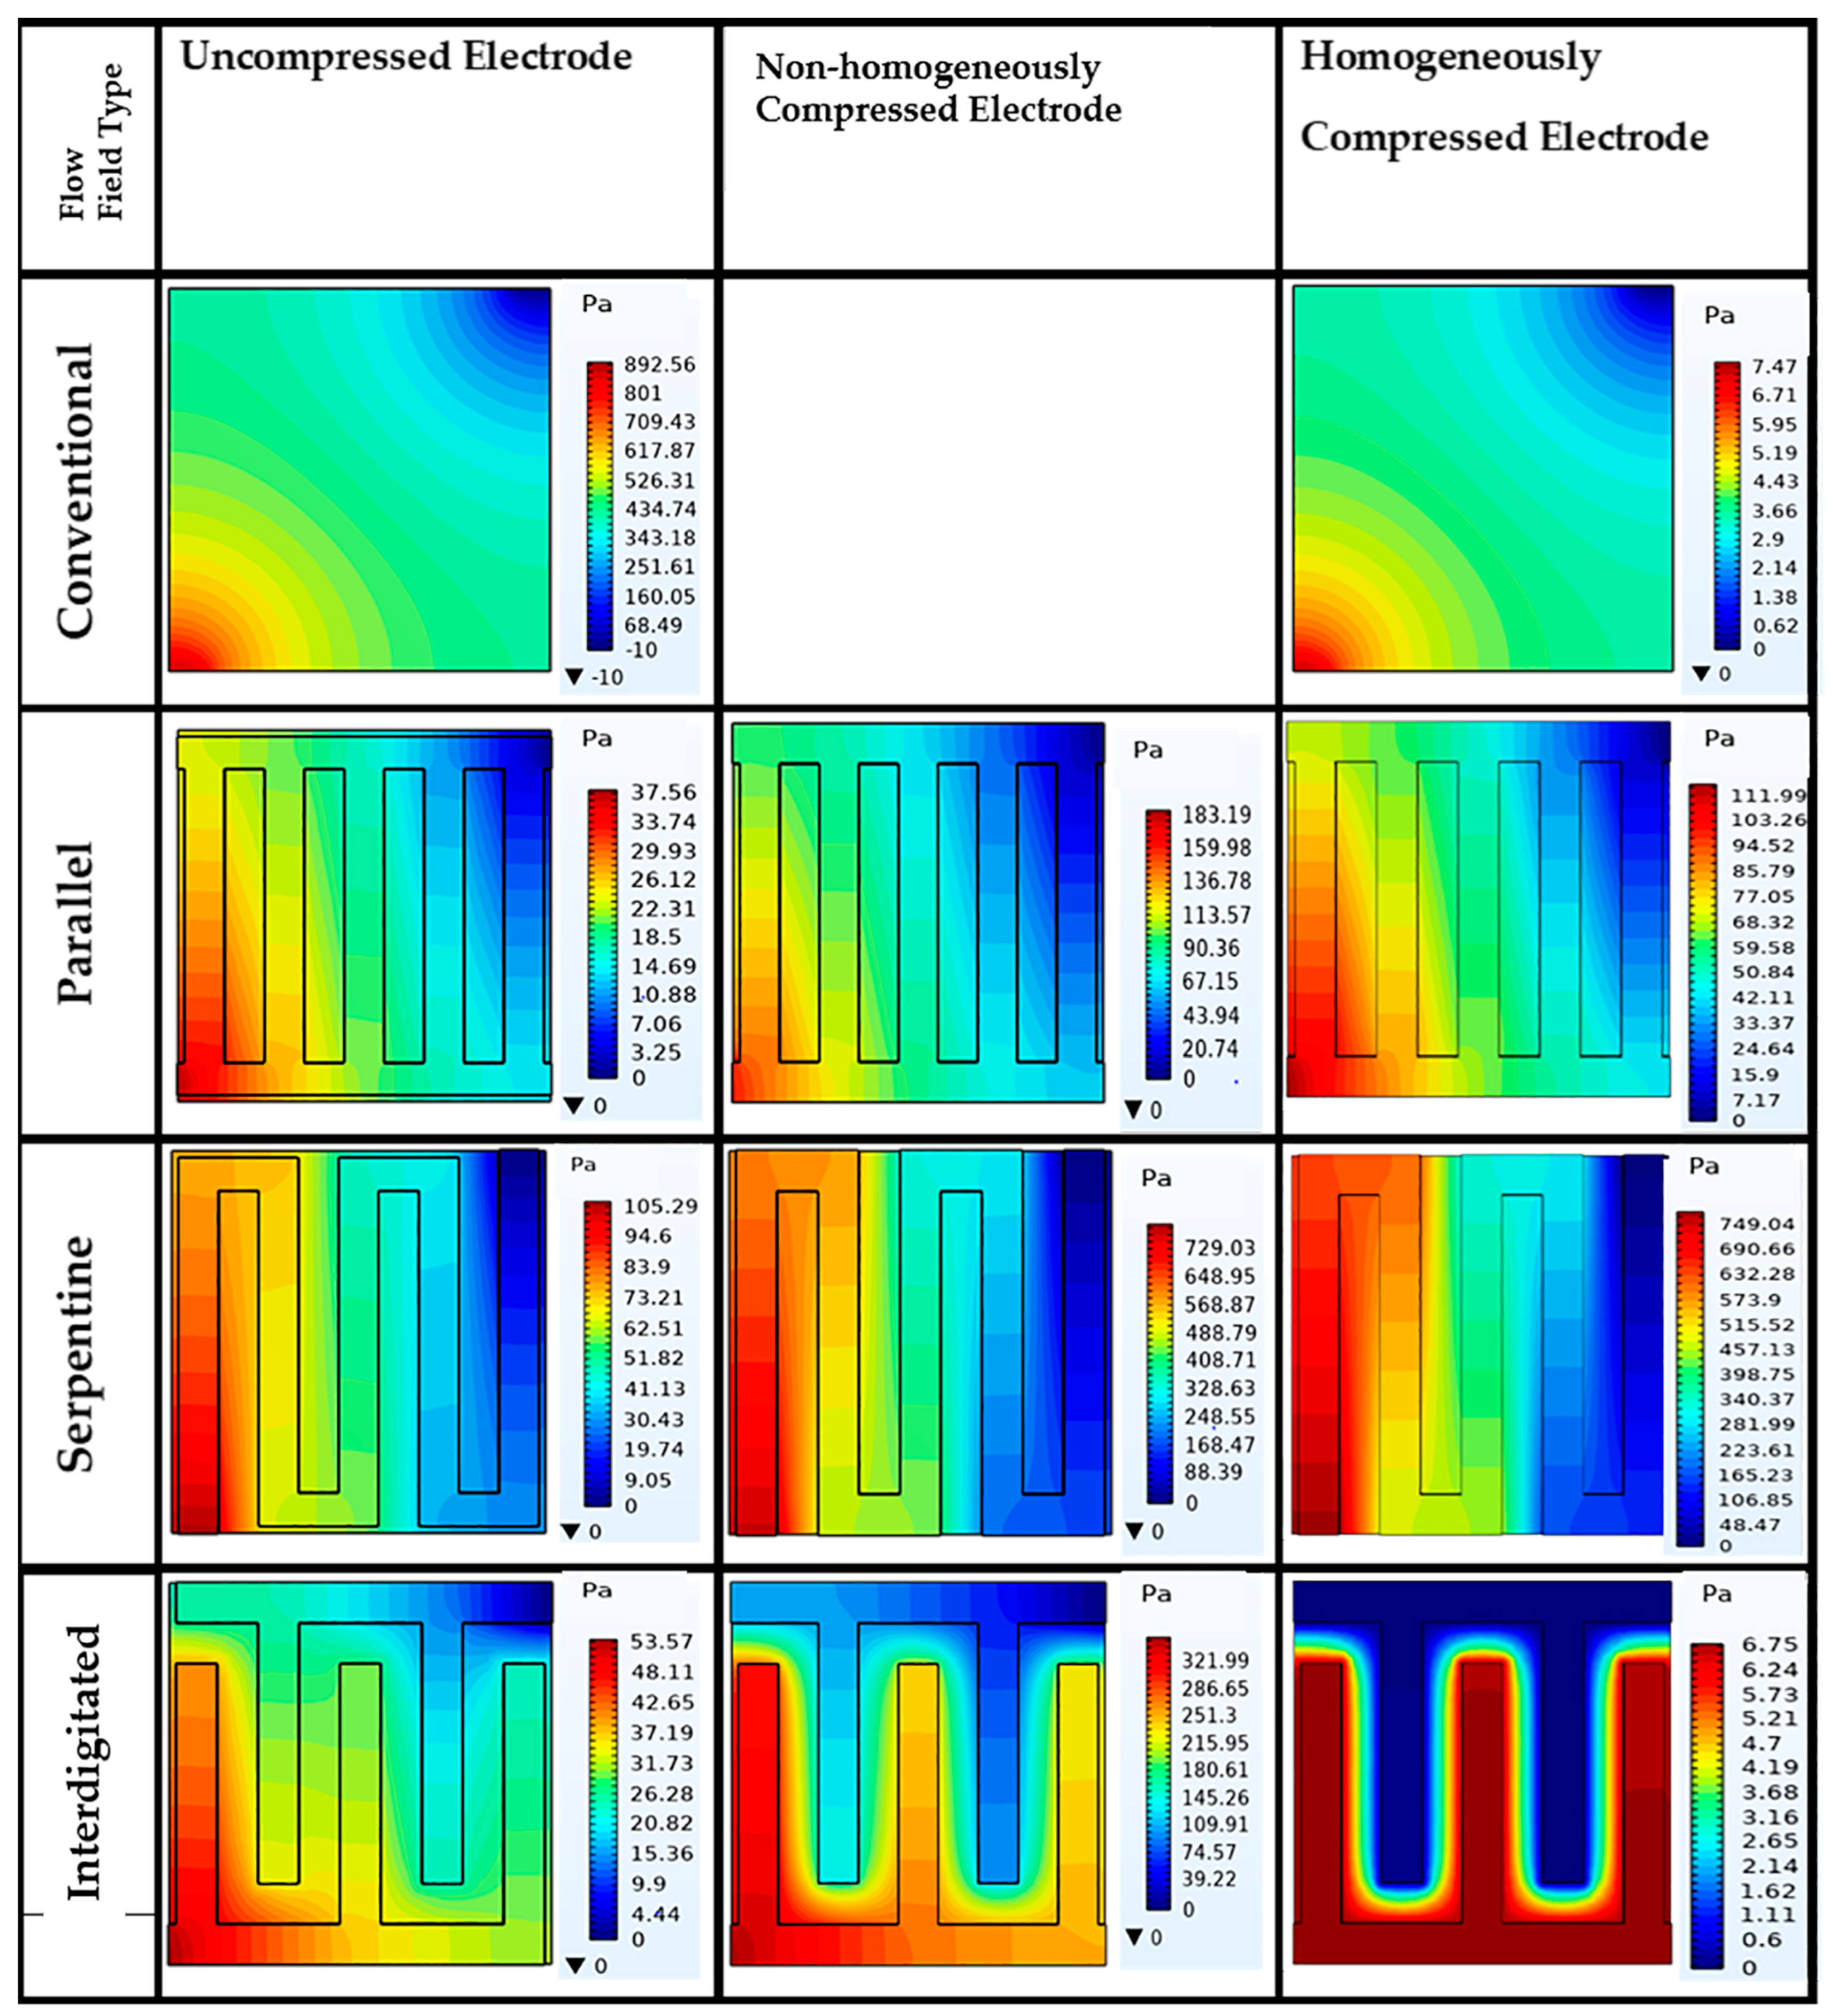
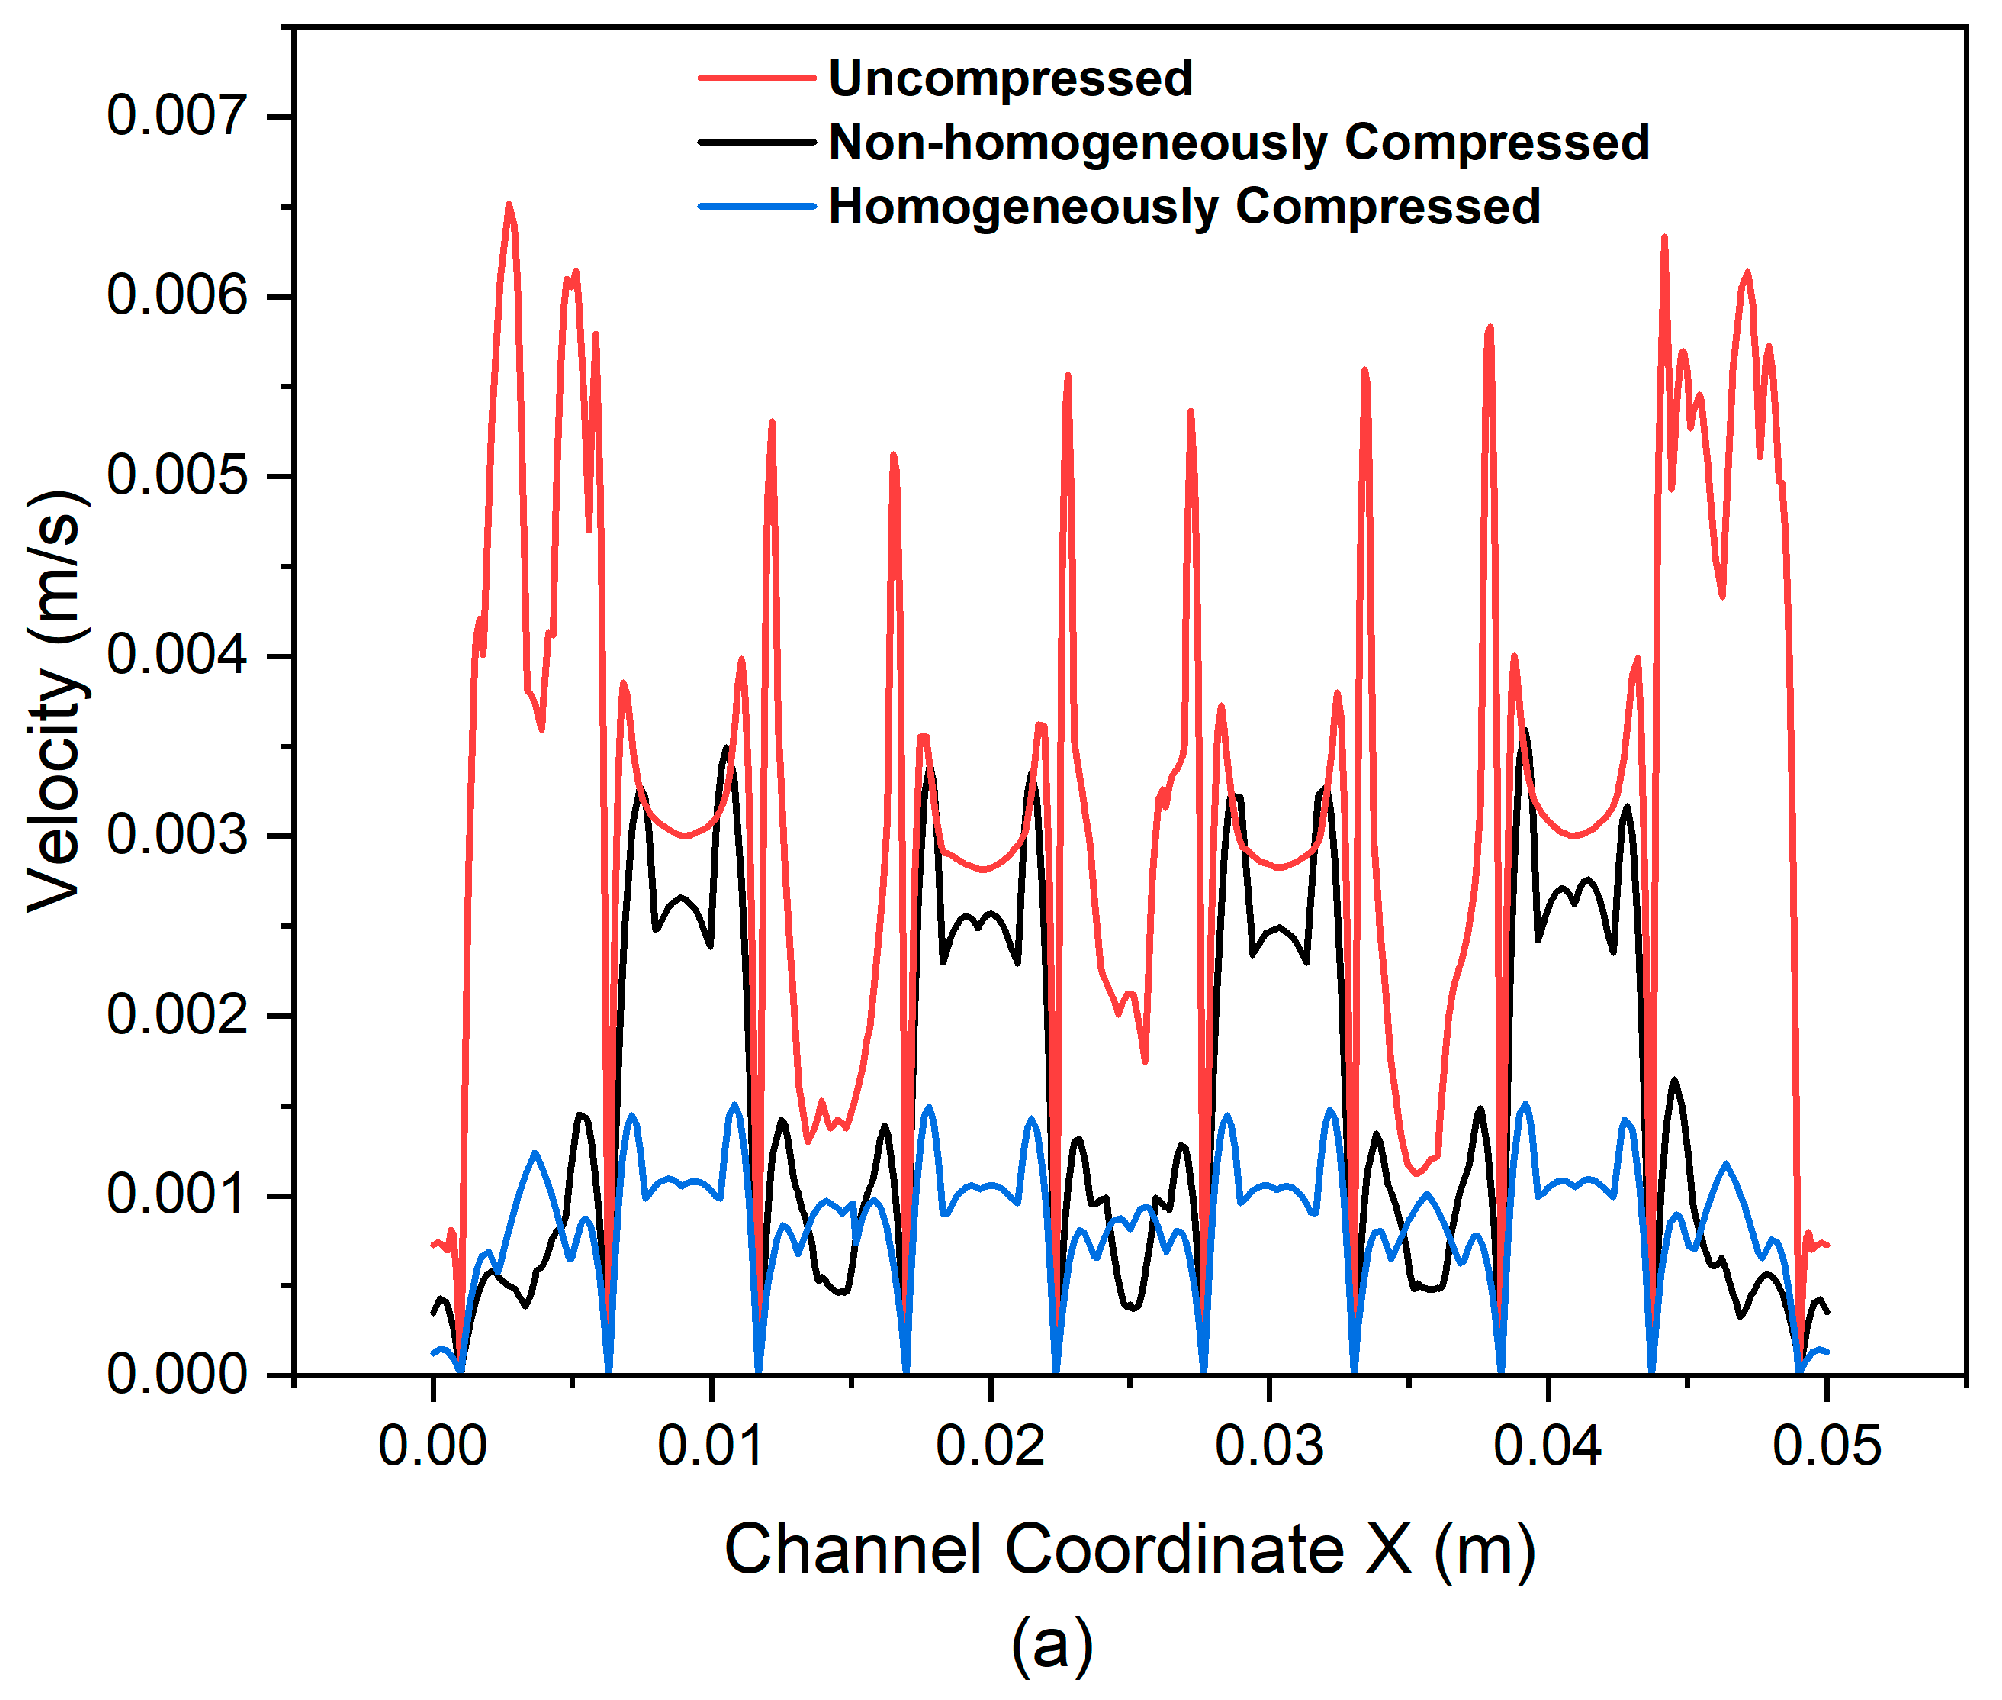
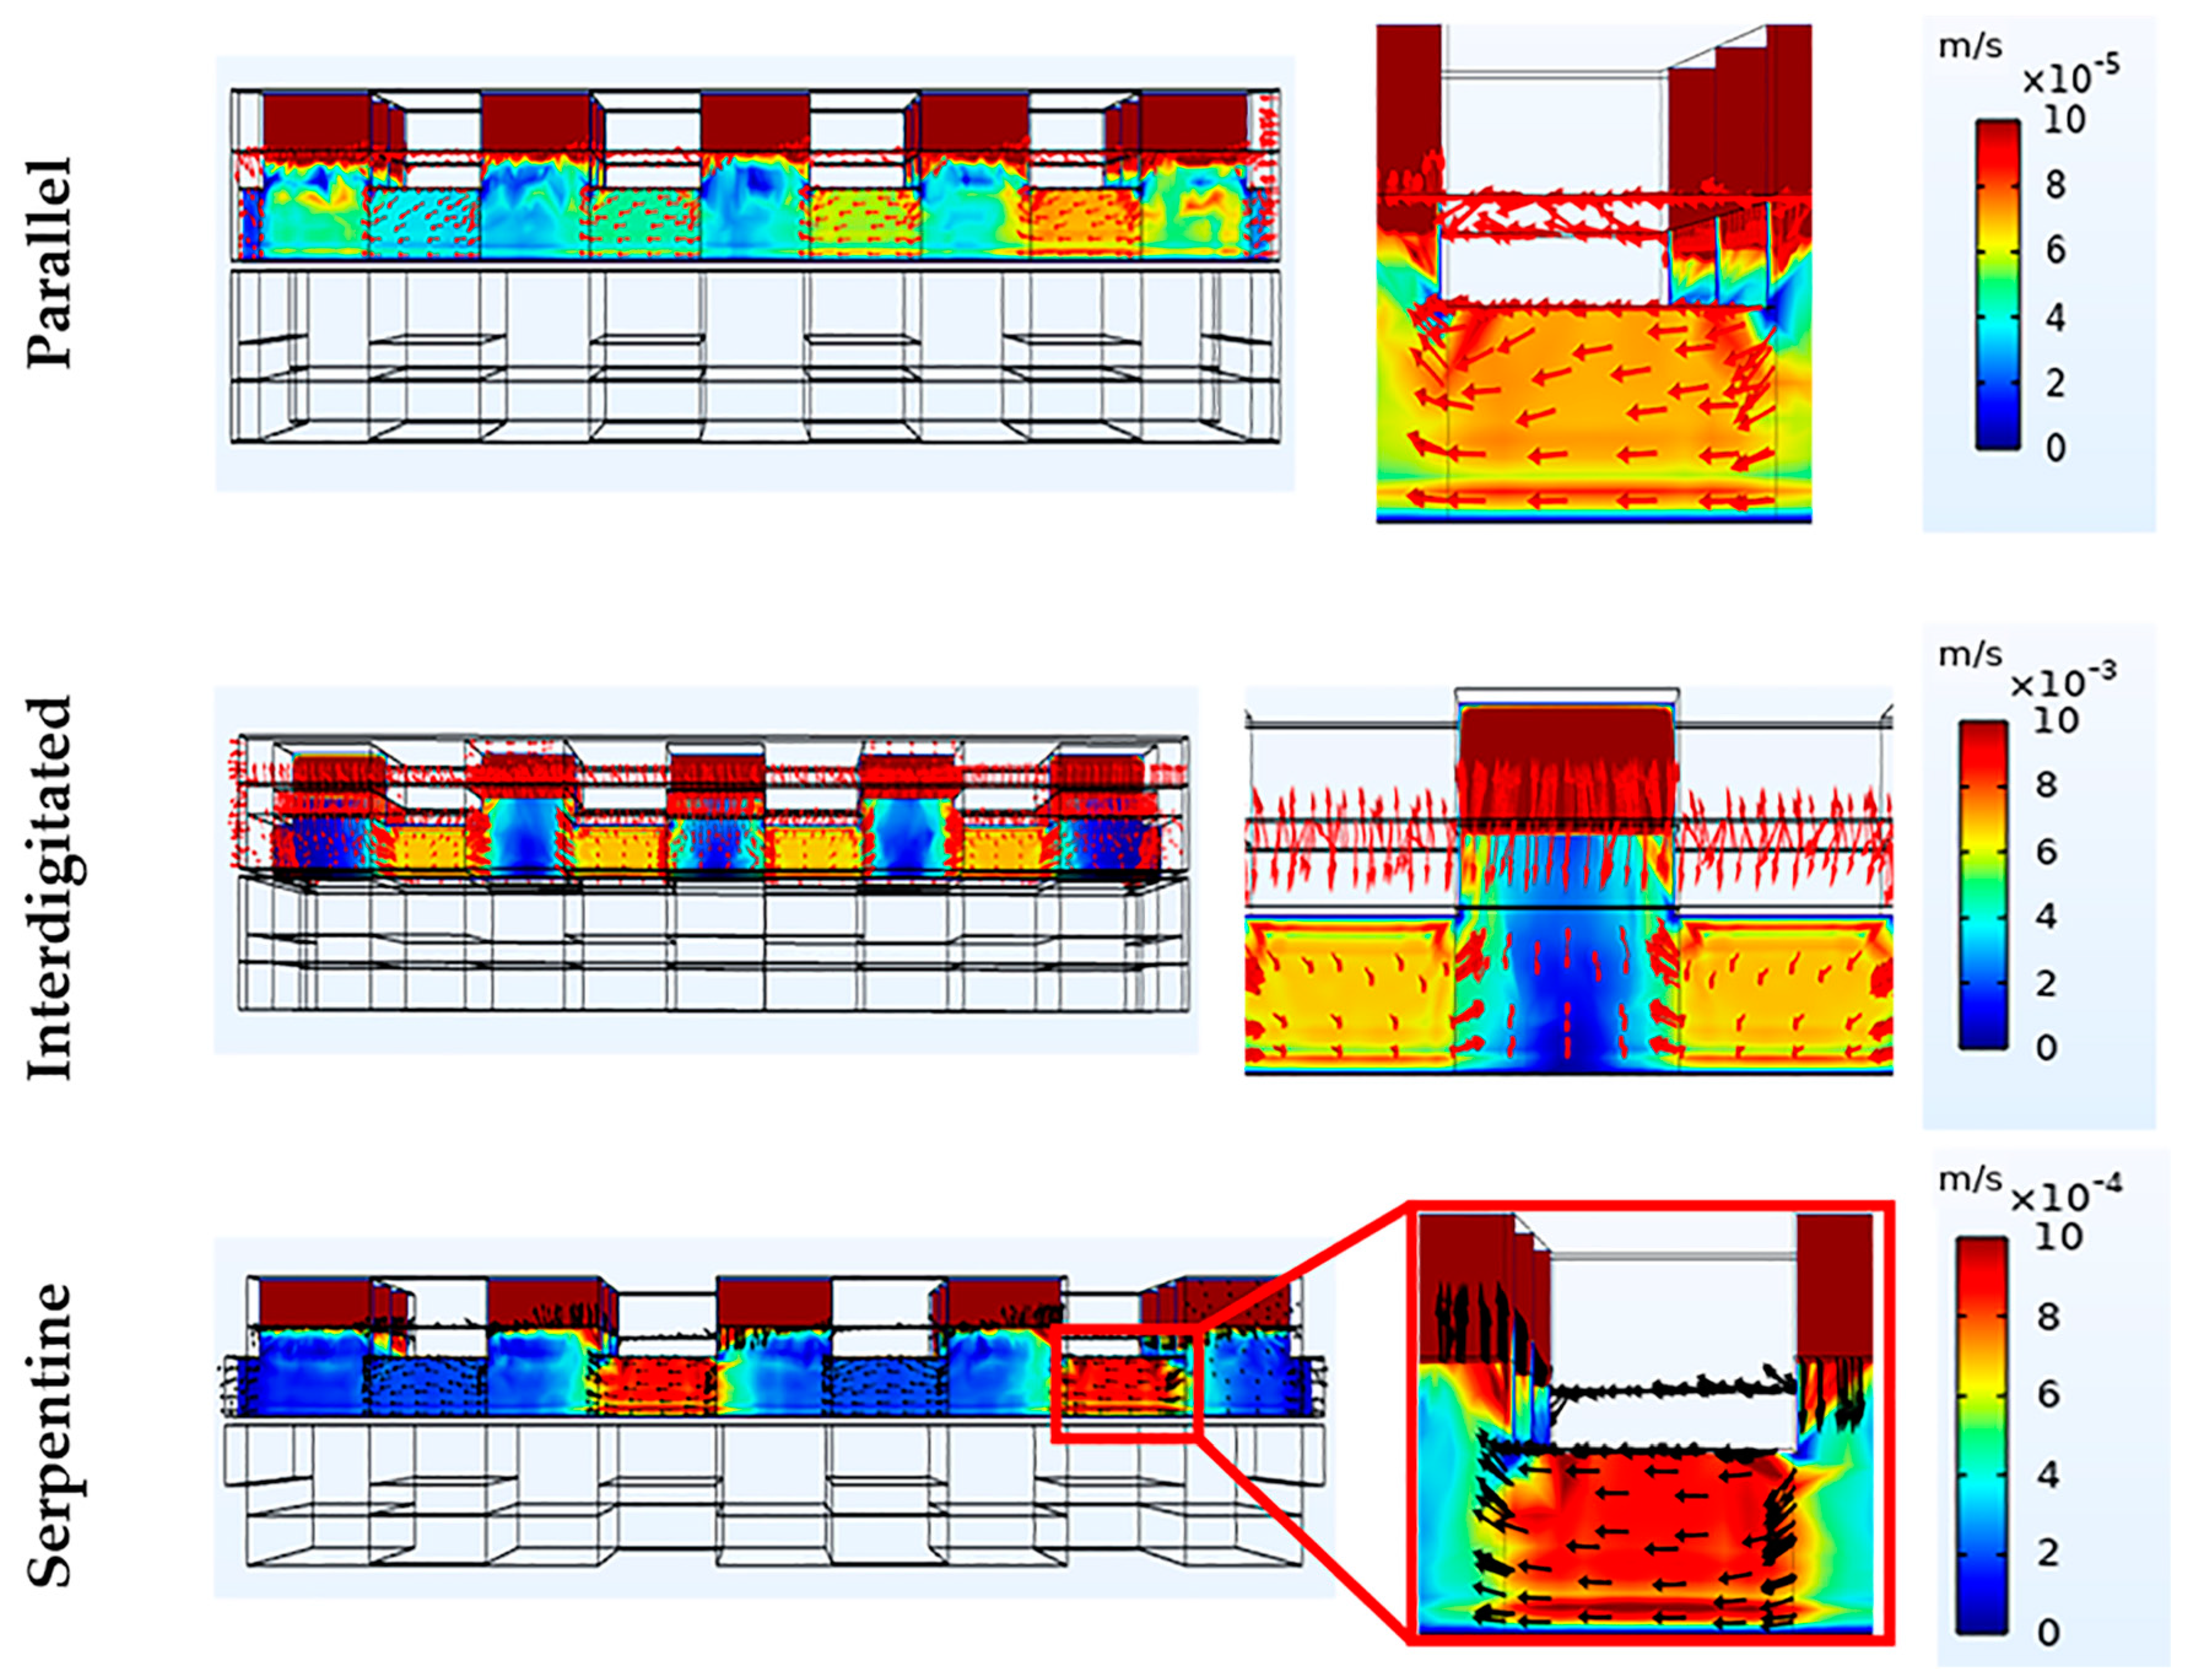
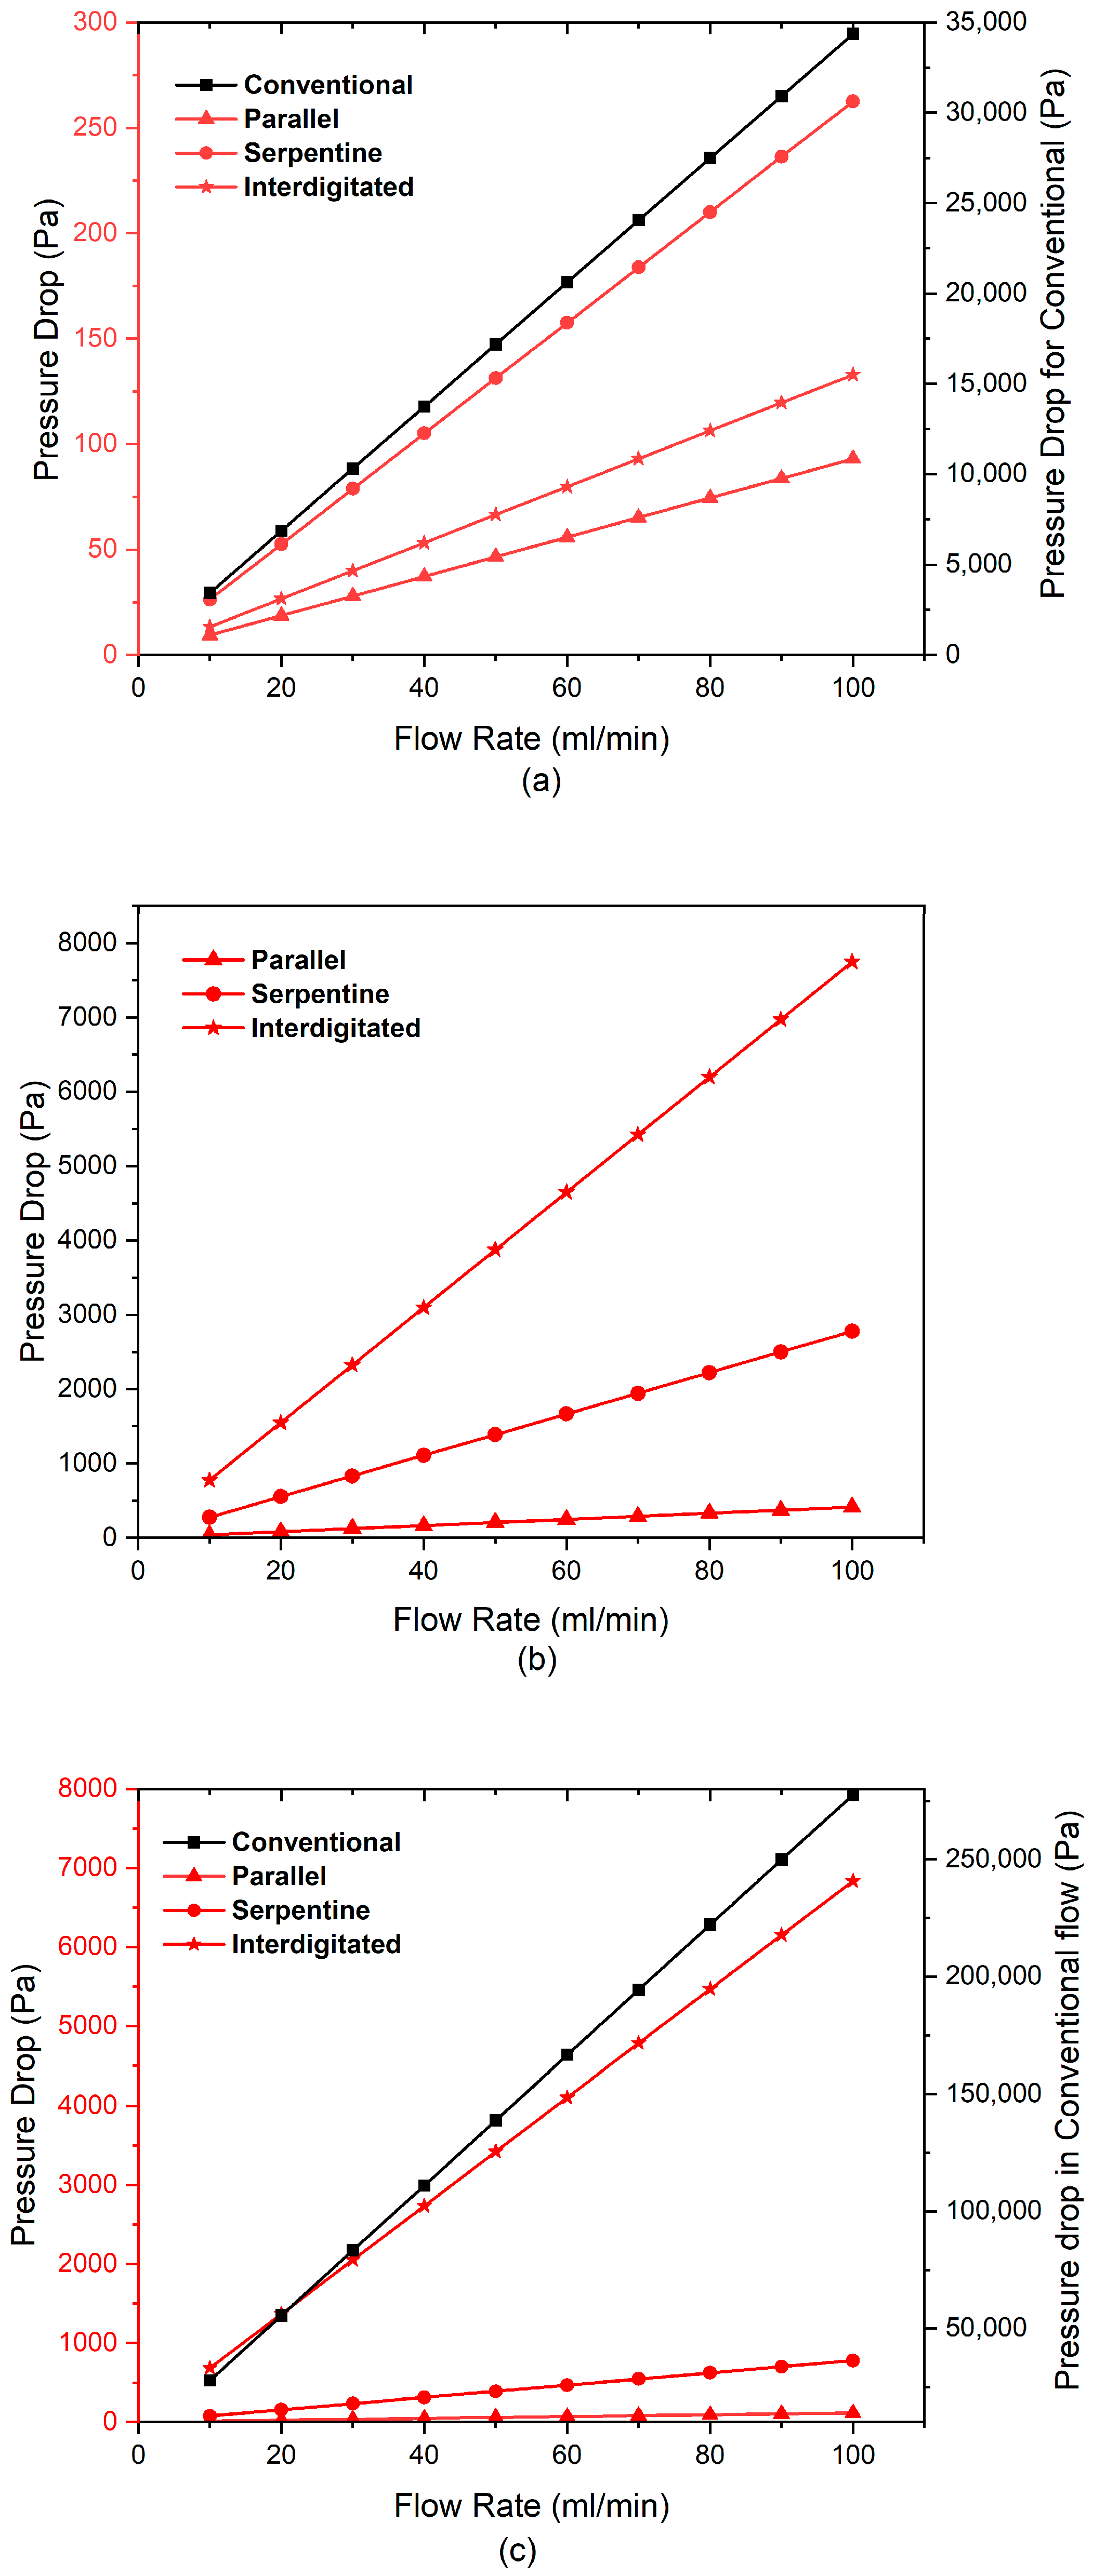
3.3. Effect of Flow Fields and Electrode Compression on Velocity and Pressure Drop

Figure 8 and Figure 9 illustrate contour planes displaying velocity and pressure distributions in the electrode and flow field domains under different compression conditions. In the case of the conventional flow field, the velocity at the inlet is initially high but gradually decreases due to the expanding electrode area. It then increases around the converging area, reaching its maximum at the outlet. The flow mostly follows a diagonal path along the inlet and outlet. The fluid pressure is maximum at the inlet and gradually reduces to atmospheric pressure at the outlet. Parallel flow fields minimise pressure drop, with higher flow occurring in the first and last channels and lower velocities in the central channels.
Serpentine flow fields exhibit higher fluid velocities within the channel compared to the other two flow fields. The velocity gradually decreases in the mid-channel and increases again towards the exit. Due to the pressure difference exerted between adjacent channels away from the U-bend, there is convection under the rib through the electrode. This leads to a more uniform electrolyte distribution through the rib, facilitated by both diffusion and convection. However, the convective flow is low near the U-bends. The fluxes under the rib are influenced by dimensions of the channel and its shape.
Interdigitated geometry shows slightly better performance than the serpentine arrangement. In this configuration, the fluid is forced to flow under the rib between the inlet and outlet channels, and the mechanism under the rib is more pronounced. The inlet of the feeding channel and the outlet of the discharging channel have higher velocity components, with flow occurring along the channel direction. The central digits of the channel experience lower velocities, with flow perpendicular to the channel direction. The pressure drop in this flow field is higher than that in the parallel arrangement but lower than in the serpentine configuration, given the flow rate and active area.
The velocity magnitude in the porous medium is approximately 5% of that in the channel, with higher values observed in the under-rib region. The pressure drop in the channels is higher than in the porous electrodes. Compression significantly affects pressure drop as it majorly impacts the porosity and permeability of the felt material, particularly in the rib region. The lower permeability of the electrolyte in compressed electrodes increases flow resistance, diverting the flow into the channel volume and thereby increasing pressure drop. This increased velocity allows more electrolytes to penetrate into the porous medium. Conversely, compression decreases the permeability, porosity, and bulk volume of the electrode, impeding electrolyte penetration [13]. These opposing factors work together. At a flow rate of 40 mL.min−1 (1.6 mL.min−1.cm−2), the pressure drop increments for conventional, serpentine, parallel, and interdigitated flow fields are 97 kPa, 1 kPa, 0.128 kPa, and 3 kPa, respectively, for 50% compression in all cases. The permeability of the uncompressed electrode is always higher than that of the compressed one, resulting in a lower pressure drop through the uncompressed electrode.

Velocity Profile

Figure 10 presents the variation of velocity along the X-direction for three different compressed geometric structures: uncompressed, non-homogeneously compressed, and homogeneously compressed electrodes for all the flow field configurations studied in this work. The velocity profile is obtained across four distinct zones, namely, (i) upstream, (ii) downstream, (iii) under channel, and (iv) under rib. Notably, the under-channel and under-rib regions exhibit the highest variations in velocity distribution, while the upstream and downstream zones display lower velocities. Comparing the velocity under the rib to that in the channel, it is evident that the area beneath the rib experiences a higher velocity due to the cross flow of the electrolyte. Additionally, the velocity in the second and subsequent parallel channels is slightly lower than that in the first channel, regardless of the compression scenario. However, the differences in estimated velocities within the compressed flow field are minimal.
Figure 11 depicts the impact of intrusion in the non-homogeneously compressed electrode across all three flow fields. In each flow field, cross flow is observed to persist under the ribs, and the velocity of cross flow increases in a consistent manner. Among the flow fields, the interdigitated flow field exhibits the highest cross flow velocity.
The pressure drop measurements for various flow fields at different volumetric flow rates are depicted in Figure 12. In all compression scenarios, the pressure drop increases as the flow rate increases. Notably, the conventional flow field exhibits the highest pressure drop among all tested configurations. This can be attributed to the fact that in the conventional flow field, the entire fluid must pass through a porous medium, whereas in the cells with flow field, only a portion of the fluid is directed through channels. Consequently, the resistance encountered by the fluid when flowing through the conventional flow field is significantly greater compared to the channel with intrusion. On the other hand, the parallel flow field demonstrates the lowest pressure drop across all compression conditions. However, in the uncompressed electrode, the pressure drop in the interdigitated flow field is lower than that of the serpentine flow field, whereas in both the non-homogeneously compressed and homogeneously compressed electrode configurations, the pressure drop in the interdigitated flow field is higher than that of the serpentine flow field.
In order to facilitate the movement of electrolytes between the tank and the cell, two pumps are utilised. The quantification of mechanical power consumption under non-homogeneously compressed conditions is derived using Equation (30). By applying this equation to various flow rates and pressure drops, the power required by the pumps is determined. The resulting pump power values for the given range of flow rates are presented graphically in Figure 13a. The analysis reveals that the conventional flow configuration demands the highest power, while the parallel configuration necessitates the least. The serpentine and interdigitated configurations fall within this range. To further investigate and compare pump power consumption under different compression conditions, Figure 13b displays the findings at a flow rate of 40 mL.min−1.
P P u m p = Q × P ψ P u m p
Figure 14 illustrates the concentration distribution of V2+ ions within the negative cell employing different flow field configurations: (i) conventional, (ii) parallel, (iii) serpentine, and (iv) interdigitated flow fields, at a state of charge (SOC) of 0.8 and an applied current density of 60 mA.cm−2. During the discharge process, V2+ ions are consumed while V3+ ions are generated. The electrolyte initially enters the channel through convection and then diffuses into the electrode. In the conventional flow field, the concentration of V2+ ions are maximum at the inlet and minimum at the outlet due to the conversion reaction from V2+ to V3+. In the parallel flow design, the under-rib convection is low, resulting in an uneven distribution of reactants [25].
For the serpentine flow field, the concentration of V2+ ions decreases from each inlet channel to the adjacent outlet channel. This indicates a higher conversion rate compared to the cases with parallel and conventional flow fields. In the interdigitated flow field, the concentration of V2+ ions is higher at the inlet end of the channel and lower at the outlet end. Additionally, it is even lower than the outlet concentration on the right side of the discharging and feeding channel [25].
When the electrode is under compression, the flow velocity in the channel region increases, leading to an enhanced reaction rate and electrolyte consumption. The reactant is predominantly consumed in the rib region due to the direct contact between the electrode and the membrane. A compressed thin electrode exhibits high electronic conductivity and ensures an even distribution of the electrolyte [13].

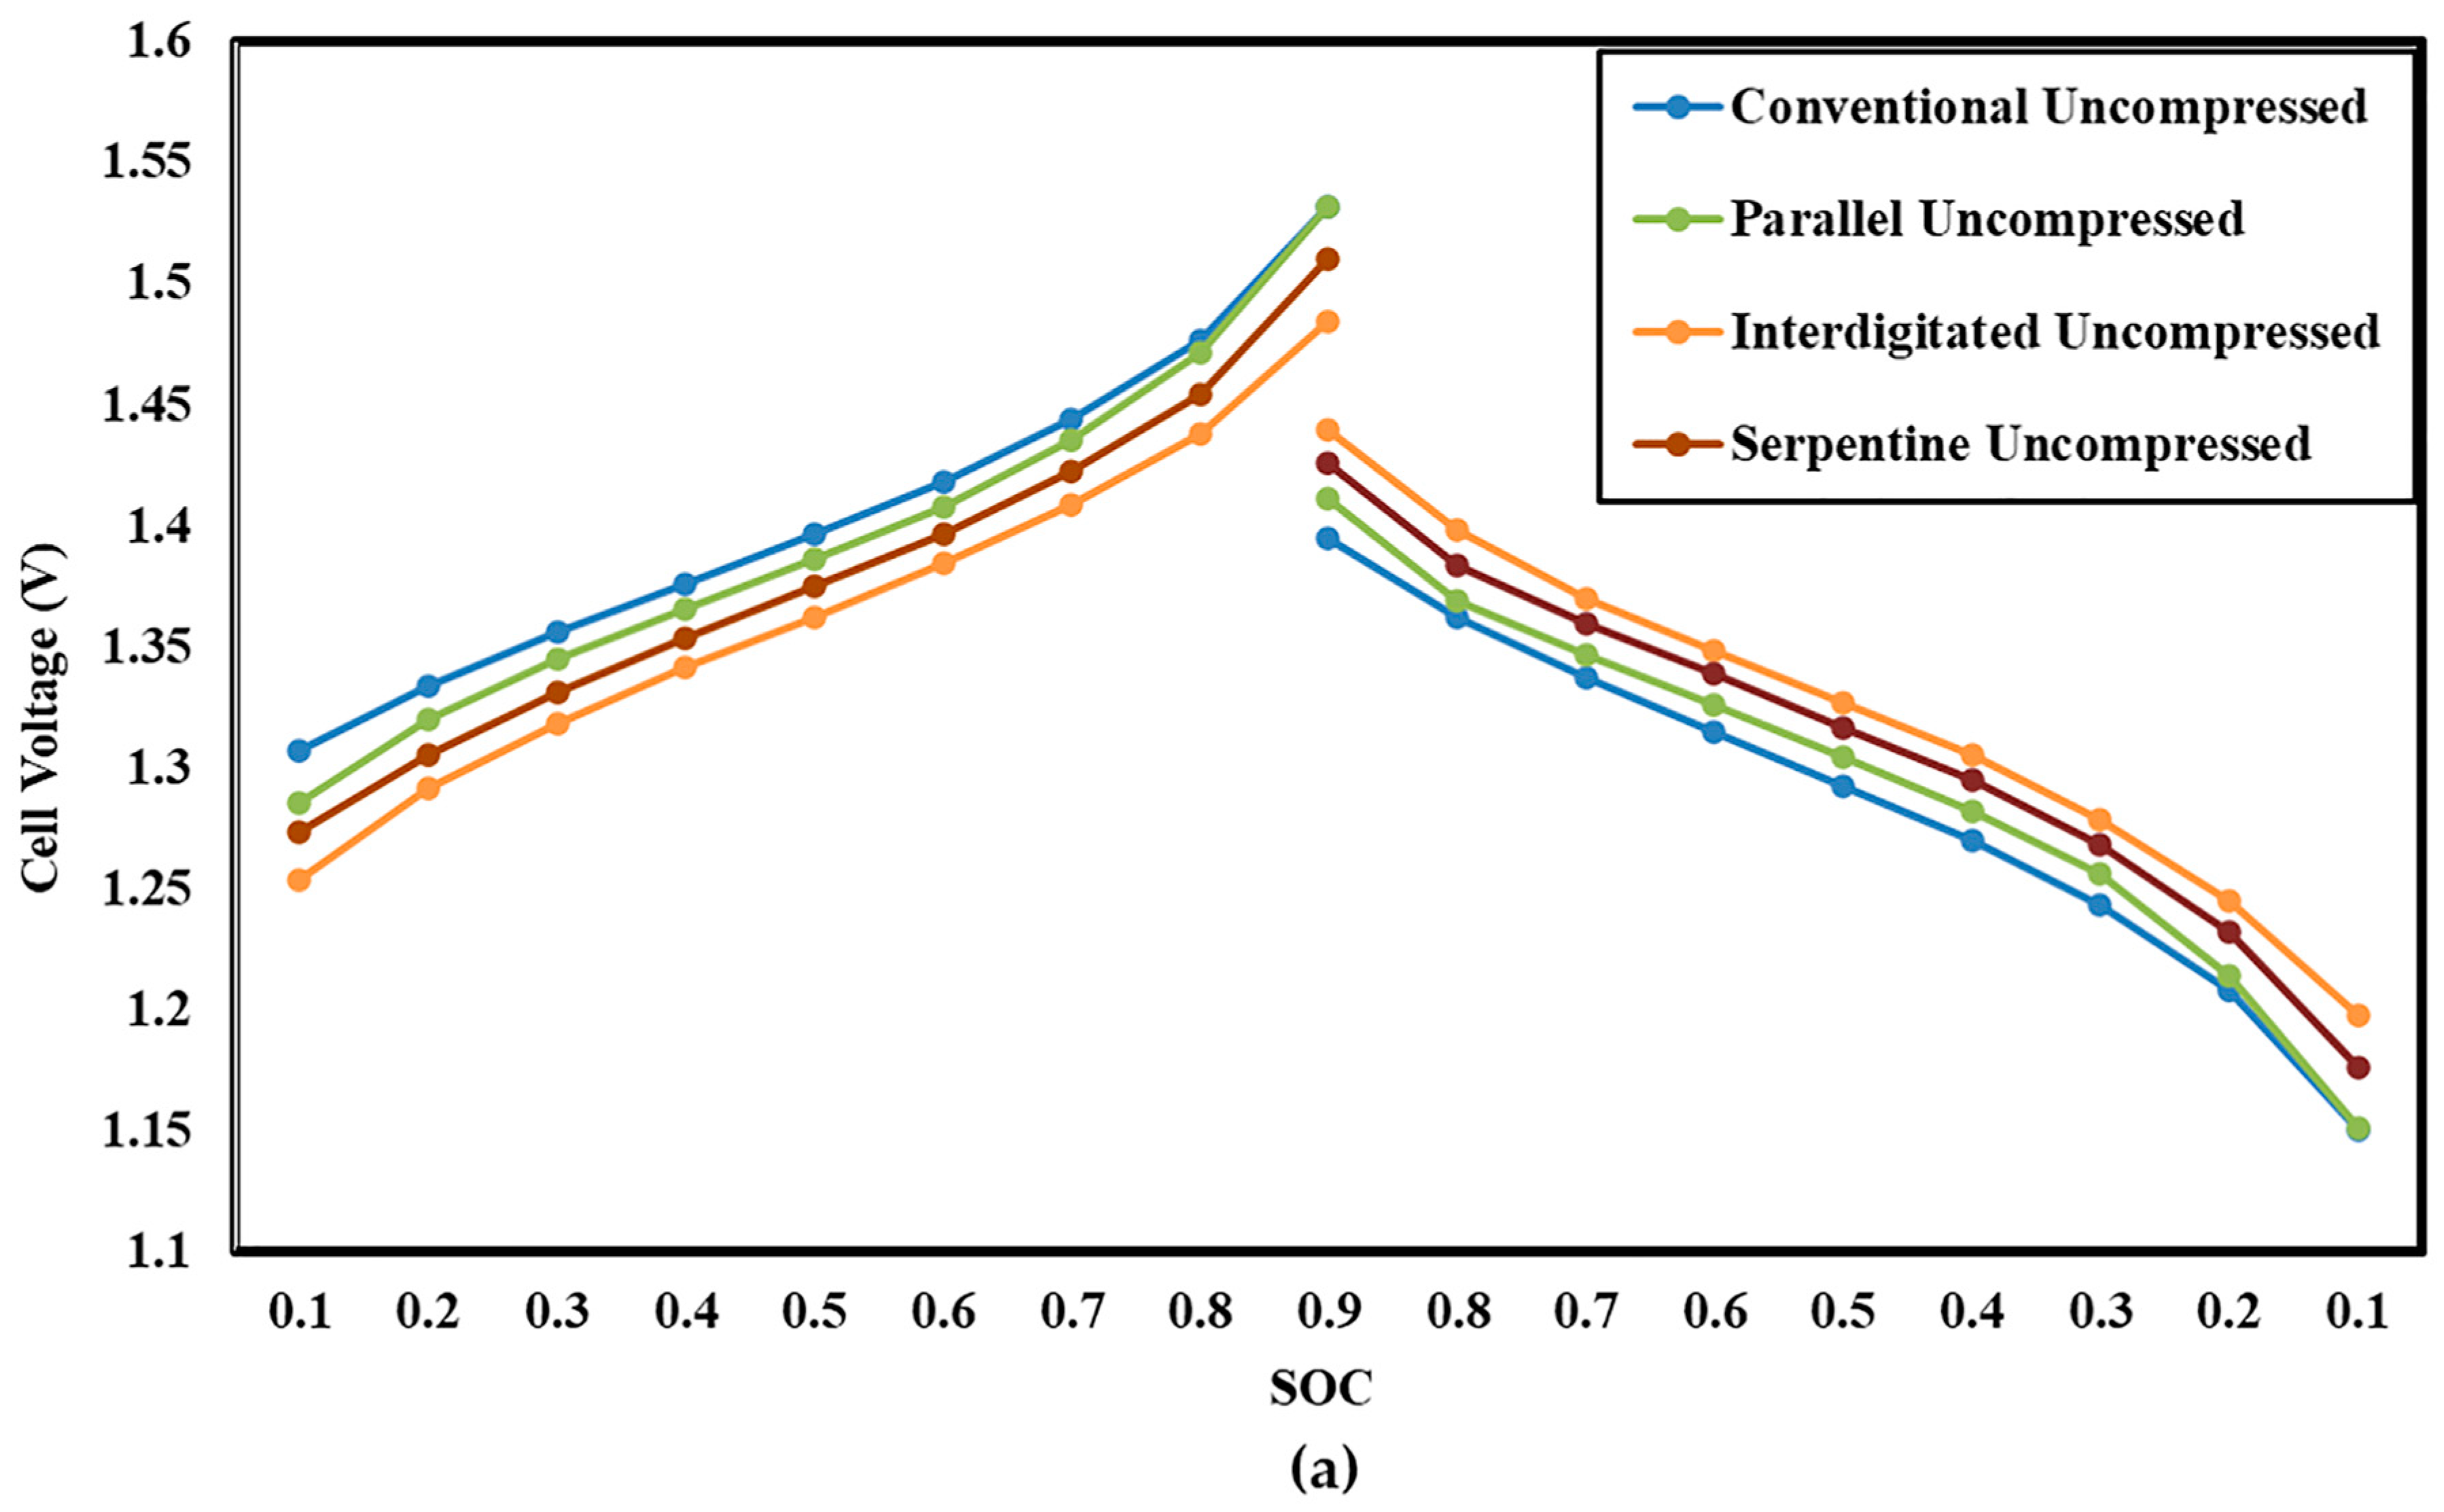
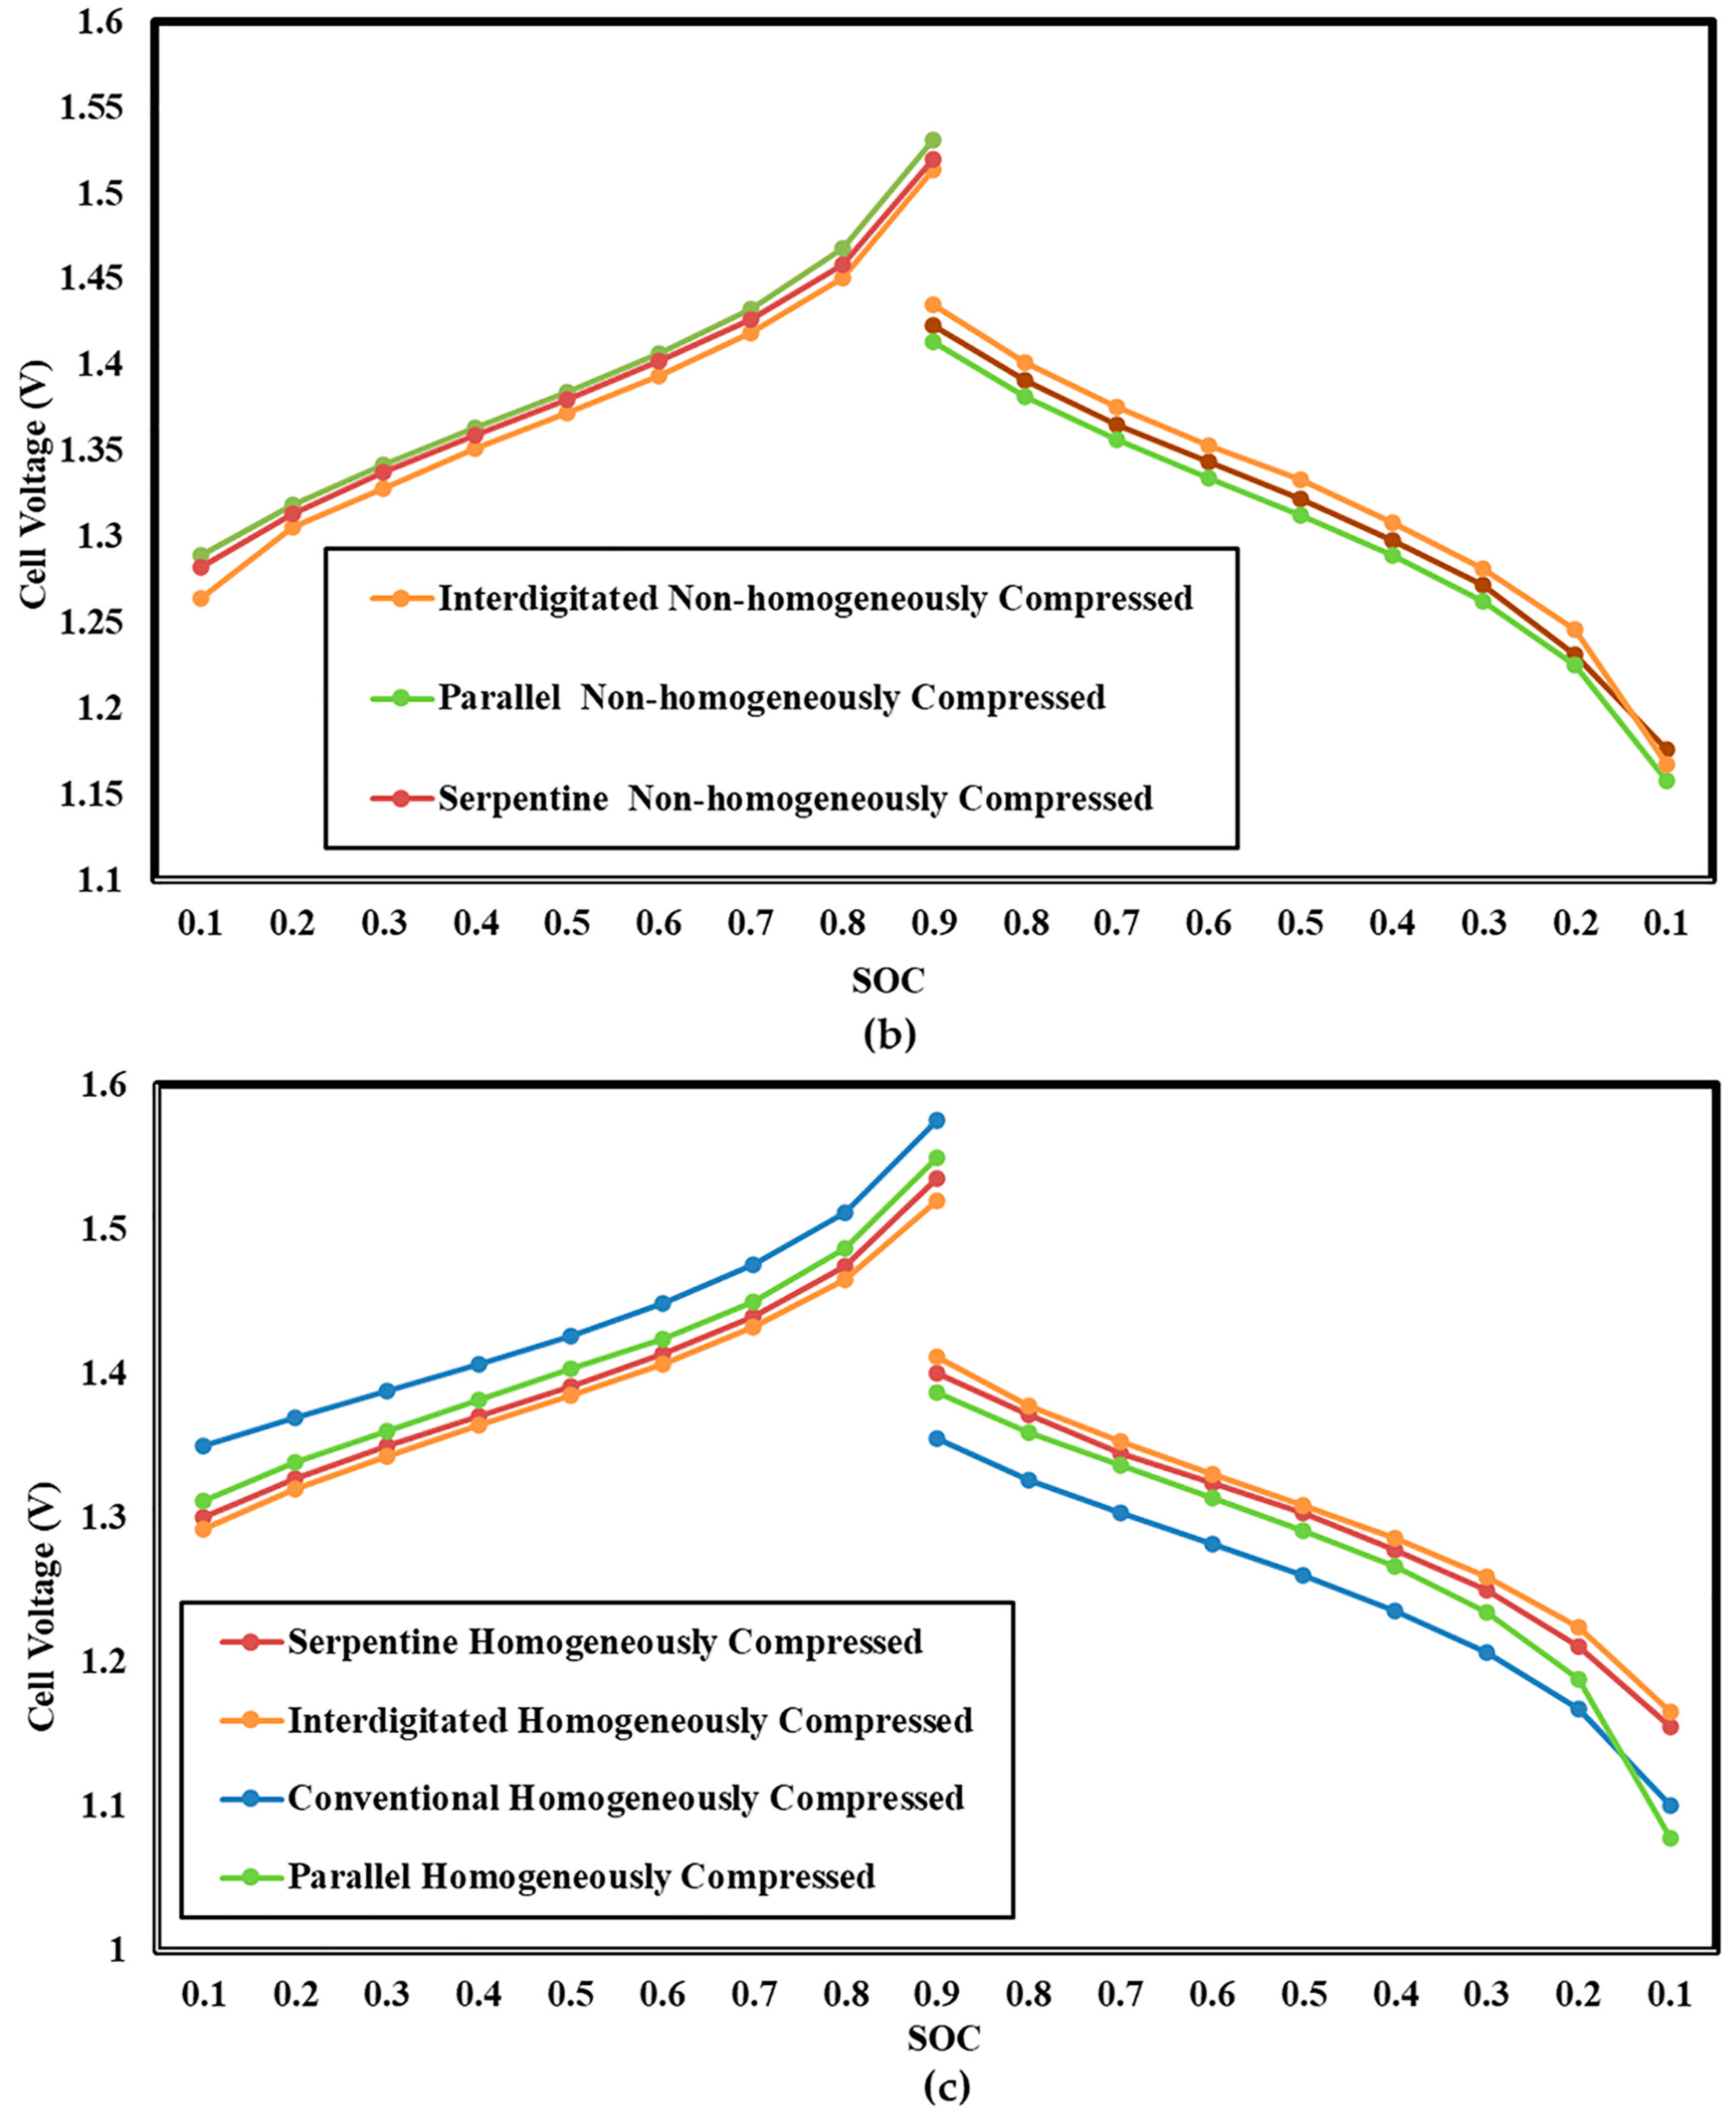
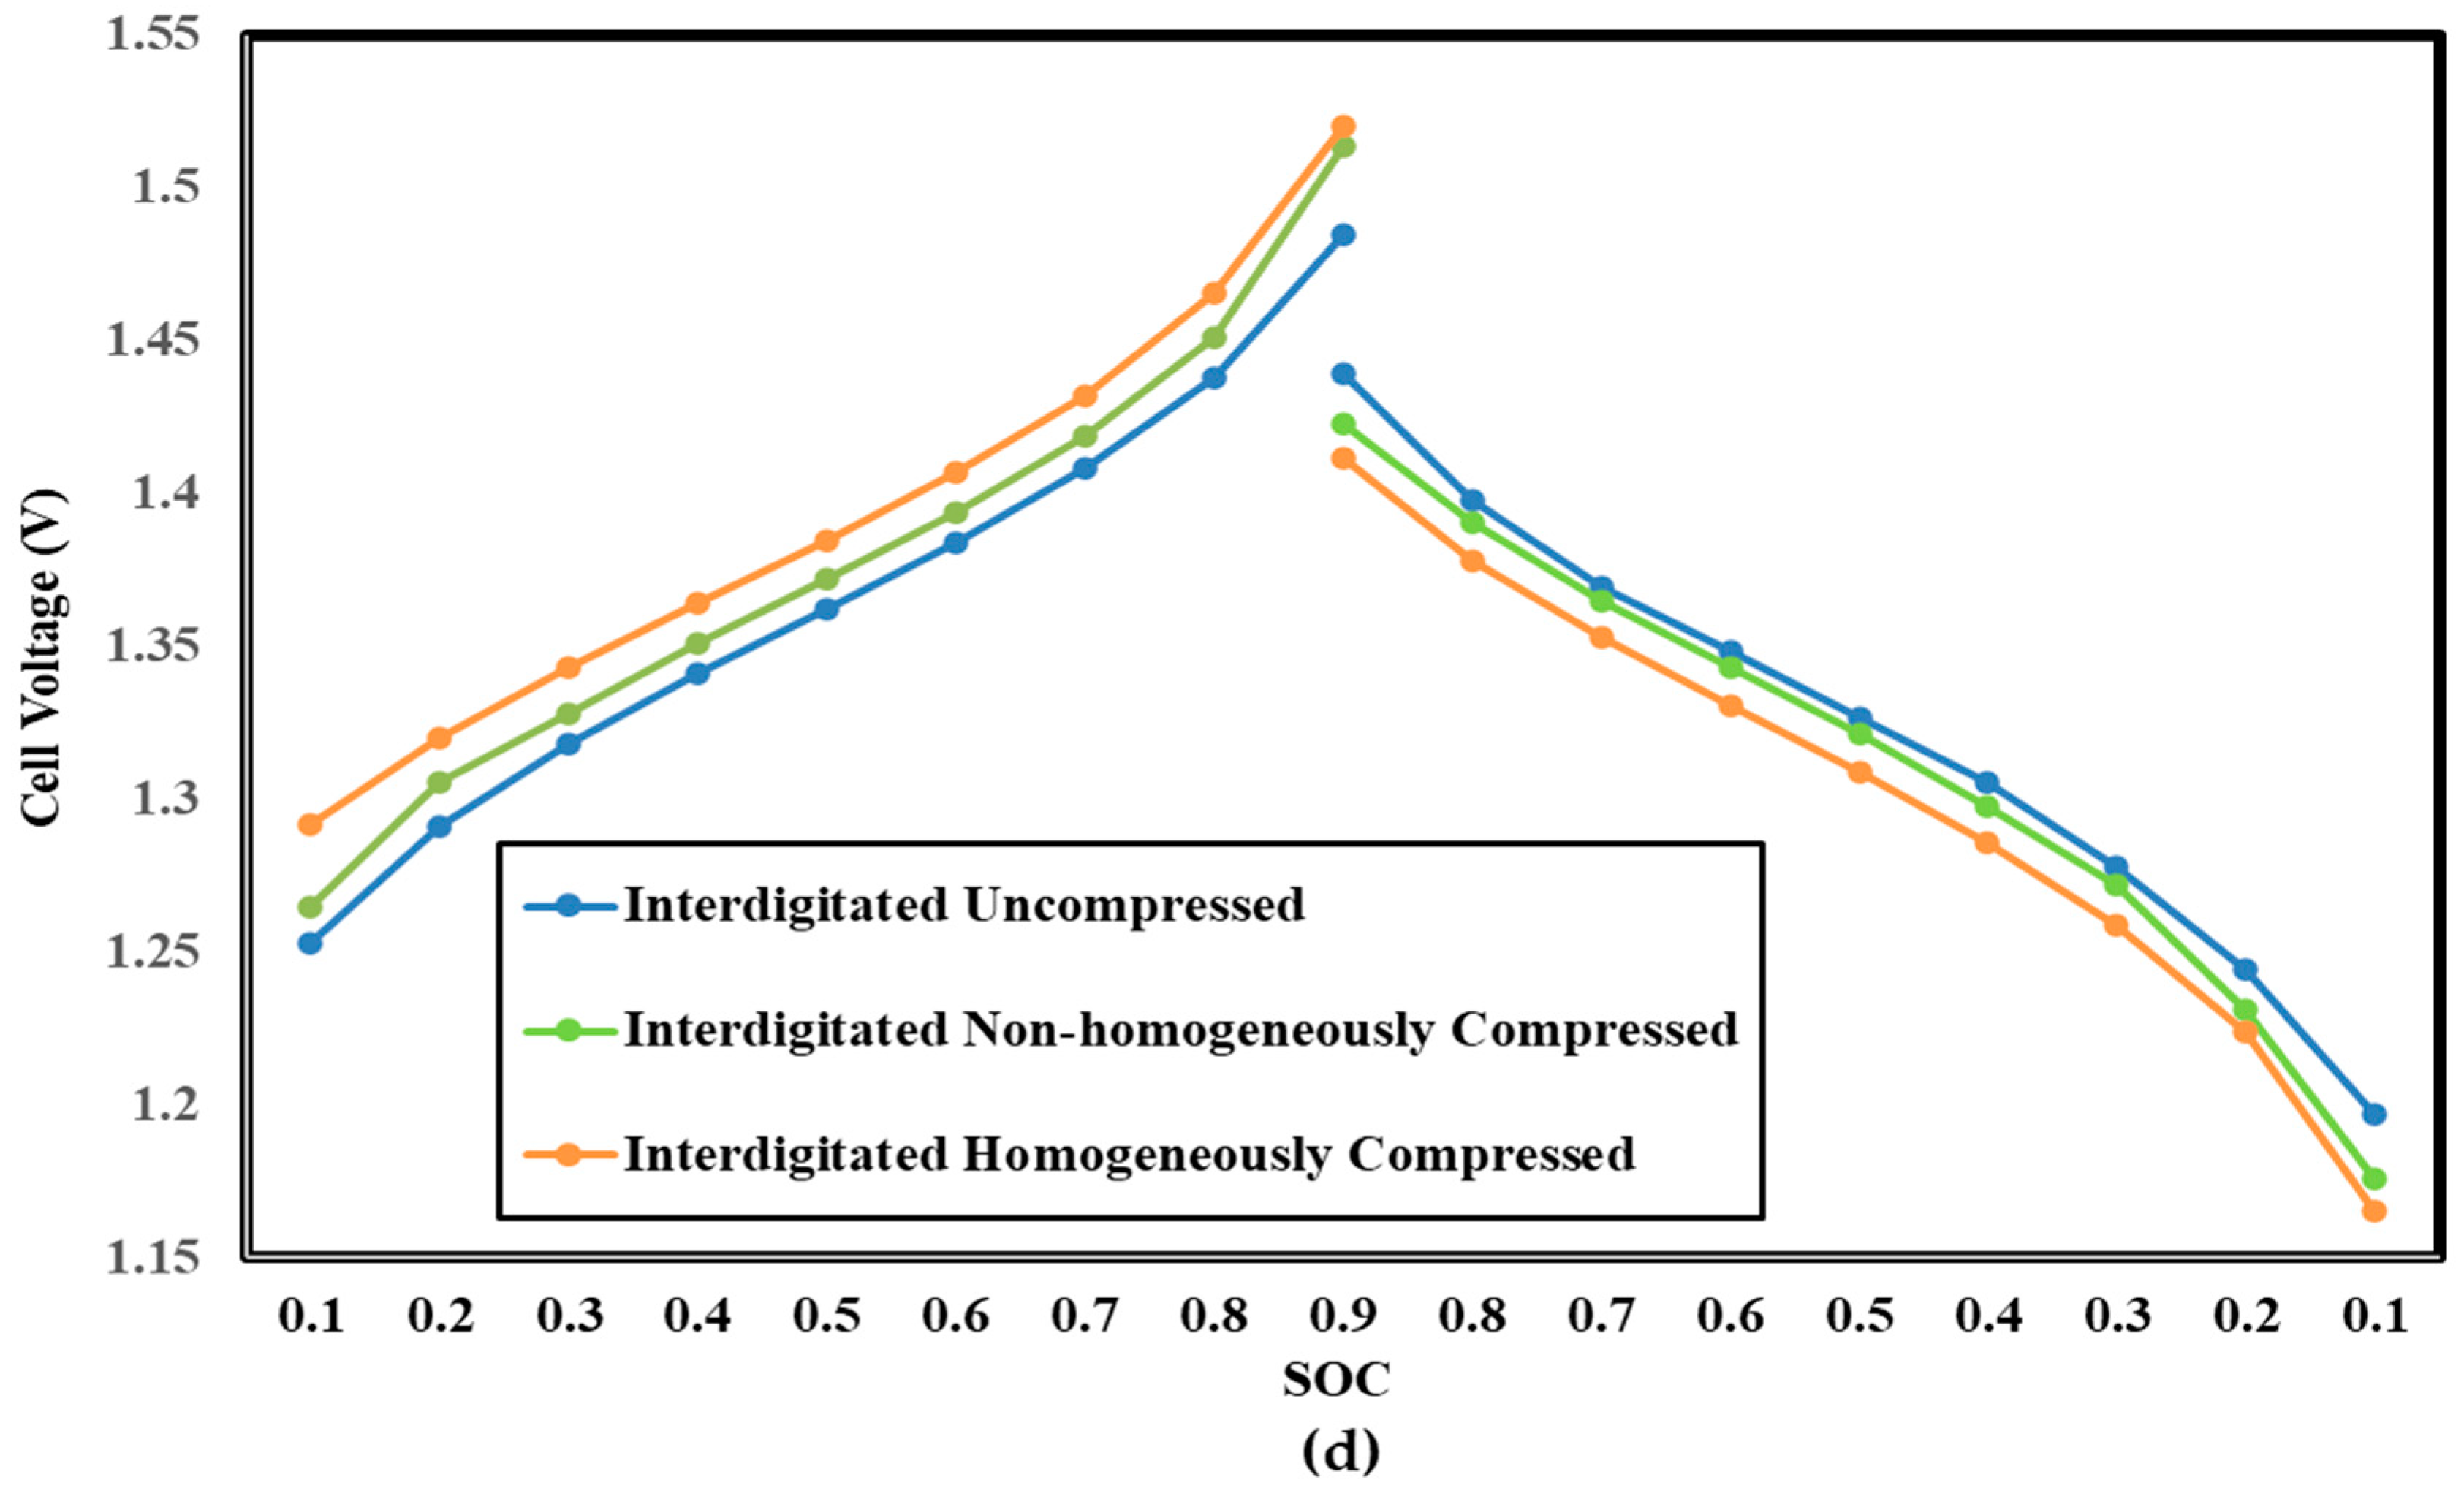
3.4. Influence of Electrode Compression on Cell Voltage

Figure 15 illustrates the charge–discharge curve for three different electrode compression scenarios: uncompressed, non-homogeneously compressed, and homogeneously compressed electrodes, considering three flow field configurations: parallel, interdigitated, and serpentine. Among these configurations, the interdigitated flow field VRFB demonstrates the lowest charging voltage and the highest discharging voltage across all states of charge (SOC). Compression of the electrode leads to a reduction in electrode thickness and porosity. However, it also results in an increase in specific surface area and electrical conductivity. The decreased thickness of the electrode reduces conduction losses in the electrolyte and electrode by shortening the distance between the current collector and the membrane for both ions and electrons. Moreover, the compression of the electrode enhances the electrical conductivity of the electrode felt. These combined effects contribute to a reduction in ohmic losses, resulting in the battery exhibiting lower internal resistance. Conversely, compression of the electrode simultaneously enhances mass transfer resistance, affecting overall cell performance [12].
Table 7 shows the summary of the average voltage values over the entire range of SOCs in charging and discharging conditions for all four flow field configurations under the three compression scenarios. It can be clearly seen that the interdigitated flow field shows the lowest charging potential and the highest discharging potential among all flow fields under all three compression scenarios. In the case of the interdigitated flow field, uncompressed electrode condition shows the conservative estimates of the average charging potential of 1.3647 V and the average discharging potential of 1.3231 V, while compressed electrode condition and the more realistic condition of non-homogeneously compressed electrode condition show the average charging potential of 1.3922 V and 1.3777 V and the average discharging potential of 1.3019 V and 1.3224 V, respectively.

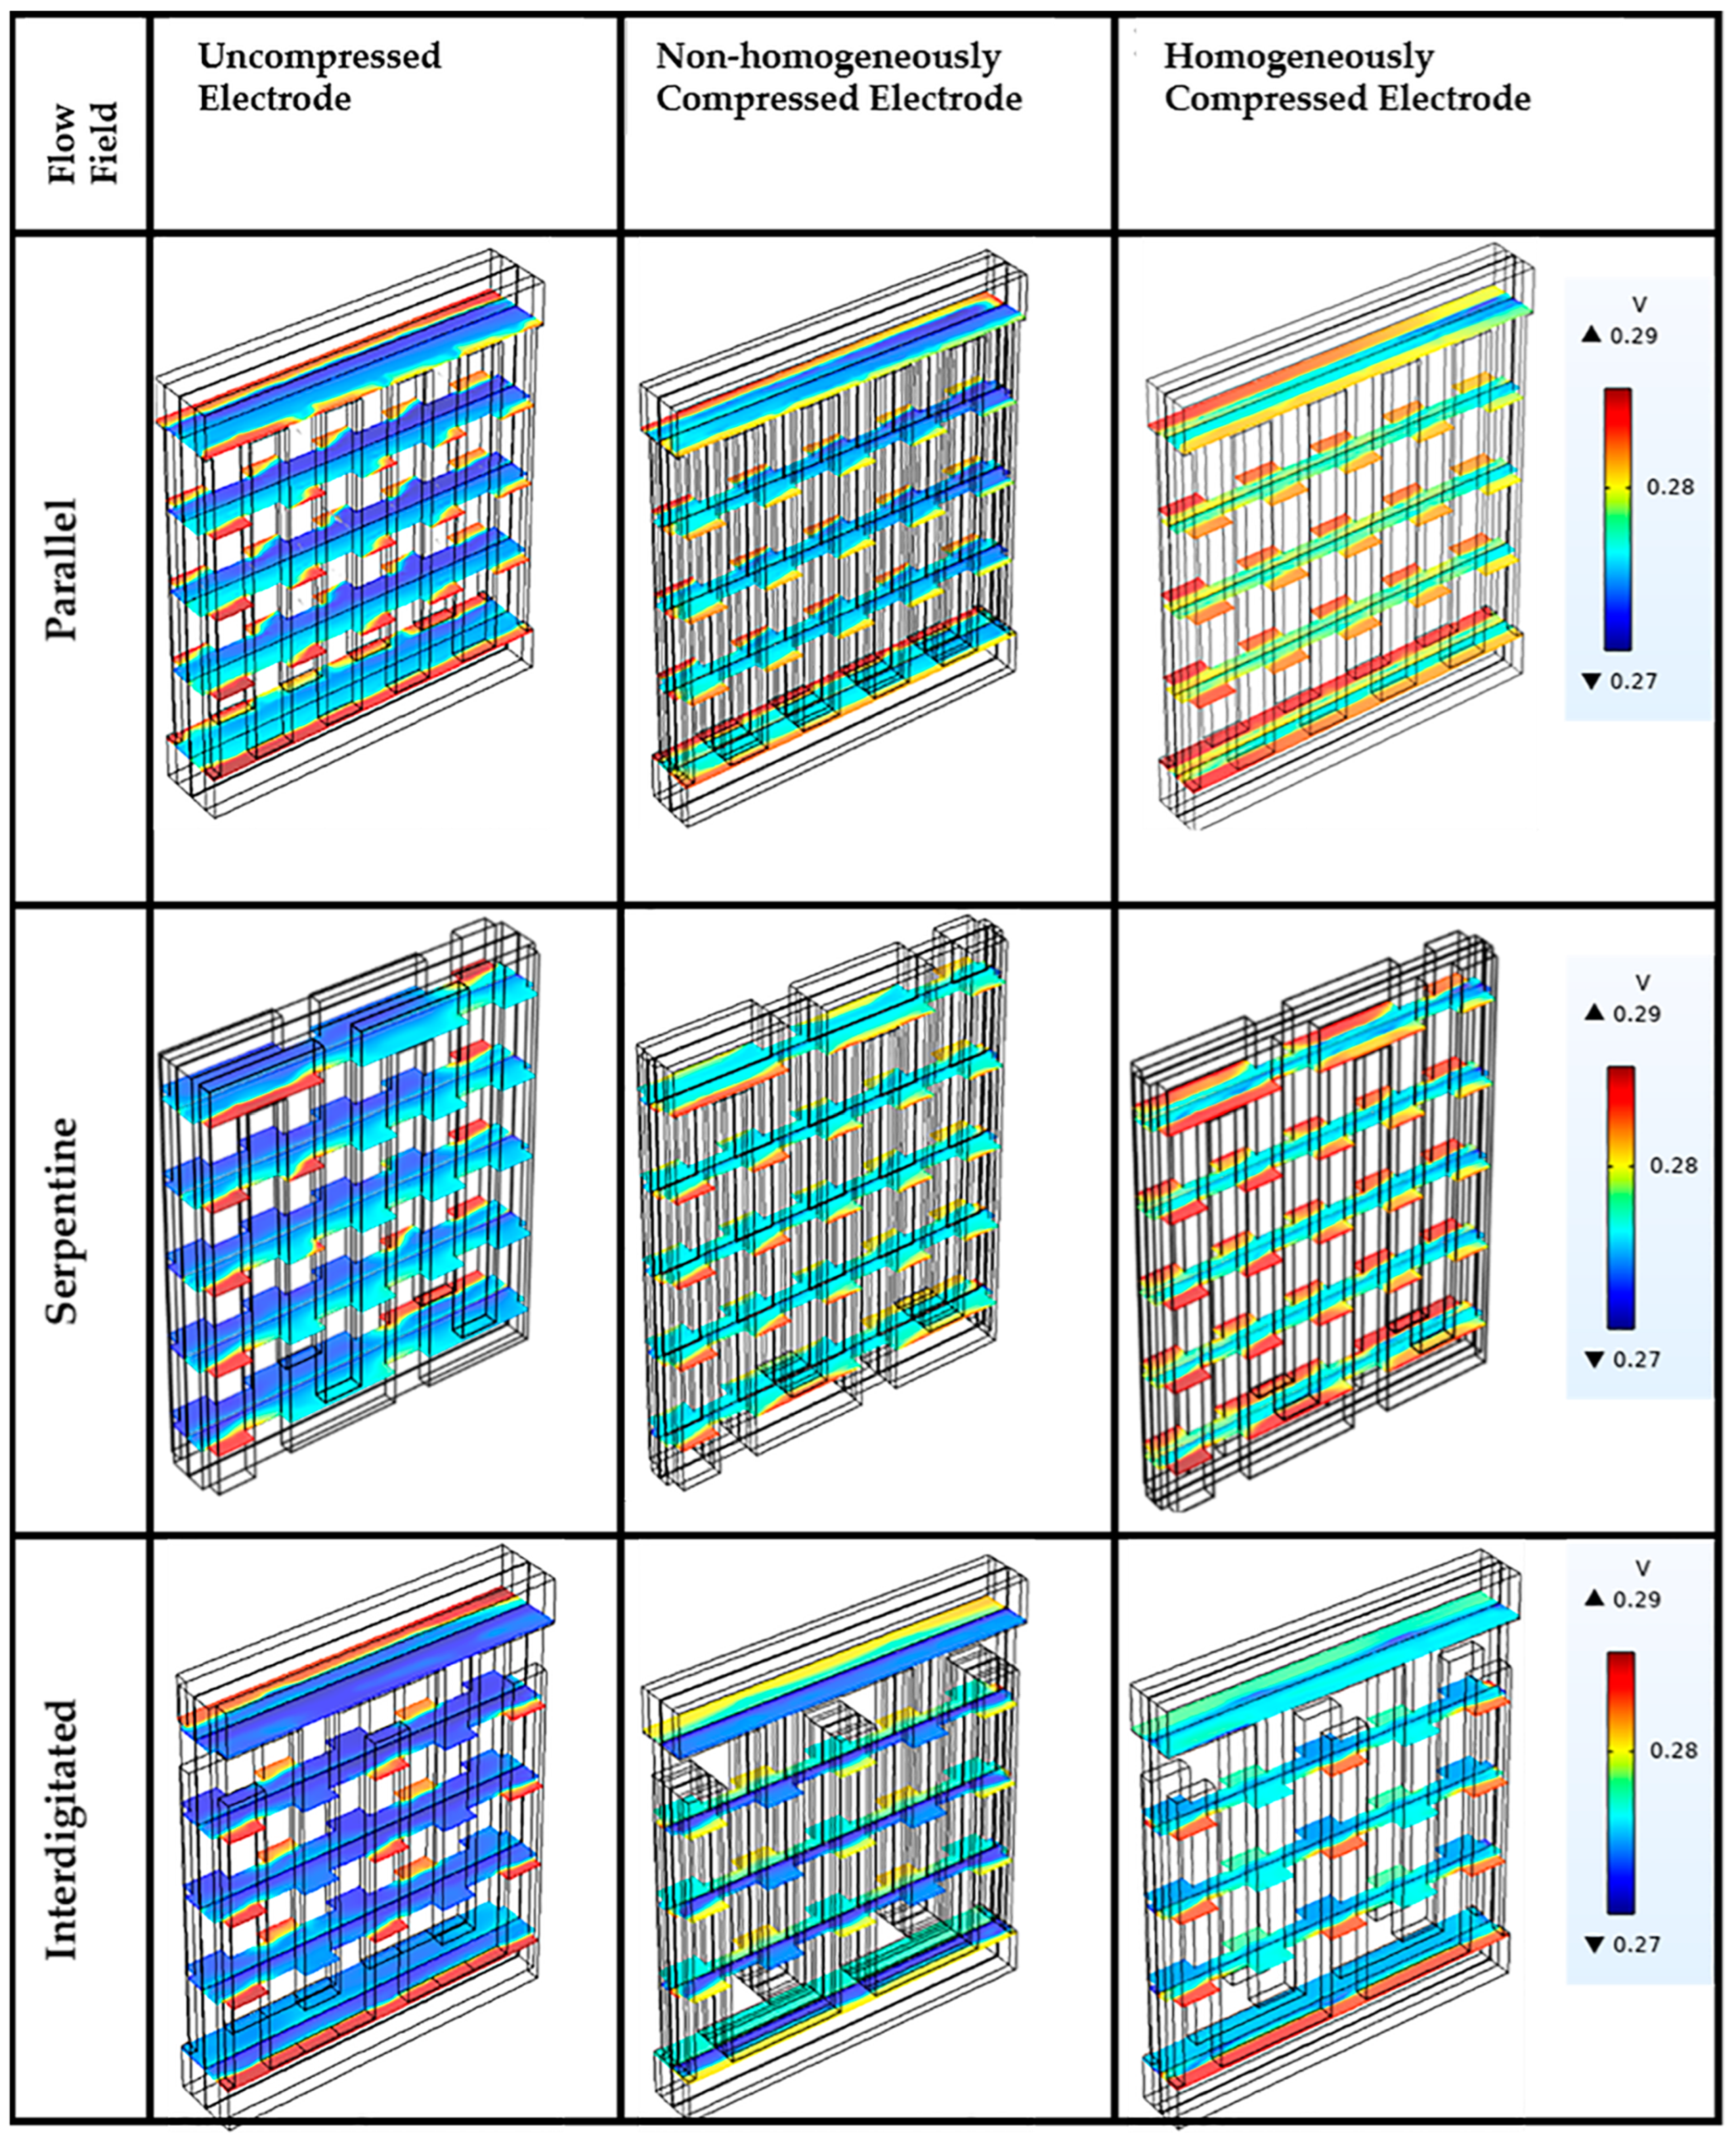
3.5. Influence of Flow Fields on Electrolyte Potential

The electrolyte potential refers to the potential within the electrolyte phase consisting of ions. Figure 16 shows the contour plots depicting the distributions of electrolyte potential for three different compression cases. The simulation results indicate that the electrolyte potential is generally higher in the channel region compared to the electrode region. Additionally, the potential gradually decreases from the inlet to the outlet of the system during discharge. In the uncompressed electrode, the electrolyte potential exhibits a larger gradient when compared to the compressed electrode. This can be attributed to the thicker electrodes present in the uncompressed configuration, which provide longer pathways for the movement of electrons. Consequently, the electrolyte potential distribution is more uniform in the compressed electrode due to the shorter electron travel distances. For the Interdigitated flow field configuration, the potential is higher in the feeding channel and lower in the discharging channel. This discrepancy in potential arises from the specific design of the flow field, which promotes different electrolyte behaviours in the feeding and discharging channels.

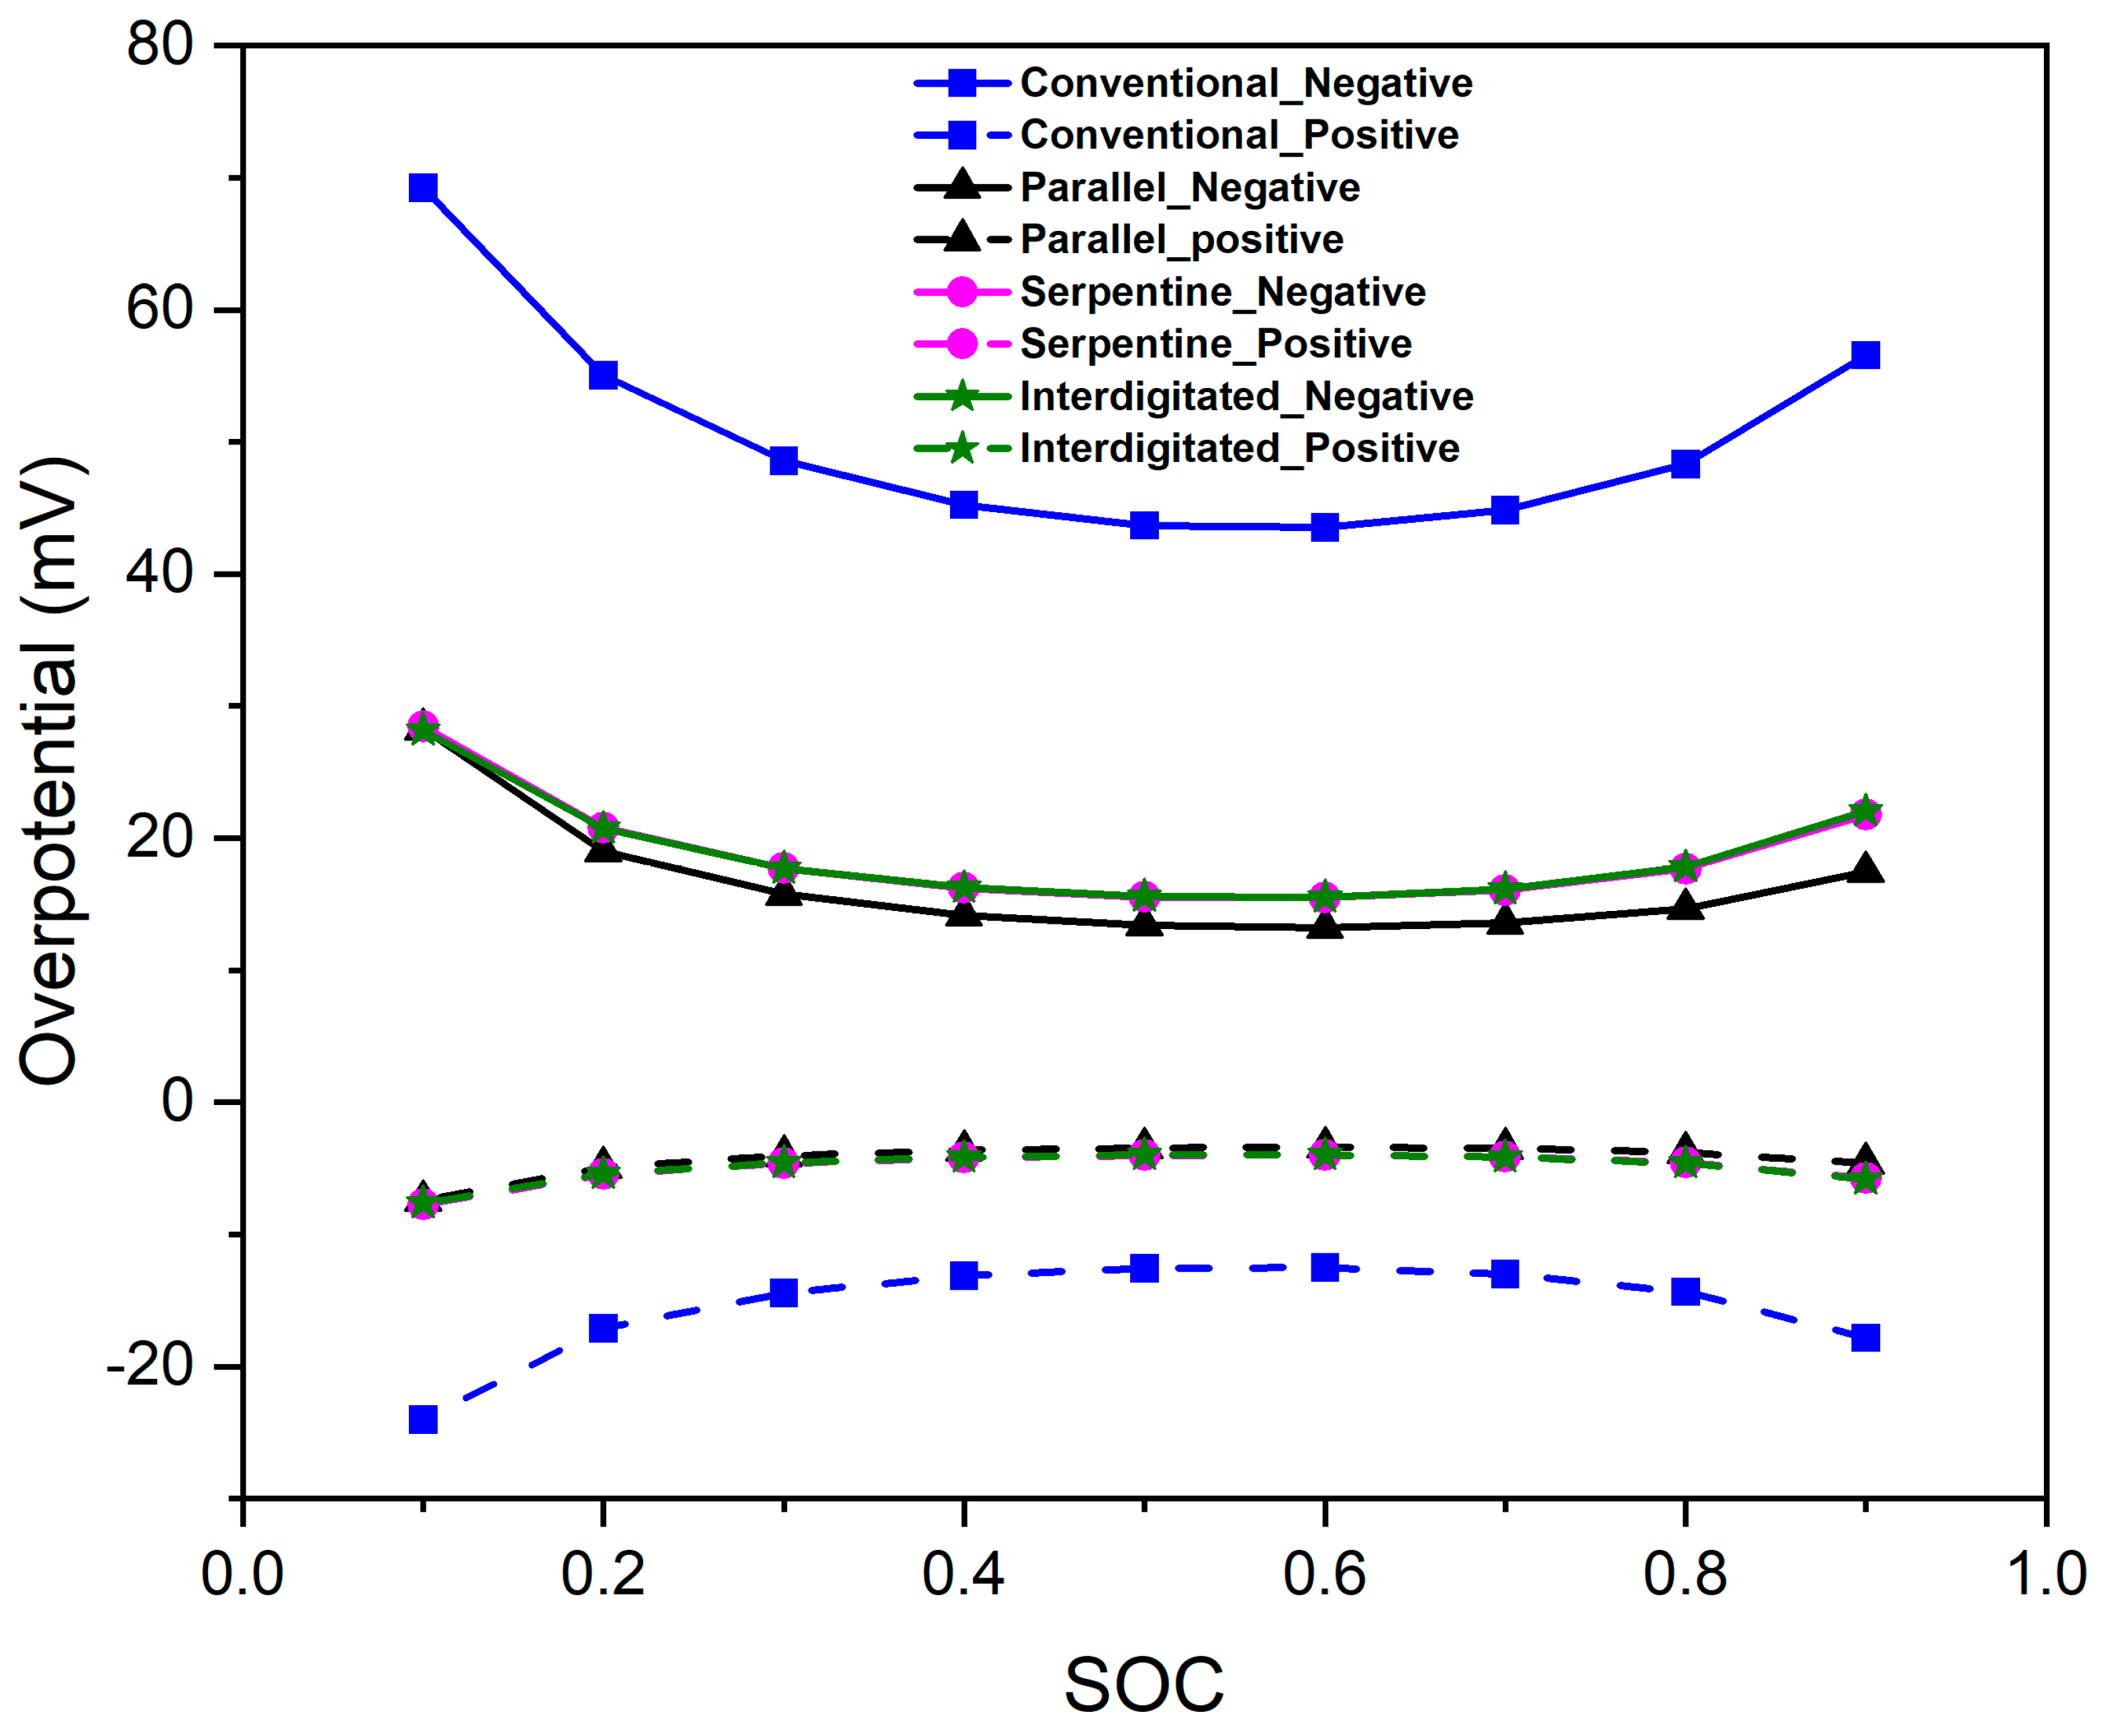
3.6. Impact of Flow Fields on Overpotential Distribution

Figure 17 shows contour plots for the distributions of overpotential on the electrode-current collector interface at 80% SOC for an applied current density of 60 mA.cm−2. The current density distribution mentioned earlier corresponds closely to the overpotential distribution, which quantifies the losses occurring in the electrode due to activation, ohmic, and concentration polarisation. To analyse the influence of structure on the resulting variation in overpotential, a specific compression condition is considered while keeping the physical and chemical property parameters of every flow field constant.
Among the different compression conditions and flow fields, the uncompressed electrode in the serpentine flow field demonstrates the lowest overpotential in the regions near the current collector. This outcome is primarily attributed to the higher uniformity in concentration distribution and enhanced convective mass transport to the membrane. The accompanying Figure 16 illustrates this phenomenon. To mitigate or minimise the impact of side reactions, such as oxygen and hydrogen evolution, it is crucial to comprehend the location and extent of such polarisation effects [26].
In Figure 18, the variations in positive and negative overpotential under non-homogeneous conditions are depicted. The overpotential exhibits its minimum value around a state of charge (SOC) of 0.5, while it reaches its maximum at either the lowest or highest SOC for all flow fields in the case of the negative electrode. This behaviour can be attributed to the influential role of ion concentrations on the local electrochemical reaction rate.

3.7. Impact of Flow Fields and Compression on Current Density Distribution

Figure 19 illustrates the contours of transfer current density distribution for three distinct instances of electrode compression applied to the negative electrodes on the contact surface between the bipolar plate and electrode. The results indicate that the flow channel within the bipolar plate significantly influences the distribution of current density. In regions where the electrode comes into direct contact with the current collector, such as around the rib positions, the current density is higher compared to the area beneath the channel in all flow fields. This enhanced electron conduction in the contact areas yields a greater response.
The non-homogeneously compressed electrode exhibits lower porosity around the ribs and higher porosity intruding and beneath the channel area. Consequently, the areas mentioned later experience less resistance and higher mass transfer for the reactant. These findings demonstrate an overall higher reactant consumption rate, resulting in a higher current density for the non-homogeneous case.
However, in a homogeneously compressed electrode, local concentration depletion in the electrode is the cause of large current gradients while the velocity distribution through the channel is uniform. The total current generated is constrained by the diffusion mass transport resistance between the liquid electrolyte and the electrode surface due to low porosity [19]. Reactant concentrations and overpotential are dependent on the current density, with the lowest reactant concentration exhibiting the most abrupt drop. Additionally, achieving an equal distribution of current density in a battery helps to reduce overpotential.
Based on the data depicted in Figure 20, a clear trend emerges indicating that the potential difference across three flow battery scenarios, each subjected to varying degrees of compression, rises correspondingly with an elevated current density. Specifically, the scenario employing an uncompressed electrode exhibits the highest discharge potential. This outcome can be attributed to the reduced resistance and uniform dispersion of current across the electrode surface.

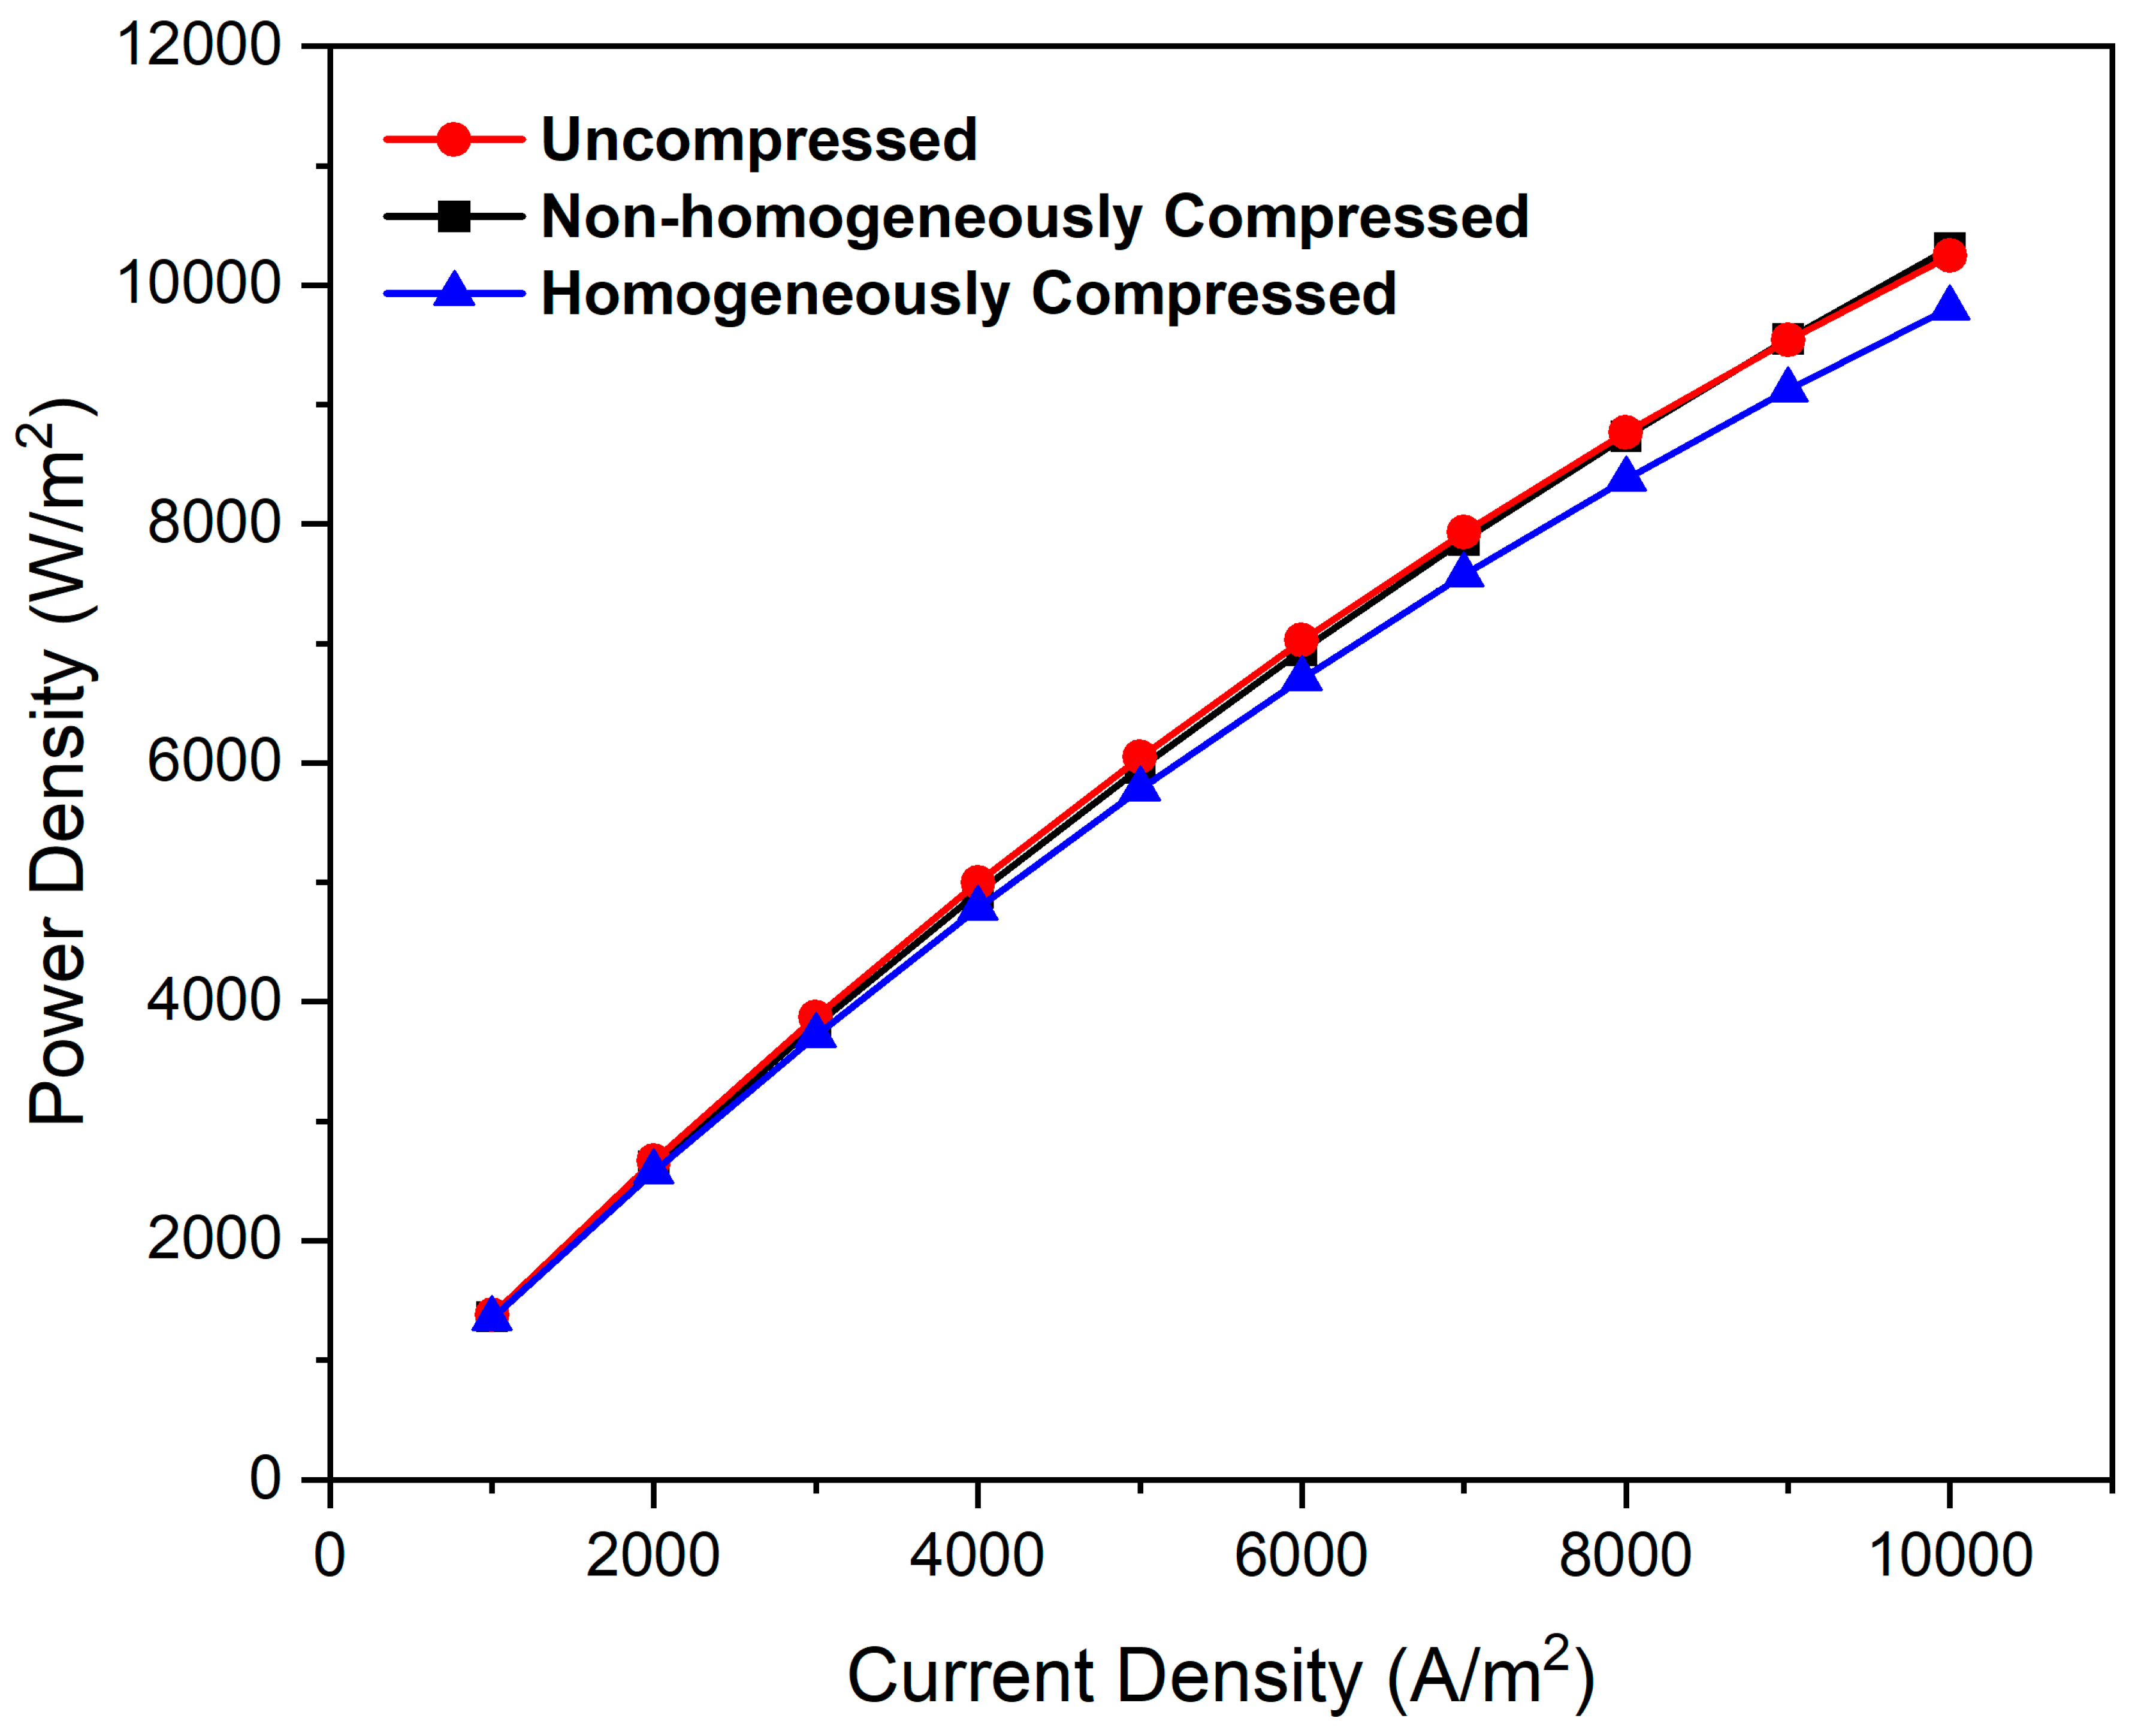
3.8. Influence of Compression in Flow Fields on Power Density

The effect of electrode compression in the serpentine flow field on power density is illustrated in Figure 21 at a state of charge (SOC) of 0.8. When comparing a specific range of current densities, it can be observed that compressed electrodes exhibit slightly lower power densities. VRFBs are typically operated at moderate current densities of 50–80 mA cm−2 [3]. Based on these normal operational conditions, compression has a negligible influence on power output. However, at higher current densities, the combined impact of Ohmic losses becomes more significant, leading to noticeable performance differences. At lower current densities, the polarisation behaviour remains unaffected by electrode compression [11]. Throughout this entire range, the power density remains relatively unaffected by changes in electrode compression.

4. Conclusions

In this study, a numerical investigation was conducted using a three-dimensional steady-state VRFB model to examine the impact of electrode compression on different flow fields. The following conclusions can be drawn from our findings:
  • The predicted cell performance of the non-homogeneously compressed electrode (a realistic operating condition) lies between the uncompressed and homogeneously compressed electrodes within the specified range of current density for all the flow field configurations considered in this study.
  • It is observed that the Interdigitated flow field has displayed the best performance with the lowest charging potential and the highest discharging potential among all flow fields under all the three compression scenarios.
  • Implementing cross flow in the flow field allows for an increased influx of reactants into the rib region, thereby enhancing overall mass transport within the battery.
  • Near the corner of the rib, non-uniform current density distribution may give rise to hot spots during battery operation, potentially affecting performance and durability.
  • It is observed that the non-homogeneous case study accurately predicts real cell performance and reveals notable variances in anticipated cell performance.
The outcomes of this study are expected to contribute to the fundamental understanding of the relationship between compression, flow field design, and electrode behaviour in VRFBs. The findings will provide valuable insights into the design and optimisation of VRFBs for enhanced performance and efficiency. The result obtained can be considered to be important in view of cell performance under intrusion effect on different flow field designs at different compression conditions. Additionally, the results could serve as a basis for further experimental investigations and guide the development of advanced flow field designs that could improve the overall performance and durability of VRFBs. Further, the outcomes of this research are expected to contribute to the optimisation of VRFBs, facilitating their integration into the electrical grid and supporting the transition towards a sustainable energy future.

Author Contributions

Conceptualisation, all; methodology, S.S. and K.K.M.; model development, S.S. and V.S.P.; validation, K.K.M., S.P. and V.S.P.; data analysis, S.S. and K.K.M.; writing—original draft preparation, S.S. and K.K.M.; writing—review and editing, K.K.M., S.P. and V.S.P. All authors have read and agreed to the published version of the manuscript.

Funding

This research received funding from the European Union’s Horizon 2020 research and innovation program under the Marie Sklodowska-Curie grant agreement No. 885793.

Data Availability Statement

Not applicable.

Conflicts of Interest

The authors declare no conflict of interest.

Nomenclature

Glossary of the symbols employed in this work are listed below.
Symbol
ASpecific surface area (m3/m2)
C i Concentration of each species (mol/m3)
DiDiffusion coefficient of each species (m2/s)
Di,effEffective diffusion coefficient of each species (m2/s)
dfFibre diameter (m)
dDepth of intrusion
E0Reference potential for the electrode reaction (V)
E e q , n e g Equilibrium potential, negative electrode (V)
E e q , p o s Equilibrium potential, positive electrode (V)
E 0 , n e g Reference potential, negative electrode (V)
E 0 , p o s Reference potential, positive electrode (V)
E m e m Donnan potential
E r e v Reversible voltage (V)
E c e l l Cell voltage (V)
E a c t Activation overpotential (V)
E o h m Ohmic overpotential (V)
E c o n Concentration overpotential (V)
FFaraday’s constant (96,485 C/mol)
i n e g Transfer current density (A/m2)
i 0 , n e g Exchange current density (A/m2)
i l Ionic current in the electrolyte (A/m2)
i s Electronic current in the electrode (A/m2)
KPermeability of porous electrode (m2)
KckKozeny–Carman constant
kRate constant (m/s)
NiMolar flux of species (mol/m2.s)
p Pressure (Pa)
QMass source
RMolar gas constant (8.31 J/(mol·K))
SOCState of charge
tThickness of electrode (m)
TCell temperature (K)
u m o b , i Species mobility (s·mol/kg)
u m i Velocity of ions in membrane (m/s)
v Local flow velocity vector (m/s)
Z i Valence of each species
Greek
ƞOverpotential (V)
φ s Electrode potential (V)
φ l Electrolyte potential (V)
ρ Density (Kg/m3)
σ s e f f Effective conductivity (S/cm)
μ Viscosity (m2/s)
Electrode porosity
α n e g Transfer coefficient, negative electrode
ƞ n e g Overpotential, negative electrode (V)
Subscript
iV2+, V3+, VO2+, VO2+, H+, HSO4
0Initial value
cCompressed condition
MemMembrane property
RefReference
ElecElectrode property
NegNegative electrode
PosPositive electrode

References

  1. Skyllas-Kazacos, M.; Rychcik, M.; Robins, R.G.; Fane, A.G.; Green, M.A. New All-Vanadium Redox Flow Cell. J. Electrochem. Soc. 1986, 133, 1057–1058. [Google Scholar] [CrossRef]
  2. Iwakiri, I.; Antunes, T.; Almeida, H.; Sousa, P.; Figueira, R.B. Redox Flow Batteries: Materials, Design and Prospects. Energies 2021, 14, 5643. [Google Scholar] [CrossRef]
  3. Zhang, H.; Zhang, H.; Li, X.; Zhang, J. Redox Flow Batteries; Zhang, H., Li, X., Zhang, J., Eds.; CRC Press: Boca Raton, FL, USA, 2017; Volume 2, ISBN 9781315152684. [Google Scholar]
  4. Aramendia, I.; Fernandez-Gamiz, U.; Martinez-San-Vicente, A.; Zulueta, E.; Lopez-Guede, J.M. Vanadium Redox Flow Batteries: A Review Oriented to Fluid-Dynamic Optimization. Energies 2020, 14, 176. [Google Scholar] [CrossRef]
  5. Lee, J.; Kim, J.; Park, H. Numerical Simulation of the Power-Based Efficiency in Vanadium Redox Flow Battery with Different Serpentine Channel Size. Int. J. Hydrogen Energy 2019, 44, 29483–29492. [Google Scholar] [CrossRef]
  6. Oh, K.; Won, S.; Ju, H. Numerical Study of the Effects of Carbon Felt Electrode Compression in All-Vanadium Redox Flow Batteries. Electrochim. Acta 2015, 181, 13–23. [Google Scholar] [CrossRef]
  7. Chang, T.C.; Zhang, J.P.; Fuh, Y.K. Electrical, Mechanical and Morphological Properties of Compressed Carbon Felt Electrodes in Vanadium Redox Flow Battery. J. Power Sources 2014, 245, 66–75. [Google Scholar] [CrossRef]
  8. Kumar, S.; Jayanti, S. Effect of Electrode Intrusion on Pressure Drop and Electrochemical Performance of an All-Vanadium Redox Flow Battery. J. Power Sources 2017, 360, 548–558. [Google Scholar] [CrossRef]
  9. Duan, Z.N.; Qu, Z.G.; Wang, Q.; Wang, J.J. Structural Modification of Vanadium Redox Flow Battery with High Electrochemical Corrosion Resistance. Appl. Energy 2019, 250, 1632–1640. [Google Scholar] [CrossRef]
  10. Bromberger, K.; Kaunert, J.; Smolinka, T. A Model for All-Vanadium Redox Flow Batteries: Introducing Electrode-Compression Effects on Voltage Losses and Hydraulics. Energy Technol. 2014, 2, 64–76. [Google Scholar] [CrossRef]
  11. Gundlapalli, R.; Jayanti, S. Effect of Electrode Compression and Operating Parameters on the Performance of Large Vanadium Redox Flow Battery Cells. J. Power Sources 2019, 427, 231–242. [Google Scholar] [CrossRef]
  12. Su, Z.Y.; Liu, C.T.; Chang, H.P.; Li, C.H.; Huang, K.J.; Sui, P.C. A Numerical Investigation of the Effects of Compression Force on PEM Fuel Cell Performance. J. Power Sources 2008, 183, 182–192. [Google Scholar] [CrossRef]
  13. Wang, Q.; Qu, Z.G.; Jiang, Z.Y.; Yang, W.W. Numerical Study on Vanadium Redox Flow Battery Performance with Non-Uniformly Compressed Electrode and Serpentine Flow Field. Appl. Energy 2018, 220, 106–116. [Google Scholar] [CrossRef]
  14. Park, S.K.; Shim, J.; Yang, J.H.; Jin, C.S.; Lee, B.S.; Lee, Y.S.; Shin, K.H.; Jeon, J.D. The Influence of Compressed Carbon Felt Electrodes on the Performance of a Vanadium Redox Flow Battery. Electrochim. Acta 2014, 116, 447–452. [Google Scholar] [CrossRef]
  15. You, D.; Zhang, H.; Chen, J. A Simple Model for the Vanadium Redox Battery. Electrochim. Acta 2009, 54, 6827–6836. [Google Scholar] [CrossRef]
  16. Xu, Q.; Zhao, T.S.; Leung, P.K. Numerical Investigations of Flow Field Designs for Vanadium Redox Flow Batteries. Appl. Energy 2013, 105, 47–56. [Google Scholar] [CrossRef]
  17. Yin, C.; Gao, Y.; Guo, S.; Tang, H. A Coupled Three Dimensional Model of Vanadium Redox Flow Battery for Flow Field Designs. Energy 2014, 74, 886–895. [Google Scholar] [CrossRef]
  18. Messaggi, M.; Canzi, P.; Mereu, R.; Baricci, A.; Inzoli, F.; Casalegno, A.; Zago, M. Analysis of Flow Field Design on Vanadium Redox Flow Battery Performance: Development of 3D Computational Fluid Dynamic Model and Experimental Validation. Appl. Energy 2018, 228, 1057–1070. [Google Scholar] [CrossRef]
  19. Ertugrul, T.Y.; Daugherty, M.C.; Houser, J.R.; Aaron, D.S.; Mench, M.M. Computational and Experimental Study of Convection in a Vanadium Redox Flow Battery Strip Cell Architecture. Energies 2020, 13, 4767. [Google Scholar] [CrossRef]
  20. Chang, C.-H.; Chou, H.-W.; Hsu, N.-Y.; Chen, Y.-S. Development of Integrally Molded Bipolar Plates for All-Vanadium Redox Flow Batteries. Energies 2016, 9, 350. [Google Scholar] [CrossRef]
  21. Wei, L.; Guo, Z.X.; Sun, J.; Fan, X.Z.; Wu, M.C.; Xu, J.B.; Zhao, T.S. A Convection-Enhanced Flow Field for Aqueous Redox Flow Batteries. Int. J. Heat Mass Transf. 2021, 179, 121747. [Google Scholar] [CrossRef]
  22. Pan, L.; Sun, J.; Qi, H.; Han, M.; Chen, L.; Xu, J.; Wei, L.; Zhao, T. Along-Flow-Path Gradient Flow Field Enabling Uniform Distributions of Reactants for Redox Flow Batteries. J. Power Sources 2023, 570, 233012. [Google Scholar] [CrossRef]
  23. Jyothi Latha, T.; Jayanti, S. Ex-Situ Experimental Studies on Serpentine Flow Field Design for Redox Flow Battery Systems. J. Power Sources 2014, 248, 140–146. [Google Scholar] [CrossRef]
  24. Hsieh, C.; Tsai, P.; Hsu, N.; Chen, Y. Effect of Compression Ratio of Graphite Felts on the Performance of an All-Vanadium Redox Flow Battery. Energies 2019, 12, 313. [Google Scholar] [CrossRef]
  25. Maurya, S.; Nguyen, P.T.; Kim, Y.S.; Kang, Q.; Mukundan, R. Effect of Flow Field Geometry on Operating Current Density, Capacity and Performance of Vanadium Redox Flow Battery. J. Power Sources 2018, 404, 20–27. [Google Scholar] [CrossRef]
  26. Ma, X.; Zhang, H.; Xing, F. A Three-Dimensional Model for Negative Half Cell of the Vanadium Redox Flow Battery. Electrochim. Acta 2011, 58, 238–246. [Google Scholar] [CrossRef]
Figure 1. Figure showing the schematic of the vanadium redox flow battery system and its components.
Energies 16 06311 g001
Figure 2. Schematic representation of (a) uncompressed, (b) homogeneously compressed, and (c) non-homogeneously compressed electrode.
Energies 16 06311 g002
Figure 3. Figure showing flow field geometrical configurations constructed using COMSOL Multiphysics software. (a) Conventional, (b) parallel, (c) serpentine, and (d) interdigitated.
Energies 16 06311 g003
Figure 4. Geometric models for non-homogeneously compressed electrode scenario in (a) parallel, (b) serpentine, and (c) interdigitated flow fields.
Energies 16 06311 g004
Figure 5. Figure showing mesh configurations constructed using COMSOL Multiphysics software of conventional, parallel, serpentine, and interdigitated flow fied.
Energies 16 06311 g005
Figure 6. Grid independence study using interdigitated, serpentine, parallel, and conventional flow fields.
Energies 16 06311 g006
Figure 7. Figure comparing the cell voltage vs. SOC from the experimental data taken from [5] and numerical simulation performed in this study.
Energies 16 06311 g007
Figure 8. Contour of velocity for conventional, parallel, interdigitated, and serpentine flow field at uncompressed, non-homogeneously compressed and homogeneously compressed condition applied flow rate of 40 mL.min−1.
Energies 16 06311 g008
Figure 9. Contours of pressure for conventional, parallel, interdigitated, and serpentine flow field at uncompressed, non-homogeneously compressed, and homogeneously compressed condition applied flow rate of 40 mL.min−1.
Energies 16 06311 g009
Figure 10. Velocity profiles reflecting the electrolyte flow through the crossection of electrode for (a) serpentine, (b) parallel, and (c) interdigitated flow fields at three compression cases.
Energies 16 06311 g010aEnergies 16 06311 g010b
Figure 11. Velocity profile of cross flow under the rib for non-homogeneously compressed parallel, serpentine, and interdigitated flow fields.
Energies 16 06311 g011
Figure 12. Pressure drop in (a) uncompressed, (b) non-homogeneously compressed, and (c) homogeneously compressed electrode.
Energies 16 06311 g012
Figure 13. Comparison of pump power consumption for all flow fields at (a) uncompressed condition. (b) Flow rate of 40 mL.min−1 for all flow fields and compression scenarios considered. (A) Uncompressed, (B) non-homogeneously compressed, (C) homogeneously compressed.
Energies 16 06311 g013
Figure 14. Concentration profile of negative electrode during discharge (SOC = 0.8 and current density = 60 mA.cm−2).
Energies 16 06311 g014
Figure 15. Charge–discharge curve for three different electrode compression scenarios: (a) uncompressed, (b) Non-homogeneously Compressed, (c) Homogeneously Compressed, considering four flow field configurations. (d) represents all three compression scenarios for interdigitated flow field.
Energies 16 06311 g015aEnergies 16 06311 g015bEnergies 16 06311 g015c
Figure 16. Electrolyte potential distribution for all flow fields under different compression conditions at SOC 0.8.
Energies 16 06311 g016
Figure 17. Overpotential distribution for the scenarios considered in this study at electrode current collector interface and SOC 0.8.
Energies 16 06311 g017
Figure 18. Overpotential for all flow field configurations for the uncompressed electrode with variation in SOC.
Energies 16 06311 g018
Figure 19. Current density distribution at the interface of bipolar plate and electrode at SOC 0.8 and current density 100 mA.cm−2.
Energies 16 06311 g019
Figure 20. Polarisation curve of three differently compressed conditions with serpentine flow field at SOC 0.8.
Energies 16 06311 g020
Figure 21. Power density of three differently compressed conditions with serpentine flow field at SOC 0.8.
Energies 16 06311 g021
Table 1. Table listing the flow field configurations and the associated electrode compression types considered in this study.
Compression TypeFlow Field Configuration
ConventionalSerpentineParallelInterdigitated
Uncompressed
Homogeneously compressed
Non-homogeneously compressed*
* Since this configuration doesn’t exist in real-time conditions, it is not considered in this study.
Table 2. Source terms of the governing equations.
TermPositive ElectrodeNegative Electrode
V 2 + , S V 2 + - i n e g /F
V 3 + , S V 3 + - i n e g /F
V 4 + , S V 4 + i p o s /F-
V 5 + , S V 5 + i p o s /F-
H + , S H + −2 i p o s /F-
Table 3. Table listing the electrochemical reactions at each electrode and the corresponding ionic species in the electrolyte.
ElectrodeReactionOxidation State of
Vanadium
Ionic Species in the Electrolyte
Negative V 3 + + e V 2 + (charging)(III)H+, S O 4 2 , H S O 4 , V3+, V2+
V 2 + V 3 + + e (discharging)(II)
Positive V O 2 + + H 2 O V O 2 + + 2 H + + e (charging)(IV)VO2+, H+, S O 4 2 , H S O 4 , VO2+, VO2+
V O 2 + + 2 H + + e V O 2 + (discharging)(V)
Table 4. Boundary conditions for the membrane, electrode, and current collector.
Boundary Condition DescriptionCondition
Velocity at the inlet and pressure at the outlet channel (Neumann condition) given for conservation of momentum. p . n = 0
Flux condition for the porous electrode’s potential distribution along the electrode/current collector contact surface.
Zero flux condition for all other surfaces of the electrode.
σ s e f f φ s . n = I
Flux condition for electrolyte’s potential distribution along electrode/membrane contact surface.
Insulation for other parts of the electrode.
k l φ l . n = I
The expression for concentration of reactant species at any SOC in the inflow of inlet channel of both the electrodes.
Concentration of vanadium ions at inlet are constant for given SOC.
c V 2 + = c 0     S O C
c V 3 + = c 0     ( 1 S O C )
c V O 2 2 + = c 0     S O C
c V O 2 + = c 0     ( 1 S O C )
Diffusive fluxes are set to zero at the outlet of outflow channel (fully developed flow). D i e f f C i . n = 0
There is no flux across all other boundaries of electrode and channel (set to wall condition). ( D i e f f C i + v C i ) . n = 0
Current density in the membrane and electrolyte are equal. n . i l , e = n . i l , m
From Faraday’s law, proton flux is proportional to current. n . N + , e = n . i l , m F
The relationship between the potentials and the concentrations is given by: φ l , m = φ l , e + R T F l n c i , m c i , e
Table 5. Electrode characteristics used in the simulation.
ZonePropertiesType
UncompressedNon-Homogeneously
Compressed
Homogeneously Compressed
Electrode under RibPorosity0.910.570.57
Permeability (m2)6.733 × 10−92.935 × 10−112.935 × 10⁻¹¹
Electrode under ChannelPorosity0.910.660.57
Permeability (m2)6.733 × 10−97.43 × 10−112.935 × 10⁻¹¹
Table 6. Parameter values for simulation and calculation [5].
ParametersValuesUnit
V2+ diffusion coefficient2.4 × 10−10[m2.s−1]
V3+ diffusion coefficient2.4 × 10−10[m2.s−1]
VO2+ diffusion coefficient3.9 × 10−10[m2.s−1]
H+ diffusion coefficient9.312 × 10−9[m2.s−1]
SO42− diffusion coefficient1.065 × 10−9[m2.s−1]
HSO4 diffusion coefficient1.33 × 10−9[m2.s−1]
Electrode conductivity500[S.m−1]
Electrode porosity0.91-
Electrode specific area1.62 × 104[m2.m−3]
Standard potential, positive reaction1.004[V]
Rate constant, positive reaction6.8 × 10−7[m.s−1]
Transfer coefficient, positive reaction0.55-
Standard potential, negative reaction−0.255[V]
Dynamic viscosity4.928 × 10−3[Pa.s]
Rate constant, negative reaction1.7 × 10−7 [m.s−1]
Transfer coefficient, negative reaction0.45
Dissociation constant0.25
HSO4 dissociation rate constant1 × 104 [mol.m−3 s]
Membrane proton concentration1990[mol.m−3]
Membrane conductivity10[S.m−1]
V2+ initial concentration1280[mol.m−3]
V3+ initial concentration320[mol.m−3]
VO2+ initial concentration320[mol.m−3]
VO2+ initial concentration1280[mol.m−3]
H+ initial concentration, negative electrode4000[mol.m−3]
H+ initial concentration, positive electrode4000[mol.m−3]
HSO4 initial concentration, negative electrode4500[mol.m−3]
HSO4 initial concentration, positive electrode4500[mol.m−3]
Density1354[kg.m−3]
Flow rate40 [mL.min−1]
Outlet pressure1 Atm
Average current density60 [mA.cm−2]
Cell temperature 293.15 [K]
SOC0.8-
Cell height 0.05 [m]
Cell depth 0.05[m]
Electrode thickness 0.003 [m]
Membrane thickness 0.0002[m]
Flow field thickness0.002[m]
Flow field width0.0053[m]
Table 7. Parameter values for simulation and calculation.
Compression
Condition
Flow FieldAverage Charging VoltageAverage Discharging Voltage
Uncompressed
electrode
Conventional1.40441.2857
Parallel1.39411.2956
Serpentine1.38011.3106
Interdigitated1.36471.3231
Non-homogeneously compressed electrodeParallel1.3931.3039
Serpentine1.38671.3136
Interdigitated1.37771.3224
Compressed
electrode
Conventional1.43921.2486
Parallel1.41201.2728
Serpentine1.40061.2932
Interdigitated1.39221.3019
Disclaimer/Publisher’s Note: The statements, opinions and data contained in all publications are solely those of the individual author(s) and contributor(s) and not of MDPI and/or the editor(s). MDPI and/or the editor(s) disclaim responsibility for any injury to people or property resulting from any ideas, methods, instructions or products referred to in the content.

