1. Introduction
The fourth industrial revolution has brought forth a plethora of technological advancements that are enabling and/or improving new paradigms, which seem deemed to transform the lives of individuals [
1]. Among these, the Internet of Things (IoT) [
2], artificial intelligence (AI) [
3], machine and deep learning (ML/DL) [
4], cloud computing [
5], additive manufacturing [
6], and augmented and virtual reality (AR/VR) [
7] are the most popular. These paradigms rely on several data communication solutions, which are selected according to their specific advantages to face costs, installation, and time-to-market issues. Unexpectedly, even some unusual proposals have been revitalized, such as the power line communication (PLC) technology [
8].
PLC harnesses the inherent potential of the electrical distribution network to facilitate data transmission capabilities. By exploiting the existing infrastructure of the power grid, PLC enables the communication of data signals through the electrical power lines [
9], allowing for the simultaneous transfer of electrical power and data for signaling and remote control [
10,
11].
Similarly to the transmission and distribution network, other infrastructures can be exploited as guiding structures to propagate electromagnetic signals. A relevant example is the electrical railway system, where the catenary and the railway tracks can transmit both the power needed to the traction operations as well as the data.
Actually, the growing focus on safety and maintenance of the railway network, and the increase in services offered on board, raise the demand for robust communication technologies. These should grant high data rates, low latency, and coverage and service continuity to enable high-speed internet connection for service management and entertainment [
12,
13]. Railway operators are paying attention to broadband power line communication (BPLC) technologies. These exploit the high-frequency range, namely, the HF band of the electromagnetic spectrum, and employ suitable solutions to transmit a relevant amount of data in a reduced time interval [
14]. More specifically, railway operators have fostered the concept of broadband traction power line communication (BTPLC), where the electric traction line is exploited as a channel for broadband communications rather than for simple signaling and control operations [
15].
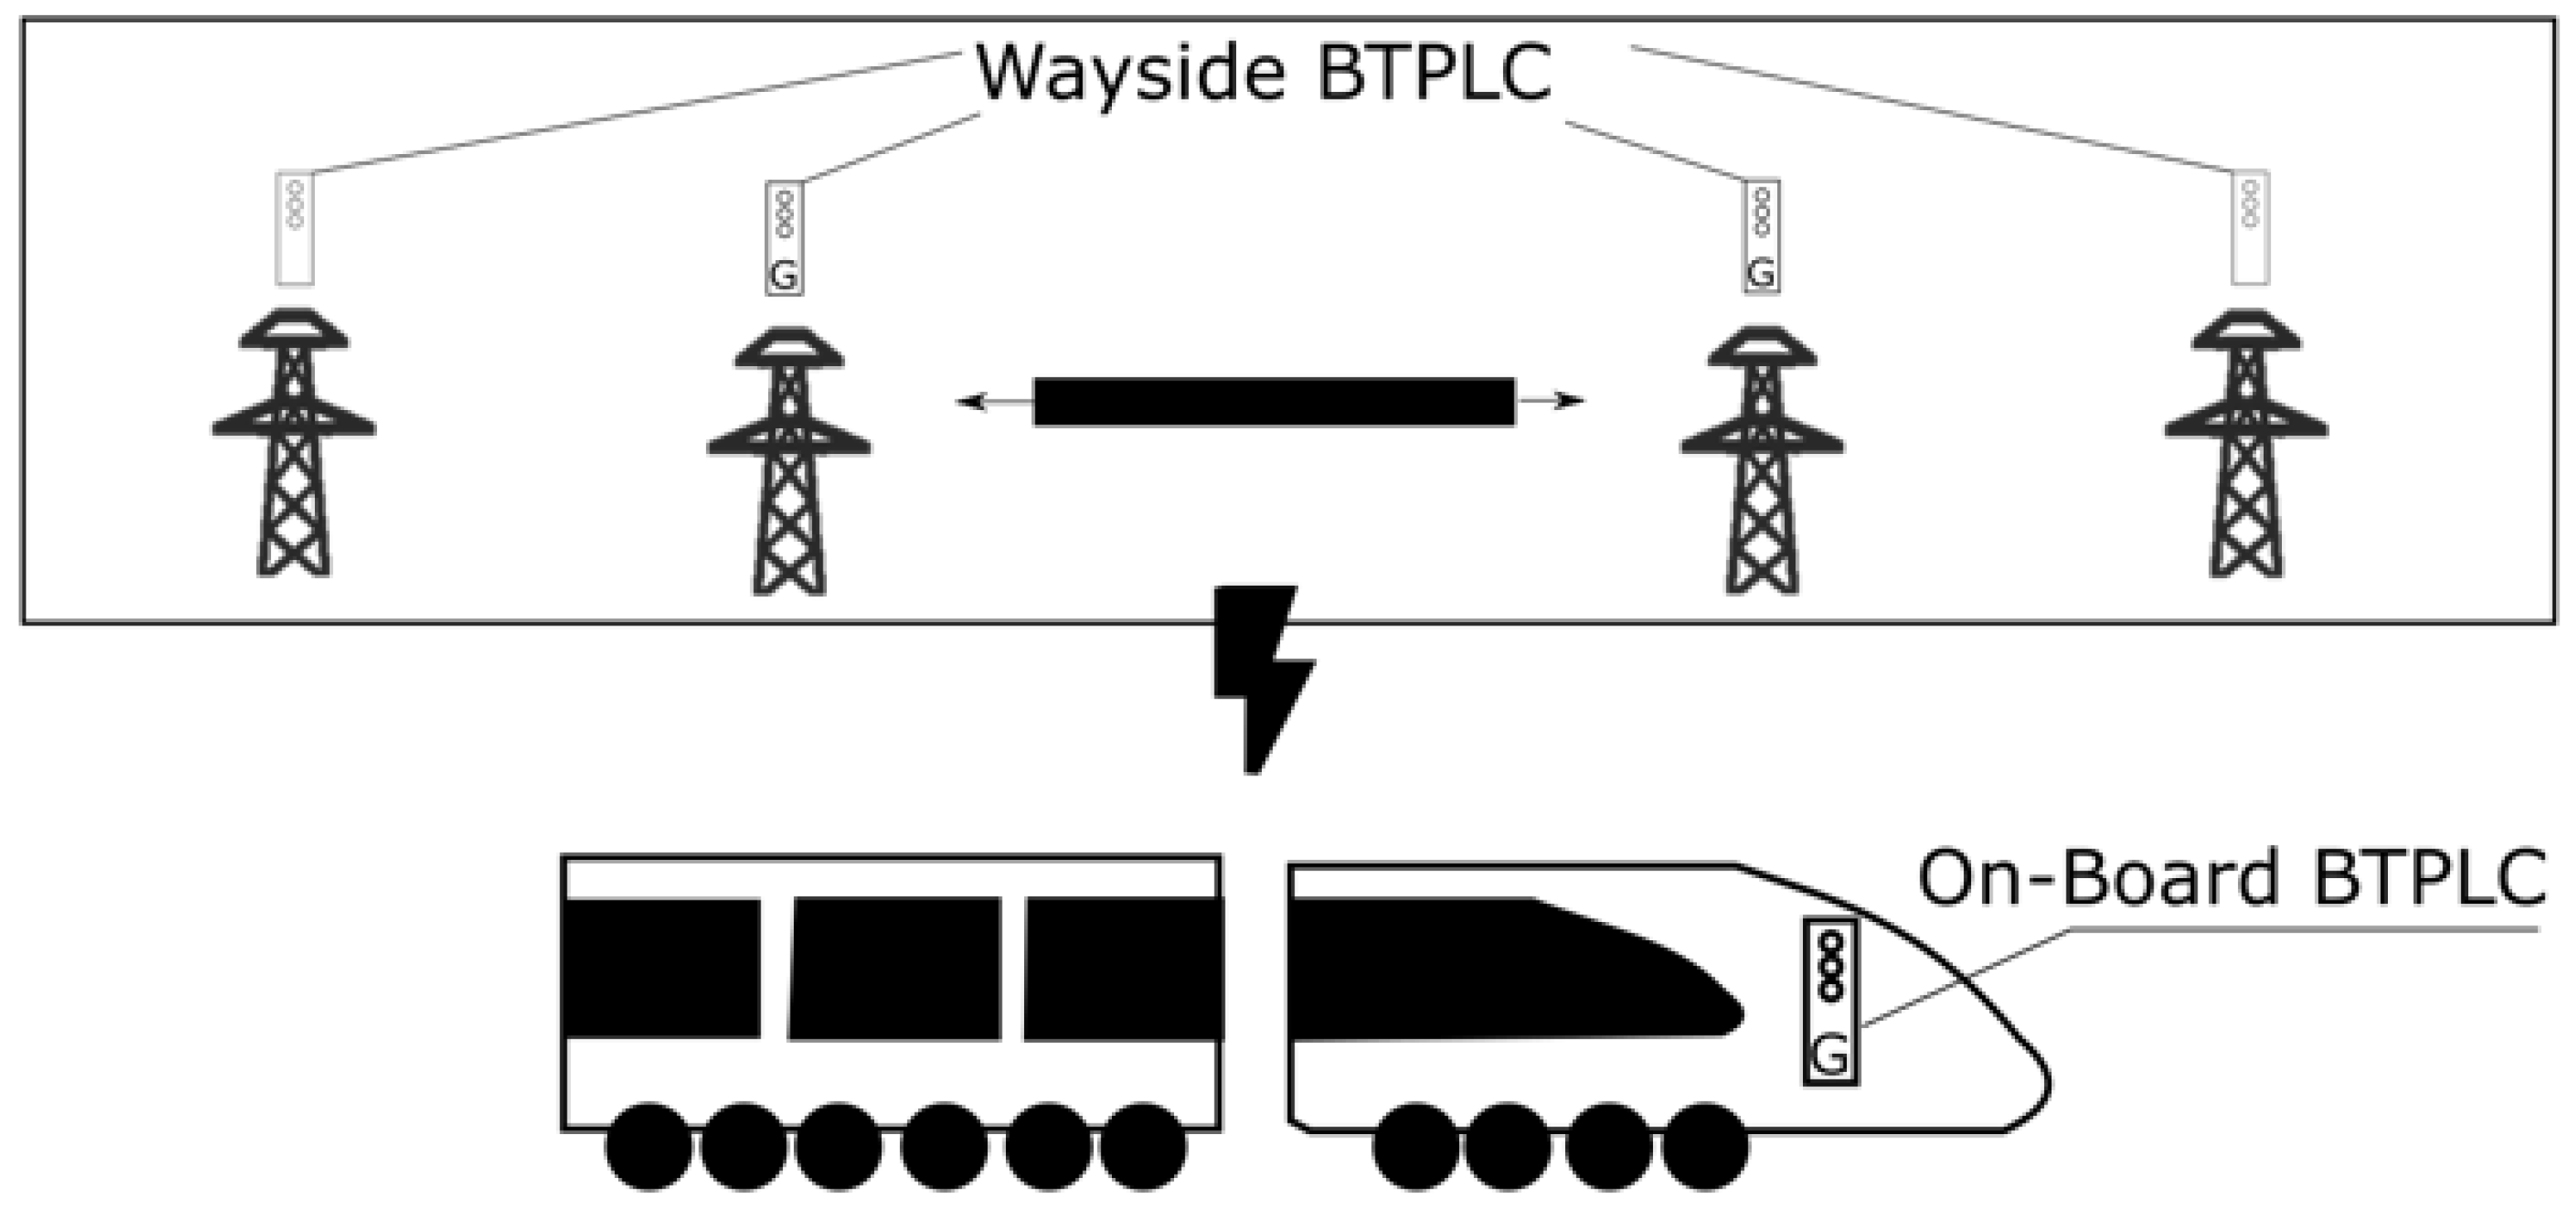
A BTPLC system is designed with the aim to establish a communication link between on-board and wayside devices, as illustrated in
Figure 1. The link has to cope with the requirements of advanced security systems, predictive maintenance, and other 4.0-driven applications [
16].
BTPLC technology should support the transmission of train-related data and other sensor-derived information. These include position, velocity, and vibration parameters, as well as environmental data in terms of weather conditions, and network-specific data, such as the number of interconnected trains. The subsequent data analysis enables the implementation of useful policies to reduce maintenance costs and operations, improve maintenance scheduling, and ensure the proper operation of the network safely [
17,
18,
19].
It is expected that BTPLC solutions will play a critical role in predictive maintenance, where artificial intelligence-based approaches are becoming widespread. These approaches necessitate of a substantial volume of data related to the condition of the railway network, the train, and its components, and hence of effective solutions for transmission and storing operations [
20].
The adoption of BPLC technology in railways is further motivated by the increasing focus on sustainable policies. Rail transport is acknowledged as a better alternative to road transport and a key element in atmospheric emission reduction strategies [
21]. Environmental policies, in fact, are driving the transition of the land transportation system from a vehicle-centered model to a rail-centered one [
22]. This shift towards the railway system is projected to yield a significant reduction in energy consumption as appealing as the substitution of the fuel engines with the electric ones in automotive [
23].
Taking all these factors into account, it becomes evident that BPLC technology is intriguing to railway operators that have to fulfill more and more advanced service delivery. But, utilizing the pre-existing network, originally designed for electrical distribution purposes, poses various technical challenges that need to be addressed when employing it for high-frequency data transmission [
24]. Unlike several networks used for low and medium-voltage power distribution, those employed in the railway sector present additional challenges. The main ones are related to the existence of different network topologies, which are difficult to characterize; to the time-varying nature of the system, which impacts the communication channel behavior; and to the numerous sources of noise and interference [
25].
Recently, researchers have pointed out the need for effective methodologies to address the design, implementation, and evaluation of broadband communication channels exploiting electric traction lines for signal propagation. In this regard, several contributions have put forth intriguing methodologies. However, to the best of the author’s knowledge, a comprehensive overview encompassing both theoretical notes and experimental protocols, to be considered at design, installation, assessment, and maintenance stages, is still absent. In an effort to address this dearth of information, the authors have produced a survey that delineates the current state of BTPLC systems, where special attention is paid to the test and measurement activities needed for installation, evaluation, and maintenance. More specifically, the survey presents the performance metrics and measurement apparatuses adopted to characterize the electric traction lines in the light of installing solutions for broadband power line communications. Its goal is to systematically analyze and evaluate the existing literature in order to provide a comprehensive understanding of the topic and guide future research efforts.
The survey has considered the papers published from 2006, which are closely related to the deployment of BPLC technologies in the railway domain. A search on the Scopus database using the keywords PLC, broadband, and railway yielded a total of 54 papers as of July 2023. From this set, nine papers were carefully selected for a comprehensive and detailed comparison. The selection criteria for these papers primarily emphasized articles published in scientific journals that clearly outlined the operation of the BTPLC system. In particular, each of the chosen papers presented an improved model or methods for characterizing the BTPLC channel.
The survey starts with an overview of the PLC fundamentals, with an emphasis on the taxonomy of the technology in
Section 2. Subsequently,
Section 3 reviews the literature highlighting the typical architectures adopted in BTPLC systems and the features and parameters of interest related to the communication channel. Then,
Section 4 explores the key findings extracted from the literature analysis, distinguishing between top-down and bottom-up approaches, and comments on them. Finally, conclusions are drawn.
3. Body of Knowledge Regarding BTPLC Systems
This section aims to survey the body of knowledge that can be extracted by the scientific literature about BTPLC systems.
3.1. BTPLC Architectures
BTPLC systems are typically composed of six major blocks, as shown in
Figure 3.
The first block comprises the power distribution system, which encompasses the traction power substations (TPSS). TPSS nodes form the foundation of the medium voltage (MV) substations, connected to the high-voltage grid. They receive high-voltage electricity from the grid, which is then converted into a suitable form for supplying power to train engines. In direct current (DC) traction systems, power substations consist of transformers and rectifiers, with the latter responsible for converting alternating current (AC) into direct current (DC) [
42].
The second block is constituted by the power line, which encompasses the catenary to convey the electric power along the line, facilitating the power supply distribution. Specifically, power is transmitted through the catenary to the train by means of one or a couple of pantographs. In the context of power line communication, the catenary also serves as the medium through which data transmission occurs.
In Europe, the components found in the first and second blocks are common across various railway infrastructures, despite the presence of different electrification systems. It is crucial to differentiate between rail network categories as they give rise to notable disparities in the selection of the devices and techniques employed at the implementation stage. As early as 1933, Garczynski [
43] observed that the United States and Europe adopted different methods of line coupling owing to differences in power line voltages and network topologies. In relation to railway lines, they are often classified into four main categories: regional, urban, inter-city, and high-speed.
Table 2 presents the main differences among these categories, taking into account the Italian framework as an example. The allocation of a limited number of services for the higher classes, or a single unitary service in the case of urban routes, reflects the current state of affairs. However, with the implementation of BPLC technology, an increase in rail services is likely even for the urban category.
The third and fifth blocks pertain to the coupler units employed for on-board and wayside BTPLC devices, respectively. In both cases, the coupler serves as a crucial device situated between the modems and the power line [
44]. Its functions include both protection against potential damage and the transmission and reception of the communication signal via the transmission line. Note that the transmitted signals must be superimposed to the waveform of the power supply, whereas the received signals must be separated from the waveform of the power supply: couplers are adopted to this end. Couplers can be classified according to voltage level, DC or AC regime, frequency band, physical connection type (capacitive, inductive, or resistive), mode of propagation (common or differential), or number of connections (single-input–single-output, single-input–multi-output, or or multi-input–multi-output) [
45]. To ensure electrical isolation between the power distribution line and the data line, couplers are typically equipped with an isolation transformer [
46]. The transformer also provides impedance matching between the two lines [
47]. Impedance mismatch, resulting from the time-frequency varying behavior of the line impedance [
48], can in fact significantly degrade transmission power [
49]. Coupling devices, acting as high-pass filters, should exhibit a fine frequency response within the PLC transmission band to reject the supply voltage [
50]. Capacitive couplers are commonly employed for power line communications [
51]. Additional protection circuits may be employed to safeguard the PLC modem against overvoltages. However, attention must be given to their impedance to prevent the creation of low-impedance paths.
The fourth block encompasses BTPLC devices (i.e., modems), which are installed on-board the train or tram. These devices are typically equipped with features like smart sensors and cameras, serving various purposes such as onboard security. On the other hand, the sixth block comprises BTPLC devices placed on the ground or along the power line, which operate as repeaters or control devices. These ground-based devices establish communication with the onboard devices, facilitating ground-vehicle communication. The on-board BTPLC devices need to be installed on every vehicle within the operational fleet. They are responsible for enabling communication within each individual vehicle. In contrast, the wayside BTPLC devices consist of multiple devices that facilitate communication between the ground-based and the on-board devices. This allows for communication between the vehicles and the ground infrastructure. Both the on-board and ground-based devices must support an ethernet interface to access IP-based networks. The onboard devices are integrated into the onboard local area network (LAN), while the ground-based devices are integrated into the ground or distribution networks.
To simplify the description of the architecture, the remote control equipment, including alarm control and management stations for managing network switches, has been excluded from the representation. Also, the bidirectionality shared by all the blocks (except the first) has not been explicitly depicted. It is important to note that in a two-way communication setup, the onboard devices receive data transmitted by other onboard BTPLC devices on different vehicles within the fleet, as well as by wayside BTPLC devices.
In BTPLC systems, one can distinguish between (i) train-to-infrastructure, (ii) train-to-train, and (iii) infrastructure-to-infrastructure communication links. For all the three links, the communication can be bidirectional, but the performance requirements can vary depending on the type of communication and the specific application. Furthermore, the choice of the most suitable BPLC apparatuses for specific applications depends on the transmission channel of the network where the BPLC technology is deployed. Characterizing the channel is therefore essential in order to design the PLC system, facilitate its deployment, and ensure optimal performance [
52]. According to the existing literature, the characterization of the communication channel is typically conducted by focusing on the major aspects indicated in
Figure 4, which are described in detail in the following subsections.
3.2. BTPLC Features
The typical BTPLC features, regarding grid topology, noise and emissions, and frequency selectivity are listed as follows.
3.2.1. Grid Topology
The first feature of interest is the power grid topology, which refers to the arrangement and configuration of the electrical power distribution network. It plays a crucial role in determining how PLC operates and performs in a given area. The grid structure differs from country to country and even within countries, making the standardization of the PLC transmission channel complex. Additionally, the multipath nature of the grid is another crucial aspect as the signal can be split between useful and parasitic paths and can undergo abrupt power reductions. [
53]. Moreover, short-time changes in the grid structure encompass alterations in the properties of the propagating medium, resulting from load insertion and detachment. This phenomenon is caused by reflections of the transmitted signal along the transmission line. This phenomenon is also contingent upon the interplay between the wavelengths of the data signal and the physical length of the line, as well as the impedance mismatch between the line and the connected devices.
Since BTPLC systems fall under the outdoor PLC category, the transmission channel is subject to phenomena that complicate its characterization compared to indoor channels [
54]. Among them, there are the state of the train, taking into account factors such as its speed and acceleration, and the impact of weather conditions on the traction line.
The lack of changes in grid topology, a condition deemed realistic for short durations and controlled circumstances, does not ensure the time-invariance of the transmission channel. This is because the characteristics of the devices connected to the grid are contingent upon the instantaneous amplitude of the supply voltage, which can fluctuate due to periodic variations in the load impedance. Then, the time-varying channel can be considered cyclostationary, subject to short-term cyclic variations [
55].
Regarding the state of the art, there have been few measurement campaigns conducted to represent time-varying effects accurately. The scarcity of information regarding the characterization of the transmission channel for outdoor grids is primarily attributed to the costs associated with conducting experimental activities for BPLC systems of this nature. These costs stem from the requirement for a specialized electrical team and its mobilization, the need for a variety of instruments, and auxiliary devices to grant operation safety. Nonetheless, a measurement campaign requires the complete control of the railway path and rolling stocks, which during the most of the experimental activities are set temporarily unavailable to the public [
56].
3.2.2. Noise and Emissions
Noise and emissions can be considered challenges of BTPLC as they have a significant impact on the performance and regulatory compliance of PLC systems. BPLC systems are subject to regulations that prescribe permissible limits for electromagnetic radiation [
57], in order to address the adverse impacts they have on PLC communication. Noise and non-intentional emissions (NIE) in BPLC systems [
58,
59] are primarily attributed to the utilization of the power-line communication (PLC) grid as a high-frequency data transmission channel [
60]. In the far field, the emissions undergo mutual cancellation owing to the inherent symmetry present in the system [
61]; this symmetry generally stands because of the power balance maintained across each phase of the transmission power system (TPS). But, this balance can occasionally be disrupted for uneven power consumption among locomotives connected to each catenary [
62,
63], or unpredictable meteorological events. This is an issue for the railway system as well, which is contrasted by means of rail power conditioners (RPCs) [
64] or power electronics converter [
65], which help in restoring the equilibrium and mitigating any associated problems.
The noise from which devices and more generally the BTPLC environment are affected is a function of different parameters that define its origin, amplitude, and representation. NIEs are composed of different contributions [
66,
67,
68,
69], which are enlisted in
Table 3:
The levels of noise and NIEs are known for the frequency interval (2–150) kHz, while they, as well as the disturbance they may cause in communication systems, are not known for operating frequencies above 1 MHz. Also, for conductive and radiated emissions, there is a lack of standards in outdoor applications [
70,
71].
To enhance the robustness of communication and mitigate the detrimental effects of NIEs and noise on data transmission quality, coding and modulation techniques are commonly employed. Among these techniques, orthogonal frequency division multiplexing (OFDM) is widely recognized and extensively studied in the literature. It is a modulation scheme that partitions the transmitted data into blocks and transfers them simultaneously over parallel independent sub-carriers [
72]. Since OFDM simultaneously transmits symbols on each sub-carrier, the effects of impulsive noise are spread out over multiple symbols [
72] so that the overall data are not affected by the noise [
73].
3.2.3. Frequency Selectivity
The channel frequency selectivity plays a critical role in determining both the amplitude distortion and delay. The frequency response of the PLC channel, typically expressed in the frequency domain by
, can exhibit notable variations in channel characteristics. In recent years, the frequency response has also been suggested as a means to estimate the impedance [
74]. In the context of linear time-invariant systems, the frequency response
is defined as the ratio of the output voltage to the input voltage of the channel.
3.3. BTPLC Parameters
The typical BTPLC parameters, regarding signal attenuation, line impedance, and frequency response, are listed as follows.
3.3.1. Signal Attenuation
One of the primary challenges for PLC systems is facing signal attenuation along the channel. Signal attenuation refers to the decrease in power level between the signal generated by the transmitting device and the signal received by the receiving device. This attenuation is primarily caused by energy absorption in the transmitting medium, signal reflections resulting from impedance mismatches, dispersion along the line into other devices, and the branching of the guiding structure into different paths [
75]. The loss in transmission, denoted as
, can be expressed in dB as shown in Equation (
1), where
represents the signal power received at the receiving device and
represents the signal power transmitted by the transmitting device.
Several factors contribute to the attenuation of the signal in addition to the topology. These factors include: the type of cables, ancillary devices acting as loads, including couplers, the frequency range chosen for the modulated data, the line length in different sections, and the overall line length [
76]. As expected, signal attenuation is directly proportional to both distance and frequency [
77]. Tonello et al. [
78] demonstrated that attenuation significantly increases with higher frequencies, reaching values exceeding 50 dB/km for frequencies greater than 1 MHz. These substantial power losses cannot be compensated for by increasing the transmitted signal power. In fact, electromagnetic compatibility issues put restrictions on the transmitted signal power; nonetheless, there are physical limitations of the devices in the network that put an inherent limit to the output power. The skin effect, as described by [
79], also results in signal attenuation along the PLC line, which increases upon the square root of the frequency. The outdoor PLC environment exhibits higher attenuation and less variation than the indoor environment. Moreover, Kiedrowski et al. [
80] found that the primary contributor to attenuation is the mismatch between the modem and the line, rather than the cable length. This mismatch is due to the difference between the values of the impedance of the modem and input impedance
, i.e., the impedance seen by the transmitter. It is related to the line impedance value
, which is defined as the load seen by the transmitter. Since it is related to the amount of reflected power, its value directly impacts the design of the analog front-end component of the PLC modem.
3.3.2. Input Impedance
The input impedance can be obtained as [
81]:
where
is the line impedance and
the reflection coefficient of the input port. The coefficient
is one of the four scattering parameters
(
), generally used to describe the behavior of a system or device or verify the impedance matching quality. These parameters are arranged into a scattering matrix, which describes the correlation between the incident and reflected power at the input and output ports. Apart from the reflection coefficient of the input port
, the other parameters are the reflection coefficient of the output port
, the forward gain
, and the reverse gain
. In general, the line impedance is characterized by both time and frequency variations [
82]. In addition, due to resonant effects, impedance values can greatly vary even within a narrow frequency range [
83]. These effects are responsible for impedance mismatches. Due to this, real-time impedance estimation can be used to improve the impedance matching with the line. Despite this variation over time and frequency, with lower values for low frequencies and higher values for higher frequencies, it is assumed that the frequency-dependent variation is smaller in broadband systems [
84]. This simplifies the choice of impedance-matching techniques for BTPLC technologies, which are made necessary to avoid reflection phenomena.
3.3.3. Frequency Response
Further metrics of interest, derived from the frequency response, are explained in [
85,
86,
87,
88,
89,
90,
91] and briefly summarized in
Table 4.
3.4. Btplc Models
Several approaches are commonly employed in order to model the transfer function and capture its cyclical variations over short periods of time, both in the time and frequency domains. The time domain approaches are typically associated with statistical tools, like the top-down models, which involve averaging various measurements. On the other hand, frequency domain methods are linked to deterministic tools, like the bottom-up approaches. Moreover, building upon these two approaches, hybrid methods have also been employed in the literature [
92,
93].
Bottom-up models provide a more accurate representation of the physical propagation of PLC signals within a specific network, whereas top-down models offer the advantage of lower complexity. Deterministic bottom-up approaches allow for an a-priori estimation of the PLC network transfer function, reducing the need for extensive measurement activities for verification purposes. Instead, statistical top-down approaches express the transfer function in terms of multiple paths, obtained through measurement campaigns, and do not require knowledge of the network.
In the railway industry, the complexity of the network, its dynamic variations over time, and the high costs associated with conducting experimental campaigns put challenges for (i) incorporating different network paths into top-down models and (ii) acquiring detailed knowledge of the grid topology for bottom-up models.
The main characteristics of top-down, bottom-up, and hybrid models are deepened in the following paragraphs.
3.4.1. Top-down Models
Top-down models represent the first models developed for characterizing the PLC channel, taking into account the significant effects caused by network branches. These effects include the multipath nature of the line resulting from discontinuities and/or impedance mismatches. Statistical models are constructed by analyzing the outcomes of experimental campaigns or by statistically describing the topology of the grid. In recent years, measurement campaigns have been carried out in broadband outdoor networks [
94].
One of the first top-down multipath propagation models was proposed by Zimmermann et al. [
53], who proposed the transfer function model described by (
3):
in which, for the
line segment on
N, the term
encapsulates the transmission and reflection factors along the line;
describes the attenuation, with
,
, and
k constant parameters that depend on the characteristics of the line section under consideration; and, finally,
describes the delay in signal transmission. The model described by (
3) has been extended by Tonello et al. in [
95] as:
where a constant coefficient
A is added for the corrections of attenuation, and the term
is approximated as a real-valued coefficient with an explicit frequency dependence through the constants
, which is constant and equal for all paths;
and
depend on the path and are modeled as random variables.
In [
91], channel measurements in the time domain were made by using a signal generator, connected to the transmitting port, and a digital oscilloscope, connected to the receiving port to acquire the signal applied by the generator to the line.
Overall, top-down models, as shown in (
3), do not necessitate prior knowledge of the PLC grid topology, which can be challenging to obtain. However, they are unable to explicitly incorporate phenomena such as resonance caused by parasitic capacitances or cable characteristics present in the network. Although these models allow for the inclusion of attenuation and delay parameters, determining these parameters can be complex and expensive. This is because one has to consider the possible network configurations, which can undergo significant changes with the addition or modification of even a single network path. In real-world PLC network studies, there is typically limited knowledge regarding the various potential paths within the network.
3.4.2. Bottom-up Models
Bottom-up models rely on deterministic models that necessitate comprehensive knowledge of the grid topology and cable patterns. They make use of transmission line theory to derive models that accurately depict signal propagation along the power line.
The first bottom-up models for BPLC networks were defined by Barnes et al. in [
96], Mang et al. in [
97], and Galli et al. in [
98]. The simplest way to model the frequency response of the channel, according to such deterministic models, is through amplitude and phase voltages that follow a log-normal distribution and a uniform distribution, respectively [
99]. Considering these signals, the PLC channel can then be modeled using the ratio of the voltage measured at the receiving port
to the voltage
measured at the input port of a branch, and considering the product of this ratio for each branch, appropriately multiplied by a coefficient
describing the factor of change in signal attenuation due to the cables. The transfer function varies for each network as a function of topology, cable length, number of branches, and the probability that each branch is connected to the network. The channel transfer function defined by Tonello et al. in [
100,
101] is:
These bottom-up approaches for modeling the PLC channel are discussed in the literature for both indoor [
102] and outdoor applications [
103]. They involve an approximation of the PLC grid segments by considering the PLC channel as a loaded transmission line using a relationship between input and output voltages and currents to the grid. This approximation can be made via the transmission matrix
T, as shown in (
6), where subscript 1 denotes the input parameters and subscript 2 denotes the receiving parameters.
This characterization allows one to obtain the transfer function as in (
7), where
and
are the network input impedance and load impedance, respectively.
The coefficients of the transmission line can be evaluated as follows:
where the parameters
l,
, and
are the length, propagation constant, and characteristic impedance of the cable, respectively. With regards to more complex transmission lines, the transfer function can be evaluated by (
6) but using different
parameters. As an example, Esmalian et al. studied, in [
104], the transfer function of a transmission line with one bridge tap. Overall, the transfer function of a generic PLC system, composed of different
n branches, can be computed by evaluating the
n transmission matrices
for
and then the overall transmission matrix as
[
105]. A graphical description of the transmission line represented as a 2-port network is provided in
Figure 5.
In addition to the aforementioned approaches, there are other state-of-the-art methods proposed for modeling outdoor PLC networks, like scattering parameters matrix-based approaches [
106]. For a given line, the outgoing
and incoming waves vectors
are linked through the scattering parameters matrix
according to (
9). For the sake of simplicity, the frequency dependency of all the variables involved in (
9) has not been reported explicitly.
The scattering matrix can be obtained by direct measurements or by a numerical model of the two port-device. Issa et al. [
107] used the numerical model and the scattering matrix to develop a simulator, later validated by experimental data acquired by measurements that were carried out on outdoor LV PLC networks in Swiss and French. They found that the simulated results are in reasonable agreement with the experimental results but with a discrepancy due to impedance mismatch and radiation losses. The main advantage of this model is in the independence of the matrix from the load change: when the load changes, matrices do not have to be re-evaluated. In some cases, instead of the scattering matrix
, the scattering transfer matrix
, which is obtained by
, is used. It allows for the calculation of the scattering transfer matrix of the overall PLC system, obtained as a product of the individual matrices
of each branch.
Bottom-up models have computational complexity independent of grid topology as they aggregate the effects of discontinuities and multipath into synthetic parameters. However, the major disadvantage of these models is that the grid topology and the type of cables and their parameters need to be accurately known in order to obtain a model as reported in (
7).
3.4.3. Hybrid Models
To overcome the limitations and leverage the advantages of both top-down and bottom-up models, different proposals combine them into hybrid models. This hybrid approach utilizes a set of representative topologies that are common in most PLC grids to derive a transfer function. Esmailian et al. [
104] made one of the initial attempts to define a model for generating PLC network topologies. They employed a statistical representation of the topology within the bottom-up model, incorporating constraints on the number of branches, distances between nodes, and other characteristic parameters of the network. This model was later extended to account for the cyclostationary nature of the channel [
108] and characterized for the European region [
109]. Barmada et al. [
52] proposed the use of the scattering transfer parameters matrix to obtain an equivalent matrix through the cascade connection of multiple circuits. By multiplying the respective matrices, this method allows for the estimation of the uncertainty of the parameters of each sub-circuit through a variational approach. Consequently, the bounds of the response, influenced by the parameters uncertainty, can be determined through a Monte Carlo procedure involving multiple simulations with random variations of the loads. This method combines aspects of both the top-down and bottom-up approaches as it can be used whether the topology is known or unknown, but it requires measurements of the scattering parameters.
For the sake of comprehensiveness,
Table 5 summarizes the three mentioned modeling approaches.
4. Literature Analysis and Discussion
Based on the literature from which the body of knowledge given in the previous Section has been extracted, the key contributions and advancements in the specific field of BTPLC are discussed here.
The specific time frame considered for this review was from 2006 onward, while the inclusion criteria for the considered papers centered primarily around articles written in English and published in scientific journals that provided a clear indication of the essential functional components of BTPLC. This methodology allowed for the selection of nine papers that put forth improved models or methods to characterize the BTPLC channel. Furthermore, the architectures shown in these papers align with the functional blocks defined in
Figure 3.
With regard to the frequency response characterization of the PLC line, 6 studies out of 9 employed bottom-up approaches, as shown in
Table 6; the remaining three studies employed top-down approaches. To the knowledge of the authors, no relevant study had adopted hybrid approaches as of July 2023.
The frequency interval most used in all the considered works is included in the frequency range suggested by the standard HomePlug AV (1.8–30.0 MHz). In addition, 6 works out of 9 (reported in
Table 6) expanded their study also in the narrowband and ultra-narrowband ranges.
Only in [
114] was a frequency range up to 100 MHz considered: this may be due to the intent of the study of analyzing the channel capacity, expressed in bits/s, over frequency and showing its trend tending to zero, approximately at 100 MHz.
4.1. Top-down Approaches
According to the top-down approaches, Tang et al., in [
110], established an electrical railway model made up of a locomotive model on a railroad, and a BPLC system. The model was developed on the track-powered module by using graphite brushes with springs to simulate the pantograph. Communication, in the frequency range of 4.5–21.0 MHz, was provided between two laptops on the PLC channel. One laptop was placed on the locomotive as a mobile device and the other one on the ground as a network service. Laptops were endowed with adapters. Different scenarios in which the communication between the laptop was once from the train to the ground, and then vice-versa for different speeds of the locomotive in the range 25–70 cm/s, were investigated. The success rate of the transmission was independent of the locomotive speed. Also, there was no significant difference between the different flows of communication, from ground to train and vice versa. However, the short speed interval was considered insufficient to generalize the results to a real environment.
For this reason, in [
113] the previous railway model was updated with different graphite brushes, motors, and structures of the system in order to guarantee the simulation of a high-speed train, with a speed up to 209 km/h, for a BTPLC system in 4.3–20.9 MHz. There was a discrepancy between the two scenarios of communication flow (from ground to train and vice versa), with a significant difference in success rate, which was better in the scenario from ground to train. However, in both scenarios, the success data rate decreased over train speed, and the highest data rate was equal to 14 Mbps.
Belhassen et al. [
25] developed a top-down approach in order to investigate the use of the BTPLC in a tramway train-to-infrastructure context with the aim of developing a BTPLC-based Closed Circuit TV (CCTV), working in the frequency range 4.0–34.0 MHz. The authors carried out the experimental campaigns within a public transport network in Lyon (France), an LV-DC distribution system, on a 15-km line. The developed infrastructure consisted of one onboard PLC system, a static PLC system, and different modems with one or two capacitive couplers on the PLC network, spaced at 350 m each other. The EMC measurements showed no EMC interference between the PLC and railway signals as these signals operate on separate frequency bands without overlapping, while the NIEs showed a higher average value for running trams than for stationary trams, with −40 dB (1 mW) level for frequencies less than 24.0 MHz, and a peak at 13.6 MHz. The line impedance measurements showed a strong variation of the input impedance of the line seen from the coupler to which the PLC modems were connected. According to the signal-to-noise ratio (SNR) measurements, the average value of SNR increases over the frequency, with a downward peak at 22.0 MHz due to the EMC values. Therefore, the operative band was selected in the range 10.0–20.0 MHz. Due to the unstable link between transmitter and receiver with the movement of the tram, the authors created an adaptive system with an extra on-board PLC modem, a switch, and a device for the available link research. In this way, the system managed to automatically detect the PLC modems around the tramway and could compare the bit rate of the available links in order to establish the most stable and fast link. With such a system, the channel capacity increased to 80 Mb/s with a typical latency up to 62 ms.
4.2. Bottom-up Approaches
Barmada et al., in [
111], explored the possibility of using single and 16-conductor cables as a BTPLC channel; specifically, the considered cable were UIC onboard cables [
116]. They used the two-port model in order to model the frequency transfer function of the line composed by a series of two 20-m lines, the last closed on a 50
resistance, and the relative FEM model in order to obtain the per-unit-length parameters of the UIC cable. Then, they used the time-domain Wavelet expansion [
117] for obtaining the simulation of the frequency response in the range (0–30) MHz by means of the evaluation of the impulse response. The simulations indicated similar responses for the two cables and thus the possibility to use them in an equivalent manner. In addition, they observed an increasing attenuation over frequency in the range of interest. The work was further extended in [
112] by comparing the previous simulated per-unit-length parameters of the UIC cables with those obtained by measurements carried out on a 6-m UIC cable provided by Trenitalia S.p.A.. The study again considered the frequency range (0–30) MHz and showed a relative error below 10%. In addition, a series of six 20-m cables with connections of 5 m between them, all terminating with an open circuit, as in [
111], or with a 50
resistance was simulated. Both cases showed a high-quality channel for BTPLC in the range (2–30) MHz, without a significant influence of the 50
resistance as end load. The cross-talk was evaluated by considering the effects of the data signal in a conductor on the others of the same cable: according to the obtained results, the cross-talk showed negligible effects.
Instead, in [
115], the frequency response was simulated for a different number of cables, from one to seven, in the frequency range (2–30) MHz, by observing an increasing attenuation over distance and frequency. By considering a maximum attenuation of −30 dB for practical uses, the need for a repeater every 75 m was highlighted. By evaluating the channel capacity (see
Table 4) using trapezoidal interpolation and considering the channel affected by additive white Gaussian noise, a channel capacity value of 80 Mbit/s for a 20 dB SNR was obtained. As is well known, shorter distances are more adequate for high-speed transmissions in the considered frequency range.
The same research group, in [
77], evaluated the delay spread, the cumulative distribution function of the frequency response attenuations, and the bit error rate over distance. Transmission power of 55 dBm/Hz over the entire frequency band was considered as it is typical for PLC devices, and a capacity of 1.6 Mbit/s was obtained. Values of RMS-DS (see
Table 4—RMS), which ranged from 52.1 ns for 25 m lines to 411 ns for 175 m lines, in accordance with the literature, were reported [
88]. The bit error rate increases over the distance and decreases over the SNR, ranging from 0% for a transmission with 60-dB SNR on a 25 m line to 0.4% for a transmission with 25 dB on a 175 m line.
Francis et al., in [
114], used the bottom-up approach with the two-port model in order to model the overhead power line referring to the Indian railways, which uses single-phase double lines in copper or aluminum. These operate with a 50 Hz supply power, provided by substations distant from each other about 32–64 km, which is collected by pantographs and converted to DC. In order to obtain the channel frequency response as in (
7), they evaluated the transmission matrix as in (
6) for a 100 m line composed of two cables from 0.125 to 0.750 m apart, with per-unit-length parameters ranging in different intervals for copper and aluminum, according to power cable standards. With simulations in the frequency range (0–10) MHz, attenuation at high frequencies, gain increments upon diameters, and channel capacity increments at low frequencies with a maximum of 10 Mbps at approximately 1.5 MHz are shown. Finally, the capacity decreased over distance for all frequencies in the range of interest.
Gheth et al., in [
15], proposed a simplified system of the overhead power line for the two-port network model in order to represent its frequency response. The simulation considered the length variation of the transmission line according to the train movement. The length of the line, a characteristic of the
matrix (
6), is updated in the simulation according to the train speed and acceleration in a time period, according to the law of uniformly accelerated motion. For a 25 km railway section, the frequency response is evaluated as in (
7) within the frequency range (1–30) MHz for different train speeds. It is shown that the amplitude of
decreased over line length and frequency with attenuation increasing over train speed, traveling time, and frequency. For a small distance, i.e., when the train is close to the substation, the attenuation variation over frequency was negligible.
4.3. Overall Considerations
In summary, the selected works primarily investigated the relationship between frequency response, attenuation, and their dependence on frequency and distance. Each work aimed to assess how these factors can influence the performance of the system. Each scenario examined in the works was unique; consequently, the achieved channel capacity varied, ranging from 1.6 Mbps up to 80 Mbps.


