Article

Toward a “Smart-Green” Future in Cities: System Dynamics Study of Megacities in China

1
School of Urban Economy and Public Administration, Capital University of Economics and Business, No. 21 Zhangjialukou, Fengtai District, Beijing 100070, China
2
Asset Management Office, University of Science and Technology Beijing, No. 30, Xueyuan Road, Haidian District, Beijing 100083, China
*
Author to whom correspondence should be addressed.
Energies 2023, 16(17), 6395; https://doi.org/10.3390/en16176395
Submission received: 28 July 2023 / Revised: 22 August 2023 / Accepted: 31 August 2023 / Published: 4 September 2023
(This article belongs to the Special Issue Economic Analysis and Policies in the Energy Sector)

Abstract

:
This study investigates the development trend of smart-green cities, focusing on seven megacities in China. It addresses three issues that are common in urban green development, including the relationship between “smart” and “green”, the scenario analysis of green development, and the uniqueness of megacities in green development. System dynamics modeling is applied. The simulation results reveal an “S”-shaped development curve for both aspects, indicating a gradual and accelerating growth pattern. Notably, the curve representing energy consumption lags behind the curve for smart city development by approximately three years. After 2030, when the smart city construction is expected to be completed, the proportion of the tertiary industry and investment in science and technology will play a significant role in limiting energy consumption. This study concludes by providing policy suggestions, including the need for long-term plans with phased targets, considering the specificity of megacities, and addressing external influences.

1. Introduction

Assuming its role as a responsible global leader, China unveiled the “Dual Carbon” objective during the United Nations Climate Conference in September 2020. This objective signifies a commitment to reach a peak in carbon emissions by 2030 and achieve carbon neutrality by 2060. This initiative not only represents a solemn pledge to the international community but also holds a fundamental place within our economic and social development framework.
Currently, the global urbanization rate stands at 56% (data source: UN-Habitat, World Cities Report 2022: Envisaging the Future of Cities), with urban areas responsible for approximately 75% of total CO2 emissions. In China, this percentage is even higher, reaching a staggering 80%. That is to say, cities are playing a critical role in achieving the “dual carbon” objective in China. The primary contributor to carbon emissions in cities is the consumption of fossil fuels in industry, transportation, and citizens’ daily lives. To control the carbon emissions in urban areas, the concept of green cities has emerged.
The notion of green city development centers around striking a balance between ecological preservation, nature conservation, and human well-being and cultural enrichment [1]. China has the highest urbanization rate in the world. So, it is important to integrate the green development concept into the process. To achieve the goal of green development in Chinese urban areas, there are several key approaches to consider, like adopting a forward-thinking urban planning approach, optimizing the structure of energy supply and consumption, and promoting the green transformation of urban construction.
With the development of technology, the potential of informative innovation has drawn more and more attention to driving the green development of cities [2,3,4]. The convergence of technological advancements and urban environments has given rise to the concept of Smart Cities [5]. Smart cities represent the forefront of digital economy applications within urban spaces, offering an effective avenue for vertical and horizontal connectivity and serving as a catalyst for high-quality urban development. They have emerged as a powerful tool for emission control and the promotion of green development.
This study places particular emphasis on the impact of smart cities on urban green development. The concept of the smart city is dissected into four key dimensions: smart governance, smart living, smart economics, and smart labor. This study aims to address these four issues. Firstly, it seeks to ascertain the developmental trend of urban green development. Secondly, it aims to establish the correlation between a “smart city” and a “green city.” Thirdly, it aims to explore how the trend of urban green development varies across diverse scenarios. Lastly, it tries to figure out the uniqueness of megacities’ green development. To find the answers, a system dynamics model is constructed.
This paper’s structure is organized as follows: Chapter One serves as the introduction, providing an overview of the study’s objectives and context. Chapter Two offers a comprehensive review of the relevant literature, encompassing key studies and theories in the field. Chapter Three delves into the data sources and methodology employed in the research, outlining the approach taken for data collection and analysis. Chapter Four presents a detailed discussion of the simulation results, analyzing the findings and drawing insights from different scenarios. Finally, Chapter Five concludes the study, summarizing the key findings and presenting policy recommendations for enhancing urban green development.

2. Literature Review

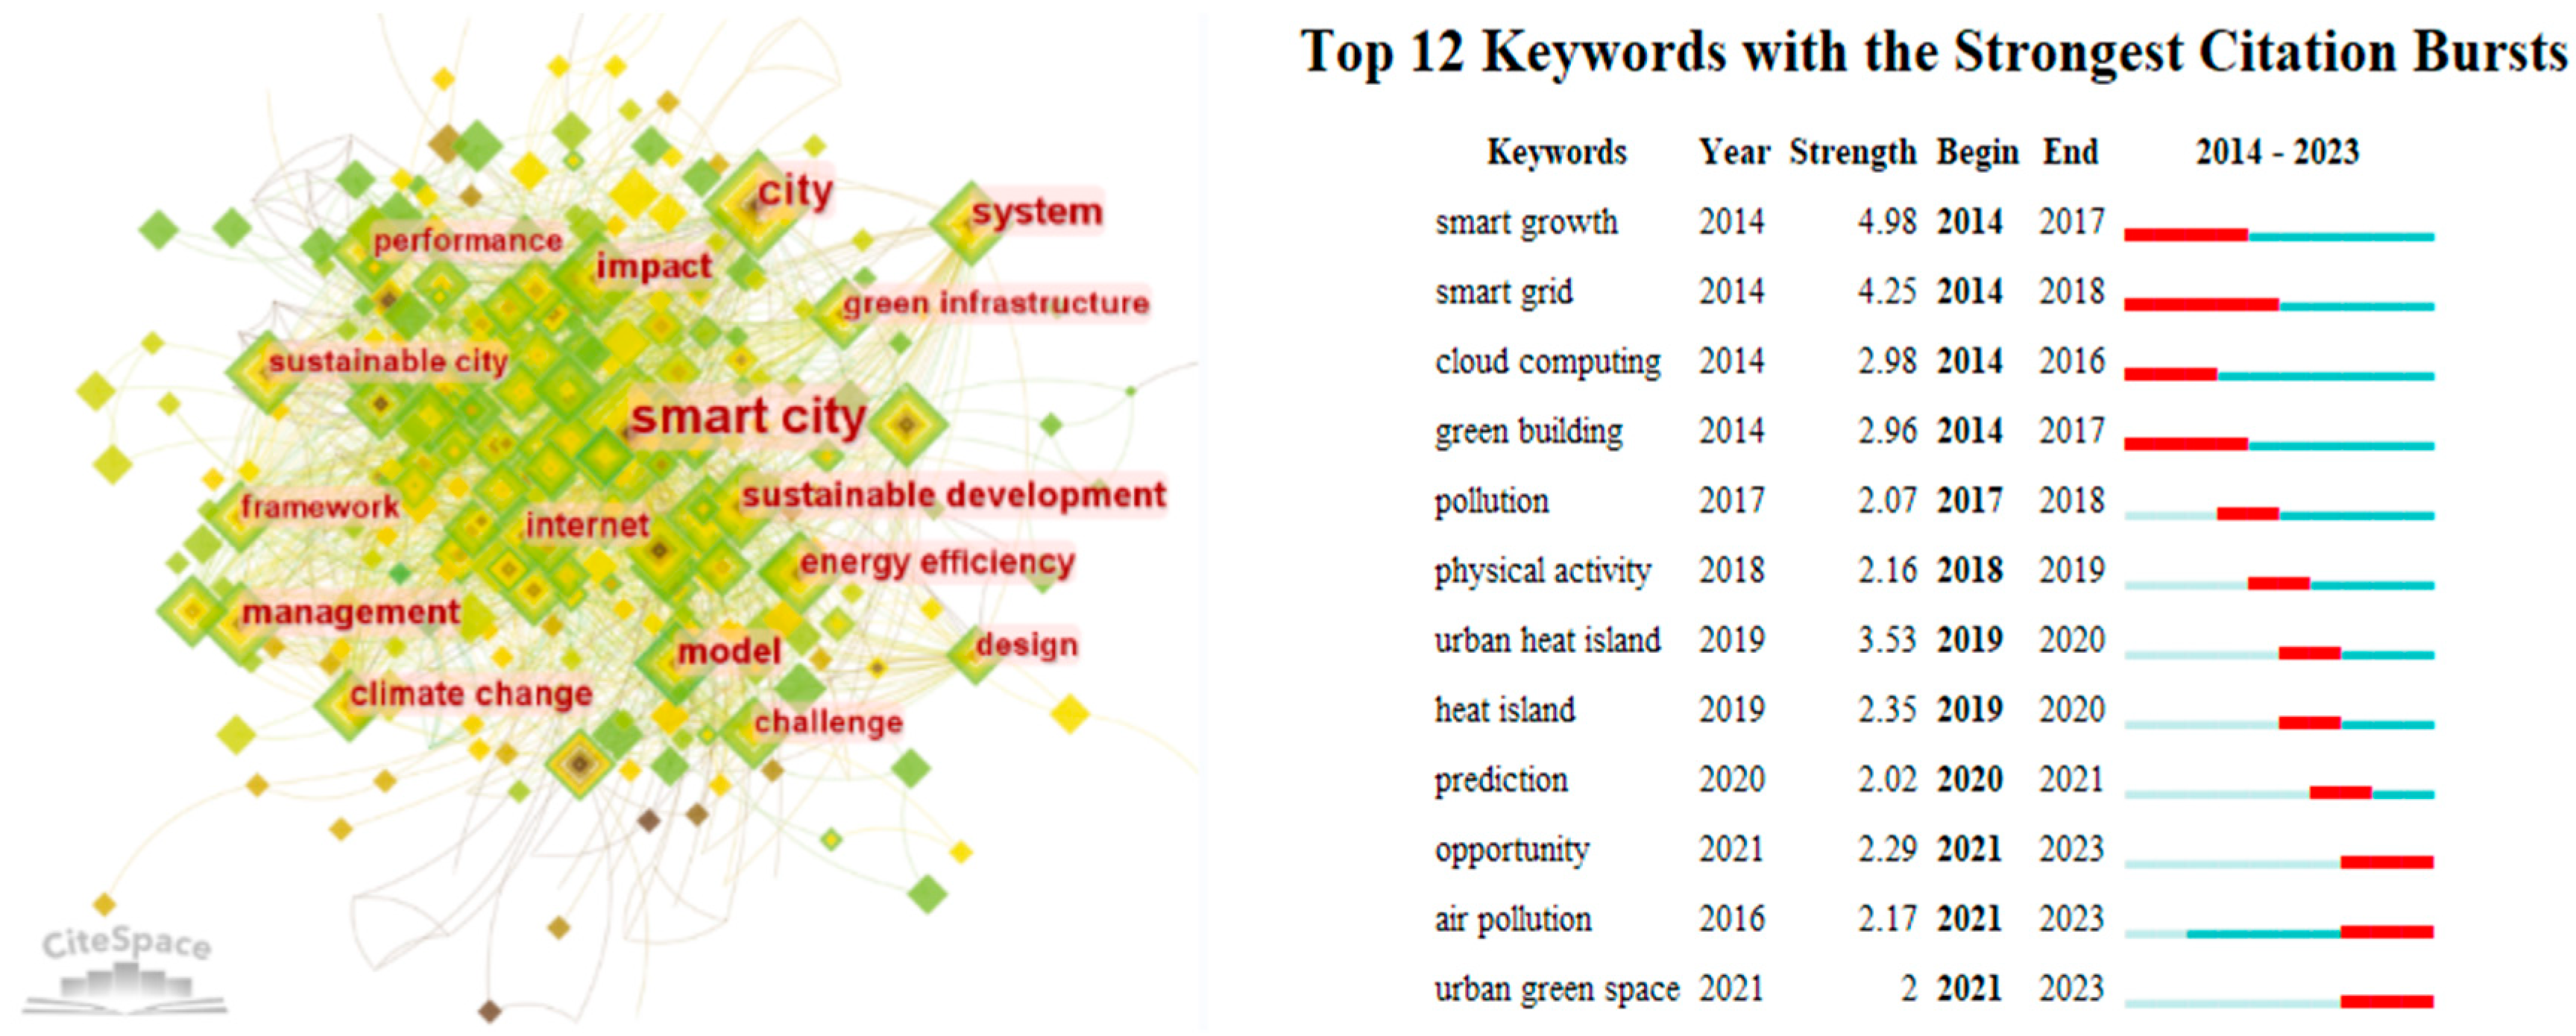
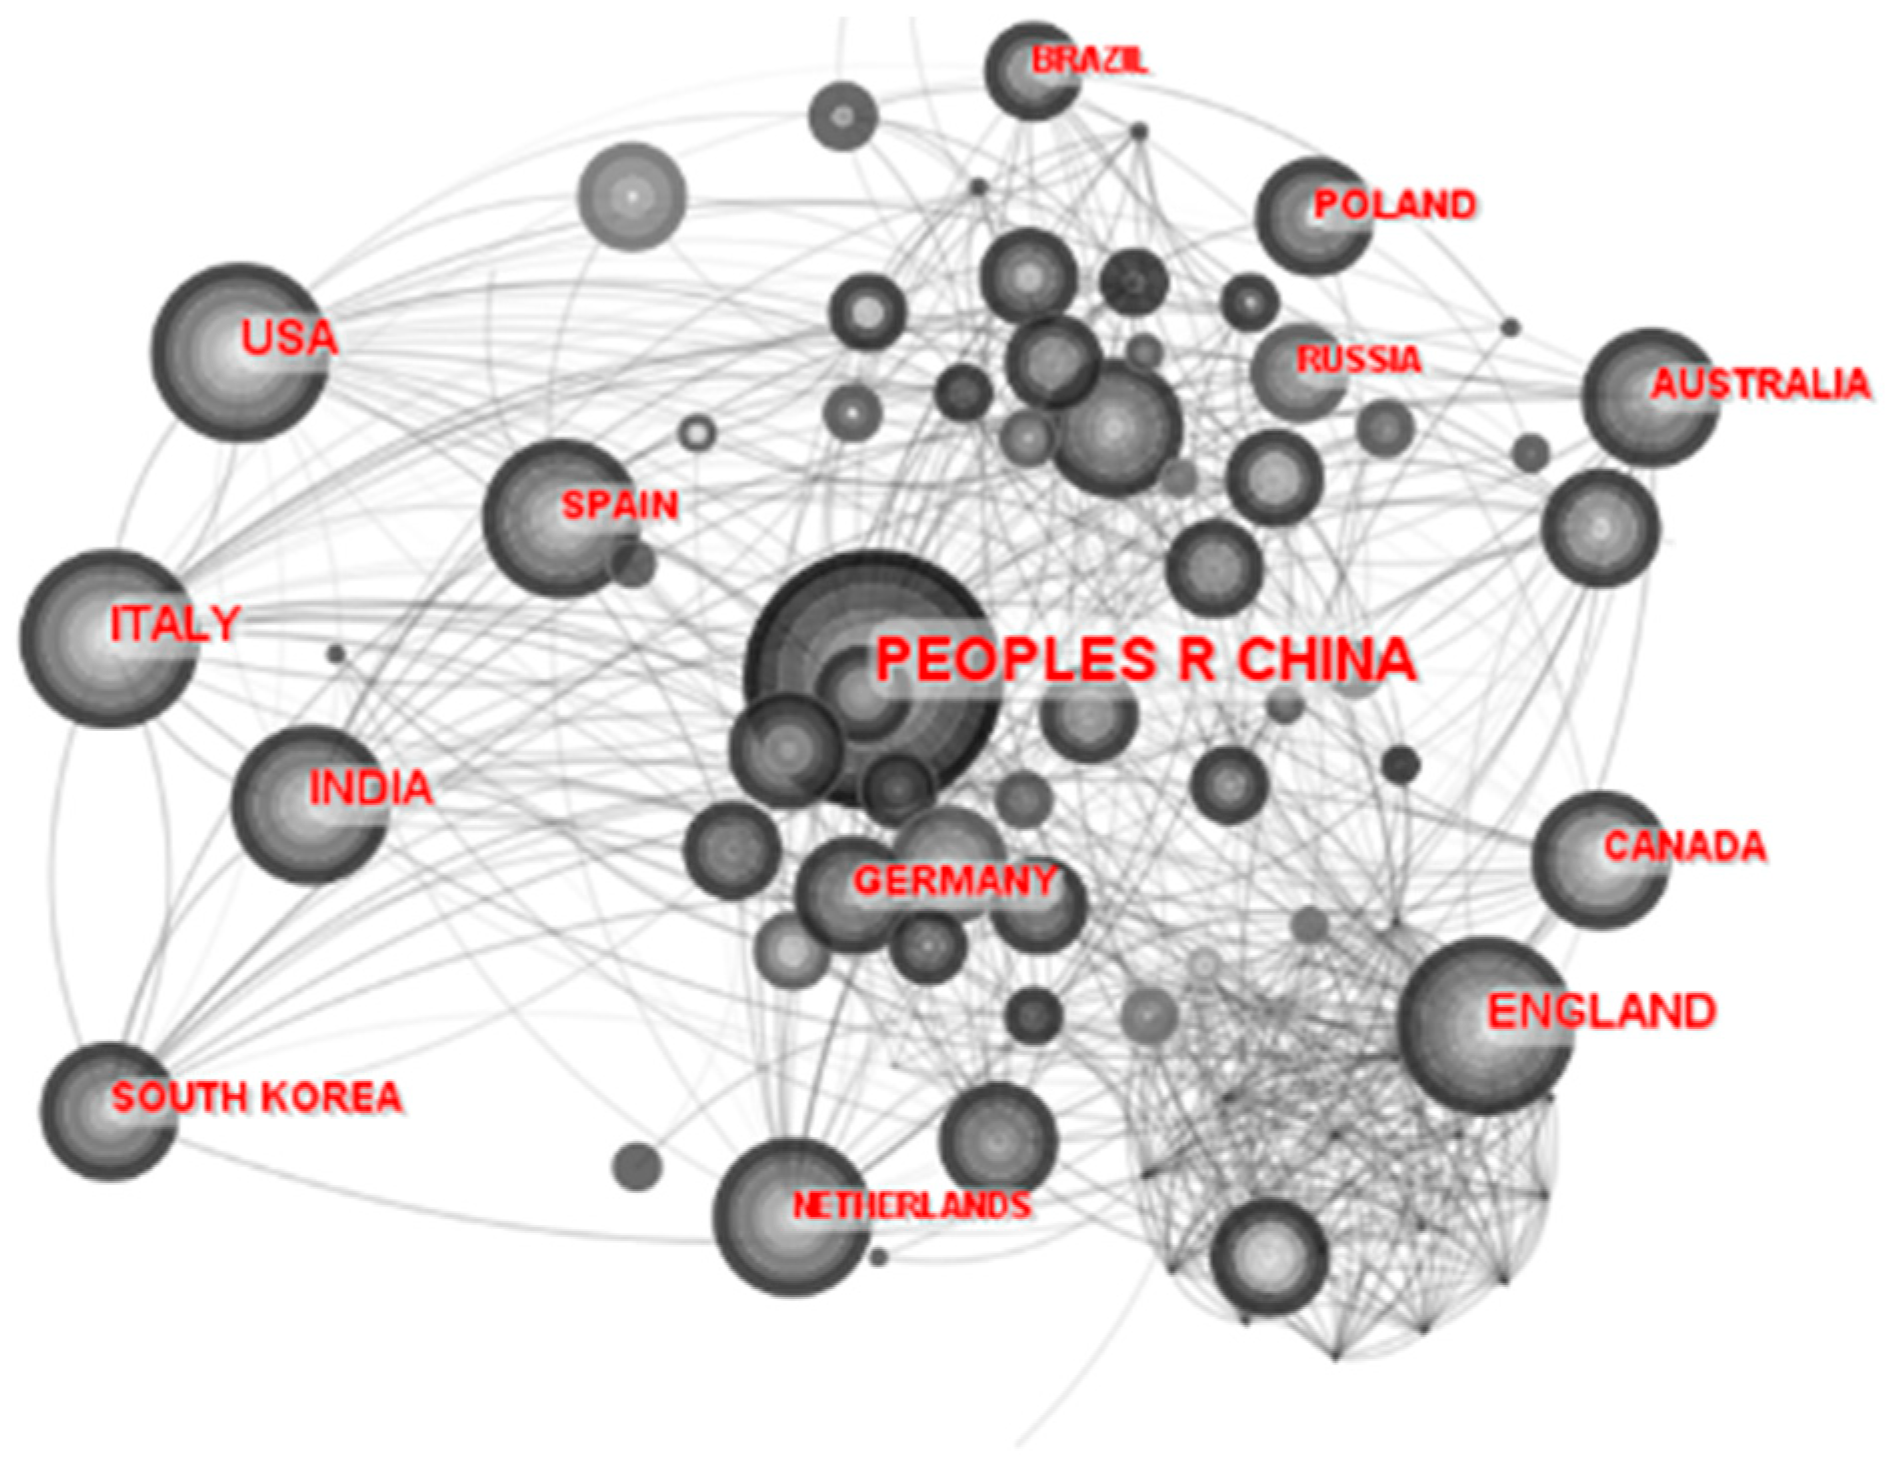
2.1. Bibliometric Analysis

Both domestically and internationally, the promotion of urban development through the concept of “smart and green coordination” has gained significant attention and has become a hot topic. This approach emphasizes the integration of smart technologies and sustainable practices to achieve more efficient, environmentally friendly, and livable urban environments. The combination of smart and green strategies has the potential to address various urban challenges, including resource management, environmental protection, transportation efficiency, energy conservation, and quality of life for residents. As cities strive for sustainable development and aim to enhance their competitiveness on the global stage, the concept of “smart and green coordination” has emerged as a key focus area.
Over the past decade, research in the field of smart and green coordination has primarily concentrated on micro-level aspects. Several prominent research areas have emerged, including the exploration of smart-green communities [6,7,8], the impact of smart city initiatives on climate change [9,10,11], green infrastructure development [12,13], and the analysis of future challenges [14,15]. The prevalent research approach has predominantly involved modeling techniques to examine and forecast various scenarios and outcomes [16]. Among these research areas, the smart grid has experienced the longest period of sustained interest and burst intensity [17,18,19,20].
As we can see in Figure 1, the hot spots have dispersed and iterated rapidly. Most research focusing on detailed areas and macroscopic research is rare and emerging. The relationship between “smart” and “green” is one of the newly emerging topics.
The rapid development of the digital economy in China has led to a significant contribution of research outcomes by Chinese authors, as depicted in Figure 2. Over the past decade, research in this field conducted in China has been highly concentrated, with a focus on qualitative studies closely aligned with policy trends [21,22]. Given the frequent introduction of new policies, the research hotspots in this field are subject to frequent updates and changes.
Based on the analysis above, two prominent areas of focus are the interrelation between “smart” and “green”, as well as the context of China. In this research, we have chosen to delve into the former topic as our main subject, while also considering the latter as an objective.

2.2. Study on the Effect Smart Cities Exert on Green Development

With the continuous deterioration of urban environments, research focus has gradually shifted towards exploring whether smart cities can promote sustainable development and enhance urban ecological benefits. Firstly, at the conceptual level, the incorporation of sustainability into smart city methods and models has garnered significant attention, leading to the emergence of compound concepts such as green smart cities and sustainable smart cities [23,24,25]. Secondly, there has been a substantial amount of research investigating the relationships between smart cities, environmental benefits, and sustainable development. Ahvenniemi et al. [26] argue that a truly “smart” city, in terms of its overall objectives, must be one that embraces sustainable development. Through the use of a difference-in-differences (DID) approach, other scholars [27] suggest that incorporating policies and planning centered around an understanding of the overarching vision of environmental quality and resilience can better achieve the integration of smart and green city concepts, thereby facilitating sustainable development.
Although some research [28] has theoretically affirmed the positive effects of smart cities on sustainable development and ecological efficiency, certain scholars still hold reservations about smart cities’ environmental benefits [29]. There is also ongoing debate regarding whether smart cities are an effective approach to achieving sustainable development.
To explore the relationship between smart and green development, scholars often employ the difference-in-differences (DID) method. They typically select prefecture-level cities as their research subjects and examine urban energy consumption and emissions as the dependent variables. They have examined the impact of smart city pilot policies on ecological efficiency, revealing that smart city construction notably enhances urban ecological efficiency and that its promotive effect strengthens over time. Overall, research in China regarding the relationship between smart and green development is characterized by a close connection to policy trends, frequent updates on research hotspots, and the use of the DID method to assess the impact of smart city pilot policies on energy consumption and emissions at the prefecture-level city level.

2.3. Research Gaps

The existing research in the field of smart and green development, as shown in Table 1, has certain limitations that need to be addressed. Firstly, there is a lack of variable granularity, with “smart city” often being used as a general explanatory variable without further deconstruction of its underlying components. Secondly, the reliance on econometric research methods, while common, may have limitations in capturing the complexity of urban systems. Thirdly, there are few papers discussing the negative impact of smart city construction on green development [30]. Lastly, there is insufficient guidance for future development, as most studies are based on historical panel data with limited consideration of future trends.
To address these limitations, this study proposes three solutions. Firstly, it suggests refining the explanatory variable “smart city construction” into the following four distinct dimensions based on the innovative quadruple theory: smart governance, smart living, smart economics, and smart labor. This approach allows for a more detailed understanding of the different aspects of smart city development and their impact on urban low-carbon development.
Secondly, this study proposes combining qualitative research methods with system simulation techniques. By integrating quantitative regression analysis and system dynamics modeling, this research can better account for the nonlinear, systematic, and dynamic nature of urban systems. This combined approach provides a more comprehensive understanding of the complex interactions and feedback loops within the urban environment.
Lastly, this study aims to incorporate trend prediction and dynamic scenario simulation. By focusing on overall trend changes and predicting urban green development trajectories under different scenarios, this research can elucidate the whole picture—both the positive and negative effects—and provide more targeted and forward-looking insights to support urban decision-making processes. This approach allows for a deeper understanding of potential future outcomes and will help inform policy and planning strategies accordingly.

3. Data and Methodology

3.1. Research Objects

This study focuses on seven megacities in China, namely, Shanghai, Beijing, Shenzhen, Chongqing, Guangzhou, Chengdu, and Tianjin. These cities represent complex and extensive urban systems characterized by various internal subjects, relationships, and external environments, all of which significantly influence the functioning of the overall system.
In terms of internal subjects and relationships, megacities demonstrate distinct “triple characteristics”. Firstly, they experience scale expansion, with their populations, infrastructure, and economic activities rapidly growing and expanding. Secondly, diverse demands emerge as these cities accommodate the wide range of social, economic, and environmental needs of their large and diverse populations. Lastly, these cities exhibit feature emergence, where unique characteristics and challenges arise due to the presence of multiple subjects within their urban fabric.
In terms of complex relationships, megacities face significant management tasks, increased management difficulty, and intensified management risks. The sheer size and complexity of these cities create challenges in effectively managing various aspects such as urban planning, transportation, public services, and environmental sustainability. The interplay and interactions among different stakeholders and sectors further contribute to the complexity of managing these megacities.
Moreover, megacities are influenced by the dynamic external environment. Factors such as informationization impact, the pressure to achieve the “dual carbon” target (carbon peak and carbon neutrality), and policy constraints shape the context in which these cities operate. The rapid development of information and communication technologies, along with the increasing focus on sustainable development and carbon reduction, create both opportunities and challenges for these megacities in their pursuit of smart and green development.
By acknowledging and analyzing these triple characteristics, complex relationships, and dynamic external environments, this study aims to provide a comprehensive understanding of the challenges and opportunities faced by the seven megacities in China in their pursuit of smart and green development.

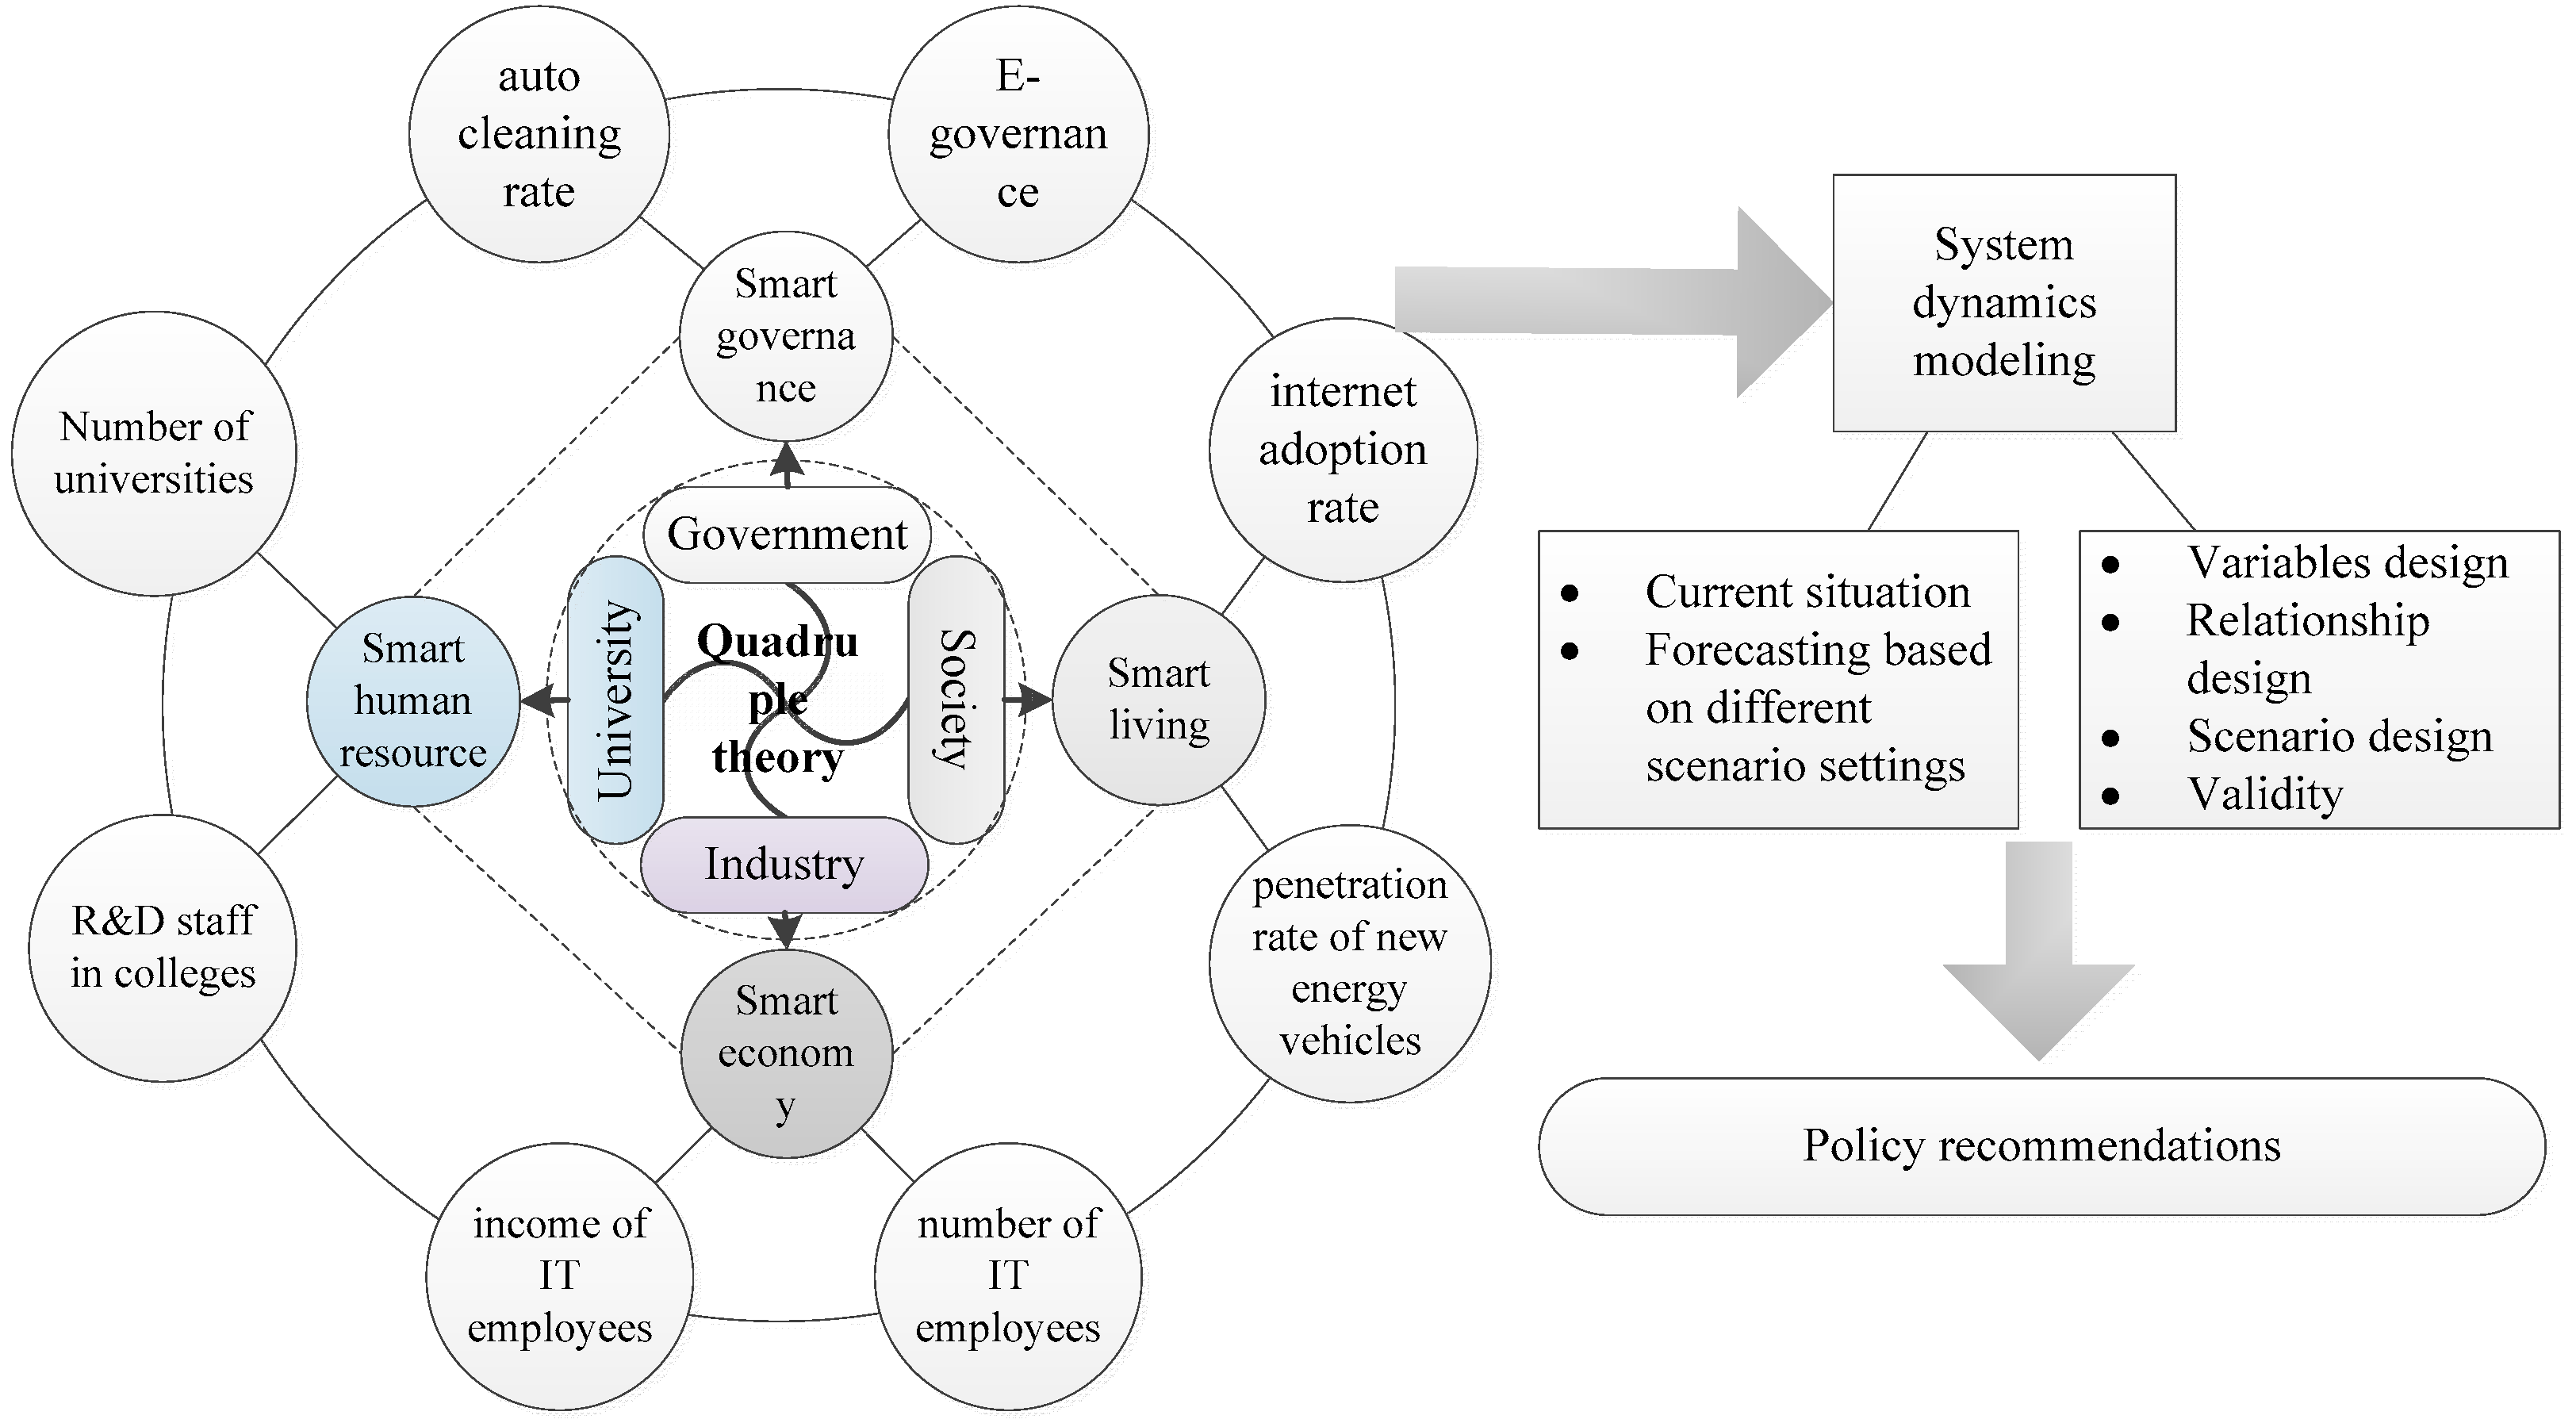
3.2. Research Framework

This study consists of four steps:
Firstly, the concept of a “smart city” is explained through four aspects based on the quadruple theory. These aspects include smart governance, smart living, smart economics, and smart human resources, which collectively form the components of a smart city system.
Secondly, an index system is designed. This study takes into full consideration the “Smart City Evaluation Model and Basic Evaluation Index System” issued by the National Standards Committee and designs indicators based on the availability of comprehensive data. Smart governance is assessed using indicators such as the urban auto cleaning rate and the online service adoption rate for civic administrative affairs (referred to as “E-governance” in the model). Smart living is assessed through indicators such as the internet adoption rate and the penetration rate of new energy vehicles. Smart economy is assessed using indicators such as the income of IT employees and the number of IT employees. Smart human resources are assessed through indicators such as the number of R & D staff in colleges and the number of universities in the city. Additionally, scenario settings are provided.
Thirdly, a simulation model, referred to as the “smart-green” model, is constructed. The results are analyzed from both a timeline perspective and in terms of scenario changes.
Lastly, based on the aforementioned analysis, policy recommendations are provided on how to develop a “smart-green” megacity.
The framework of this research is shown in Figure 3 below.

3.3. Data and Indicator System

There are 29 variables in “smart-green” system model. The dependent variable that we want to observe is green development level, which includes “Energy consumption” and “CO2 emission”. Their values are obtained directly from the energy section of the statistical yearbook.
As for the independent variables, there are three level variables, three flow variables, twenty auxiliary variables, and one shadow variable.
The level variables are external factors that influence the system model. They are the economic level, represented by GDP; industrial structure, represented by the proportion of the tertiary industry; and the social development level, represented by population. The flow variables are the level variables’ growth rate.
There are two types of auxiliary variables: the smart city system and scenario variables. The smart city system is built based on the innovative quadruple theory in Figure 3, and includes four aspects: smart governance, smart life, smart economy, and smart human capital. The scenario variables are composed of environmental control investment and technology and science investment. Environmental control investment is represented by the proportion of environmental protection investment to GDP, and technological financial investment is represented by the proportion of R & D expenditure to GDP.
The values of some critical variables are listed in Table 2 below. The data were collected from the “China City Statistical Yearbook”, city statistical bulletins and official news reporting. Some missing data were imputed using the method of nearby-year mean interpolation.

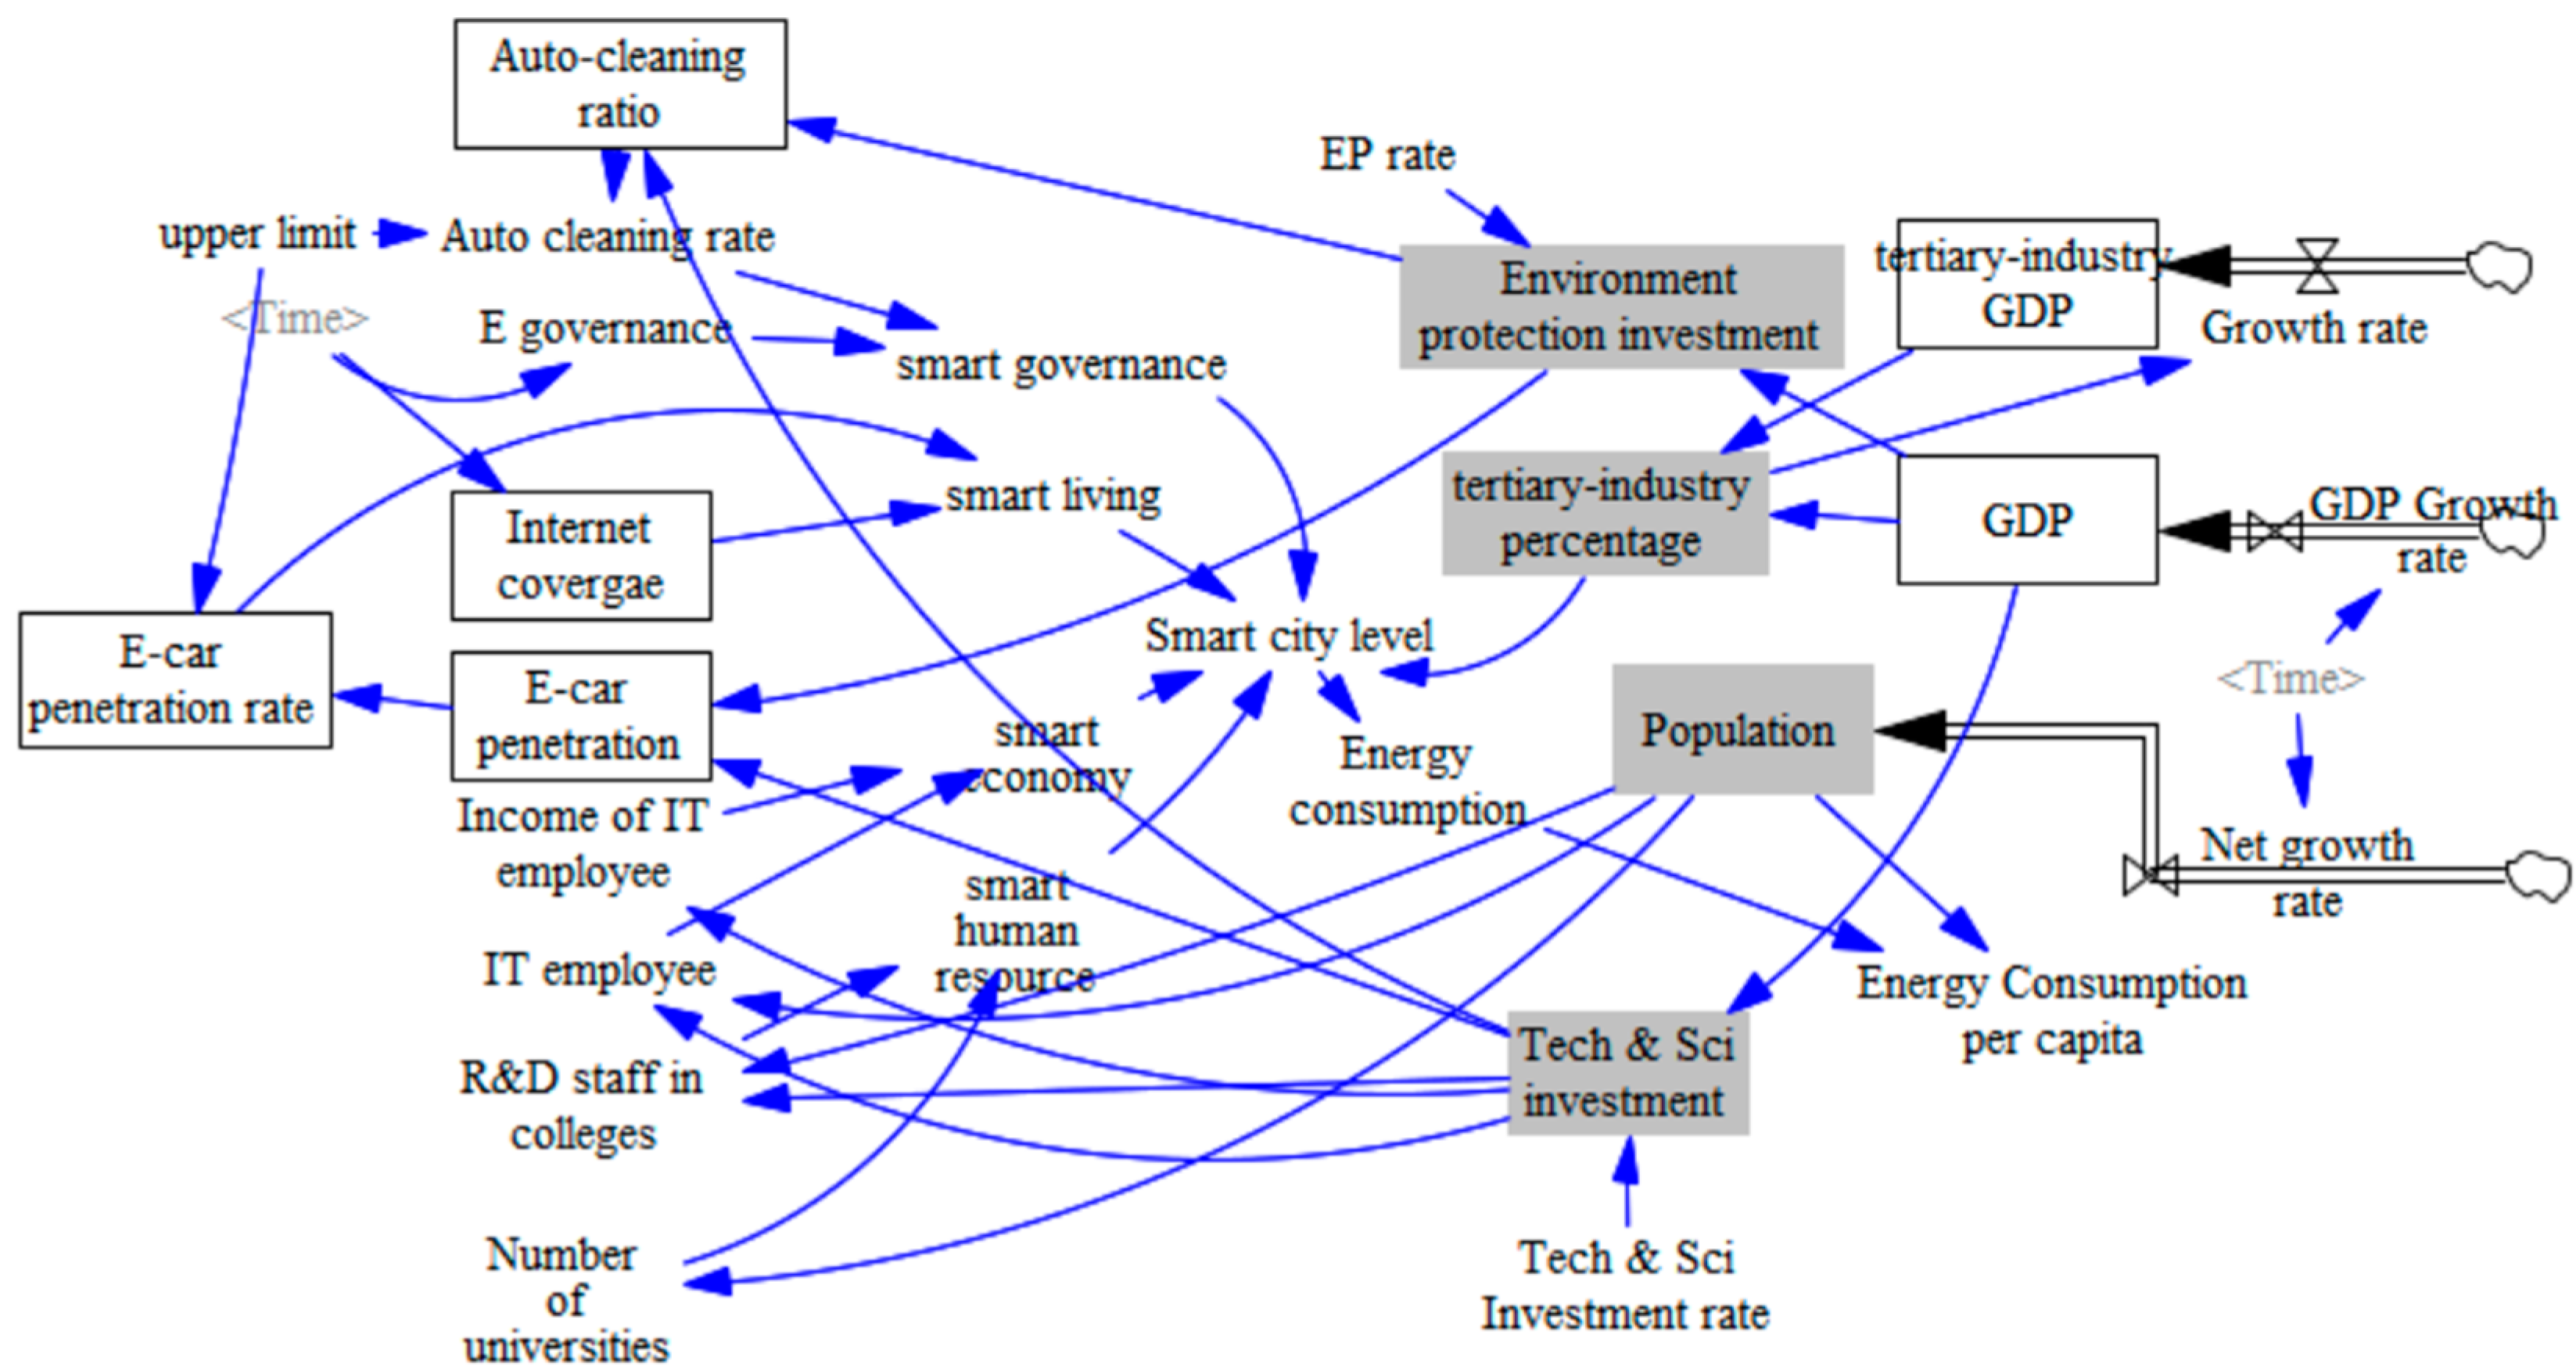
3.4. System Dynamic Model

Based on the analysis above, the following “smart-green” model was built and is illustrated in Figure 4.
The relationships between variables are expressed by equations. The variables listed in Table 3 are mostly assigned through a table function, which means their values come from real data, for example:
Internet coverage = WITH LOOKUP (Time, Look up ([(0.5,0) − (3000,10)], (2012,0.75), (2019,0.78), (2025,0.82), (2030,1), (2035,1)))
Population Net growth rate = WITH LOOKUP (Time, Look up ([(0,0) − (2035,50)],(2012,0),(2013,0.023),(2014,0.018),(2015,0.017),(2016,0.025),(2018,0.012),(2019,0.012),(2020,0.01),(2021,0.004),(2035,0.01)))
E-governance = WITH LOOKUP (Time, Look up ([(2012,−10) − (2035,10)],(2012,0.92),(2015,0.93),(2018,0.935),(2020,0.94),(2035,1)))
Others are assigned through equations based on regression analysis, for example:
IT employee = 0.0018 × Population + 0.022 × “Tech & Sci investment” + 56
Auto-cleaning rate = (2 × 10⁻⁵ × “Tech & Sci investment” + 6 × 10⁻⁶ × Environmental protection investment + 0.795) × 0.25, initial value 0.78
IT employee = 0.0018 × Population + 0.022 × “Tech & Sci investment” + 56
“R & D staff in colleges” = −2.9 × Population + 13.4 × “Tech & Sci investment” + 19261.7
As for the level variables, their values are controlled using flow variables, for example:
Population = INTEG (Population × Net growth rate), Initial Value = 17464.25
GDP = INTEG(2 × GDP × GDP Growth rate), Initial Value = 13658
tertiary-industry GDP = INTEG(2 × “tertiary-industry GDP” × Growth rate), Initial Value = 2155.3
The scenario settings are shown in Table 3:

4. Results and Discussion

The simulation, covering the period from 2012 to 2035, was validated by comparing the simulation results with real data from 2012 to 2021. The average error was found to be 3.1%, with the largest error occurring in 2020 at 6.5%. It is worth noting that the COVID-19 pandemic started in 2020, resulting in significant reductions in economic and social activities in most cities, leading to a sudden decrease in energy consumption. Considering that the model is considered reliable when the error is below 5%, the “smart-green” model can be deemed acceptable.
The traditional DID method involves only one single factor, the policy, and it is based on historical facts. The system dynamics model is a “black box” model. All relevant factors can be included in this system. Additionally, it is a model that represents the future. This is the main advantage of the SD method.

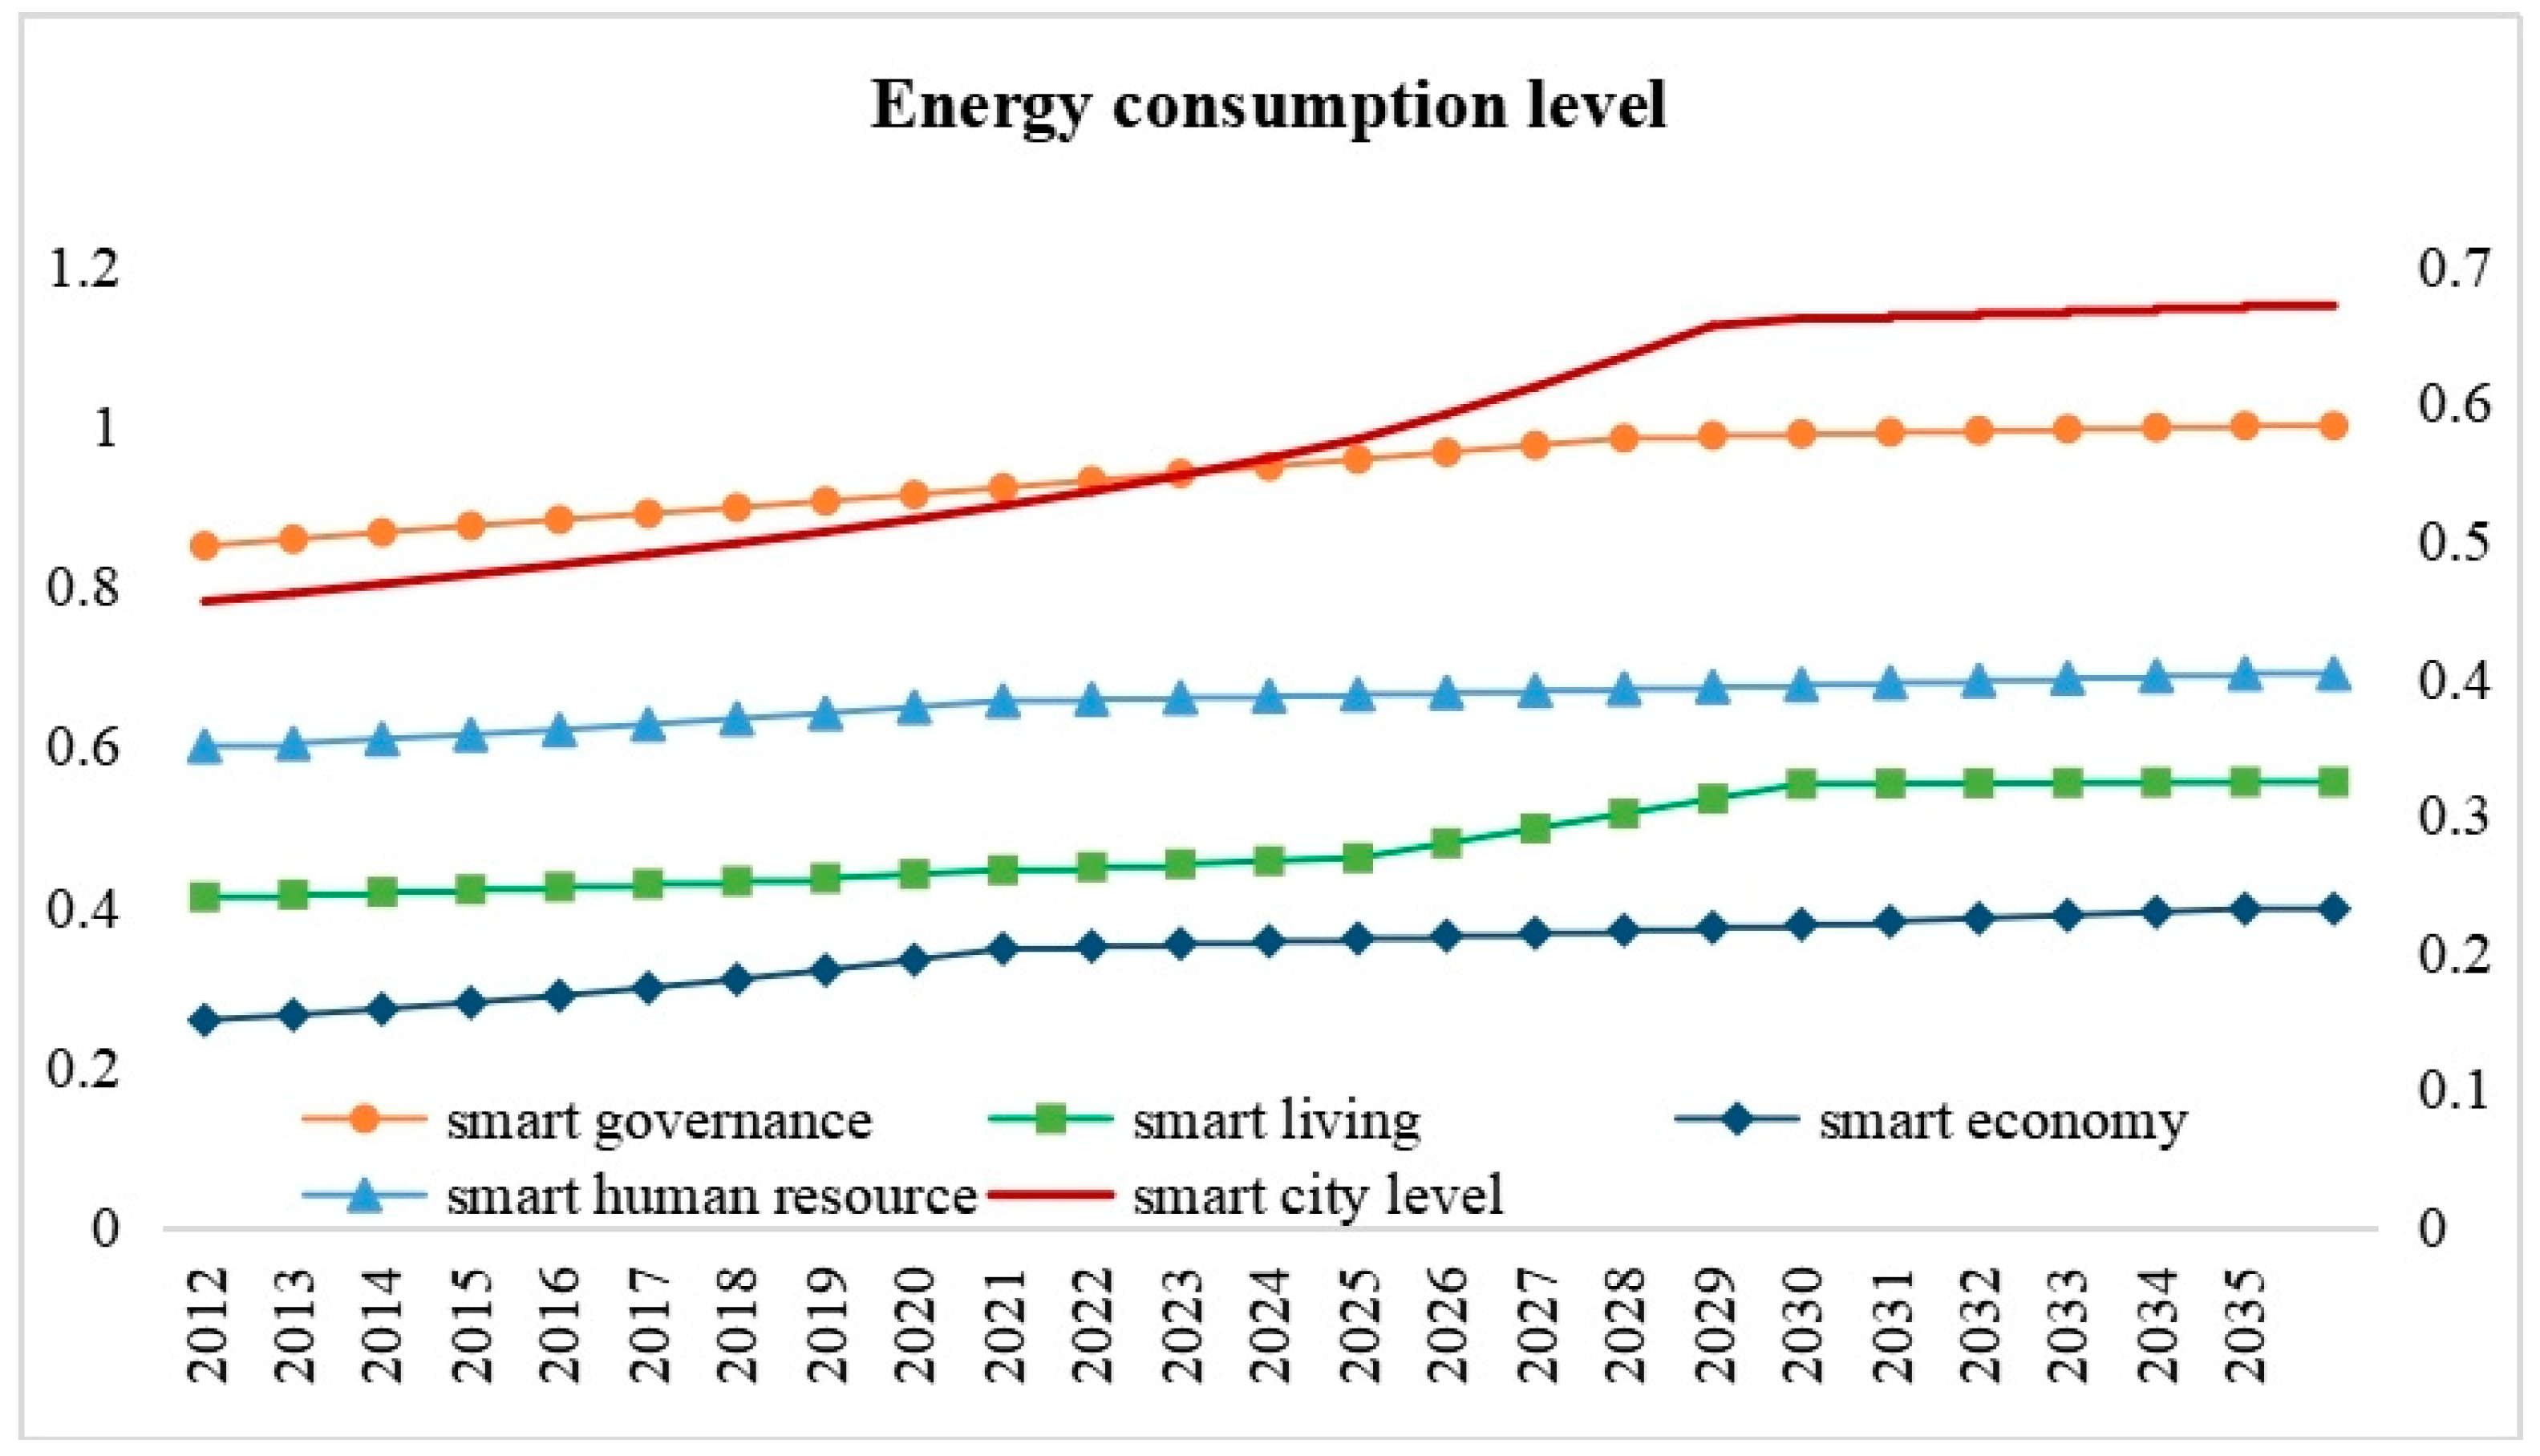
4.1. Development Level of Smart Cities

In seven megacities, the trend of smart city construction continues to rise until the end of the forecasting period. However, after 2029, the growth rate becomes very low, indicating that after approximately 17 years of construction, the smart city reaches a certain maturity level, leading to a deceleration in its progress.
In terms of the four dimensions of a smart city, namely, smart governance and smart human resources, we observe consistent progress. Specifically, the smart human resources dimension maintains a relatively stable trajectory. This is mainly due to the Education Bureau of China promoting vocational education and new universities choosing to establish themselves in other cities due to high land rents and other costs in these seven megacities. Additionally, these cities have already attracted the most talented technology professionals in the country, resulting in limited potential for further development. On the other hand, smart governance continues to grow until the early 2030s. Citizens can fulfill most of their needs through online apps or by calling the 12345 public service hotline. However, administrative approvals still require visits to the service hall, and the administrative reform involved in this process is a time-consuming task.
Smart living and smart economy, on the other hand, are the main driving forces behind the fluctuations in the smart level curve. In terms of smart living, new energy vehicles are transforming people’s lives in these cities. Currently, the average penetration rate of new energy vehicles in the seven cities has reached 30%, but the overall retention rate is only 4%. There is still a significant gap that must be filled to achieve the target of 30% to 40%. The Ministry of Industry and Information Technology (MIIT) has released the “Development Plan for the New Energy Vehicle Industry (2021–2035)”, which indicates that by 2025, the national penetration rate of new energy vehicles will reach 20%. As megacities, the penetration rate in these cities will be even higher. Therefore, there will be a noticeable increase in the smart living curve in 2025, and the trend will become smoother in 2030 when over 50% of new vehicles will be powered by new energy.

4.2. Trend of Green Development

As discussed earlier, the overall trend of smart cities can be described as “fast-growing, slow-growing, and then stabilizing”, and correspondingly, the energy consumption in these cities has followed a pattern of “fast growth, slow growth, stabilization, and finally a decrease”. Based on the current scenario, prior to 2030, energy consumption continues to increase steadily. Between 2030 and 2033, it reaches its peak level. Afterward, it begins a gradual decline. As shown in Figure 5 below. And correspondingly, the green development level experiences a “steady-decrease-bottom-increase” process.

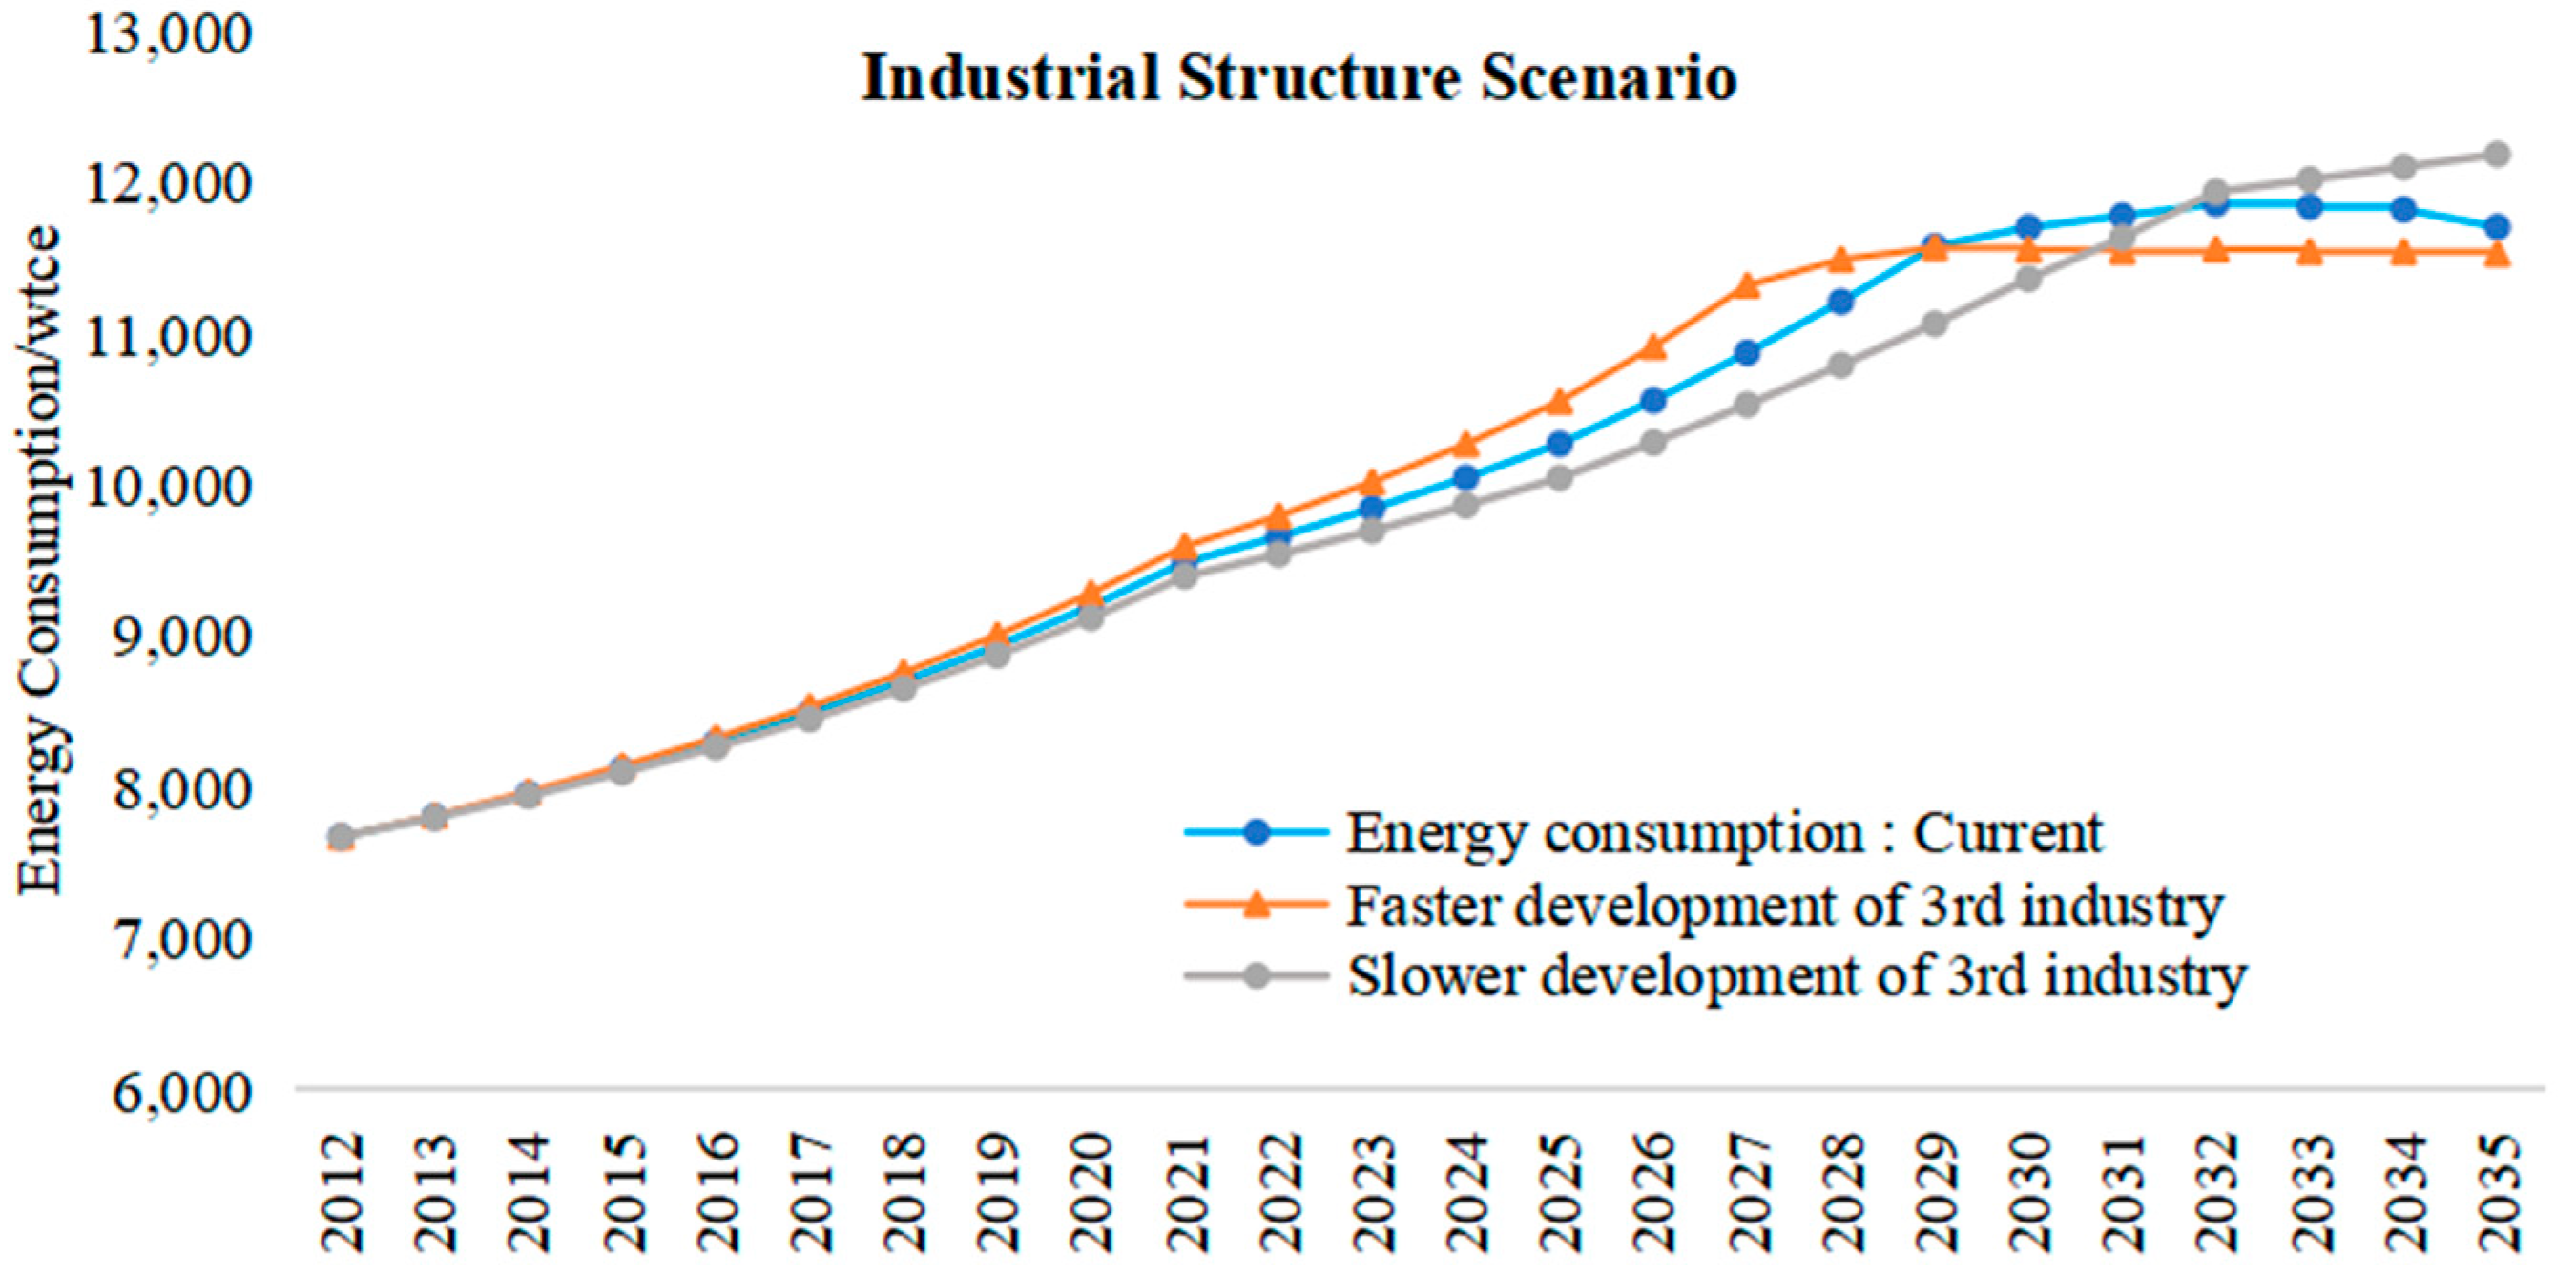
4.2.1. Industrial Structure Scenarios

When the third industry proportion is higher, the initial energy consumption increases until 2028, and starts to decrease after that. Compared with the current curve, the peak is reached earlier (about 4 years earlier), and the maximum value is lower (about 3.1% lower). Additionally, in a low scenario, energy consumption would be lower for the first 18 years, but exceed the baseline after 2019 and continue rising towards the end of the forecast period, as shown in Figure 6 below.
While the growth of the tertiary sector can improve economic efficiency and competitiveness to some extent, it can also lead to increased energy consumption at the beginning. There are several reasons for this:
(1)
Increased demand for services: As the tertiary sector develops, there is an increased demand for services such as transportation, logistics, communication, tourism, and entertainment. These services often require energy, such as fuel and electricity, for transportation and energy consumption by information technology equipment. For megacities, the increased demand for services may exacerbate the “urban diseases”, which may have an amplifying effect on energy consumption.
(2)
Energy consumption in commercial and office buildings: With the growth of the service industry, the number of commercial and office buildings also increases. These buildings require lighting, heating, ventilation, and air conditioning infrastructure, which often consume significant amounts of energy. The developers tend to build skyscrapers that rely on air conditioners and fresh air ventilation systems in megacities. This kind of building costs much more energy than traditional ones.
(3)
Energy consumption in digitization and information technology: With the digitization and widespread use of information technology in the tertiary sector, there is a corresponding increase in energy consumption from various devices, servers, and data centers. Technologies such as cloud computing, big data analytics, and artificial intelligence all require substantial energy support.
But after the updating of industrial structure, the energy consumption will decrease. So, the optimization of industrial structure has demonstrated a lag effect on energy consumption.

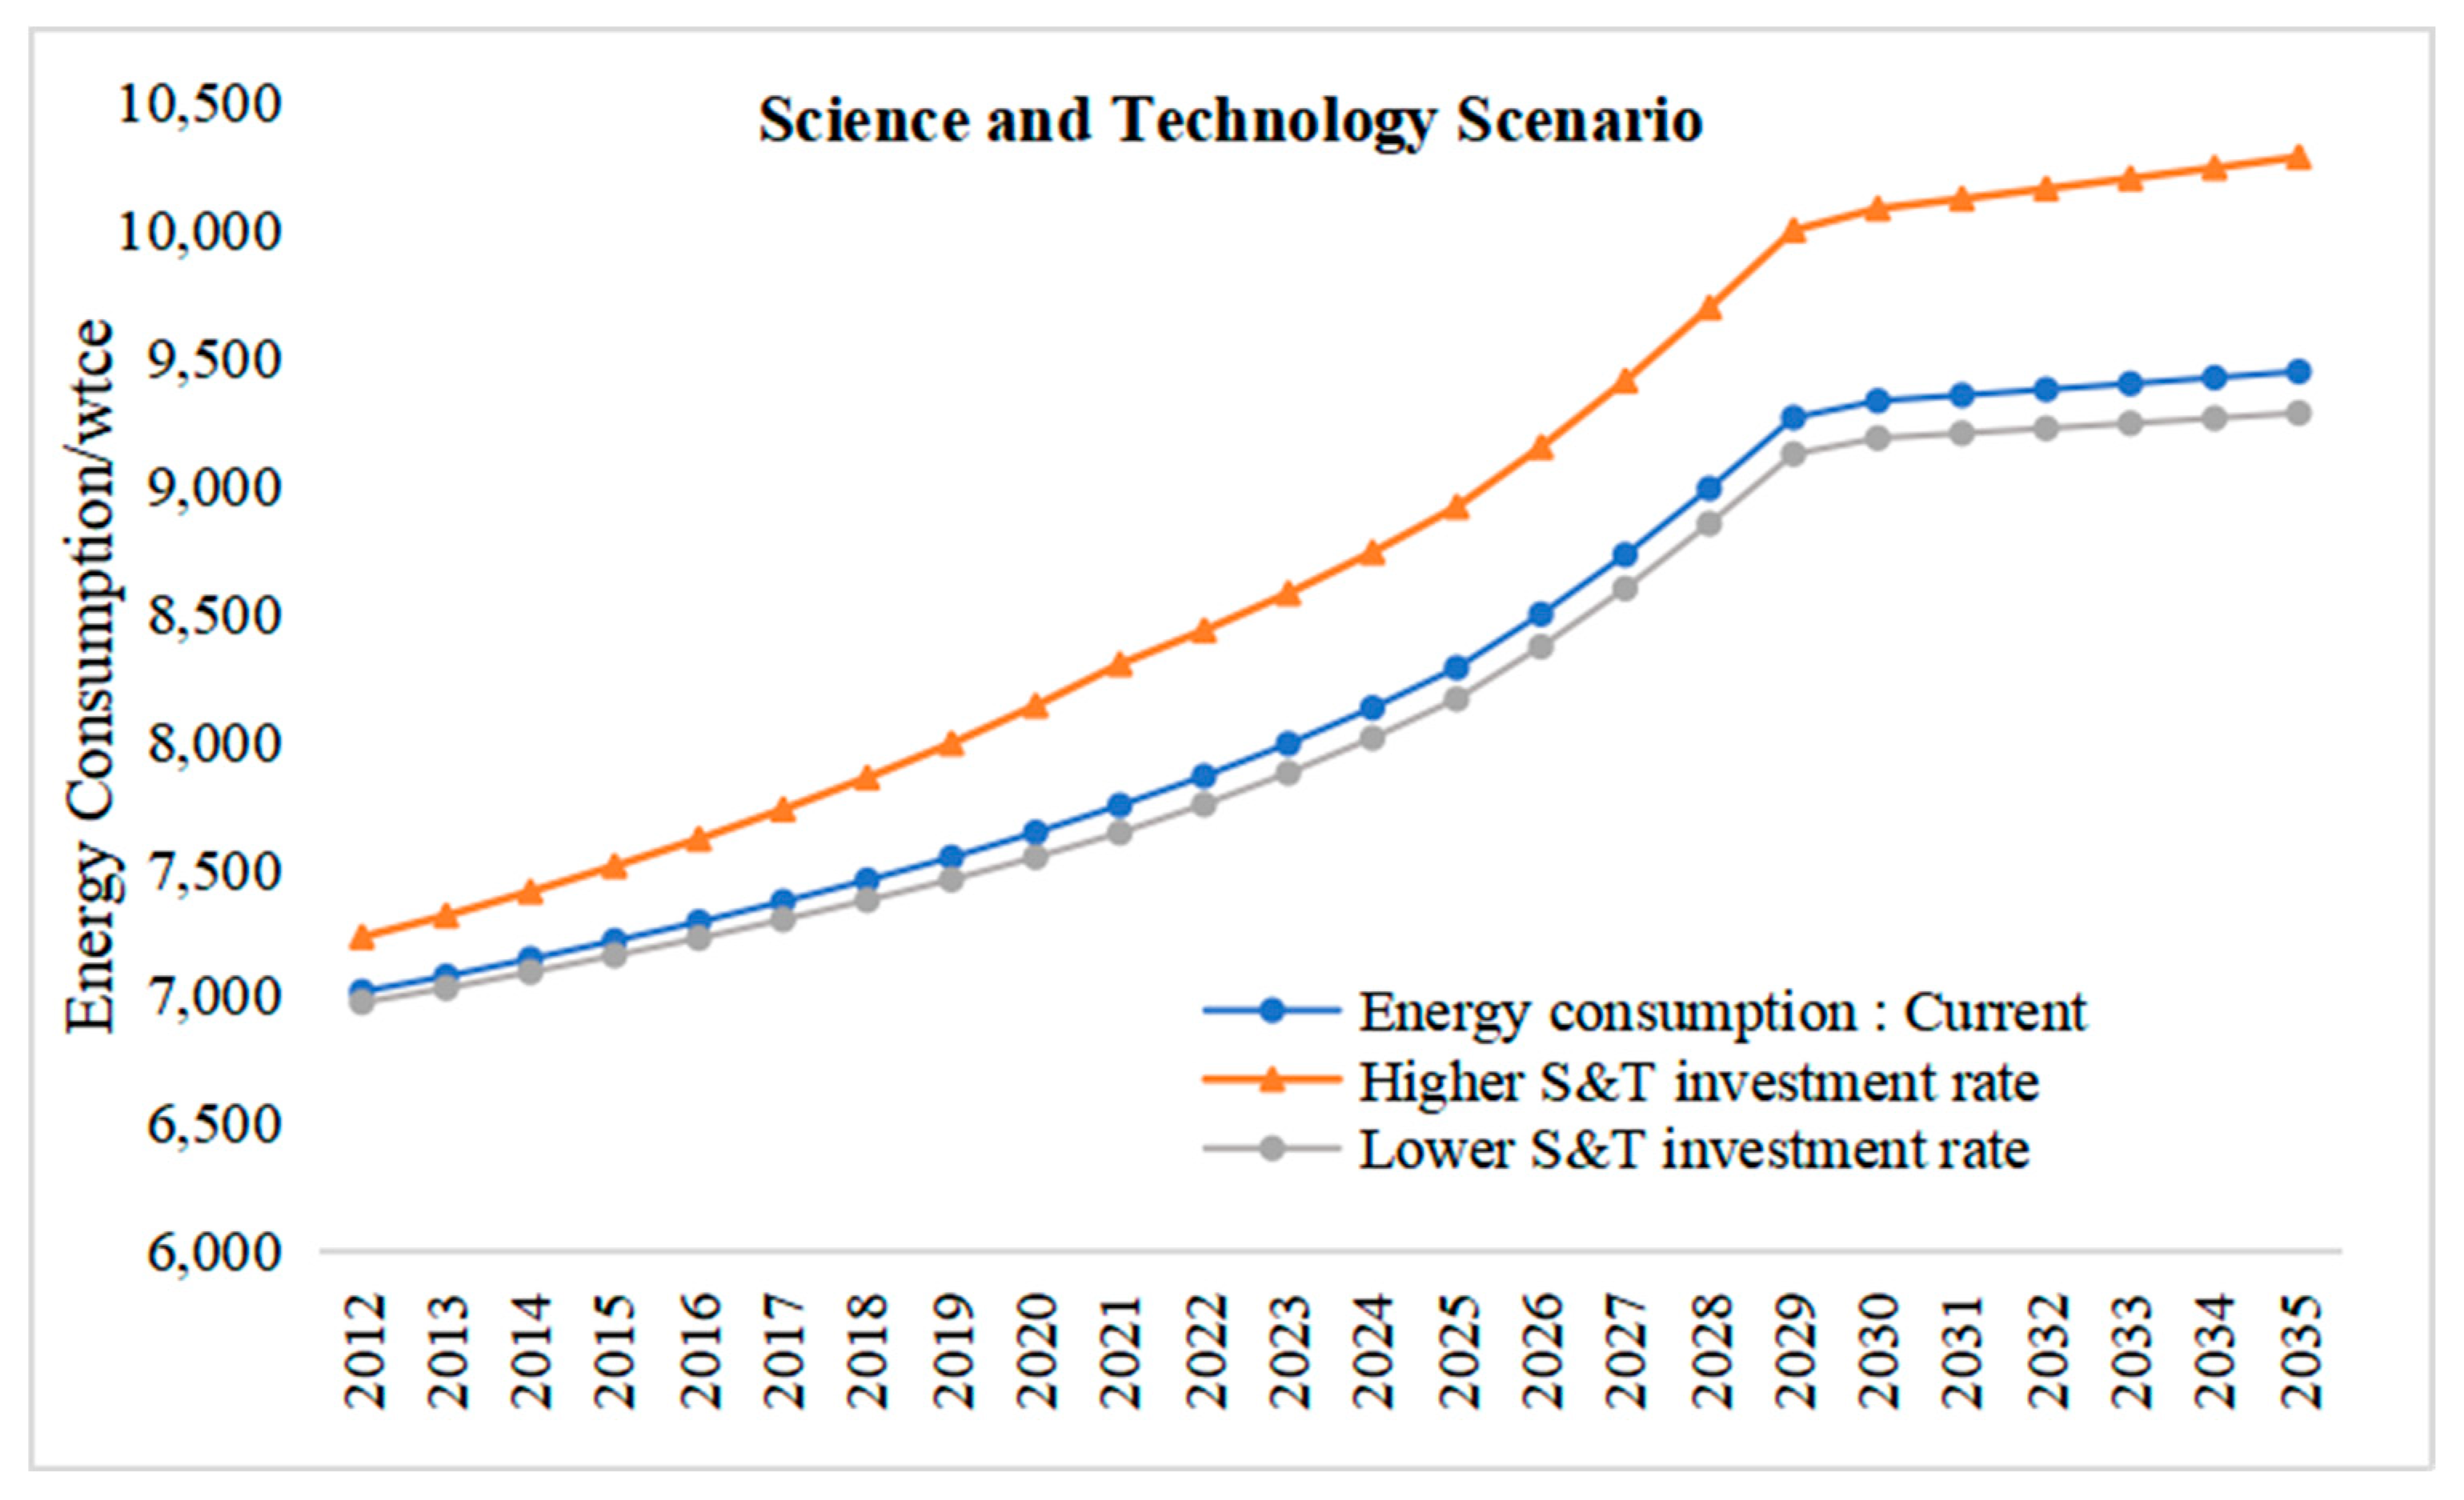
4.2.2. Science and Technology Scenarios

A higher investment rate in science and technology initially results in increased overall energy consumption. However, after the year 2026, the curve starts to shift below the original curve and reaches its peak around 2033, followed by a gradual decrease. By the end of the forecasting period, there is a reduction of approximately 3.5% in energy consumption compared to the original curve. Conversely, a lower investment rate leads to lower energy consumption for approximately 16 years, but it continues to grow, surpassing the original curve. At the end of the forecasting period, energy consumption is approximately 4% higher, as shown in Figure 7 below.
Increasing investment in technology can lead to an increase in energy consumption in the initial period, which might be due to the following reasons:
(1)
Increased investment in technology often leads to advancements in production and consumption activities, resulting in higher energy demands. For example, technological progress can lead to the emergence of new energy-intensive industries and products in megacities, such as data centers, cloud computing, and smart devices, all of which require significant energy supply.
(2)
Increased quantity of equipment and facilities: An increase in technology investment is often accompanied by an expansion in the quantity of equipment and facilities, such as factories, laboratories, and offices. The operation of this equipment and these facilities requires energy supply, thereby increasing energy consumption.
(3)
Manufacturing and disposal of electronic devices: Increased technology investment means more electronic devices and computer systems, which consume energy during their manufacturing, usage, and disposal processes. The manufacturing of electronic devices involves the extraction, processing, and transportation of raw materials, while the usage and disposal of devices require electricity and other resources.
Environmental investment rate has little effect on consumption.
Similar to the industrial structure scenario, an energy consumption effects is shown after a relatively long period of preparation. A lag effect also exists here.

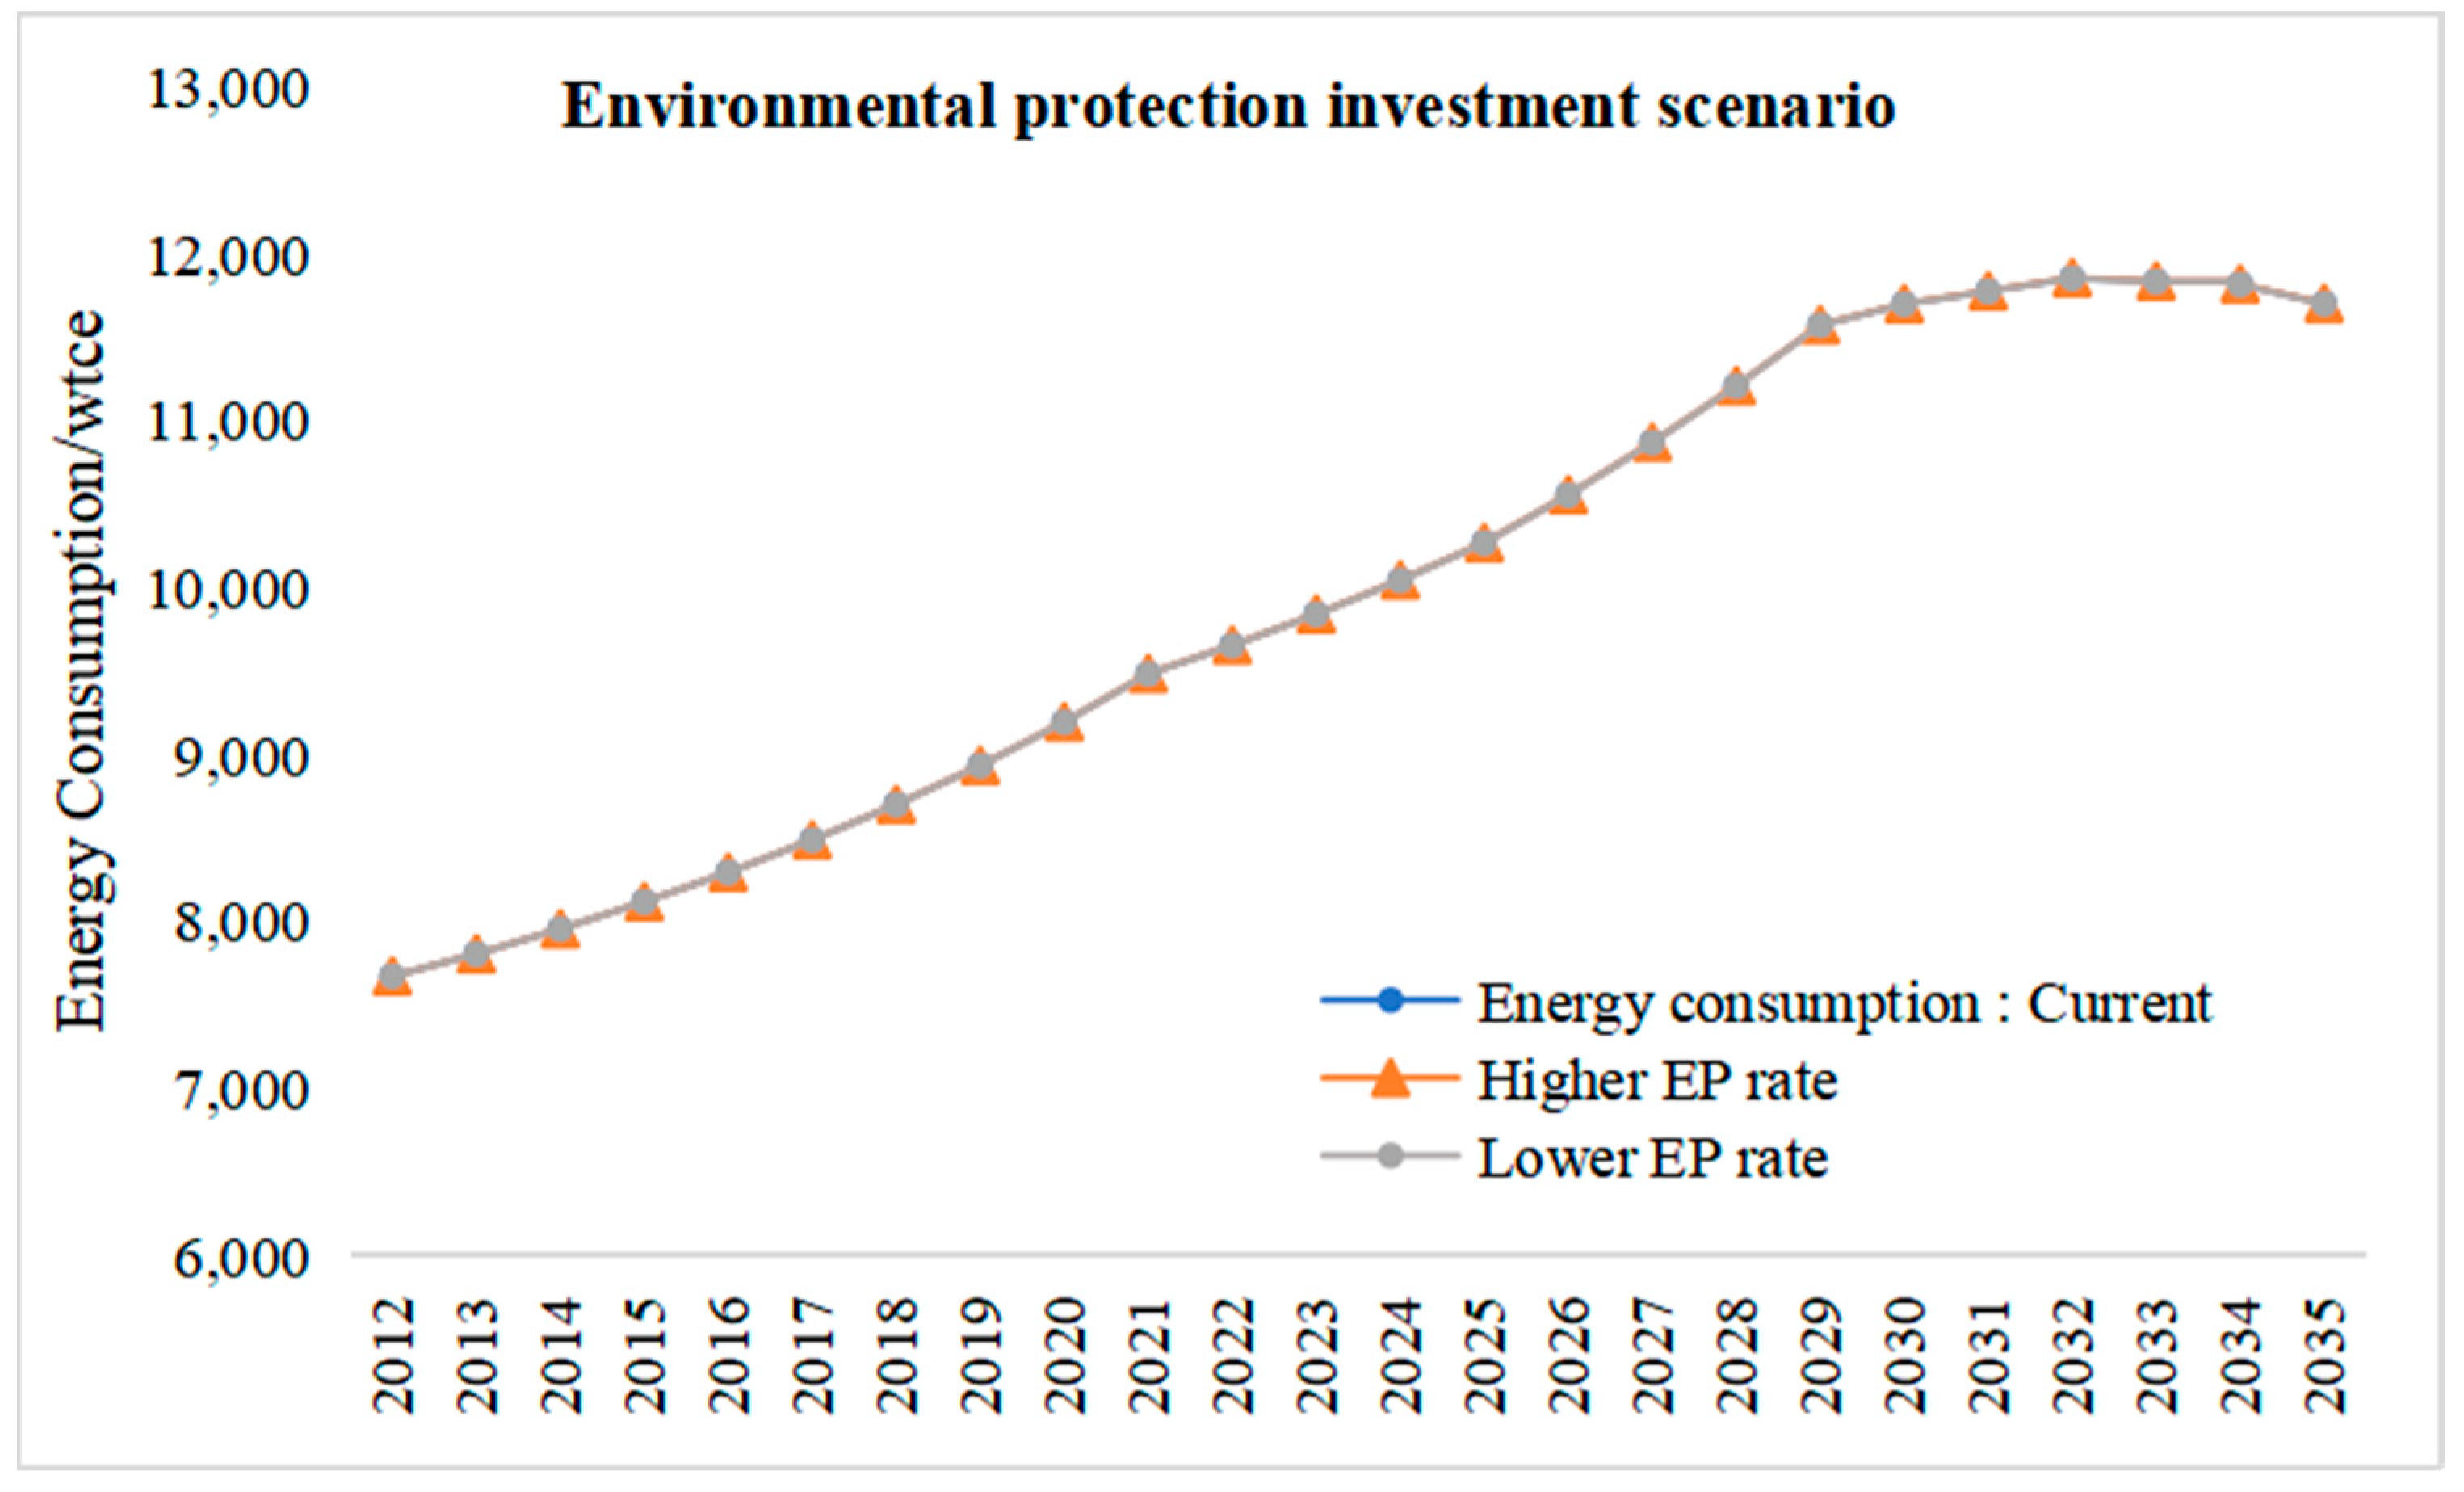
4.2.3. Environmental Investment Rate

Surprisingly, the direct change in environmental investment has little to do with the energy consumption. There will be only a 5% difference at the end of the forecasting period. There are some reasons for this:
Increasing environmental protection investment may not have an immediate significant impact on energy consumption due to several reasons:
(1)
Small difference in scenario settings: China is already one of the top countries that invest in environmental protection, especially its megacities, which represent the frontier of China’s development. So, the difference between the current and high scenarios is very small.
(2)
Technology and equipment upgrade cycles: Environmental protection investment often involves upgrading and replacing existing technologies and equipment to improve energy efficiency and reduce pollutant emissions. However, equipment replacement and technology upgrades often require time and money, especially for large-scale production facilities. In such cases, the impact of environmental protection investment may require a longer cycle to be reflected in energy consumption.
(3)
Environmental protection investment often entails high costs, such as purchasing energy-efficient equipment, implementing cleaner production processes, or adopting renewable energy sources. These costs may impose financial burdens on businesses, particularly during the initial investment phase, which could lead to significant decreases in energy consumption.
Although the impact of increased environmental protection investment on energy consumption may not be immediately evident, it remains an essential means to achieve sustainable development and reduce environmental impacts. As environmental technologies continue to develop and mature, coupled with increasing environmental awareness, the effects of environmental protection investment will gradually become more apparent, making more substantial contributions to reducing energy consumption. Therefore, sustained environmental protection investment and long-term commitment are key to achieving energy consumption reduction and environmental improvement, as shown in Figure 8 below.

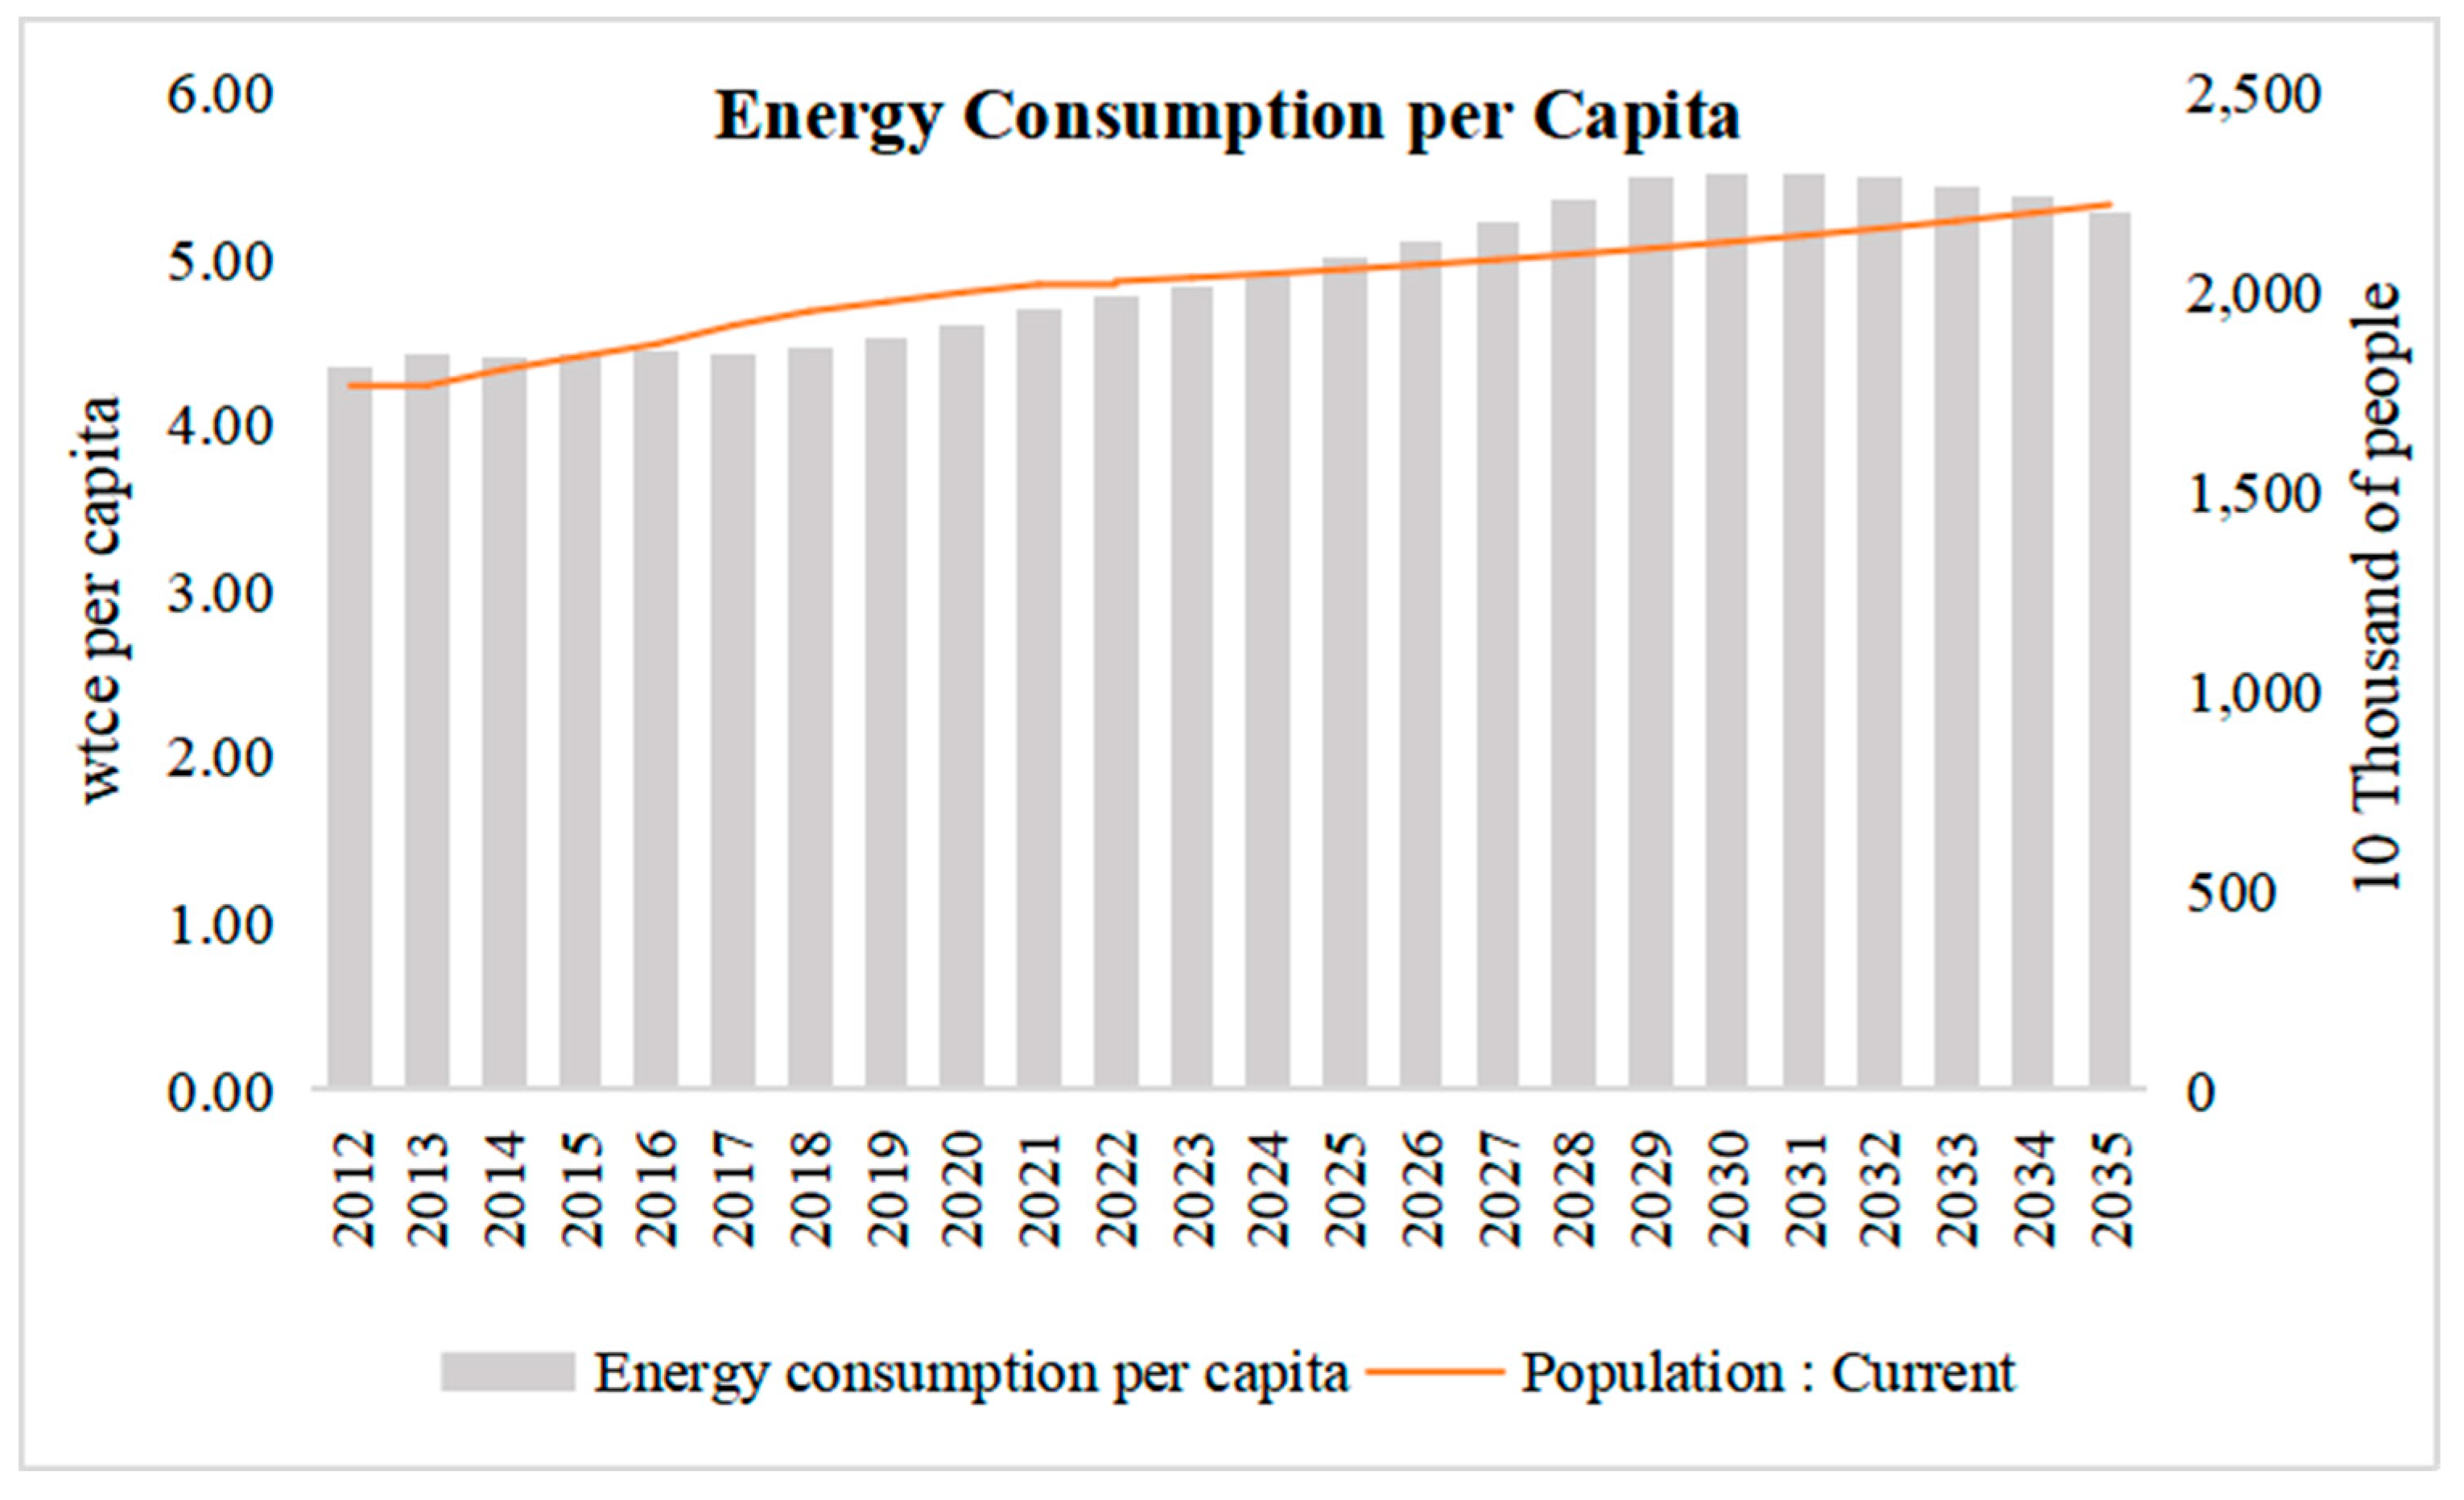
4.2.4. Per Capita Scenario

When taking population into consideration, the decrease around 2030 becomes more significant. All megacities in China are now trying to control their populations. But, except for Beijing, the other cities’ populations are still rising. So, the changing energy consumption trend becomes more significant, as shown in Figure 9 below.

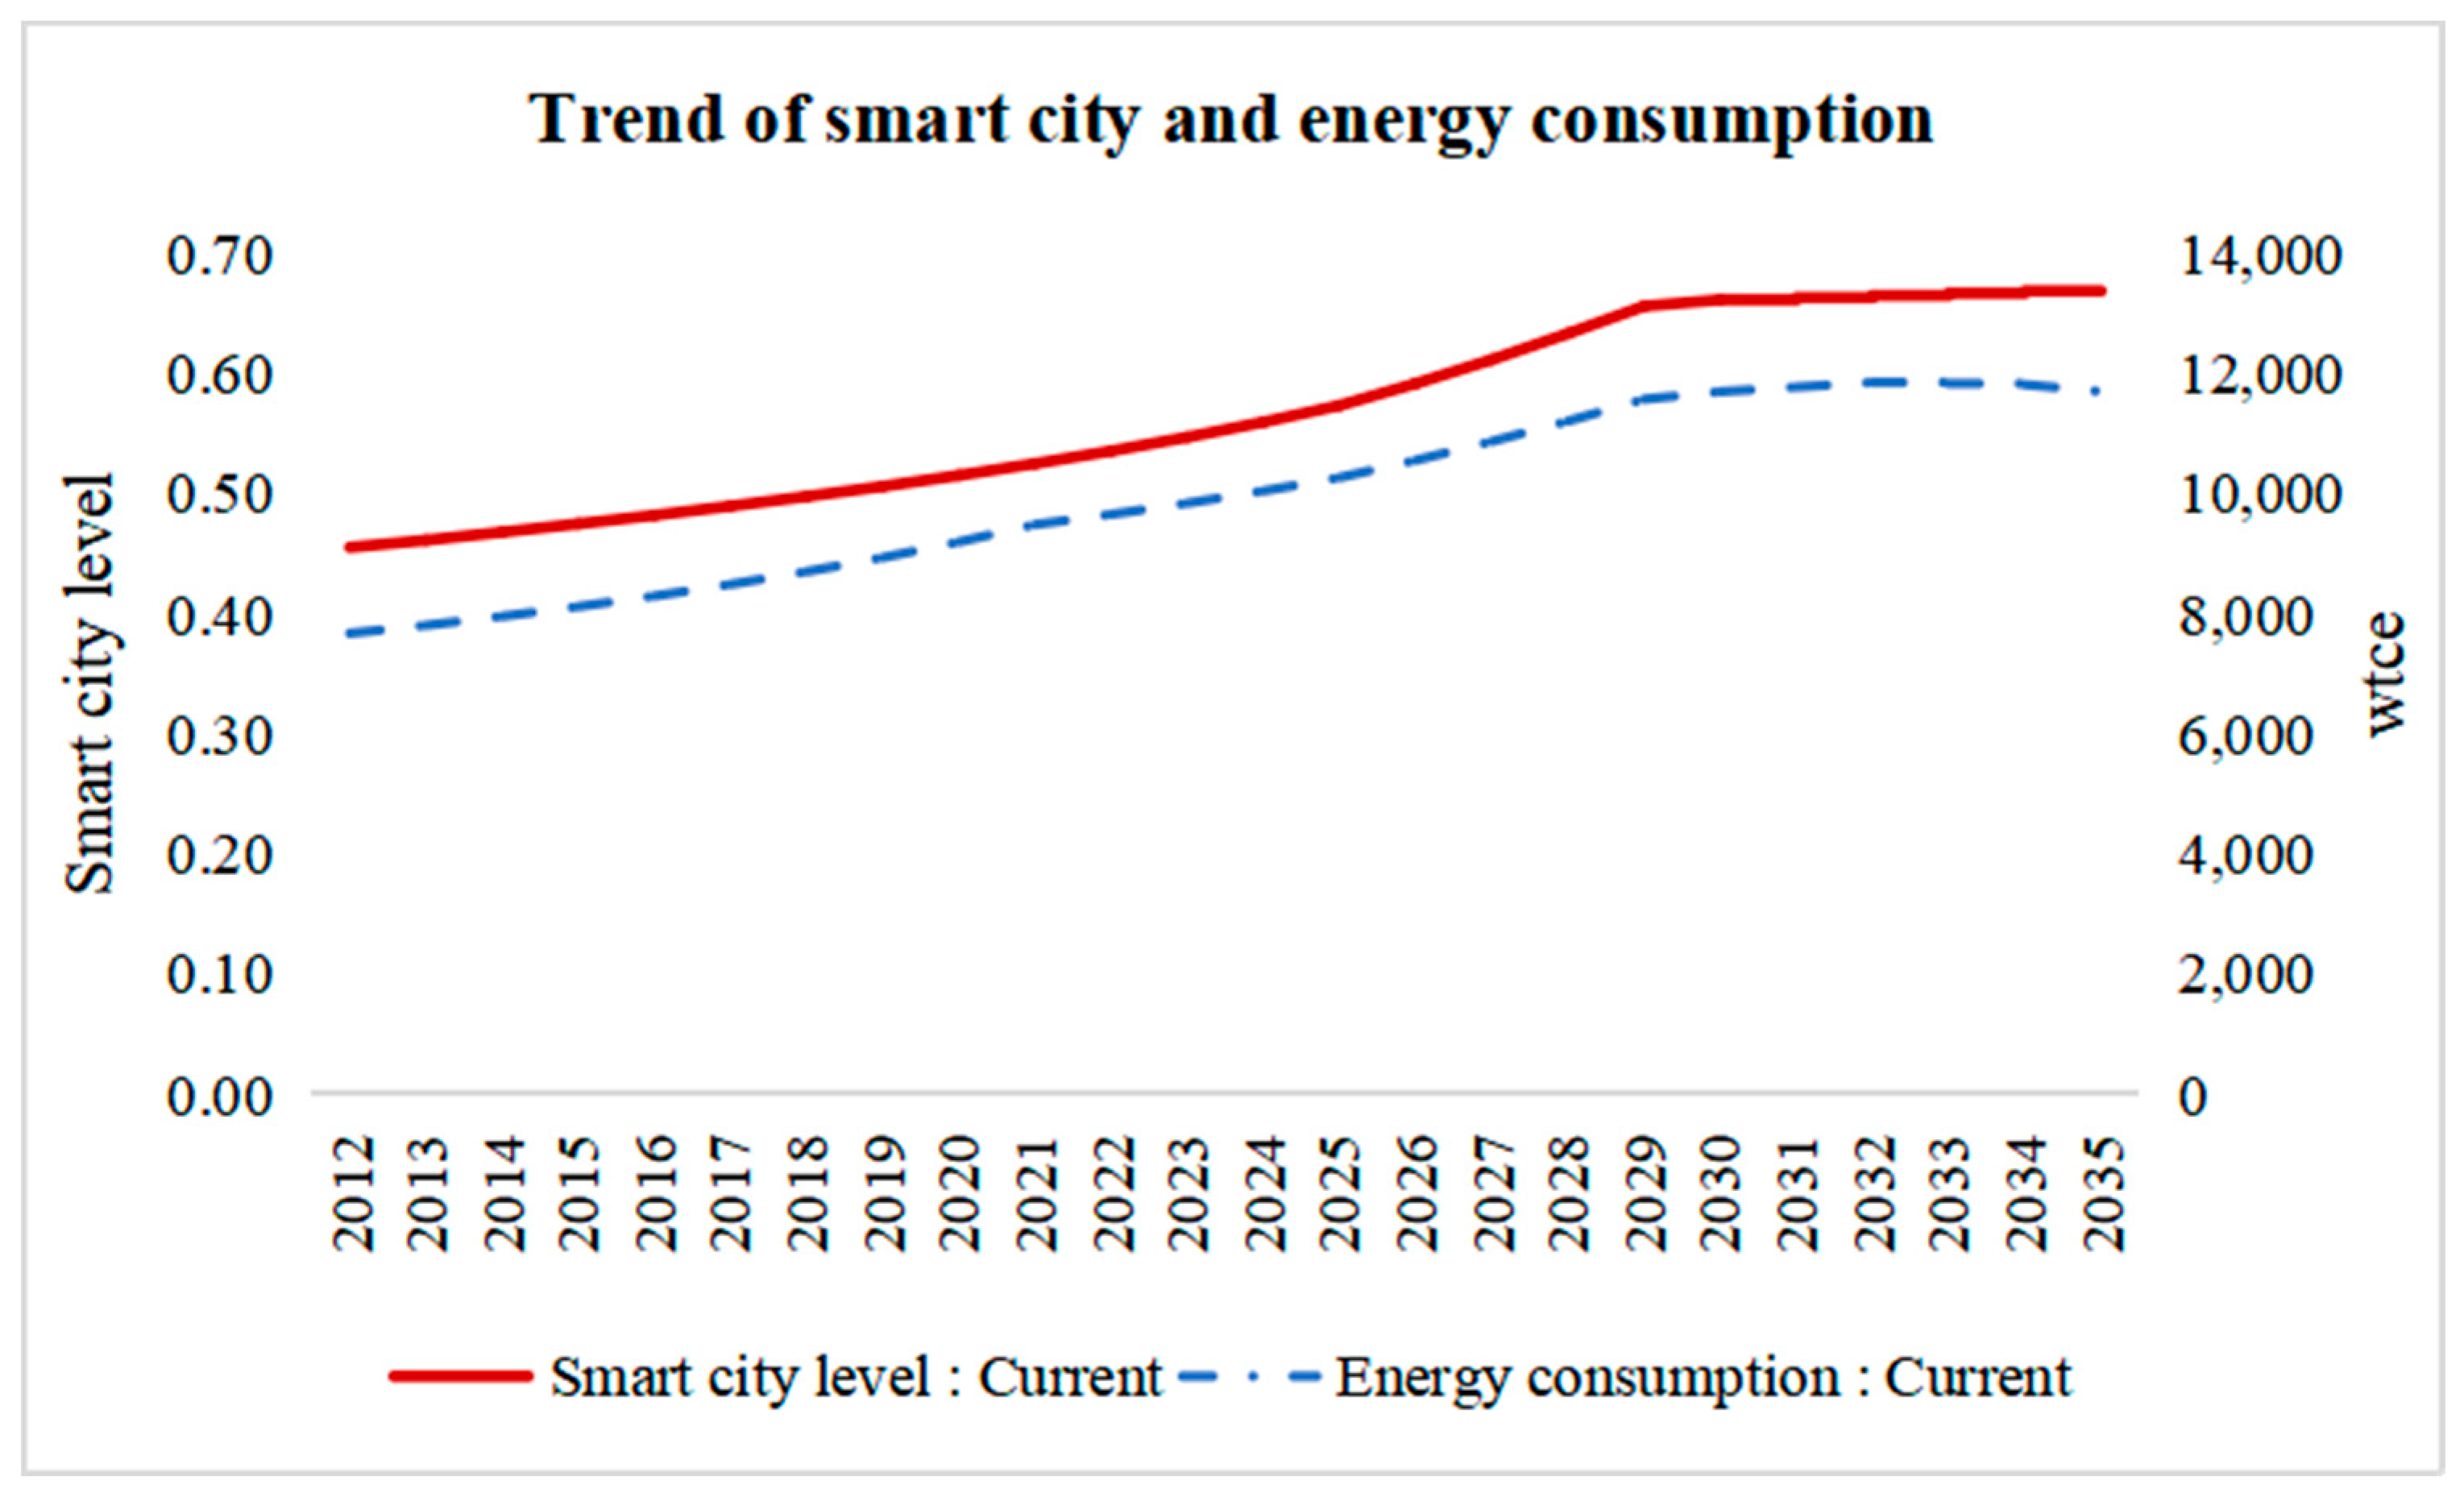
4.3. Relationship between “Smart” and “Green” Development

As we can see in Figure 3, Figure 4, Figure 5, Figure 6, Figure 7 and Figure 8, the trends of smart cities and energy consumption are in synchronization. The energy curve lags behind the smart curve by approximately three years. They all meet their peak at around the early 2030s. The smart city curve horizontally shifts at that point, and energy consumption slightly drops, as shown in Figure 10 below.
That is to say, when the construction period of a smart city finishes, unless there are other intervening factors or circumstances that cause a deviation from the expected pattern, the smart city level will maintain stability for about 5 years. Not until then will its positive effects on energy consumption starts to occur, and until the end of our forecasting period, the influence does not reach its limits. Among the four aspects of smart cities, smart governance and smart living are the main driving forces.

5. Conclusions and Policy Implications

5.1. Conclusions

From the analysis above, the following conclusions can be drawn:
1. Both smart development and energy consumption will experience a growth pattern characterized by an S-shaped curve in megacities. Correspondingly, the urban green development level will experience a “steady-decrease-bottom-increase” process. There are mainly two stages.
Stage one: smart city construction and energy increase. The smart city construction process costs more energy in megacities. Governors used to believe that a smart city can reduce its energy consumption in a short time. But our simulation results show that this is not true. During their construction, smart cities cost more energy, especially in megacities. The reasons for this are, on one hand, smart city requires high-performance infrastructure support, sensors, surveillance devices, data centers, etc., which all cost large amount of power. On a large scale, this is a much bigger problem in megacities than in smaller ones. On the other hand, smart cities rely on the collection, transmission, and processing of big data. Large amounts of data need to be transmitted through networks and processed and analyzed in data centers. These data transmission and processing processes require a significant amount of electrical power, especially when dealing with large-scale cities and massive data volumes. This leads to further increases in energy consumption.
Stage two: smart city construction has been completed and the energy consumption starts to drop. As we can see in the simulation results, when the construction has finished and all the smart city facilities are put into operation, the energy consumption will decline significantly. Seeking quick results is not a good idea here.
2. External factors influence the system in different ways. Economic structure, science and technology investment, and environmental protect investment were considered as external factors in this model. As discussed in Section 4.2, the first two factors both show influences on megacity energy consumption. A higher proportion of tertiary industry in an economic system means an earlier and lower energy peak; a lower proportion of tertiary industry in an economic system leads to a later and higher energy peak. So, during the phase of industrial restructuring, there may be a temporary increase in energy consumption levels, which is considered a necessary cost and a transitional phase for long-term sustainable development. S & T investment rate has similar effects to the industrial structure factor. Environmental protection investment has little influence on energy consumption in megacities.
3. The energy consumption levels in megacities are higher than the national average level. In 2022, the energy consumption was 3.83 tce per capita. The average number in these seven cities was 4.43 tce per capita. And the peak will be 5.51 tce per capita in 2030 and 2031 according to the forecast. The reasons for this might be as follows:
First, high population density: Big cities usually have larger populations concentrated in relatively small areas, which leads to higher population density. The increase in population density will increase the demand for energy, including energy consumption in residential heating, household electricity, transportation, etc. Second, the high degree of urbanization: Big cities are more urbanized and have more businesses, offices, and public facilities, which require a lot of energy to keep them running. Lighting, heating, cooling and other forms of energy consumption in commercial areas and office areas are relatively large. At the same time, large cities also have more transport networks, road lighting, and public transport systems, which also increase energy demand. Third, the diversification of economic activities: Larger cities usually have more economic activities and industrial sectors. These activities involve many fields such as manufacturing, the service industry, the financial industry, the technology industry, etc. These industries usually have high demand for energy. For example, industrial facilities such as factories, office buildings, and large commercial centers consume large amounts of energy. Fourth, the high standard of living: Big cities usually have a higher standard of living, and people’s spending habits may be more luxurious. People may have more electronic devices, household appliances, private cars, and other energy-consuming products, and at the same time, use these devices and services more frequently.

5.2. Policy Implications

Three aspects of policy implications are given.
1. A long-term smart city development plan with phased targets needs to be made, and it is not rational to pursue immediate results. In China, the plan is the guidance for all the tasks. As discussed above, the smart city plays a role in urban green development that starts with restraint and ends with promotion. So, it takes time to meet the “dual carbon” target for megacities.
When a long-term plan is developed, it is necessary to conduct it in stages. It has been ten years since the smart city pilot policy was implemented in the cities studied herein. The policy during that time was to support the smart-city-related industry, construct the infrastructure, and make an early plan. For the next 8 to 10 years, until the early 2030s, the key focus should be integrating the fragmented components, developing up-level applications, and building self-learning organic cities. So, the policy should also put more efforts into encouraging the development of these areas.
After that, the construction process will transition to a maintenance and optimization phase. And correspondingly, the financial investment in smart infrastructure should be tightened and funding for efficiency evaluation should be increased.
With a well-designed long-term plan, smart cities will have better performance in promoting urban green development.
2. To be smart and green, the specificity of megacities should be fully considered. As discussed in Chapter 4, this specificity manifests in the following ways. First, scale and complexity. Megacities have large scales, large populations, vast territories, complex urban systems and infrastructure networks, and large-scale management and operational challenges. Second, data processing and analysis. The huge and diverse amounts of data generated by megacities, including data from sensors, devices, and citizens, require powerful data processing and analysis capabilities to extract useful information and insights. Third, infrastructure requirements. The intelligent construction of megacities requires strong infrastructure support, such as high-speed networks, communication base stations, data centers, etc., to meet large-scale data transmission and processing needs.
So, policies need to encourage multi-agent involvement and regional collaboration. The smart construction of megacities requires the participation and cooperation of the government, enterprises, academia, and social organizations. It is necessary to establish a good cooperation mechanism and sharing platform to achieve resource sharing, information exchange, and collaborative innovation.
Also, it is difficult for megacities to achieve this alone, so regional collaboration is needed. Cities in the same region should share resources, including sharing experiences, technologies, data, and best practices. Different cities can learn from each other, jointly solve problems in smart construction and green development, and avoid redundant construction and wasting resources. And cities can share complementary advantages and industrial cooperation. Through regional synergy, cities can give full play to their respective advantages and characteristics and form complementary industrial layouts and cooperative relationships. For example, one city may have strengths in renewable energy, while another may have unique experience in smart transportation or environmental governance. Through cooperation and coordinated development, the optimal allocation of resources and the complementary development of industries can be realized. Additionally, geographically close cities are able to share infrastructure interconnection and transportation connectivity. Regional coordination promotes the interconnection of urban infrastructure and transportation connectivity. This includes building efficient transportation networks, shared infrastructure, and information platforms to achieve data sharing, service collaboration, and resource integration across cities. This can improve the overall benefits of urban smart construction and green development. Last but not least, cities can share strategic coordination and policy support. Regional synergy can promote strategic coordination and policy support among cities. Cities can jointly formulate and promote consistent policy frameworks and regulations, forming unified standards and guidance to promote the common goal of smart construction and green development. At the same time, through regional cooperation, cities can also obtain more policy support and resource input to accelerate the process of smart construction and green development.
3. Policies should be more inclined toward the field of scientific and technological support. Financial support in the field of environmental protection can temporarily maintain the status quo. Based on our simulation results, increasing science and technology investment shows more obvious control of urban energy consumption. China’s current environmental protection investment is already world-leading, so there is not much potential in this area. Also, the tertiary industry aspect should be promoted.

5.3. Future Work

There are two directions that future research can focus on:
(1)
The scope of the research can be expanded. This research is based on seven megacities in China, but future work could encompass broader objectives beyond China. This research framework holds applicability for all developing countries currently undergoing rapid urbanization processes.
(2)
The scenarios can be further enriched. As indicated in Section 2.1, various factors can influence the level of green development. While this study includes industrial structure, environmental protection investment, and R & D investment, it would also be intriguing to explore additional variables such as population dynamics, policy impacts, and other relevant factors.

Author Contributions

Conceptualization, R.H.; Methodology, R.H.; Software, X.H.; Validation, X.H.; Formal analysis, R.H.; Data curation, X.H.; Writing—original draft, R.H.; Writing—review & editing, X.H.; Visualization, X.H.; Supervision, R.H. All authors have read and agreed to the published version of the manuscript.

Funding

Beijing Municipal Social Science Foundation (19JDGLB027) and Beijing Social Science Fund (20GLA005).

Data Availability Statement

All data used in this research are public. Readers can get access to them on “China City Statistical Yearbook”, city statistical bulletins and official news reporting.

Conflicts of Interest

The authors declare no conflict of interest.

References

  1. Corbusier, L. The City of Tomorrow and Its Planning: The City of Tomorrow and Its Planning; John Wiley & Sons: Malden, MA, USA, 1987. [Google Scholar]
  2. Angelidis, M. Smart green just city actions versus urban planning in European union. Sustain. Dev. Cult. Tradit. J. 2021, 1, 60–80. [Google Scholar] [CrossRef]
  3. Xie, Z.; Wu, R.; Wang, S. How technological progress affects the carbon emission efficiency? Evidence from national panel quantile regression. J. Clean. Prod. 2021, 307, 127133. [Google Scholar]
  4. Pan, J. Scientific planning as the key to new-type of ecologically friendly urbanization. Environ. Prot. 2014, 42, 14–18. [Google Scholar]
  5. Gibson, D.V.; Kozmetsky, G.; Smilor, R.W. (Eds.) The Technopolis Phenomenon: Smart City, Fast Systems, Global Networks; Rowman & Littlefield: Lanham, MD, USA, 1992. [Google Scholar]
  6. Li, F.; Yang, H.; Gao, X.; Han, H. Towards IoT-based sustainable digital communities. Intell. Converg. Netw. 2022, 3, 14. [Google Scholar] [CrossRef]
  7. De Aguiar, C.; Leshed, G.; Pinch, T.; Green, K. Evaluation of communIT, a large-scale, cyber-physical artifact supporting diverse subgroups building community. J. Smart Cities Soc. 2022, 1, 165–178. [Google Scholar] [CrossRef]
  8. Cristiano, E.; Deidda, R.; Viola, F. The importance of green roofs in an urban Water-Energy-Food-Ecosystem nexus context. In EGU General Assembly Conference Abstracts; EGU: München, Germany, 2021. [Google Scholar] [CrossRef]
  9. Otieno, J.P.; Duncan, M.; Oluoch, P. Climate Neutral Icpac (Smart City, Transport & Energy, Software & Data). 2021. Available online: https://www.researchgate.net/publication/354585953_CLIMATE_NEUTRAL_ICPACSMART_CITY_TRANSPORT_ENERGYSOFTWARE_DATA (accessed on 15 January 2022).
  10. Sembiring, M. Smart City Development: Supporting Climate Resilience in Southeast Asia? Non-Traditional Security in the Asia-Pacific. In Non-Traditional Security in the Asia-Pacific: A Decade of Perspectives; World Scientific: Singapore, 2021. [Google Scholar]
  11. Hadidi, L.A.; Rahman, S.M.; Maghrabi, A.T. Smart city—A sustainable solution for enhancing energy efficiency and climate change mitigation in Saudi Arabia. Int. J. Glob. Warm. 2021, 24, 91–107. [Google Scholar] [CrossRef]
  12. Wang, Y.; Jiulin, L.I.; Kangkang, G.U.; Lin, L.U. Optimization of urban green infrastructure network layout based on MSPA-CIRCUIT: Case of Hefei. Acta Ecol. Sin. 2022, 42, 2022–2032. [Google Scholar]
  13. Ou, X.; Lyu, Y.; Liu, Y.; Zheng, X.; Li, F. Integrated multi-hazard risk to social-ecological systems with green infrastructure prioritization: A case study of the Yangtze River Delta, China. Ecol. Indic. 2022, 136, 108639. [Google Scholar] [CrossRef]
  14. Gulsecen, S.; Gezer, M.; Celik, S.; Koolu, F.N. Future needs from the Smart Mega City (SMC) plans smart green city the case of Istanbul. In Sustainable Mega City Communities; Butterworth-Heinemann: Oxford, UK, 2021. [Google Scholar]
  15. Lee, S.H.; Lee, D.W. Smart Convergence—The Future of Green City. J. Digit. Converg. 2012, 10, 233–237. [Google Scholar]
  16. Anthopoulos, L. Evaluating Green Smart City’s Sustainability with an Integrated System Dynamics Model. In Proceedings of the CeDEM Asia 2014: Conference for E-Democracy an Open Government, Hong Kong, China, 4–5 December 2014; MV-Verlag: Greifswald, Germany, 2015. [Google Scholar]
  17. Oad, A.; Ahmad, H.G.; Talpur, M.S.H.; Zhao, C.; Pervez, A. Green smart grid predictive analysis to integrate sustainable energy of emerging V2G in smart city technologies. Optik 2023, 272, 170146. [Google Scholar] [CrossRef]
  18. Qureshi, K.N.; Hussain, R.; Jeon, G. A distributed software defined networking model to improve the scalability and quality of services for flexible green energy internet for smart grid systems. Comput. Electr. Eng. 2020, 84, 106634. [Google Scholar] [CrossRef]
  19. Zhang, X.; Manogaran, G.; Muthu, B. IoT enabled integrated system for green energy into smart cities. Sustain. Energy Technol. Assess. 2021, 46, 101208. [Google Scholar] [CrossRef]
  20. Mukherjee, P.; Patra, S.S.; Pradhan, C.; AL-Amodi, S.; Barik, R.K. Green Energy Powered by Smart Grids: A Business Model for Long Term Sustainability. In Proceedings of the Cyber Technologies and Emerging Sciences: ICCTES 2021, Uttarakhand, India, 17–18 December 2021; Springer: Singapore, 2022. [Google Scholar]
  21. Cao, W.; Zhang, Y.; Qian, P. The effect of innovation-driven strategy on green economic development in China—An empirical study of smart cities. Int. J. Environ. Res. Public Health 2019, 16, 1520. [Google Scholar] [CrossRef]
  22. Tian, H.; Qing, S. Can innovation-driven approaches promote the sustainable economic development of smart cities? Sci. Technol. Prog. Policy 2018, 35, 6–12. [Google Scholar]
  23. Bibri, S.E.; Krogstie, J. Smart sustainable cities of the future: An extensive interdisciplinary literature review. Sustain. Cities Soc. 2017, 31, 183–212. [Google Scholar] [CrossRef]
  24. Silva, B.N.; Khan, M.; Han, K. Towards sustainable smart cities: A review of trends, architectures, components, and open challenges in smart cities. Sustain. Cities Soc. 2018, 38, 697–713. [Google Scholar] [CrossRef]
  25. Martin, C.; Evans, J.; Karvonen, A.; Paskaleva, K.; Yang, D.; Linjordet, T. Smart-sustainability: A new urban fix? Sustain. Cities Soc. 2019, 45, 640–648. [Google Scholar] [CrossRef]
  26. Ahvenniemi, H.; Huovila, A.; Pinto-Sepp, I.; Airaksinen, M. What are the differences between sustainable and smart cities? Cities 2017, 60, 234–245. [Google Scholar] [CrossRef]
  27. Gazzola, P.; Del Campo, A.G.; Onyango, V. Going green vs. going smart for sustainable development: Quo vadis? J. Clean. Prod. 2019, 214, 881–892. [Google Scholar]
  28. Yao, T.; Huang, Z.; Zhao, W. Are smart cities more ecologically efficient? Evidence from China. Sustain. Cities Soc. 2020, 60, 102008. [Google Scholar] [CrossRef]
  29. Viitanen, J.; Kingston, R. Smart cities and green growth: Outsourcing democratic and environmental resilience to the global technology sector. Environ. Plan. A 2014, 46, 803–819. [Google Scholar]
  30. Shi, D. Evolution of industrial development trend under digital economy. China’s Ind. Econ. 2022, 11, 26–42. [Google Scholar]
  31. Jiang, X.; Wang, L. Industrial structure upgrading effect of smart city policy: An empirical study based on multi-period DID. Forum Sci. Technol. China 2021, 12, 31–40. [Google Scholar]
  32. Lichao, W.; Li, W.; Chen, L.; Li, J. The impact of smart city construction on green technology innovation: An empirical study based on panel data of prefecture-level cities. Technol. Econ. 2022, 41, 1–16. [Google Scholar]
  33. Cheng, Z.; Wang, L.; Zhang, Y. Does smart city policy promote urban green and low-carbon development? J. Clean. Prod. 2022, 379, 134780. [Google Scholar]
  34. Huang, H.; Xie, Y.; Li, N. Does Smart City Construction Promote Low-carbon Development? Urban Dev. Stud. 2022, 29, 105–112. [Google Scholar]
  35. Fan, H.; Mi, X. Research on the construction of smart cities and green economy transformation of cities. Urban Probl. 2021, 11, 96–103. [Google Scholar]
  36. Liu, K.; Meng, C.; Tan, J.; Zhang, G. Do smart cities promote a green economy? Evidence from a quasi-experiment of 253 cities in China. Environ. Impact Assess. Rev. 2023, 99, 107009. [Google Scholar] [CrossRef]
  37. Lin, X.; Wang, D. Can smart city construction promote green development—Evidence based on “quasi natural experiment”. Technol. Econ. 2022, 41, 104–113. [Google Scholar]
  38. Filiou, D.; Kesidou, E.; Wu, L. Are smart cities green? The role of environmental and digital policies for Eco-innovation in China. World Dev. 2023, 165, 106212. [Google Scholar]
  39. Tian, H.; Song, Q. Can innovation-driven promote the green development of smart city economy—An empirical analysis based on the panel data of 47 cities in China. Sci. Technol. Prog. Policy 2018, 35, 6–12. [Google Scholar]
  40. Liu, Y.; Li, Q.; Zhang, Z. Do Smart Cities Restrict the Carbon Emission Intensity of Enterprises? Evidence from a Quasi-Natural Experiment in China. Energies 2022, 15, 5527. [Google Scholar]
  41. Du, J.; Wang, Y.; Zhao, A. The Effects and Machanism of Smart City Construction on Urban Green Development. Soft Sci. 2020, 34, 59–64. [Google Scholar]
  42. Zhang, J.; Li, Q. Influence of Smart City Construction on Urban Technology Innovation. Technol. Prog. Policy 2020, 37, 38–44. [Google Scholar]
  43. Wang, K.L.; Pang, S.Q.; Zhang, F.Q.; Miao, Z.; Sun, H.P. The impact assessment of smart city policy on urban green total-factor productivity: Evidence from China. Environ. Impact Assess. Rev. 2022, 94, 106756. [Google Scholar]
  44. Zhang, E.; He, X.; Xiao, P. Does Smart City Construction Decrease Urban Carbon Emission Intensity? Evidence from a Difference-in-Difference Estimation in China. Sustainability 2022, 14, 16097. [Google Scholar]
Figure 1. Keywords in Web of Science database search on smart-green areas.
Energies 16 06395 g001
Figure 2. Authors’ nationalities in smart-green areas.
Energies 16 06395 g002
Figure 3. Framework of this study.
Energies 16 06395 g003
Figure 4. “Smart-green” system model.
Energies 16 06395 g004
Figure 5. Development level of smart city.
Energies 16 06395 g005
Figure 6. Energy consumption trend under industrial structure scenario.
Energies 16 06395 g006
Figure 7. Energy consumption trend under science and technology investment scenario.
Energies 16 06395 g007
Figure 8. Energy consumption trend under environmental protection investment scenario.
Energies 16 06395 g008
Figure 9. The trend of per capita energy consumption.
Energies 16 06395 g009
Figure 10. Trend of smart cities and energy consumption.
Energies 16 06395 g010
Table 1. Main points of view on how smart cities affect green development.
Main IdeaSource
Mechanism testThe increased proportion of science and technology expenditure in financial expenditure promotes the low-carbon development of cities.[31,32,33]
The development of the information industry promotes the upgrading of industrial structure and thus promotes the low-carbon development of cities.[34,35,36]
Promotes urban low-carbon development through technological innovation.[31,37,38]
Promotes urban low-carbon development by optimizing urban resource allocation.[34,39,40]
Reduces the scale of government to offset its impact on green development.[41]
HeterogeneitySmart city construction has a more significant effect on carbon reduction in cities with low financial development levels, high human capital levels, and low export-oriented economy levels.[42]
The effect is more significant in western cities, southern cities, non-environmentally friendly cities, resource-based cities, and non-provincial capital cities.[34,43]
The effect of carbon reduction in underdeveloped cities, megacities, and highly administrative cities is more significant.[33,35,41]
The effect of carbon reduction in cities with obvious economic agglomeration advantages and strict environmental regulations is more significant.[37,44]
Table 2. Data used to build the simulation model.
Smart GovernanceSmart LivingSmart EconomicsSmart Human ResourceGreen Development Level
Auto-Cleaning RatioE-GovernanceInternet CoverageE-Car CoverageIncome of IT EmployeesNumber of IT EmployeesR & D Staff in CollegesNumber of UniversitiesEnergy Consumption
Unit CNY10,000 PeoplePeopleUniversitiesWtce
Beijing20130.90.970.7520.11136,59958.2418,600896723.9
20150.90.970.7650.11159,48668.00719,540906852.6
20170.90.970.80.19183,18377.4420,000927132.8353
20190.90.970.850.19234,12185.913122,000937360.32
20210.90.970.90.08290,03886.523,000927103.617
Tianjin20130.90.950.6130.1102,9223.577440557881.83
20150.920.950.630.12134,3314.35417816558319.38
20170.9210.72120.25151,7785.34648000577831.72
20190.9210.75670.3105144,5106.57288800568240.7
20210.9210.76330.3105157,72579200568205.69
Guangzhou2013110.92030.1120,0009.3917,000805333.57
2015110.49750.1160,00010.052919,000815688.89
2017110.58130.12200,00016.589721,000825961.97
2019110.59330.205220,00022.669523,000836294.2
2021110.60.3433240,0002425,001836575.64
Shenzhen20130.9740.93620.68880.1288100,00012.51600103594.42
20150.9740.93620.47650.1288110,00013.48082100123909.91
201710.93620.58340.25135,00019.24662600124272.64
201910.950.62320.4160,00030.36773000134534.14
202110.950.60290.4809150,000323241154756.67
Chengdu20130.84060.90.49290.052898,00014.5418,6005317,774.57904
20150.84060.90.56250.1034110,00016.983519,5405616,680.10628
20170.84060.90.70670.25130,00031.443220,0005615,448.7
20190.84060.930.76630.3225150,00026.162122,0005916,382.2
20210.90.930.73540.3225170,0003023,0006616,356
Chongqing20130.90.9970.4390.173,59813.9518,100636225.92
20150.90.9970.4830.192,95816.0420,300646924.77
20170.910.55160.1524112,0434.784422,500657251.59
20190.9310.86080.2033131,3564.73624,700657687.25
20210.9310.85420.2951155,067526,900688046.31
Shanghai201310.640.7070.1066153,98949.4318,7656810,890.39
201510.640.7310.2677183,36527.819523,4536710,930.53
201710.730.82840.3212,06330.731225,4786411,381.85
201910.730.71740.4784237,40541.76836,0006411,696.46
202110.730.7150.4784303,5734540,0006411,683.02
Table 3. Scenario settings.
Tertiary-Industry GDP Growth RateEnvironmental Protection Investment RateScience and Technology Investment Rate
HighIF THEN ELSE (“tertiary-industry percentage” <0.7, 0.09, 0.02)China’s target value is 3%.Highest rate is now in Israel, which is 5%.
MediumIF THEN ELSE (“tertiary-industry percentage” <0.7, 0.08, 0.01)Current value of megacities is around 2%.Current rate in seven megacities 2.4%.
LowIF THEN ELSE (“tertiary-industry percentage” <0.7, 0.07, 0.01)Current national value is around 1.5%.Average value for OECD countries in 2019 was 2%.
Disclaimer/Publisher’s Note: The statements, opinions and data contained in all publications are solely those of the individual author(s) and contributor(s) and not of MDPI and/or the editor(s). MDPI and/or the editor(s) disclaim responsibility for any injury to people or property resulting from any ideas, methods, instructions or products referred to in the content.

