Article

Current Pulse-Based Measurement Technique for Zinc–Air Battery Parameters

Department of Modern Mechanics, University of Science and Technology of China, Hefei 230027, China
*
Author to whom correspondence should be addressed.
Energies 2023, 16(18), 6448; https://doi.org/10.3390/en16186448
Submission received: 18 August 2023 / Revised: 4 September 2023 / Accepted: 4 September 2023 / Published: 6 September 2023

Abstract

:
Zinc–air batteries possess advantages such as high energy density, low operational costs, and abundant reserves of raw materials, demonstrating broad prospects for applications in areas like stationary power supplies and emergency power sources. However, despite significant advancements in zinc–air battery technology, a comprehensive measurement model for zinc–air battery parameters is still lacking. This paper utilizes a gas diffusion model to separately calculate the concentration polarization of zinc–air batteries, decoupling it from electrochemical polarization and ohmic polarization, simplifying the equivalent circuit model of zinc–air batteries into a first-order RC circuit. Subsequently, based on the simplified equivalent circuit model and gas diffusion model, a zinc–air battery parameter measurement technique utilizing current pulse methods is proposed, with predictions made for the dynamic voltage response during current pulse discharges. Validation of this method was conducted through single current pulses and step current pulses. Experimental results demonstrate the method’s capability to accurately measure zinc–air battery parameters and predict the dynamic voltage response.

1. Introduction

Among various energy storage systems, batteries are favored for their high energy conversion efficiency and diverse options [1]. Common battery systems include Zn-ion batteries [2], lithium–selenium batteries [3], Li-ion batteries [4], Zn–air batteries [5], and ammonium-ion batteries [6]. Within these battery systems, lithium-ion batteries have achieved tremendous commercial success and are extensively utilized in automobiles and various portable electronic devices [7]. However, lithium-ion batteries have drawbacks such as safety risks and low energy density [8]. More importantly, due to the rapid development of electric vehicles, lithium resources cannot meet the growing demand for large-scale energy storage [9].
Compared to other types of batteries, zinc-based batteries are recognized as one of the most promising battery technologies following lithium-ion batteries, offering advantages such as high energy density, low operational costs, abundant raw material sources, and readily available anode metals [10]. In particular, zinc–air batteries have demonstrated the capability to achieve a peak power of up to 150 mW·cm−2 and an energy density of 912.7 mA·h·g−1, surpassing these values compared to commercially available lithium-ion batteries [11]. As a result, zinc–air batteries exhibit promising applications in areas such as power batteries, stationary power sources, and portable energy supplies.
Currently, the focus in the zinc–air battery research field primarily revolves around material enhancements [12,13] and structural design [14,15], with relatively limited attention given to battery state monitoring. Nonetheless, within the context of batteries, the exigency for management systems to precisely anticipate dynamic battery behaviors and monitor real-time states remains imperative, thereby facilitating timely maintenance and upkeep of the battery systems. In various other battery research domains, a significant number of scholars have put forth models for estimating battery states [16,17,18]. However, in the case of zinc–air batteries, the development of such models is still in its nascent stages.
Battery operational models can be classified into electrochemical models and equivalent circuit models [19]. Electrochemical models emphasize the depiction of internal chemical reactions and particle movements within zinc–air batteries from both macroscopic and microscopic perspectives, by employing a series of partial differential equations [20,21,22]. These models offer precision in describing the battery’s physical state. However, these models are time consuming to compute and require high accuracy of the input parameters, so they are not suitable for direct monitoring of the battery state. The equivalent circuit model employs a set of essential electrical components to predict the behavior of the battery, utilizing these components to describe the electrochemical processes that hold a dominant position within the battery’s interior [23]. Due to its capacity for flexible adjustment as required, the equivalent circuit model is extensively employed in the field of battery state monitoring [24,25,26]. The equivalent circuit model often enhances predictive accuracy by increasing the count of electrical components within the circuit. However, in doing so, while precision is improved, some of the electrical elements within the equivalent circuit may lose their representative physical significance [27].
In this paper, an effective method for measuring zinc–air battery parameters is proposed based on gas diffusion models and equivalent circuit models. This method involves applying pulse current only to the zinc–air battery, significantly reducing the complexity of measuring zinc–air battery parameters. The parameters measured using this method are used to predict the zinc–air battery’s output voltage, and the results are in good agreement with experimental values, thereby validating the method’s effectiveness. These parameters can not only be used to predict the dynamic behavior of zinc–air batteries but also provide reliable data support for battery self-diagnosis and management.

2. Zinc–Air Battery Model

2.1. Electrochemical Model

2.1.1. Electrode Reaction and Theoretical Electric Potential

As depicted in Figure 1, a comprehensive zinc–air battery comprises three integral components: the air electrode, zinc electrode, and electrolyte, as articulated by previous research. Among them, the air electrode interfaces directly with ambient oxygen, while the electrolyte typically assumes an alkaline solution composition.
Oxygen permeates through the micropores of the air electrode and diffuses to the catalytic layer, where it combines with water molecules to form hydroxide ions (OH), a phenomenon integral to the zinc–air battery operation. These hydroxide ions (OH) subsequently migrate through the electrolyte towards the anode, where they engage in a reaction with zinc. During this process, zinc loses electrons and undergoes oxidation to yield zinc oxide. The flow of electrons through the external circuitry to the air electrode establishes a completely closed circuit. The electrochemical reactions at the respective electrodes can be succinctly represented as follows [28]:
Cathode:
O 2 + 2 H 2 O + 4 e 4 OH
Anode:
Z n + 2 OH Z n O + H 2 O + 2 e
Total response:
Z n + 1 2 O 2 Z n O
In accordance with the Nernst equation, the theoretical electromotive force of the zinc–air battery can be expressed as:
E = E O 2 / O H 0 E Zn / Zn O 0 + R T n F ln P O 2 1 2
where E O 2 / O H 0 represents the standard electrode potential of the oxygen electrode, with a designated value of 0.40 V; E Z n / Z n O 0 represents the standard electrode potential of the zinc electrode, with a designated value of −1.25 V; and P O 2 represents the oxygen partial pressure at the electrode’s surface.

2.1.2. Zinc–Air Battery Polarization

The operational mechanism of the zinc–air battery involves electrochemical reactions that yield energy for external utilization. Within this operational paradigm, the battery’s reversible state is perturbed as current flows across its electrodes, leading to a departure of the actual electrode potential from the equilibrium potential, commonly referred to as the theoretical electromotive force. This phenomenon is termed polarization. Based on the origins of polarization, it can be classified into the following three distinct categories [29]:
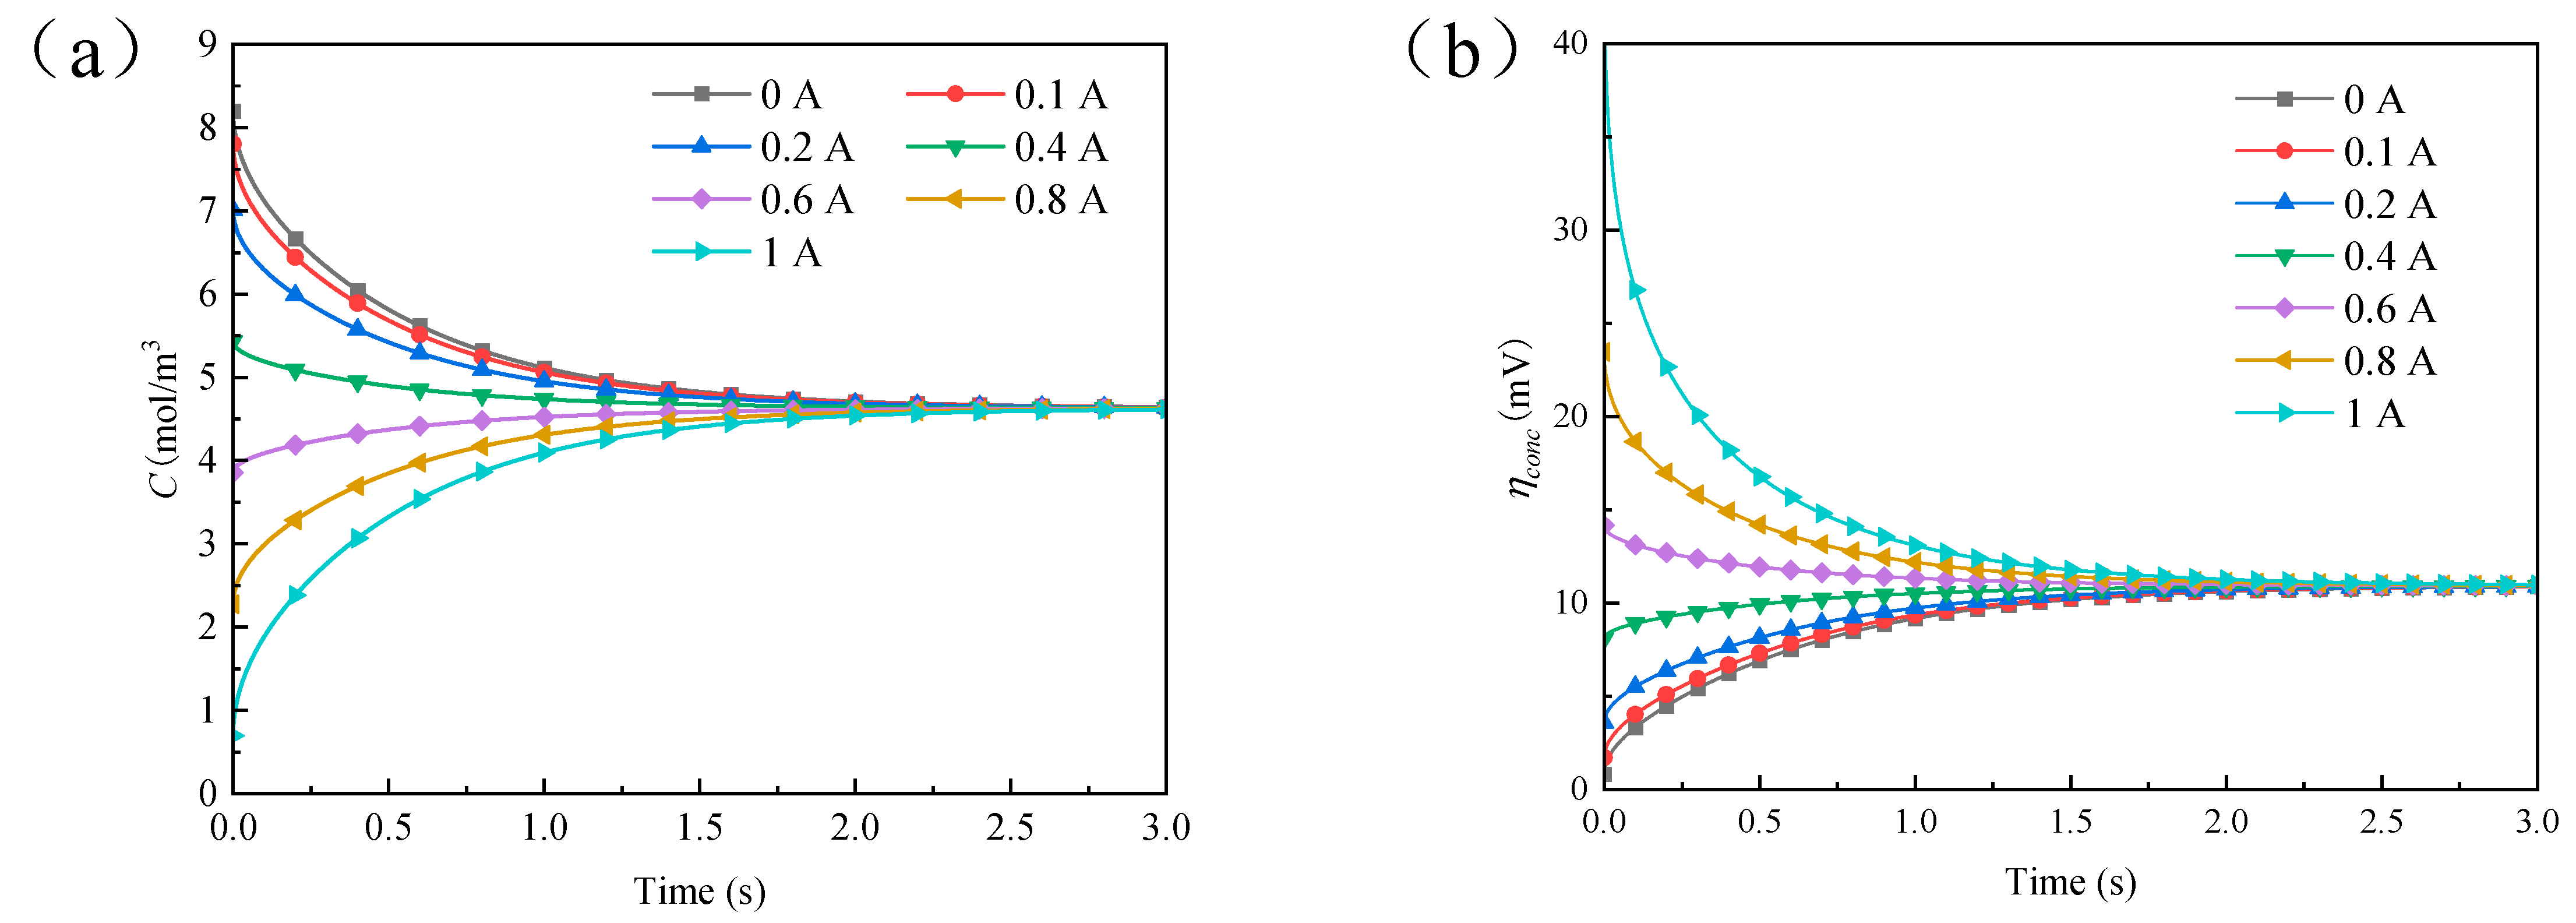
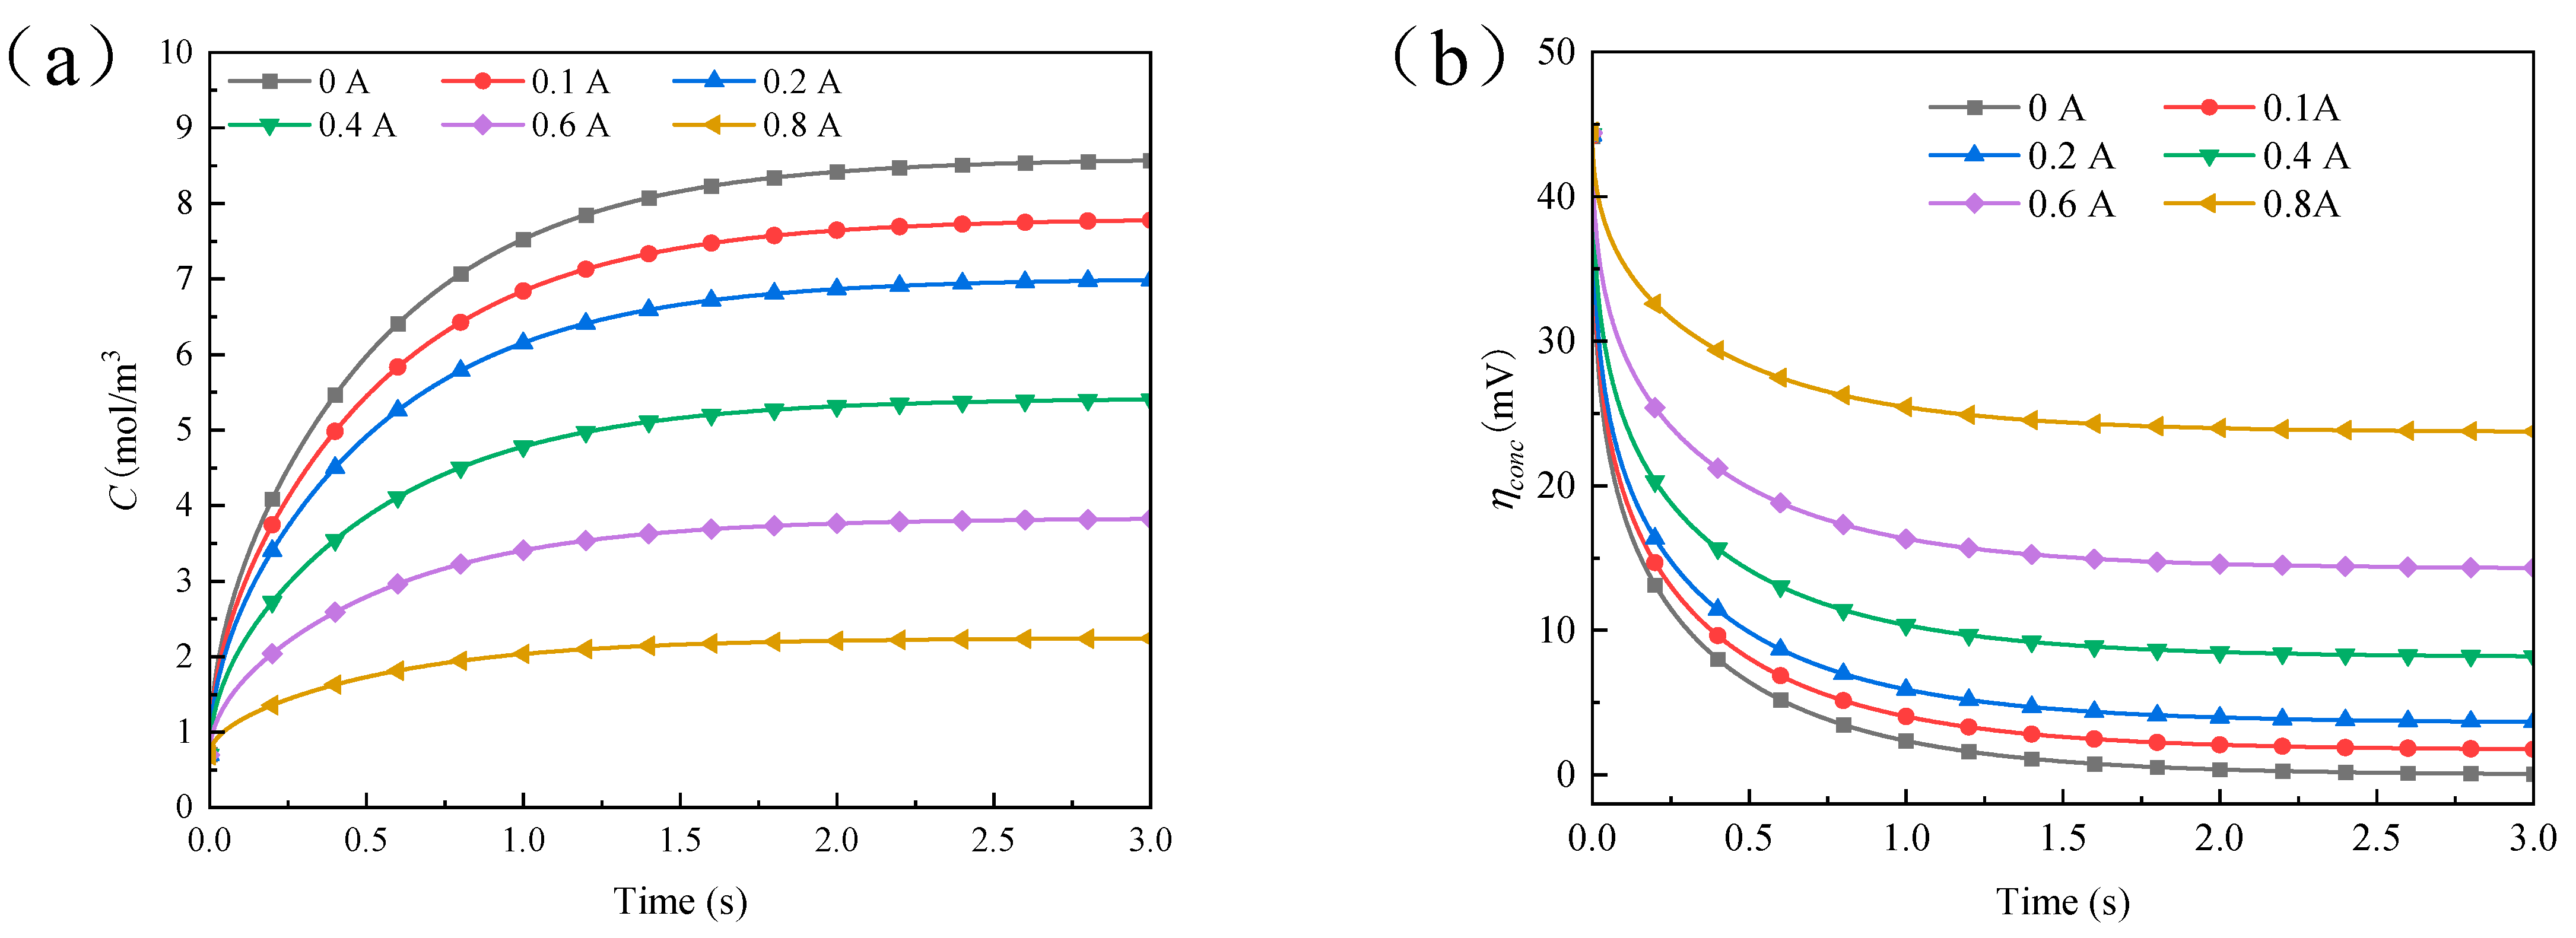
  • Concentration polarization (ηconc): Polarization caused by a decrease in the concentration of reactants on the electrode surface has a response time of seconds due to the fact that the rate of reactant transport in a chemical reaction is less than the rate of reactant consumption. In zinc–air batteries, this can be calculated using the following equation:
η c o n c = R T 4 F 1 + 1 α ln C 0 C *
where R represents the universal gas constant, T represents the temperature, F represents the Faraday constant, α represents the exchange transfer coefficient, C0 represents the concentration of reactants at the external surface of the air electrode, and C* represents the actual concentration of reactants within the catalytic layer of the air electrode in the context of zinc–air batteries;
2.
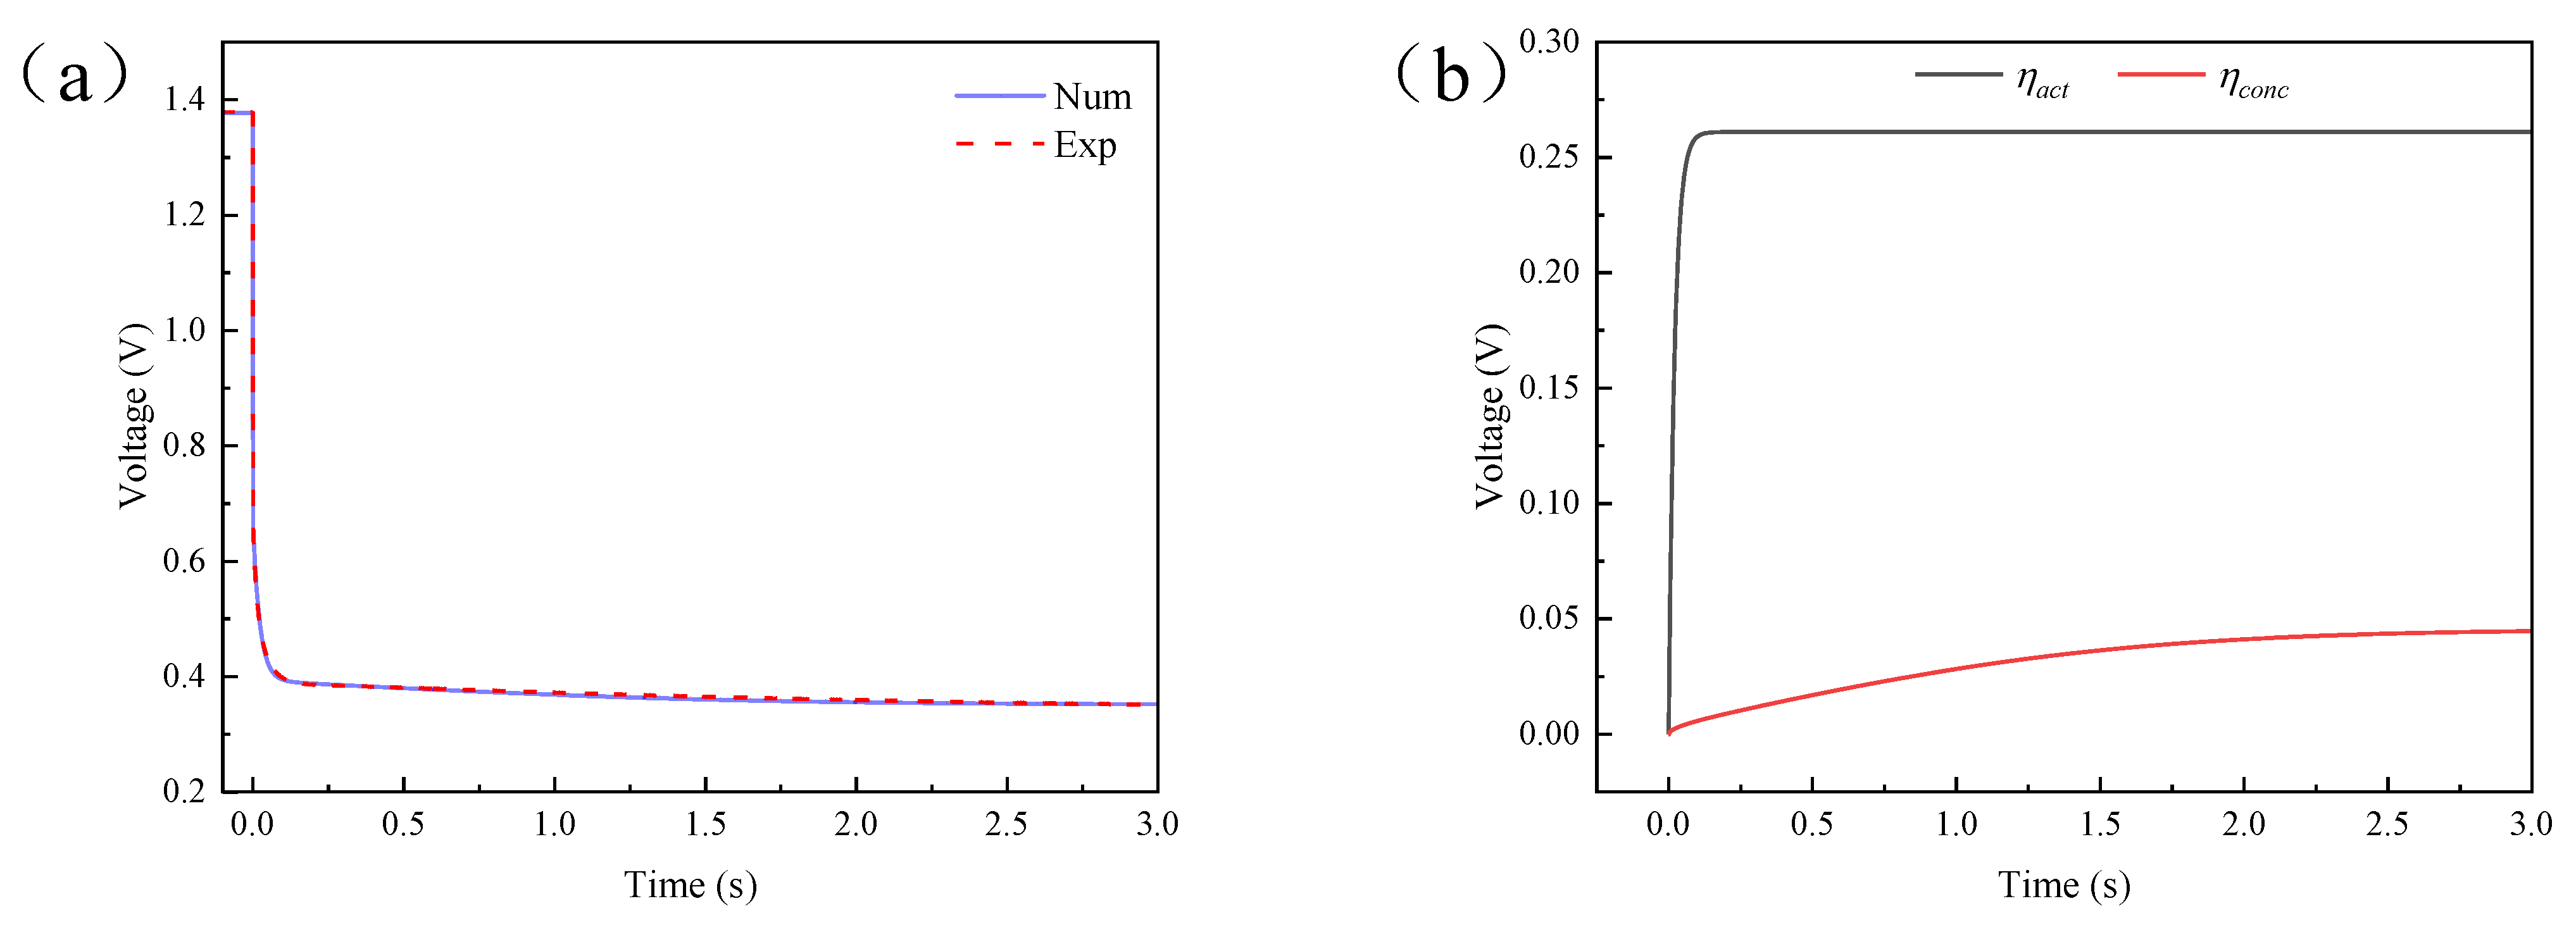
Electrochemical polarization (ηact): Polarization stems from the discrepancy between the electrochemical reaction rate of the cathodic and anodic active materials and the rate of electron mobility. This phenomenon manifests with a response time measured within the microsecond scale;
3.
Ohmic polarization (ηohmic): Polarization due to the electrolyte, electrode material, diaphragm resistance, and contact resistance existing between the various constituent parts occurs instantaneously.

2.1.3. Output Voltage

Polarization phenomena give rise to a reduction in the output voltage of zinc–air batteries below the anticipated theoretical voltage. Consequently, the output voltage of zinc–air batteries can be articulated as the theoretical electromotive force subtracted by the voltage losses incurred due to various polarization effects:
V o u t = E η a c t η o h m i c η c o n c
where Vout is the output voltage and E is the theoretical electromotive force.
During practical operational scenarios, the inherent conductive nature of the electrolyte establishes a conductive pathway between the cathode and anode within the zinc–air battery, resulting in the generation of minute short-circuit currents. This phenomenon leads to a notable reduction in the actual open-circuit voltage of the zinc–air battery in comparison to its theoretical electromotive force. Subsequently, in the following analytical derivations, the present study adopts the open-circuit voltage as a surrogate for the theoretical electromotive force. This substitution yields an expression for the actual output voltage as follows:
V = E O C V η a c t η o h m i c η c o n c
where V is the actual output voltage and EOCV is the open-circuit voltage.

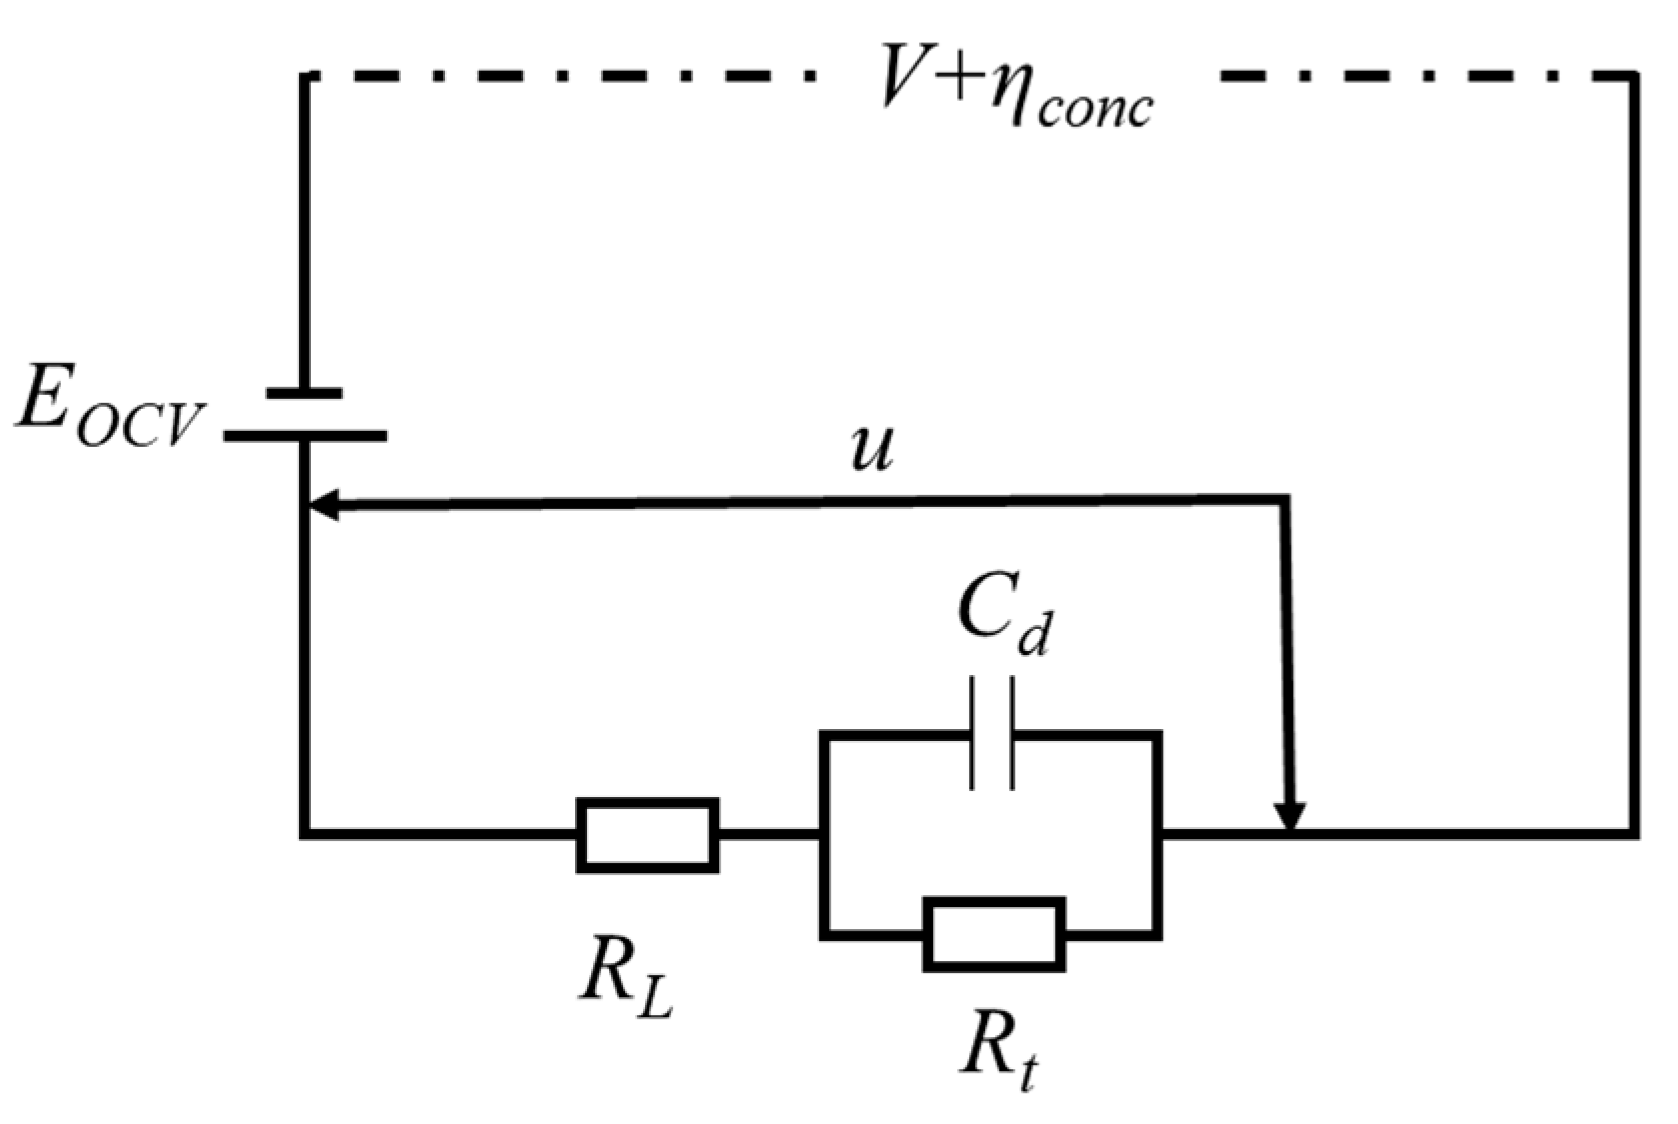
2.2. Equivalent Circuit Model

In zinc–air batteries, the air electrode impedance is usually much larger than the zinc electrode and electrolyte impedance due to the more difficult gas diffusion and chemical reaction process above the air electrode. Chen et al. compared the full-cell equivalent circuit model of zinc–air battery with the electrochemical impedance model neglecting the anode, and the results showed that the simplified model can be applied to the study of air electrodes [30].
In zinc–air batteries, the concentration polarization due to oxygen diffusion at the air electrode can be calculated by a gas diffusion model. In this way, the equivalent circuit diagram of the zinc–air battery only needs to model the electrochemical polarization and ohmic polarization. As shown in Figure 2, the complexity of the equivalent circuit diagram can then be further reduced, and only a first-order RC circuit is needed to predict the dynamic behavior of the zinc–air battery.
In the circuit diagram, Cd is the polarization capacitance, RL is the solution resistance, Rt is the charge transfer resistance, and u is the polarization voltage. The ohmic polarization is characterized by RL, and the electrochemical polarization is jointly characterized by Cd and Rt.
According to the above circuit diagram, the current–voltage relationship can be obtained as follows:
V = E O C V η a c t η o h m i c η c o n c
V = E O C V u η c o n c
u i R L R t + C d d d t u i R L = i
The initial conditions are: u(0) = V0 i(0) = i1 at t = 0.
The boundary conditions are: i(t) = i2 for t > 0.
Solve to get:
u t = i 2 R L + R t 1 e t R t C d + V 0 i 1 R L e t R t C d .
V t = E O C V i 2 R L + R t 1 e t R t C d + V 0 i 1 R L e t R t C d η c o n c
If i1 = 0 and V0 = 0 in the circuit at t = 0, Equation (9) can be morphed into:
V t = E O C V i 2 R L + R t 1 e t R t C d η c o n c

2.3. Gas Diffusion Model

The air electrode of zinc–air batteries is characterized by a design featuring a porous structure. It is assumed that initially, the oxygen concentration is uniform both inside and outside the air electrode. Once a current flows through the zinc–air battery, the oxygen on the surface of the catalytic layer on the inner side of the air electrode is consumed, resulting in decreased concentration. External oxygen begins to diffuse into the interior of the air electrode. Moreover, if an initial concentration gradient exists between the inner and outer sides of the air electrode, even when the operational current of the zinc–air battery is at zero, oxygen will spontaneously diffuse from regions of higher concentration to those of lower concentration.
In order to calculate the variation of oxygen concentration with space and time during the operation of the zinc–air battery, a rectangular area with a thickness of l and a height of infinity is selected to represent the electrode model, as shown in Figure 3. Assuming that the left side of the air electrode is in contact with air, oxygen can freely diffuse through the air electrode into the inside of the zinc–air battery. There is a concentration difference between the oxygen concentration inside and outside the air electrode and the external oxygen concentration remains constant. Oxygen will be consumed by an electrochemical reaction in the catalytic layer. According to Fick’s law and the actual situation, the control equation and the corresponding boundary conditions for the oxygen concentration inside the air electrode are obtained as follows:
C t = D O 2 e f f 2 C x 2 0 < x < l , t 0
where C represents the gas concentration, t represents the time, x represents the distance, and D O 2 e f f represents the effective diffusion coefficient, which is related to the gas species and the properties of the membrane electrode itself.
Based on the gas concentration distribution at the initial time, the initial condition can be deduced as follows:
t = 0 C 0 , t = C 1
Based on the above assumptions and Faraday’s law, the boundary conditions can be deduced as follows:
C x , 0 = C 1 C 1 C 2 l x C x 0 , l = i 4 A s D O 2 e f f F
where: C1 represents the oxygen concentration in the air outside the air electrode, C2 represents the oxygen concentration inside the air electrode, i represents the operating current, As represents the area of the membrane electrode in contact with the air, F represents the Faraday constant, and l represents the membrane thickness.
Since the above equations are non-homogeneous boundary conditions, it is more difficult to solve them. In order to solve the above equation, the boundary conditions are first processed such that:
C x , t = u x , t + v x , t
Assumption:
v x , t = i 4 A s D O 2 e f f F x + C 1
Consequently, the system of equations can be transformed into a homogeneous problem concerning u(x,t):
u t = D O 2 e f f 2 u x 2 u 0 , t = u x l , t = 0 u x , 0 = i 4 A s D O 2 e f f F C 1 C 2 l x 0 < x < l , t 0
The general solution of the equation is obtained as follows:
u x , t = 1 n + 1 2 C 1 C 2 l i 4 A s D O 2 e f f F l n + 1 2 2 π 2 e n + 1 2 2 π 2 l t D O 2 e f f sin n + 1 2 π x l
So, the time–space distribution of gas concentration is as follows:
C x , t = u x , t + v x , t   = Σ 0 1 n + 1 8 C 1 C 2 l i 4 A s D O 2 e f f F l π 2 2 n + 1 2 e 2 n + 1 2 π 2 4 l 2 t D O 2 e f f sin 2 n + 1 π x 2 l i 4 A s D O 2 e f f F x + C 1
According to the solution of the gas diffusion equation mentioned above, we can know that after the operation of the zinc–air battery, the gas concentration distribution in the air electrode will undergo modifications. This alteration is influenced by the initial internal and external gas concentration distribution, as well as the magnitude of the current passing through the electrode surface during the operational process. In the zinc–air battery, the calculation parameters related to the diffusion of oxygen in the air electrode and the consequent concentration polarization are shown in Table 1:
Under stationary conditions, it can be approximated that oxygen is uniformly distributed within the air electrode of the zinc–air battery, with no concentration gradient between the internal and external environments. However, when operational current is applied, oxygen, as a reactant, is rapidly consumed in the inner catalytic layer of the air electrode. As depicted in Figure 4a, within the initial second, oxygen depletion is most rapid, resulting in the most pronounced concentration decrease. After approximately 3 s, the oxygen concentration at the surface of the air electrode’s catalytic layer reaches a new equilibrium. With an increase in operational current, as equilibrium is eventually reached, the oxygen concentration at the surface of the catalytic layer of the air electrode exhibits a non-linear decreasing trend. The greater the current, the more substantial the consumption of oxygen by the air electrode.
Correspondingly, as shown in Figure 4b, with the rapid consumption of oxygen in the catalytic layer, concentration polarization gradually increases from zero. In the initial stages, its growth rate is highest, and as time progresses, the rate of increase gradually slows down. After approximately 3 s, the magnitude of concentration polarization reaches a steady state. Under lower current conditions, it takes only 0.5 s to achieve half the maximum value of concentration polarization. However, under higher current conditions, it takes about 1 s to reach half of the maximum concentration polarization. Furthermore, as the current increases, concentration polarization rises rapidly upon reaching equilibrium, and the larger the current, the greater the extent of concentration polarization increases.
During the actual operational process, the operational current of the zinc–air battery exhibits variable characteristics. In such circumstances, the oxygen concentration within the inner layer of the air electrode and the concentration polarization will alter in response to changes in the operational current. When the operational current of the zinc–air battery decreases, as shown in Figure 5a,b, starting from 1 A and decreasing to various values, the oxygen concentration in the catalytic layer increases rapidly, while the concentration polarization decreases swiftly, ultimately reaching a stable state.
When the operational current of the zinc–air battery transitions from varying magnitudes to an identical value, as shown in Figure 6a,b, shifting from different initial operational currents to 0.5 A, under circumstances where the initial operational current surpasses 0.5 A, the oxygen concentration on the surface of the air electrode’s catalytic layer increases, leading to a reduction in concentration polarization. Conversely, when the initial operational current is below 0.5 A, the oxygen concentration on the surface of the air electrode’s catalytic layer decreases, resulting in an increase in concentration polarization. However, after a period of operation, regardless of the initial operational current’s magnitude, the oxygen concentration and concentration polarization on the surface of the air electrode will converge to a stable state. Moreover, in the final equilibrium state, all oxygen concentrations and concentration polarizations on the surface of the air electrode’s catalytic layer will remain consistent.

3. Experimental Section

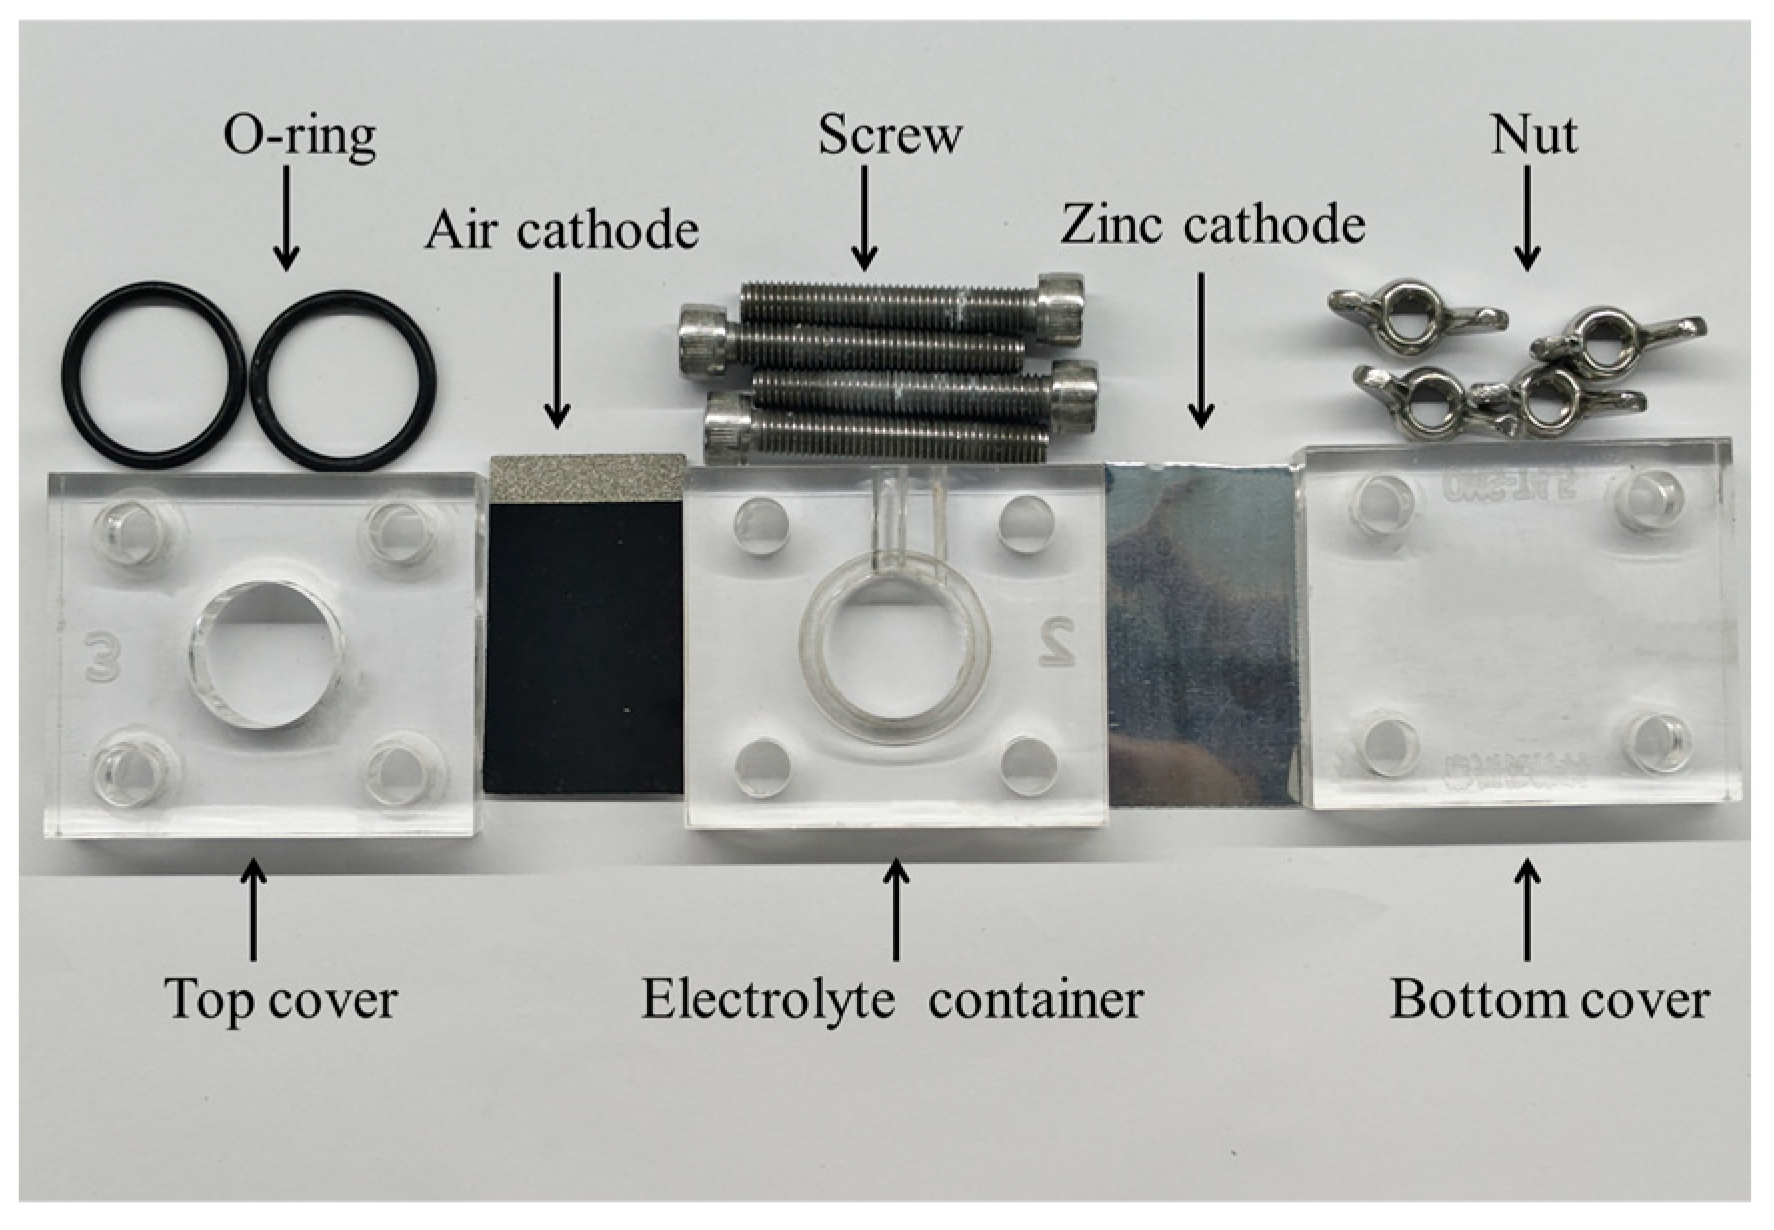
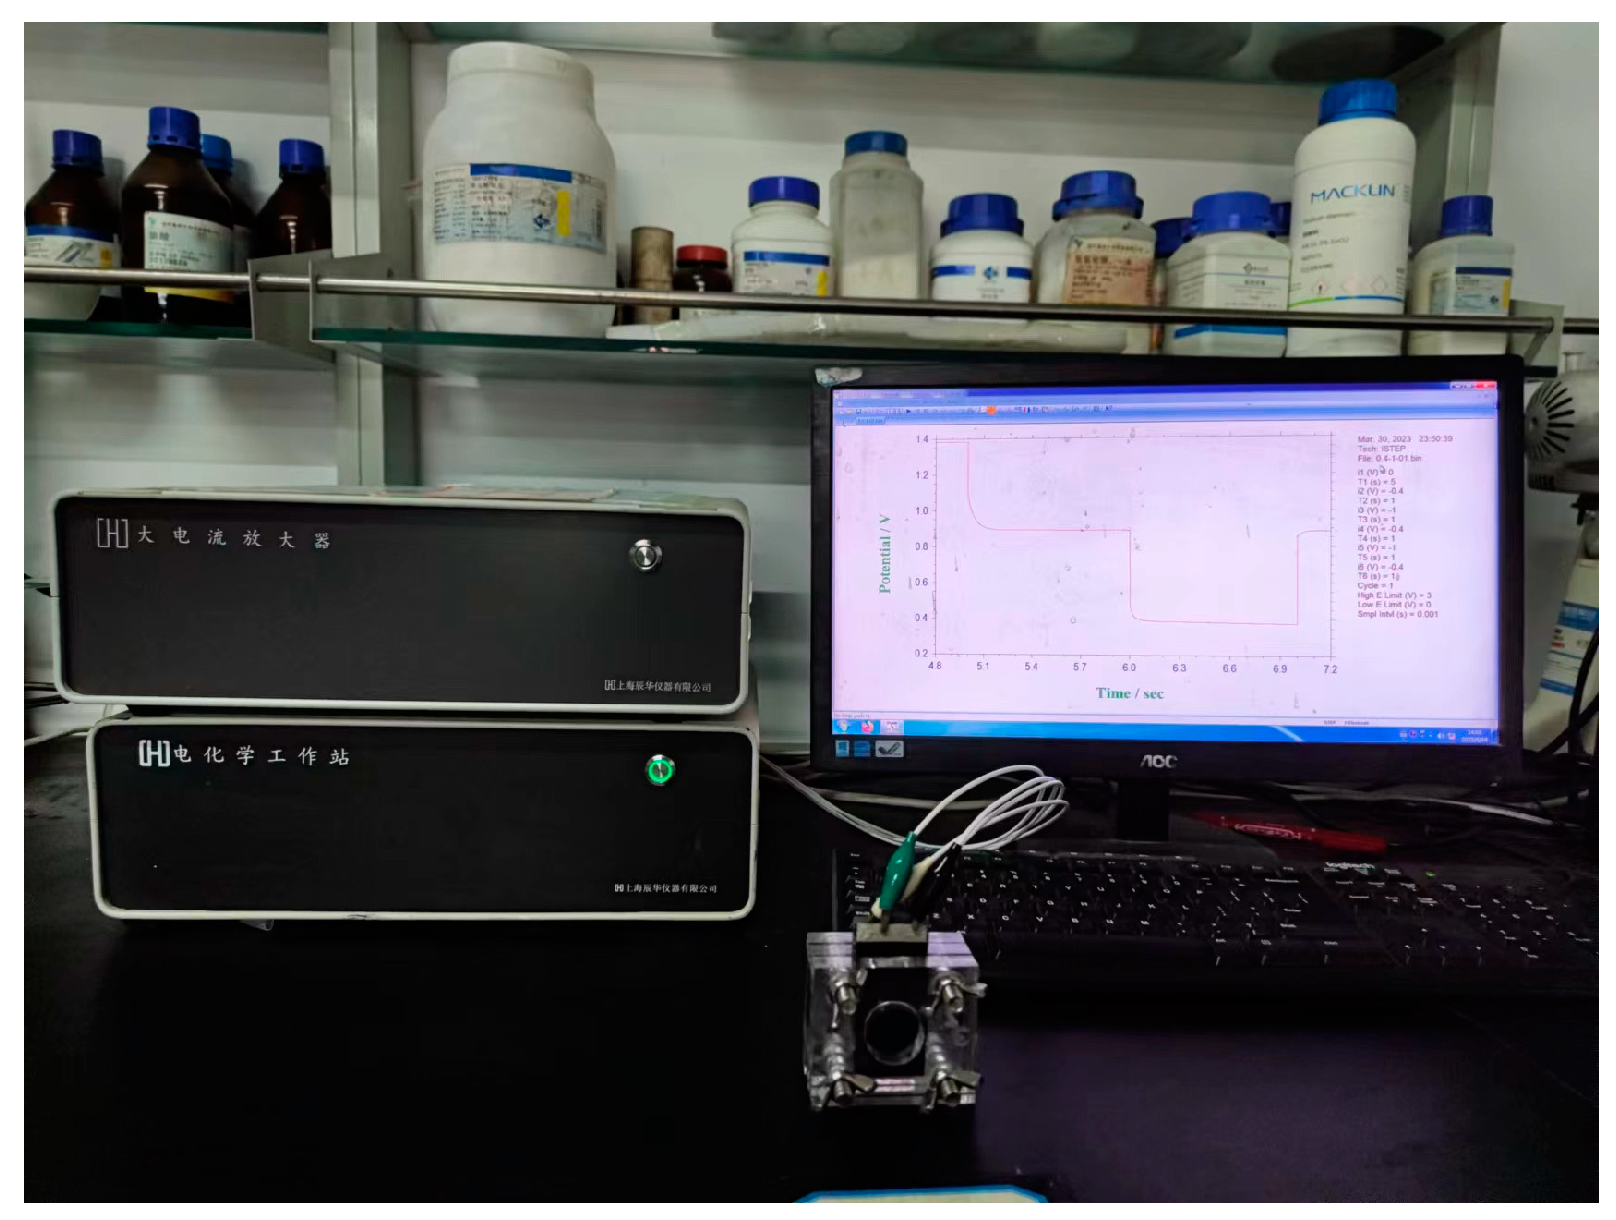
3.1. Experimental Setup

To record the dynamic voltage response of zinc–air batteries to current pulses, the experimental setup in this study comprises a zinc–air battery, an electrochemical workstation (CHI 660D, Shanghai Chenhua, Shanghai, China), and a computer (Win7). The structural diagram of the zinc–air battery test apparatus (Changzhou Youteke New Energy Technology Co., Ltd., Changzhou, China) is illustrated in Figure 7, with a width of 7 cm, height of 6 cm, reaction area of 4.5 cm2, and an electrolyte loading capacity of 6 mL. The negative electrode material is a 0.5 mm thick, 99.9% pure zinc plate, while the positive electrode material consists of a self-prepared air electrode with a Co-N-C catalyst. The electrolyte is a 33% KOH solution. During the battery assembly process, assembly is carried out sequentially from left to right. The O-ring is placed in the groove of the electrolyte container, the positive and negative electrodes are clamped with plates, and finally, the assembly is secured using bolts.
The primary responsibility of the electrochemical workstation is to apply pulsed current to the zinc–air battery and measure its output voltage, while the computer’s main role is to control the electrochemical workstation’s operation and record measurement data. The temperature was maintained at 25 °C throughout the experimental process. The physical diagram of the experimental system is shown in the Figure 8:

3.2. Experimental Operation

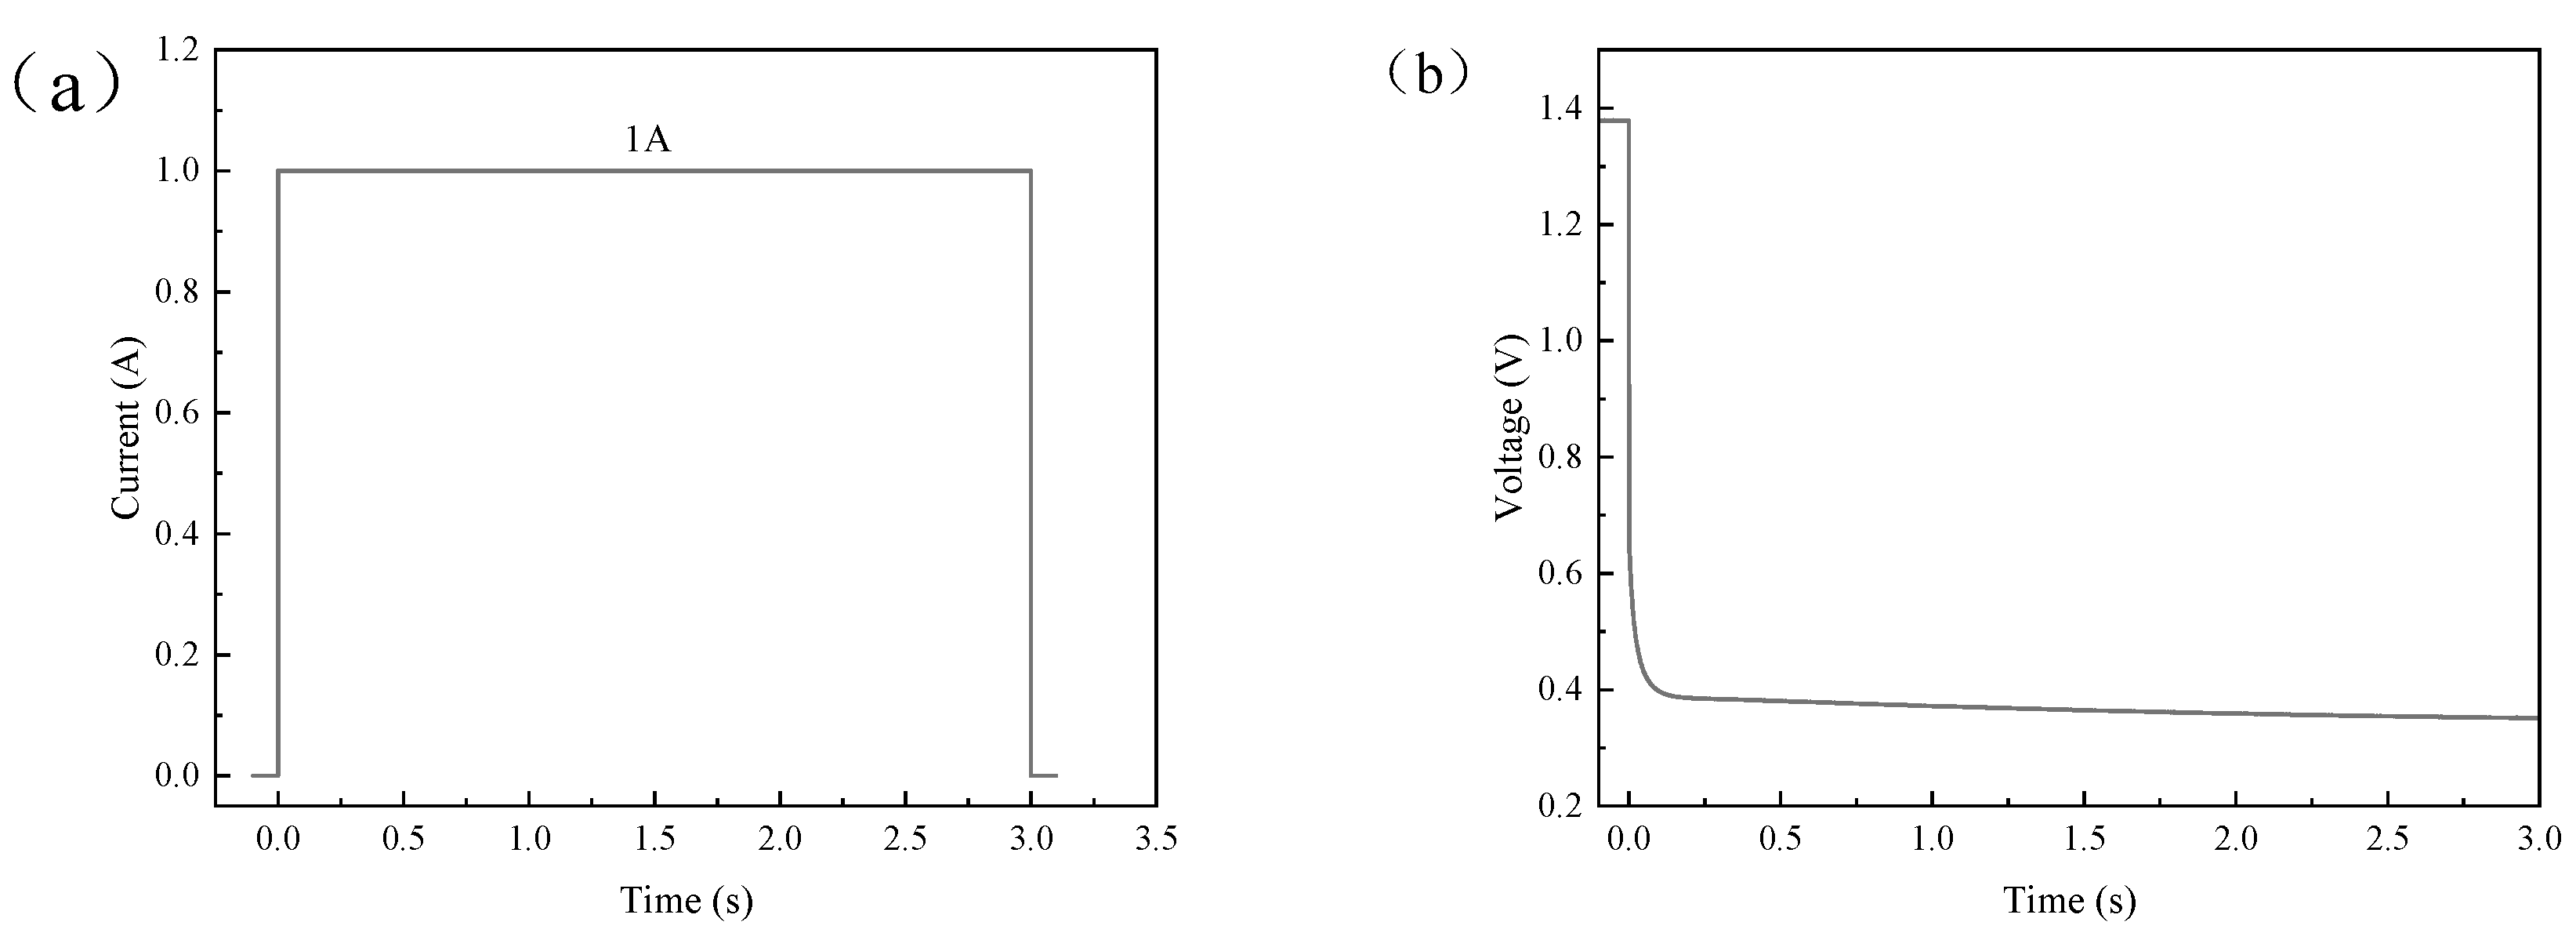
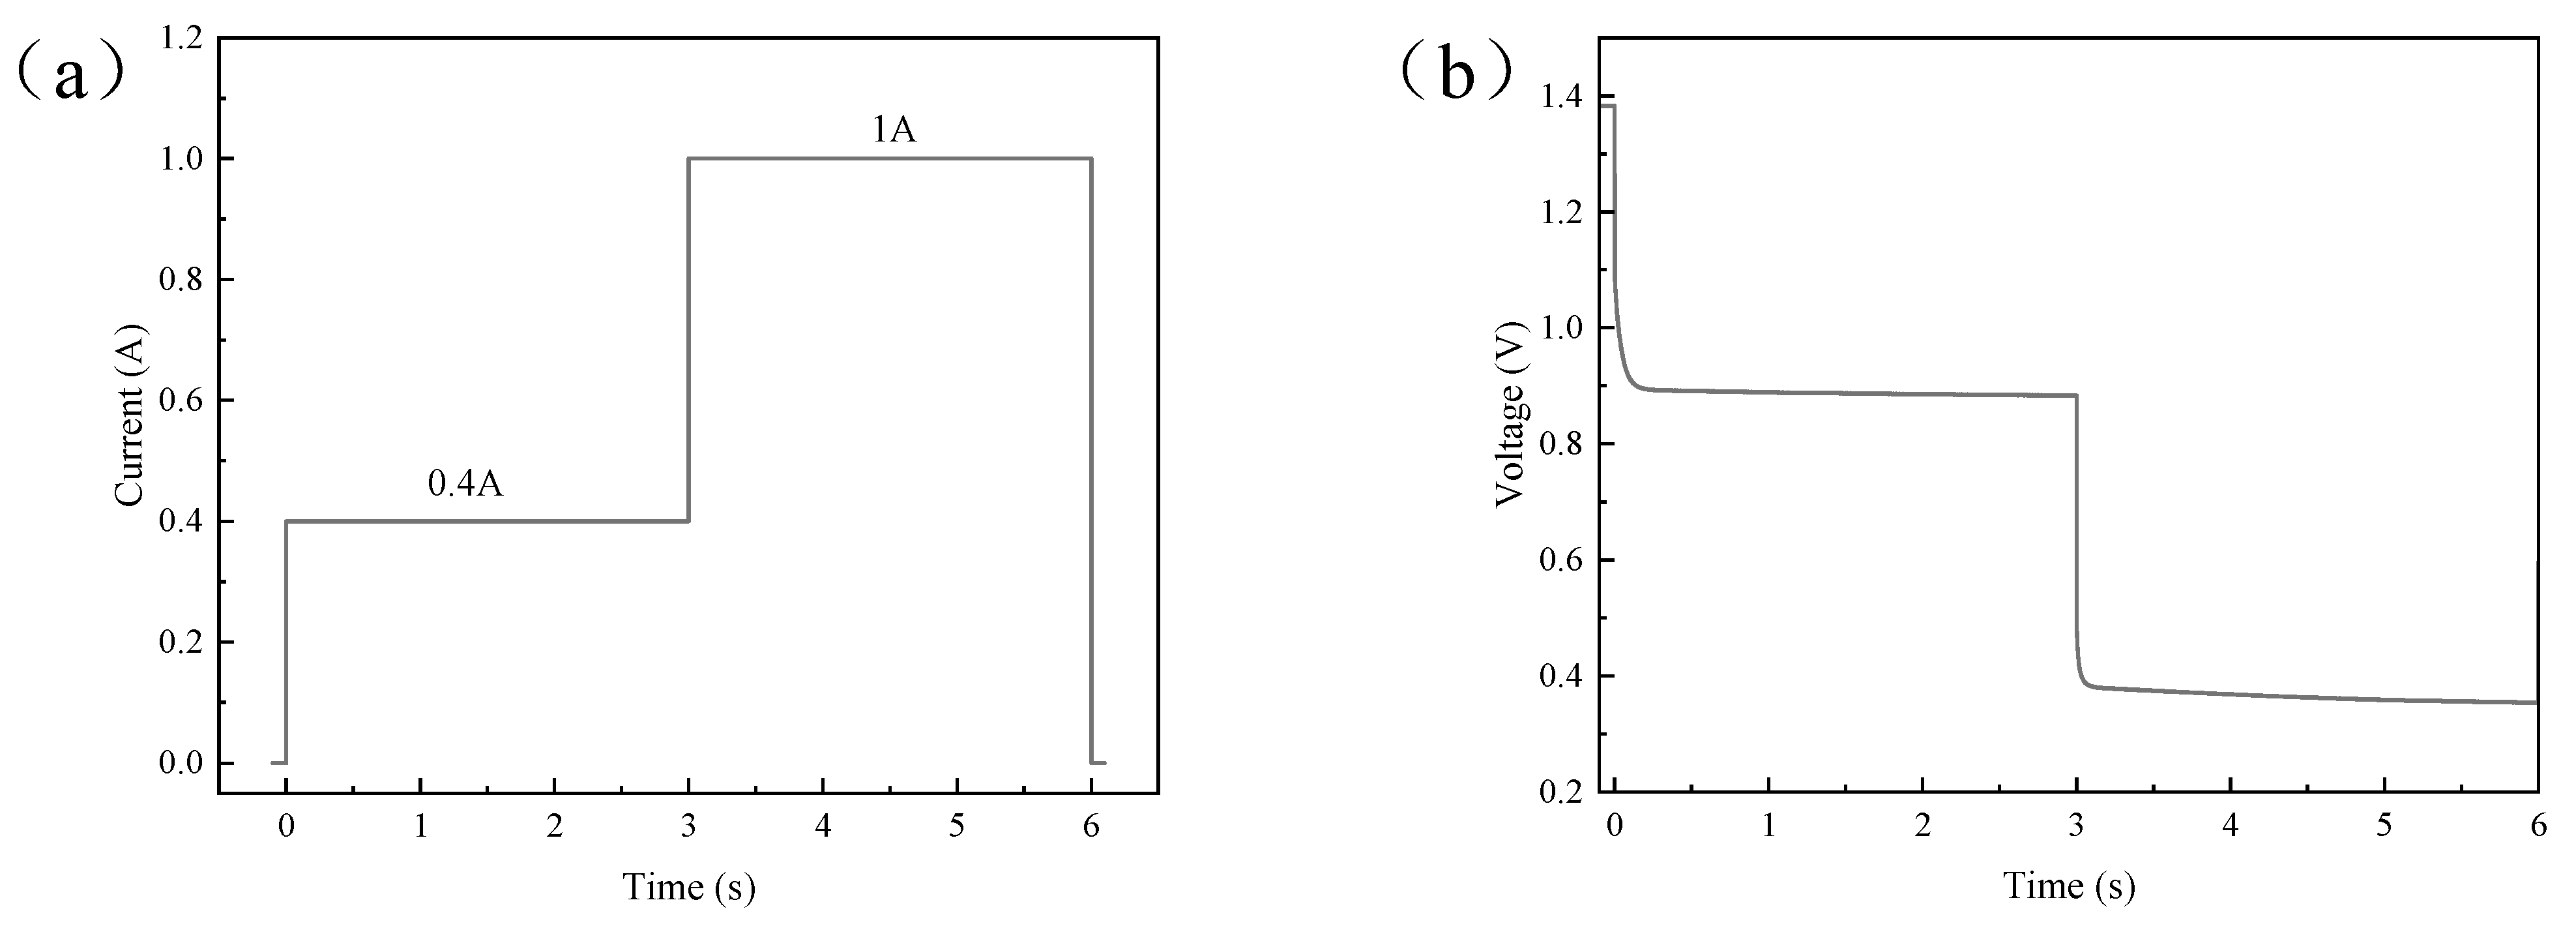
3.2.1. Single Current Pulse

At the beginning of the experiment, the current on the air electrode is maintained at zero by controlling the circuit to open. Subsequently, the working current on the air electrode is rapidly increased to 1 A and maintained for 3 s. Finally, remove the working current and record the output voltage changes of the zinc–air battery during this process. The images of current and output voltage variation with time are shown in Figure 9.

3.2.2. Step Current Pulses

At the beginning of the experiment the circuit is controlled to open while maintaining the current on the air electrode at zero. Subsequently, the working current on the air electrode is rapidly increased to 0.4 A and maintained for 3 s. Then, the working current on the air electrode continues to increase from 0.4 A to 1 A and is maintained for 3 s. Finally, the working current is removed and the battery’s output voltage during this process is recorded. The images of current and output voltage variation with time are shown in Figure 10.

4. Results and Discussion

4.1. Calculation of Zinc–Air Battery Parameters

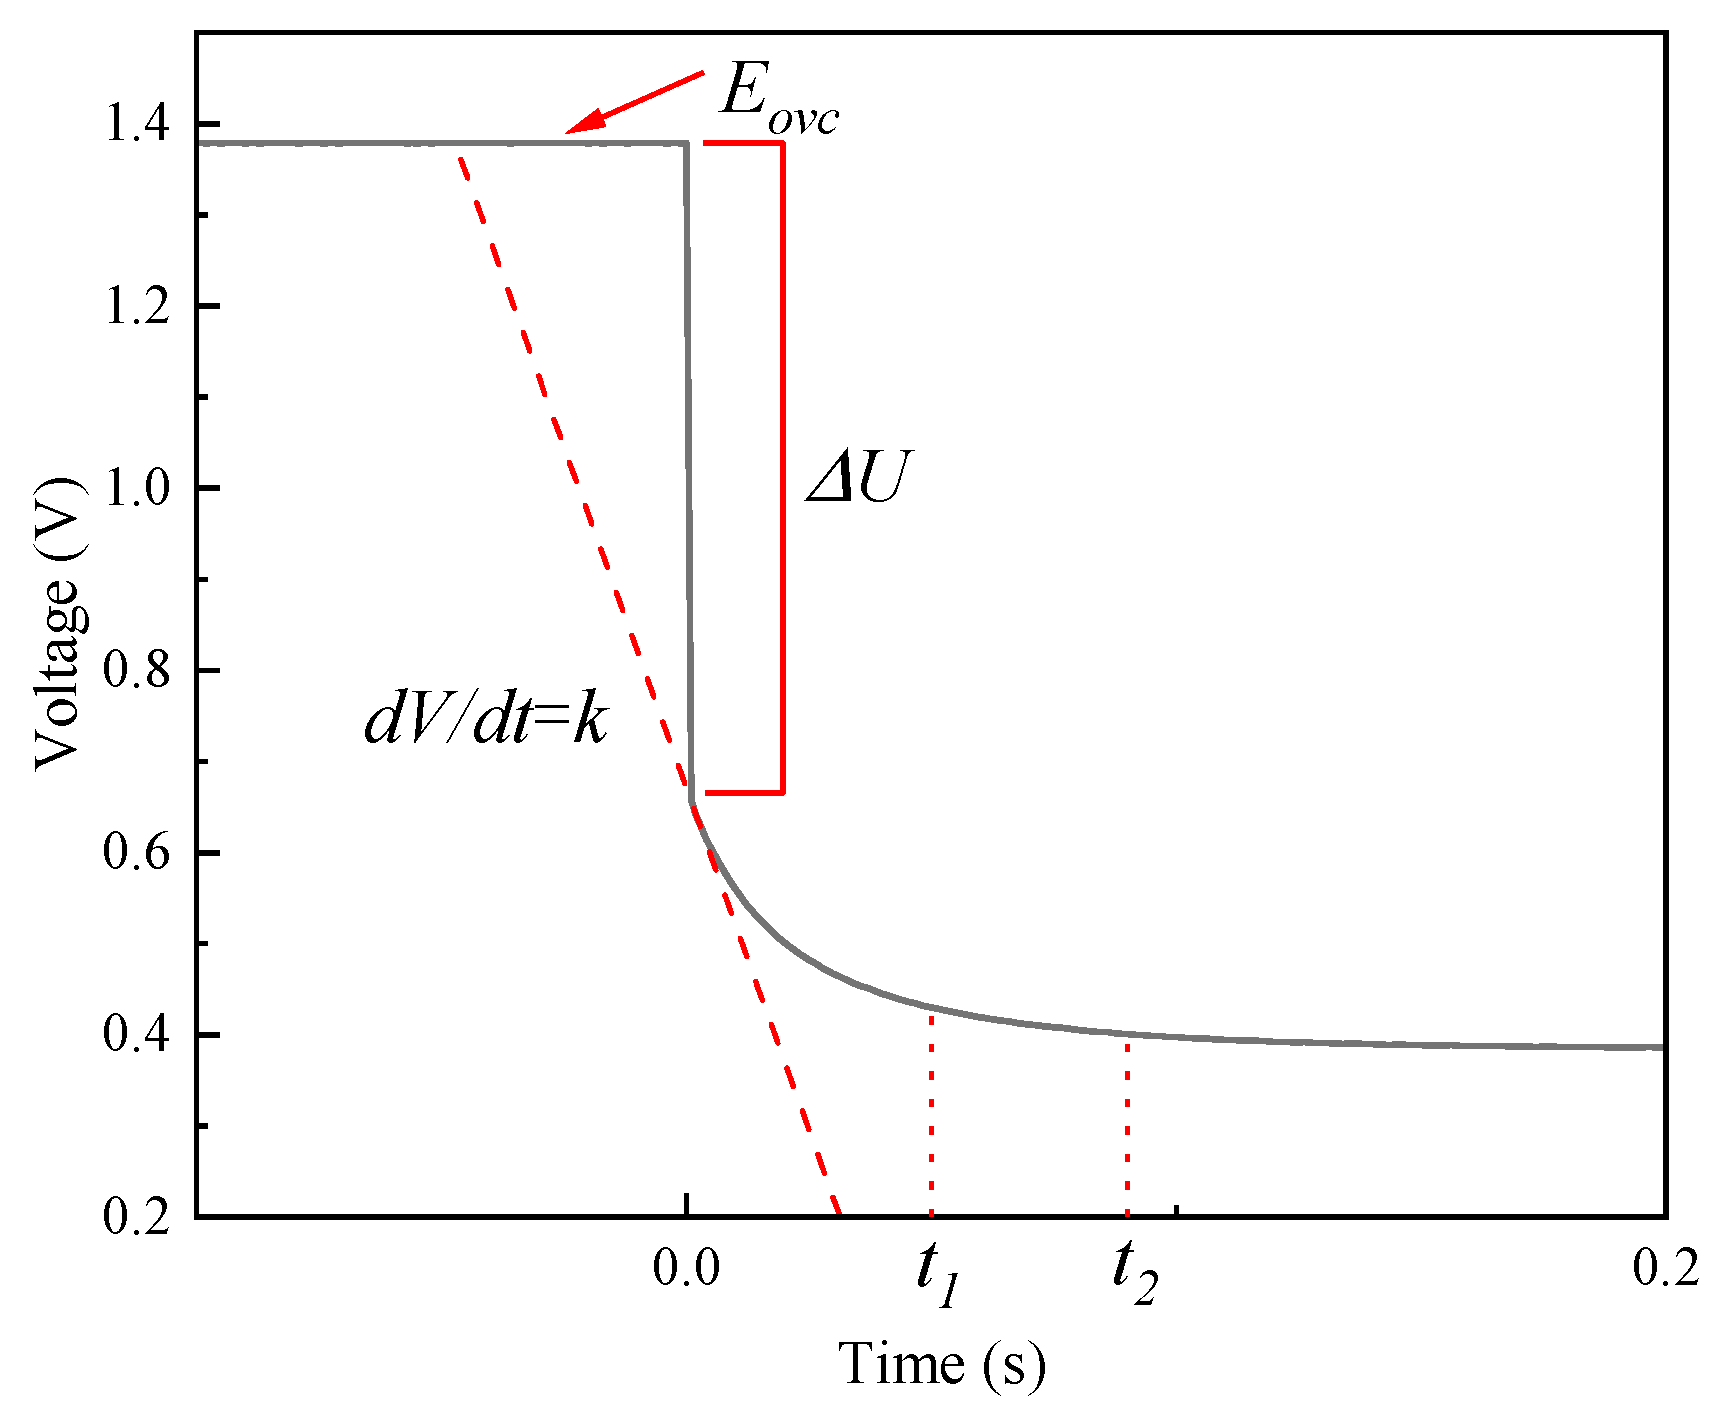
4.1.1. Calculation of Circuit Parameters

Upon applying a pulsed current to the zinc–air battery, a voltage–time curve representing the battery output is obtained. The parameters of the electrical components in the equivalent circuit can be obtained by analysing this curve by the asymptotic simplification method as shown in Figure 11. The specific calculation procedure is as follows:
(1) Solution resistance RL
Upon energizing the circuit, the output voltage experiences a rapid step decrease. Taking the limit of Equation (13) at the initial moment yields the following result:
R L = Δ U t 0 i
(2) Charge transfer resistance Rt
After a zinc–air battery suddenly applies a higher current from an open-circuit state, the oxygen at the surface of the air electrode’s catalytic layer begins to be consumed, leading to a gradual increase in concentration overpotential from zero. However, at an instantaneous moment (t < 0.1 s), due to the relatively small consumption of oxygen, the change in concentration overpotential is insignificant and can be approximately ignored. In the scenario where the influence of concentration overpotential is not considered, the output voltage of the zinc–air battery can be expressed as:
V t = E O C V i 2 R L + R t 1 e t R t C d
In the initial stage of the voltage curve, select two time points, t1 and t2 (t2 < 0.1 s), so that the time interval of the second time point is exactly twice that of the first time point:
t 2 = 2 t 1
Substituting Equation (20) gives:
V t 1 = E O C V i 2 R L + R t 1 e t 1 R t C d
V t 2 = E O C V i 2 R L + R t 1 e t 2 R t C d
Moving the first two terms from the right side of Equations (25) and (26) to the left and dividing, results in:
1 + e t 1 R t C d = E O V C V t 1 i 2 R L E O V C V t 1 i 2 R L
Substituting (27) back into (25) and solving, we obtain:
R t = E O V C V t 1 i 2 R L 2 i 2 E O V C + V t 2 V t 1 i 2 R L
(3) Polarization capacitance Cd
According to Equation (23), taking the derivative of the output voltage yields:
d V d t = i 2 C d e t R t C d
Taking the limit of Equation (29) at the initial moment yields Cd:
C d = i 2 d V d t t 0

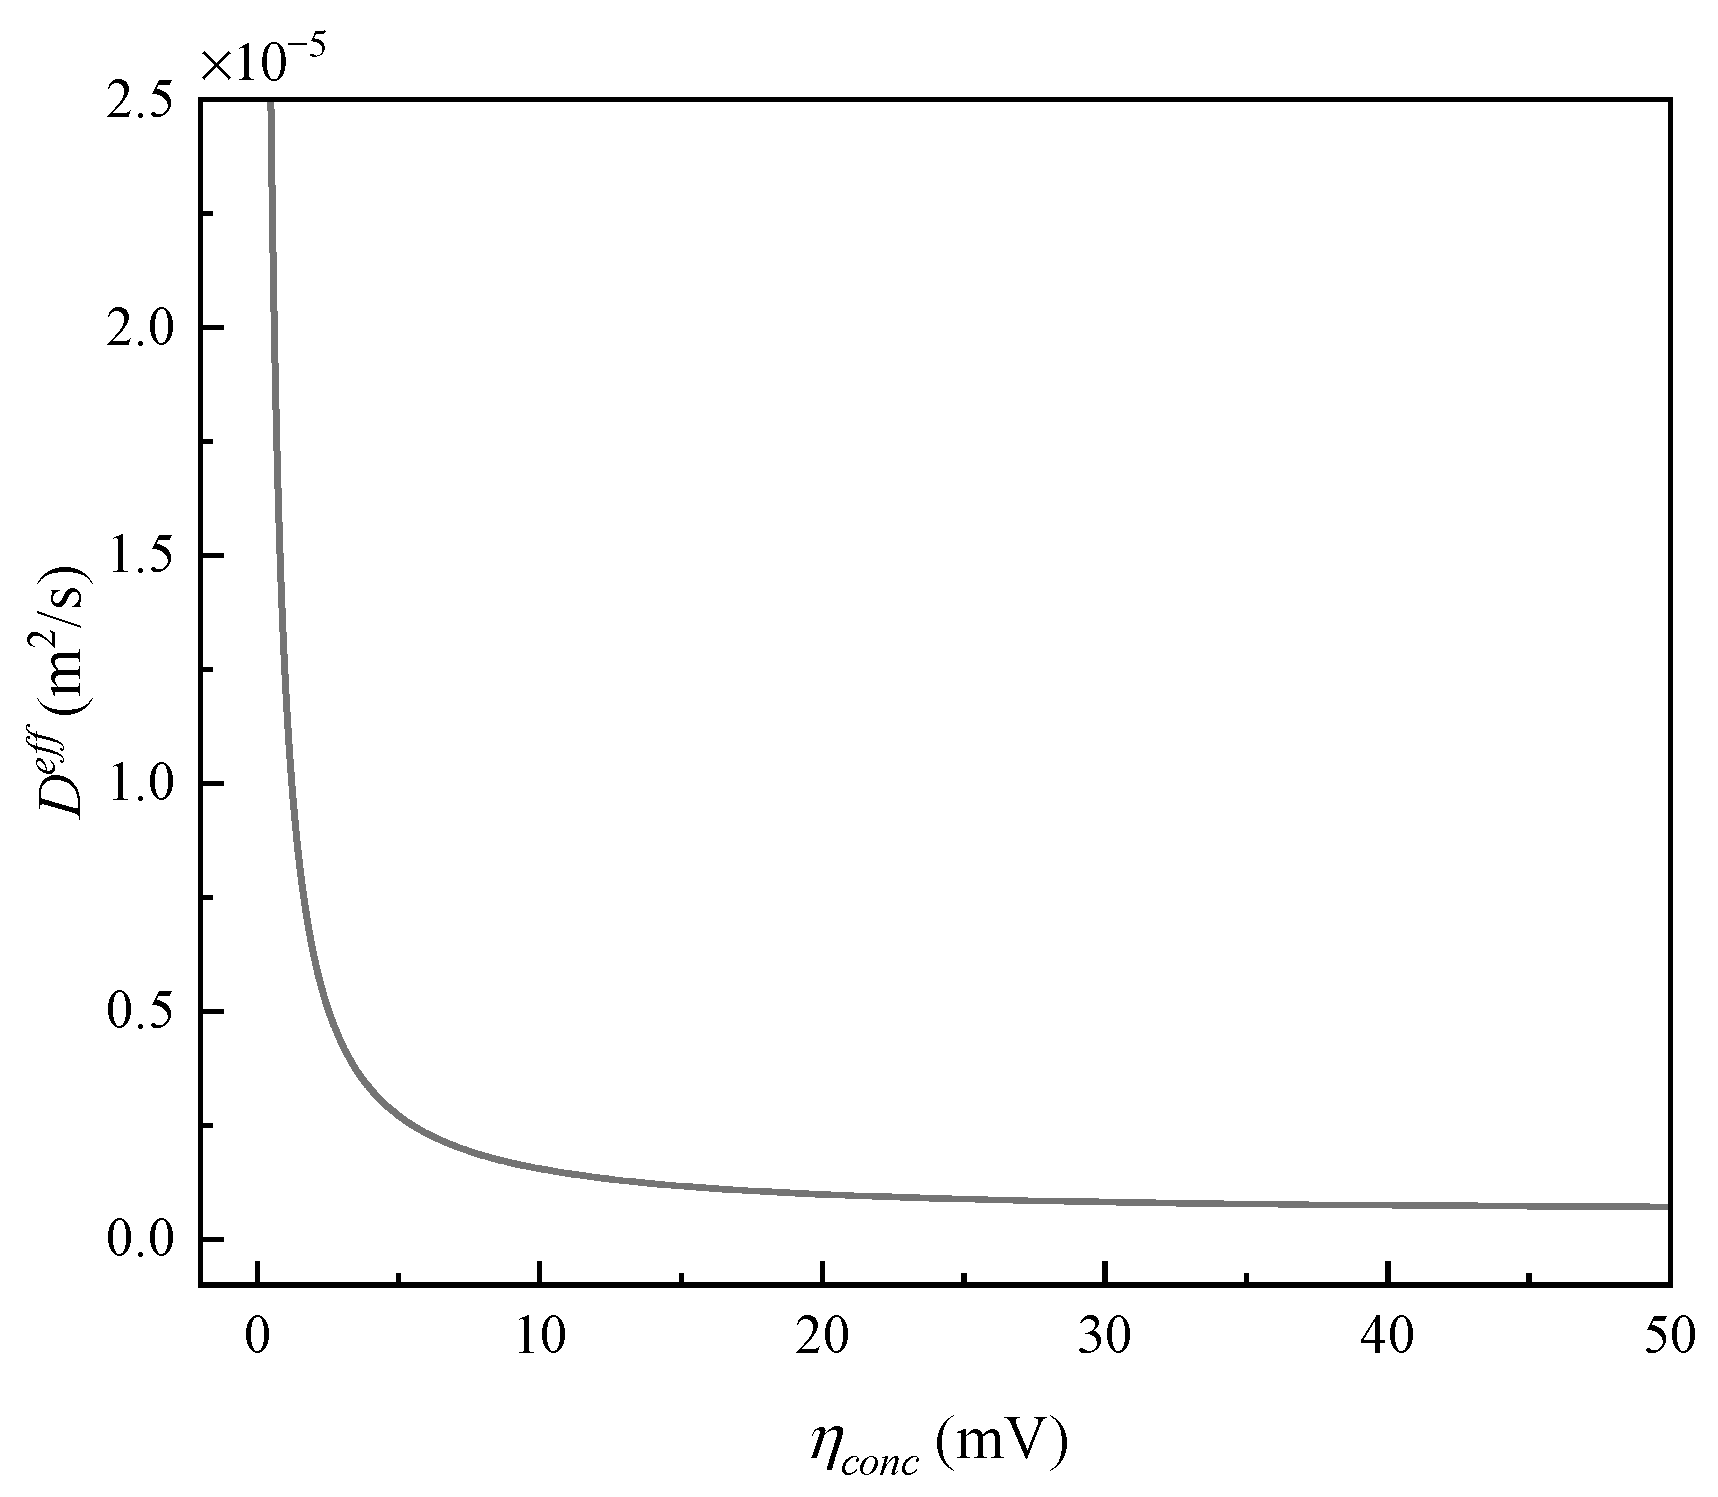
4.1.2. Calculation of Effective Diffusion Coefficient

The effective diffusion coefficient is a critical metric for assessing the air electrode condition in zinc–air batteries. After prolonged operation of the zinc–air battery, electrolyte infiltrates the interior of the air electrode, and the resulting crystalline material blocks the micropores of the air electrode. As a consequence, the effective diffusion coefficient of the air electrode experiences a substantial reduction, leading to a decrease in output power.
Section 4.1.1 explains how to obtain the numerical values of various components in the equivalent circuit of a zinc–air battery through the voltage output curve. Consequently, by substituting the values of solution resistance RL, charge transfer resistance Rt, and differential capacitance Cd back into Equation (13), the magnitude of concentration polarization in the zinc–air battery can be determined:
η c o n c = E O C V i 2 R L + R t 1 e t R t C d V t
The oxygen concentration in the air generally remains stable and can be directly calculated. If a single pulse current is applied to the air electrode, with the working time of the pulse current in the zinc–air battery being t0, the theoretical solution for the concentration polarization of the zinc–air battery can be obtained based on Equations (5) and (21):
η c o n c = R T 4 F 1 + 1 α ln C 0 C *
C 0 = Σ 0 1 n + 1 2 i l π 2 A s D e f f F 2 n + 1 2 e 2 n + 1 2 π 2 4 l 2 t 0 D e f f sin 2 n + 1 π x 2 l i 4 A s D e f f F l + C 1
Combining Equations (31)–(33) results in a system of equations with respect to Deff. However, solving this system is challenging. In this system, the concentration polarization ηconc is a single-valued function of the effective diffusion coefficient Deff, and their relationship can be simply expressed as:
D e f f = f η c o n c
In engineering applications, when the magnitude of a single pulse current i, the oxygen concentration C1 in the air, and the working time t0 of the single pulse current are known values, it is possible to pre-plot a concentration polarization-effective diffusion coefficient function graph. Upon concluding the experiment, by using Equation (28) to determine the concentration polarization magnitude, the effective diffusion coefficient of the air electrode can be obtained from the function graph.
In this paper, taking the example of a single pulse current experiment, the operating current is 1 A, the duration is 3 s, and the oxygen concentration in the air is 8.6 mol/m3. The concentration polarization-effective diffusion coefficient correlation curve is obtained from Equation (31) are shown in Figure 12.

4.2. Results and Discussion of Single Current Pulse Experiment

Based on Figure 9 and Figure 12, in conjunction with the parameter calculation methods outlined in Section 4.1.1 and Section 4.1.2, the calculated parameters for the output voltage during a 1 A current pulse extracted from Figure 5b are as follows:
By substituting the parameters from Table 1 into Equation (21), and the parameters from Table 2 into Equation (12), then solving the combined equations of (5), (12), and (21), the calculation curves for the output voltage and the concentration polarization-derived output curves can be obtained. The calculation results are shown in Figure 13.
As shown in Figure 13a, upon applying a 1 A working current, the zinc–air battery immediately responds with Ohmic polarization, leading to a decrease in voltage. Subsequently, the electrochemical polarization characterized jointly by resistance Rt and capacitance Cd becomes predominant in influencing the variation of the zinc–air battery’s output voltage. Following the current passage through the zinc–air battery, the interface double layer begins to charge. Consequently, the output voltage curve of the zinc–air battery doesn’t exhibit a 90-degree angle change but rather shows a certain degree of buffering. It’s noteworthy that this change occurs within a very short time, roughly around 0.1 s, during which the double layer charging is completed. Subsequently, only the resistance Rt continues to exert an influence, causing the equivalent circuit to exhibit characteristics resembling those of a pure resistive circuit.
Meanwhile, with the consumption of oxygen on the air electrode, the concentration polarization of the air electrode gradually increases. As shown in Figure 13b, at the initial stage, the oxygen on the surface of the air electrode catalyst layer is sufficient, resulting in zero concentration polarization. However, as oxygen continues to be consumed, the concentration polarization increases sharply, reaching about half of its maximum value at around 0.7 s. At this point, concentration polarization becomes the main factor driving changes in the output voltage of the zinc–air battery.

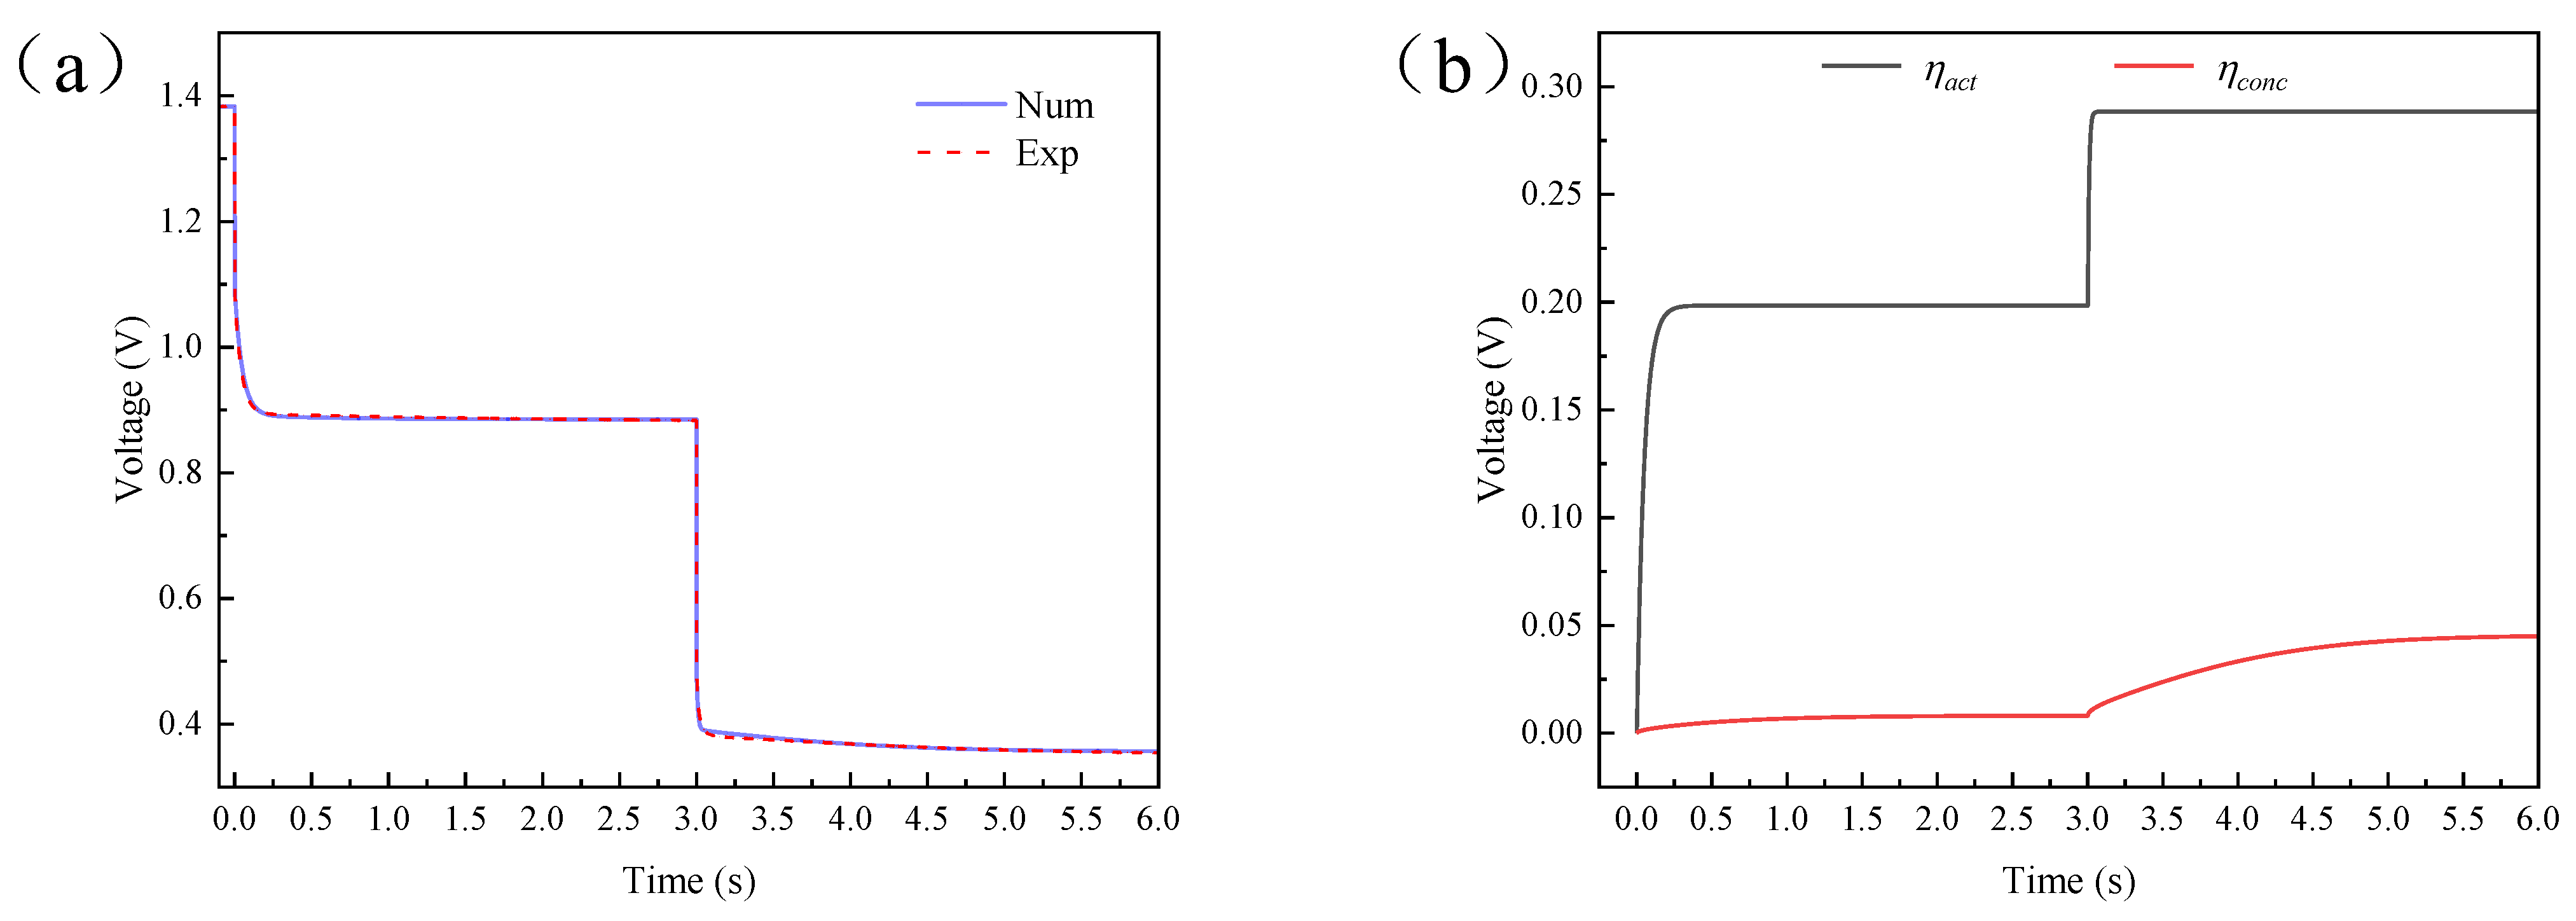
4.3. Results and Discussion of Step Current Pulse Experiment

When the operating current increases from 0 to 0.4 A, the calculation method for circuit parameters remains consistent with the previous content. When further increasing the current from 0.4 A to 1 A, it is important to note that due to the change in zinc–air battery current, the equivalent circuit parameters inside it will also change. In this case, it is necessary to use the current increment in Equation (12) for calculations. The calculation parameters for output voltage during step current pulse are shown in Table 3:
Calculations as shown in Figure 14 reveal that when the operating current of the zinc–air battery increases from 0 to 0.4 A, the output voltage of the zinc–air battery immediately experiences a steep drop, followed by a gradual change, with an overall trend consistent with Figure 13a. However, during this process, due to the relatively small working current at the surface of the air electrode catalytic layer and the limited demand for oxygen, the diffusion rate of oxygen can meet the requirements of the zinc–air battery. Hence, during this time, the concentration polarization value is minimal, and the losses in the zinc–air battery are primarily caused by electrochemical polarization and ohmic polarization, while the losses caused by concentration polarization can be neglected.

5. Conclusions

By combining the gas diffusion model with the equivalent circuit model, a voltage output model for zinc–air batteries has been established. This model considers factors such as gas diffusion, double-layer effects, and particle transport, allowing for the prediction of transient voltage response in zinc–air batteries under different operating conditions. By comparing the theoretical calculations of single current pulses and step current pulses with experimental results, a substantial agreement is observed, confirming the validity of the model.
According to the gas diffusion model, the transport behavior of oxygen within the air electrode is analyzed. The diffusion rate of oxygen is influenced by the initial concentration difference between the interior and exterior of the air electrode, as well as the magnitude of the operating current. An increase in the concentration difference between the interior and exterior enhances the transportation of oxygen, while a reduction in the concentration difference slows down oxygen transport. However, in the final steady state, the distribution of oxygen concentration is solely affected by the magnitude of the operating current and the oxygen concentration in the air. When the operating current at the air electrode surface undergoes alterations, both the oxygen concentration distribution and the concentration polarization will change accordingly, with the most rapid variation occurring within approximately 0.5 s and reaching a new equilibrium after 3 s.
By applying pulsed current to zinc–air batteries and analyzing the battery’s output voltage curve, parameters such as solution resistance RL, charge transfer resistance Rt, differential capacitance Cd, effective diffusion coefficient Deff, and more can be calculated. These parameters can be employed to monitor the operational state of zinc–air batteries and, on a more advanced level, to predict the battery’s lifespan.

Author Contributions

Conceptualization, L.H. and X.X.; methodology, L.H.; software, L.H.; validation, L.H.; formal analysis, L.H.; investigation, L.H.; resources, L.H.; data curation, L.H.; writing—original draft preparation, L.H.; writing—review and editing, L.H.; visualization, L.H.; supervision, L.H.; project administration, X.X.; and funding acquisition, X.X. All authors have read and agreed to the published version of the manuscript.

Funding

This research was funded by “the Fundamental Research Funds for the Central Universities”, grant number WK5290000002.

Data Availability Statement

The data relevant with this study can be accessed by contacting the corresponding author.

Conflicts of Interest

The authors declare no conflict of interest.

References

  1. Olabi, A.G.; Onumaegbu, C.; Wilberforce, T.; Ramadan, M.; Abdelkareem, M.A.; Al Alami, A.H. Critical review of energy storage systems. Energy 2021, 214, 118987. [Google Scholar] [CrossRef]
  2. Deng, W.; Xu, Y.; Zhang, X.; Li, C.; Liu, Y.; Xiang, K.; Chen, H. (NH4)2Co2V10O28·16H2O/(NH4)2V10O25·8H2O heterostructure as cathode for high-performance aqueous Zn-ion batteries. J. Alloys Compd. 2022, 903, 163824. [Google Scholar] [CrossRef]
  3. Deng, W.; Li, Y.; Xu, D.; Zhou, W.; Xiang, K.; Chen, H. Three-dimensional hierarchically porous nitrogen-doped carbon from water hyacinth as selenium host for high-performance lithium–selenium batteries. Rare Met. 2022, 41, 3432–3445. [Google Scholar] [CrossRef]
  4. Li, D.; Guo, H.; Jiang, S.; Zeng, G.; Zhou, W.; Li, Z. Microstructures and electrochemical performances of TiO2-coated Mg–Zr co-doped NCM as a cathode material for lithium-ion batteries with high power and long circular life. New J. Chem. 2021, 45, 19446–19455. [Google Scholar] [CrossRef]
  5. Su, D.; Xiao, Y.; Liu, Y.; Xu, S.; Fang, S.; Cao, S.; Wang, X. Surface-confined polymerization to construct binary Fe3N/Co–N–C encapsulated MXene composites for high-performance zinc-air battery. Carbon 2023, 201, 269–277. [Google Scholar] [CrossRef]
  6. Wen, X.; Luo, J.; Xiang, K.; Zhou, W.; Zhang, C.; Chen, H. High-performance monoclinic WO3 nanospheres with the novel NH4+ diffusion behaviors for aqueous ammonium-ion batteries. Chem. Eng. J. 2023, 458, 141381. [Google Scholar] [CrossRef]
  7. Zeng, X.; Li, M.; Abd El-Hady, D.; Alshitari, W.; Al-Bogami, A.S.; Lu, J.; Amine, K. Commercialization of Lithium Battery Technologies for Electric Vehicles. Adv. Energy Mater. 2019, 9, 1900161. [Google Scholar] [CrossRef]
  8. Chavan, S.; Venkateswarlu, B.; Prabakaran, R.; Salman, M.; Joo, S.W.; Choi, G.S.; Kim, S.C. Thermal runaway and mitigation strategies for electric vehicle lithium-ion batteries using battery cooling approach: A review of the current status and challenges. J. Energy Storage 2023, 72, 108569. [Google Scholar] [CrossRef]
  9. Han, S.; Zhenghao, M.; Meilin, L.; Xiaohui, Y.; Xiaoxue, W. Global supply sustainability assessment of critical metals for clean energy technology. Resour. Policy 2023, 85, 103994. [Google Scholar] [CrossRef]
  10. Zhou, W.; Zeng, G.; Jin, H.; Jiang, S.; Huang, M.; Zhang, C.; Chen, H. Bio-Template Synthesis of V2O3@ Carbonized Dictyophora Composites for Advanced Aqueous Zinc-Ion Batteries. Molecules 2023, 28, 2147. [Google Scholar] [CrossRef]
  11. Wang, H.; Xu, L.; Deng, D.; Liu, X.; Li, H.; Su, D. Regulated electronic structure and improved electrocatalytic performances of S-doped FeWO4 for rechargeable zinc-air batteries. J. Energy Chem. 2023, 76, 359–367. [Google Scholar] [CrossRef]
  12. Xu, M.; Dou, H.; Zhang, Z.; Zheng, Y.; Ren, B.; Ma, Q.; Wen, G.; Luo, D.; Yu, A.; Zhang, L. Hierarchically Nanostructured Solid-State Electrolyte for Flexible Rechargeable Zinc–Air Batteries. Angew. Chem. Int. Ed. 2022, 134, e202117703. [Google Scholar] [CrossRef]
  13. Jiao, M.; Zhang, Q.; Ye, C.; Liu, Z.; Zhong, X.; Wang, J.; Li, C.; Dai, L.; Zhou, G.; Cheng, H. Recycling spent LiNi1−x−yMnxCoyO2 cathodes to bifunctional NiMnCo catalysts for zinc-air batteries. Proc. Natl. Acad. Sci. USA 2022, 119, e2092765177. [Google Scholar] [CrossRef]
  14. He, Y.; Shang, W.; Ni, M.; Huang, Y.; Zhao, H.; Tan, P. In-situ observation of the gas evolution process on the air electrode of Zn-air batteries during charging. Chem. Eng. J. 2022, 427, 130862. [Google Scholar] [CrossRef]
  15. Pei, Z.; Ding, L.; Wang, C.; Meng, Q.; Chen, Y. Make It Stereoscopic: Interfacial Design for Full-Temperature Adaptive Flexible Zinc-Air Batteries. Energy Environ. Sci. 2021, 14, 4926–4935. [Google Scholar] [CrossRef]
  16. Cuadras, A.; Miró, P.; Ovejas, V.J.; Estrany, F. Entropy generation model to estimate battery ageing. J. Energy Storage 2020, 32, 101740. [Google Scholar] [CrossRef]
  17. Wang, H.; Sayed, S.Y.; Luber, E.J.; Olsen, B.C.; Shirurkar, S.M.; Venkatakrishnan, S.; Tefashe, U.M.; Farquhar, A.K.; Smotkin, E.S.; McCreery, R.L. Redox flow batteries: How to determine electrochemical kinetic parameters. ACS Nano 2020, 14, 2575–2584. [Google Scholar] [CrossRef]
  18. Shang, Y.; Lu, G.; Kang, Y.; Zhou, Z.; Duan, B.; Zhang, C. A multi-fault diagnosis method based on modified Sample Entropy for lithium-ion battery strings. J. Power Source 2020, 446, 227275. [Google Scholar] [CrossRef]
  19. Arregi, O.; Agirrezabala, E.; Iraola, U.; Milo, A.; Yeregui, J.; Nogueras, U.; Sánchez, R.; Gil, I. A New Equivalent Circuit Model Parametrization Methodology Based on Current Pulse Tests for Different Battery Technologies. Energies 2021, 14, 7255. [Google Scholar] [CrossRef]
  20. Wang, K.; Yu, J. Lifetime simulation of rechargeable zinc-air battery based on electrode aging. J. Energy Storage 2020, 28, 101191. [Google Scholar] [CrossRef]
  21. Schmitt, T.; Arlt, T.; Manke, I.; Latz, A.; Horstmann, B. Zinc electrode shape-change in secondary air batteries: A 2D modeling approach. J. Power Source 2019, 432, 119–132. [Google Scholar] [CrossRef]
  22. He, Y.; Cui, Y.; Shang, W.; Zhao, Z.; Tan, P. Insight into the bubble-induced overpotential towards high-rate charging of Zn-air batteries. Chem. Eng. J. 2022, 448, 137782. [Google Scholar] [CrossRef]
  23. Tran, M.; DaCosta, A.; Mevawalla, A.; Panchal, S.; Fowler, M. Comparative study of equivalent circuit models performance in four common lithium-ion batteries: LFP, NMC, LMO, NCA. Batteries 2021, 7, 51. [Google Scholar] [CrossRef]
  24. Xiong, B.; Yang, Y.; Tang, J.; Li, Y.; Wei, Z.; Su, Y.; Zhang, Q. An enhanced equivalent circuit model of vanadium redox flow battery energy storage systems considering thermal effects. IEEE Access 2019, 7, 162297–162308. [Google Scholar] [CrossRef]
  25. Petrone, G.; Zamboni, W.; Spagnuolo, G. An interval arithmetic-based method for parametric identification of a fuel cell equivalent circuit model. Appl. Energ. 2019, 242, 1226–1236. [Google Scholar] [CrossRef]
  26. Lao-Atiman, W.; Olaru, S.; Diop, S.; Skogestad, S.; Arpornwichanop, A.; Cheacharoen, R.; Kheawhom, S. Linear parameter-varying model for a refuellable zinc–air battery. R. Soc. Open Sci. 2020, 7, 201107. [Google Scholar] [CrossRef]
  27. Ji, Y.; Qiu, S.; Li, G. Simulation of second-order RC equivalent circuit model of lithium battery based on variable resistance and capacitance. J. Cent. South Univ. 2020, 27, 2606–2613. [Google Scholar] [CrossRef]
  28. Leong, K.W.; Wang, Y.; Ni, M.; Pan, W.; Luo, S.; Leung, D.Y.C. Rechargeable Zn-air batteries: Recent trends and future perspectives. Renew. Sustain. Energy Rev. 2022, 154, 111771. [Google Scholar] [CrossRef]
  29. O’Hayre, R.; Cha, S.; Colella, W.; Prinz, F.B. Fuel Cell Fundamentals, 3rd ed.; John Wiley & Sons: Hoboken, NJ, USA, 2016; pp. 203–237. [Google Scholar]
  30. Dongfang, C.; Pucheng, P.; Xin, S.; Peng, R. Electrochemical impedance equivalent circuit model for zinc-air fuel cells. J. Tsinghua Univ. Sci. Technol. 2020, 60, 139–146. [Google Scholar]
Figure 1. Zinc–air battery structure diagram.
Energies 16 06448 g001
Figure 2. Equivalent circuit diagram model of zinc–air battery.
Energies 16 06448 g002
Figure 3. Schematic diagram of oxygen diffusion at the air electrode.
Energies 16 06448 g003
Figure 4. As the operating current increases from 0 A to different values: (a) the oxygen concentration varies with time and (b) the concentration polarization changes over time.
Energies 16 06448 g004
Figure 5. As the operating current decreases from 1 A to different values: (a) the oxygen concentration varies with time and (b) the concentration polarization changes over time.
Energies 16 06448 g005
Figure 6. As the operating current transitions from different values to 0.5 A: (a) the oxygen concentration varies with time and (b) the concentration polarization changes over time.
Energies 16 06448 g006
Figure 7. Structural diagram of the zinc–air battery test apparatus.
Energies 16 06448 g007
Figure 8. Physical diagram of the experimental system.
Energies 16 06448 g008
Figure 9. Single current pulse: (a) The operating current varies over time and (b) The output voltage varies over time.
Energies 16 06448 g009
Figure 10. Step current pulse: (a) The operating current varies over time and (b) The output voltage varies over time.
Energies 16 06448 g010
Figure 11. Circuit parameter calculation schematic.
Energies 16 06448 g011
Figure 12. Concentration polarization plotted against effective diffusion coefficient.
Energies 16 06448 g012
Figure 13. Single current pulse: (a) Comparison of calculated and experimental results; (b) Electrochemical polarization and concentration polarization over time.
Energies 16 06448 g013
Figure 14. Step current pulse: (a) Comparison of calculated and experimental results; (b) Electrochemical polarization and concentration polarization over time.
Energies 16 06448 g014
Table 1. Parameter table for gas diffusion and concentration polarization calculation.
ParameterValueUnit
D O 2 e f f 7.25 × 10⁻⁷m/s2
R8.3145J/(mol·K)
T298.15K
F96,485C/mol
C*8.6mol/m3
α0.5-
As4.5 × 10−4m2
l0.001m
Table 2. Parameter table for output voltage calculation at 1 A current pulse.
EOCVRLRtCdC1C2 D O 2 e f f
1.378 V0.721 Ω0.261 Ω0.079 F8.6 mol/m38.6 mol/m37.25 × 10−7 m/s2
Table 3. Parameter table for output voltage calculation at step current pulse.
EOCVRLRtCdC1C2 D O 2 e f f
1.383 V0.729 Ω0.496 Ω0.10 F8.6 mol/m38.6 mol/m37.25 × 10−7 m/s2
0.883 V0.653 Ω0.155 Ω0.057 F8.6 mol/m35.43 mol/m37.25 × 10−7 m/s2
Disclaimer/Publisher’s Note: The statements, opinions and data contained in all publications are solely those of the individual author(s) and contributor(s) and not of MDPI and/or the editor(s). MDPI and/or the editor(s) disclaim responsibility for any injury to people or property resulting from any ideas, methods, instructions or products referred to in the content.

