
Computational Fluid Dynamics of Ammonia Synthesis in Axial-Radial Bed Reactor

Abstract
:1. Introduction
2. Materials and Methods
2.1. Materials and Process Parameters
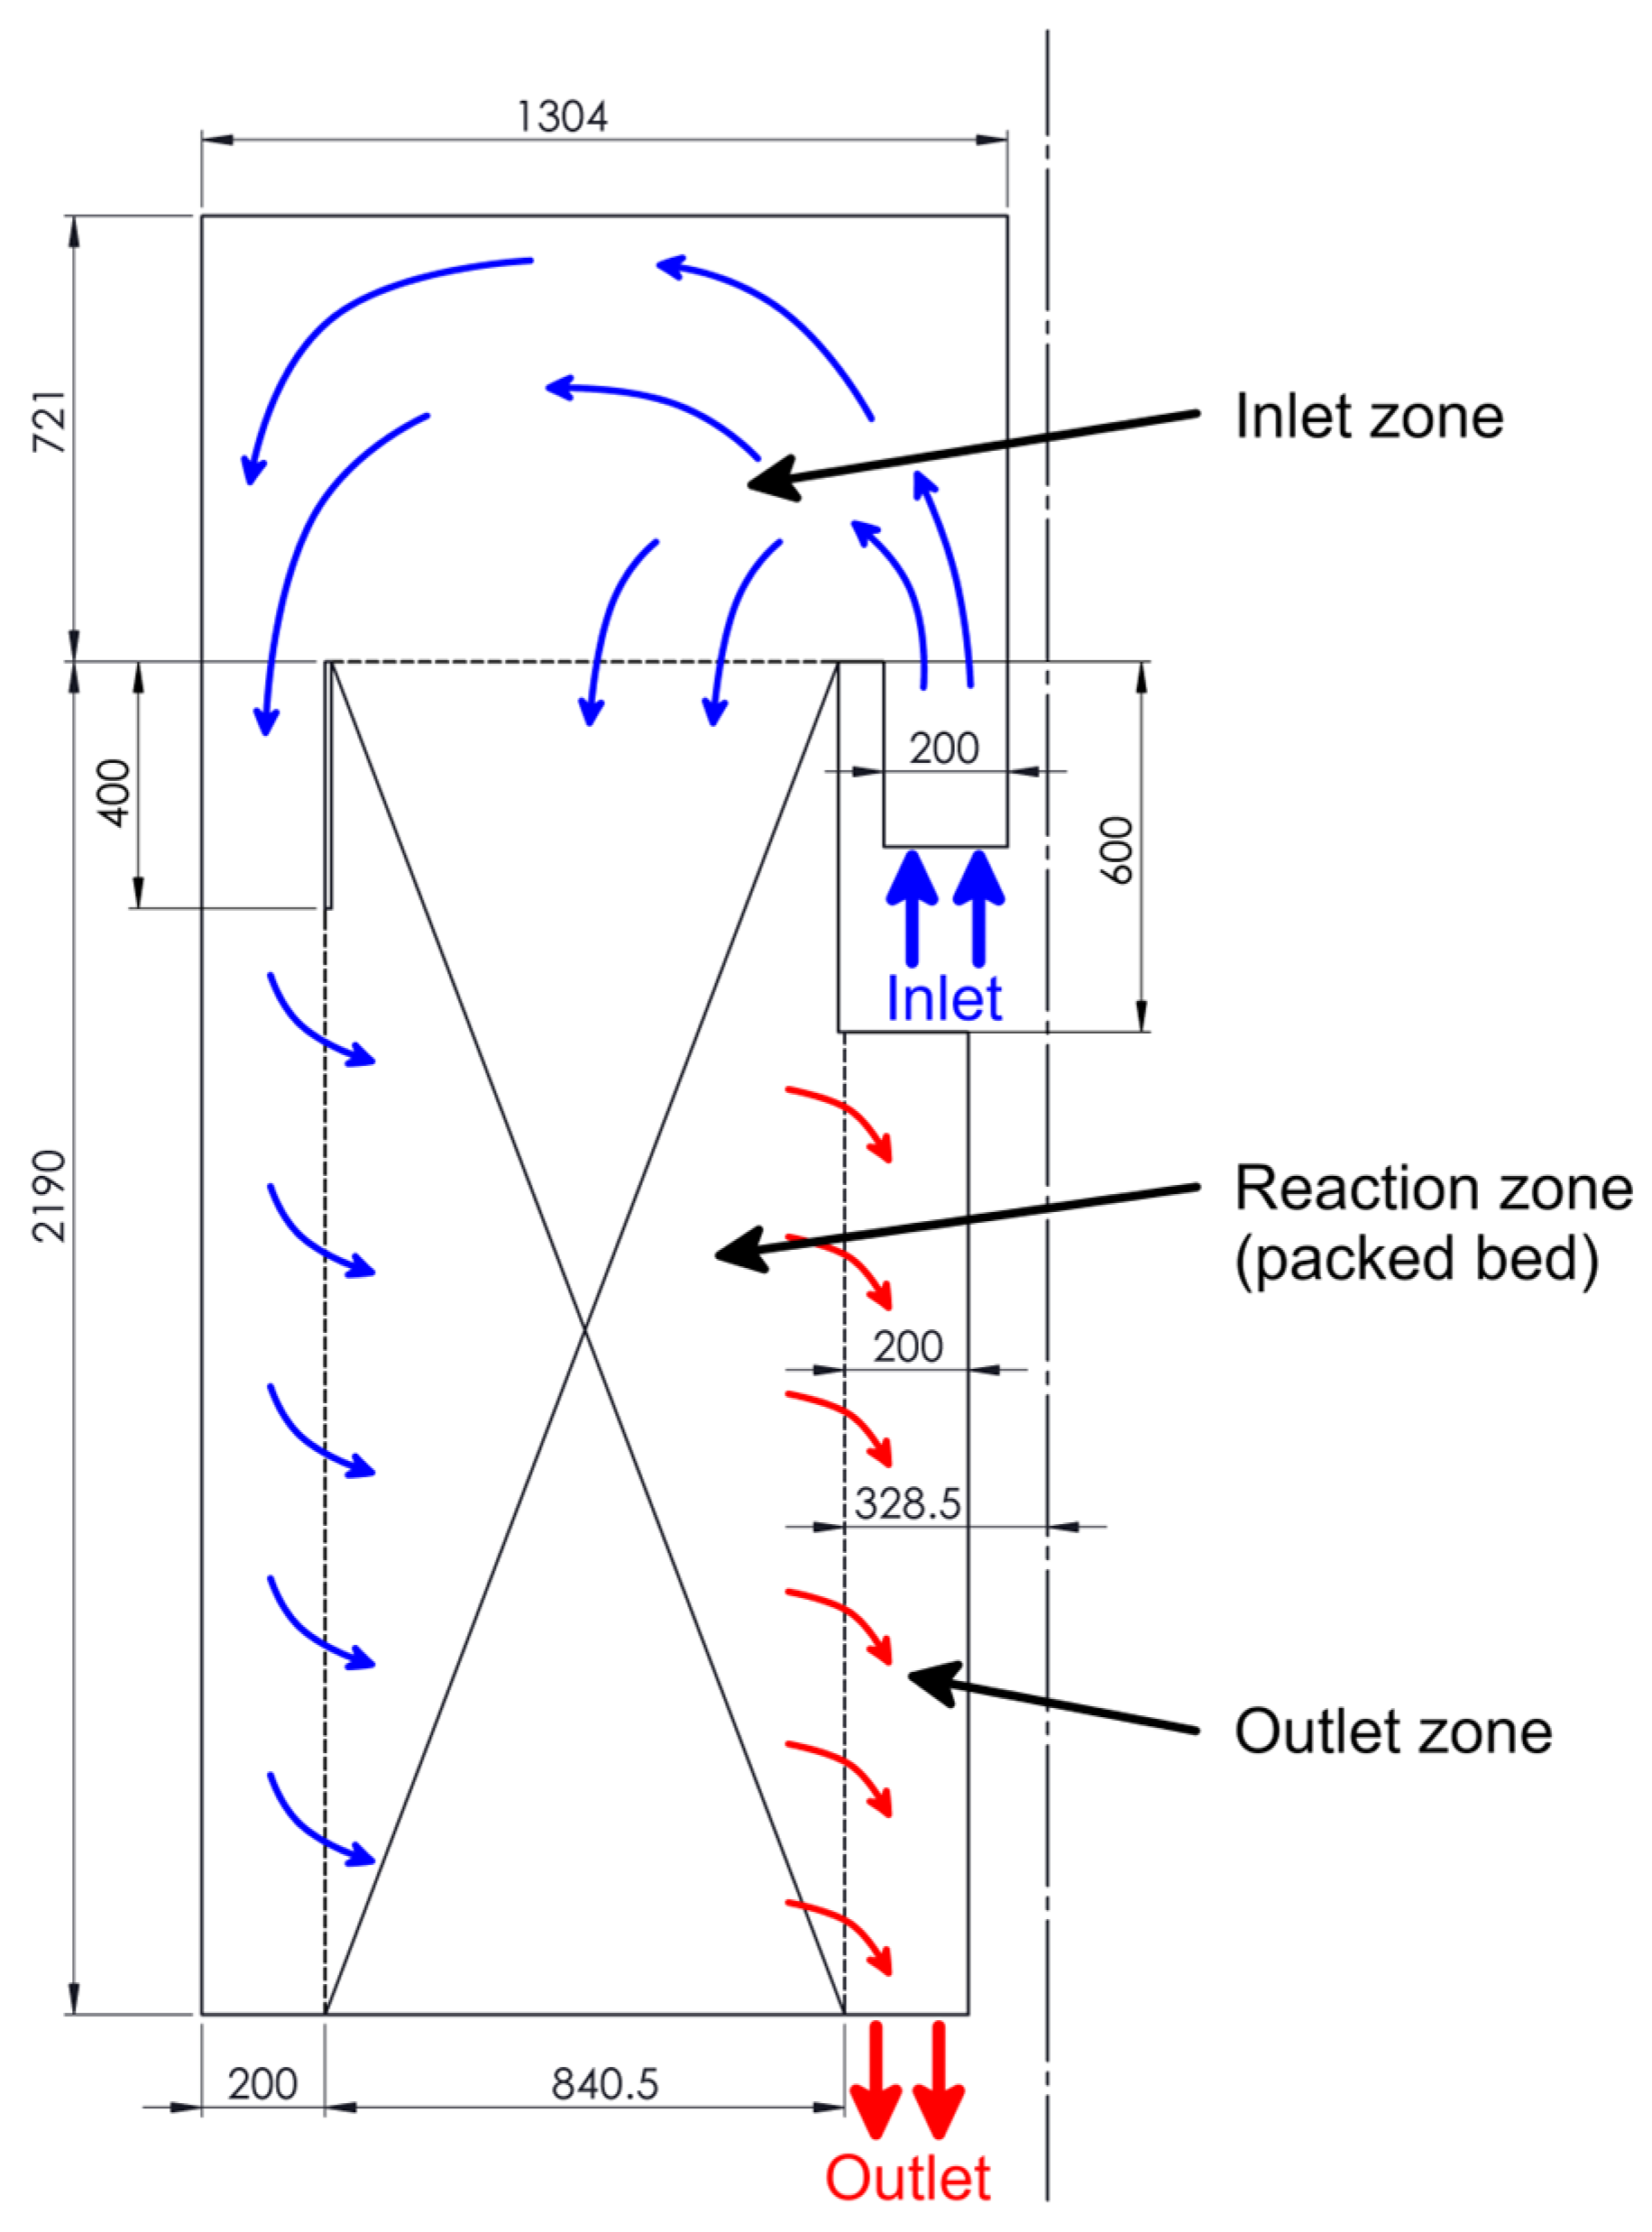
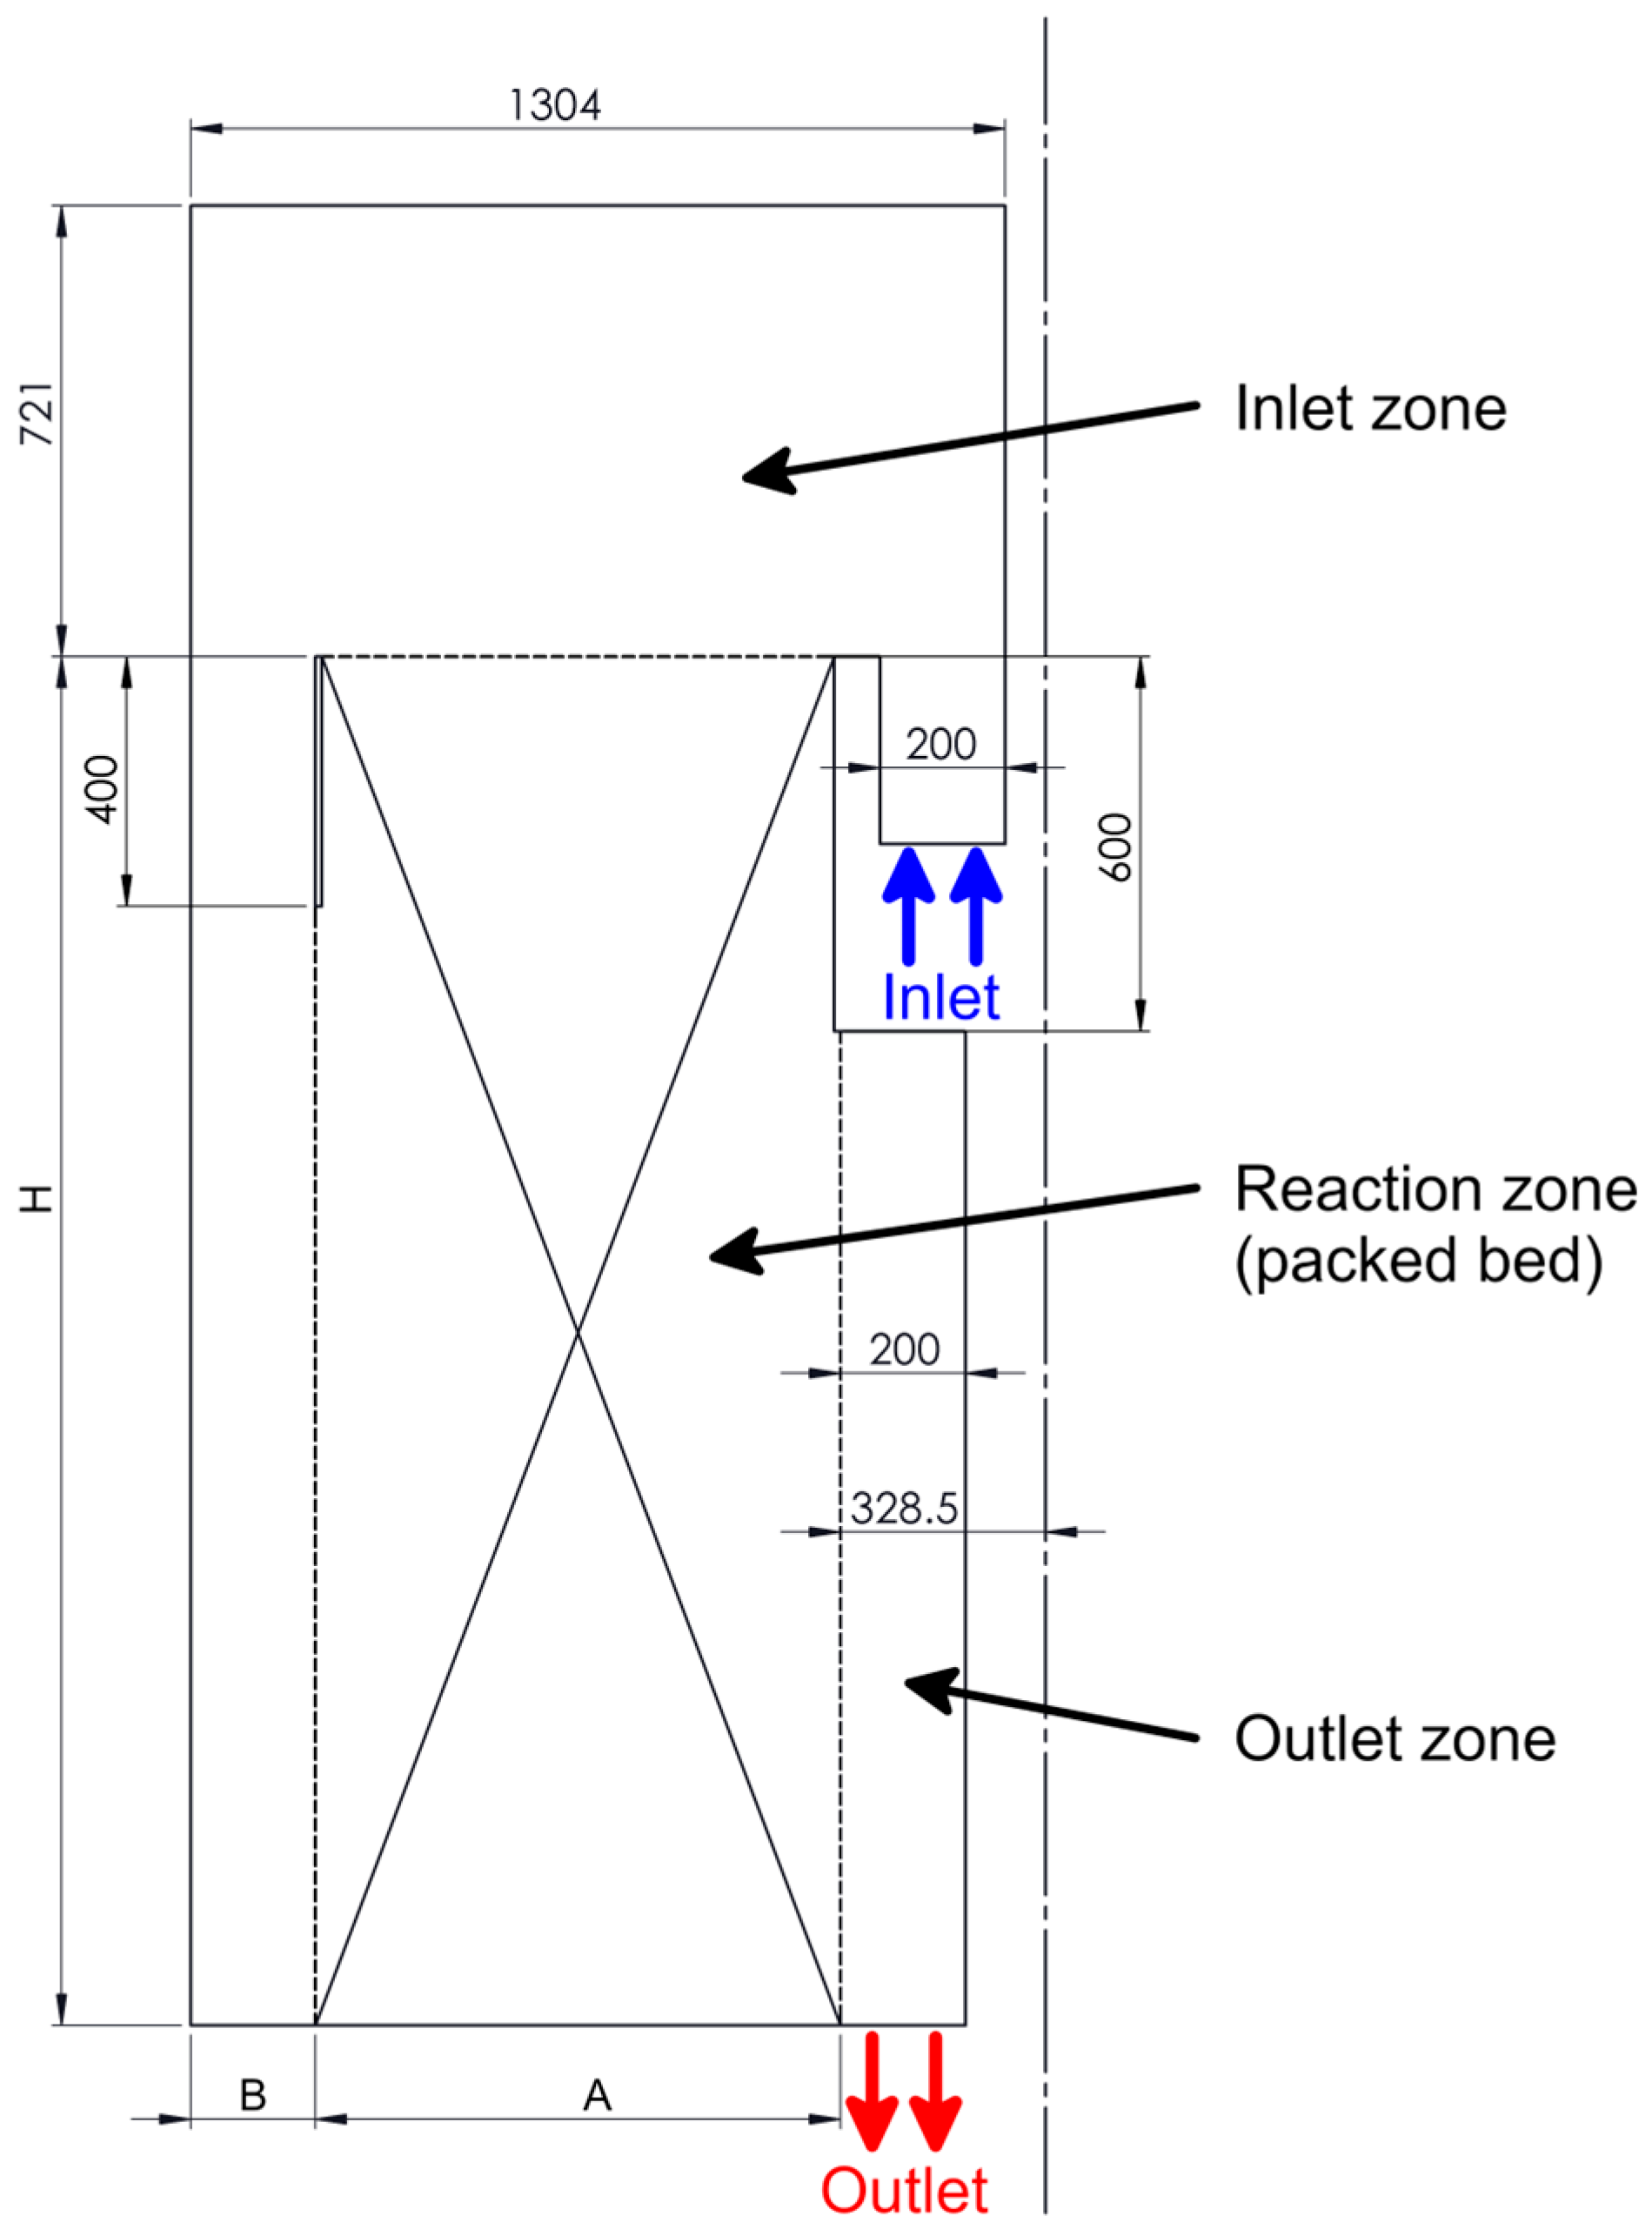
2.2. The Computational Domain
2.3. Gas-Phase Modelling
2.4. Catalyst Bed Modelling
2.5. Reaction Kinetics
3. Results
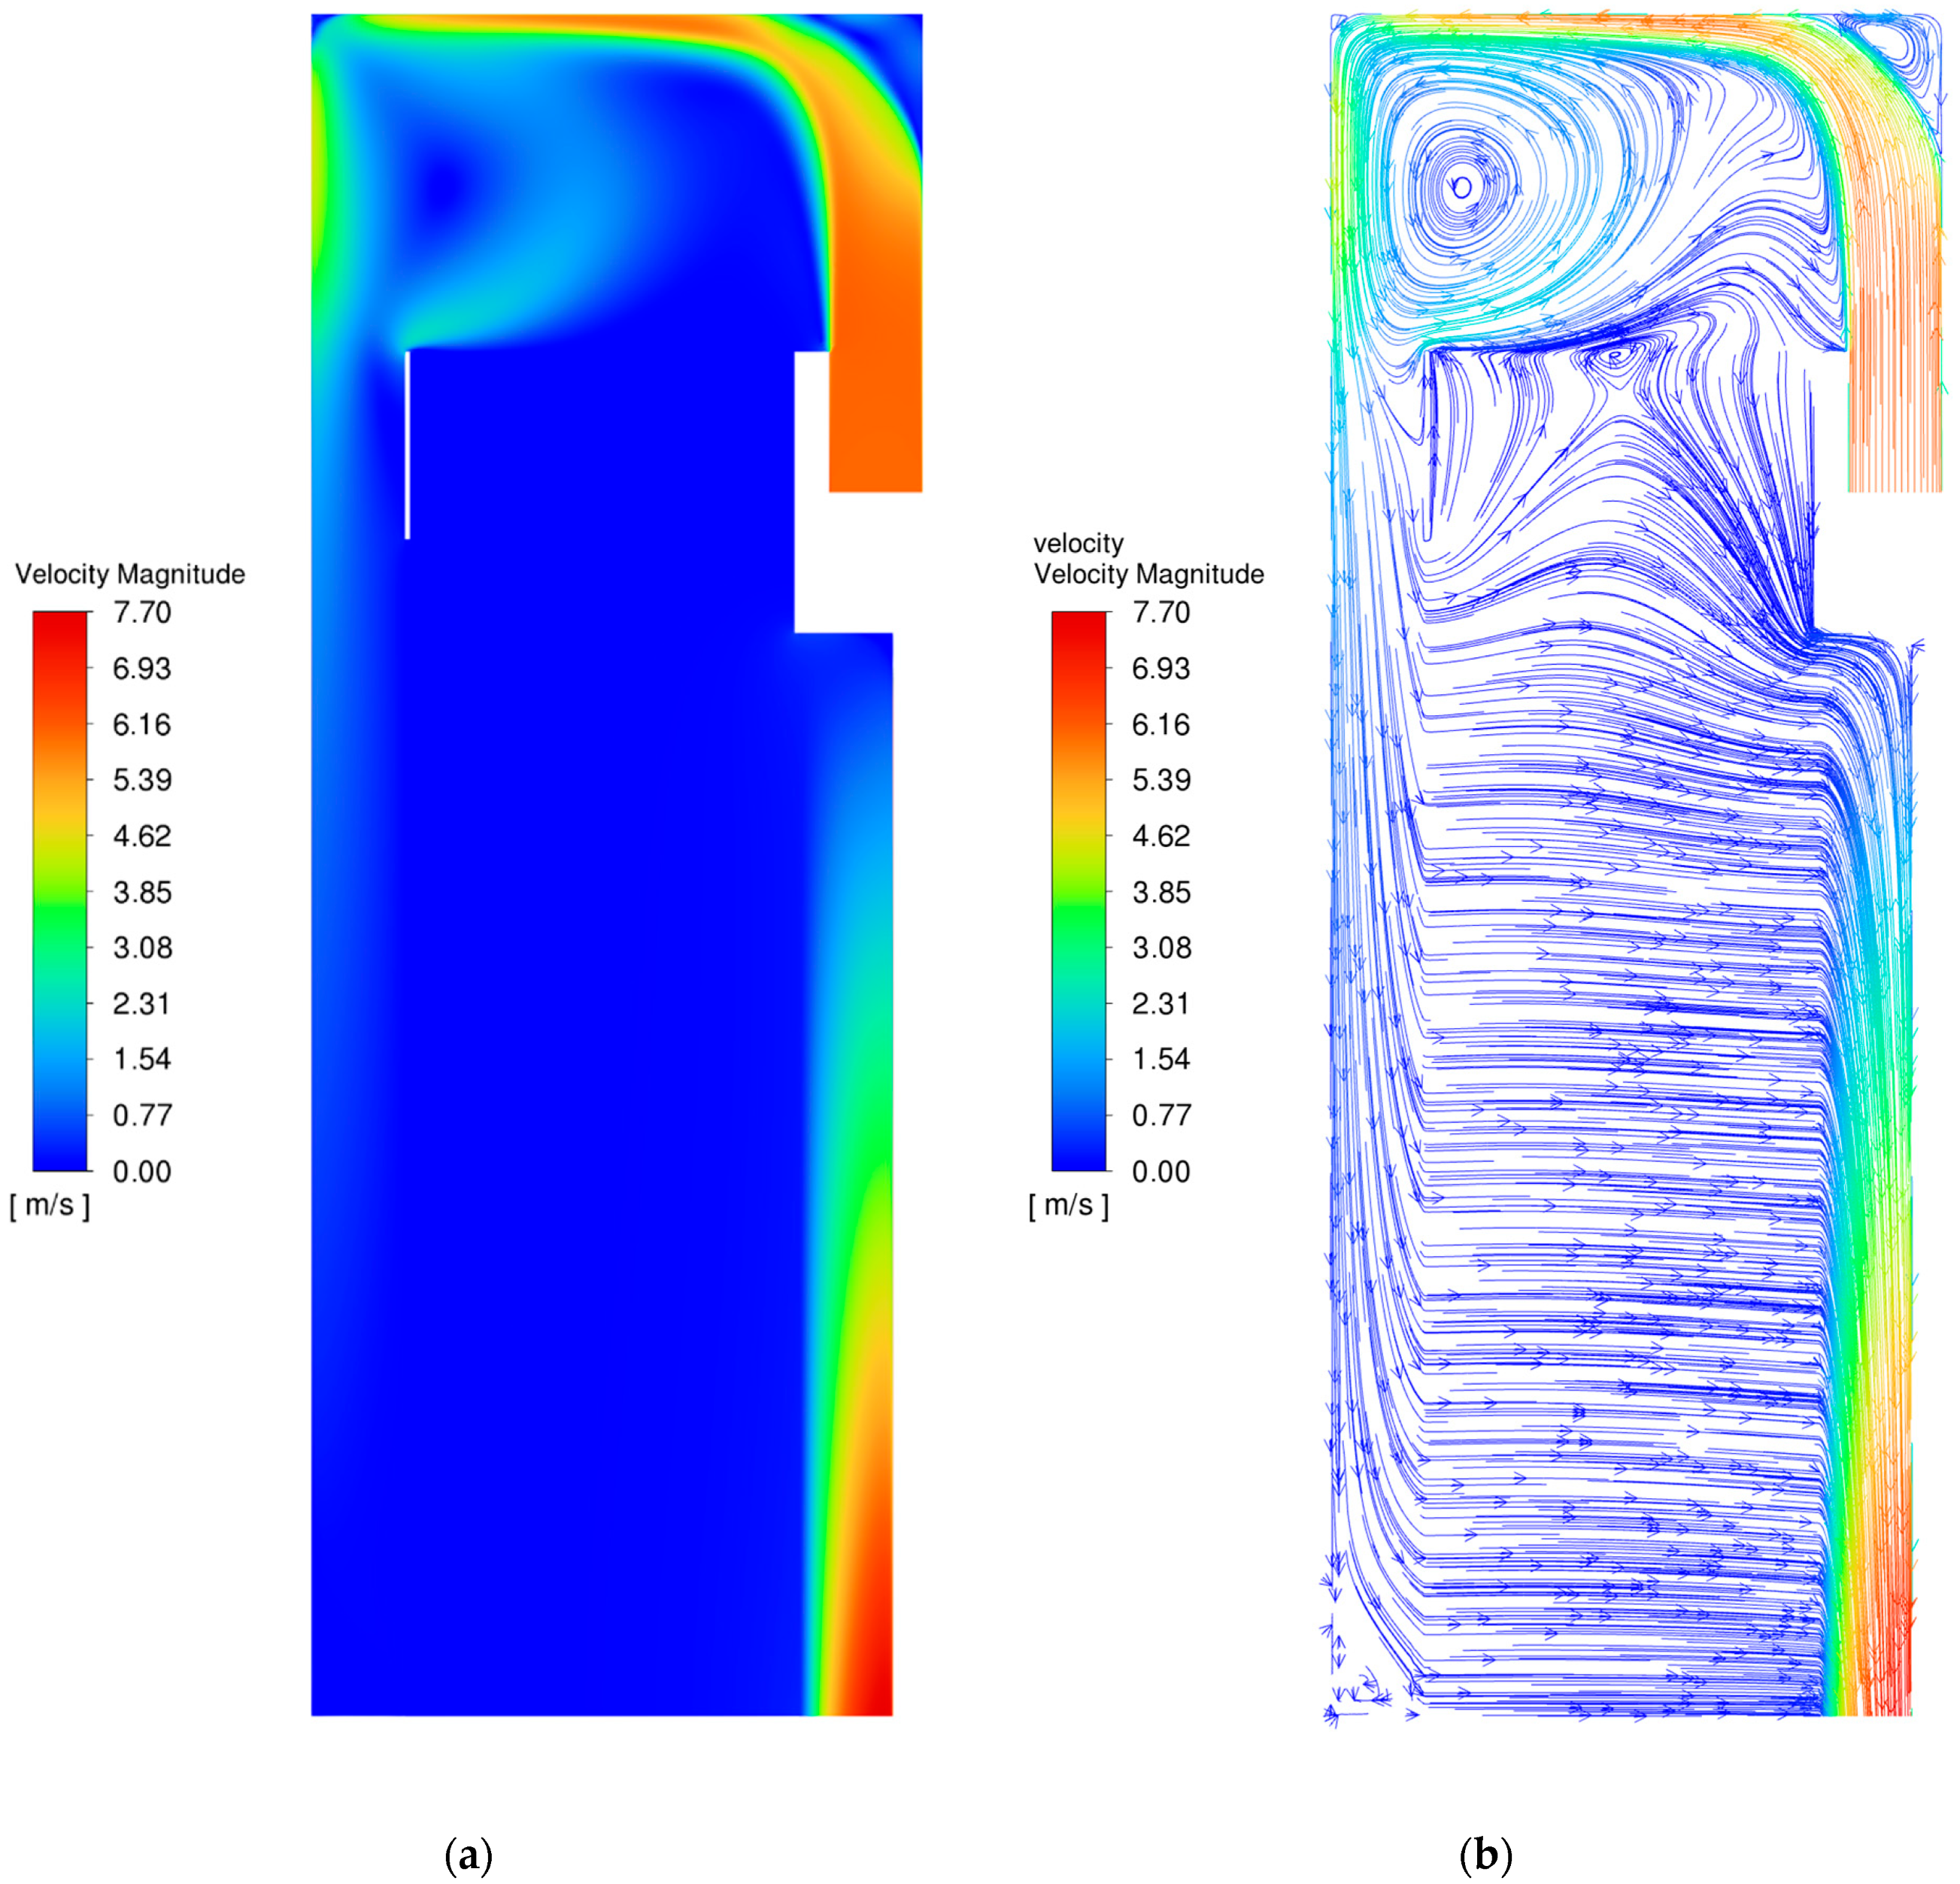
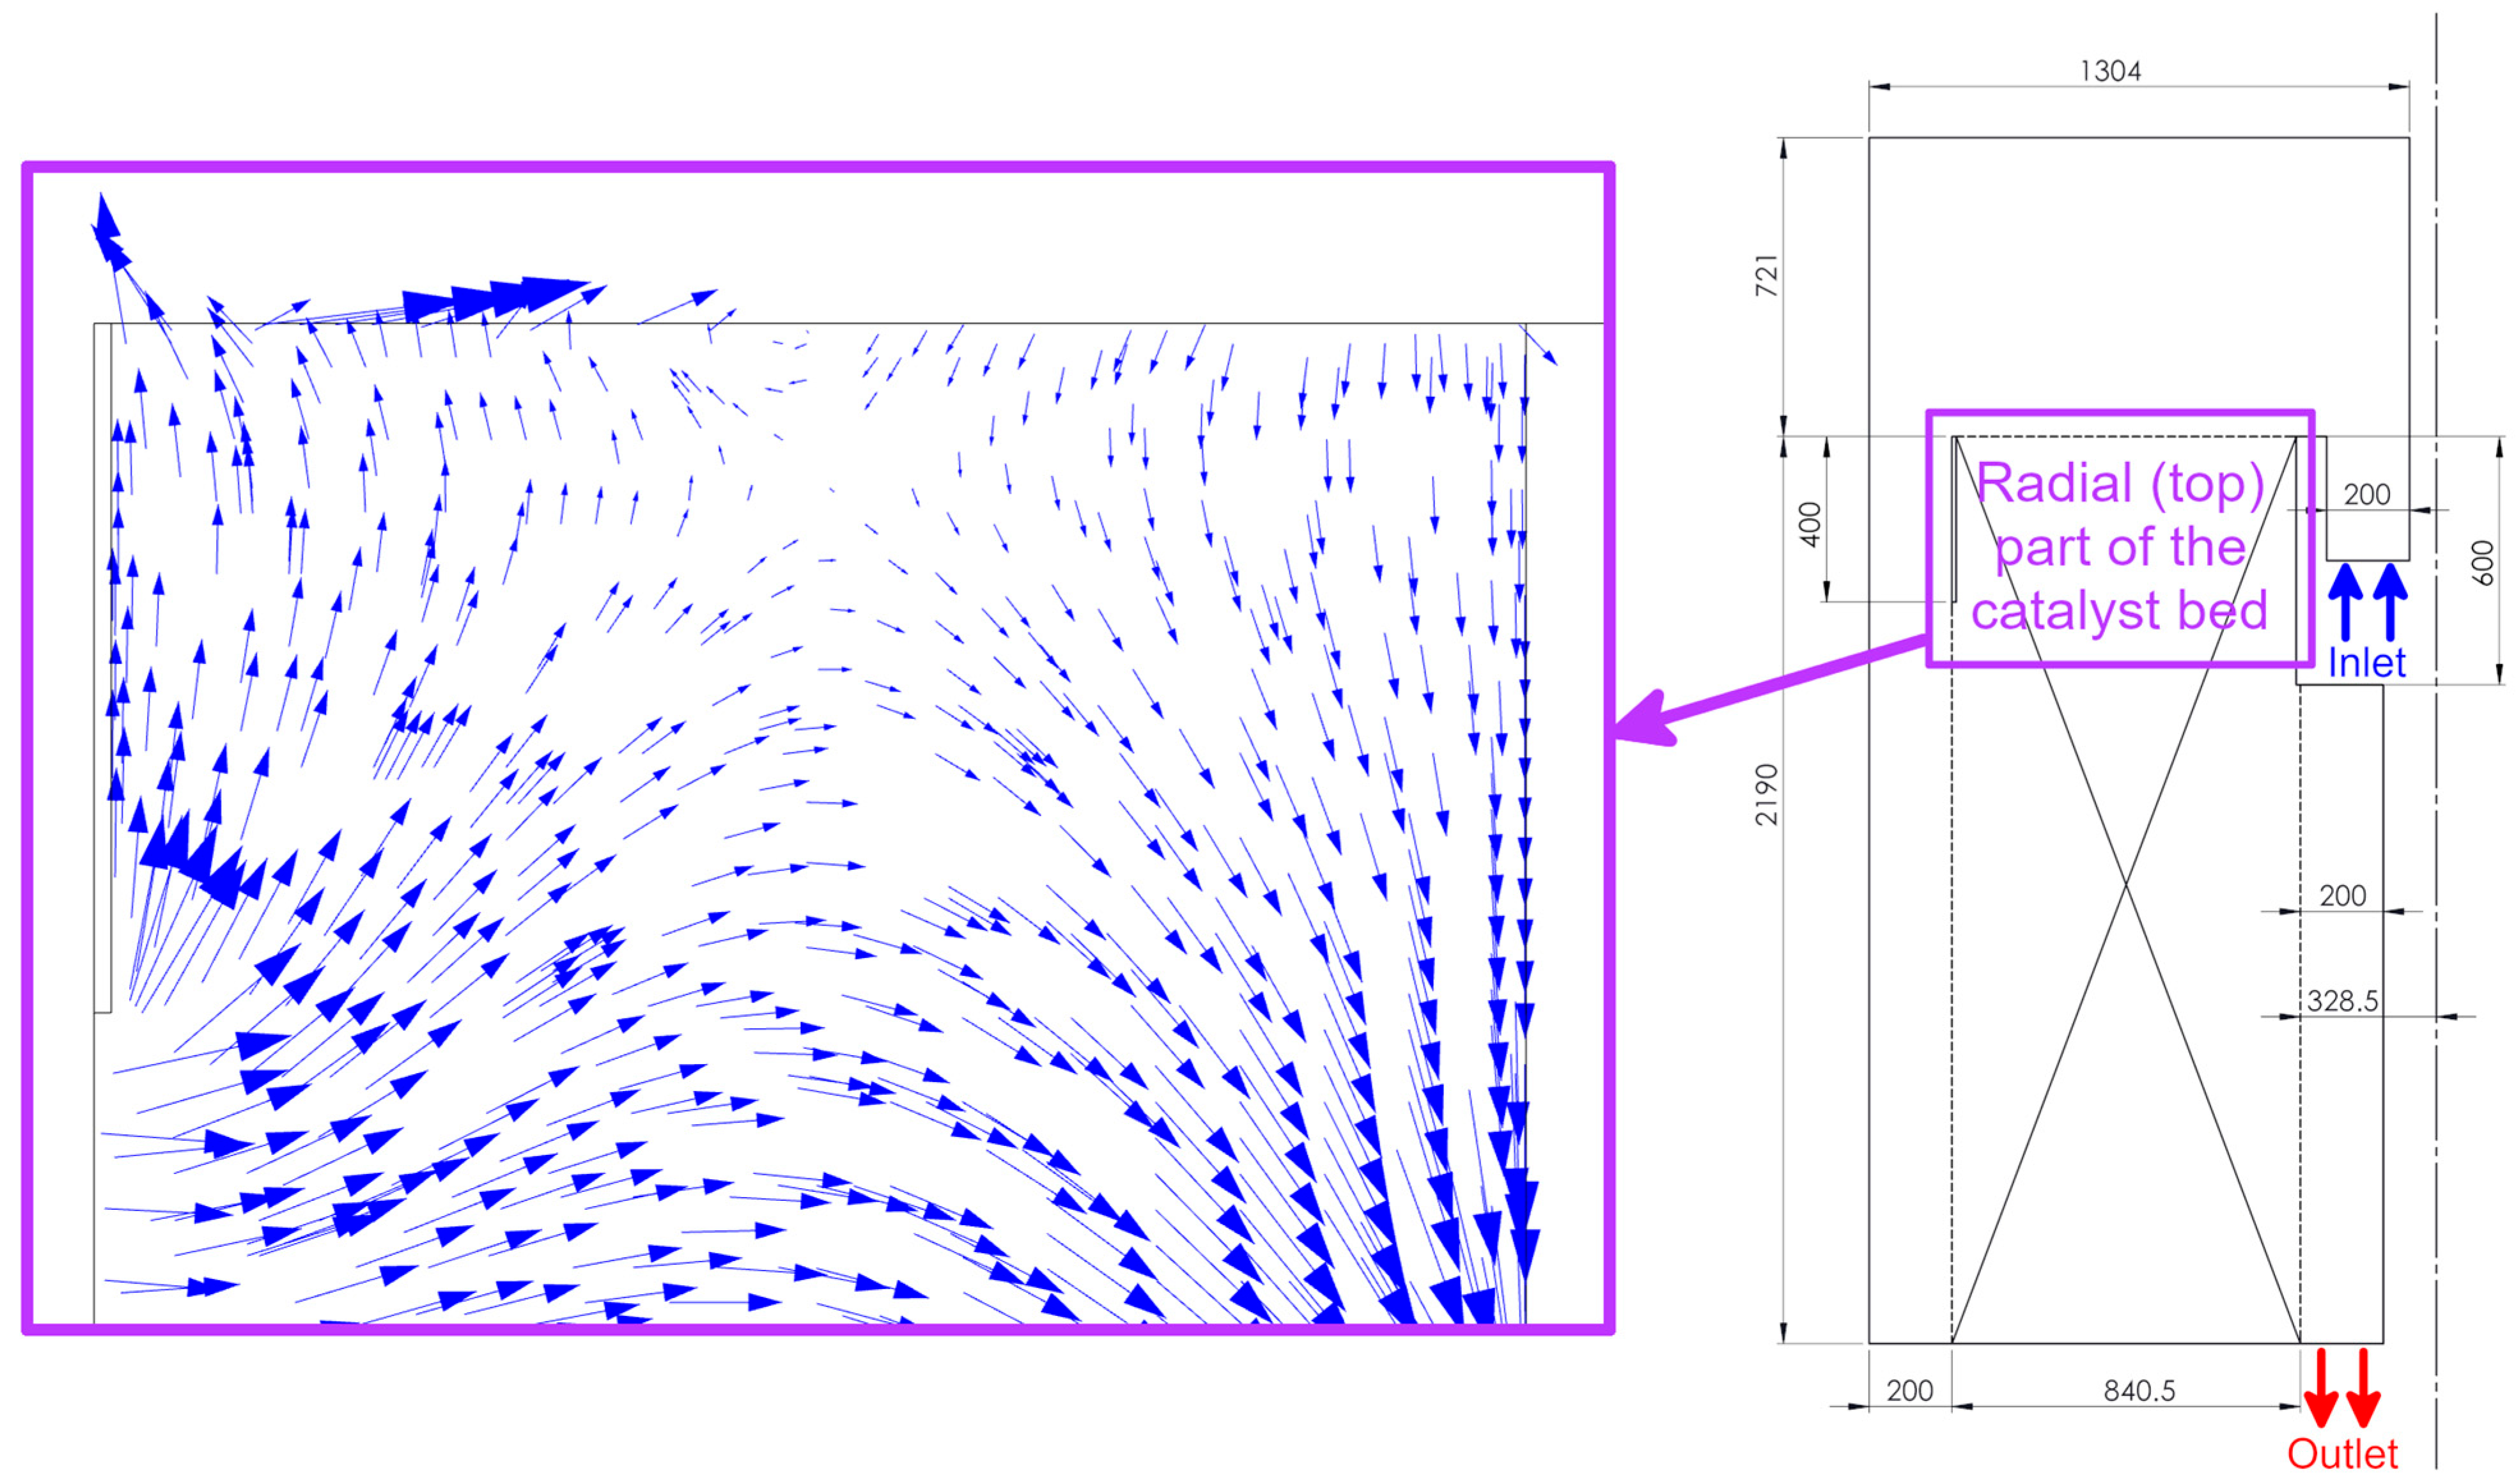
3.1. Flow Field
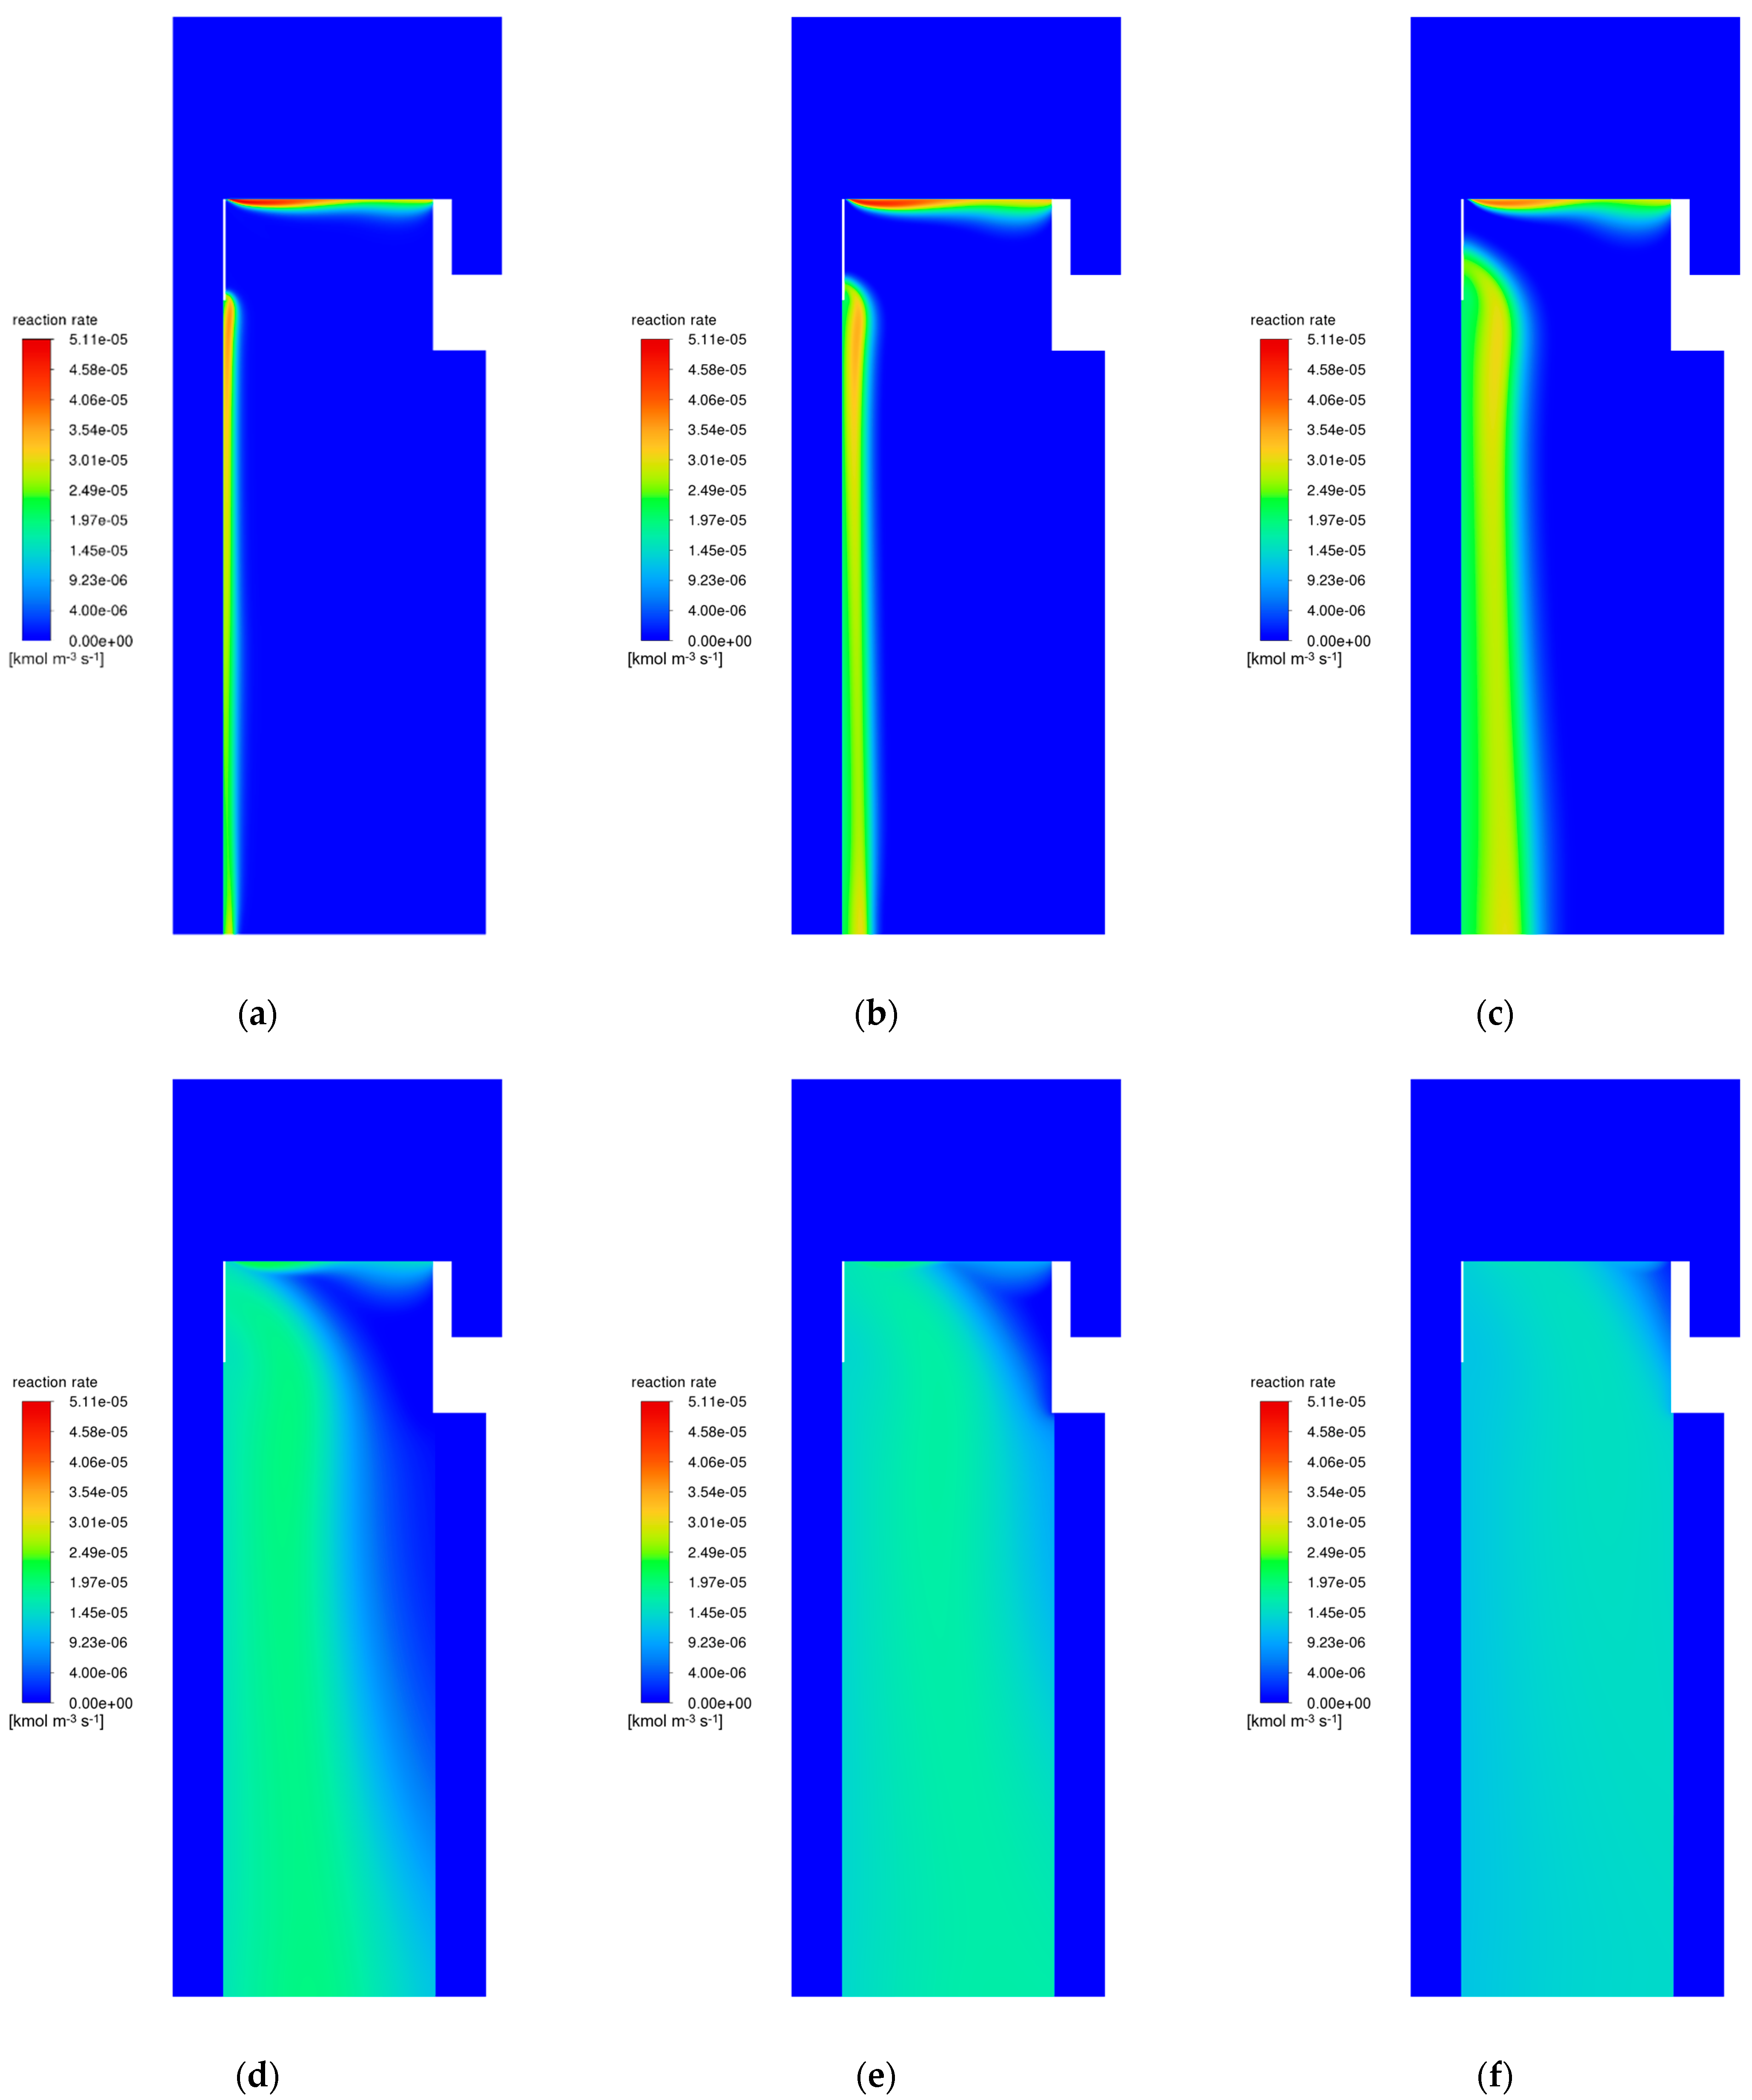
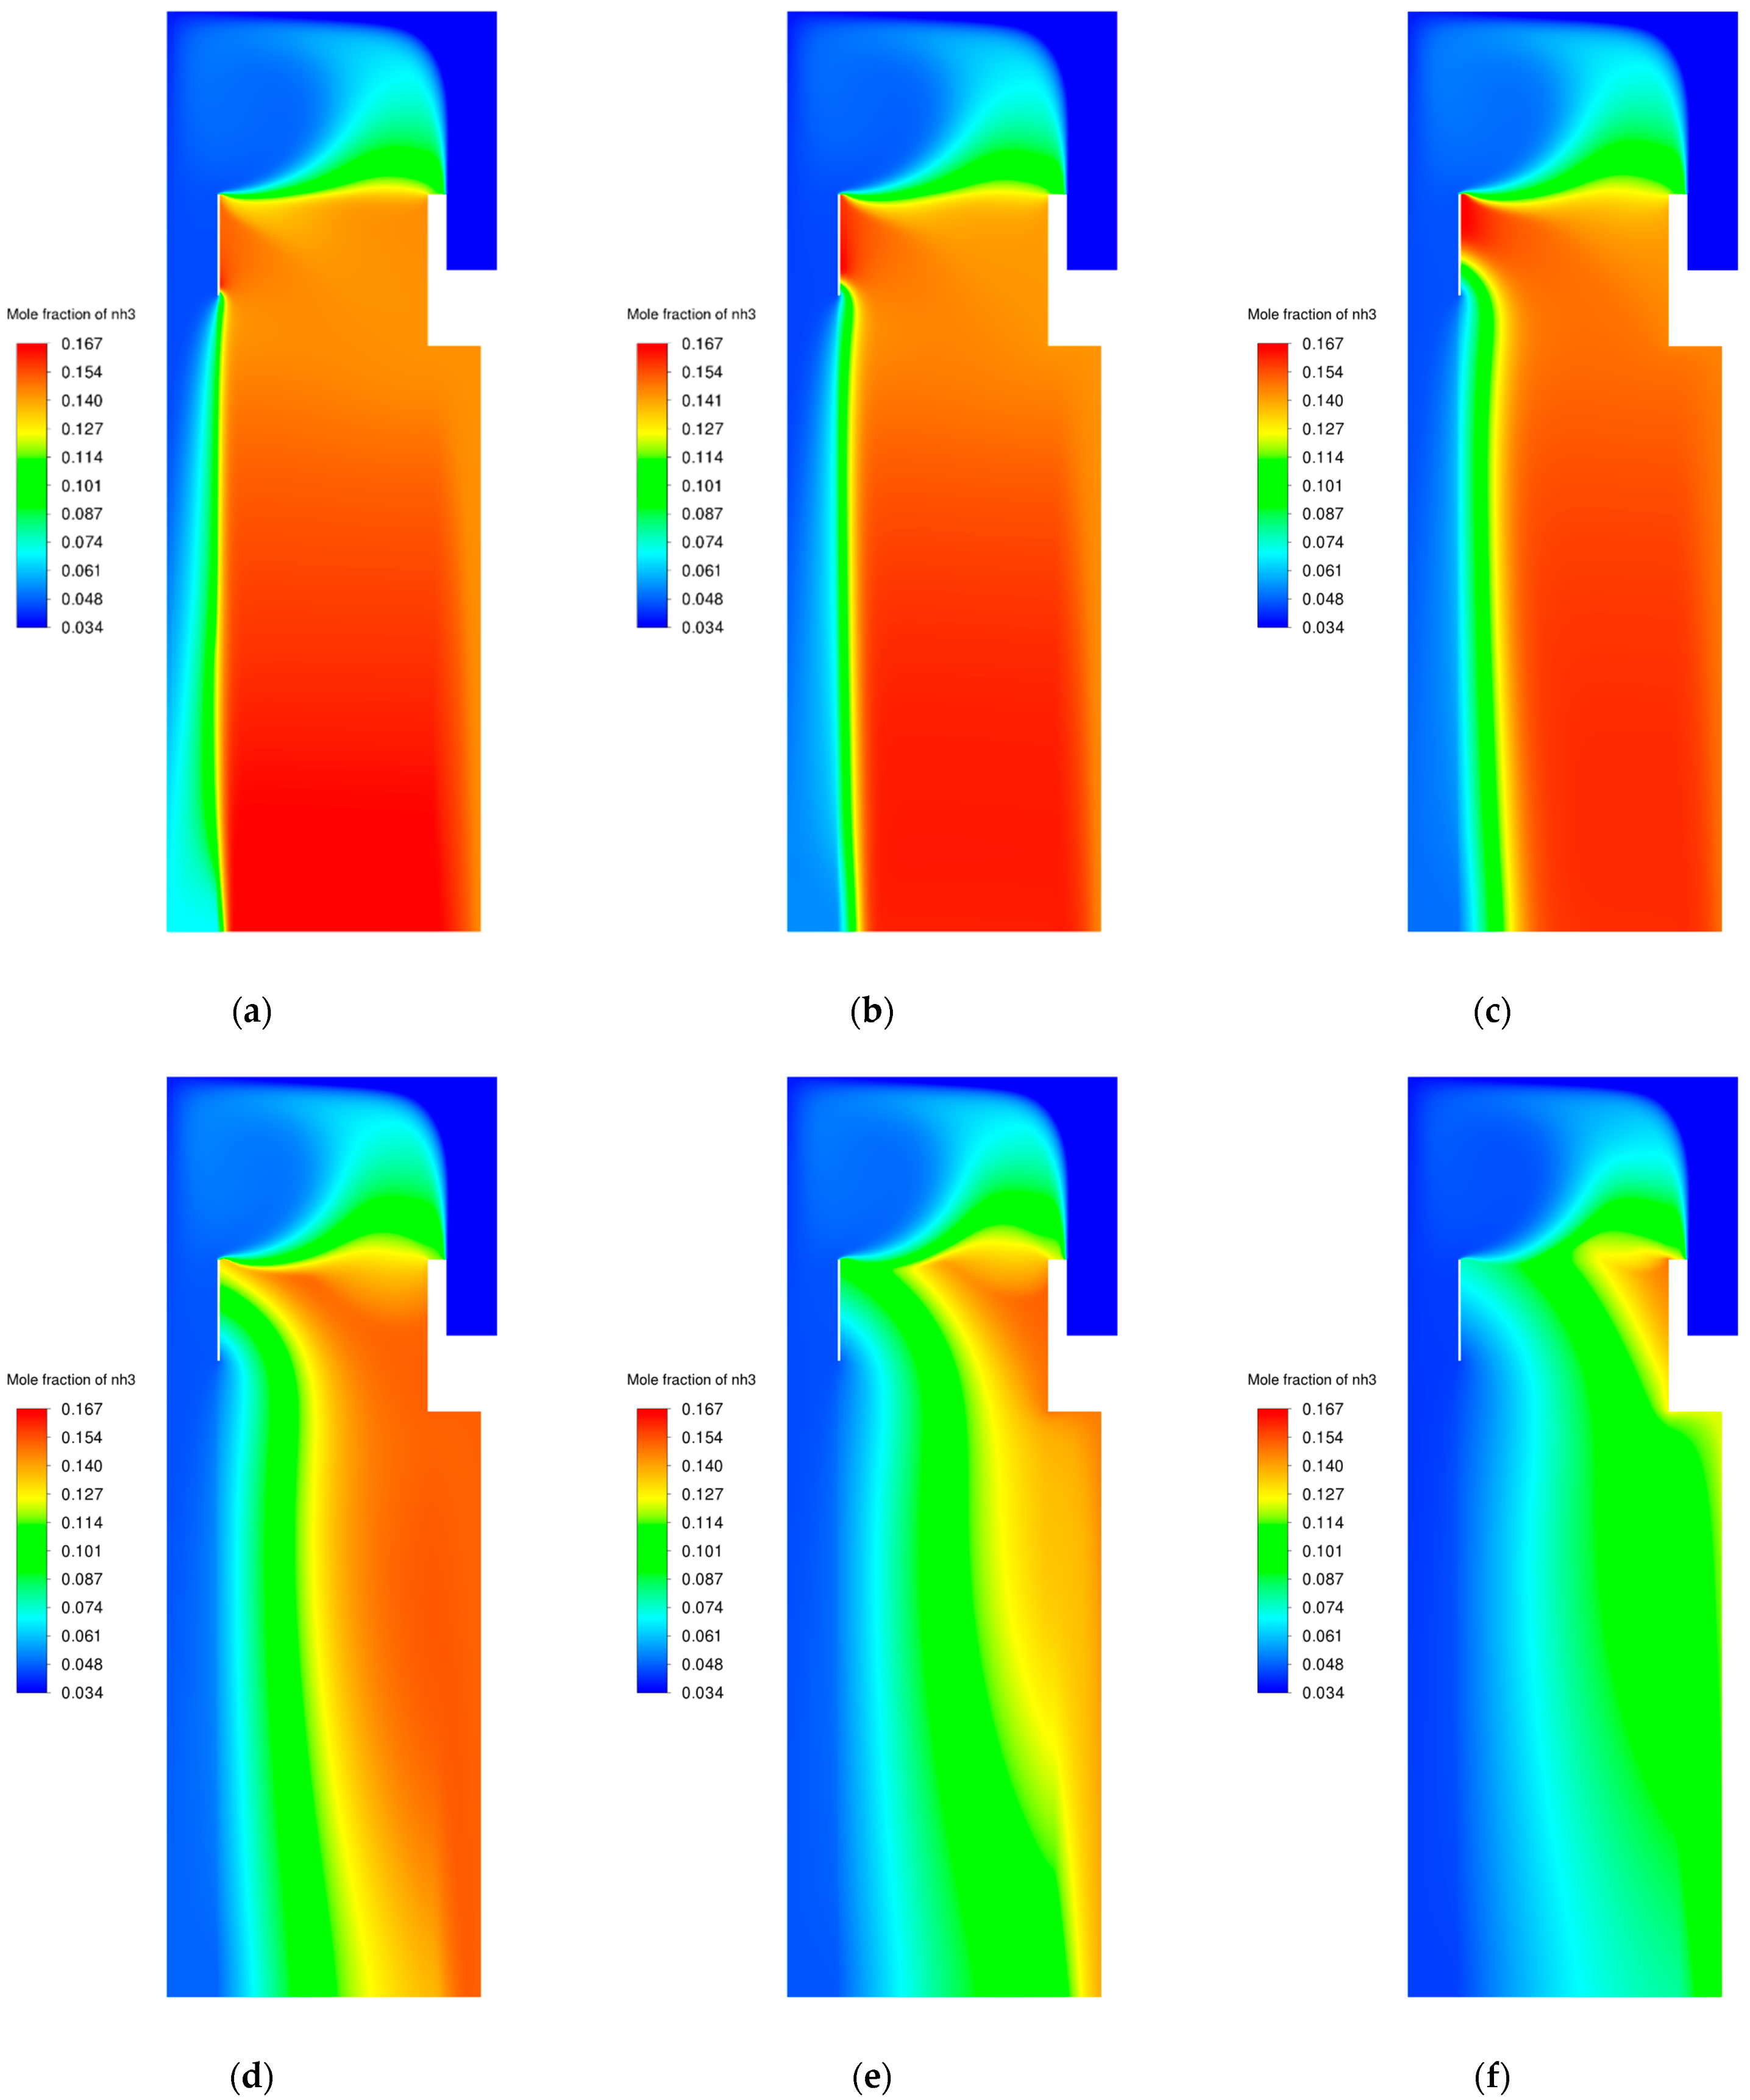
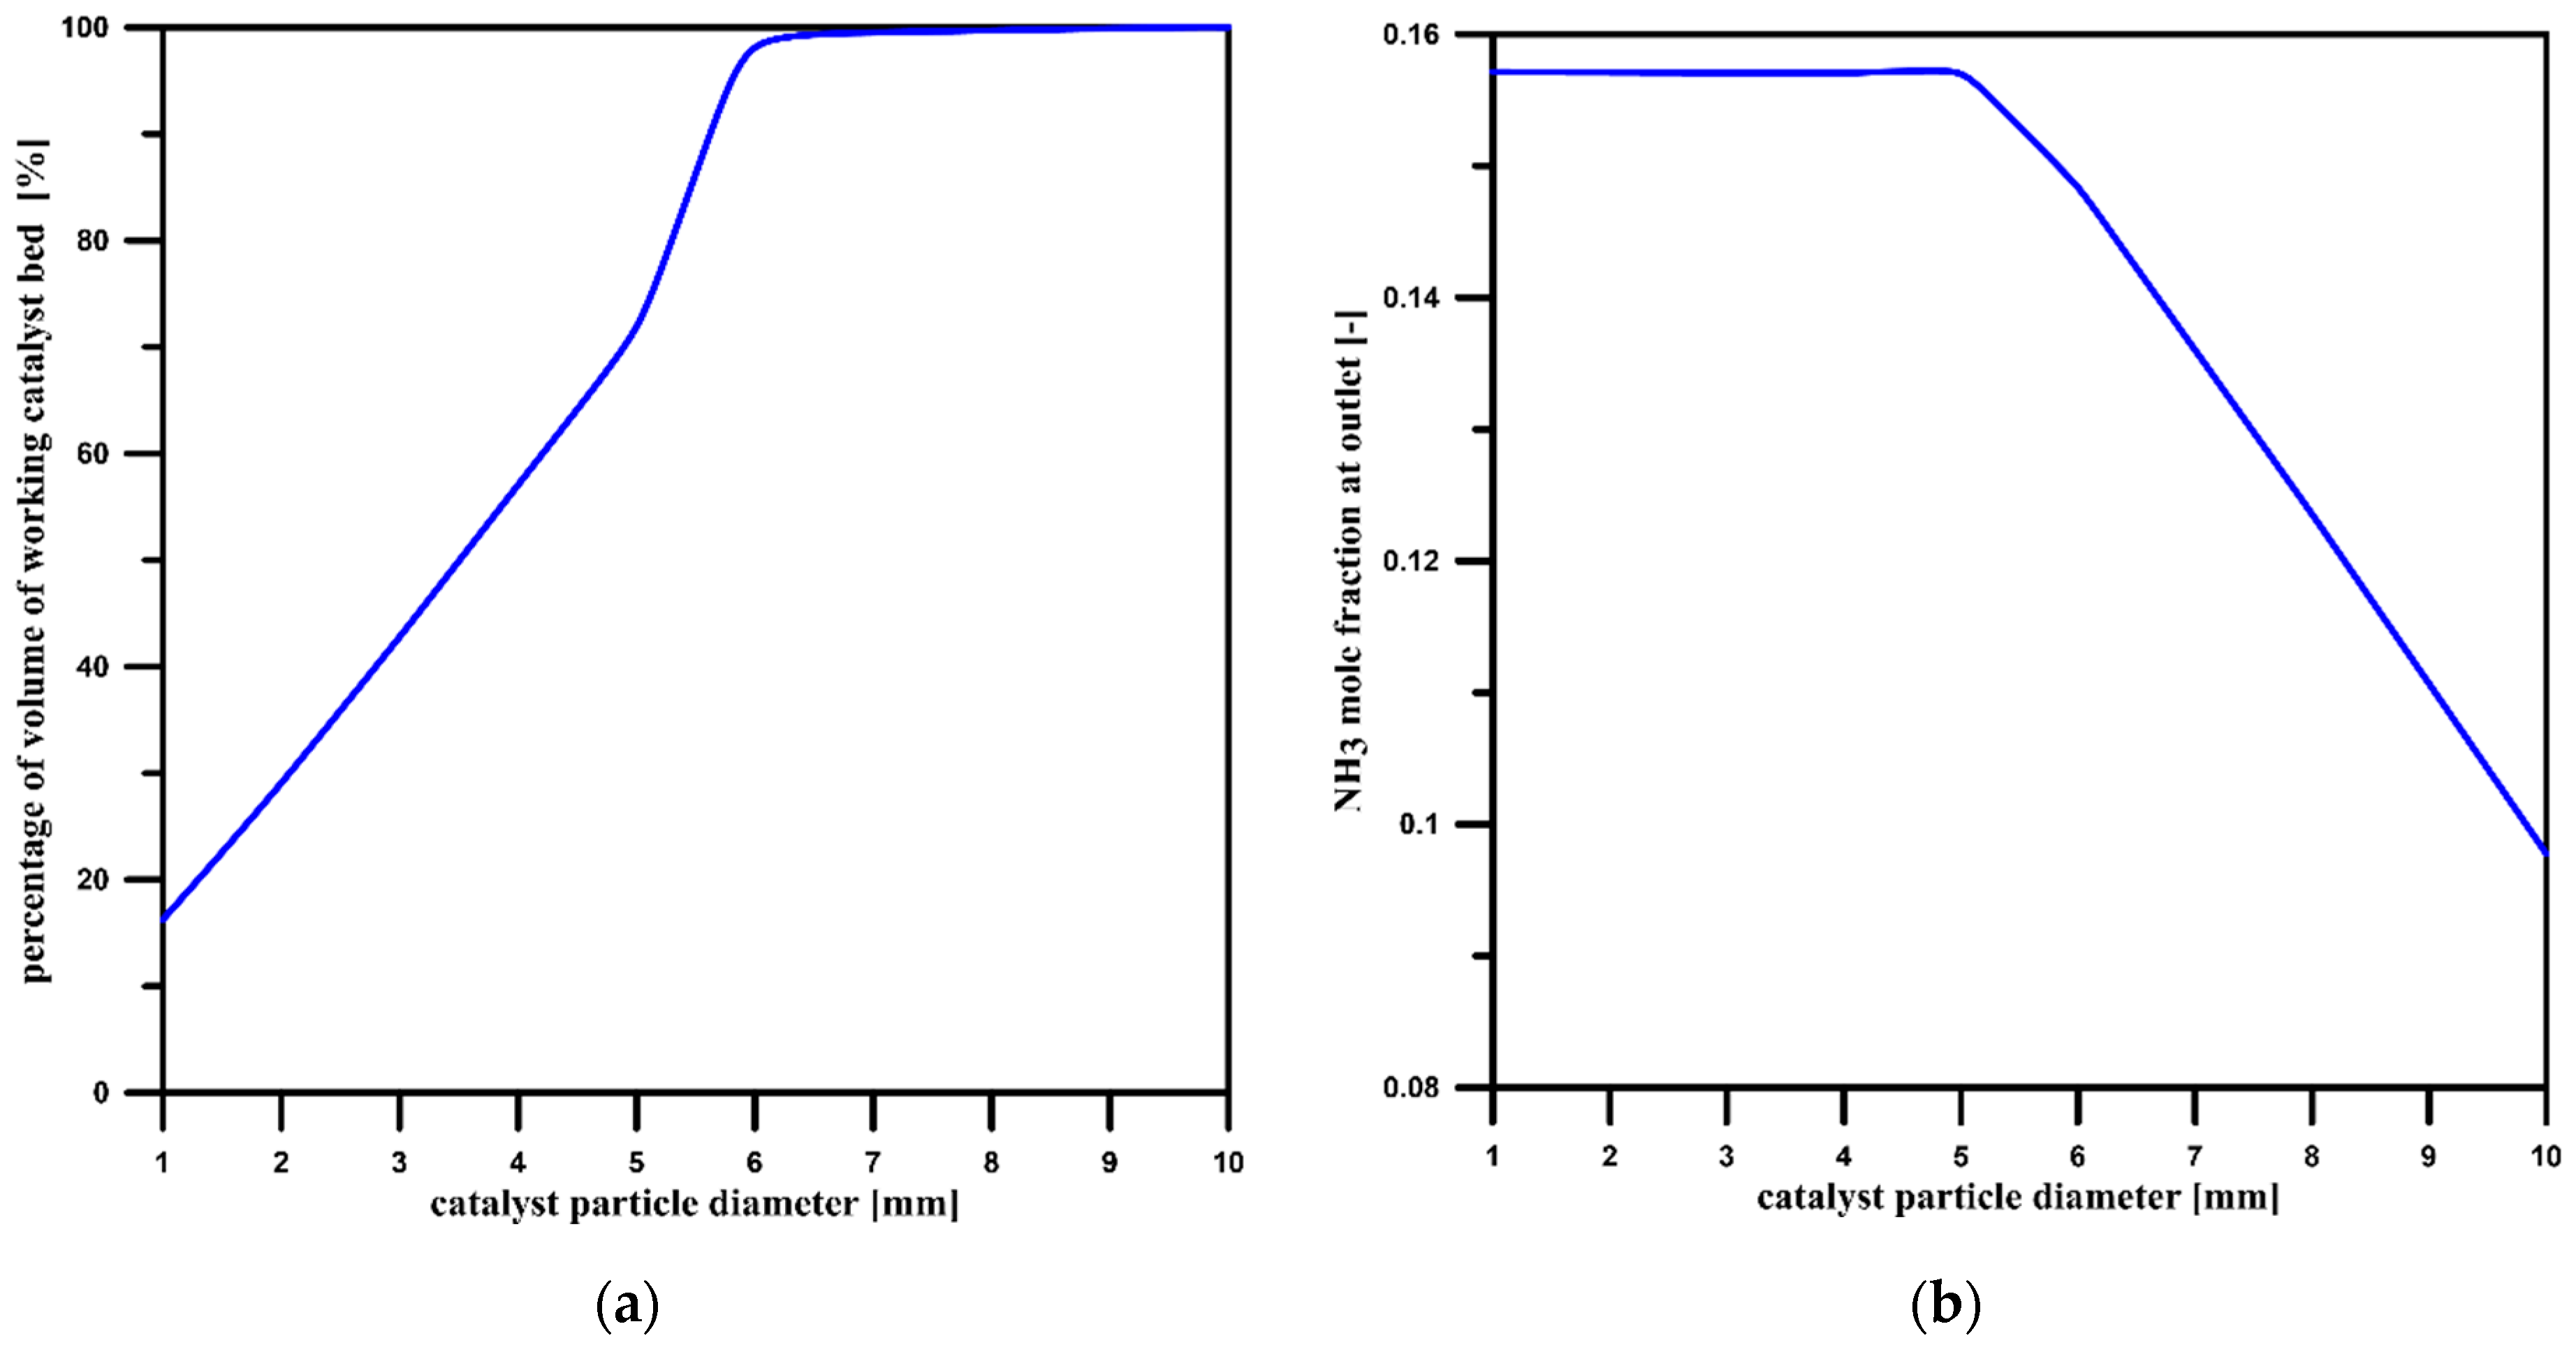
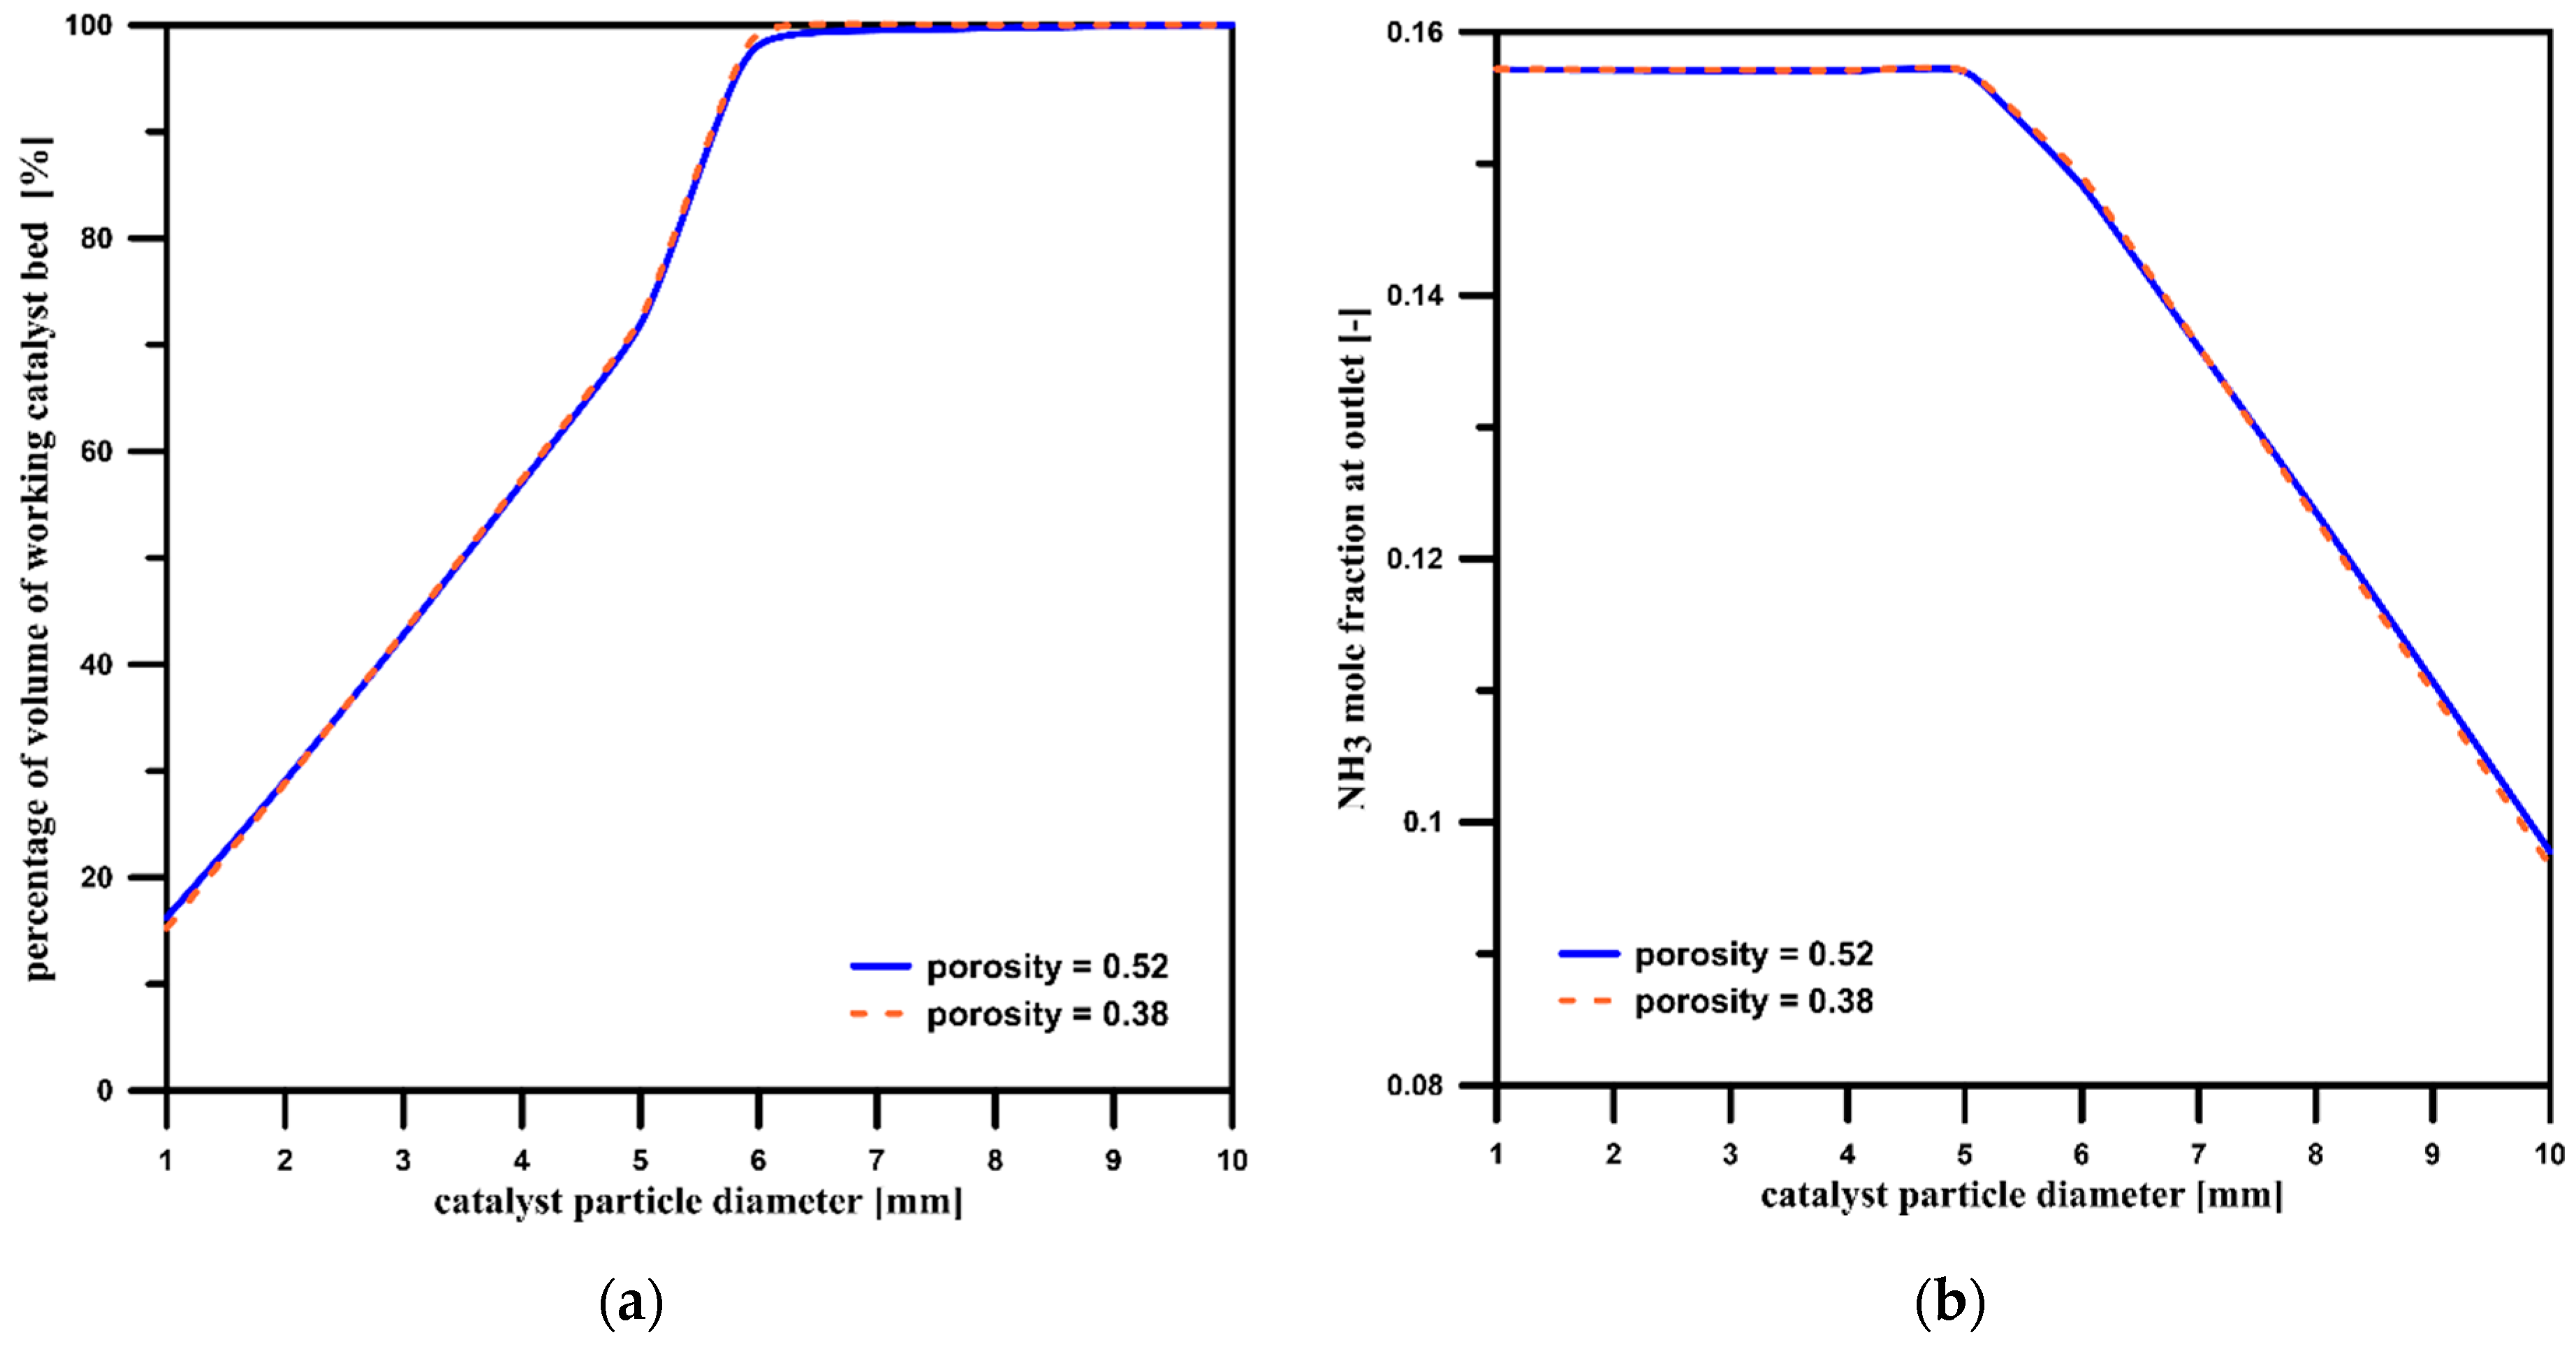
3.2. Catalyst Particle Size Influence
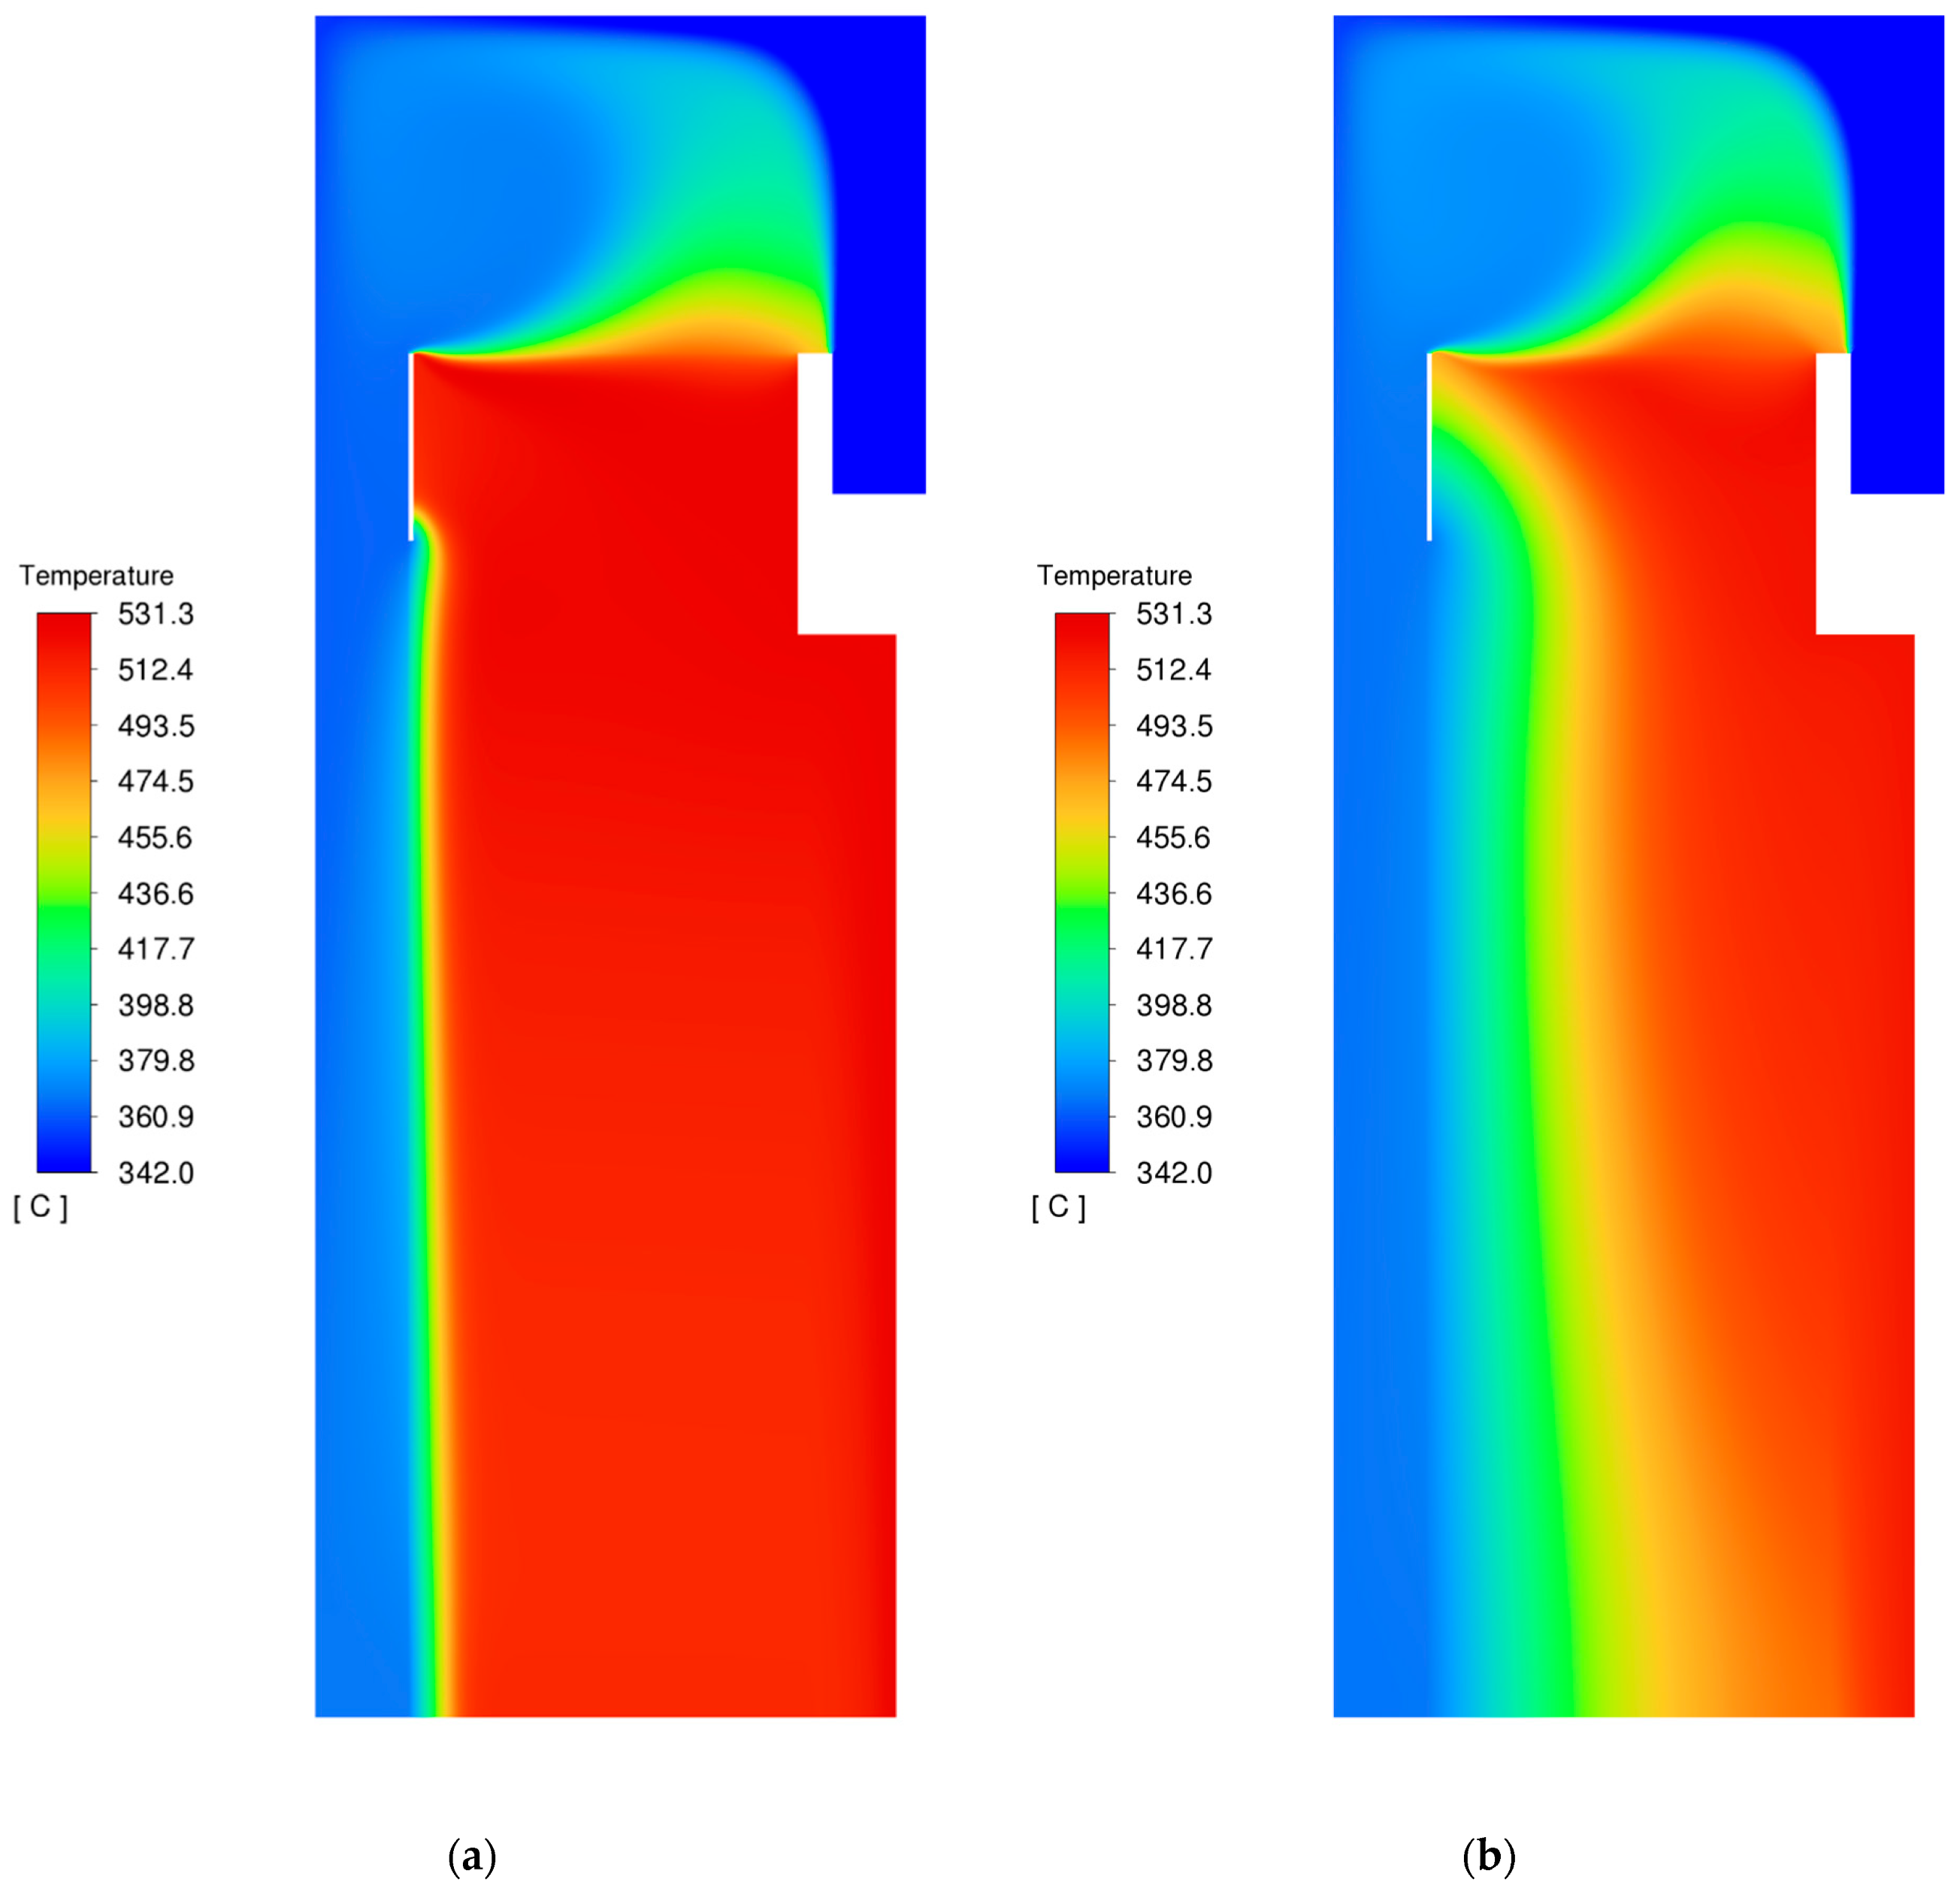
3.3. Temperature
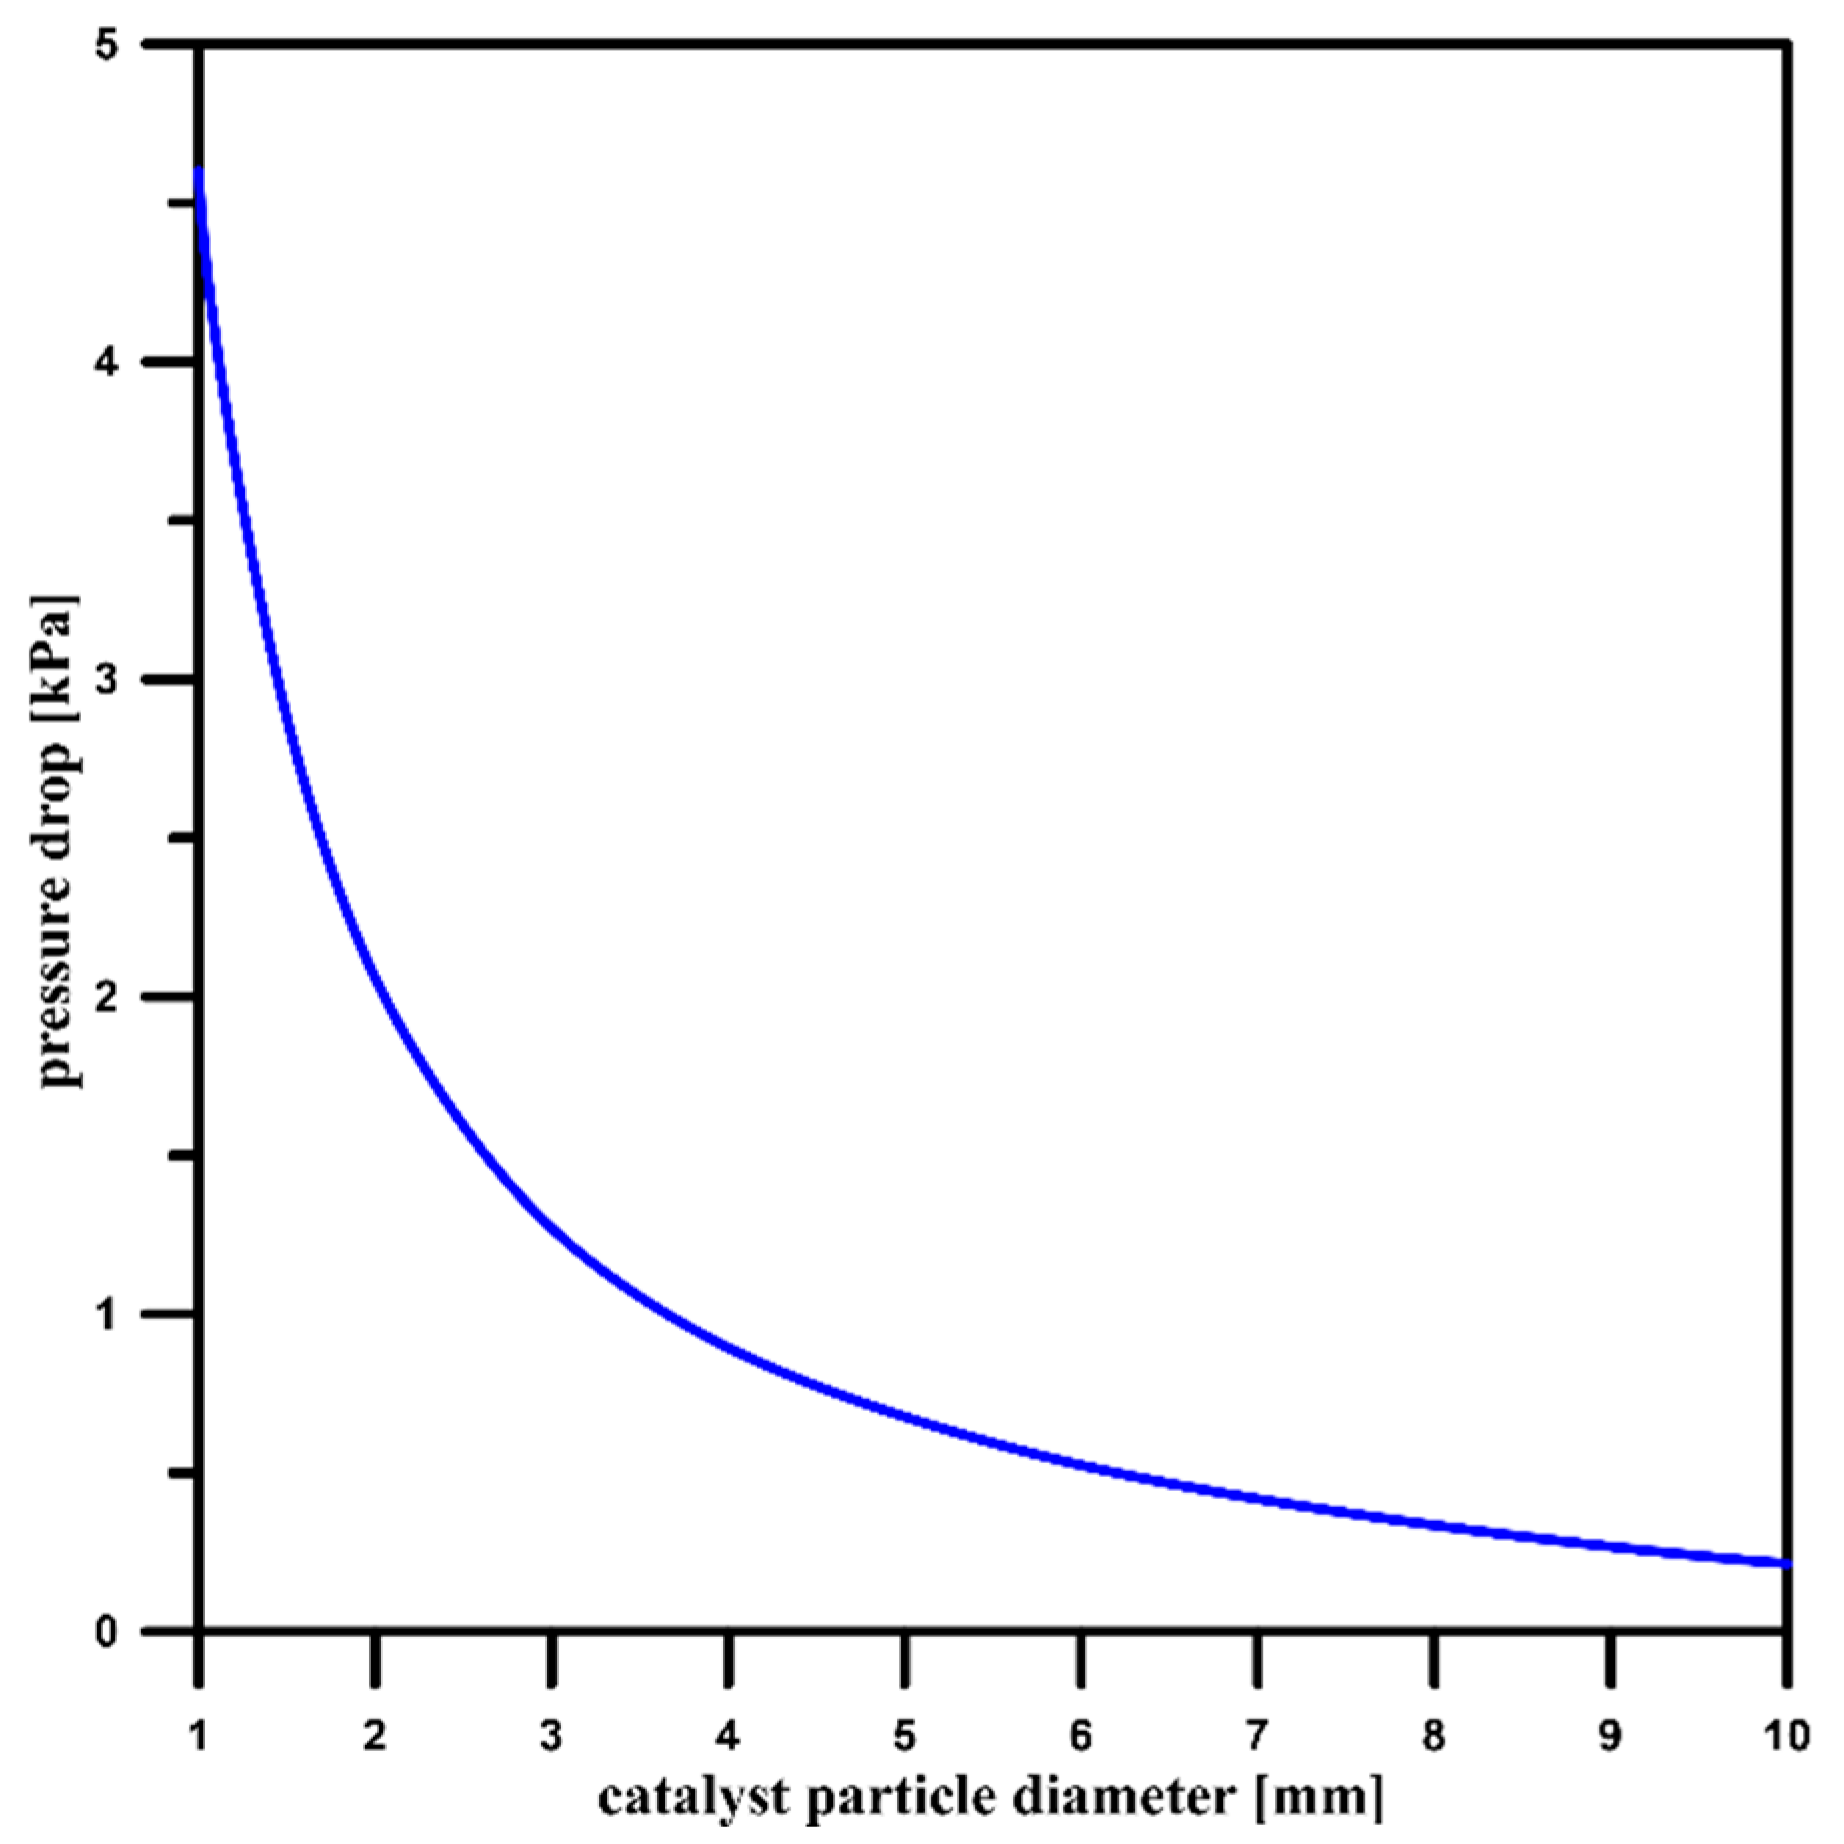
3.4. Pressure Drop
3.5. The Influence of the Catalyst Bed’s Porosity
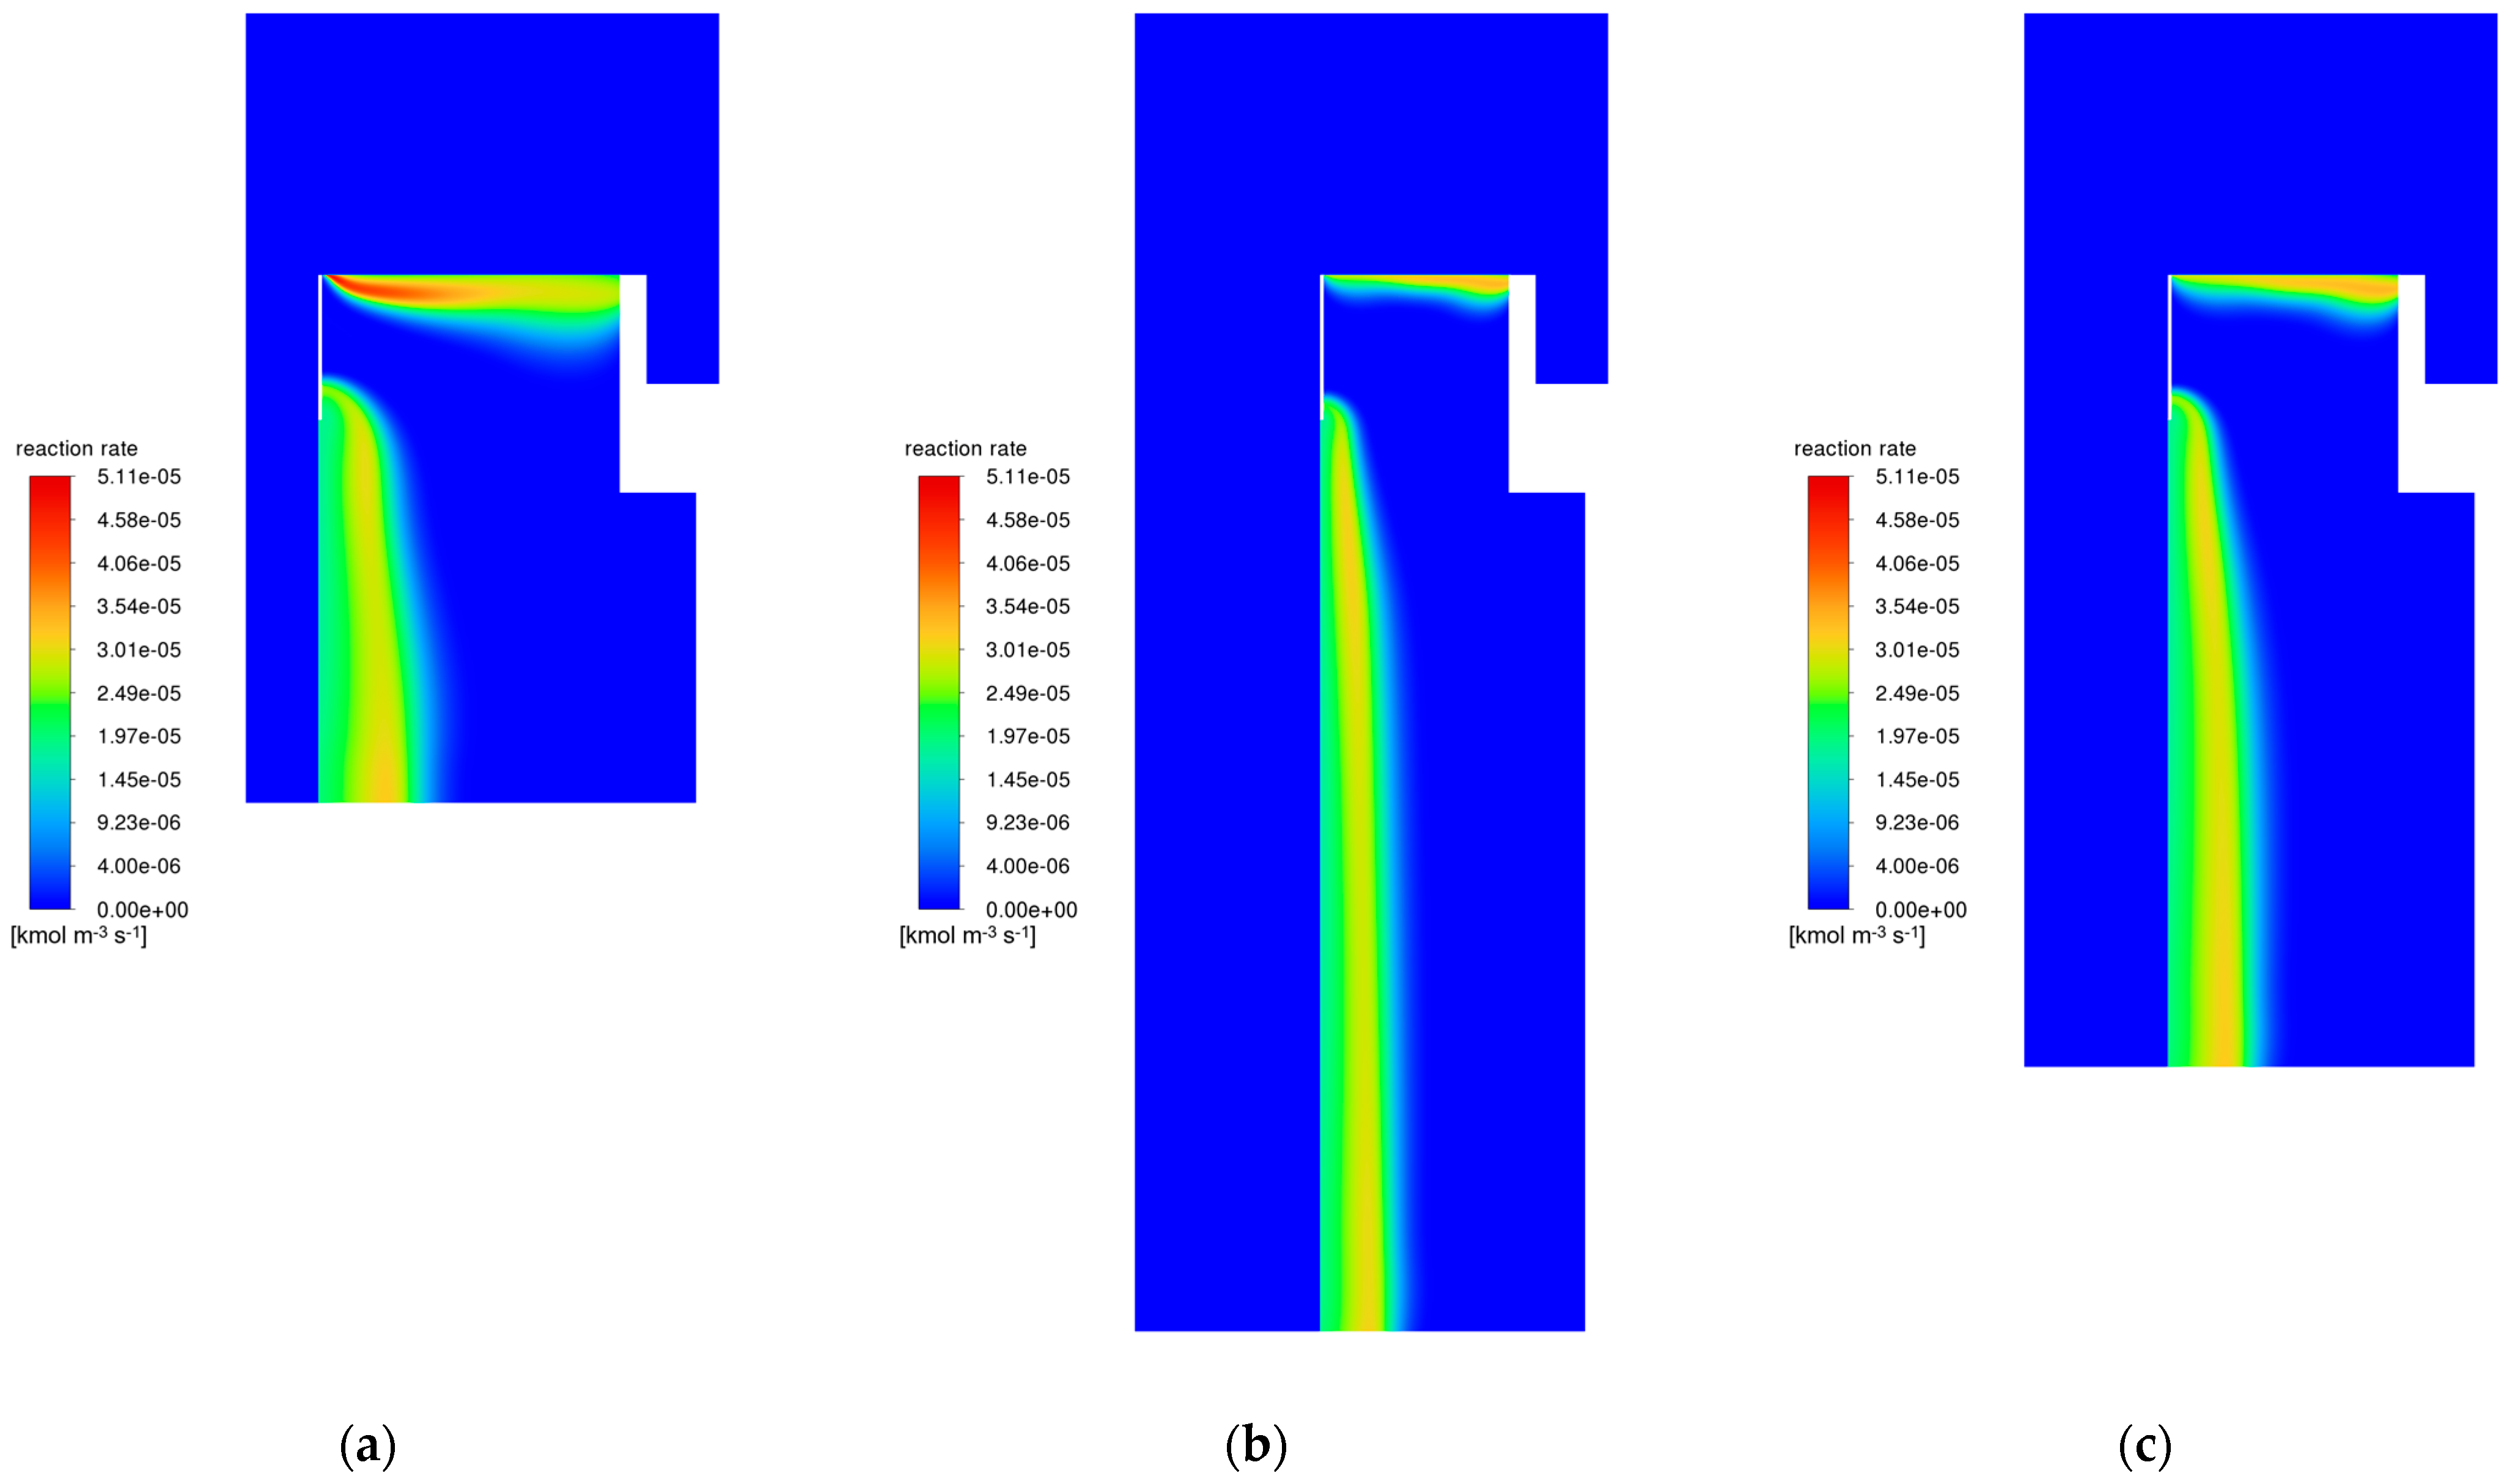
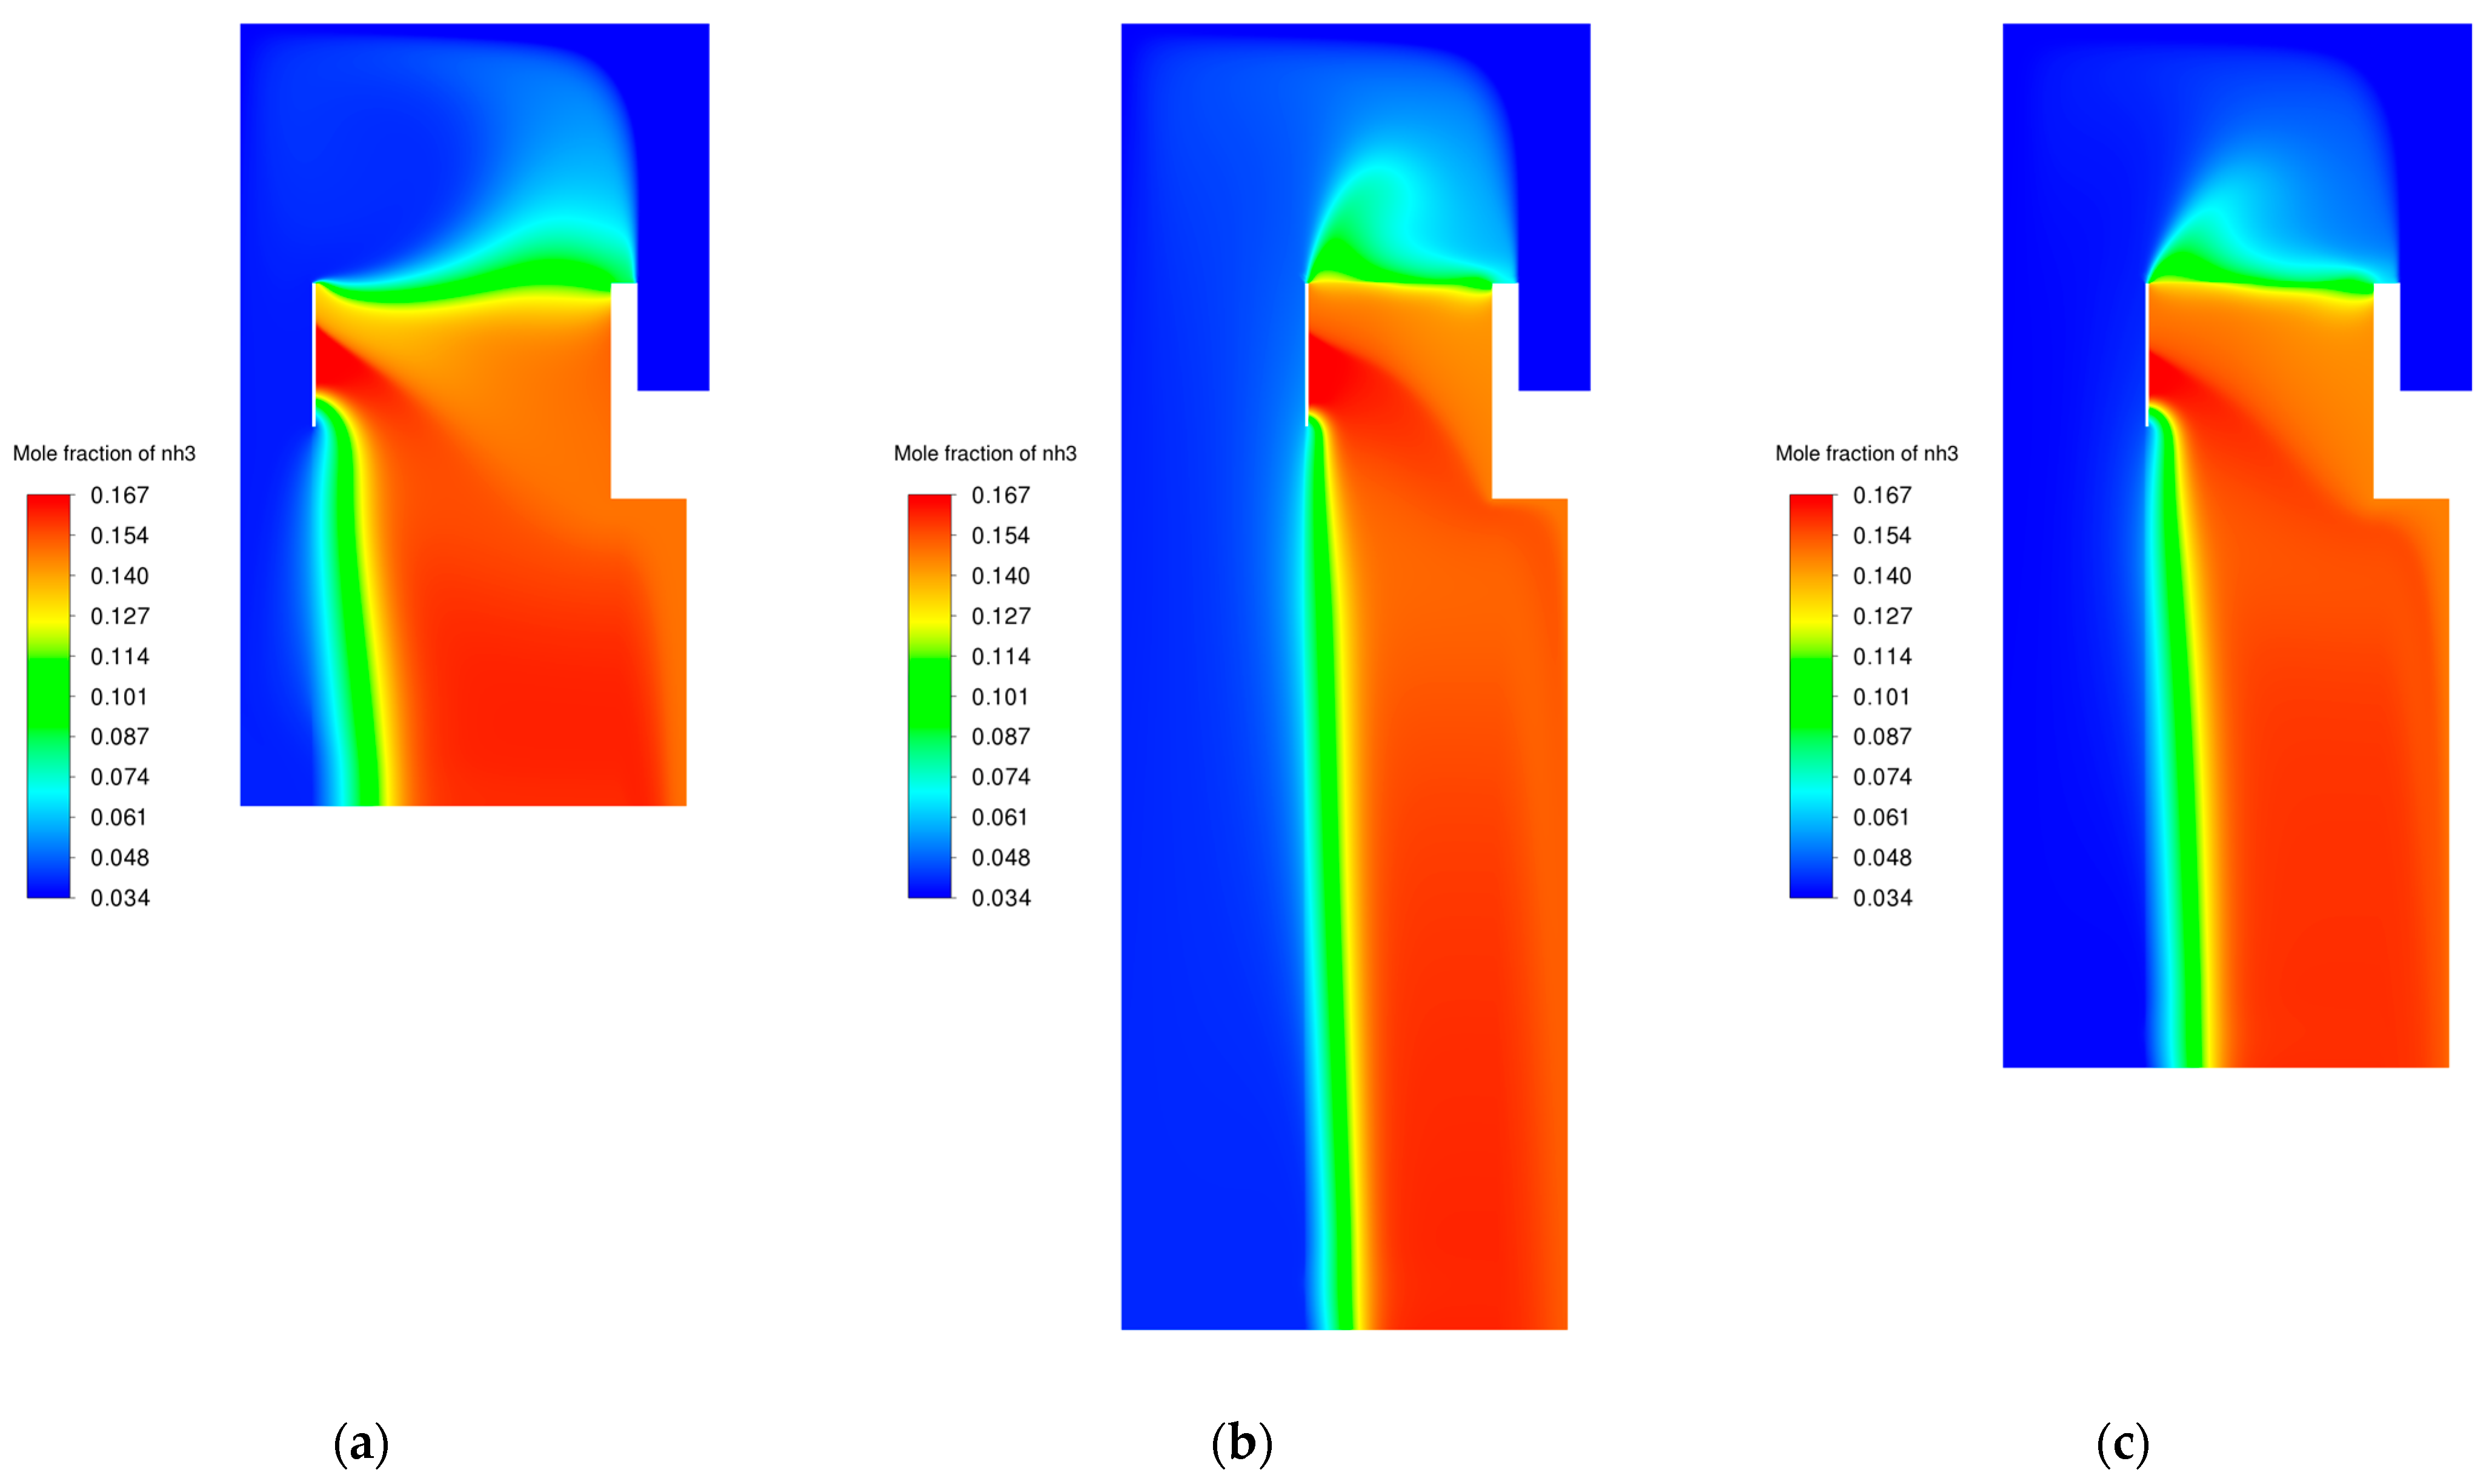
3.6. Modifications of the Catalyst Bed
3.7. Verification with the Literature Data
4. Conclusions
Author Contributions
Funding
Data Availability Statement
Conflicts of Interest
Nomenclature
| Latin symbols: | |
| A | pre-exponential factor, kmol m−3 h−1 |
| Afs | interfacial area density (ratio of the area of the fluid-solid interface and the volume of the porous zone), m−1 |
| ai | activity of component i |
| bi | constants |
| Ci,j,Di,j | prescribed matrices |
| dp | catalyst particle diameter, m |
| CA | mole fraction of component A in a plug-flow reactor |
| CAL | mole fraction of component A at the outlet of the plug-flow reactor |
| CAL_CFD | ammonia mole fraction in CFD simulation at the calculated length of the plug flow reactor |
| CA0 | mole fraction of component A at the inlet of a plug-flow reactor |
| C1 | viscous resistance, m−2 |
| C2 | inertial resistance factor, m−1 |
| E | activation Energy, cal mol−1 |
| Ef | total fluid energy, J |
| Es | total solid medium energy, J |
| fi | fugacity of component i in a mixture |
| fi* | fugacity of component i at standard state |
| fi0 | fugacity of a pure component i at temperature and pressure of the system |
| F2 | parameter |
| Gb | generation of turbulence kinetic energy due to buoyancy |
| Gk | generation of turbulence kinetic energy due to the mean velocity gradients |
| Gω | generation of specific dissipation rates due to the mean velocity gradients |
| Gωb | generation of specific dissipation rate due to buoyancy |
| hi | enthalpy of the component i, J kg−1 |
| hfs | heat transfer coefficient for the fluid-solid interface, W m−2 K−1 |
| I | unit tensor |
| diffusion flux of species i, kg m−2 s−1 | |
| k | reaction rate constant, s−1 |
| k | turbulent kinetic energy, m2 s−2 |
| Ka | equilibrium constant in terms of activities |
| kf | fluid phase thermal conductivity, W m−1 K−1 |
| ks | solid medium thermal conductivity, W m−1 K−1 |
| L | length of the plug-flow reactor, m |
| molar flow of nitrogen at the inlet, kmol s−1 | |
| molar flow of nitrogen at the outlet, kmol s−1 | |
| P | pressure, Pa, atm |
| R | universal gas constant cal K−1 mol−1 |
| rA | the formation rate of component A in a plug-flow reactor |
| Ri | net rate of production of species i by chemical reaction |
| ammonia formation rate, kmol m−3 s−1 | |
| S | strain rate magnitude, s−1 |
| Si | rate of creation of species i by addition from the dispersed phase plus any user-defined sources |
| Si | source term for the i (x, y, or z) momentum equation |
| Sk | user-defined source term of turbulence kinetic energy |
| Sv | surface-to-volume ratio, m−1 |
| Sω | user-defined source term for a specific dissipation rate |
| fluid enthalpy source term | |
| solid enthalpy source term | |
| T | temperature, °C, K |
| t | time, s |
| Tf | temperature of the fluid, K |
| Ts | temperature of the solid medium, K |
| u | continuous phase velocity, m s−1 |
| ui, vi | continuous phase velocity in the i direction, m s−1 |
| average fluctuation of continuous phase velocity, m s−1 | |
| |v| | magnitude of velocity, m s−1 |
| overall velocity vector, m s−1 | |
| xi, xj | computational domain dimensions, m |
| y | distance, m |
| y+ | dimensionless wall distance |
| yi | mole fraction of component i |
| Yi | local mass fraction of species i |
| Yk | dissipation of turbulence kinetic energy due to turbulence |
| Yω | dissipation of a specific dissipation rate due to turbulence |
| Greek symbols: | |
| α | parameter |
| α | permeability, m2 |
| α*, α1 | coefficients |
| γi | activity coefficient of component i |
| ε | porosity of the medium |
| η | conversion |
| μ | continuous phase dynamic viscosity, Pa·s |
| μt | continuous phase turbulent viscosity, Pa·s |
| ξ | effectiveness factor |
| ρ | continuous phase density, kg m−3 |
| ρf | fluid denstity, kg m−3 |
| ρs | solid medium density, kg m−3 |
| σk | turbulent Prandtl number for k |
| σω | turbulent Prandtl number for ω |
| ψ | sphericity |
| ω | specific dissipation rate, s−1 |
| Acronyms: | |
| CFD | Computational Fluid Dynamics |
| SIMPLE | Semi-Implicit Method for Pressure-Linked Equations |
References
- Hoque, A.; Mohiuddin, M.; Su, Z. Effects of Industrial Operations on Socio-Environmental and Public Health Degradation: Evidence from a Least Developing Country (LDC). Sustainability 2018, 10, 3948. [Google Scholar] [CrossRef]
- Klumpp, A.; Domingos, M.; Klumpp, G. Assessment of the Vegetation Risk by Fluoride Emissions from Fertiliser Industries at Cubatão, Brazil. Sci. Total Environ. 1996, 10, 219–228. [Google Scholar] [CrossRef]
- Roser, M.; Ritchie, H. Hunger and Undernourishment. Available online: https://ourworldindata.org/hunger-and-undernourishment (accessed on 14 September 2022).
- Global Market Insights Fertilizer Market Size, Share & Forecasts 2022–2030. Available online: https://www.gminsights.com/industry-analysis/fertilizer-market (accessed on 11 May 2023).
- Maximize Market Research Water Soluble Fertilizer Market: Increasing Acceptance of Micro-Irrigation Practices Is Expected to Drive the Market. Available online: https://www.maximizemarketresearch.com/market-report/global-water-soluble-fertilizer-market/33171/ (accessed on 11 May 2023).
- Research and Markets ltd Fertilizer Market: Global Industry Trends, Share, Size, Growth, Opportunity and Forecast 2023–2028. Available online: https://www.researchandmarkets.com/reports/5768989/fertilizer-market-global-industry-trends (accessed on 11 May 2023).
- Statista Fertilizer Industry Worldwide. Available online: https://www.statista.com/study/106183/global-fertilizer-industry/ (accessed on 9 May 2023).
- Ritchie, H. To Protect the World’s Wildlife We Must Improve Crop Yields—Especially across Africa. Available online: https://ourworldindata.org/yields-habitat-loss (accessed on 9 May 2023).
- Modak, J.M. Haber Process for Ammonia Synthesis. Resonance 2011, 16, 9. [Google Scholar] [CrossRef]
- Schlögl, R. Ammonia Synthesis. In Handbook of Heterogeneous Catalysis 8 Volume Set, 2nd ed.; Wiley: New York, NY, USA, 2008; Volume 5, pp. 2501–2575. ISBN 978-3-527-31241-2. [Google Scholar]
- Tamaru, K. The History of the Fevelopment of Ammonia Synthesis. In Catalytic Ammonia Synthesis: Fundamentals and Practice; Fundamental and Applied Catalysis; Springer: Boston, MA, USA, 1991; ISBN 978-1-4757-9594-3. [Google Scholar]
- Hooper, C.W. Ammonia Synthesis: Commercial Practice. In Catalytic Ammonia Synthesis: Fundamentals and Practice; Fundamental and Applied Catalysis; Springer: Boston, MA, USA, 1991; ISBN 978-1-4757-9594-3. [Google Scholar]
- Singh, C.P.P.; Saraf, D.N. Simulation of Ammonia Synthesis Reactors. Ind. Eng. Chem. Proc. Des. Dev. 1979, 18, 364–370. [Google Scholar] [CrossRef]
- Jorqueira, D.S.S.; Neto, A.M.B.; Rodrigues, M.T.M. Modeling and Numerical Simulation of Ammonia Synthesis Reactors Using Compositional Approach. ACES 2018, 8, 124–143. [Google Scholar] [CrossRef]
- Elnashaie, S.S.E.H.; Mahfouz, A.T.; Elshishini, S.S. Digital Simulation of an Industrial Ammonia Reactor. Chem. Eng. Process. Process. Intensif. 1988, 23, 165–177. [Google Scholar] [CrossRef]
- Kasiri, N.; Hosseini, A.R.; Moghadam, M. Dynamic Simulation of an Ammonia Synthesis Reactor. In Computer Aided Chemical Engineering; Elsevier: Amsterdam, The Netherlands, 2003; Volume 14, pp. 695–700. ISBN 978-0-444-51368-7. [Google Scholar]
- Panahandeh, M.R.; Fathikaljahi, J.; Taheri, M. Steady-State Modeling and Simulation of an Axial-Radial Ammonia Synthesis Reactor. Chem. Eng. Technol. 2003, 26, 666–671. [Google Scholar] [CrossRef]
- Dashti, A.; Khorsand, K.; Marvast, M.A.; Kakavand, M. Modeling and Simulation of Ammonia Synthesis Reactor. Petroleum and Coal 2006, 48, 15–23. [Google Scholar]
- Azarhoosh, M.J.; Farivar, F.; Ale Ebrahim, H. Simulation and Optimization of a Horizontal Ammonia Synthesis Reactor Using Genetic Algorithm. RSC Adv. 2014, 4, 13419–13429. [Google Scholar] [CrossRef]
- Dyson, D.C.; Simon, J.M. Kinetic Expression with Diffusion Correction for Ammonia Synthesis on Industrial Catalyst. Ind. Eng. Chem. Fund. 1968, 7, 605–610. [Google Scholar] [CrossRef]
- Mirvakili, A.; Eksiri, Z.; Biniaz, P.; Mohaghegh, N. Two-Dimensional Mathematical Modeling of an Industrial Ammonia Synthesis Reactor with CFD Analysis. J. Taiwan Inst. Chem. Eng. 2021, 121, 1–19. [Google Scholar] [CrossRef]
- Araújo, A.; Skogestad, S. Control Structure Design for the Ammonia Synthesis Process. Comput. Chem. Eng. 2008, 32, 2920–2932. [Google Scholar] [CrossRef]
- Jaymes Dionne, C.; Gutowska, I.; Brian Jackson, R. CFD Simulations to Characterize near Wall Heat Transfer in High Prandtl Number Packed Bed Conditions. Nucl. Eng. Des. 2022, 396, 111868. [Google Scholar] [CrossRef]
- Lee, J.-J.; Yoon, S.-J.; Park, G.-C.; Lee, W.-J. Turbulence-Induced Heat Transfer in PBMR Core Using LES and RANS. J. Nucl. Sci. Technol. 2007, 44, 985–996. [Google Scholar] [CrossRef]
- Ansys® Fluent, Release 2021 R2, Help System, Fluent Theory Guide; ANSYS, Inc.: Canonsburg, PA, USA, 2021.
- Gramatica, G.; Pernicone, N. Kinetics of Ammonia Synthesis and Influence on Converter Design. In Catalytic Ammonia Synthesis: Fundamentals and Practice; Fundamental and Applied Catalysis; Springer: Boston, MA, USA, 1991; ISBN 978-1-4757-9594-3. [Google Scholar]
- Tennison, S.R. Alternative Noniron Catalysts. In Catalytic Ammonia Synthesis: Fundamentals and Practice; Fundamental and Applied Catalysis; Springer: Boston, MA, USA, 1991; ISBN 978-1-4757-9594-3. [Google Scholar]
- Gillespie, L.J.; Beattie, J.A. The Thermodynamic Treatment of Chemical Equilibria in Systems Composed of Real Gases. I. An Approximate Equation for the Mass Action Function Applied to the Existing Data on the Haber Equilibrium. Phys. Rev. 1930, 36, 743–753. [Google Scholar] [CrossRef]

| Species Name | Concentration (Mole Fractions) |
|---|---|
| N2 | 0.2093 |
| H2 | 0.6280 |
| NH3 | 0.0347 |
| CH4 (inert) | 0.0939 |
| Ar (inert) | 0.0341 |
| Parameter | Value |
|---|---|
| pressure (atm) | 220 |
| temperature (°C) | 342 |
| flow rate (kmol h−1) | 19,622.17 |
| flow rate (kg s−1) | 57.7154 |
| velocity (m s−1) | 6 |
| Name | Value | Source |
|---|---|---|
| material | magnetite | [11] |
| particle diameter (mm) | vary from 1 to 10 | [26,27] |
| porosity (-) | 0.52 | [27] |
| sphericity (-) | 0.65 | [26] |
| Particle Diameter (mm) | Surface-to-Volume Ratio (m−1) | Viscous Resistance (m−2) | Inertial Resistance (m−1) |
|---|---|---|---|
| 1 | 9231 | 2.46 × 10⁸ | 11,948 |
| 1.5 | 6154 | 1.09 × 10⁸ | 7965 |
| 2 | 4615 | 6.14 × 10⁷ | 5974 |
| 3 | 3077 | 2.73 × 10⁷ | 3983 |
| 4 | 2308 | 1.54 × 10⁷ | 2987 |
| 5 | 1846 | 9.83 × 10⁶ | 2390 |
| 6 | 1538 | 6.83 × 10⁶ | 1991 |
| 8 | 1154 | 3.84 × 10⁶ | 1494 |
| 10 | 923 | 2.46 × 10⁶ | 1195 |
| Symbol | Name | Value | Unit |
|---|---|---|---|
| A | pre-exponential factor | 8.849 × 10¹⁴ | kmol m−3 h−1 |
| E | activation energy | 40,765 | cal mol−1 |
| R | universal gas constant | 1.987 | cal K−1 mol−1 |
| Pressure (atm) | b0 | b1 | b2 | b3 | b4 | b5 | b6 |
|---|---|---|---|---|---|---|---|
| 150 | −17.539096 | 0.076978 | 6.900548 | −1.082790 × 10⁻⁴ | −26.42469 | 4.927648 × 10⁻⁸ | 38.93727 |
| 225 | −8.2125534 | 0.037741 | 6.190112 | −5.354571 × 10⁻⁵ | −20.86963 | 2.379142 × 10⁻⁸ | 27.88403 |
| 300 | −4.6757259 | 0.023549 | 4.687353 | −3.463308 × 10⁻⁵ | −11.28031 | 1.540881 × 10⁻⁸ | 10.46627 |
| Particle Diameter (mm) | Viscous Resistance (m−2) | Inertial Resistance (m−1) |
|---|---|---|
| 1 | 1.05 × 10⁹ | 39,547 |
| 1.5 | 4.67 × 10⁸ | 26,364 |
| 2 | 2.63 × 10⁸ | 19,773 |
| 3 | 1.17 × 10⁸ | 13,182 |
| 4 | 6.57 × 10⁷ | 9887 |
| 5 | 4.20 × 10⁷ | 7909 |
| 6 | 2.92 × 10⁷ | 6591 |
| 8 | 1.64 × 10⁷ | 4943 |
| 10 | 1.05 × 10⁷ | 3955 |
| Modifications | A | B | H |
|---|---|---|---|
| original | 840.5 | 200 | 2190 |
| variant 1 | 840.5 | 200 | 1455 |
| variant 2 | 530 | 510 | 2910 |
| variant 3 | 645 | 396 | 2183 |
| Modification Variant | Catalyst Bed Volume [m3] | Percentage “Working” Volume Bed [%] | NH3 Mole Fraction at the Outlet [-] |
|---|---|---|---|
| original | 11.465 | 29.08 | 0.157 |
| variant 1 | 5.711 | 55.06 | 0.157 |
| variant 2 | 5.719 | 56.30 | 0.157 |
| variant 3 | 5.716 | 54.88 | 0.157 |
| Parameter at the Outlet of the Catalyst Bed | Experimental Data | Calculated Data | Error [%] |
|---|---|---|---|
| NH3 mole fraction [-] | 0.1403 | 0.1401 | 0.11 |
| N2 mole fraction [-] | 0.1796 | 0.1796 | 0.04 |
| H2 mole fraction [-] | 0.5390 | 0.5391 | 0.03 |
| CH4 mole fraction [-] | 0.1035 | 0.1034 | 0.03 |
| Ar mole fraction [-] | 0.0376 | 0.0375 | 0.07 |
| temperature [°C] | 494.7 | 493.1 | 0.32 |
Disclaimer/Publisher’s Note: The statements, opinions and data contained in all publications are solely those of the individual author(s) and contributor(s) and not of MDPI and/or the editor(s). MDPI and/or the editor(s) disclaim responsibility for any injury to people or property resulting from any ideas, methods, instructions or products referred to in the content. |
© 2023 by the authors. Licensee MDPI, Basel, Switzerland. This article is an open access article distributed under the terms and conditions of the Creative Commons Attribution (CC BY) license (https://creativecommons.org/licenses/by/4.0/).
Share and Cite
Tyrański, M.; Bujalski, J.M.; Orciuch, W.; Makowski, Ł. Computational Fluid Dynamics of Ammonia Synthesis in Axial-Radial Bed Reactor. Energies 2023, 16, 6680. https://doi.org/10.3390/en16186680
Tyrański M, Bujalski JM, Orciuch W, Makowski Ł. Computational Fluid Dynamics of Ammonia Synthesis in Axial-Radial Bed Reactor. Energies. 2023; 16(18):6680. https://doi.org/10.3390/en16186680
Chicago/Turabian StyleTyrański, Mariusz, Jakub Michał Bujalski, Wojciech Orciuch, and Łukasz Makowski. 2023. "Computational Fluid Dynamics of Ammonia Synthesis in Axial-Radial Bed Reactor" Energies 16, no. 18: 6680. https://doi.org/10.3390/en16186680
APA StyleTyrański, M., Bujalski, J. M., Orciuch, W., & Makowski, Ł. (2023). Computational Fluid Dynamics of Ammonia Synthesis in Axial-Radial Bed Reactor. Energies, 16(18), 6680. https://doi.org/10.3390/en16186680