Article

Energy and Exergy Analysis of Cascade Mixed Refrigerant Joule–Thomson System with the Application of a Precooler

Department of Refrigeration and Air-Conditioning Engineering, College of Engineering, Pukyong National University, Busan 48513, Republic of Korea
*
Author to whom correspondence should be addressed.
Energies 2023, 16(19), 6991; https://doi.org/10.3390/en16196991
Submission received: 4 September 2023 / Revised: 23 September 2023 / Accepted: 6 October 2023 / Published: 8 October 2023
(This article belongs to the Section K: State-of-the-Art Energy Related Technologies)

Abstract

:
This study proposes the application of a precooler to the cascade mixed refrigerant Joule–Thomson (CMR J–T) cycle, herein referred to as the precooled CMR J–T (PCMR J–T) system. The purpose of the precooler is to utilize the temperature gradient characteristics within the two-phase region exhibited by the non-azeotropic mixed refrigerant. The precooler reduces the temperature of the high-temperature gas exiting the compressor by using cooling water from the condenser, thereby decreasing the capacity requirements of the high-temperature cycle (HTC). The working fluid comprises a nonflammable mixed refrigerant (R218, R23, R14, and Ar), and simulations were conducted by varying the HTC evaporation temperature and cooling water temperature for energy and exergy analysis. Under the analysis conditions, the capacity of each component in the HTC can be reduced by over 45%, leading to a maximum increase of 21.6% in the system’s coefficient of performance. Furthermore, the exergy destruction in the PCMR J–T system decreases along with the reduction in component capacity, with the most significant reduction occurring at the HTC expansion valve. The exergy efficiency of the system increases by up to 47.4%.

1. Introduction

Today, the demand for cryogenic refrigeration systems operating below −100 °C is increasing across various industries such as food and pharmaceutical storage [1,2,3], boil-off gas re-condensation [4,5], semiconductor cooling, and medical applications [6,7,8]. With this increasing demand in the ultra-low-temperature market, research on mixed refrigerant Joule–Thomson (MR J–T) refrigeration systems is also on the rise. The MR J–T refrigeration system features an intermediate heat exchanger and utilizes non-azeotropic mixed refrigerants as the working fluid. The system’s operational principle is based on the utilization of the temperature gradient in the phase transition region exhibited by these non-azeotropic mixed refrigerants, allowing a cycle to achieve lower temperatures using a single compressor [9]. High-boiling-point refrigerants are condensed by a cooling medium (e.g., air, water), and through counter-flow expansion, both the refrigerant’s temperature and pressure decrease. The refrigerant then undergoes heat exchange on the high-pressure side, and this process iteratively repeats with rest of refrigerants in sequential order of boiling-point to achieve temperature reduction [10]. MR J–T refrigeration systems offer several advantages over other ultra-low-temperature refrigeration systems, including simpler manufacturing, fewer component requirements, and the absence of separate processes, which collectively result in lower costs and increased reliability [11,12,13].
A single-stage MR J–T (SMR J–T) refrigeration system employs the MR J–T cycle as a standalone setup. Existing research on SMR J–T refrigeration systems has predominantly focused on optimizing charging amounts and refrigerant compositions [14,15,16,17,18,19,20,21,22,23]. However, the majority of these studies neglected the practical requirement for nonflammable mixed refrigerants in industrial applications. The charging amounts can vary depending on the device and refrigerant composition, posing challenges for broad applications. Furthermore, most of the existing studies overlooked the critical issue of cooling capacity.
Bychkov [14] conducted an analytical study examining the deviation in recirculation mixture composition from the charge composition in MR J–T refrigeration systems. Through a review of the existing literature and experimental data, a coefficient of variation for changes in recirculation composition was proposed and experimentally verified. The results experimentally confirmed a hypothesis linking this coefficient with the physical characteristics of the mixture. Sreenivas et al. [15] conducted an experimental study on the relationship between the composition ratio in circulation and the charge amount for both J-T and auto-cascade cycles. The working fluids used were R-245fa, R-134a, R-23, and R-14. The experimental results showed that R-134a had the same composition ratio in circulation as the charge composition. In contrast, R-14 had a higher composition ratio in circulation than the charge composition, while R-23 and R-245fa had lower composition ratios in circulation compared to the charge amount. The significant difference in composition ratio between the charge amount and circulation was attributed to the relatively high-boiling refrigerants remaining in liquid form in the passages between the aftercooler and the internal heat exchanger. Rozhentsev [16] compared the effects of charging amounts in a low-temperature SMR J–T refrigeration system through both theoretical and experimental research. The results indicated that the SMR J–T refrigeration system exhibited significant changes in efficiency with charging amounts below 20%. Experimental data on compressor input power revealed values 30% higher than theoretically calculated input power. Furthermore, the minor temperature difference at the exit of the condenser and the intermediate heat exchanger (IHX) indicates the possibility of downsizing the heat exchanger. Wang et al. [17] conducted a comparative simulation study between the SMR J–T and reverse Brayton cycle (RBC) at temperatures ranging from 80 to 180 K. The results showed that the RBC achieved higher exergy efficiency under ideal conditions across all temperatures. However, under non-ideal conditions, the SMR J–T system was significantly more efficient in the 100–180 K temperature range. They attributed the performance decline of the SMR J–T to significant entropy generation and exergy losses during the throttling process. Bai et al. [18] carried out an experimental study on a microchannel-based Joule–Thomson refrigeration system using a flammable non-azeotropic mixed refrigerant composed of R-170 and R-290. They analyzed the impact of the mixture’s composition ratio and ambient temperature on the cycle. The results indicated that a 35% proportion of R-170 was most suitable, and significantly low or high proportions of the low-boiling refrigerant R-170 adversely affected the cool-down time and achieved temperature. Lu et al. [19] conducted an experimental study on the MR J–T cycle, using a binary mixed refrigerant composed of R-23 and R-600a and analyzing the impact of the composition ratio on the dynamic characteristics of the cycle. The results suggested that a 3:7 ratio of R-23 to R-600a was the most appropriate, allowing the system to reach the target temperature within 45 min. Jerome et al. [20] conducted a simulation study on a Joule–Thomson refrigeration system, targeting an evaporator inlet temperature range of −60 °C to −120 °C. Utilizing a binary mixture of R14 and hydrocarbon refrigerants, they optimized the operational conditions and composition ratio of the cycle based on vapor–liquid–liquid equilibria (VLLE) and exergy efficiency at the evaporator inlet. The results indicated that in the range of −60 °C to −110 °C, the system’s exergy efficiency increased as the cooling temperature decreased when using the optimal composition corresponding to VLLE. Walimbe et al. [21] conducted a study on temperature reduction based on the working fluid in MR J–T cycles using both flammable and nonflammable mixed refrigerants. They optimized refrigerant composition ratios using pressure–enthalpy (P–h) and temperature–enthalpy (T–h) diagrams. For an SMR J–T system starting at 300 K, they achieved a minimum temperature of 65 K with a cooling capacity of 6 W at 80 K. Furthermore, they experimentally demonstrated that reaching 100 K is achievable when a minimal amount of flammable refrigerant is mixed. Podtcherniaev et al. [22] conducted an experimental study on dual-circuit and MR J–T refrigeration systems aiming for an evaporator inlet temperature ranging from −70 °C to −100 °C. They found that the dual-circuit system was more advantageous at temperatures above −70 °C, while the MR J–T system outperformed it at temperatures below −80 °C. Liu et al. [23] proposed a Vapor Injection Compressor for improving the performance of MR J-T and theoretically compared it to the base cycle at a target temperature of −86 °C. They used a binary hydrocarbon as the working fluid, and the MR J-T cycle with vapor injection was reported to achieve a maximum COP (Coefficient of Performance) that is 19.25% higher.
As outlined in the studies mentioned above, the J–T cycle utilizing mixed refrigerants exhibits a temperature gradient along the isothermal line in the phase transition region. This characteristic suggests that with lower temperatures at the exit of the aftercooler, achievable temperatures can be even lower, thereby enhancing the cooling capacity of MR J–T cycles. This understanding has led to the development of cascade MR J–T (CMR J–T) refrigeration systems, which integrate a vapor compression refrigeration system in place of the aftercooler [24,25].
Yoon et al. [26] conducted an experimental study aiming to achieve low-temperature generation around −100 °C using the CMR J–T refrigeration system. They used both flammable and nonflammable mixed refrigerants as working fluids and compared the effects of high-boiling refrigerants. The results indicated that flammable refrigerants facilitated a quicker attainment of the target temperature and higher cooling capacity, attributed to their higher specific enthalpy. Lee et al. [27] proposed a CMR J–T system with a precooling cycle to enhance the cooling capacity of the MR J–T system, targeting a temperature of 70 K. They optimized the system to maximize the coefficient of performance (COP). The optimized MR J–T refrigerator exhibited the same COP as a Stirling cryocooler at 70 K, thus validating its enhanced efficiency. Fernando et al. [28] modeled and optimized three ultra-low-temperature refrigeration cycles for use in LNG liquefaction processes: the propane precooled mixed refrigerant (C3MR) cycle, the dual mixed refrigerant (DMR) cycle, and the Phillips Cascade cycle. Among these three cascade cycles, the DMR cycle had the lowest shaft power demand, achieving savings of 10.4% compared to C3MR and 22.5% compared to the Phillips Cascade. Building upon previous research comparing cascade cycles, Fernando et al. [29] proposed and theoretically analyzed three new cycles: the CryoMan Cascade cycle, the Bypass Cascade cycle, and the Double CryoMan Cascade cycle. They compared these new cycles to the existing cascade cycles based on their analyzed data. The proposed cycles demonstrated energy savings ranging from 14.8% to 15.6% compared to the C3MR cycle and 4.9% to 5.9% compared to the DMR cycle.
The CMR J–T system combines the MR J–T cycle with a vapor compression refrigeration system, resulting in a lower temperature for the refrigerant entering the IHX compared to the SMR J–T system. However, the temperature of the mixed refrigerant at the compressor discharge remains sufficiently high for cooling by a room-temperature heat sink. Therefore, using the cooling water in the condenser may manage a portion of the heat load, reducing the vapor compression cycle’s cooling load and offering the possibility for system downsizing. Considering these aspects, this study proposes a cycle incorporating a precooler to improve the CMR J–T system’s performance and validates this enhancement through both energy and exergy analyses. While the utility of energy analysis is widely recognized, it has its limitations. Exergy analysis supplements this by assessing the quality of energy, allowing for a more accurate reflection of the system’s thermodynamic integrity. Existing research on integrating vapor compression cycles with CMR J–T remains at a nascent stage and lacks optimization of mechanical elements such as temperature drop and working fluids.
Additionally, previous research has primarily focused on hydrocarbon family refrigerants, which offer superior cooling capacity per unit mass. However, safety considerations may necessitate the use of nonflammable refrigerants, depending on the application. Therefore, this study employs nonflammable mixed refrigerants as working fluids and formulates a four-component mixture to minimize interactions among them.

2. CMR J–T Cycle

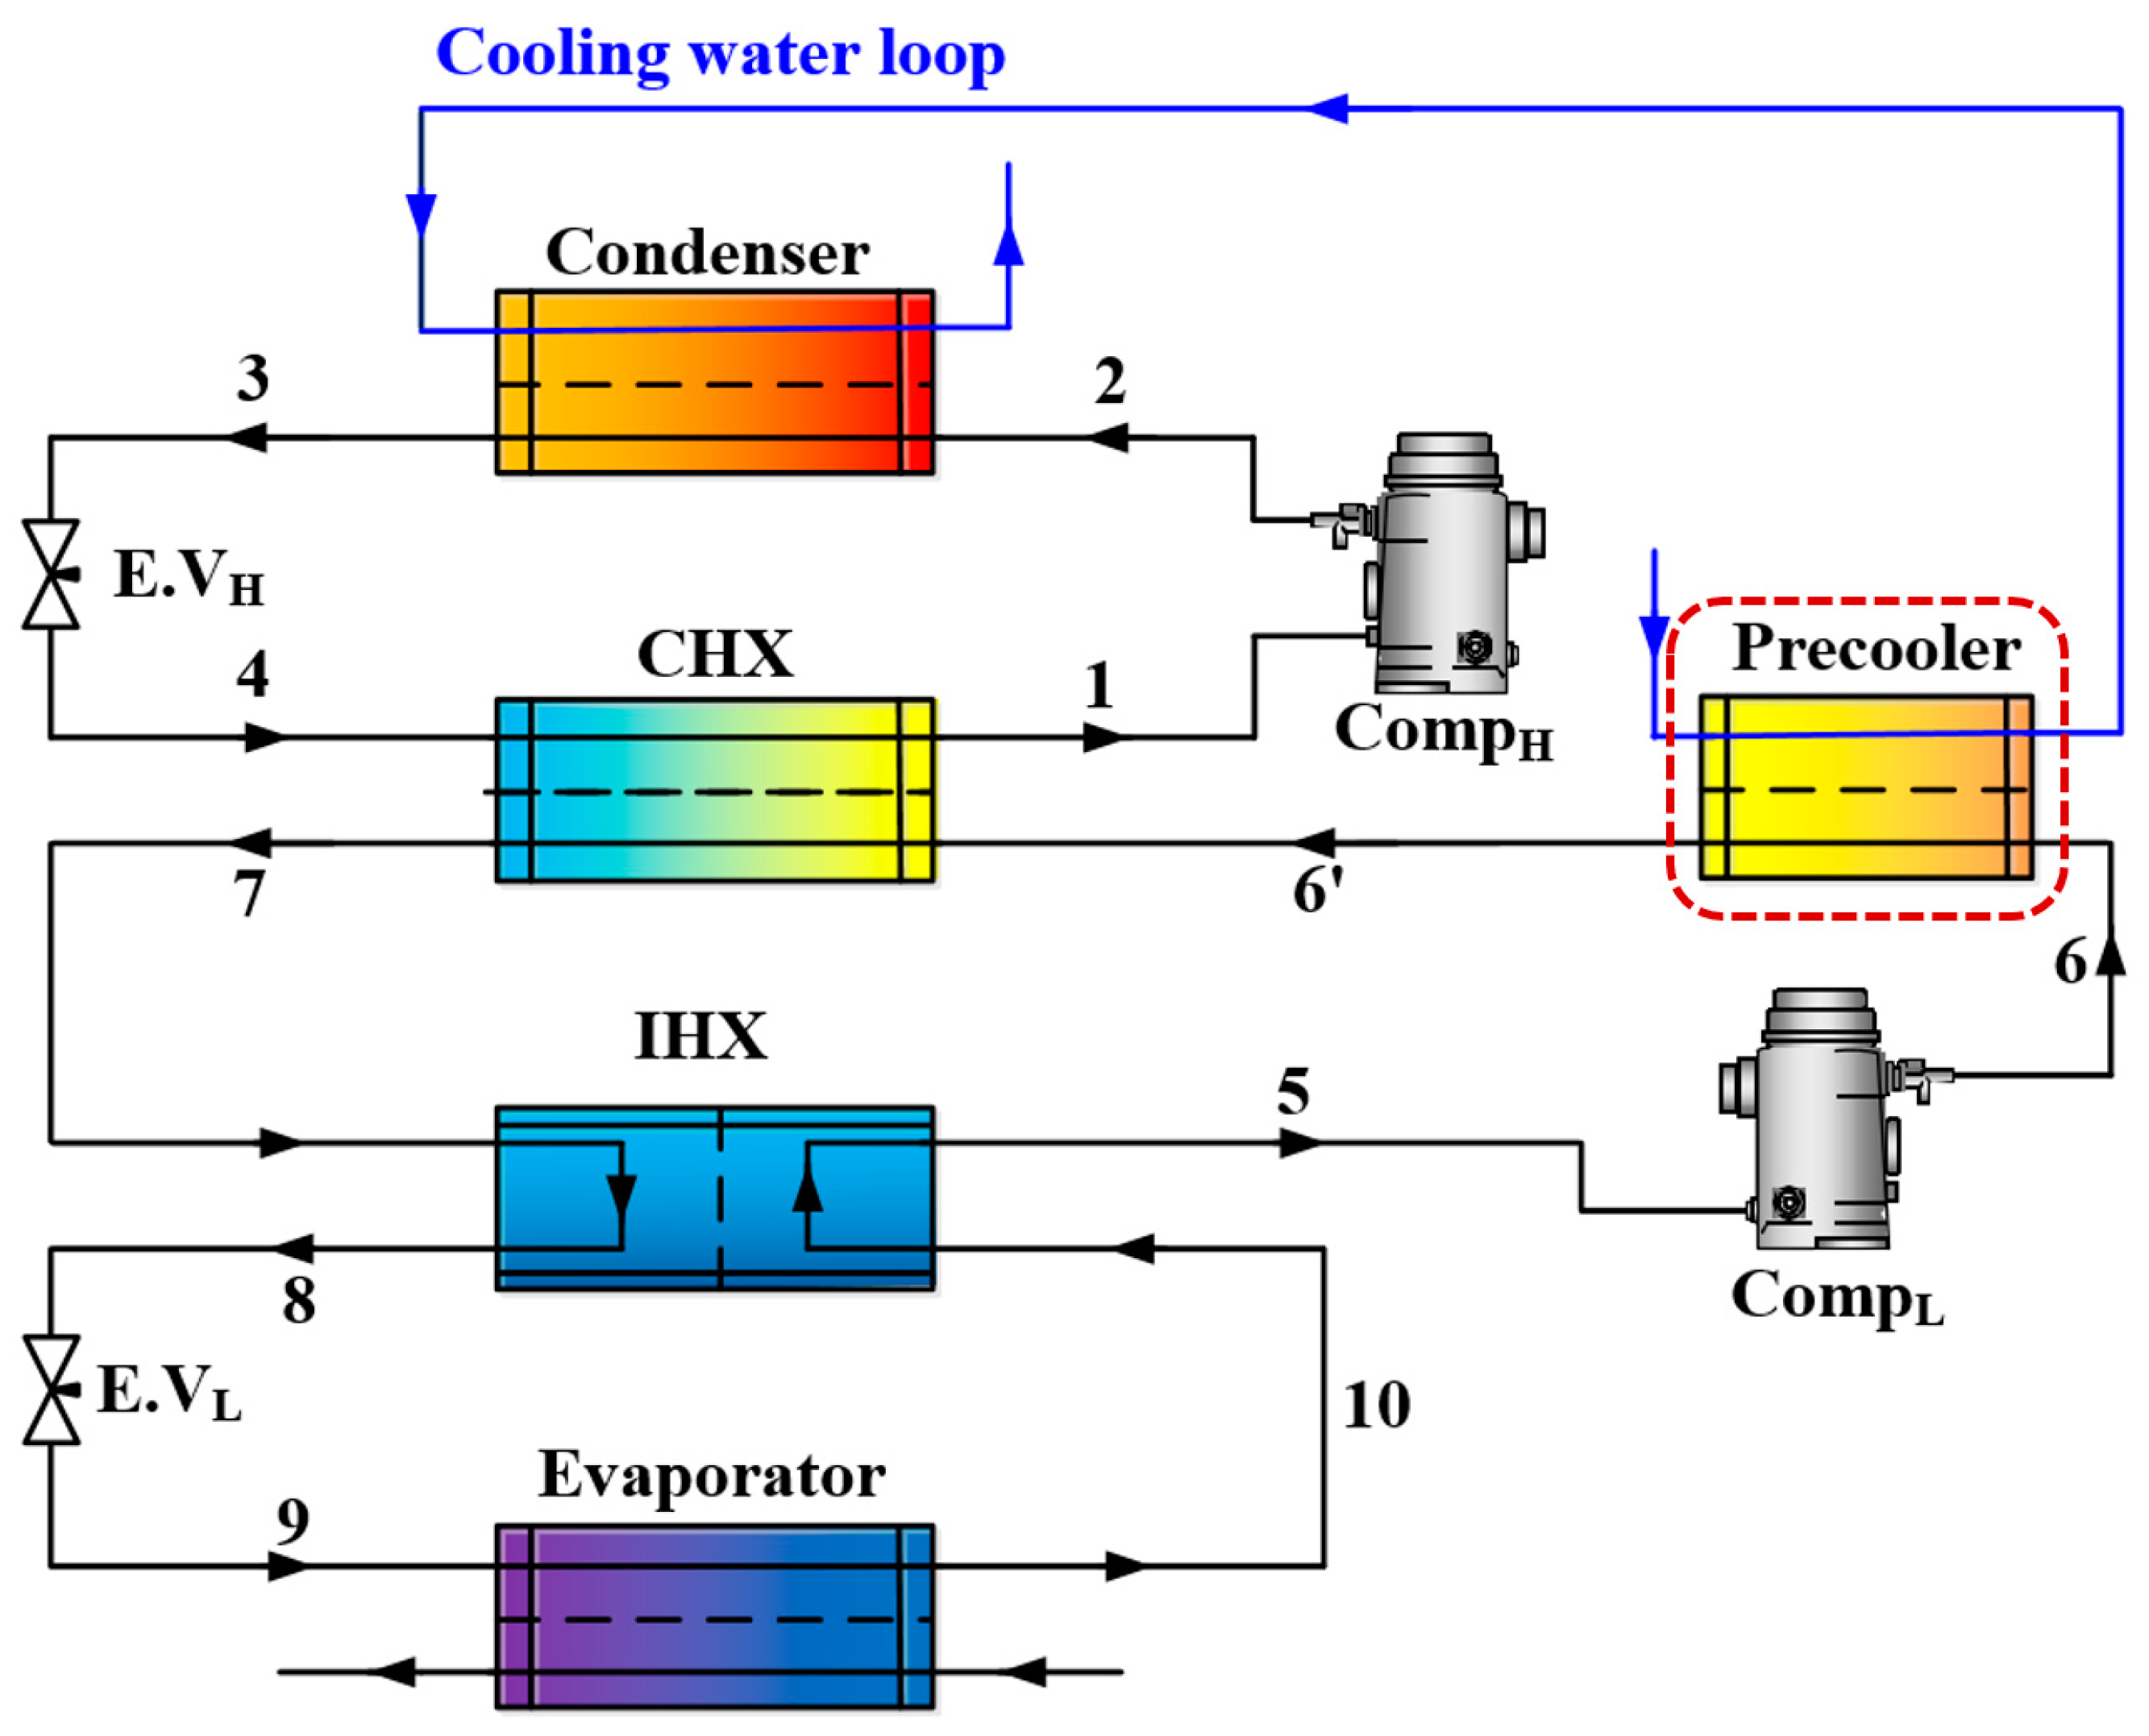
2.1. Precooled CMR J–T Cycle
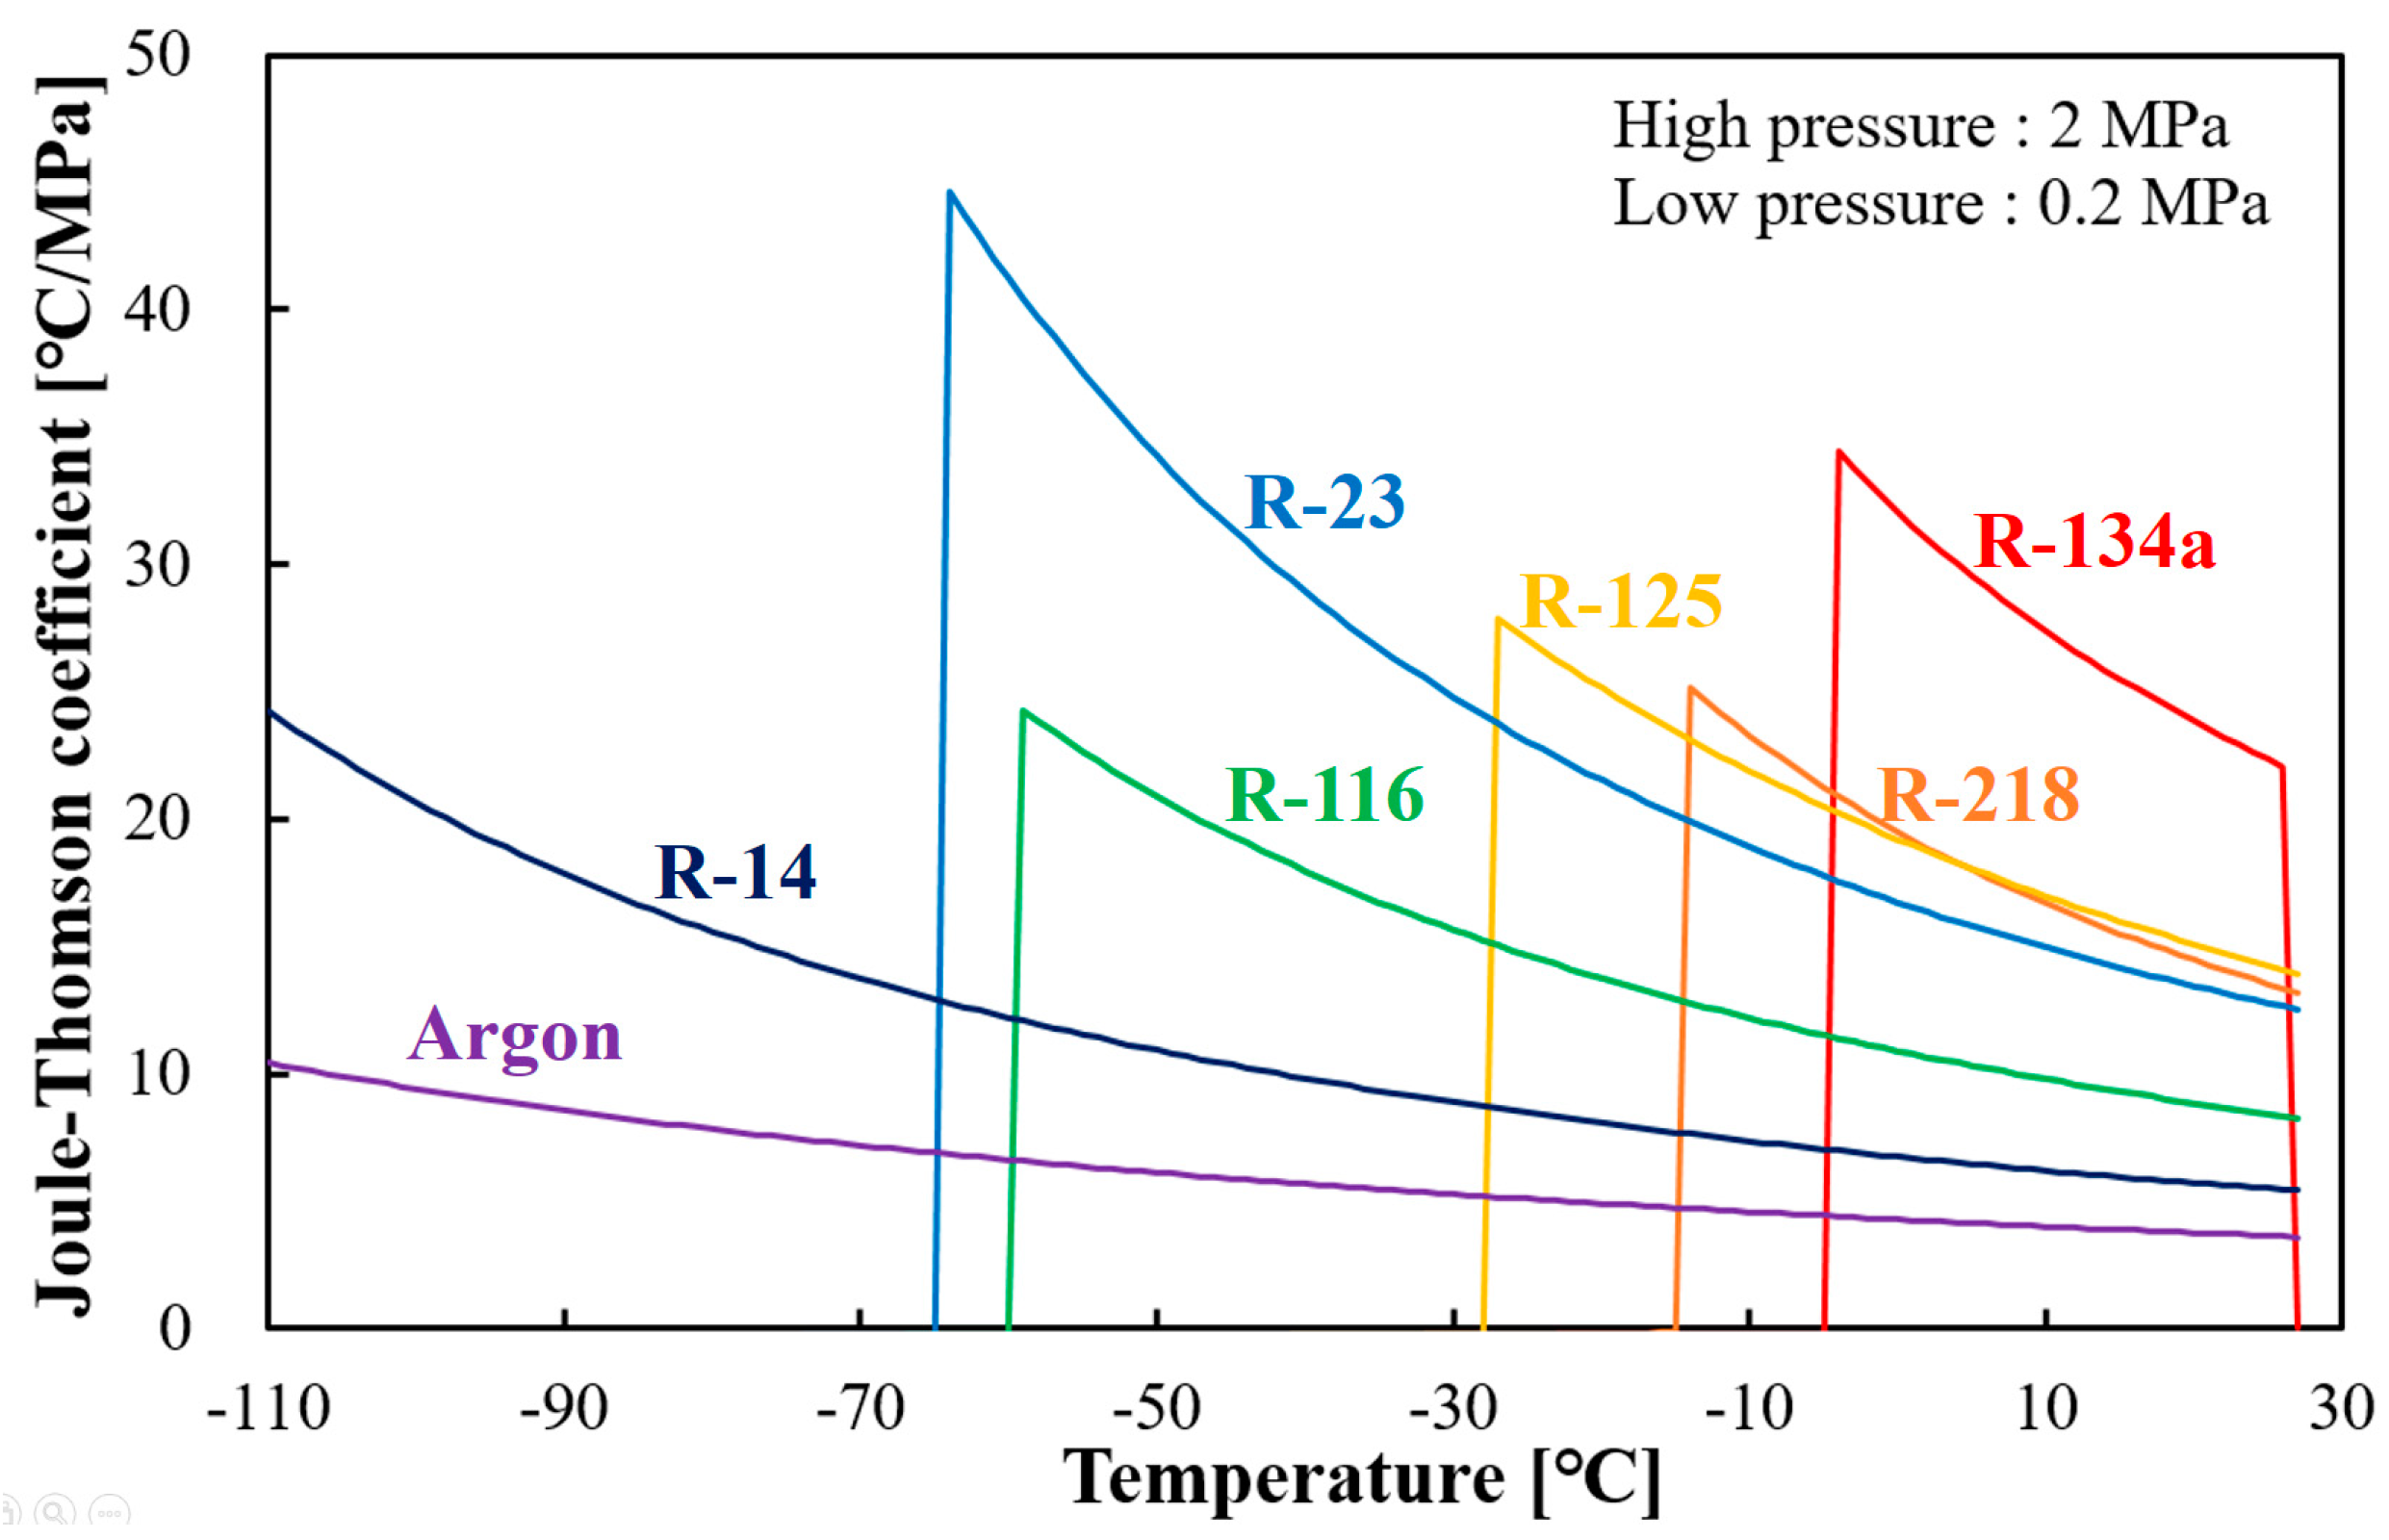
Figure 1 provides an overview of the CMR J–T systems with and without a precooler. Figure 2 illustrates the P–h diagram for the CMR J–T configuration with a precooler. The precooler aims to reduce the cooling load of the cascade heat exchanger (CHX). The cycle is divided into two main configurations: basic CMR (BCMR) and precooled CMR (PCMR), depending on whether a precooler is employed.
The high-temperature cycle (HTC) features a conventional vapor compression refrigeration cycle comprising a compressor, condenser, expansion valve, and CHX. The low-temperature cycle (LTC) operates on an MR J–T cycle, which includes a CHX, IHX, expansion valve, evaporator, and compressor. The LTC is similar to a standard refrigeration cycle but includes an IHX and is referred to as the J–T cycle. In the LTC, the refrigerant gas discharged from the low-pressure cycle’s compressor is precooled using cooling water from the high-pressure cycle. The heat exchanger responsible for this cooling process is referred to as the precooler.
The operating mechanisms of the HTC and LTC are as follows, with each numbered point corresponding to Figure 1. Concerning the HTC, low-temperature and low-pressure refrigerant gas (1) is compressed and discharged as high-temperature and high-pressure refrigerant gas (2) from the HTC’s compressor. The discharged refrigerant gas is then condensed to ambient temperature levels (3) by releasing heat to the surroundings through the condenser. The high-pressure refrigerant liquid passing through the expansion valve experiences a temperature drop due to the Joule–Thomson effect (4). It absorbs heat from the LTC and returns as low-temperature and low-pressure refrigerant vapor (1) to the compressor after passing through the CHX.
In the LTC, the low-temperature and low-pressure refrigerant gas (5) is compressed and discharged as high-temperature and high-pressure refrigerant gas (6 or 6′) from the compressor. In the case of the PCMR configuration, this discharged refrigerant gas is cooled using the cooling water in the precooler. During this cooling process, the cooling water absorbs heat from the LTC, causing its temperature to rise before entering the HTC’s condenser. Subsequently, both BCMR and PCMR configurations release heat to the HTC in the CHX, with resulting temperatures ranging from 21 to 31 °C for the BCMR and −10 °C to −29 °C for the PCMR (7). The high-pressure mixed refrigerant passing through the internal heat exchanger undergoes heat exchange with the low-pressure stream exiting the evaporator. Its temperature continues to decline due to the gradient of the isothermal line, even within the phase transition region (8). Exiting the internal heat exchanger, the high-pressure refrigerant experiences a temperature drop due to the Joule–Thomson effect at the expansion valve (9). The low-temperature and low-pressure mixed refrigerant (10) then passes through the evaporator, where it absorbs heat from the high-pressure stream in the internal heat exchanger before being suctioned back into the compressor (5). This cycle repeats, and as a result of the temperature drop at the expansion valve and the heat exchange within the internal heat exchanger, the temperature at the evaporator inlet continues to decrease gradually until it reaches the target temperature.

2.2. Working Fluids

In this study, the selected working fluids included the refrigerant R-134a, which can be condensed under the specified working conditions. Additionally, to achieve cooling down to the target temperature of −110 °C, R-14 and argon were chosen due to their lower normal boiling points at the set low pressure. For continuous cooling, refrigerants with intermediate boiling points between these two groups were also considered and are listed in Table 1.
The selected refrigerants can be categorized into three groups: high-boiling refrigerants (R-134a, R-218, R-125), medium-boiling refrigerants (R-116, R-23), and low-boiling refrigerants (R-14, argon). High-boiling refrigerants serve to condense through the cooling medium during initial operation and simultaneously determine the dew point at the set pressure. A higher dew point implies that at a constant temperature, the state points after the CHX shift further to the left, thereby reducing the compressor’s suction and discharge temperatures [30]. Medium-boiling refrigerants are essential for sustaining continuous phase changes, while low-boiling refrigerants play a crucial role in establishing the target temperature and the saturation line.
Figure 3 presents the differential enthalpy per unit mass between high and low pressure along the isothermal lines. Enthalpy is determined by both the pressure and temperature at each point. A large enthalpy difference at a specific temperature implies that the amount of heat absorbed by the refrigerant (in both liquid and vapor phases) increases as it passes through the expansion valve until it reaches the compressor’s suction point. To achieve a smooth temperature reduction in the internal heat exchanger from the fixed temperature at −20 °C (state point 7 in Figure 2) to the target cooling temperature, a consistently high enthalpy difference must be maintained due to the evaporation temperature of the HTC [30,31].
Figure 4 displays the Joule–Thomson coefficient for each refrigerant, ranging from room temperature to −110 °C. To achieve temperature reduction through expansion, the Joule–Thomson coefficient must be positive. Among the refrigerants that can be condensed at room temperature, R-134a exhibits the highest Joule–Thomson coefficient. However, considering that the study’s target temperature is below the freezing point of R-134a, it was deemed unsuitable. For this reason, R-125 was also excluded. R-218, which can be condensed at room temperature and has a lower freezing point, was selected as the high-boiling refrigerant. In the range where the Joule–Thomson coefficient of R-218 becomes zero, R-23 has the highest coefficient. Similarly, R-14 was chosen as the low-boiling refrigerant using the same criteria. Argon was also added to achieve stable temperature reduction. It lowered the saturation temperature at the saturation line, enabling stable temperature reduction at the set low pressure. Therefore, the following mixture of four components was selected: R-218, R-116, R-14, and argon.

2.3. Analysis Conditions

The conditions for simulation interpretation are outlined in Table 2. Simulation analysis was performed using the Aspen HYSYS V12 [32].
According to the previous literature, a higher pressure difference in the MR J–T cycle generally results in higher performance [33]. However, a high compression ratio can lead to issues such as elevated compressor discharge temperatures and suction state points influenced by the dew point. Therefore, in this study, the high pressure was set at 2.0 MPa and the low pressure at 0.2 MPa to ensure safety while avoiding sub-atmospheric pressures [34].
The simulation analysis focused on evaluating the impact of incorporating a precooler on refrigeration performance under identical conditions and refrigerant composition ratios. The selected independent variables were the evaporation temperature of the HTC, which directly influences the precooler, and the supply temperature of the cooling water. Both energy and exergy performance were analyzed based on these variables.

3. Thermodynamic Model

3.1. Energy Balance

Energy analysis is essential for evaluating cycle characteristics. The input power of the compressor in the HTC can be expressed as follows:
W ˙ c o m p , H = m H ˙ h 2 s h 1 η c o m p , H = m H ˙ h 2 h 1 ,
where m H ˙ is the mass flow rate of the refrigerant in the HTC, ηcomp.H is the compressor efficiency, and h1 and h2 are the specific enthalpies of the refrigerant at the inlet and outlet of the compressor, respectively.
The heat rejected to the surroundings by the condenser is
Q c o n d , H = m ˙ H ( h 2 h 3 ) ,
where h3 is the specific enthalpy of the refrigerant at the condenser outlet.
The expansion process at the expansion valve of the HTC is an isenthalpic process:
h 3 = h 4 ,
where h4 is the specific enthalpy of the refrigerant at the throttling valve outlet.
The energy balance equation in the CHX can be expressed as
Q C H X = m ˙ H h 1 h 4 = m ˙ L h 6 h 7 ,
where m ˙ L is the mass flow rate of the refrigerant in the low stage cycle, and h 7 and h 6 are the specific enthalpies of the refrigerant at the LTC inlet and outlet of the CHX, respectively.
The input power of the LTC compressor is expressed as
W ˙ c o m p , L = m L ˙ h 6 s h 5 η c o m p , L = m L ˙ h 6 h 5 ,
where h5 is the specific enthalpy of the refrigerant at the inlet of the LTC compressor.
The heat rejected to the surroundings by the precooler is
Q P r e , L = m ˙ L ( h 6 h 6 ) ,
where h6′ is the outlet enthalpy of the precooler.
The energy balance equation within the IHX is expressed as [35]
Q I H X = m ˙ L h 7 h 8 = m ˙ L h 5 h 10 ,
where h8 and h10 are the specific enthalpies at the high-pressure side outlet and the low-pressure side inlet of the CHX, respectively.
The expansion process at the expansion valve of the LTC is
h 8 = h 9 ,
where h9 is the specific enthalpy of the refrigerant at the throttling valve outlet.
The cooling capacity of the CMR J–T can be obtained by
Q E v a , L = m ˙ L ( h 10 h 9 ) .
The COP of the CMR J–T cycle can be determined by
C O P = Q E v a , L W ˙ c o m p , H + W ˙ c o m p , L .

3.2. Exergy Balance

The energy analysis method based on the first law of thermodynamics, as described in Section 3.1, is widely employed to assess the overall performance of the CMR J–T system. However, for a more detailed understanding of the irreversibilities in various components, exergy analysis is more appropriate. Exergy (X) analysis is a crucial tool for evaluating the performance and efficiency of thermal engineering applications and thermodynamic systems. Exergy represents the maximum work potential of a system and indicates how efficiently a system could operate under equilibrium conditions. In contrast to energy, which is conserved, exergy can be lost due to irreversibilities, leading to performance degradation. Exergy analysis allows for the identification of the factors causing these inefficiencies, providing valuable insights for design and operational improvements. It is a vital tool in the field of thermal engineering for optimizing and enhancing system performance, as well as improving energy efficiency. Therefore, this study employed exergy analysis to investigate the performance of the CMR J–T system further.
The exergy at every point in the cycle can be expressed as [36]
X = m ˙ ( h h 0 ) T 0 ( s 0 s 0 ) ,
where X represents the physical exergy, with the subscript “0” denoting the reference state. The reference temperature T0 and reference pressure P0 are set at 25 °C and 101.325 kPa, respectively [37]. The exergy destruction in different components is summarized as follows:
In the high-stage compressor,
X C o m p , H = T 0 m ˙ H ( s 2 s 1 ) ,
where s1 and s2 are the specific entropies of the refrigerant at the HTC compressor inlet and outlet, respectively.
In the condenser
X C o n d , H = T 0 m ˙ H s 2 s 3 + Q c o n d , H ,
where s3 is the specific entropy at the condenser outlet.
In the HTC expansion valve,
X E V , H = T 0 m ˙ H s 4 s 3 ,
where s4 is the specific entropy at the expansion valve outlet.
In the CHX [37],
X C H X = T 0 m ˙ H s 1 s 4 + m ˙ L s 6 s 7 ,
where s 6 and s 7 are the specific entropies at the low-stage CHX inlet and outlet, respectively.
In the LTC compressor,
X C o m p , L = T 0 m ˙ L ( s 6 s 5 ) ,
where s5 and s6 are the specific entropies at the LTC compressor inlet and outlet, respectively.
In the precooler [38],
X P r e , L = T 0 m ˙ L s 6 s 6 + Q P r e , L .
In the IHX,
X I H X = T 0 m ˙ L s 7 s 8 + s 5 s 10 ,
where s 8 and s 10 are the specific entropies at the expansion valve inlet and evaporator outlet, respectively.
In the LTC expansion valve,
X E V , H = T 0 m ˙ L s 9 s 8 ,
where s 9 is the specific entropy at the expansion valve outlet.
In the evaporator,
X E v a , L = T 0 m ˙ L s 10 s 9 + Q e T a v e , e v a + Δ T ,
where Tave.eva is the mathematical average of the refrigerant inlet and outlet temperatures at the evaporator, and ΔT is the temperature difference between the refrigerant and the space being cooled.
The total exergy can be expressed as
X t = X C o n d , H + X C o m p , H + X E V , H + X C H X + X C o m p , L + X P r e , L + X I H X + X E V , L + X E v a , L .
The exergy efficiency of the CMR J–T system is
η e x = 1 X t W ˙ C o m p , L + W ˙ C o m p , H .
Exergy efficiency (ηex) serves as a valuable tool for evaluating the performance and efficiency of thermal engineering systems. It enables the identification of system inefficiencies and thermodynamic imperfections, thereby assisting in isolating the root causes of performance degradation.

4. Results and Discussion

In line with the objectives of the study, the performance of the CMR J–T system was evaluated when applying a precooler. The variables used for performance analysis included the evaporating temperature of the HTC and the supply temperature of the cooling water. Key performance indicators such as cooling capacity (Qeva), compressor input power ( W ˙ comp), coefficient of performance (COP), exergy efficiency of the system (ηex), and exergy destruction (X) in each component were analyzed with respect to variations in each condition.

4.1. Energy Analysis of the CMR J–T System

Figure 5 presents a graph comparing the performance of each cycle while varying the evaporation temperature of the HTC from −39 °C to −20 °C. This is to assess the effect of evaporation temperature when a precooler is used. Under the analyzed conditions, the cooling capacity of the LTC remained unaffected by the presence of the precooler. As the evaporation temperature increased, the system’s cooling capability declined. The application of the precooler resulted in a decrease in the total input power of the compressor by approximately 17% to 22%. Moreover, as the evaporation temperature decreased, the input power of the compressor increased. This can be mainly attributed to variations in the HTC, as the input power of the LTC compressor remained constant during the analysis. Furthermore, the system COP increased as the evaporation temperature dropped, showing an increase of up to 21.6% when the precooler was applied.
Figure 6 presents a graph analyzing the cooling water temperature’s effect on the system cycle when using a precooler. It compares the system compressor input power ( W ˙ comp), cooling capacity (Qeva), and COP as the cooling water temperature varies from 18 °C to 28 °C. The evaporation temperature of the HTC was set at −39 °C, which was determined from the analysis in Figure 5 to yield the highest COP. The cooling capacity was not significantly affected by the presence of the precooler or the temperature of the cooling water. However, the compressor input power decreased as the cooling water temperature decreased. With the application of the precooler, an average reduction of 16% in input power can be achieved, reaching a maximum reduction of 18% at the lowest cooling water temperature. As a result, employing a precooler and lowering the cooling water temperature led to an increase in COP, reaching a maximum value of 0.38, which is 17% higher compared to the BCMR configuration.
Figure 7 is a graph illustrating the capacities of each component device in both BCMR and PCMR, aimed at confirming the observed common reduction in compressor input power in Figure 5 and Figure 6. The conditions were set at mid-range values for each variable, with an HTC evaporation temperature of −30 °C and a cooling water temperature of 23 °C. When the precooler was applied, the capacity of the LTC components remained unchanged, except for the addition of the precooler. In the PCMR, all component devices showed a capacity reduction ranging from 39% to 45% compared to the BCMR. This reduction can be explained further using Figure 8. The decrease in HTC capacity is attributed to a decrease in the capacity of the CHX, likely caused by a reduced refrigerant circulation rate within the HTC. This decrease is inferred to occur as a result of diverting a portion of the total heat rejection required in the LTC to the precooler.
Figure 8 presents a graph detailing the compressor discharge temperature, CHX inlet temperature, and CHX capacity. In the LTC, the CHX capacity is determined by the enthalpy difference between the inlet and outlet state points, as described by Equation (4). Although the refrigerant circulation rate remains constant with a fixed compressor input power, the introduction of the precooler alters the state point at the inlet. In the BCMR cycle, the CHX inlet temperature corresponds to the compressor discharge temperature. However, in the PCMR cycle, due to the application of the precooler, this compressor discharge temperature is cooled to the cooling water temperature, thus determining the CHX inlet temperature and state point. Consequently, in both cycles, the CHX cooled the refrigerant from 78 °C and 21–31 °C to −20 °C, resulting in a capacity reduction. The use of the precooler led to an average decrease of 45% in CHX capacity, with the most significant reduction occurring at lower cooling water temperatures—reaching a maximum decrease of 49%. This trend suggests that as the cooling water temperature drops, the heat absorbed by the precooler increases, causing a decrease in CHX capacity and, in turn, reducing HTC’s capacity.

4.2. Exergy Analysis of CMR J–T

Exergy analysis serves as a vital tool for evaluating the performance and efficiency of thermal engineering and thermodynamic systems. Exergy represents the maximum work potential within a system and indicates how efficiently the system operates in a state of complete equilibrium. While energy is conserved, exergy is not; hence, exergy losses within a system result in irreversible inefficiencies and performance degradation. Exergy analysis allows for the identification of key factors contributing to performance degradation and highlights areas for improvement during both the design and operational stages. This tool is essential in the field of thermal engineering for optimizing and enhancing system performance, as well as for improving energy efficiency.
Figure 9 presents a graph comparing the total exergy destruction and exergy efficiency of each cycle as the HTC evaporation temperature varies from −39 °C to −20 °C. The average exergy destruction in PCMR is 23% lower than in BCMR. Particularly at the lowest HTC evaporation temperature, exergy destruction is highest, with a difference of approximately 25%. Moreover, the exergy efficiency of the PCMR, which has lower exergy destruction, averages 46% higher than that of BCMR, reaching a peak efficiency that is 47.4% higher. The significant difference in exergy efficiency, relative to the reduction in exergy destruction, suggests a lower exergy destruction for the same input power. This can be corroborated by the energy analysis (compressor input power) presented in Figure 5.
Figure 10 presents a graph comparing the total exergy destruction and exergy efficiency of the system, factoring in the application of the precooler and varying cooling water temperatures. As the cooling water temperature decreased, the total exergy destruction in both cycles also declined. However, the exergy efficiency exhibits diverging trends for the two cycles. In B CMR, the exergy efficiency increased, whereas in precooler CMR, it decreased. This difference can be attributed to the interplay between the reduction in compressor input power and the decrease in exergy destruction, as deduced from Equation (22). This relationship becomes more pronounced as the precooler’s impact increases at lower cooling water temperatures. As the CHX capacity decreases, leading to an overall reduction in system capacity and, subsequently, a decline in exergy destruction, the reduction in compressor input power outweighs this effect. Consequently, from an exergy efficiency perspective, the efficiency tends to decrease.
Figure 11 presents a graph to assess the impact of the precooler from an exergy perspective. The graph compares the exergy destruction of individual components under a single set of conditions. Both systems exhibit similar levels of exergy destruction for LTC components. This similarity is attributed to the constant input power conditions for the LTC compressor (on the MR side) and the relatively small variations within the cycle. Moreover, a notable reduction in exergy destruction was observed for the HTC when using the PCMR configuration. The most significant change observed was an impressive 82% reduction in exergy destruction for the HTC expansion valve. As discussed in Section 4.1, the precooler contributes to reducing the cooling load on the CHX by partially removing heat, leading to a decrease in the refrigerant flow rate through the HTC. Despite the increase in the number of components due to the application of the precooler, the overall system’s exergy destruction (Xt) decreased by 24%, while the exergy efficiency (ηex) improved by approximately 45%.

5. Conclusions

The objective of this study was to optimize the structural design of the CMR J–T through analytical investigation. The CMR aims to reach a lower temperature and higher cooling capacity by leveraging the characteristics of zeotropic refrigerants. It is characterized by its simplicity and high reliability compared with other cooling methods. As the demand for ultra-low-temperature refrigeration continues to grow, research on SMR (single mixed refrigerant) J–T systems has been active, while research on CMR (cascade mixed refrigerant) systems, which use a single compressor for chilling purposes, has been relatively limited. Therefore, to improve the performance of CMR J–T refrigeration, a precooler was applied, and a comparison was conducted between the basic cycle and its energetic parameters (cooling capacity, compressor input power, and COP), as well as its exergetic parameters (exergy destruction, exergy efficiency). To estimate the most influential factors, parameters such as HTC evaporation temperature and cooling water supply temperature were adjusted. The following points detail the performance improvement and exergetic analysis resulting from the application of a precooler in CMR J–T.
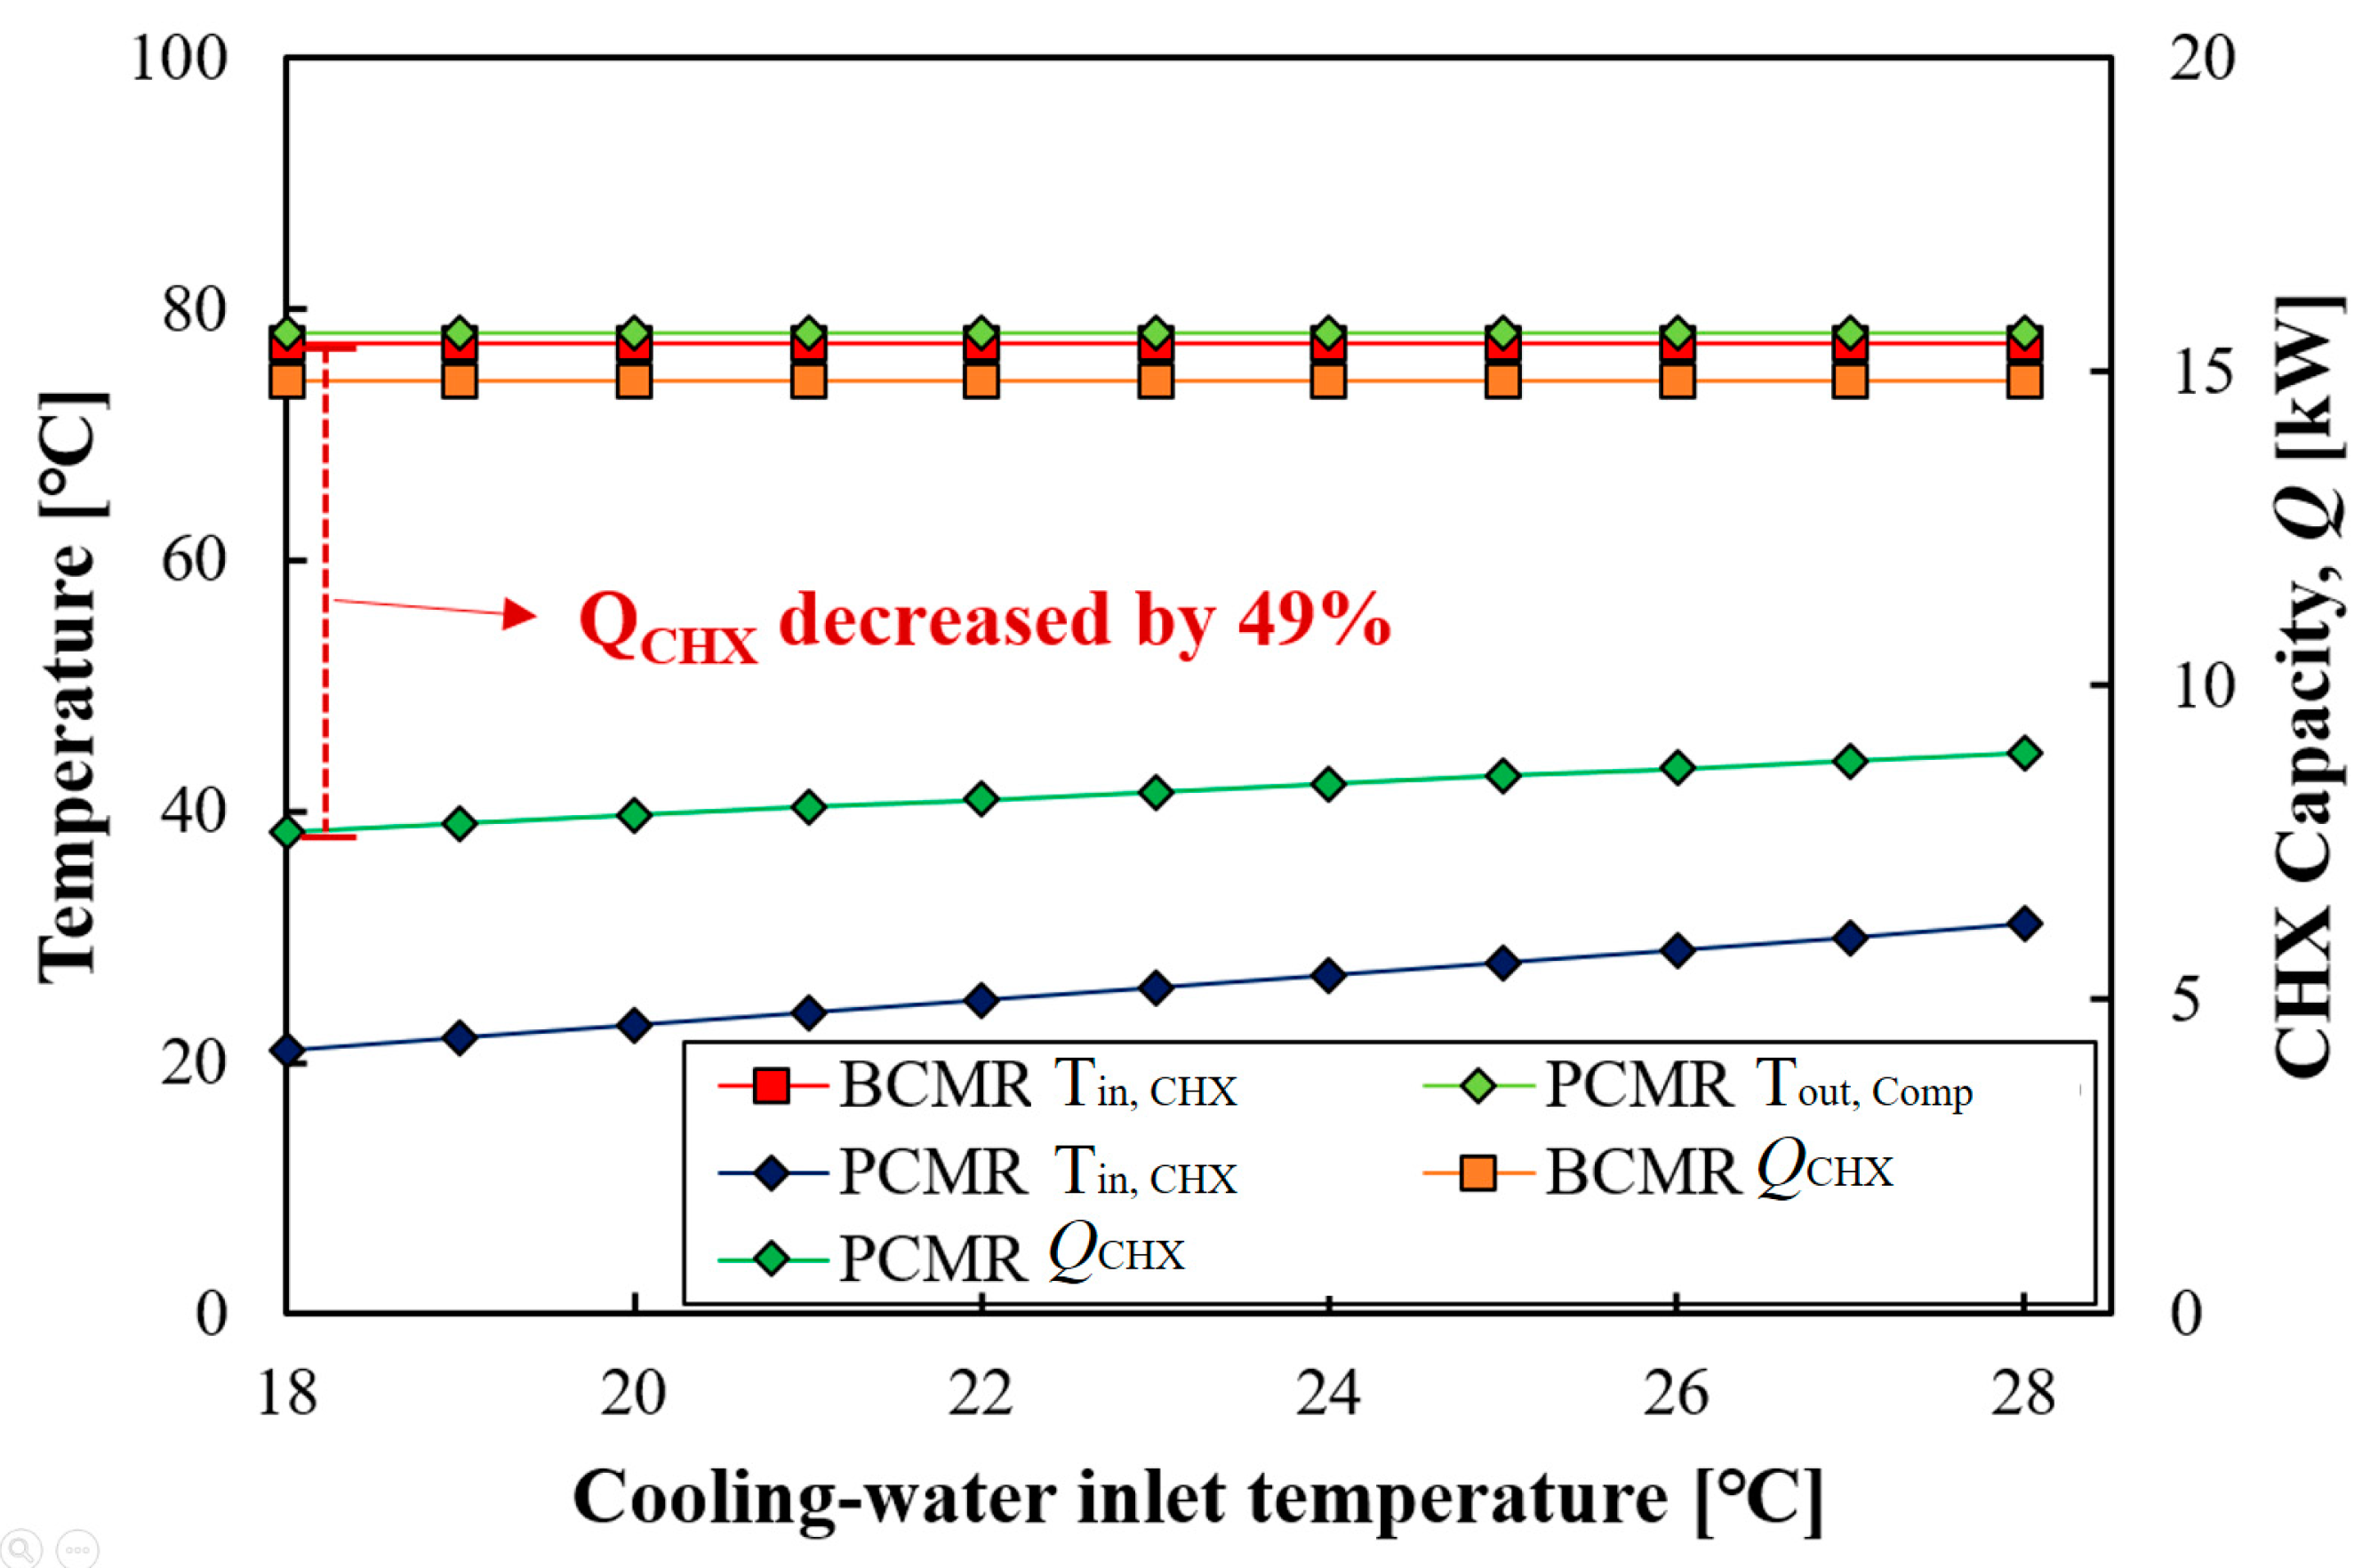
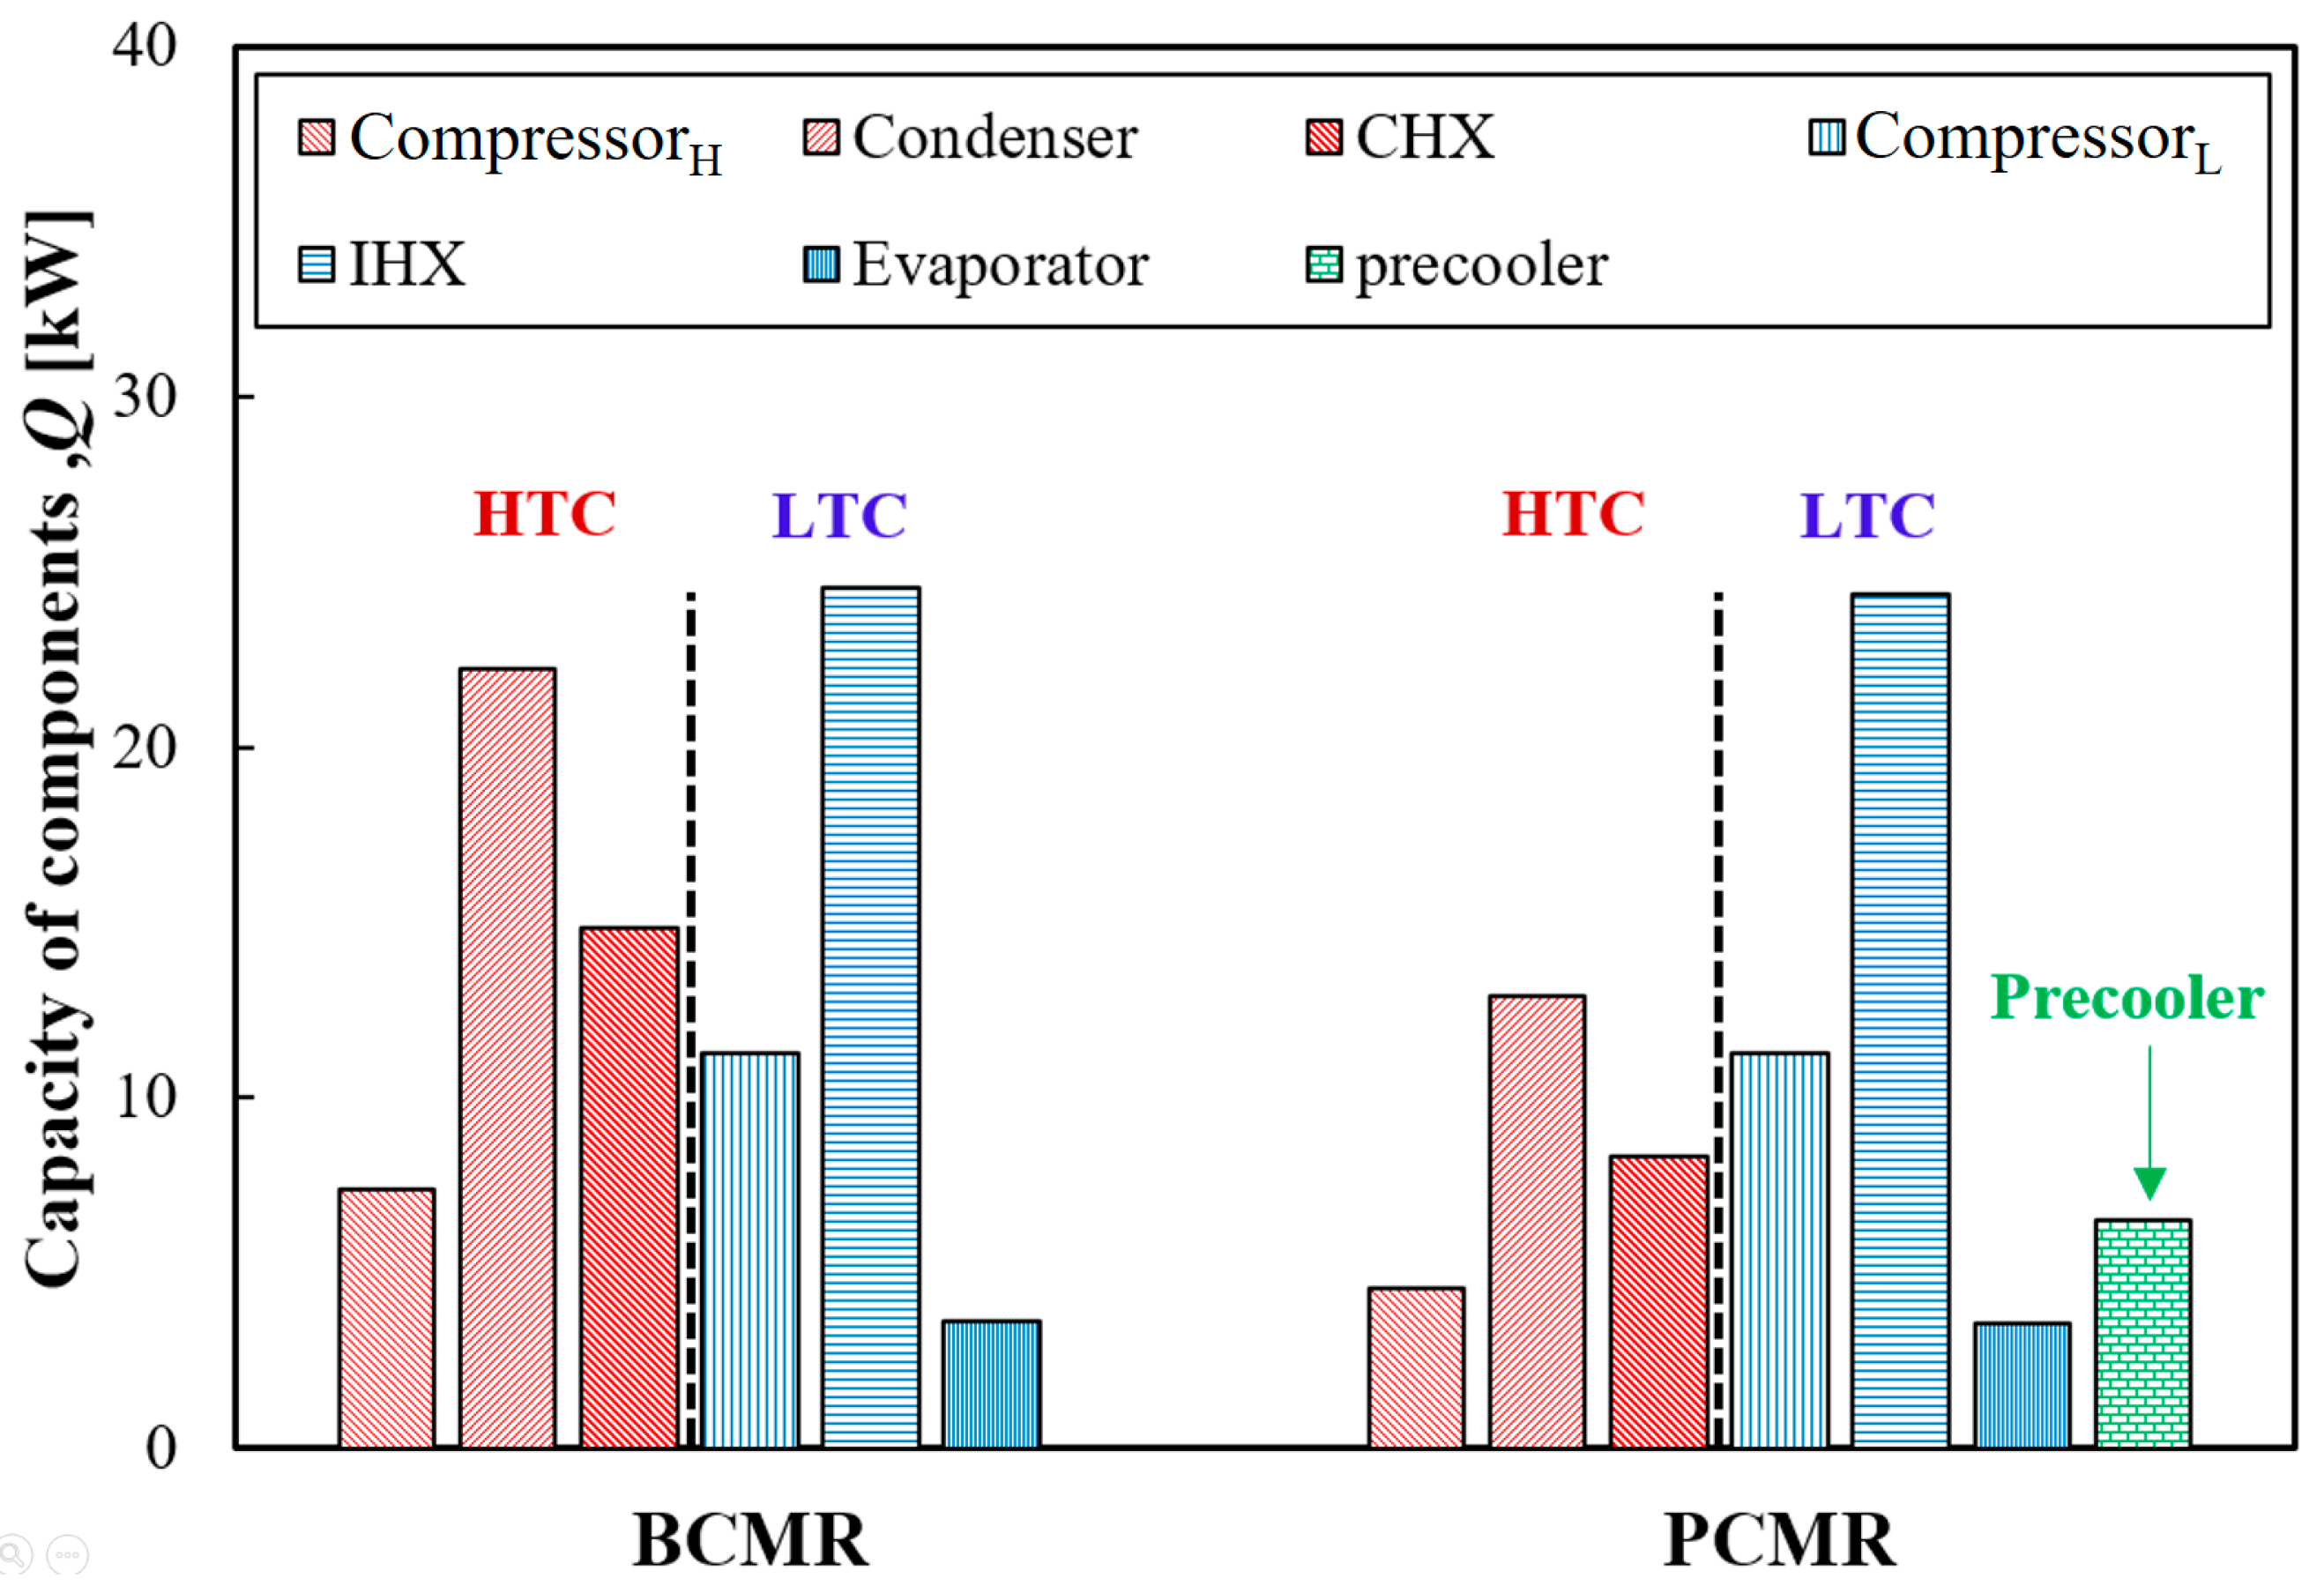
  • The application of the precooler allows for partial handling of the cooling load of LTC, leading to a reduction in the cooling capacity of the HTC and enabling the downsizing of HTC components. Under the conditions considered in this study, the capacity of each component can be reduced by more than 40%. Utilizing this effect, device miniaturization and cost savings are anticipated.
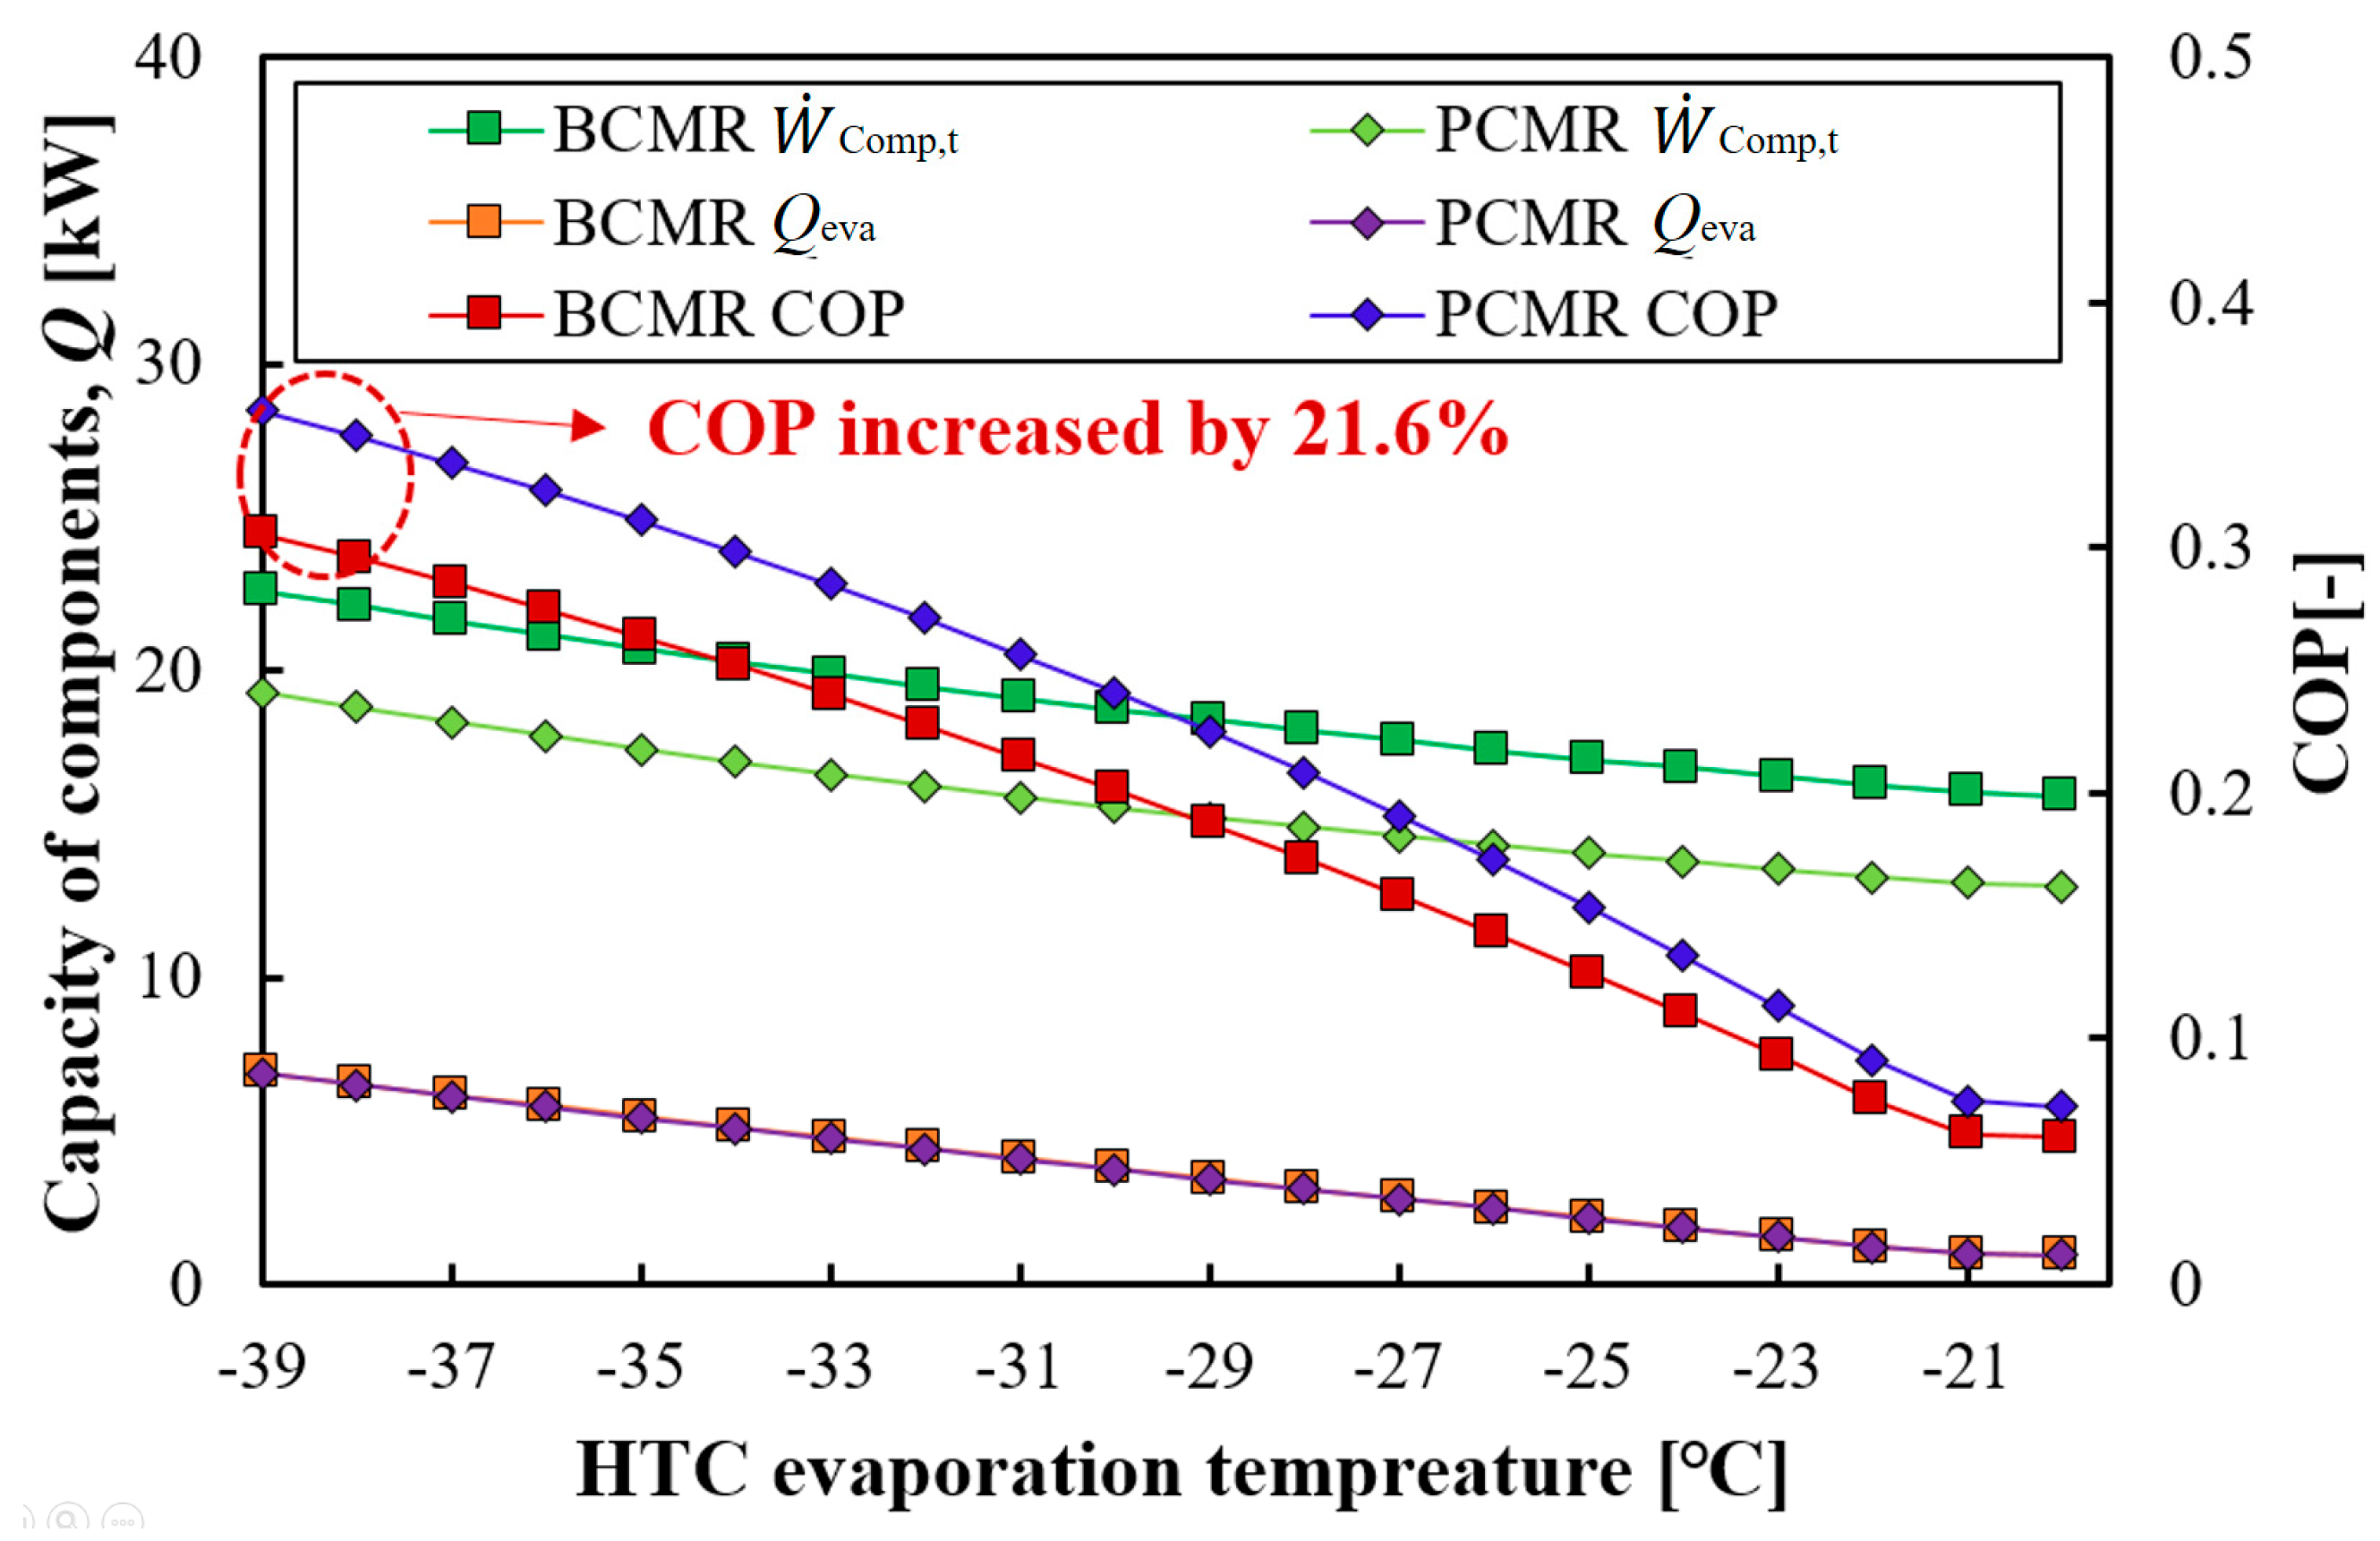
  • In CMR J–T systems, variations in the HTC evaporator temperature have a significant impact on the system’s COP. A lower evaporation temperature results in a higher COP, with a maximum increase of 21.6%. The main reason for this is that the previously mentioned non-azeotropic refrigerant undergoes phase changes within a certain pressure range based on temperature, affecting the achievable temperature, i.e., the cooling capacity of CMR J–T.
  • Variations in cooling water temperature in CMR J–T systems can result in a 13% and 15% increase in COP for a BCMR and PCMR, respectively, under the specified conditions. A PCMR is more sensitive to these temperature variations because they affect the temperature and capacity that can be handled by the precooler, resulting in changes in the capacity of the CHX and other HTC components.
  • From an exergy perspective, the evaporator temperature of HTC also has a significant impact. As the evaporator temperature decreases, there is an increasing trend in exergy destruction. However, exergy efficiency increases, albeit at a lower level compared to the increase in input energy (compressor power). Furthermore, the application of the precooler results in a maximum of 47.4% higher exergy efficiency within the analyzed range.
  • An analysis of the variation in cooling water temperature reveals that, from an exergy perspective, the use of a PCMR results in lower exergy destruction and higher exergy efficiency compared to a BCMR. However, when considering energy analysis, lower cooling water temperatures lead to an increase in COP, but exergy efficiency decreases. This discrepancy can be attributed to the fact that the reduction in compressor input power outweighs the decrease in exergy destruction.

Author Contributions

Conceptualization, writing, J.-H.Y.; methodology, formal analysis, J.-I.Y.; writing—review and supervision, visualization, investigation, S.-H.S.; editing, C.-H.S. All authors have read and agreed to the published version of the manuscript.

Funding

This research was funded by the National Research Foundation of Korea (NRF) grant funded by the Korean government (MSIT) (No. 2022R1F1A1071257).

Acknowledgments

This work was supported by the National Research Foundation of Korea (NRF) grant funded by the Korean government (MSIT) (No. 2022R1F1A1071257).

Conflicts of Interest

The authors declare no conflict of interest.

Nomenclature

MR:Mixed refrigerant [-]
CMR:Cascade mixed refrigerant [-]
J–T:Joule–Thomson [-]
HTC:High-temperature cycle [-]
LTC:Low-temperature cycle [-]
Q:Heat capacity [kW]
m ˙ :Mass flow rate [kg/s]
Cp:Specific heat capacity [kJ/kg∙K]
T:Temperature [K]
ΔT:Temperature difference [K]
W ˙ :Compressor work [kW]
ΔT:Temperature difference [K]
h:Specific enthalpy [kJ/kg]
s:Specific entropy [kJ/kg∙K]
X:Exergy destruction [-]
η :Efficiency [-]
Subscripts
Eva:Evaporator
Comp:Compressor
Cond:Condenser
EV:Expansion valve
CHX:Cascade heat exchanger
Pre:Precooler
IHX:Intermediate heat exchanger
CW:Cooling water
P:Pressure
T:Temperature
t:Total
in:Inlet
out:Outlet
H:High-temperature cycle
L:Low-temperature cycle
0:Reference state
s:specific entropy
ex:Exergy
ave:Average
eff:Efficiency

References

  1. Rodriguez-Criado, J.C.; Expósito-Carrillo, J.A.; Peris Pérez, B.; Dominguez-Muñoz, F. Experimental performance analysis of a packaged R290 refrigeration unit retrofitted with R170 for ultra-low temperature freezing. Int. J. Refrig. 2022, 134, 105–114. [Google Scholar] [CrossRef]
  2. Liu, Z.; Bai, M.; Tan, H.; Ling, Y.; Cao, Z. Experimental test on the performance of a −80 °C cascade refrigeration unit using refrigerants R290-R170 for COVID-19 vaccines storage. J. Build. Eng. 2023, 63, 105537. [Google Scholar] [CrossRef]
  3. Sun, J.; Zhang, M.; Gehl, A.; Fricke, B.; Nawaz, K.; Gluesenkamp, K.; Shen, B.; Munk, J.; Hagerman, J.; Lapsa, M. COVID 19 vaccine distribution solution to the last mile challenge: Experimental and simulation studies of ultra-low temperature refrigeration system. Int. J. Refrig. 2022, 133, 313–325. [Google Scholar] [CrossRef] [PubMed]
  4. Kochunni, S.K.; Chowdhury, K. Use of dual pressure Claude liquefaction cycles for complete and energy-efficient reliquefaction of boil-off gas in LNG carrier ships. Energy 2020, 198, 117345. [Google Scholar] [CrossRef]
  5. Romero Gómez, J.; Romero Gómez, M.; Lopez Bernal, J.; Baaliña Insua, A. Analysis and efficiency enhancement of a boil-off gas reliquefaction system with cascade cycle on board LNG carriers. Energy Convers. Manag. 2015, 94, 261–274. [Google Scholar] [CrossRef]
  6. Liu, S.; Bai, T.; Wei, Y.; Yu, J. Performance analysis of a modified ejector-enhanced auto-cascade refrigeration cycle. Energy 2023, 265, 126334. [Google Scholar] [CrossRef]
  7. Chakravarthy, V.S.; Shah, R.K.; Venkatarathnam, G. A review of refrigeration methods in the temperature range 4–300 K. J. Therm. Sci. Eng. Appl. 2011, 3, 020801. [Google Scholar] [CrossRef]
  8. Radebaugh, R. Refrigeration for Superconductors. Proc. IEEE 2004, 92, 1719–1734. [Google Scholar] [CrossRef]
  9. Venkatarathnam, G.; Kumar, P.; Murthy, S. Performance of a Throttle Cycle Refrigerator with Nitrogen-Hydrocarbon and Argon-Hydrocarbon Mixtures. In AIP Conference Proceedings; American Institute of Physics: College Park, MD, USA, 2004; Volume 710. [Google Scholar] [CrossRef]
  10. Gong, M.Q.; Wu, J.F.; Luo, E.G. Performances of the mixed-gases Joule-Thomson refrigeration cycles for cooling fixed-temperature heat loads. Cryogenics 2004, 44, 847–857. [Google Scholar] [CrossRef]
  11. Longsworth, R.C.; Boiarski, M.J.; Klusmier, L.A. 80 K Closed-Cycle Throttle Refrigerator BT-Cryocoolers 8; Ross, R.G., Ed.; Springer: Boston, MA, USA, 1995; pp. 537–541. ISBN 978-1-4757-9888-3. [Google Scholar]
  12. Little, W.A.; Sapozhnikov, I. Development of a Low Cost, Cryogenic Refrigeration System for Cooling of Cryoelectronics BT-Advances in Cryogenic Engineering; Kittel, P., Ed.; Springer: Boston, MA, USA, 1994; pp. 1467–1474. ISBN 978-1-4615-2522-6. [Google Scholar]
  13. Radebaugh, R. Cryocoolers: The state of the art and recent developments. J. Phys. Condens. Matter 2009, 21, 164219. [Google Scholar] [CrossRef]
  14. Bychkov, E.G. An analytical method for ensuring the optimal circulating composition of the multicomponent refrigerant mixture in a steady-state operation mode of the Joule-Thomson refrigerator operating with mixtures. Int. J. Refrig. 2021, 130, 356–369. [Google Scholar] [CrossRef]
  15. Sreenivas, B.; Nayak, H.G.; Venkatarathnam, G. Relationship between composition of mixture charged and that in circulation in an auto refrigerant cascade and a JT refrigerator operating in liquid refrigerant supply mode. Cryogenics 2017, 81, 42–46. [Google Scholar] [CrossRef]
  16. Rozhentsev, A. Refrigerating machine operating characteristics under various mixed refrigerant mass charges. Int. J. Refrig. 2008, 31, 1145–1155. [Google Scholar] [CrossRef]
  17. Wang, H.C.; Chen, G.F.; Dong, X.Q.; Zhao, Y.X.; Guo, H.; Gong, M.Q. Performance comparison of single-stage mixed-refrigerant Joule–Thomson cycle and pure-gas reverse Brayton cycle at fixed-temperatures from 80 to 180 K. Int. J. Refrig. 2017, 80, 77–91. [Google Scholar] [CrossRef]
  18. Bai, T.; Li, D.; Xie, H.; Yan, G.; Yu, J. Experimental research on a Joule-Thomson refrigeration cycle with mixture R170/R290 for −60 °C low-temperature freezer. Appl. Therm. Eng. 2021, 186, 116476. [Google Scholar] [CrossRef]
  19. Lu, X.; Rui, S.; He, T. Experimental investigation of cycle characteristics of a R23 and R600a based Joule-Thomson refrigerator. Heat Mass Transf. 2019, 55, 1439–1446. [Google Scholar] [CrossRef]
  20. Jerome, S.; Venkatarathnam, G. Performance of a Linde-Hampson refrigerator operating from −120 °C to −60 °C with optimised R14-hydrocarbon mixtures exhibiting vapour-liquid-liquid equilibria. Heat Mass Transf. 2020, 56, 1523–1535. [Google Scholar] [CrossRef]
  21. Walimbe, N.S.; Narayankhedkar, K.G.; Atrey, M.D. Experimental investigation on mixed refrigerant Joule–Thomson cryocooler with flammable and non-flammable refrigerant mixtures. Cryogenics 2010, 50, 653–659. [Google Scholar] [CrossRef]
  22. Podtcherniaev, O.; Boiarski, M.; Lunin, A. Comparative Performance of Two-Stage Cascade and Mixed Refrigerant Systems in a Temperature Range from–100C to–70C. 2002. International Refrigeration and Air Conditioning Conference. Paper 618. Available online: http://docs.lib.purdue.edu/iracc/618 (accessed on 3 September 2023).
  23. Liu, J.; Liu, Y.; Yu, J.; Yan, G. Thermodynamic analysis of a novel vapor-injection Joule-Thomson refrigeration cycle with a binary hydrocarbon mixture for −86 °C freezer. Appl. Therm. Eng. 2023, 230, 120835. [Google Scholar] [CrossRef]
  24. Podtcherniaev, O. Performance of throttle-cycle coolers operating with mixed refrigerants designed for industrial applications in a temperature range 110 to 190 K. In AIP Conference Proceedings; AIP: Woodbury, NY, USA, 2002; Volume 613, pp. 863–872. [Google Scholar]
  25. Pan, M.; Zhao, H.; Liang, D.; Zhu, Y.; Liang, Y.; Bao, G. A review of the cascade refrigeration system. Energies 2020, 13, 2254. [Google Scholar] [CrossRef]
  26. Yoon, J.-I.; Son, C.-H.; Seol, S.-H.; Yoon, J.-H. Perspective Chapter: Ultra-Low Temperature Chillers for Semiconductor Manufacturing Process; Vizureanu, P., Ed.; IntechOpen: Rijeka, Croatia, 2021; p. Ch. 3. ISBN 978-1-80355-610-9. [Google Scholar]
  27. Lee, J.; Hwang, G.; Jeong, S.; Park, B.J.; Han, Y.H. Design of high efficiency mixed refrigerant Joule–Thomson refrigerator for cooling HTS cable. Cryogenics 2011, 51, 408–414. [Google Scholar] [CrossRef]
  28. Almeida-Trasvina, F.; Smith, R. Design and optimisation of novel cascade mixed refrigerant cycles for LNG production–Part I: Benchmark cascade cycles. Chem. Eng. Res. Des. 2023, 190, 619–633. [Google Scholar] [CrossRef]
  29. Almeida-Trasvina, F.; Smith, R. Design and optimisation of novel cascade mixed refrigerant cycles for LNG production–Part II: Novel cascade configurations. Energy 2023, 266, 126404. [Google Scholar] [CrossRef]
  30. Lee, K.S.; Yoon, J.I.; Son, C.H.; Lee, J.H.; Moon, C.G.; Yoo, W.J.; Lee, B.C. Performance Characteristics of a Joule–Thomson Refrigeration System with Mixed Refrigerant Composition. Heat Transf. Eng. 2021, 42, 1087–1096. [Google Scholar] [CrossRef]
  31. Wang, Y.; Zhao, Y.; Wang, H.; Gong, M. The effective refrigeration temperature zone expressed by partial molar enthalpy difference of each component in mixed-refrigerant Joule-Thomson refrigerators. Cryogenics 2022, 128, 103590. [Google Scholar] [CrossRef]
  32. Aspen HYSYS V12; Aspen Technology Inc.: Bedford, MA, USA, 2023.
  33. Ardhapurkar, P.M.; Atrey, M.D. Performance optimization of a miniature Joule-Thomson cryocooler using numerical model. Cryogenics 2014, 63, 94–101. [Google Scholar] [CrossRef]
  34. Lakshmi Narasimhan, N.; Venkatarathnam, G. A method for estimating the composition of the mixture to be charged to get the desired composition in circulation in a single stage JT refrigerator operating with mixtures. Cryogenics 2010, 50, 93–101. [Google Scholar] [CrossRef]
  35. Mota-Babiloni, A.; Navarro-Esbrí, J.; Barragán, Á.; Molés, F.; Peris, B. Theoretical comparison of low GWP alternatives for different refrigeration configurations taking R404A as baseline. Int. J. Refrig. 2014, 44, 81–90. [Google Scholar] [CrossRef]
  36. Bayrakçi, H.C.; Özgür, A.E. Energy and exergy analysis of vapor compression refrigeration system using pure hydrocarbon refrigerants. Int. J. Energy Res. 2009, 33, 1070–1075. [Google Scholar] [CrossRef]
  37. Yan, G.; Chen, J.; Yu, J. Energy and exergy analysis of a new ejector enhanced auto-cascade refrigeration cycle. Energy Convers. Manag. 2015, 105, 509–517. [Google Scholar] [CrossRef]
  38. Yang, M.H.; Yeh, R.H. Performance and exergy destruction analyses of optimal subcooling for vapor-compression refrigeration systems. Int. J. Heat Mass Transf. 2015, 87, 1–10. [Google Scholar] [CrossRef]
Figure 1. Schematic of the PCMR J–T cycle.
Energies 16 06991 g001
Figure 2. P–h diagram of the PCMR J–T cycle.
Energies 16 06991 g002
Figure 3. Differential enthalpy per unit mass between high and low pressure along the isothermal lines.
Energies 16 06991 g003
Figure 4. Joule–Thomson coefficient with operating pressure.
Energies 16 06991 g004
Figure 5. Performance comparison of the system according to HTC evaporation temperature.
Energies 16 06991 g005
Figure 6. Performance comparison of the system according to cooling water temperature.
Energies 16 06991 g006
Figure 7. Capacity comparison of each component in CMR J–T.
Energies 16 06991 g007
Figure 8. LTC side CHX inlet temperature and capacity variations with cooling water temperature.
Energies 16 06991 g008
Figure 9. Exergy analysis according to the HTC evaporation temperature.
Energies 16 06991 g009
Figure 10. Exergy analysis according to the cooling water temperature.
Energies 16 06991 g010
Figure 11. Exergy destruction analysis for each component.
Energies 16 06991 g011
Table 1. List of working fluids.
TypeRefrigerantNormal Boiling Point [°C]Global Warming PotentialOzone Depletion PotentialSafety Group
HydrofluorocarbonR-134a−26.314300A1
PerfluorocarbonR-218−36.788300A1
HydrofluorocarbonR-125−48.531700A1
PerfluorocarbonR-116−78.212,2000A1
HydrofluorocarbonR-23−82.114,8000A1
PerfluorocarbonR-14−127.873900A1
-Argon−185.8500A1
Table 2. Analysis conditions of CMR J–T cycle.
Design ParameterValues
Cooling waterSupply temperature18~28 °C
Flow rate1 kg/s
HTCCondensation temperatureΔ10 (from cooling-water inlet temperature) °C
Evaporator inlet temperature−39~−20 °C
Superheat and subcool temperatures5 °C
Working fluidR-404A
LTCPrecooler outlet temperatureΔ3 (from cooling-water inlet temperature) °C
Evaporator temperature−110 °C
IHX minimum approach4.829 °C
Discharge pressure2 MPa
Suction pressure0.2 MPa
Compressor work11.25 kW
Working fluidMixed refrigerants
(R-218, R-23, R-14, Ar)
Heat exchangerPressure drop in heat exchanger
(refrigerant side/water side)
30/20 kPa
Disclaimer/Publisher’s Note: The statements, opinions and data contained in all publications are solely those of the individual author(s) and contributor(s) and not of MDPI and/or the editor(s). MDPI and/or the editor(s) disclaim responsibility for any injury to people or property resulting from any ideas, methods, instructions or products referred to in the content.

