Abstract
The battery management system (BMS) is a core component to ensure the efficient and safe operation of electric vehicles, and the practical evaluation of key BMS functions is thus of great importance. However, the testing of a BMS with actual battery packs suffers from a poor testing repeatability and a long status transition time due to the uncontrollable degradation of battery systems and testing environment variations. In this paper, to overcome this challenge, we propose an efficient BMS testing framework that uses virtual battery packs rather than actual ones, thus enabling a rapid and accurate evaluation of a BMSs key functions. A series-connected virtual battery pack model through leveraging Copula’s method is formulated to capture the dynamics and inconsistency of individual batteries in the pack. The developed lithium iron phosphate model features low computational efforts and is experimentally validated with different dynamical profiles, implying a high-precision virtual battery pack that is capable of reproducing the actual one. Furthermore, this framework includes a closed-loop testing platform, which can provide the state-of-charge/state-of-power references and thus automatically test and evaluate the states of the battery packs estimated from the BMS. Particularly, we consider the initial polarization that often exists in the batteries during the operation to accurately calibrate the available state-of-power benchmark of battery packs in the real world. The performed BMS testing results using the proposed framework illustrate that the tested BMS cannot adapt to the varied operation conditions, thus leading to high state estimation errors, which may result in the over-charge/discharge or over-temperature of the batteries. Therefore, this work highlights the value of effective BMS testing, providing the promising potential to achieve reliability and durability for battery systems.
1. Introduction
The dual pressure of the energy crisis and environmental protection has fueled the rapid development of electric vehicles and new energy technologies. Lithium-ion batteries, as the mainstream power source of electric vehicles and battery energy storage systems, are usually equipped with a battery management system (BMS) to ensure their reliable and safe operation [1,2,3]. Therefore, the accurate testing and effective evaluation of the key BMS functions are of a great significance for battery systems’ safe and reliable operation.
Test and evaluation techniques for BMSs based on actual battery packs are maturing. The performance and functional safety testing of BMS systematically were summarized, and a corresponding testing scheme is proposed in [4]. Based on this, some new tests on the state-of-charge (SOC) error correction speed and state-of-power (SOP) test have been added [5]. Kalk et al. [6] built a test bench to perform rapid testing and the real-time evaluation of the developed BMS algorithm using actual battery packs. Due to the problems of a poor test repeatability, being time-consuming, having a requirement for several surrounding equipment, and a low safety using the actual battery to test the BMS [7], researchers have developed virtual batteries with various functions. The virtual battery is a power source that can simulate the charging and discharging characteristics of a battery pack under different operating conditions. Hence, the key step for a virtual battery pack to be able to replace the actual battery pack for the testing of a BMS is to establish an accurate model. The current battery model mainly includes an electrochemical, black box, and the equivalent circuit models. The equivalent circuit model is commonly used for battery pack modeling. After lithium-ion batteries are grouped, there are inconsistencies in the parameters such as the capacity, SOC, internal resistance, and temperature among the individual cells. Considering that the inconsistency parameters significantly impact the battery pack’s performance [8,9,10,11], it is necessary to build an inconsistency model when simulating the output characteristics of the battery pack. Several studies have been conducted on the distribution of the battery pack’s parameters [12,13,14,15]. It has been found that the distribution of parameters is diverse, and a significant correlation between them exists. The research on battery inconsistency modeling focuses on the reconstruction of the battery pack’s parameters, referencing the distribution of the existing parameters, which can be achieved through sampling based on statistical distributions. For example, Jiang et al. [16] used the Copula function to model the battery inconsistency parameters. They demonstrated the superiority of the Copula-based approach by estimating the available energy of the battery pack. Lin et al. [11] considered the battery cell’s internal resistance and SOC usage interval’s inconsistency when performing a battery pack fault diagnosis. However, almost all of these studies are based on first-order resistance and capacitance (RC) for inconsistency modeling due to its simplicity, resulting in the limited dynamic simulation of the battery system.
On the other hand, a closed-loop testing platform is urgently needed to implement the fully automated testing of the BMSs functions. Hardware-in-the-loop (HIL) simulation has been used in many fields, such as control development and verification, the product and component assessment, and the system performance validation [17]. Using a pure numerical simulation for development testing has the disadvantage that the accuracy of the conclusions is strongly dependent on the numerical model, but using a pure hardware platform is costly. The HIL testing system makes up for the shortcomings of both of the aspects mentioned above [18], which has led to a boom in the use of the HIL system to test the BMSs functions. Nevertheless, most of the existing industry tests employ an open-loop format, which cannot be adjusted in-loop to the actual operating conditions. In the long term, the HIL BMS closed-loop testing systems must be developed for a more convenient and practical testing.
As the virtual battery appears, an HIL BMS testing platform based on the virtual battery is gradually established so that the BMS can be tested repeatedly many times. Barreras et al. [19] proposed a simulated battery model for a commercial HIL simulator considering the dependence of the battery model on the temperature, aging, and SOC, and tested the BMS, including the exemplary functional test and fault insertion test. Fleischer et al. [20] introduced the theoretical principles of BMS testing, proposed a practical method to develop dedicated software and strategies for system-level BMS testing on a commercial HIL simulator, and tested the BMS under overvoltage, overtemperature, short-circuit, and low-temperature charging conditions. A battery simulator used to test the functionality of the BMS applied to the medium-power battery is presented in [21], and the functionality of the BMS balancing circuit was tested. Dinggen et al. [22] built a BMS testing platform based on CAN communication, designed a master-slave structure to combine several test units, and wrote the platform host with LabWindows/CVI to realize the multiple function testing of BMS. Cao [23] developed a battery model considering various factors, constructed an HIL testing platform for the BMS using a virtual battery, and used the RT-LAB real-time simulation platform to verify and test the designed BMSs functions. The literature mentioned above conducts in-depth research mainly in BMS hardware functional testing. Despite these achievements, the platform and technique to automatically test and evaluate the state estimation algorithms for a BMS have yet to be investigated.
In this paper, a virtual battery pack-based HIL platform is developed to achieve the fully automated testing and evaluation of the BMS state estimation algorithm. First, a lithium iron phosphate battery pack model connected in series is established. It is suitable for virtual batteries and relies on the Copula method. Then, a closed-loop, fully automated HIL platform based on a virtual battery pack is designed to meet the testing needs of a BMS. Finally, a test evaluation method for a BMS state estimation based on a virtual battery pack is presented and experimentally tested. The main contributions of this paper lie in the following aspects: (1) we modeled a virtual battery pack with a high accuracy, which is achieved by combining the generated battery pack’s inconsistency parameters with the second-order RC individual model. At the same time, the pack model is made to run matrixed to improve the efficiency of the operation. (2) We designed and built a BMS closed-loop testing platform based on a virtual battery pack for the BMSs test contents. (3) Finally, we established a versatile, operational, and comprehensive BMS measurement and evaluation system. In particular, different initial polarization states are considered when deriving the SOP reference value, making the test closer to the actual situation.
The remainder of this paper is structured as follows: Section 2 describes the process of building the virtual battery pack model. Section 3 shows the construction of the BMS closed-loop testing platform and the hardware and software components. Section 4 describes the BMSs SOC/SOP estimation accuracy testing technique based on the HIL system. Section 5 discusses the experimental results. Finally, Section 6 summarizes all of the contents.
2. Virtual Battery Pack Modeling
2.1. Battery Cell Modeling
The key to a virtual battery replacing an actual battery is the accuracy of the battery model. The circuit model performs relatively well in simulating the battery cell external characteristics. The second-order RC circuit model, which has a simple structure and is widely used, is selected to simulate the lithium-ion battery, as shown in Figure 1. The model consists of a voltage source, a resistor, and two RC networks representing short transients and long transients, respectively, and the terminal voltage of the batteries can be calculated as:
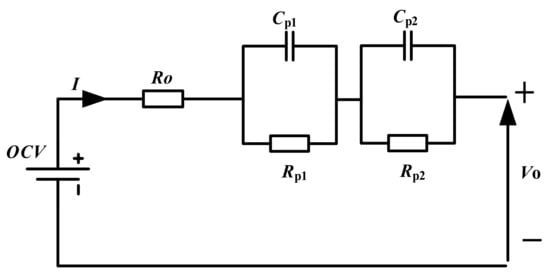
Figure 1.
Battery cell model: the second-order equivalent circuit.
The model’s parameters are generally identified using the data obtained from the hybrid pulse power characterization (HPPC) test at different SOC values [24]. However, the battery polarization is rarely in a stable state in the actual situation, which leads to the limited applicability of the parameters obtained using the HPPC tests method, and the accuracy of the model established in this way is inferior. In order to build a model with a better applicability, we use the method proposed in [25] to identify the model’s parameters by applying continuous pulses to the second-order equivalent circuit. The accuracy and reliability of this method have been verified in [25].
2.2. Copula-Based Modeling of Parameter Inconsistencies in Battery Pack
The Copula function is commonly used to connect the joint distribution functions and the marginal distribution function of each variable, which can generate marginal distribution functions and correlation properties between random variables like the original data distribution. The Copula is defined as the joint cumulative distribution function of the standard uniform random variables, which can be used to describe the correlation between random variables. Its core concept is to couple the marginal distributions of multiple random variables with the Copula function. The joint distribution function of an N-dimensional random variable (X1,..., Xn) is shown in Equation (2). According to Sklar’s theorem, there exists a Copula function C such that Equation (3) holds, where F1,..., Fn is the corresponding marginal distribution of each random variable. In this paper, the sampling method based on the Copula function is used to achieve the regeneration of the battery pack’s parameters. A detailed sampling procedure for the inconsistency parameters of the battery pack can be found in [26].
2.3. Battery Pack Model
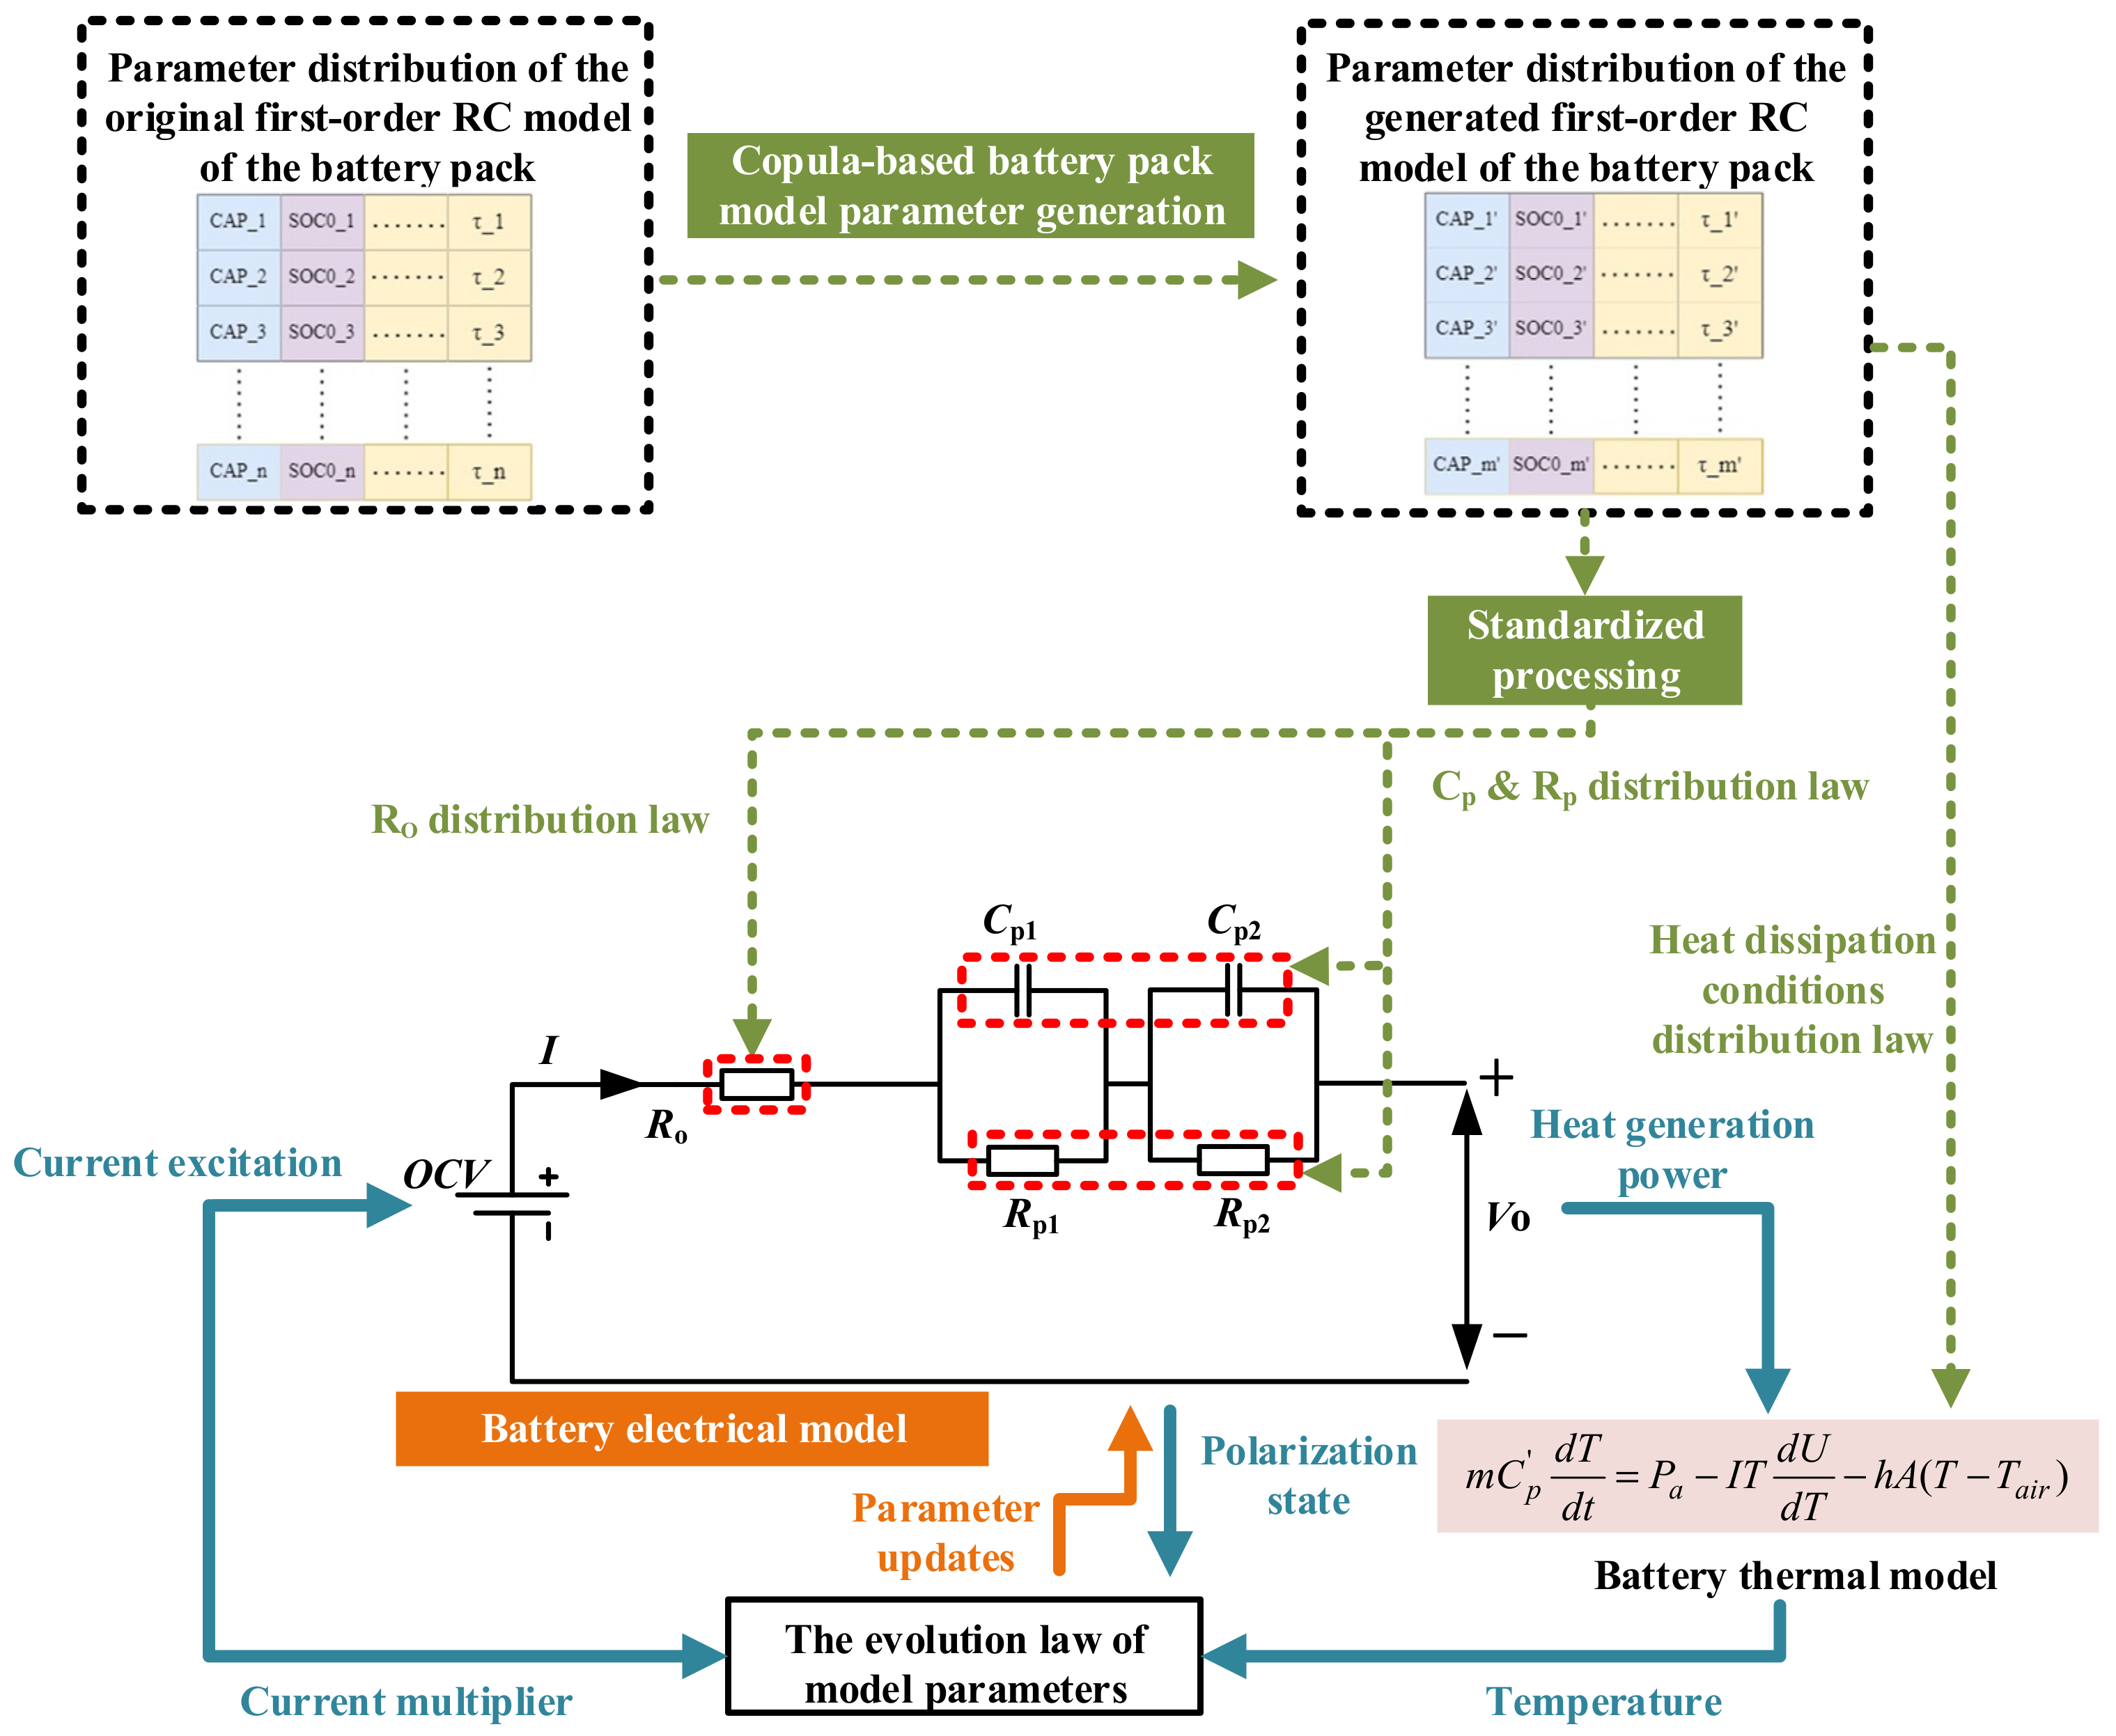
A virtual battery pack can be developed by combining the equivalent circuit model of the battery cell and the new battery pack parameters generated based on the copula method, as shown in Figure 2. The virtual battery pack also includes a lumped thermal model to comprehensively describe the behaviors of the battery, including the electrical performance and the thermal variations [27]. The parameters of the electrical model are highly dependent on the temperature, and the electrical behavior of the battery generates heat. Therefore, the electrical and thermal models are coupled to each other. Specifically, when the battery is excited, the terminal voltage and heat generation power can be calculated according to the electrical model. After the heat production, the temperature of the battery is calculated according to the thermal model. On the other hand, the battery’s parameters change with the temperature, which in turn affects the output voltage of the electrical model. Subsequently, the heat production power of the battery changes, which will affect the temperature rise of the battery.
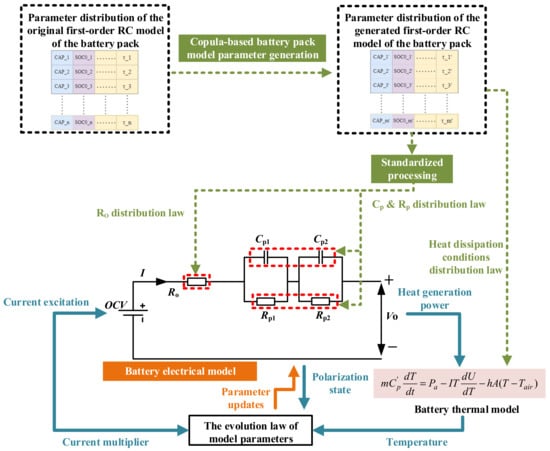
Figure 2.
Schematic diagram of virtual battery pack modeling.
The battery pack model connected in series is built on the battery cell model. First, the Copula-based battery inconsistency modeling method is used to generate new model parameters based on the existing second-order RC model parameters of the battery pack. Additionally, the distribution function of the Copula function uses a Gaussian Copula. Then, the generated parameters are normalized, and the ratio of the individual model parameters to the mean is calculated, as shown in Equation (4).
Finally, based on the identified parameters in the previous subsection, the resistance and capacitance parameters of the individual in the virtual battery pack are calculated according to Equation (5).
In the simulation calculation of the battery pack based on the virtual battery, the whole calculation process is slow if the model is called repeatedly for each battery, which is obviously unreasonable. Therefore, multiple battery cell models are matrixed in a single computational process for the virtual battery pack. The polarization voltage and terminal voltage are calculated with Equations (6) and (7). The matrixed processing of the battery model improves the computational efficiency of the virtual battery model. Subsequently, the dynamic voltage response of the virtual battery is accelerated.
3. Battery Management System Testing Framework
The battery management system’s testing platform can achieve a rapid switching of the testing conditions and a high test repeatability by adopting a virtual battery and high-precision current sources to simulate the input and output of the analog signals from actual battery packs. With the help of a real-time simulation system, the software and hardware can be designed to obtain a closed-loop BMS testing system.
Figure 3 presents the framework of the BMSs testing platform, which mainly consists of hardware and software parts. The hardware part includes four modules: the tested samples module, analog signal module, high precision collection module, and real-time simulation system module. The software includes the high-precision battery pack equivalent circuit model and SOX reference value estimation. In addition, the upper computer management software can be responsible for the interaction between the machines and researchers, including data monitoring and the data visualization design of each module of the platform, the management of the test conditions, the starting state setting of the battery pack model, and the start-stop control of the test.
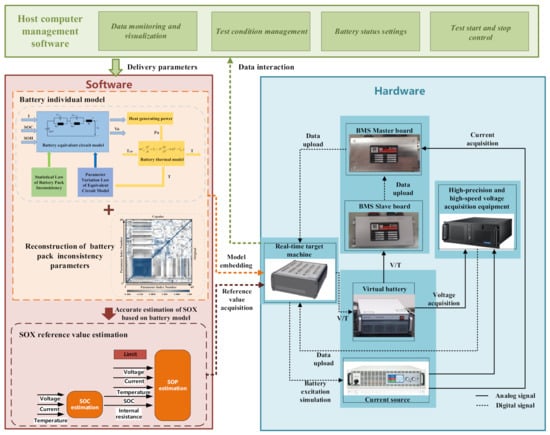
Figure 3.
Schematic diagram of BMS testing framework.
3.1. Hardware Part
The hardware part of the battery management system’s testing platform consists of a virtual battery pack, a current source and conditioning circuit, the BMS under test, high-precision collection equipment, and a real-time target machine (dSPACE). The virtual battery pack mainly realizes the output of analog signals, such as the voltage and temperature. Most BMSs use thermistors to collect temperature signals, that is, by measuring the voltage of a certain port and calculating the resistance of the sensor to obtain the battery’s temperature. The current source is a unidirectional output source, which is mainly used to simulate the total current signal of the battery system. The signal conditioner module uses a full-bridge circuit to converse the unidirectional to bidirectional current. The current source and its signal conditioner module jointly realize the output of the charging and discharging analog signal of the battery system. The real-time target machine is for the realization of the software part and is also the control center of each hardware part. Hence, it can realize the output control of the virtual object and the communication interaction between each hardware link. The primary task of the high-precision collection equipment is to collect the analog signal output from the virtual object and upload the collected signal data to the upper computer. A high-precision voltage acquisition system is integrated in the virtual battery used in this paper, so the value of the voltage acquisition system is directly used as the high-precision acquisition result. Similarly, a high-precision current acquisition system is integrated into the current source. Combined with the reported value, the BMS is evaluated after acquiring the reference value using the data transmitted from the high-precision collection equipment.
Figure 4 displays the physical view of the virtual battery-based BMS testing platform. The hardware part mainly realizes the interaction between each hardware module through the real-time simulation system. Overall, the dSPACE controls the outputs of the analog signal sources, such as the voltage output of the virtual battery and the current output of the current source. Then, the BMS under test and the high-precision acquisition equipment simultaneously acquires data from the analog signals and transmits the data back to the dSPACE, which can realize the evaluation of the BMSs acquisition accuracy. Eventually, the BMSs estimation accuracy is evaluated by comparing the SOX estimation results of the measured BMS with the SOX benchmark values obtained by the algorithm embedded inside the real-time simulation system.
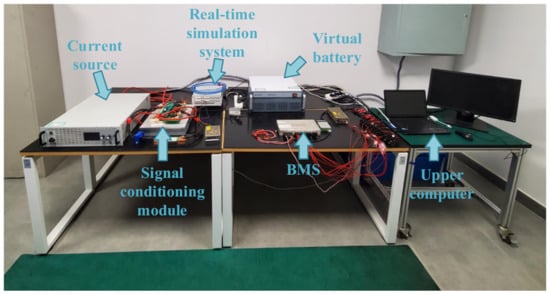
Figure 4.
Physical view of battery management system testing platform.
3.2. Software Part
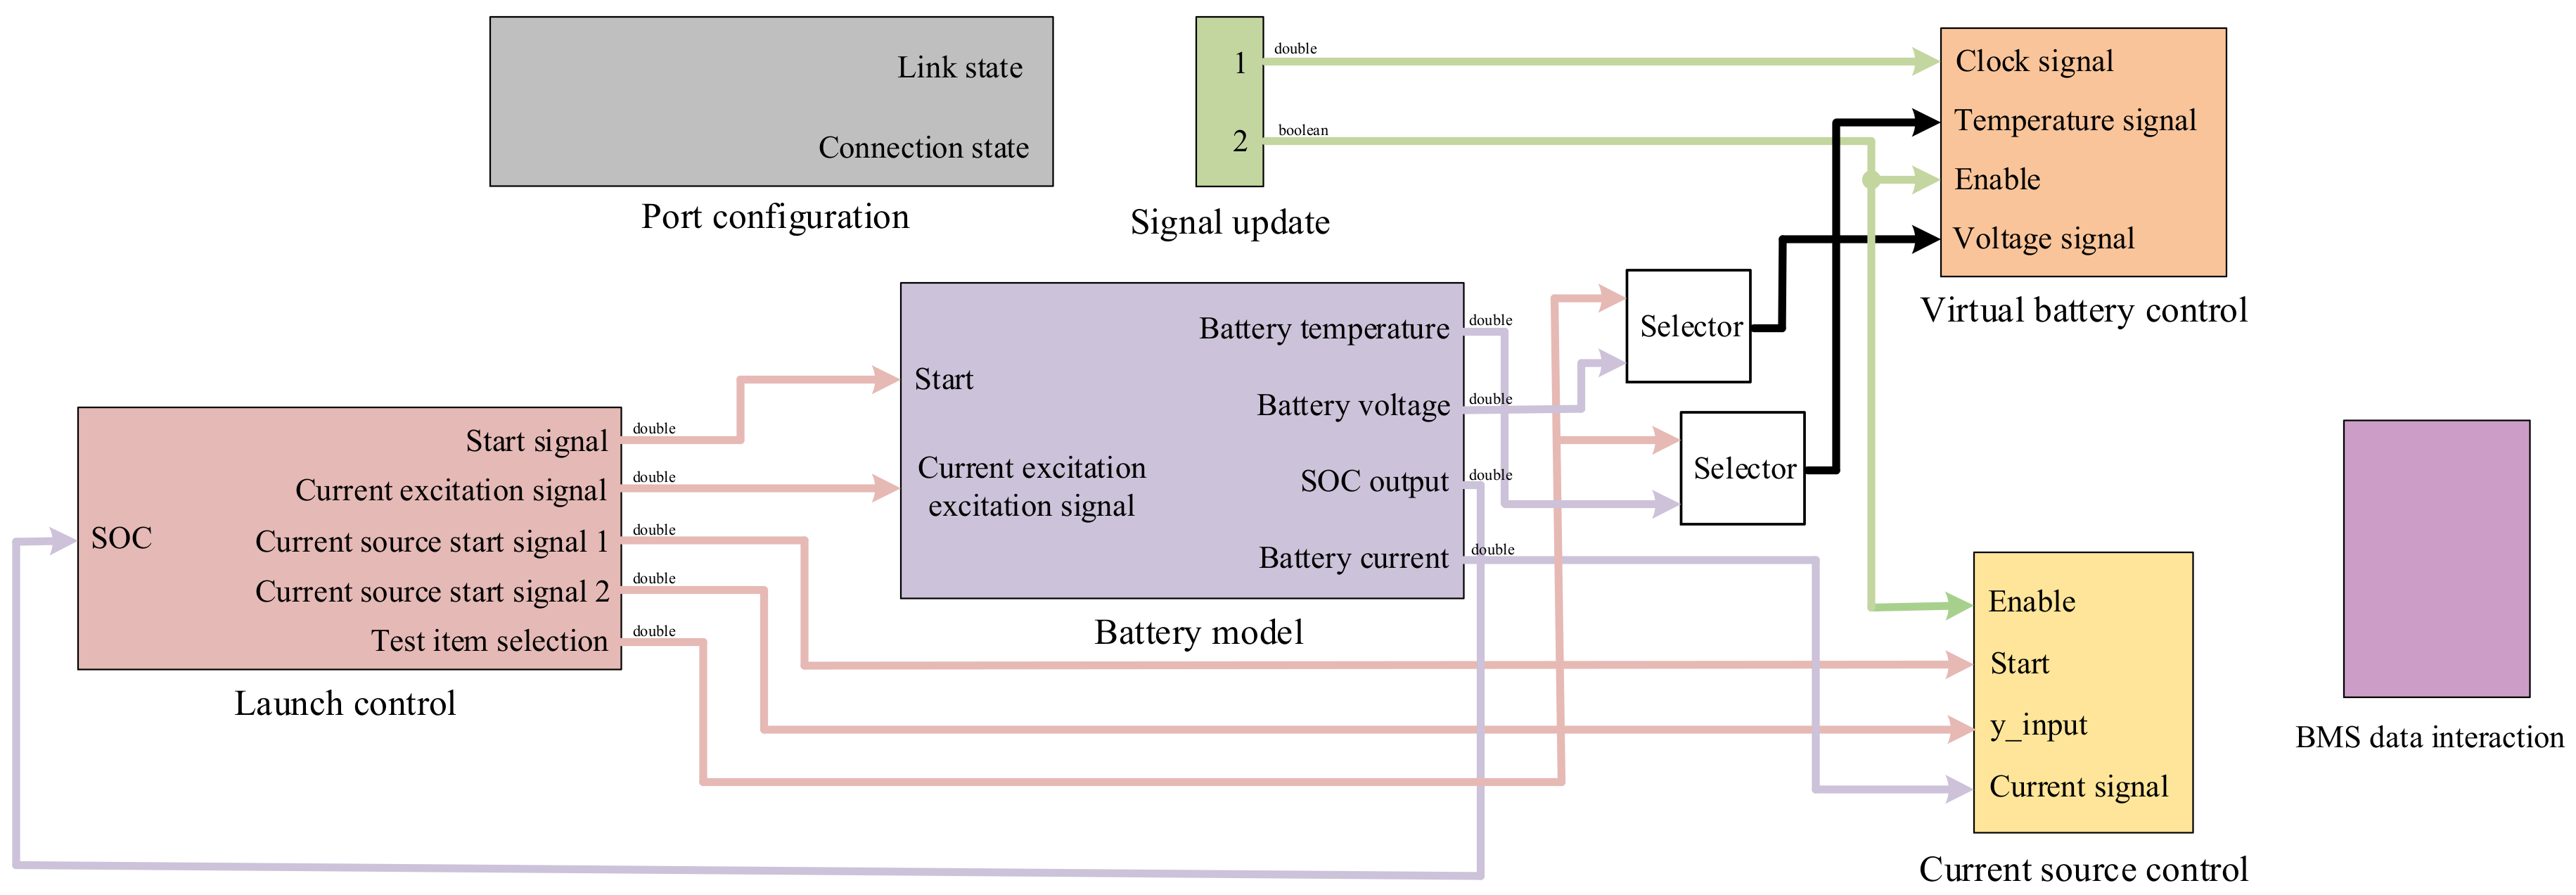
In this paper, the software part of the testing system is designed based on Simulink in MATLAB, whose structural block diagram is shown in Figure 5. The software part is divided into seven modules: the launch control module, battery model module, virtual battery control module, current source control module, BMS data interaction module, signal update module, and port configuration module. Among them, the battery model is the core of the software part, which is mainly used to control the output value of analog signals, such as the battery cell voltage, battery cell temperature, and total current. The function of the virtual battery control module is mainly to control the output signal of the hardware part by converting the calculation results of the model into the data that the device can recognize according to the specified communication protocol. The current source control module ensures that the current path is always maintained during the signal tuning of the unidirectional current source.
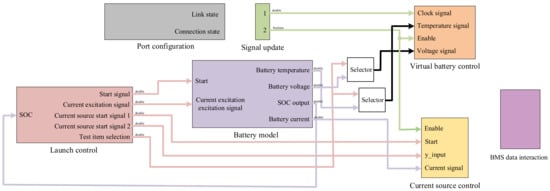
Figure 5.
The software part of battery management system testing framework.
In addition, this platform uses the ControlDesk software for the interface and visualization of the host computer, which plays the role of a human–computer interaction, command issuance, and data visualization. The functions of the host computer include the parameters setting of the battery model, input mode setting of the analog signals, function testing condition setting, and data visualization.
4. BMS SOC/SOP Estimation Testing Based on Virtual Battery Pack
The scientific measurement and accurate evaluation of the BMSs performance are essential to ensure the safety of the battery system in complex environments, the accuracy of the BMS throughout its life cycle, and its efficiency during service. This paper focuses on the accuracy test of the BMSs state estimation. As mentioned in the previous section, the evaluation of the BMSs estimation accuracy is achieved by comparing the SOC/SOP estimation results of the BMS under test with the reference value in the BMS closed-loop testing system. It is worth mentioning that the testing for the BMSs estimation accuracy is similar to a black-box process.
4.1. Battery Pack SOC Estimation Accuracy Test
4.1.1. Battery Pack SOC Reference Value
Before evaluating the SOC estimation from the BMS, the SOC reference value needs to be accurately obtained. In practice, the battery pack’s charging or discharging is limited by the battery cell that achieves the full charge or the full discharge. In this paper, the battery pack’s SOC reference value is calculated using the definition based on the battery cell, as shown in Equation (8). SOCi is computed with the data collected using high-precision acquisition equipment and CAPi are obtained by the Battery Cell Capacity Test (see Appendix A). Therefore, the SOC of the battery pack calculated based on Equation (8) must have a higher accuracy than the SOC estimated by the BMS, and it is feasible to use it as a reference value.
4.1.2. SOC Estimation Accuracy Test Method for BMS
- (1)
- Cumulative error test
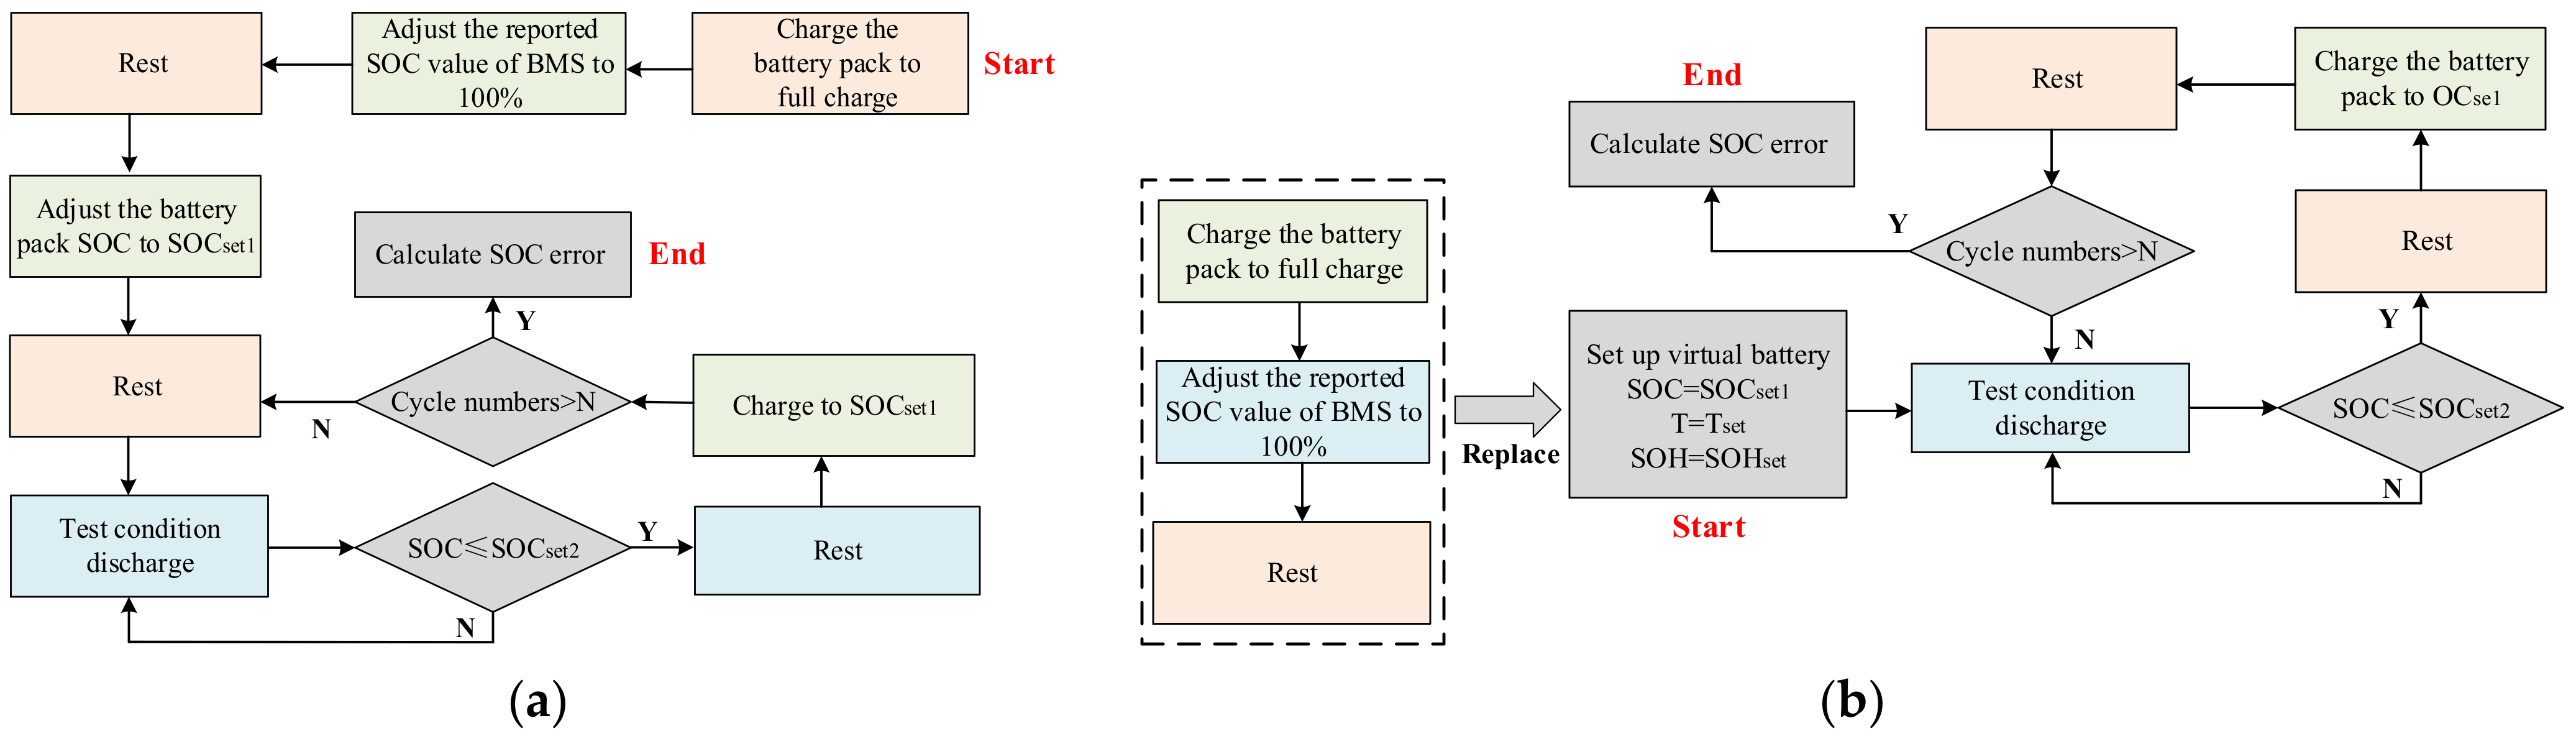
Figure 6 presents the SOC cumulative error test flow chart based on the actual and virtual battery packs. The cumulative error test of the BMS is to judge the BMSs SOC accuracy after N times charge/discharge cycles in a fixed SOC interval, which is essential to detect whether the BMSs SOC estimation is qualified. Since the virtual battery pack can be quickly switched between different SOC states, temperatures, and aging states via the host computer, it can save a lot of time when using the virtual battery pack to conveniently evaluate the BMSs functions compared with that when using the actual one.
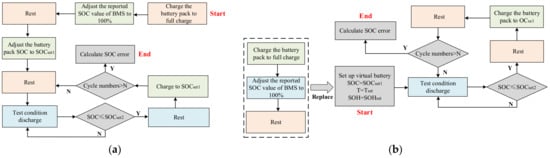
Figure 6.
SOC cumulative error testing: (a) based on actual battery pack; (b) based on virtual battery packs.
- (2)
- SOC error correction speed test
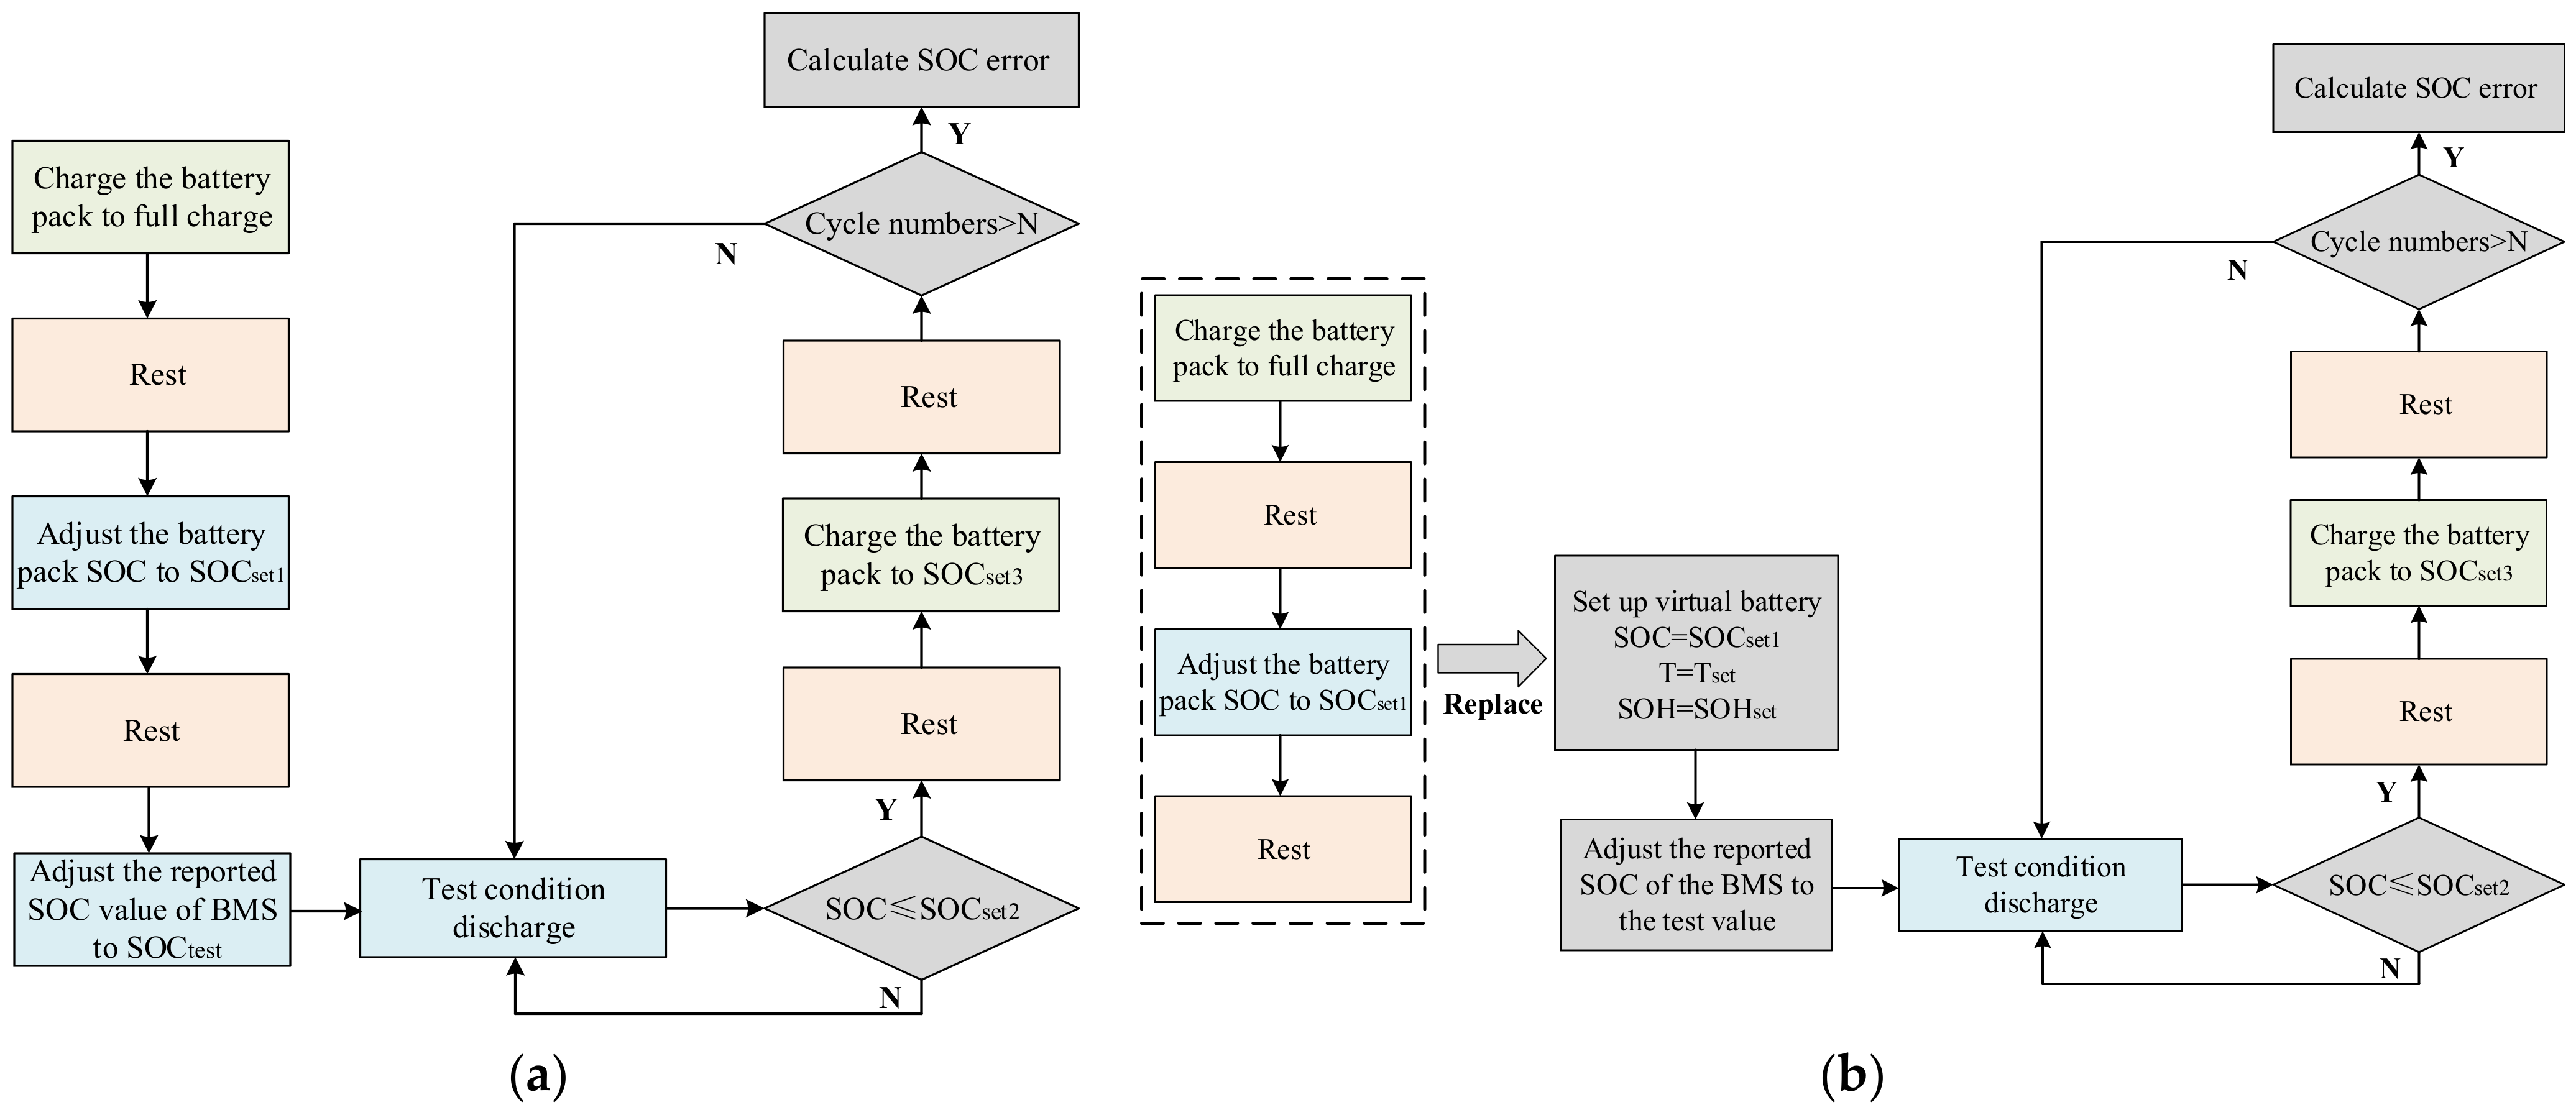
The purpose of the SOC error correction speed test is to evaluate the BMSs error correction function and test the correction speed in the case of the SOCs deviation. We can test the correction speed in different SOC intervals and deviations by setting the initial SOC, and the specific settings are shown in Table A2 in Appendix B. The flow chart of the SOCs cumulative error test based on the actual and virtual battery pack is shown in Figure 7. Compared to the actual battery pack testing, the virtual battery packs only need to adjust the output state of the battery model to the desired SOC by the upper computer of the virtual battery. Based on the virtual battery, it is also possible to realize the SOC error correction speed test under different temperatures and aging states, which is challenging to realize with the actual battery pack.

Figure 7.
SOC error correction speed test flow: (a) based on actual battery pack; (b) based on virtual battery packs.
4.1.3. SOC Estimation Accuracy Evaluation for BMS
After the SOC cumulative error test and the SOC error correction speed test are performed on the BMS, the error between the estimated value of the BMS and the SOC reference value is calculated by Equation (9), and SOCREF is obtained from Equation (8).
4.2. SOP Estimation Accuracy Test for BMS
4.2.1. Battery Pack SOP Reference Value
- (1)
- Multi-boundary feature chart method
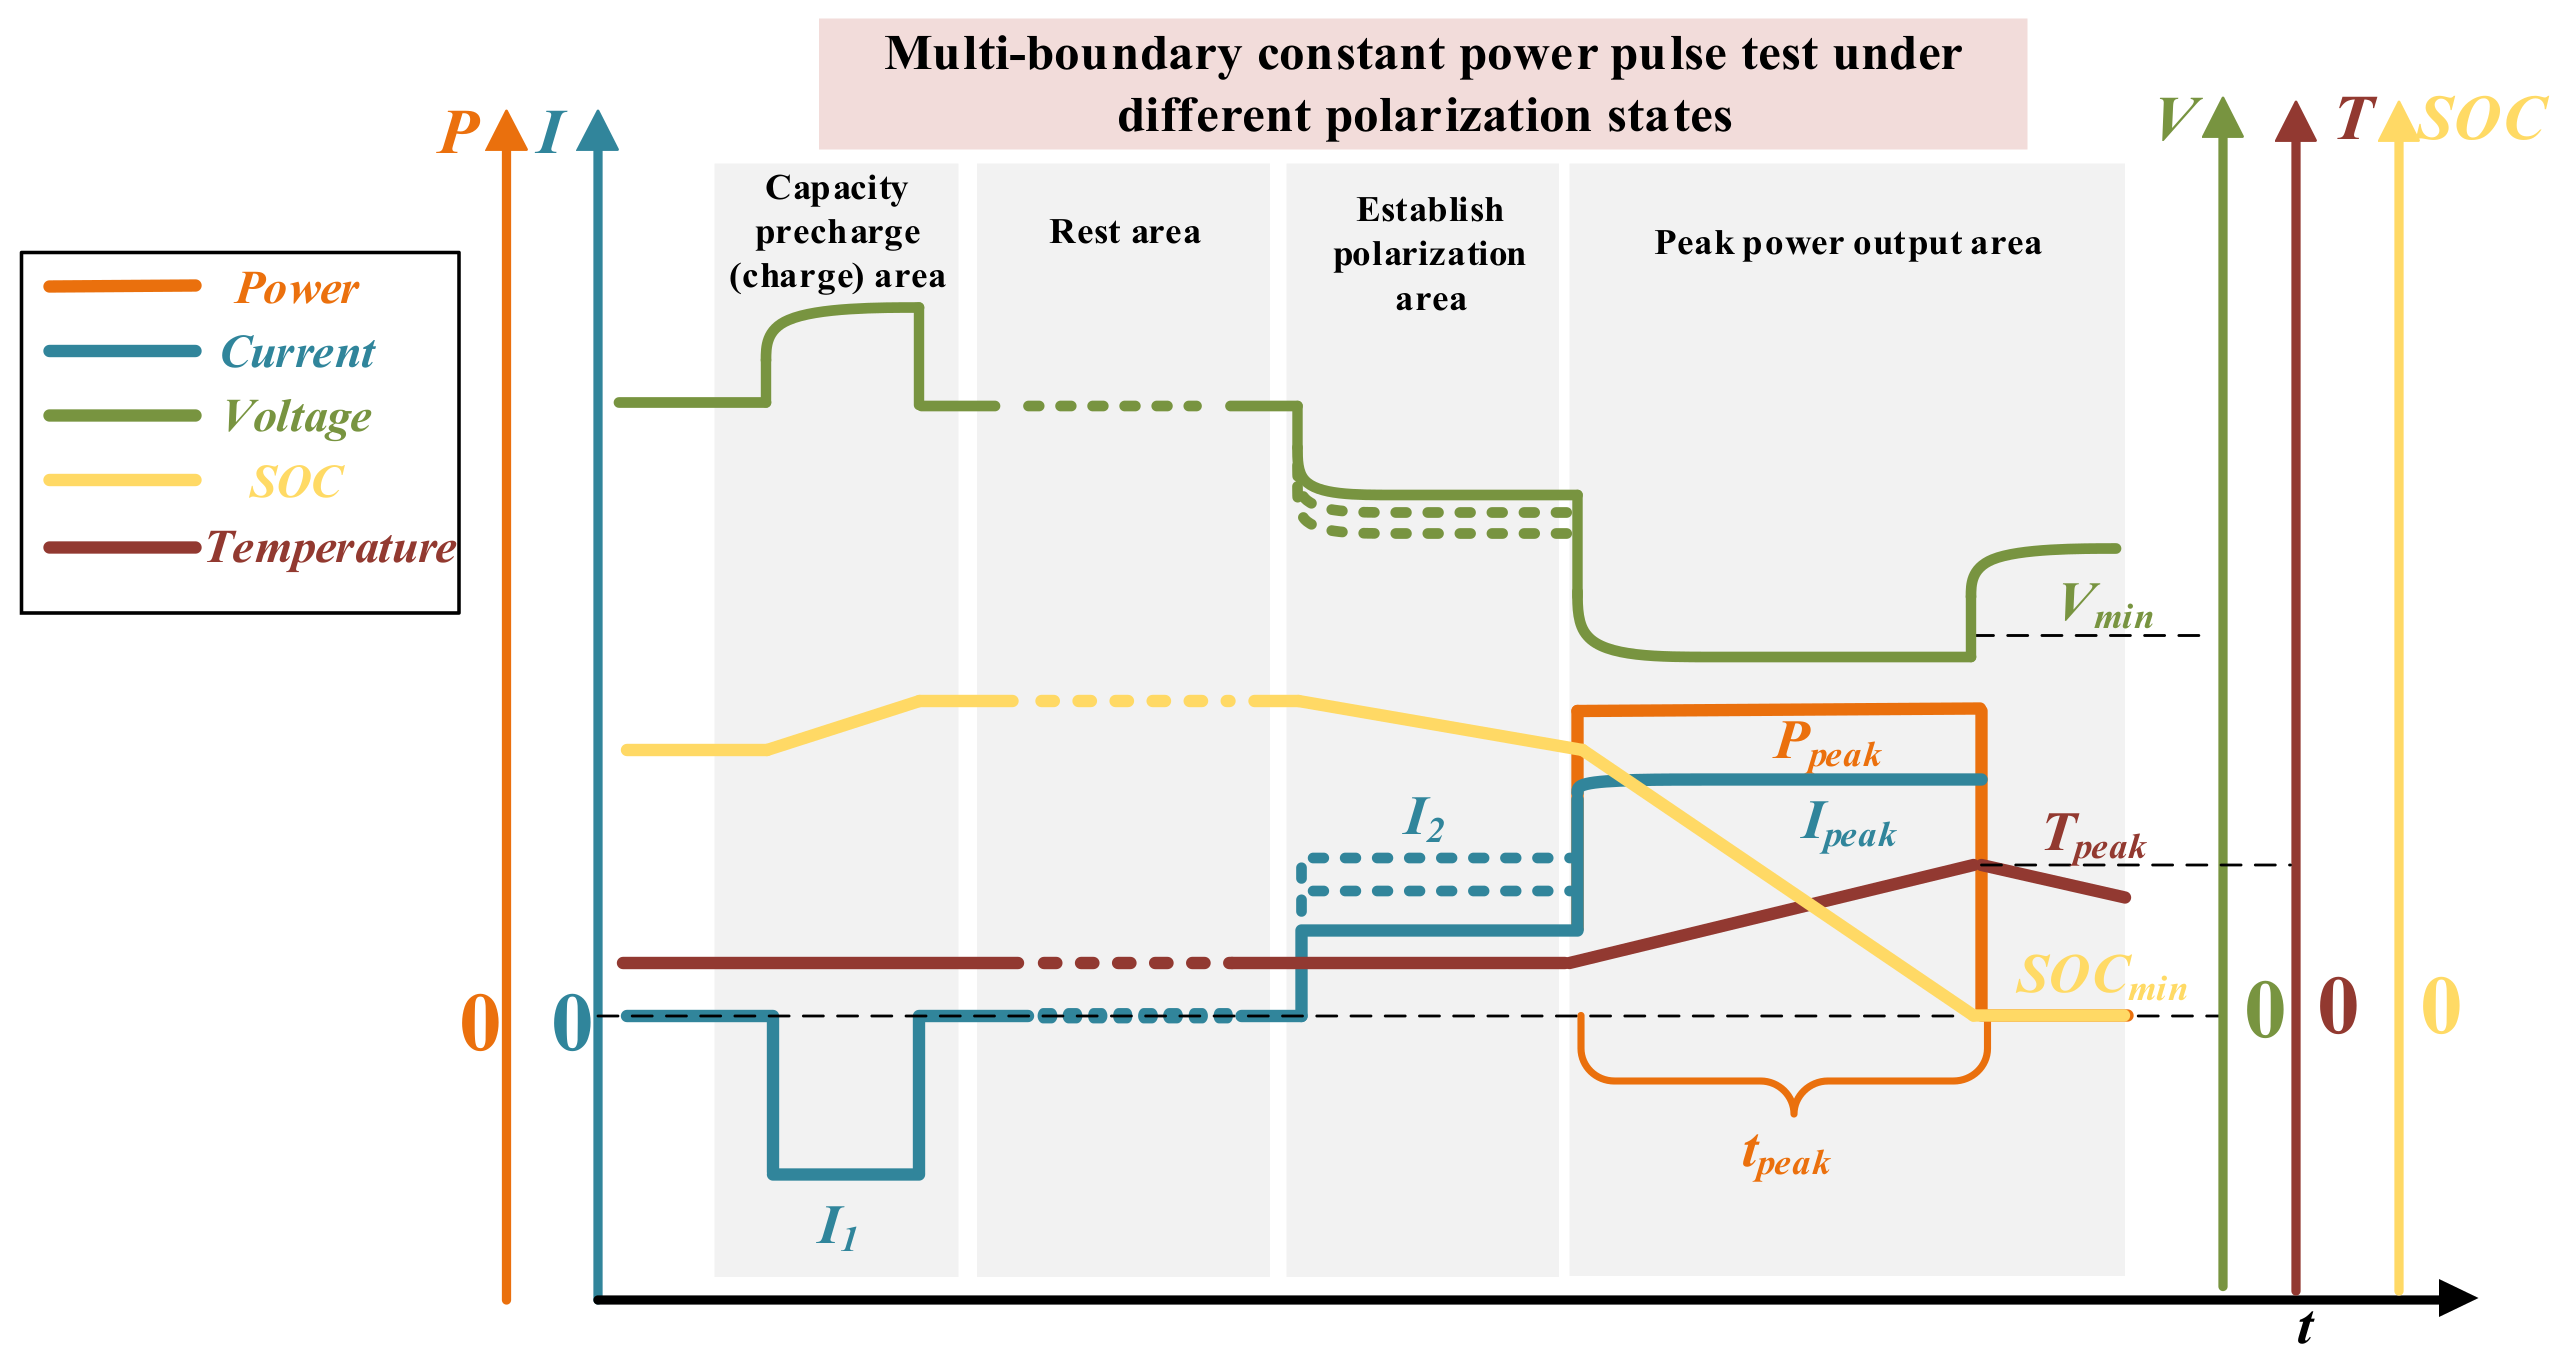
The SOP estimation based on the feature chart method is to establish a data table of the peak power with each influencing factor from the offline test results. This method can quickly obtain the SOP by looking up the table, and the calculation burden is low. According to the practical usage scenario of the battery pack, this paper takes the current, voltage, temperature, and SOC as the boundary of the peak power and considers the initial polarization state when conducting a constant power charge/discharge test. Considering the peak power test in the discharge direction, the multi-boundary peak power test conditions for different polarization states are shown in Figure 8. After the initial polarization establishment phase, the peak power output is performed until the output meets one of the following conditions: Ipeak > Ilimit; Vmin < Vlimit; Tpeak > Tlimit; SOCmin < SOClimit. The peak power output time tpeak is recorded. After changing the battery’s state conditions (the SOC and temperature), the relationship between Ppeak and tpeak can be established after several peak power tests with different amplitudes. In addition, constant power pulse test experiments should be repeated to avoid random errors. The multi-boundary SOP estimation method based on the look-up table enables offline testing according to the definition. The test considers the different initial polarization states, indicating that the estimation result is more applicable in a real operation.
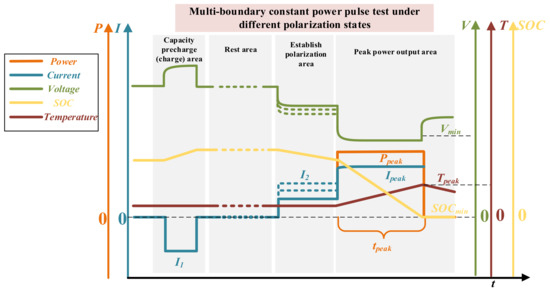
Figure 8.
Constant power pulse test under different polarization conditions.
- (2)
- SOP estimation based on battery model
In order to solve the problems of the needed extensive tests, the randomness of the testing results, and the poor adaptability in the SOP estimation method based on the feature chart method, the SOP estimation method based on the battery pack model is used. The model estimation method is to estimate the peak power of the battery based on the equivalent circuit model, considering the current, voltage, and temperature limitations. According to the second-order RC equivalent circuit model, the relationship between the peak current, terminal voltage, and open circuit voltage can be obtained with Equation (10), where the discharging power is considered. Moreover, in Equation (10), the parameters such as OCV, Ro, Rp, and Cp will change with the SOC and temperature.
The OCV will have noticeable differences with the changes in the SOC at the SOCs high and low ends. When some functions to fit the relationship between the OCV and SOC are used, the relational expression is Equation (11). SOC0 is the SOC value at the moment before discharging.
After Taylor expands Equation (11) and ignores the remainder, the peak current in the discharge direction can be calculated by Equation (12). OCV0 is the OCV initial value before discharging.
Correspondingly, the peak current of the battery pack connected in series is the minimum of the peak current in the battery pack due to the short-board effect, expressed as:
According to Equation (13), the voltage expression at the end of the battery pack discharging can be obtained as:
Finally, we can calculate the Ppeak of the battery pack using Equation (15). According to this method, the peak power of the battery pack in the charging direction can be obtained. We have demonstrated the SOP estimation accuracy of the battery cell based on the equivalent circuit model considering the polarization in [28], and the result meets the test requirements for the BMS.
4.2.2. SOP Estimation Accuracy Test Method
The main purpose of the SOP estimation accuracy test for the BMS is to test whether the BMS can ensure that the power battery can meet the power output in different scenarios, which is the key to the efficiency and safety of the battery pack’s operation. This paper proposes an SOP test condition with a high operability and reliability and mainly focuses on evaluating the SOP estimation errors caused by the SOCs error and dynamic battery characteristics. The specific SOP test conditions are as follows:
- Adjust the virtual battery so that the SOC = SOCtest and the battery temperature is set to Ttest.
- Adjust the SOC reported by the BMS to SOCtest + 5%.
- Set the initial polarization size (the discharge pulse with the amplitude of I1 and the time of 5 s) and calculate the peak power reference value Ppeak with a duration of t1 s under this polarization condition.
- Output the voltage and current signals of the polarization establishment phase and the peak power output phase from the BMSs test system.
- Record the peak power reported by the BMS during the test (if the peak current is reported, the peak power is calculated based on the minimum value of the voltage during the discharge process).
- Modify the size of I1 and repeat steps 1~5.
- Modify t1 size and repeat steps 1~6.
- Modify the SOCtest of the virtual battery, repeat steps 1~7.
- Modify the temperature Ttest of the virtual battery, repeat steps 1~8.
In the above test conditions, the peak power estimation under different dynamic characteristics is achieved by adjusting the amplitude of I1. The peak power estimation ability is evaluated under different time scales by adjusting the length of t1. The evaluation of the SOPs estimation errors due to the SOC, temperature, and model’s parameters is achieved by adjusting the SOCtest and Ttest.
4.2.3. Evaluation Method of SOP Estimation Accuracy
It is necessary to evaluate the SOPs estimation accuracy and the capability of SOP switching at different time scales for the BMS. Combined with the proposed test conditions of the SOPs estimation accuracy, this paper simulates the different output scenarios of the battery pack by applying a different multiplier current (power) excitation and then evaluates the SOPs estimation accuracy according to the results of the different stages. The details are as follows.
Stage 1: The BMS performs a long timescale SOP estimation during the small multiplier current establishment polarization phase;
Stage 2: The BMS performs a short timescale SOP estimation in the case of a high-power discharge.
The specific SOP estimation accuracy calculation formula is shown in Equation (16). The SOPREF under different conditions is obtained based on the multi-boundary SOP reference value acquisition method, the SOP estimation error is calculated at the end moments of the different stages, respectively, and the SOPs switching time between the different time scales is calculated.
5. Results
5.1. Battery Packs Model Validation
5.1.1. Battery Pack Parameters Generation Result
To reconfigure the actual battery pack, we first tested an electric vehicle power pack that had been operating for some time. The battery pack consisted of 95 lithium iron phosphate batteries connected in series with a rated capacity of 48 Ah. By conducting the battery pack capacity test, battery cell capacity test, and battery pack internal resistance characteristics and OCV tests (See Appendix A), we obtained several battery parameters, including the battery cell’s capacity (Capacity), SOC operation interval (SOCend), temperature rise (Tempdiff), heat dissipation characterization coefficient (H), ohmic internal resistance (Ro SOCx) at different SOC points, polarization resistance (Rp SOCx) at different SOC points, and time constant (τ SOCx) at different SOC points. The SOC range is selected from 95 to 20% with a 5% SOC interval, and the distributions of the battery model’s parameters can be obtained in 15 different SOC points. The heat generation rate of the battery is shown in Equation (17). According to Equation (17), the battery temperature can be calculated with Equation (18) in the rest state. The H of an individual can be determined by fitting the data to Equation (18) using the least squares method. The temperature difference between the before and after constant-current charging is chosen as Tempdiff. At last, a set of 95 × 49 two-dimensional data matrices can be obtained, i.e., there are 95 battery cells and 49 battery parameters for an individual. The inconsistency parameter numbers are shown in Table A1 of Appendix A.
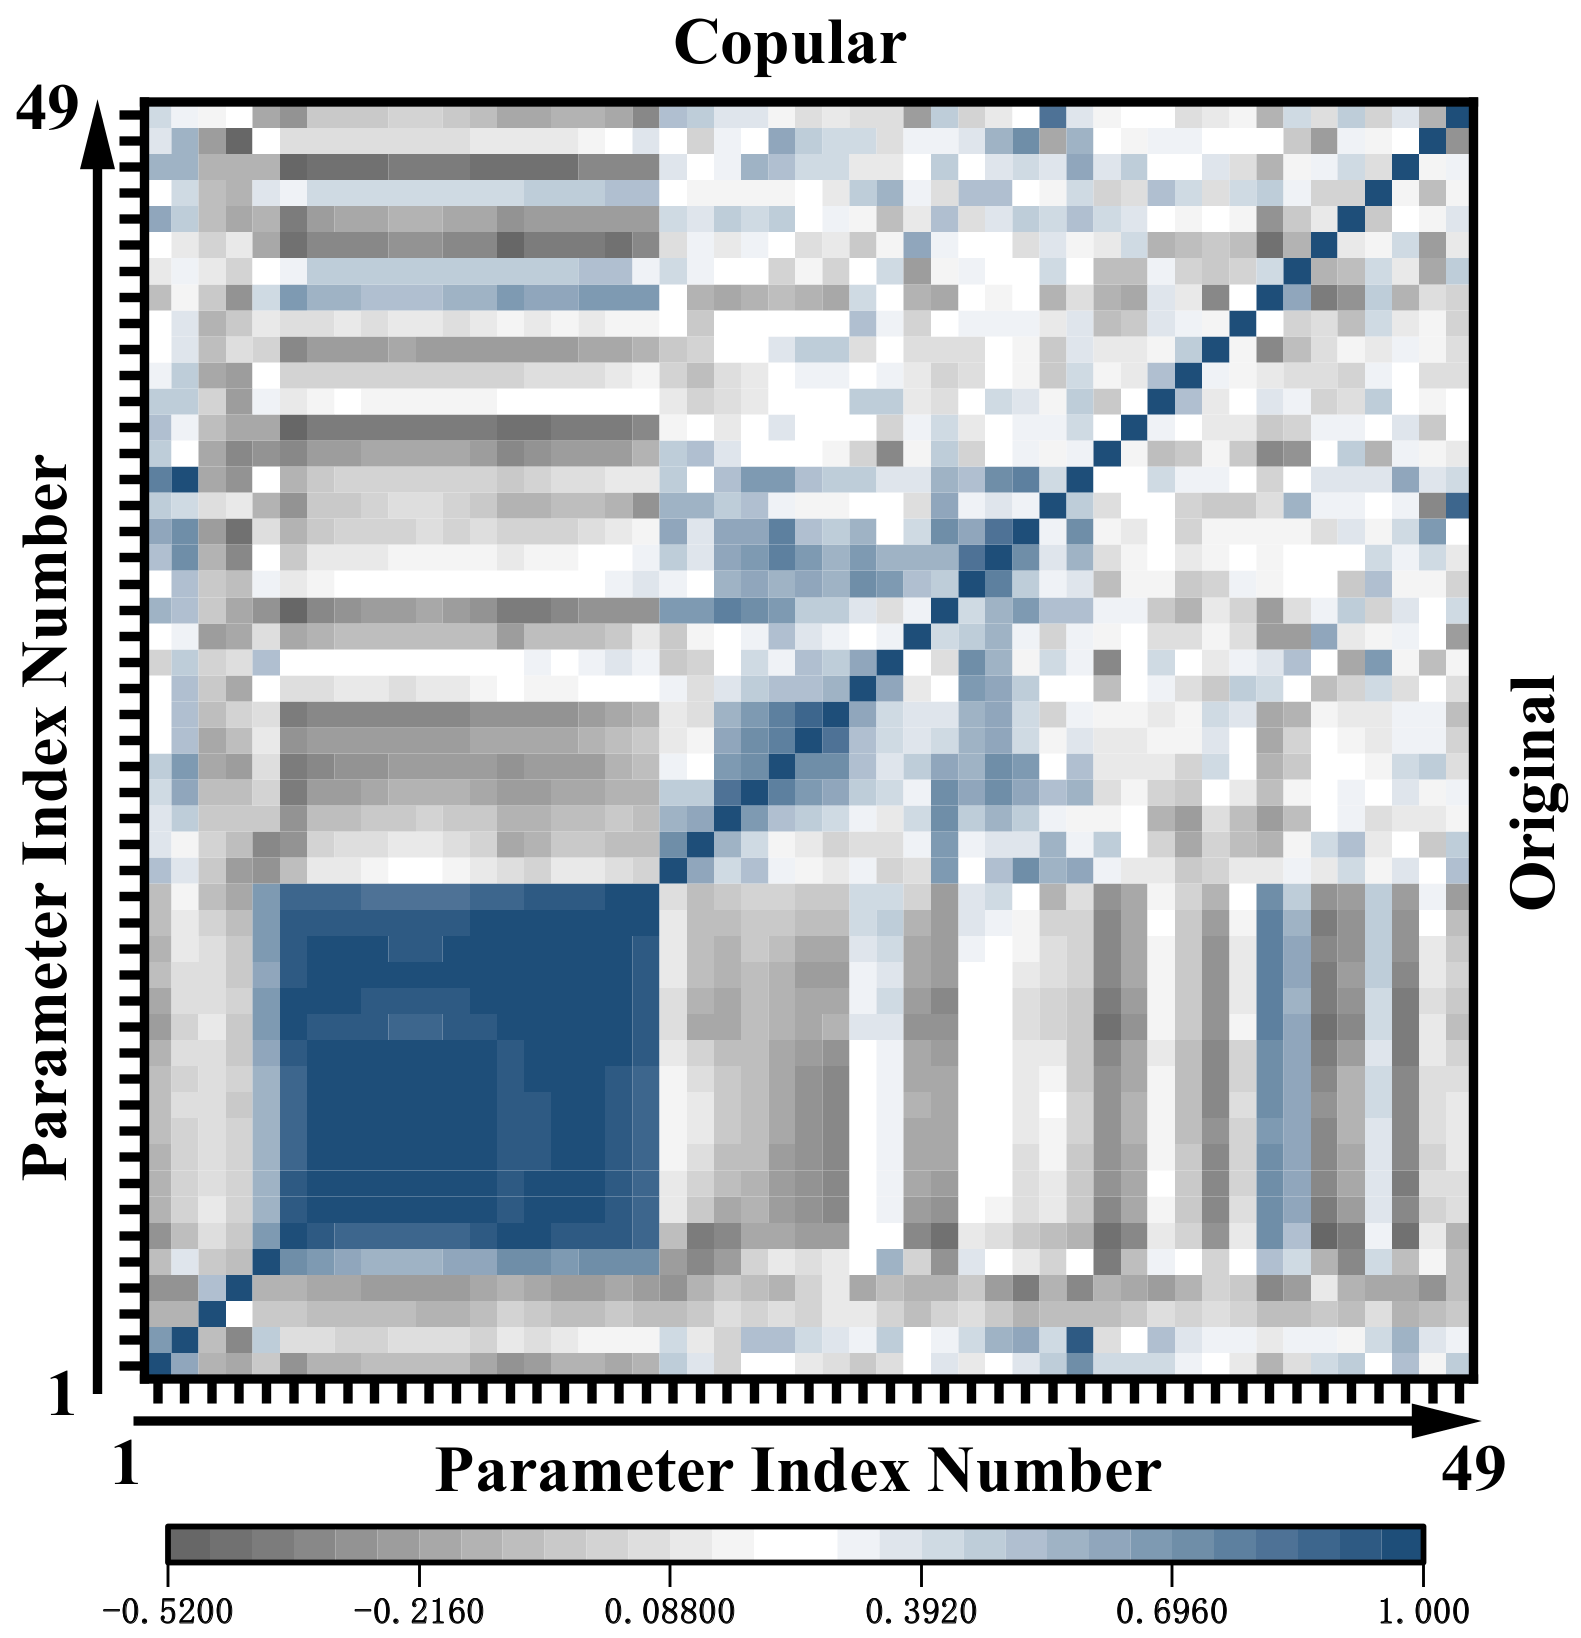
In order to assess the correlation between the parameters, Pearson correlation coefficients were calculated separately for the original data and the newly generated parameters obtained by the Copula-based sampling method, as shown in Figure 9. The upper triangle is the correlation of the generated parameters, and the lower triangle is that of the original parameters. It is easy to see a strong correlation between the specific parameters, and the battery pack’s parameters obtained by the Copula-based method show close correlation characteristics with the original data.

Figure 9.
Correlation analysis on the parameter distribution of the newly generated data and the original data.
5.1.2. Battery Pack Model Validation
To illustrate the feasibility of the battery pack modeling method shown in Figure 2, a Highway Fuel Economy Test (HWFET) condition was used to validate it. Figure 10 shows the battery pack model’s terminal voltage and average temperature curves. Figure 10a represents that the maximum error of the terminal voltage is 2.39%, and the Root Mean Square Error (RMSE) is 1.602 V. This paper uses the average temperature to describe the thermal behavior of a virtual battery pack model. Figure 10b shows that the maximum error of the average temperature is 0.22%, and the RMSE is 0.039 degrees Celsius. The results show that the battery pack model obtained based on the proposed method can better simulate the voltage characteristics of the battery pack, so that it can meet the requirements of virtual battery-based BMS testing.
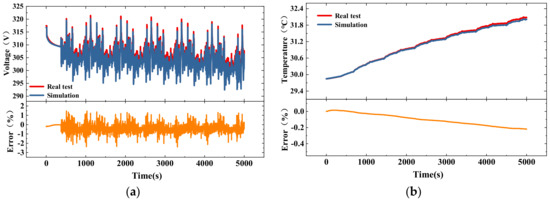
Figure 10.
Simulation results of virtual battery pack model under HWFET profile: (a) terminal voltage; (b) average temperature.
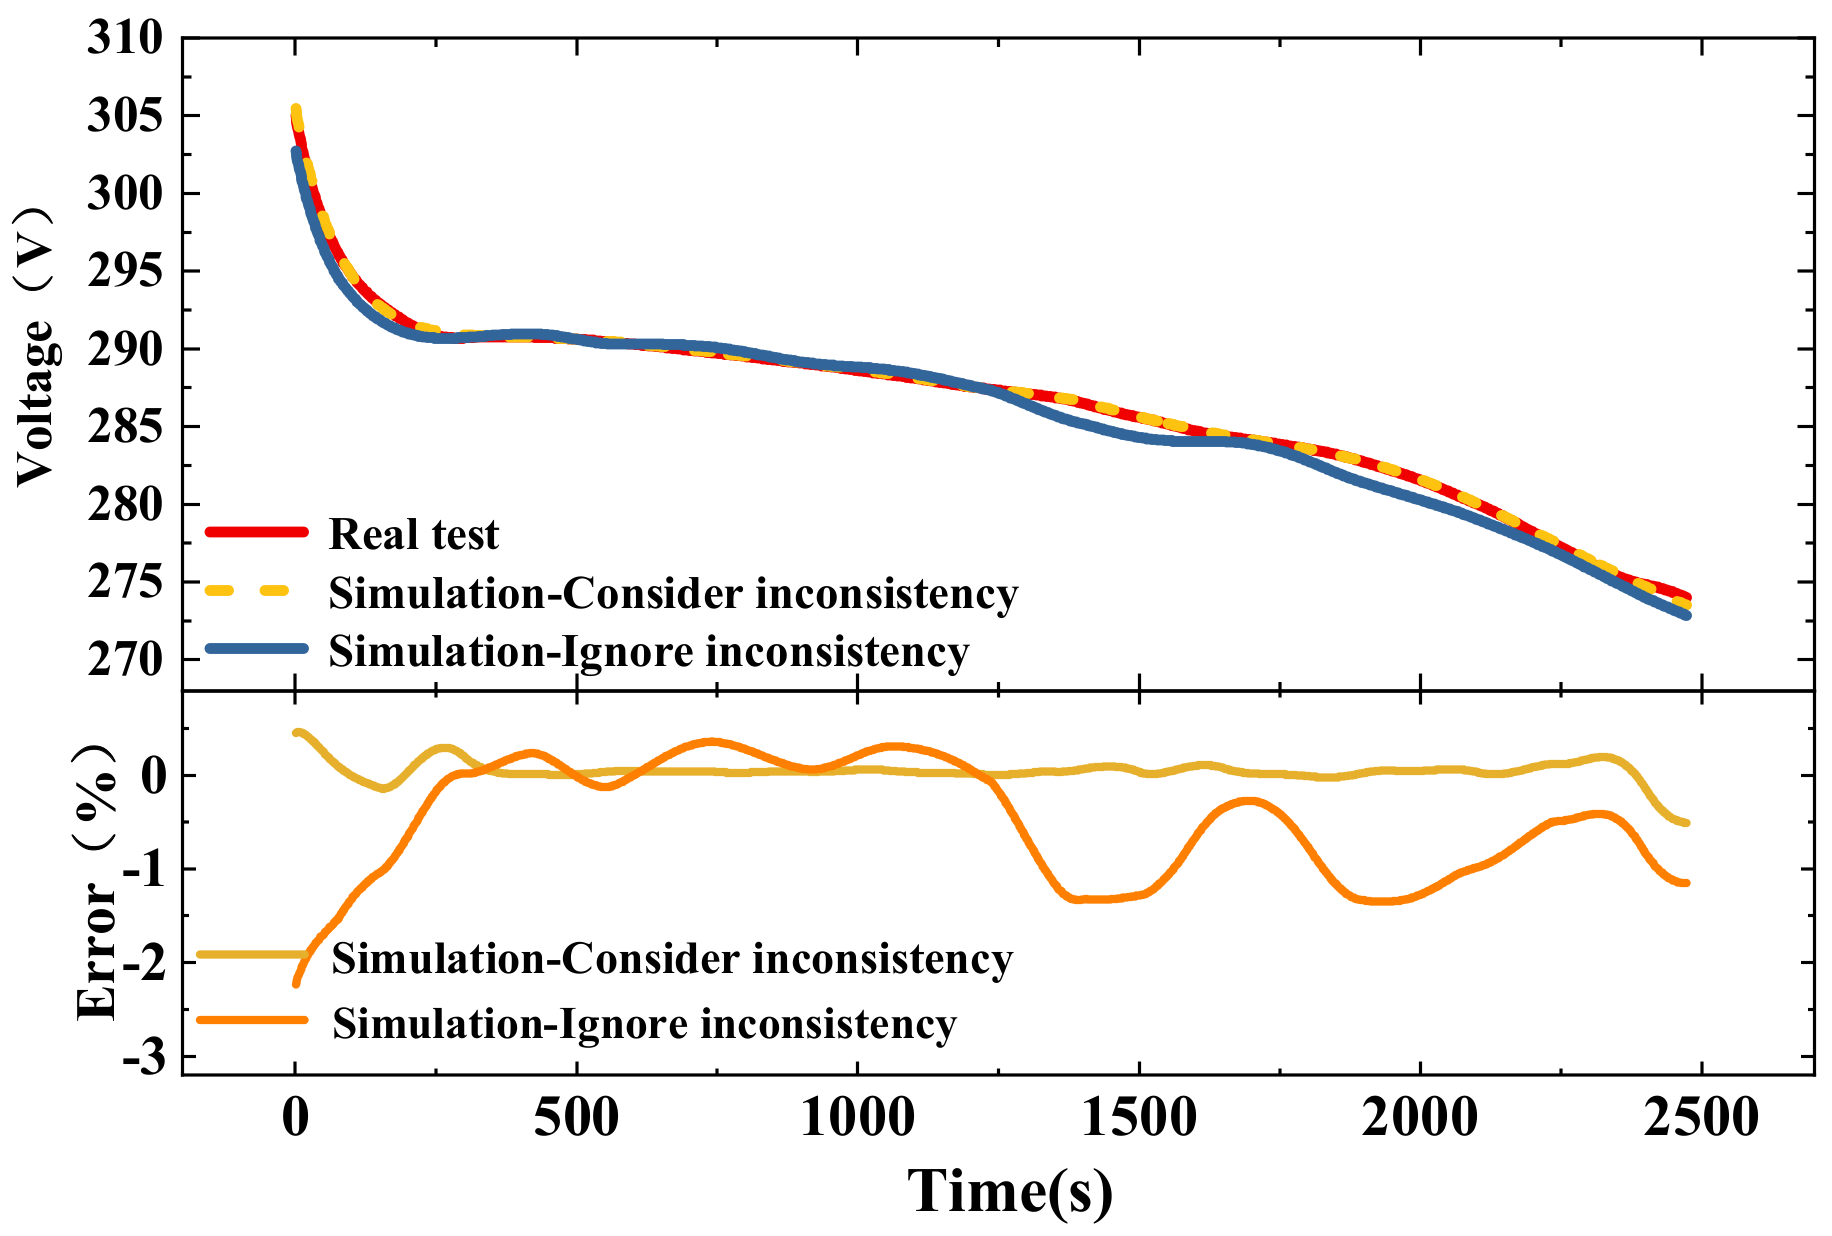
The constant current discharge experiment is carried out on the battery pack to demonstrate the necessity of considering inconsistency. The unique individual with the least total internal resistance is used as the primary cell of the battery pack model that ignores inconsistency. In Figure 11, the simulation result ignoring the inconsistency compared to considering the inconsistency increases the maximum error by 2.69 V. The energy utilization efficiency (EUE) of the actual battery pack is calculated to be 67.43%, while the EUEs considering inconsistency and ignoring consistency are 67.44% and 68.57%, respectively. The EUE is calculated as shown in Equation (19). Therefore, considering the inconsistency of the battery pack is closer to reality, and it has a lower EUE than ignoring the inconsistency.

Figure 11.
Constant current discharge comparison considering parameter inconsistency and ignoring parameter inconsistency.
5.2. BMS SOC Estimation Accuracy Evaluation
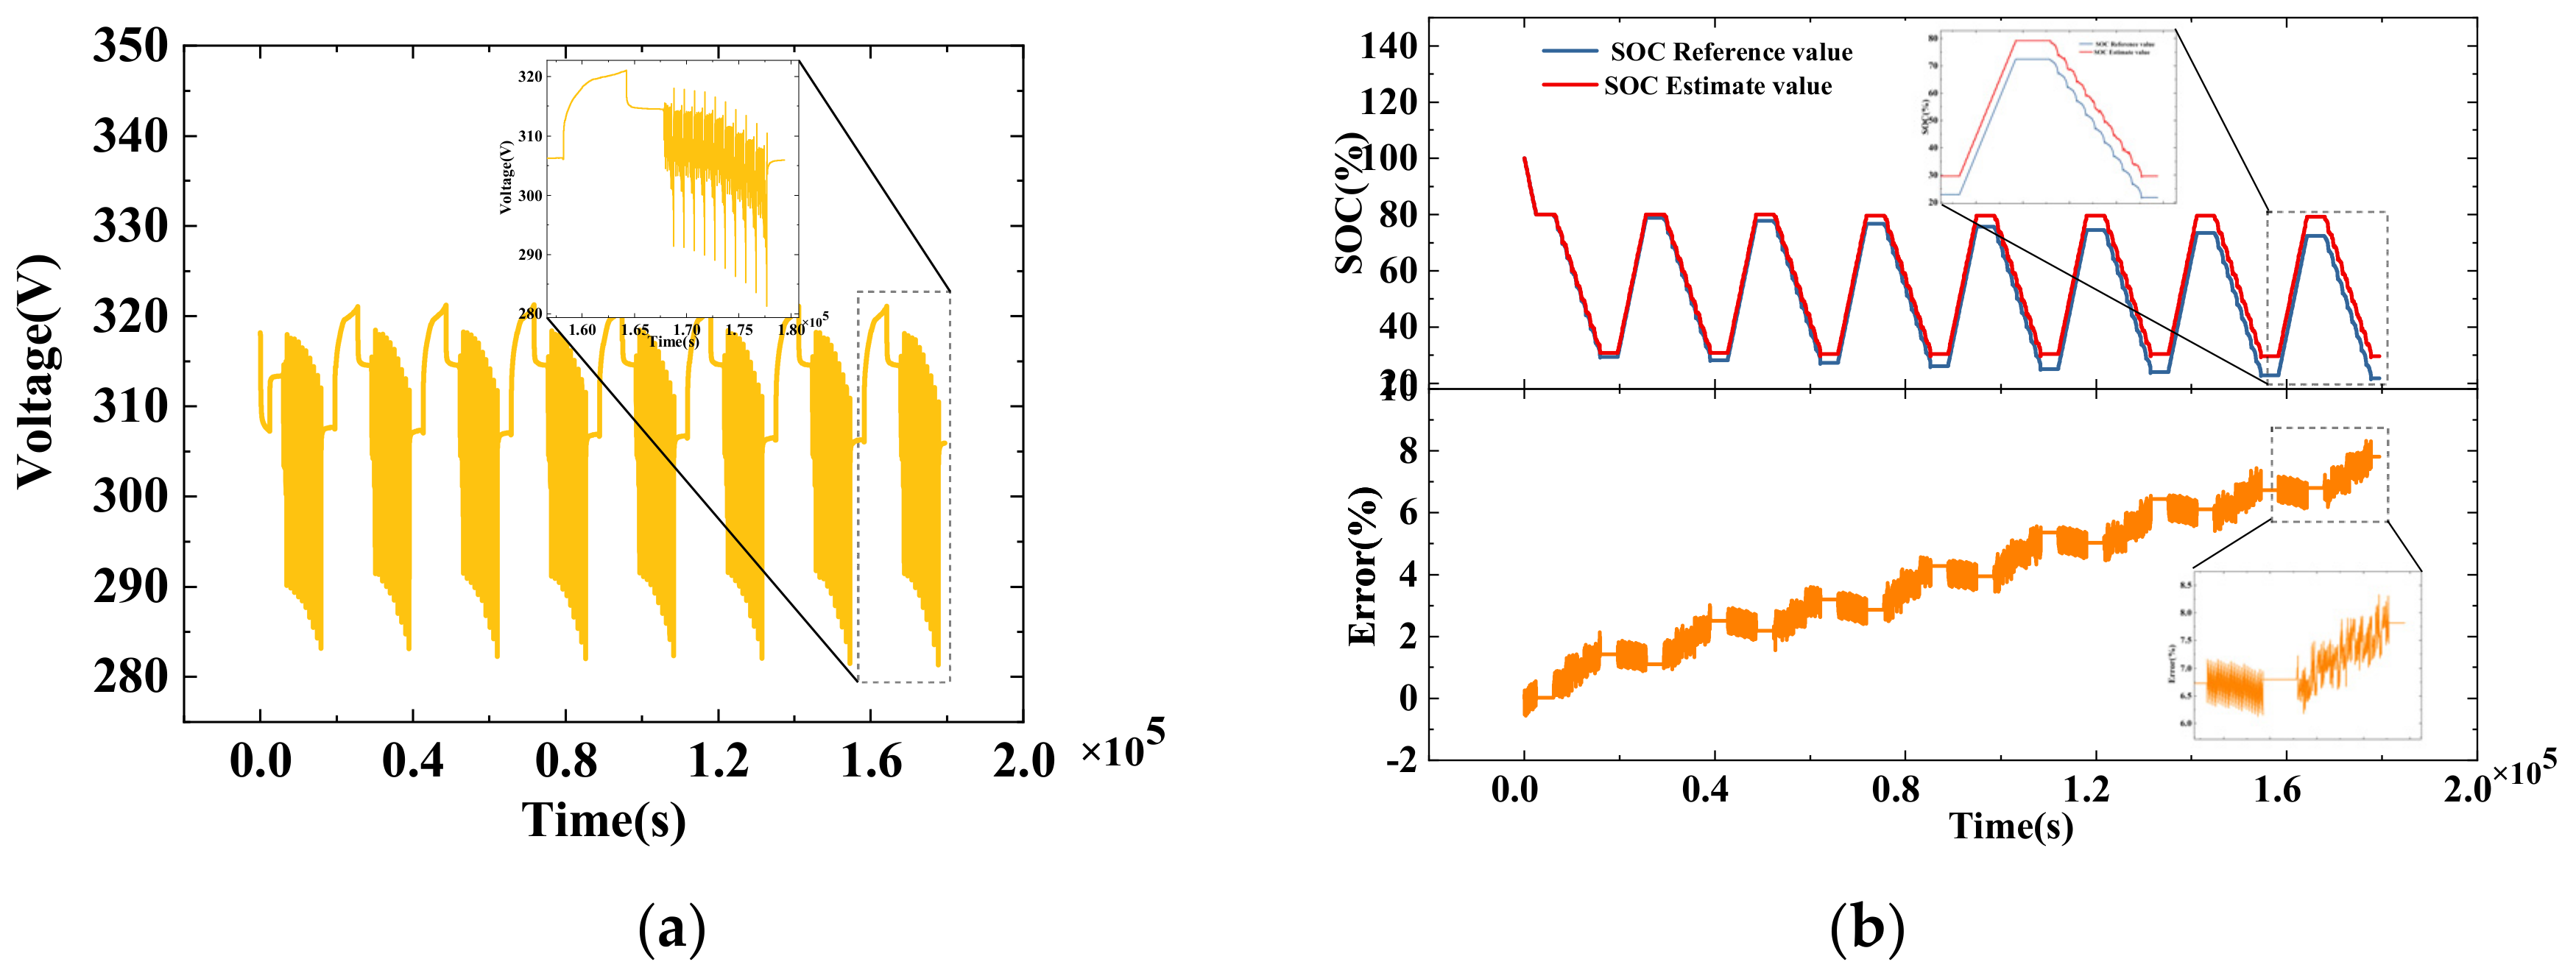
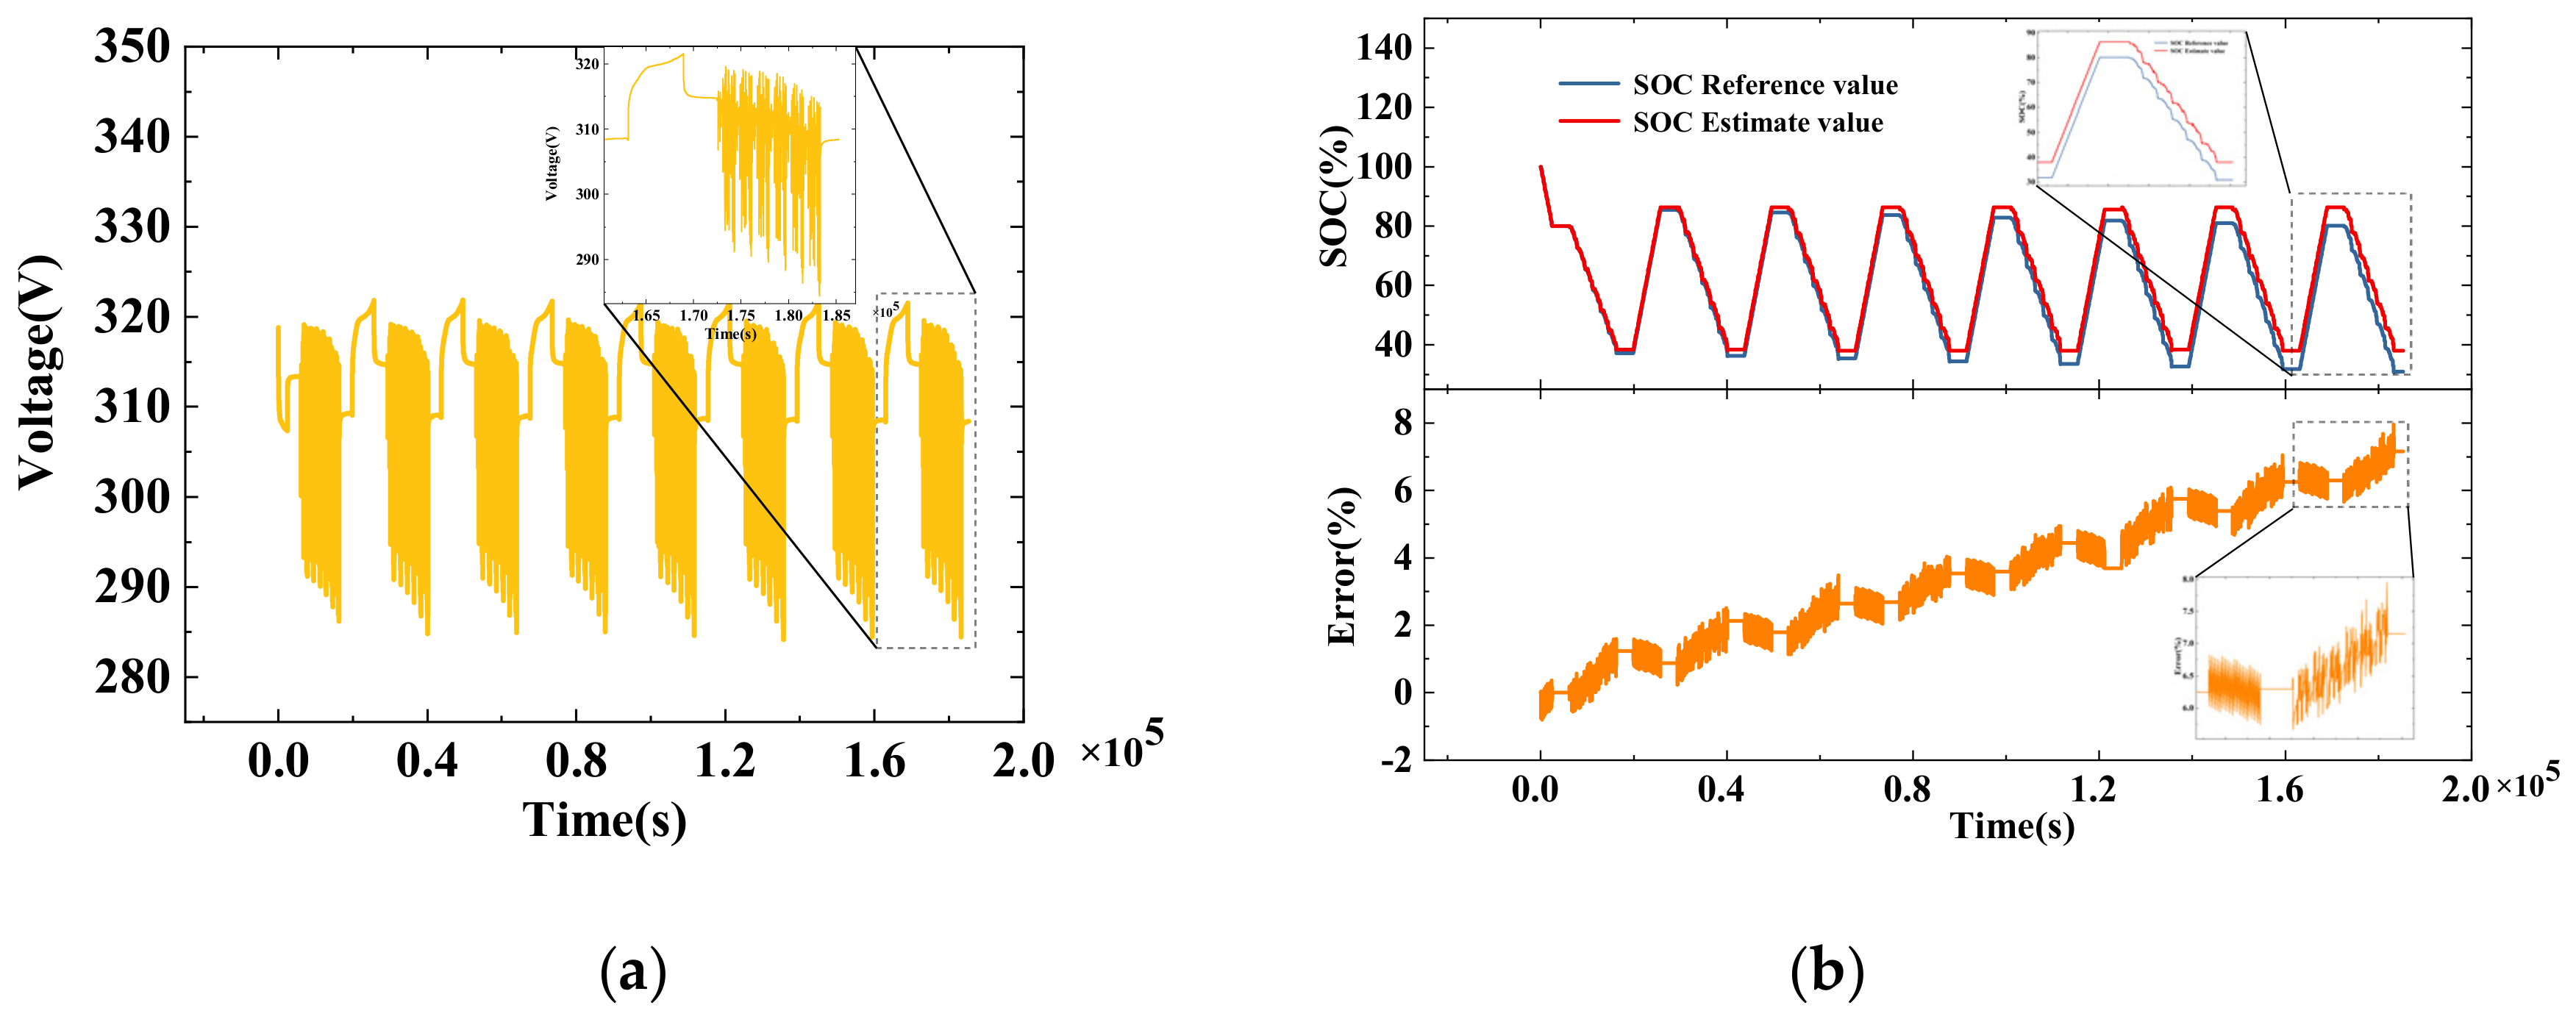
In this paper, the New European Driving Cycle (NEDC) and China light-duty vehicle test cycle (CLTC) discharge tests are conducted using the actual battery pack according to the experimental procedure shown in Figure 6. The testing results are shown in Figure 12 and Figure 13. After eight cycles of discharge, the SOC estimation of the BMS shows the apparent deviation compared with the reference value. The deviation after a cyclic discharge with the NEDC profile reaches 7.815%, while the CLTC profile is 7.150%. The difference in the cumulative error of the SOC estimation between the two profiles is 0.665%, which means that the difference in the cumulative error of the SOC obtained under different test conditions is low. It is essential to mention that the SOC resolution of the BMS under test is 0.4%.
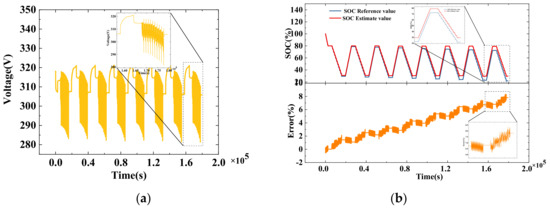
Figure 12.
Test results of NEDC profile: (a) battery voltage curve; (b) SOC curve.
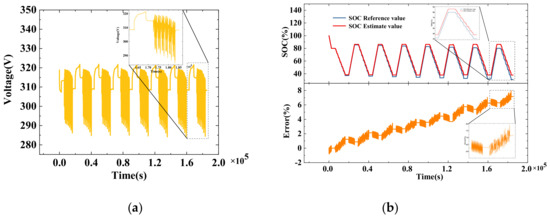
Figure 13.
Test results of CLTC profile: (a) battery voltage curve; (b) SOC curve.
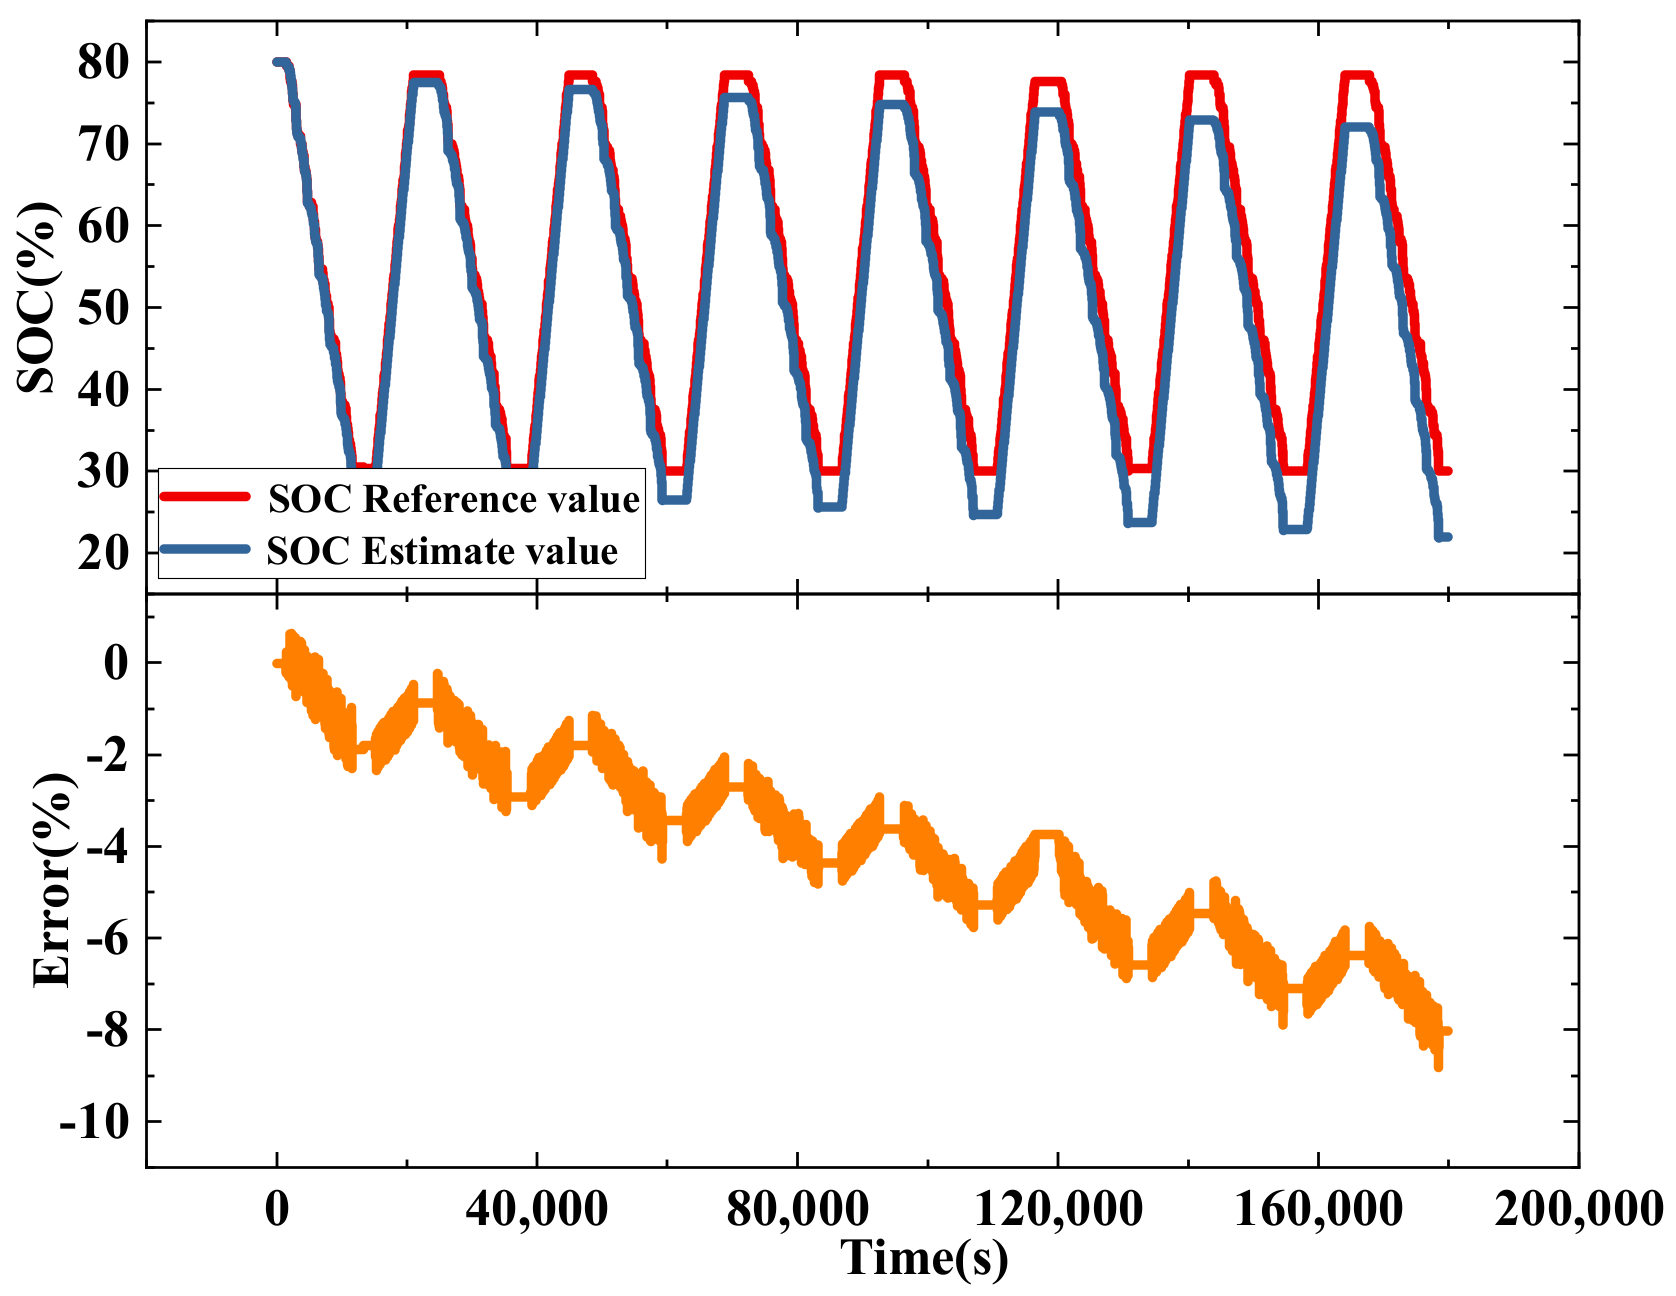
The SOC cumulative error of the BMS under different test conditions varies very little so that the BMS test can be conducted under the required current profile. The selected CLTC profile for the BMSs SOC cumulative error test based on the virtual battery and the test results are shown in Figure 14. The cumulative error of the BMS is −8.023% after eight CLTC cycles without triggering the SOC error correction.

Figure 14.
SOC cumulative error test results of BMS.
There is a number of factors that contribute to the above BMS estimation errors. The inadequate performance of the measurement system and interference from the external environment are possible reasons that lead to the current measurement errors, including systematic and random errors. Due to the battery’s temperature and aging, capacity errors will appear. If the sampling rate is too low and the current signal changes drastically, the BMS will lose some of the current signals, which causes some errors. In addition, the accuracy of the algorithm model in the BMS also impacts on the final result.
5.3. BMS SOP Estimation Accuracy Evaluation
5.3.1. SOP Reference Value Acquisition Based on Feature Chart Method
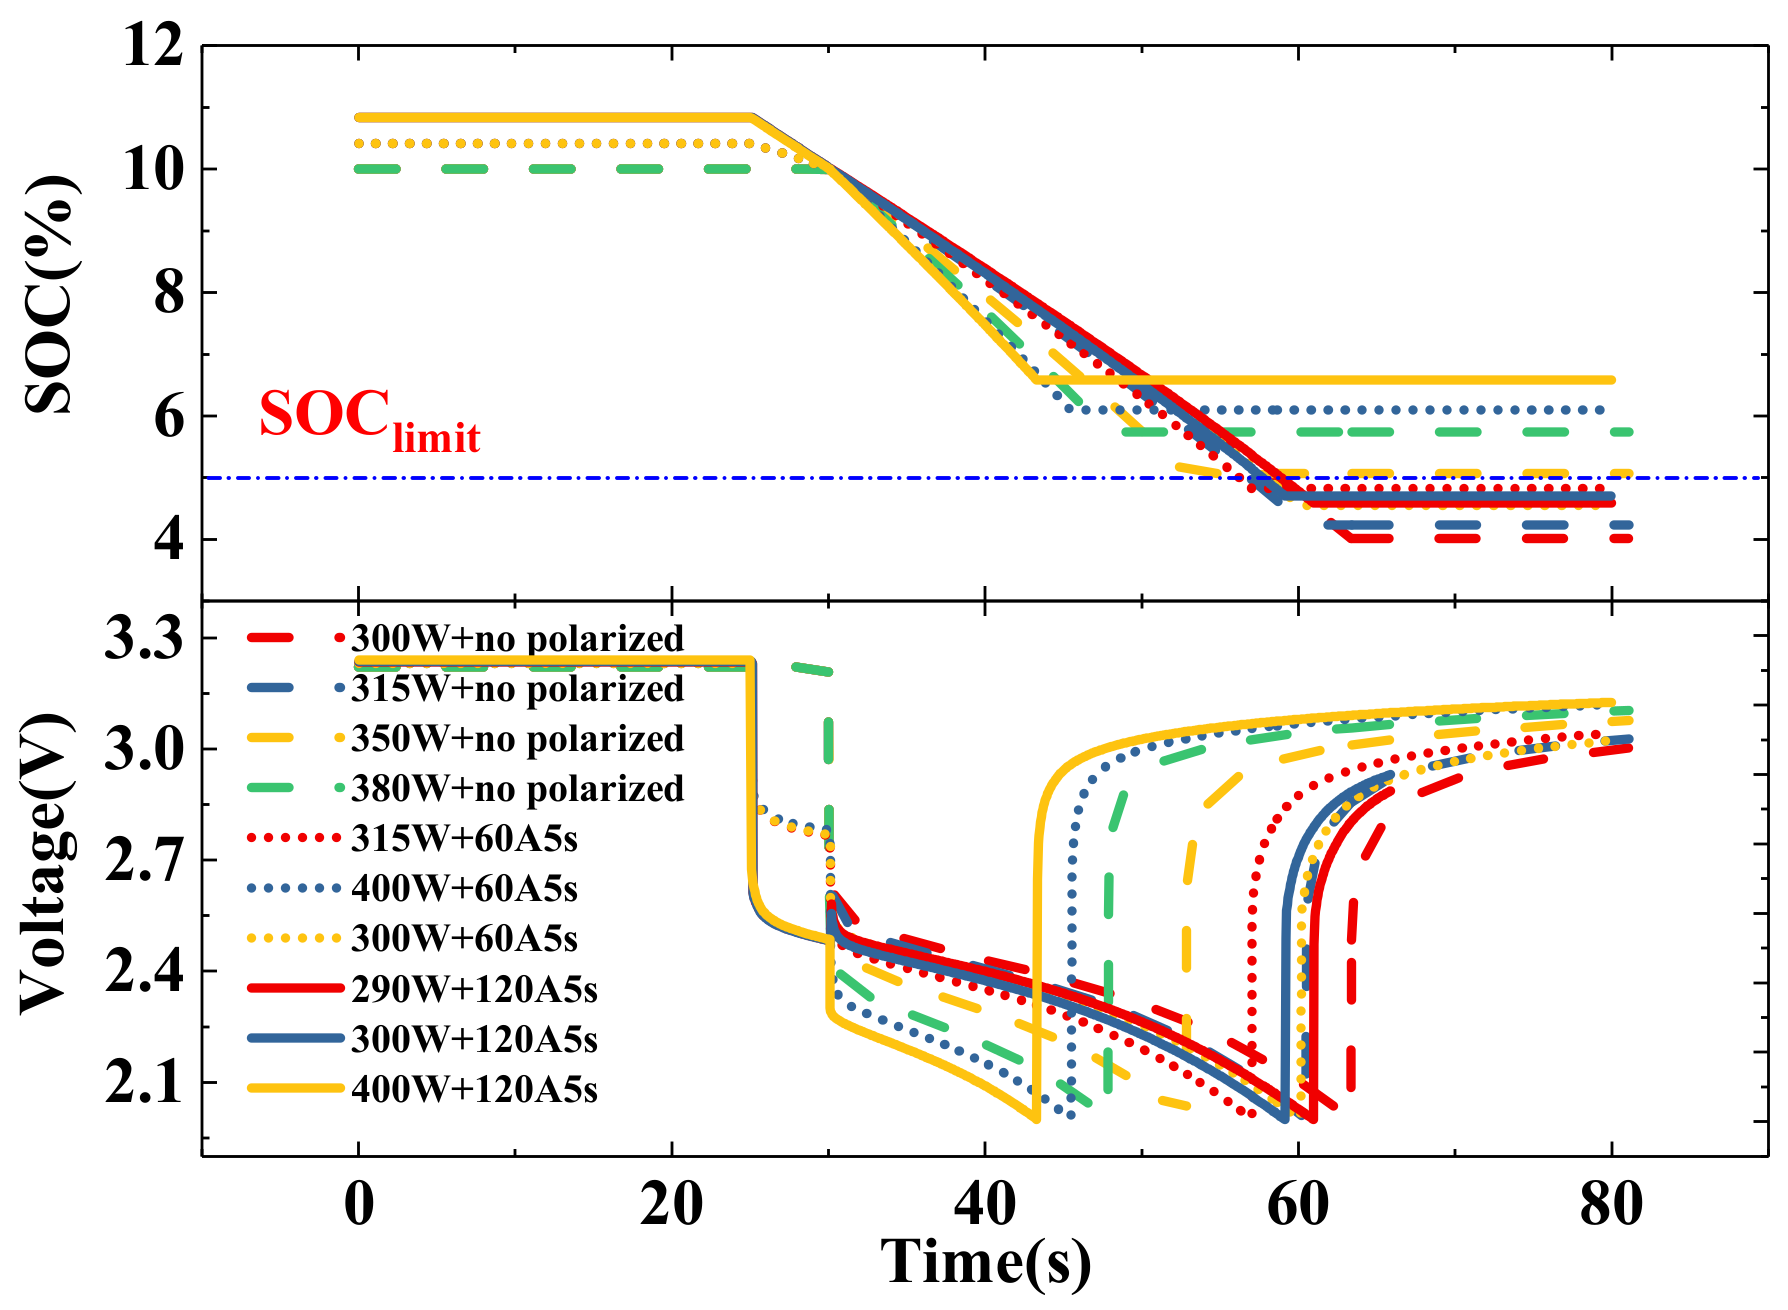
In this paper, constant power discharge pulse tests are conducted on LiFePO4 batteries at an SOC = 10% under different polarization states. Furthermore, the experimental test temperature is 0 degrees Celsius and 10 degrees Celsius. Since the experimental temperatures are well below the cut-off temperature of the battery, the temperature boundary is not considered. The current boundary is 200 A, the cut-off voltage is 2 V, and the SOC boundary is 5%. During the constant power pulse test, the output time of the constant power pulse must be judged based on the information from multiple boundaries.
Figure 15 shows the voltage and SOC variation curves of the constant power discharge considering the initial polarization. As can be seen from the figure, the voltage boundary is the primary limiting condition. However, when the power is small, there is still a risk of reaching the SOC boundary as the discharge time increases. The initial polarization state of the individual has a significant effect on the duration of the peak power. The preliminary observations show that the larger the initial polarization, the shorter the peak power duration.

Figure 15.
Voltage and SOC of batteries under constant power pulse test at 0 degrees Celsius considering different initial polarization.
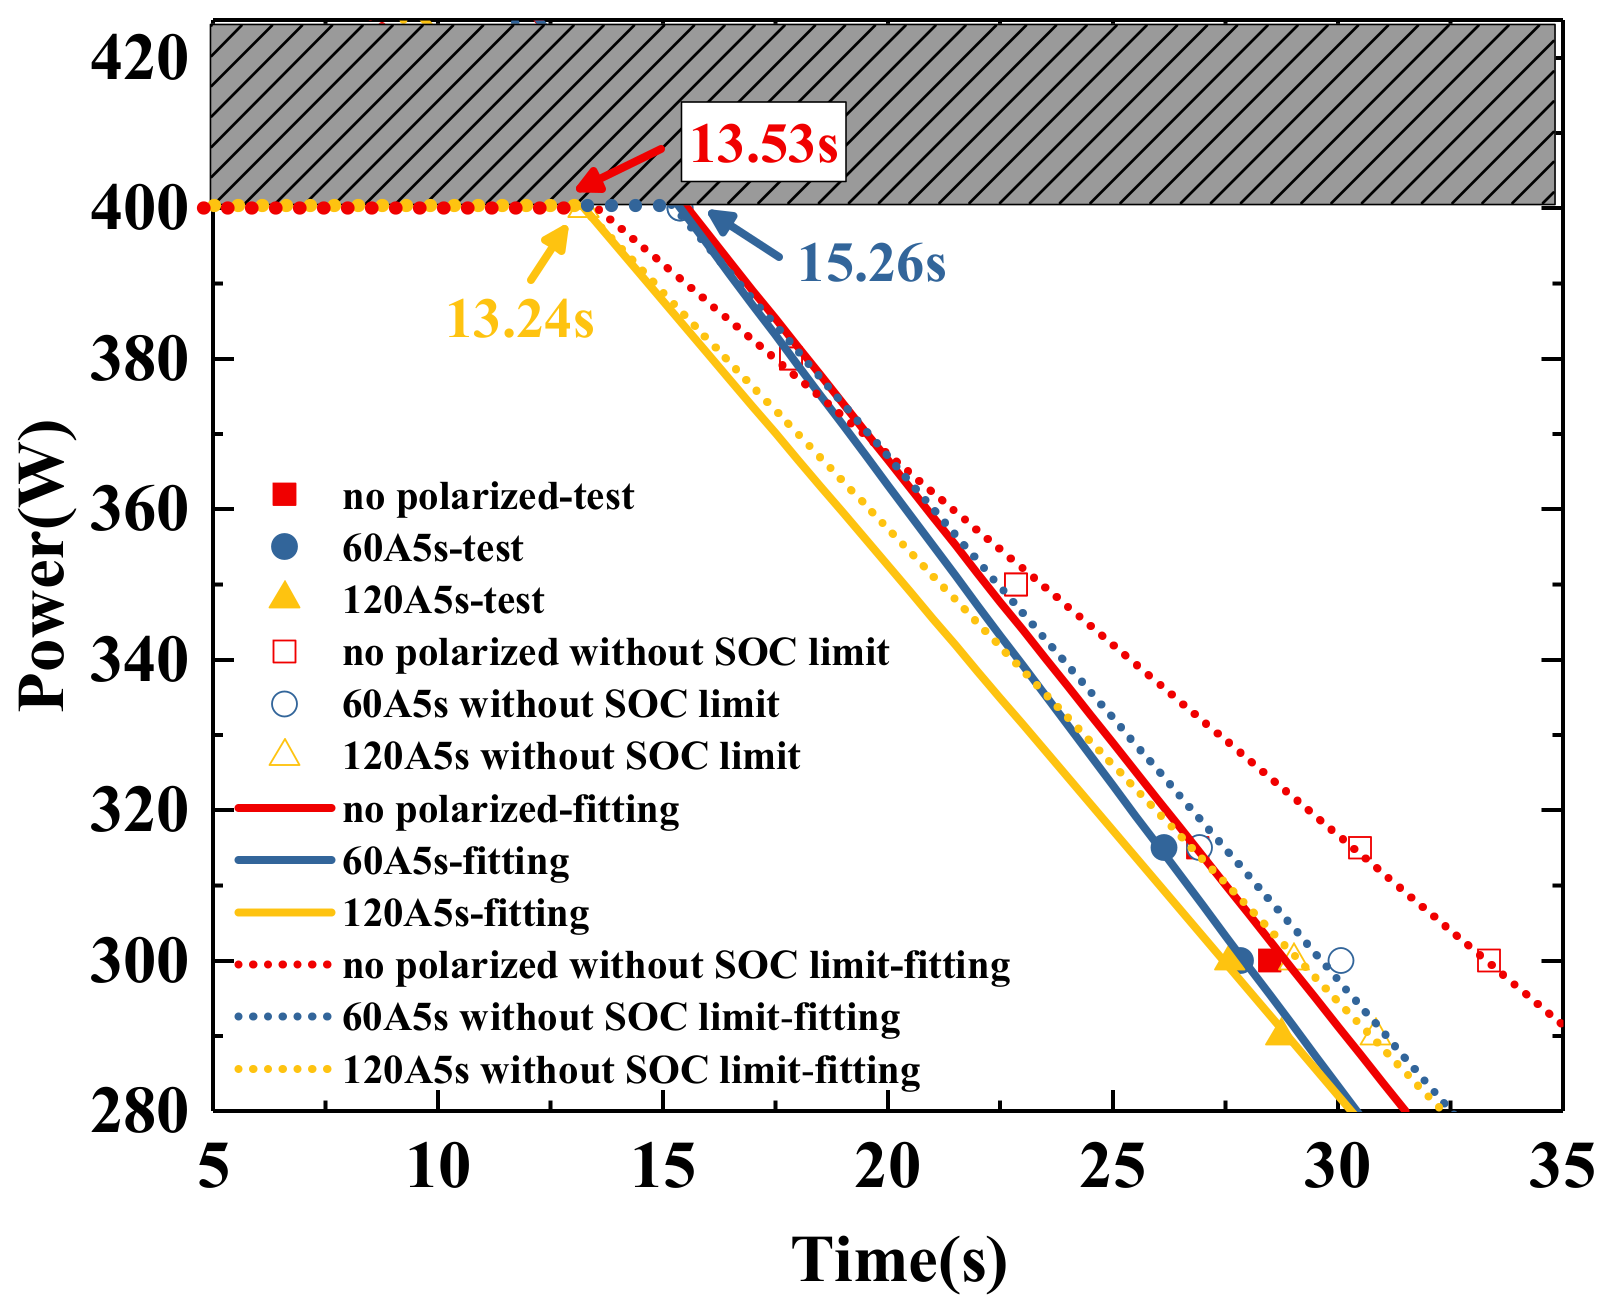
Figure 16 shows the peak power curves considering a different initial polarization at 10 degrees Celsius. We can see that the initial polarization state significantly affects the duration of the peak power and that the SOP estimation result is complicated when considering the effects of the current boundary and the SOC boundary. The proposed estimation method has considered the dynamic characteristics of the battery pack in a practical operation, and it is suitable for an SOP estimation in the range of the test conditions.

Figure 16.
Constant power pulse test results with initial polarization at 10 degrees Celsius.
5.3.2. BMS SOP Estimation Accuracy Test Results
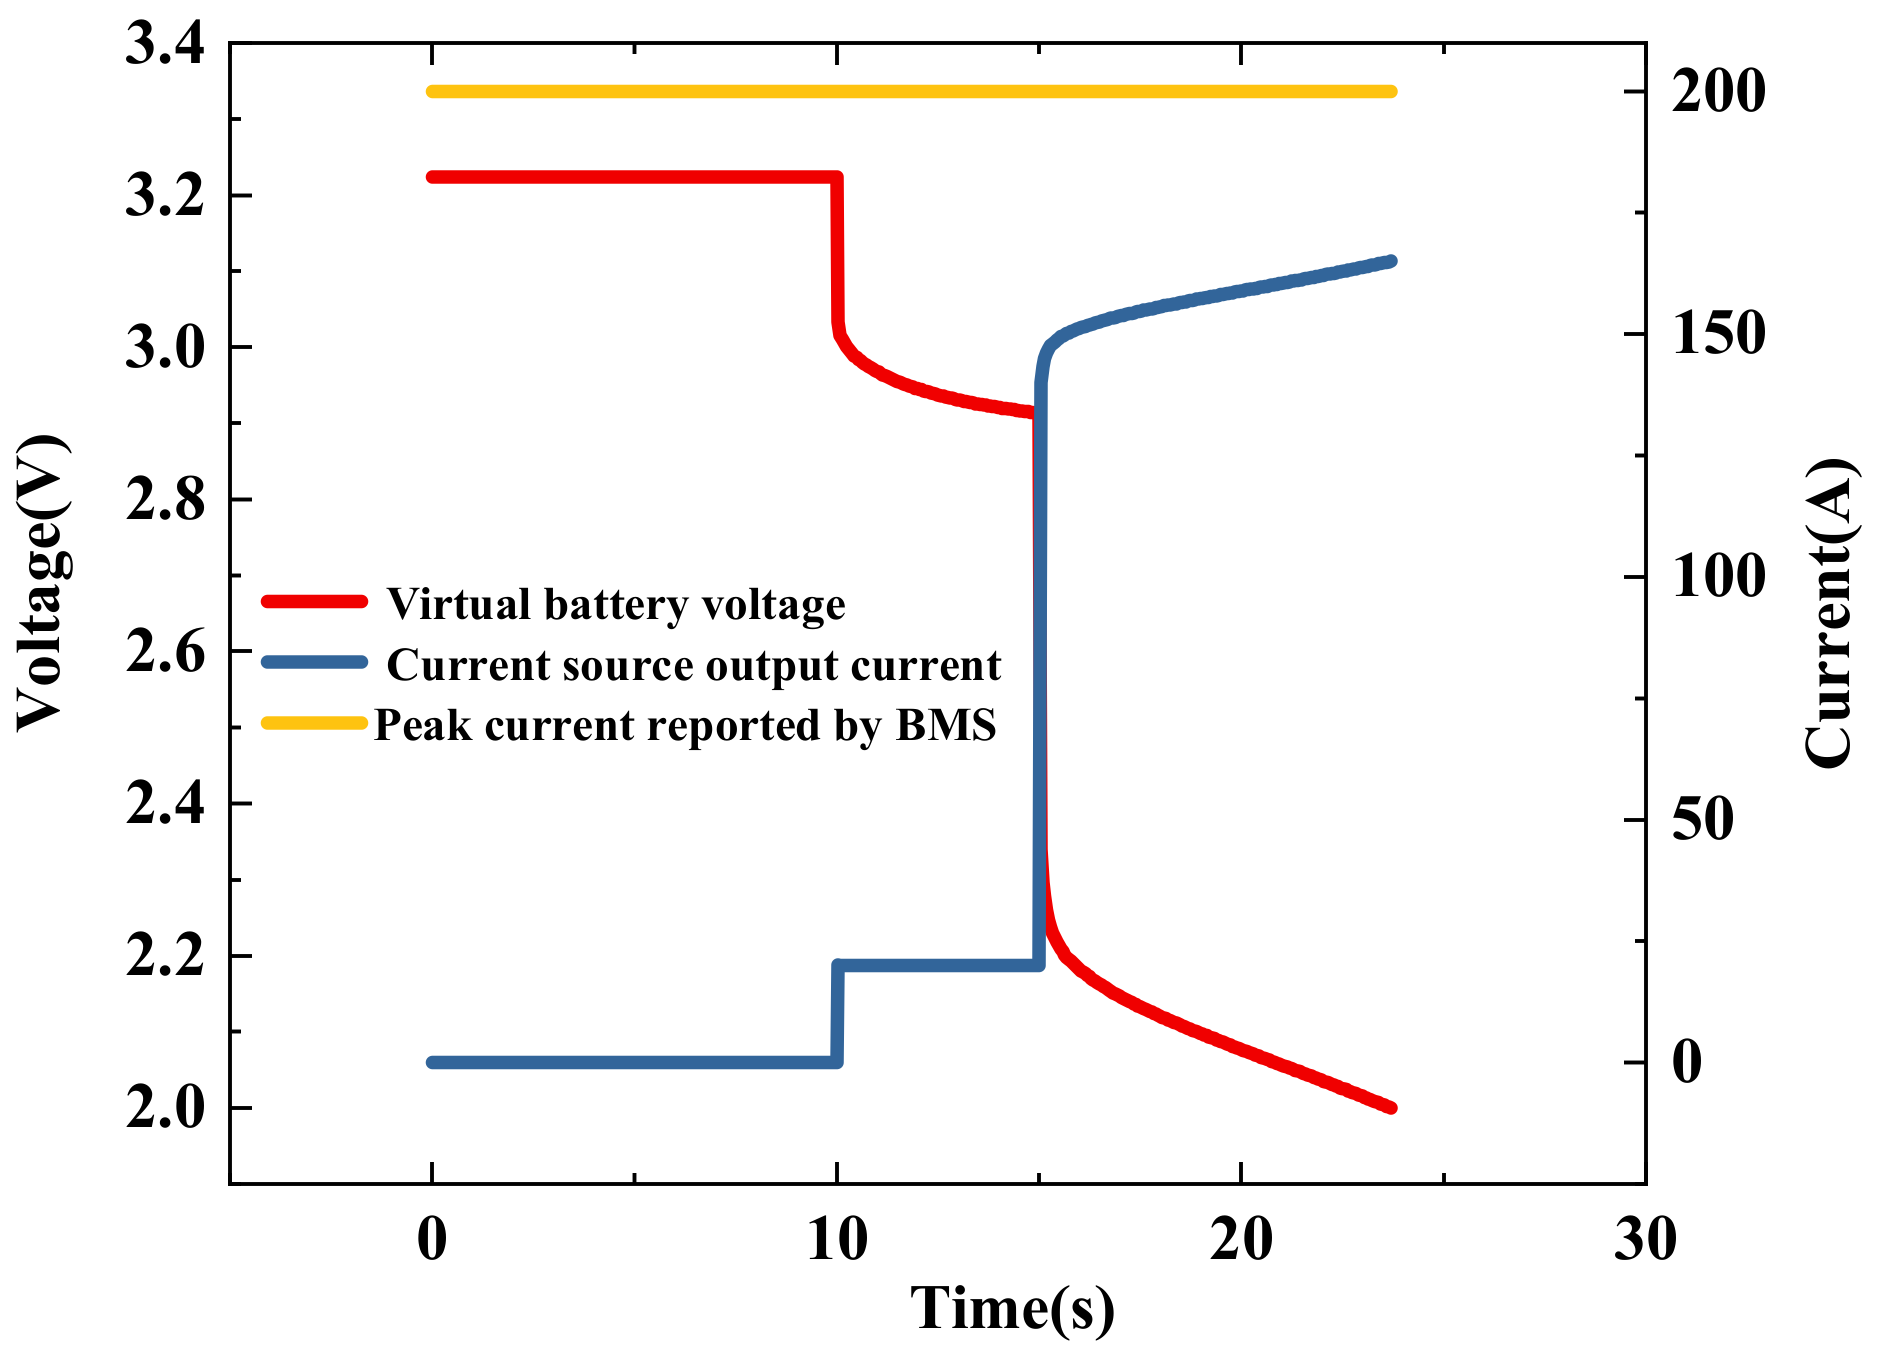
The peak power test of the sample BMS in the initial polarization state was executed on the built testing bench. When discharging with an amplitude of 20 A for 5 s to establish initial polarization, the specified battery has a peak power output capacity of 330 W. Figure 17 illustrates the output values of the platform modules while carrying out the BMS peak power test: the output voltage of the virtual battery, the output current of the current source, and the peak current reported from the BMS. In the figure, the BMSs testing system outputs a peak power of 330 W with a duration of 8 s. Whether in the initial polarization build-up phase or the peak current discharge phase, the peak power reported by the BMS is 400 W, which is the product of the peak current (200 A) reported by the BMS and the minimum value of the voltage (2 V) during the discharge process. It means that the peak current of the BMS under test cannot switch between different time scales. Therefore, under this test condition, the reported peak power (peak current) of the BMS under test is too large, which may lead to over-discharge and over-temperature problems of the battery system.

Figure 17.
Output values of BMS testing system during SOP testing.
6. Conclusions
This paper investigates the technology of the testing of a BMS based on a virtual battery pack.
First, a series-connected battery inconsistency modeling method for the virtual battery is proposed. The lithium iron phosphate battery pack inconsistency model based on the Copula method is obtained from a derivative transformation. The constant current discharge and Highway Fuel Economy Test (HWFET) profile were deployed to validate the accuracy of the proposed model. Compared with ignoring the inconsistency, the battery pack model considering the inconsistency has a minor error and a more realistic energy utilization efficiency (EUE) in the constant current discharge simulation. Under the HWFET profile, the maximum error of the proposed model is 2.39%, and the RMSE is 1.602 V. Similarly, the maximum error of the average temperature is 0.22%, and the RMSE is 0.039 degrees Celsius.
Then, a virtual battery-based BMS closed-loop testing platform is established for the needs of the BMSs’ testing. The hardware part consists of a real-time target machine, virtual battery, and controllable current source, while the software part consisting of the Simulink model is introduced in detail. In addition, the real-time interaction between the model and the BMS under test has been achieved with the help of ControlDesk.
Finally, some testing methods and the evaluation of the SOC/SOPs estimation accuracy of the BMS are proposed. The methods of obtaining the SOC/SOPs reference value have been discussed, and the initial polarization conditions are considered in extracting the SOP reference value to better match the actual operating conditions of the battery system. The SOC estimation cumulative error of the BMS was tested using the actual and virtual battery packs, respectively. Moreover, the results show that the cumulative error of the tested BMS is large, and the BMS is not sensitive to the test conditions. Apart from this, the SOPs estimation accuracy test was conducted on the BMS. The result shows that the BMS under test cannot switch the peak current on different time scales, and it reports excessive peak currents.
In the future, it will be an excellent way to use this testing platform for the BMSs estimation accuracy tests under different aging conditions. Given the advantages of test repeatability and fast state switching offered by the virtual battery pack, the above statement is easy to achieve.
Author Contributions
Conceptualization, B.S.; investigation, X.Z. (Xingzhen Zhou); project administration, H.R.; validation, Z.Z.; writing—original draft, X.Z. (Xinze Zhao); writing—review and editing, X.H. All authors have read and agreed to the published version of the manuscript.
Funding
This research was funded by the National Natural Science Foundation of China (Grant No. 51907005 and 52177206).
Conflicts of Interest
The authors declare no conflict of interest.
Nomenclature
| A | the battery surface area (m2) |
| CAPi | the capacity of the i-th battery cell in a series battery pack (Ah) |
| C’p | the battery specific heat capacity (J/(kg °C)) |
| Cpi | polarization capacitance of the i-th RC element (F) |
| Cp-i | polarization capacitance of the i-th battery cell in a series battery pack generated by leveraging the Copula method (F) |
| Cp-mean | the average value of Cp-i (F) |
| cp-i | the polarization capacitance ratio of the i-th battery cell in a series battery pack |
| h | the heat dissipation coefficient |
| m | the mass of the battery cell (kg) |
| OCV | open circuit voltage (V) |
| OCVave | the average value of OCV in the whole SOC interval (V) |
| Pa | the Joule heat of total insistence (W) |
| P | Battery heating power (W) |
| Ro | ohmic internal resistance (Ω) |
| Ro-i | ohmic internal resistance of the i-th battery cell in a series battery pack generated by leveraging the Copula method (Ω) |
| Ro-mean | the average value of Ro-i (Ω) |
| ro-i | the ohmic internal resistance ratio of the i-th battery cell in a series battery pack |
| Rpi | polarization resistance of the i-th RC element (Ω) |
| Rp-i | polarization resistance of the i-th battery cell in a series battery pack generated by leveraging the Copula method (Ω) |
| Rp-mean | the average value of Rp-i (Ω) |
| rp-i | the polarization resistance ratio of the i-th battery cell in a series battery pack |
| SOCi | the state of charge of the i-th battery cell in a series battery pack |
| Vcut-off | the cut-off voltage of the battery cell (V) |
| Vo | output terminal voltage (V) |
| Vpi | polarization voltage of the i-th RC element (V) |
Abbreviations
| BMS | Battery management system |
| CLTC | China light-duty vehicle test cycle |
| EUE | Energy utilization efficiency |
| HIL | Hardware in the loop |
| HPPC | Hybrid pulse power characterization |
| HWFET | Highway Fuel Economy Test |
| NEDC | New European Driving Cycle |
| RC | Resistance and capacitance |
| RMSE | Root Mean Square Error |
| SOC | State of charge |
| SOP | State of power |
Appendix A
Appendix A.1. Battery Pack Capacity Test
- The 0.3 C constant current discharge to a minimum monomer voltage is 2.00 V.
- Rest for 2 h.
- Charge the battery pack with the stepped current, and the specific working conditions are as follows:
- ①
- 0.3 C charging to a maximum individual voltage up to 3.60 V;
- ②
- 0.05 C charging to a maximum individual voltage up to 3.65 V.
- Rest for 2 h.
- The 0.3 C constant current discharge to a minimum monomer voltage is 2.00 V; record the discharge capacity of this step.
Appendix A.2. Battery Cell Capacity Test
- Use the battery pack charging-discharging equipment to charge the battery pack until it reaches a full charge according to step 3 of the battery pack capacity test.
- Charge the battery cell to 3.65 V with 5 A constant current using the equalization equipment and record the charging capacity of the individual at this step.
- Rest for 2 h.
- Discharge the battery pack at a constant current of 0.3 C to a minimum individual voltage of 2.00 V using the battery pack charging-discharging equipment and record the discharge capacity at this step.
- Rest for 2 h.
- Discharge the individual to 2.00 V at a constant current of 5 A using the equalization equipment and record the discharge capacity of the battery cell at this step.
Appendix A.3. Battery Pack Internal Resistance Characteristics and OCV Testing
- Use the battery pack charging-discharging equipment to charge the battery pack until it reaches a full charge according to step 3 of the battery pack capacity test.
- Rest for 2 h.
- Discharge 5% SOCpack at 0.3 C, where SOCpack is the ratio of the remaining available capacity of the battery pack to the discharge capacity of the battery pack.
- Rest for 2 h.
- Repeat steps 3 and 4 a total of 19 times.
Appendix B

Table A1.
Parameter Index.
Table A1.
Parameter Index.
| Parameters | Number |
|---|---|
| Capacity | 1 |
| SOCend | 2 |
| Tempdiff | 3 |
| H | 4 |
| Ro SOCx | 5–19 (the larger the number, the smaller the SOC) |
| Rp SOCx | 20–34 (the larger the number, the smaller the SOC) |
| τ SOCx | 35–49 (the larger the number, the smaller the SOC) |
Table A2.
Parameter setting for SOC correction speed test.
Table A2.
Parameter setting for SOC correction speed test.
| SOC Test Range | Battery System Initial SOC | SOC Reported by BMS | Battery Pack SOC Cycle Condition: SOCset1- SOCset2- SOCset3- SOCset2- SOCset3 | ||
|---|---|---|---|---|---|
| SOCset1 | SOCset2 | SOCset3 | |||
| SOC ≥ 80% | 90% | 75% | 90% | 30% | 95% |
| 30% < SOC < 80% | 75% | 90% | 75% | 30% | 80% |
| 75% | 60% | 75% | 30% | 80% | |
| 35% | 50% | 35% | 30% | 80% | |
| 35% | 20% | 35% | 30% | 80% | |
| SOC ≤ 30% | 20% | 35% | 20% | 5% | 80% |
References
- Lu, L.; Li, J.; Hua, J. A review on the key issues of the lithium-ion battery management. Sci. Technol. 2016, 34, 39–51. [Google Scholar]
- Wei, Z.; Zhao, J.; He, H. Future smart battery and management: Advanced sensing from external to embedded multi-dimensional measurement. J. Power Sources 2021, 489, 229462. [Google Scholar] [CrossRef]
- Ding, X.; Zhang, D.; Cheng, J. An improved Thevenin model of lithium-ion battery with high accuracy for electric vehicles. Appl. Energy 2019, 254, 113615. [Google Scholar] [CrossRef]
- QC/T 897-2011; Technical Specification of Battery Management System for Electric Vehicles. National Standard of the People’s Republic of China: Shenzhen, China, 2011.
- GB/T 38661-2020; Technical Specification of Battery Management System for Electric Vehicles. National Standard of the People’s Republic of China: Shenzhen, China, 2020.
- Kalk, A.; Salikoglu, Y.; Leister, L.; Braeckle, D.; Hiller, M. Hardware-in-the-Loop Test Rig for Rapid Prototyping of Battery Management System Algorithms. In Proceedings of the 2022 IEEE Transportation Electrification Conference & Expo (ITEC), Zhejiang, China, 28–31 October 2022; pp. 473–478. [Google Scholar]
- Bae, K.; Choi, S.C.; Kim, J.H. LiFePO4 dynamic battery modeling for battery simulator. In Proceedings of the 2014 IEEE International Conference on Industrial Technology (ICIT), Busan, Republic of Korea, 26 February–1 March 2014; pp. 354–358. [Google Scholar]
- Liu, X.; Ai, W.; Marlow, M.N. The effect of cell-to-cell variations and thermal gradients on the performance and degradation of lithium-ion battery packs. Appl. Energy 2019, 248, 489–499. [Google Scholar] [CrossRef]
- Zhou, L.; Zheng, Y.; Ouyang, M. A study on parameter variation effects on battery packs for electric vehicles. J. Power Sources 2017, 364, 242–252. [Google Scholar] [CrossRef]
- Zhang, C.; Jiang, Y.; Jiang, J. Study on battery pack consistency evolutions and equilibrium diagnosis for serial-connected lithium-ion batteries. Appl. Energy 2017, 207, 510–519. [Google Scholar] [CrossRef]
- Lin, T.; Chen, Z.; Zhou, S. Voltage-correlation based multi-fault diagnosis of lithium-ion battery packs considering inconsistency. J. Clean. Prod. 2022, 336, 130358. [Google Scholar] [CrossRef]
- Zheng, Y.; Ouyang, M.; Lu, L. Understanding aging mechanisms in lithium-ion battery packs: From cell capacity loss to pack capacity evolution. J. Power Sources 2015, 278, 287–295. [Google Scholar] [CrossRef]
- Rumpf, K.; Naumann, M.; Jossen, A. Experimental investigation of parametric cell-to-cell variation and correlation based on 1100 commercial lithium-ion cells. J. Energy Storage 2017, 14, 224–243. [Google Scholar] [CrossRef]
- Yang, N.; Song, Z.; Hofmann, H. Robust State of Health estimation of lithium-ion batteries using convolutional neural network and random forest. J. Energy Storage 2022, 48, 103857. [Google Scholar] [CrossRef]
- Schuster, S.F.; Brand, M.J.; Berg, P. Lithium-ion cell-to-cell variation during battery electric vehicle operation. J. Power Sources 2015, 297, 242–251. [Google Scholar] [CrossRef]
- Jiang, Y.; Jiang, J.; Zhang, C. A Copula-based battery pack consistency modeling method and its application on the energy utilization efficiency estimation. Energy 2019, 189, 116219. [Google Scholar] [CrossRef]
- Bui, T.M.; Niri, M.F.; Worwood, D.; Dinh, T.Q.; Marco, J. An Advanced Hardware-in-the-Loop Battery Simulation Platform for the Experimental Testing of Battery Management System. In Proceedings of the 2019 23rd International Conference on Mechatronics Technology (ICMT), Salerno, Italy, 23–26 October 2019; pp. 1–6. [Google Scholar]
- Gauchia, L.; Sanz, J. A per-unit hardware-in-the-loop simulation of a fuel cell/battery hybrid energy system. IEEE Trans. Ind. Electron. 2009, 57, 1186–1194. [Google Scholar] [CrossRef]
- Barreras, J.V.; Fleischer, C.; Christensen, A.E. An advanced HIL simulation battery model for battery management system testing. IEEE Trans. Ind. Appl. 2016, 52, 5086–5099. [Google Scholar] [CrossRef]
- Fleischer, C.; Sauer, D.U.; Barreras, J.V.; Schaltz, E.; Christensen, A.E. Development of software and strategies for Battery Management System testing on HIL simulator. In Proceedings of the 2016 Eleventh International Conference on Ecological Vehicles and Renewable Energies (EVER), Monte Carlo, Monaco, 6–8 April 2016; p. 12. [Google Scholar]
- Di Rienzo, R.; Roncella, R.; Morello, R. Low-cost modular battery emulator for battery management system testing. In Proceedings of the 2018 IEEE International Conference on Industrial Electronics for Sustainable Energy Systems (IESES), Hamilton, New Zealand, 31 January–2 February 2018; pp. 44–49. [Google Scholar]
- Dinggen, L.; Xiaofeng, T.; Shijie, L. Design of BMS test platform for electric vehicles based on CAN communication. Power Technol. 2018, 42, 1543–1545. [Google Scholar]
- Cao, M. Battery Management System Key Technology Research and Test System Construction; Nanchang University: Nanchang, China, 2019. [Google Scholar]
- Wu, H.; Yuan, S.; Zhang, X.; Yin, C.; Ma, X. Model parameter estimation approach based on incremental analysis for lithium-ion batteries without using open circuit voltage. J. Power Sources 2015, 287, 108–118. [Google Scholar] [CrossRef]
- Sun, B.; He, X.; Zhang, W. Study of parameters identification method of li-ion battery model for EV power profile based on transient characteristics data. IEEE Trans. Intell. Transp. Syst. 2020, 22, 661–672. [Google Scholar] [CrossRef]
- Yan, J. Research on Life Cycle State Assessment Technology of Cascade Utilization Lithium-Ion Battery Pack; Beijing Jiaotong University: Beijing, China, 2019. [Google Scholar]
- Ruan, H.; Jiang, J.; Sun, B. An optimal internal-heating strategy for lithium-ion batteries at low temperature considering both heating time and lifetime reduction. Appl. Energy 2019, 256, 113797. [Google Scholar] [CrossRef]
- Yin, G. Study on the Method of Obtaining the Peak Power Reference Value of Lithium-Ion Battery for Testing; Beijing Jiaotong University: Beijing, China, 2020. [Google Scholar]


Disclaimer/Publisher’s Note: The statements, opinions and data contained in all publications are solely those of the individual author(s) and contributor(s) and not of MDPI and/or the editor(s). MDPI and/or the editor(s) disclaim responsibility for any injury to people or property resulting from any ideas, methods, instructions or products referred to in the content. |
© 2023 by the authors. Licensee MDPI, Basel, Switzerland. This article is an open access article distributed under the terms and conditions of the Creative Commons Attribution (CC BY) license (https://creativecommons.org/licenses/by/4.0/).