1. Introduction
The dynamic development of urban infrastructure, combined with pro-ecological trends, has made bicycles become increasingly popular means of transport. This phenomenon became ever more evident during the SARS-CoV-2 pandemic [
1,
2,
3,
4]. The more frequent selection of a bicycle as means of transport increasingly more often translates to limited air pollution emissions [
5,
6,
7] and improved quality and level of life [
8,
9,
10,
11,
12]. Dense populations in cities and the growing number of vehicles face engineers with a number of complex challenges [
13,
14,
15]. Information on bicycle traffic volume is one of the inherent elements of designing new bicycle lane network sections. Regular traffic measurements have to be conducted in order to obtain such data.
Traffic measurements have been one of the issues taken into account in planning and designing road networks for many years [
16,
17,
18,
19,
20]. The process applies not only to motor vehicles, but also to bicycles and even pedestrians. Decisions on expanding a road network or implementing solutions aimed at improving traffic safety are made based on traffic volume information collected during bicycle traffic measurements [
21,
22,
23,
24,
25,
26,
27]. One example of recording such data is the bicycle traffic study in the capital city of Warsaw, conducted in accordance with the guidelines of the Municipal Roads Authority in Warsaw. The first such measurement was conducted in 2007, and reports on bicycle traffic in the capital of Poland have been regularly developed based on acquired data since 2014 [
28,
29]. The annually collected traffic volume information enable conducting an effective analysis of forming trends and observed changes in the movement methods among the residents within the studied area [
30,
31,
32,
33,
34]. This information can be used to manage the energy of electric vehicles [
35,
36,
37,
38,
39].
2. Study Area
There are several methods applied in measuring bicycle traffic volume [
40,
41,
42,
43,
44]. Devices automatically counting vehicles are gaining popularity with technical development [
45,
46,
47,
48,
49,
50,
51,
52,
53,
54]. Currently, the most frequently applied study methods include the observation and recording of the number of vehicles directly by an operator at the measurement point and counting objects in office conditions, based on acquired video footage from the measurement location. The second of these methods was used within the data collection method for the report “Pomiary Ruchu Rowerowego 2020” (Traffic volume measurements 2020), which involved a four-day measurement in 36 locations throughout Warsaw, in June and July of the given year. Vehicle volume was measured during morning and afternoon rush hours, i.e., 7–9 a.m. and 4–7 p.m., and the obtained data were aggregated into 15-minute intervals. The detailed categorization attributes involved traffic direction, sex, means of transport used, infrastructure type, wearing a helmet, and clothing type (sports/casual). Traffic volume information recorded using cameras [
55,
56] was expanded in the report with data from 35 automatic bicycle traffic measurement (ABTM) points, which counted vehicles passing through a given section via an induction loop embedded in the asphalt.
In order to discuss the whole issue of the analysis and evaluation of methods used in measuring bicycle traffic volume, the following organization of the article was adopted. First, an introduction is provided along with an analysis of the literature in the area under discussion. Then, the various methods used to record objects in selected locations are characterized. The next section presents the results of the measurements made, along with their analysis. The article concludes with conclusions, followed by a bibliography.
3. Materials and Methods
Determining the accuracy of measuring instruments required conducting a series of carefully planned activities [
57]. Study implementation was divided into several stages. The first one involved determining bicycle lane sections, which were to be subject to the bicycle traffic volume study. Next, the radars and the camera were inspected in terms of damages and correct functioning. It was also checked whether batteries intended for powering the devices were charged, and the SIM card that was a component of one of the controllers used was topped up. The next stage involved setting up stations equipped with the measuring instruments at the selected locations. The task was completed a day prior to the planned start of the study. The correctness of data acquisition by the devices was checked several times in the course of the measurement. The next day, after the measurements were completed, both stations were disassembled, and the collected materials were copied to spare drives. The next stage involved converting the data collected by all the measuring instruments to a single, consistent format that ensured convenient implementation of subsequent analyses. This was followed by describing the methods used to record the objects at the selected locations.
3.1. Video Recording and Vehicle Classification
Bicycle traffic volume measurements resulted in a total of 96 h of video footage from two selected locations. The actual number of vehicles passing through the measurement section was manually determined based on this data. Furthermore, the authors adopted a categorization of the counted objects by means of transport, namely, a bicycle, electric scooter, and personal transporter. The measurement involved using a CCTV IP camera that records the image in 1080 P (1920 × 1080 pixels) at 30 fps, which is characterized with viewing angles of almost 100° in the horizontal plane and 30° in the vertical plane. The aggregation level for recorded video materials was limited to video length below 15 min. The video recorder capability range was additionally expanded through the application of external devices. These involved a multifunctional microcomputer containing a set of inputs, outputs, and modules. It was connected to the camera via an RJ-45 network cable. The microcomputer was connected to a laptop via a LAN cable and entering a specific IP number in the web browser enabled video preview in real time. In addition, a topped-up SIM card and an RTSP port enabled remote video preview in real time.
3.2. Microwave Radar
A microwave radar (
Figure 1) classifies vehicles into appropriate classes based on technical parameters defined during traffic volume measurement. Its recording and classification options can accumulate data on daily traffic. The applied FSK technology enables measuring vehicle length and speed. The FSK technology also allows the selection of locations that do not enable operation of certain radar groups due to, for example, protective barriers or other reflective structures. A detailed 8 + 1 vehicle class classification pursuant to TLS 2012 (technical conditions of delivery for road stations) is based on classification features regarding vehicle length, distance from counter, and acoustic detection. Technical parameters are determined according to the class of vehicles. Vehicle classification was done according to the A1 accuracy according to TLS (specification issued by BASt, the German Federal Highway Administration), in particular, based on vehicle length, distance from the meter, and acoustic detection. The device can be additionally integrated with a microphone, which enables determining, apart from traffic data, sound intensity at a given measuring point. Access to data was possible via cellular transmission and a manual data transfer through a Bluetooth connection with a laptop. Receiving and analysing data was possible owing to an installed application that enables obtaining not only information on the activity status of individual systems, but also receive warning messages, e.g., in the event of low battery level. Various variants for exporting files with traffic data were available. This enabled a simple assessment and visualization of the data using third-party engineering software.
3.3. Perpendicular Radar
A perpendicular radar (
Figure 2) used in the study recorded traffic volume information using a radio frequency of 24.125 GHz (K-band). It is also capable of measuring traffic volume, average speed, the individual speed of a vehicle, lane occupancy, and vehicle classification. The device sends two radio beams at different angles in the horizontal plane. As a result, each of the vehicles crosses both beams just once. The distance of a vehicle from the radar is determined based on the opening angle and the time between sending the beam, its reflection from the vehicle, and its return to the device. The distance, speed, and travel direction of recorded vehicles are determined based on the occupancy duration of each beam and the time between crossing both beams. The vertical range of the sent beam is an angle of 65°. The radar is capable of detecting vehicles within its field of view, regardless of the weather and lighting conditions. This is because the radar electromagnetic wavelength is significantly greater than that of light; therefore, a radar beam can penetrate rain, snow, and even fog. Heavy rain or snowfall may slightly affect microwave radar test results.
3.4. Induction Loop
Induction loops are used in many transport-related fields, one of which is the issue of measuring bicycle traffic volume. Induction loops can detect vehicles both on a bicycle lane and bicycle traffic sections of a road. A properly designed and constructed loop will not be impacted even by larger vehicles passing nearby [
58]. Magnetic sensors are among the instruments used to detect two-track vehicles. Unfortunately, they do not correctly record all passing vehicles made of aluminium. In order to solve this issue, loop operation was based on exciting eddy currents in conductive bicycle parts, which leads to a decrease in loop inductance. The current flowing through the coils of an inductive loop sensor creates a sine-alternating magnetic field (primary field) around it. When this field encounters a metal object nearby, it induces eddy currents therein, which then generate a sine-variable magnetic field that weakens the primary field. As a consequence, the resultant field also has a reduced modulus and is phase-shifted [
59].
Owing to the application of this technology, such factors as the electrical conductivity of the material that the vehicle is made of, the distance from the loop, and its surface are of major significance. In the event of connecting two separate induction loops to a counter, bicycle lane traffic volume can be measured in both directions [
60].
4. Results
Traffic volume data were collected by two equally equipped measuring stations. The chapter below presents measurement results broken down by measuring stations.
4.1. Measurement of Traffic Volume at the Bicycle Lane at Stefana Banacha Street
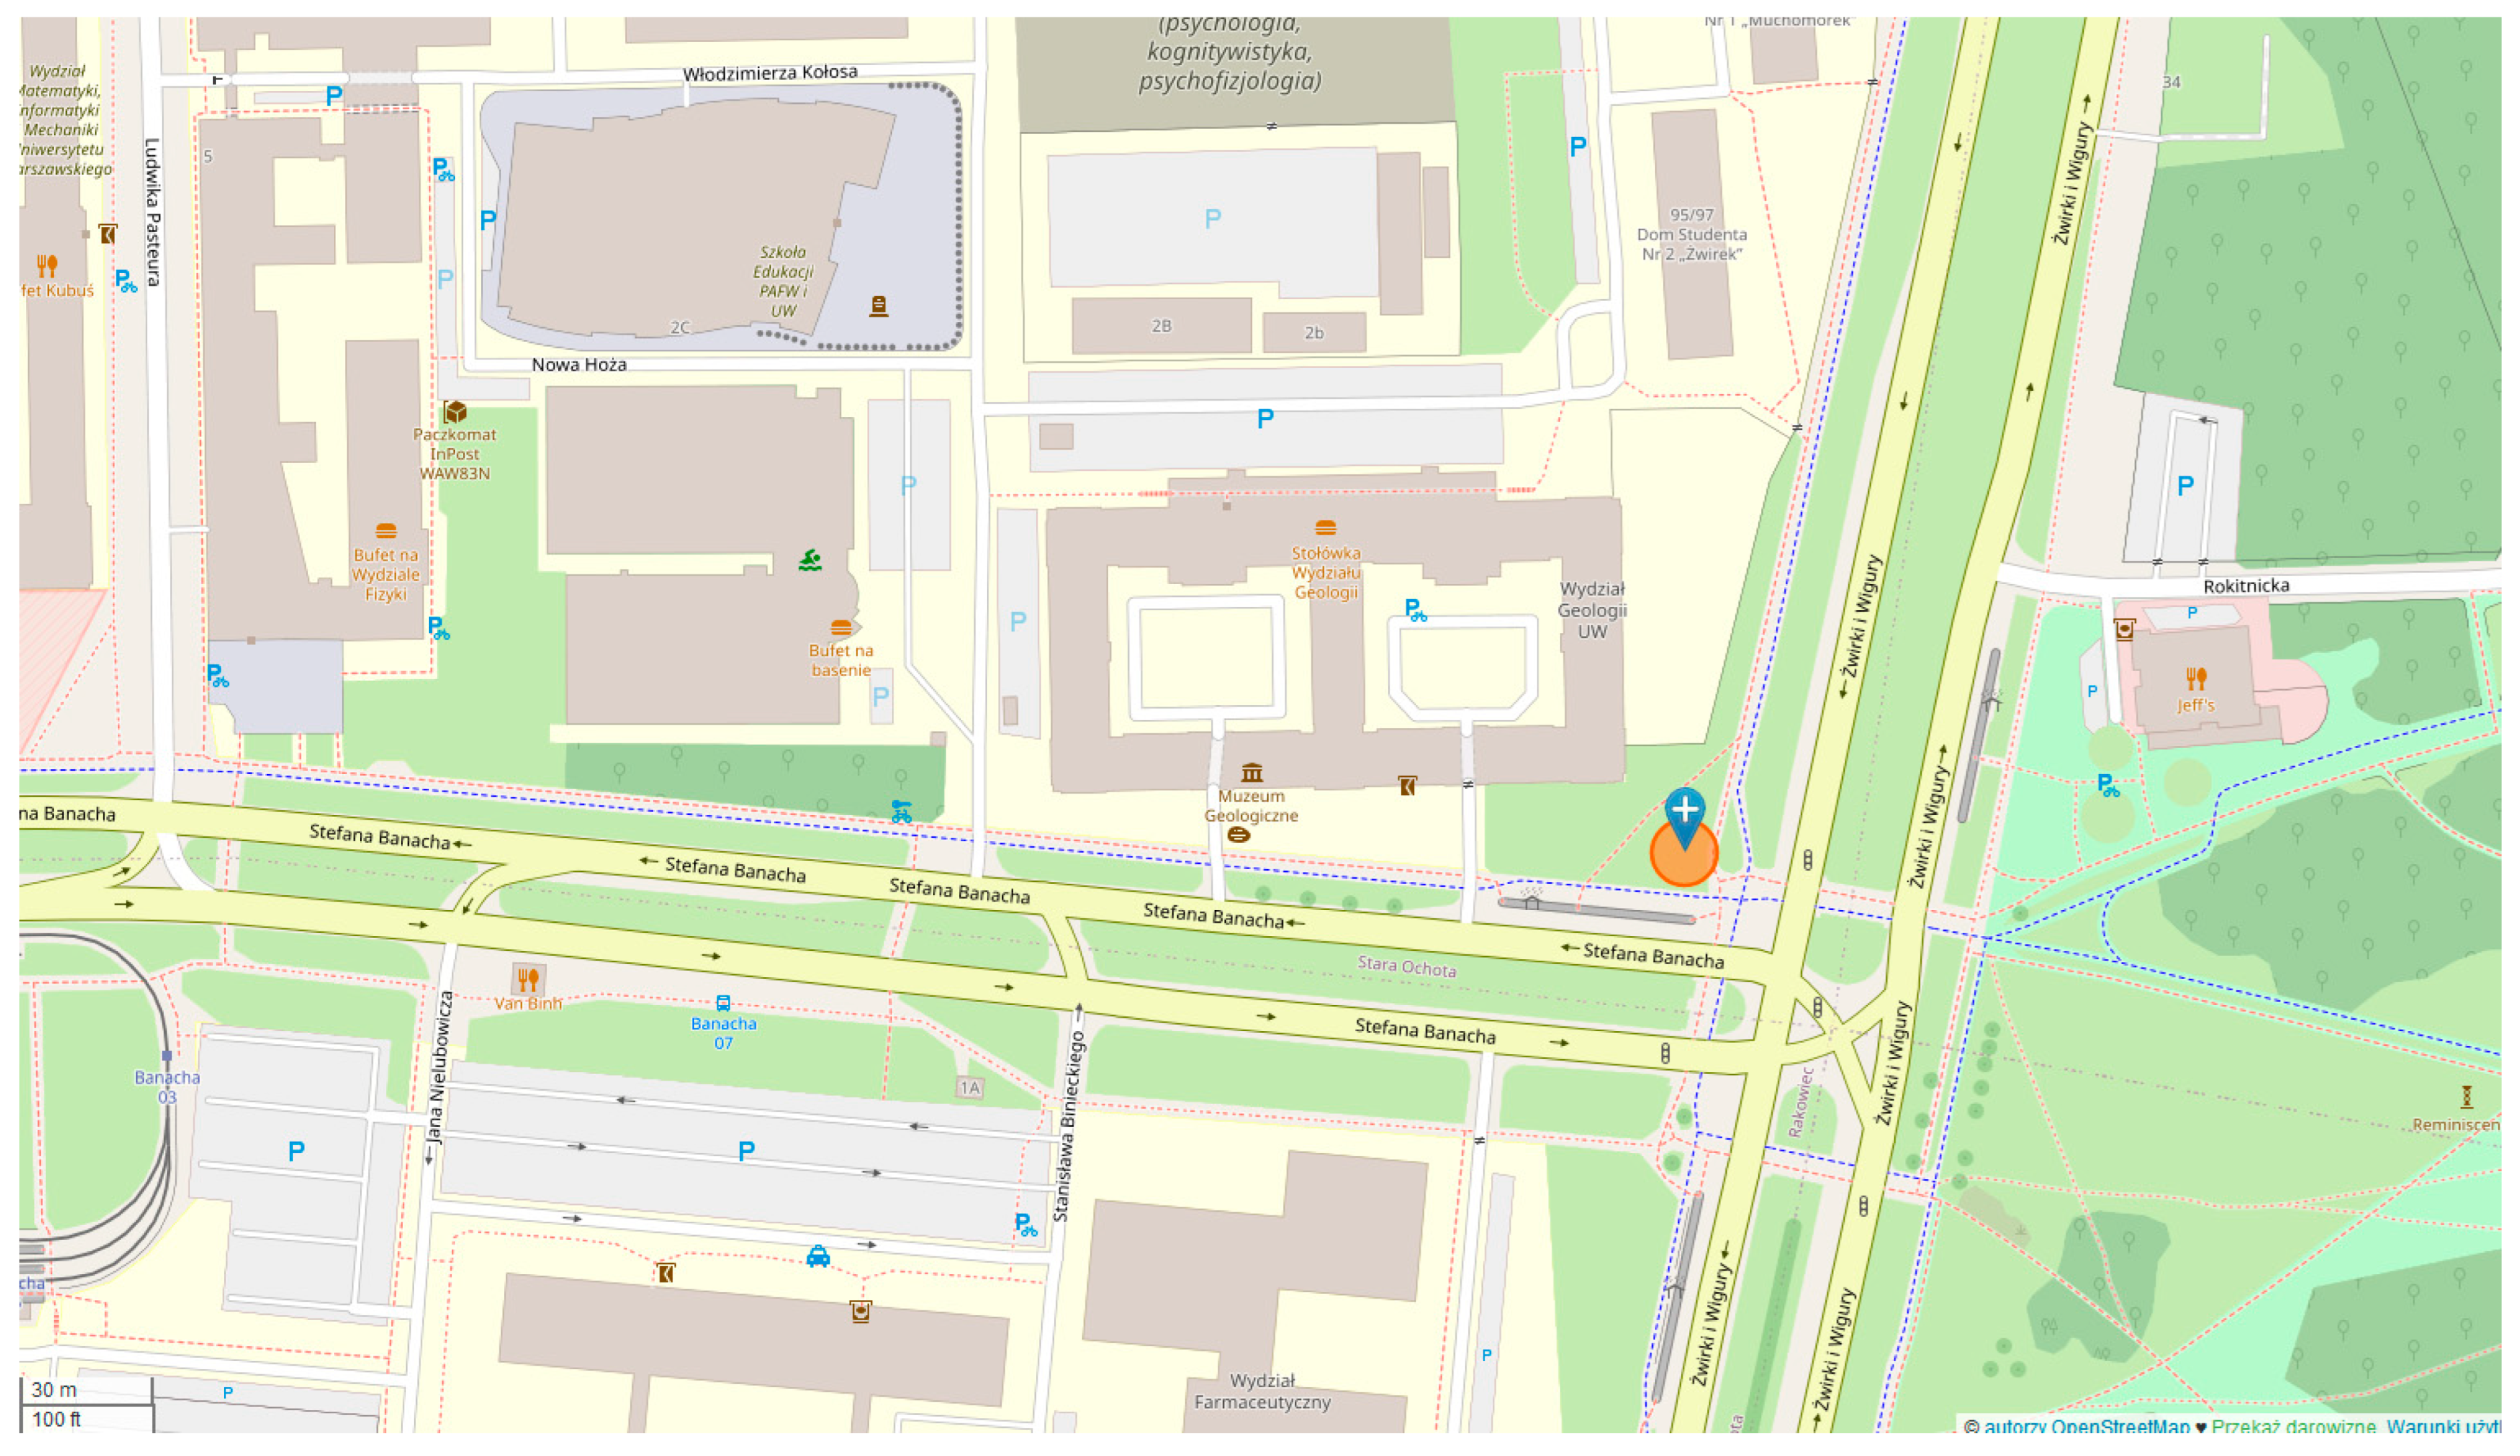
The stations used to measure bicycle traffic as part of the practical section of the diploma thesis were located within the capital city of Warsaw. The first one was located in the Ochota district, at the intersection of Stefana Banacha and Żwirki i Wigury streets (52.210646 N, 20.987321 E) (
Figure 3). It was characterized by the immediate vicinity of a public park, Pole Mokotowskie, and was located approximately 3 km from the city center. Such locations are often characterized by the highest bicycle traffic volume in the direction of the city center from 7 a.m. to 9 a.m. (morning rush hours) and from 3 p.m. to 6 p.m. (afternoon rush hours) [
61]. Increased traffic during these periods is caused by residents commuting to work and returning to their places of residence. The studied section was located on the northwestern part of the intersection and covered a bicycle lane fragment perpendicular to Stefana Banacha street. The measurement section was 30 m away from the intersection center with traffic lights, and there was a bus stop in its proximity. There was a wide pavement made of concrete slabs next to the studied bicycle lane section, which was not structurally separated from it. Minor snowfall was recorded on the day preceding the measurements. The weather was cloudy with clear spells and patchy rain during the night two days prior to the study period. The pavement of the studied section was wet for most of the study, and the average temperature during the day was 5 °C.
4.1.1. Video Recording
The source data from the perpendicular and microwave radars and the coded video footage data were appropriately aggregated and compared. The collected video footage was used in order to obtain the number of vehicles actually passing the measurement section. In the case of the station at Stefana Banacha street, the studied measurement section was passed by 1701 vehicles over the 48 h of measurements. According to the adopted classification, this included 1587 bicycles, 104 scooters, and 10 personal transporters. Over the two days, 881 vehicles (including 815 bicycles) were recorded travelling in direction 1, i.e., towards Grójecka street, and 820 vehicles (including 772 bicycles) in direction 2, i.e., towards Żwirki i Wigury street (
Figure 3). On 15 December, the section was crossed by 823 vehicles (including 759 bicycles) and on 16 December by 878 vehicles (including 828 bicycles).
Table 1 and
Table 2 contain information on the structure type of recorded vehicles, broken down by directions and measurement days.
4.1.2. Microwave Radar
During the 48 h of the measurement, the device recorded 1554 vehicles, which was 8.64% less than the number of vehicles that actually crossed the studied section. Based on the comparative analysis of data in the vehicle-by-vehicle structure with the video footage, it was concluded that the almost 9% difference resulted from the failure of the device to count a large number of scooters and personal transporters. Because the microwave radar does not classify such means of transport as a scooter or a personal transporter, all recorded vehicles were treated as bicycles in the course of further processing. The device also recorded the presence of three vehicles in the car category and nine in the motorcycle category. Due to the nature of the study, which involves only traffic along the bicycle lane, the aforementioned 12 records were classified as categorization errors and included in the comparative statement as bicycles. Under such an assumption, the device in question recorded 1554 bicycles, which compared to the actual number of bicycles of 1587 constituted a basis to adopt the estimated device measurement accuracy at almost 97.9%. It should also be emphasized that there were cases where scooters were recorded and classified by the microwave radar as bicycles, and where bicycles were not recorded at all. The analyses of the video recording indicate that such situations could have occurred for 30 to 40 vehicles, which amounts to approximately 2% of the entire research population. After taking these cases into account, the estimated measurement accuracy of the microwave radar in the bicycle category was determined at 96.0%. The measurement accuracies for direction 1 (Grójecka street) and direction 2 (Żwirki i Wigury street) compared to coded vehicles amounted to 99.0% and 93.4%, respectively. The device beam was directed not only on the bicycle lane, but also the pavement. Owing to the advancement of the used software, the device did not register pedestrians crossing the studied section in the output data. The graphs (
Figure 4 and
Figure 5) below show the traffic volume measured at particular hours over the two measurement days. The first one shows a comparison of the number of vehicles recorded by the microwave radar and the actual number of bicycles. The second one illustrates a comparison of the number of vehicles measured with the microwave radar and the number of vehicles crossing the measurement section.
Besides measuring the number of vehicles, the radar also measured their speed; in the case of the station at Stefana Banach street, the average value was 15.22 km/h. Factors that could have impacted this result include the vicinity of an intersection with traffic lights, which was located approximately 30 m from the measurement section. In addition, the studied bicycle lane section passed a pedestrian crossing. People moving with the use of vehicles should exercise particular caution due to the proximity of a bus stop and the resulting increased pedestrian traffic. The graph (
Figure 6) below shows the distribution of vehicle speed recorded by the microwave radar.
4.1.3. Perpendicular Radar
Over the two measurement days, the device registered 2187 records, which was 28.6% more than the actual number of vehicles and 37.8% more than the actual number of bicycles (
Figure 7). After analysing video footage, it was concluded that the main reason behind the said differences was the counter recording pedestrians moving along the pavement adjacent to the bicycle lane. This happened despite setting out the detection area in the device calibration software. It should be noted that some people also moved directly on the bicycle lane. The device recorded the speed and length of objects crossing the measurement section, and thus, it was possible to discard records that did not fall within the expected value ranges. However, due to the nature of the conducted study, it was decided not to apply this step since the adopted analysis objective was to compare the data not modified in any way. The relative errors caused by the excessive number of recorded vehicles was 31.7% for direction 1 (Grójecka street) and 44.2% for direction 2 (Żwirki i Wigury street), relative to the actual number of bicycles.
4.1.4. Induction Loop
The last vehicle recording method applied as part of the bicycle traffic volume study was an induction loop embedded in asphalt combined with a counter. A camera, which was one of the elements of the measuring station, was installed in such a way so that its recorded image displayed the total daily and annual numbers of cyclists on the pylon screen. Due to the contrast between the display (an integral part of the pylon) and the surroundings, the number of cyclists was visible on video footage only between 9.30 a.m. and 2.30 p.m. The cameras recorded the image through the entire 15 and 16 December and until 11 a.m. on 17 December. As a result, based on the available traffic volume data, it was possible to calculate the number of vehicles recorded by the induction loop on both measurement days. The first conducted step was to determine the total number of recorded bicycles for each of the three days and for the entire year 2021. The calculations adopted the number of cyclists for 10 a.m. on 15–17 December. Next, in order to obtain the number of cyclists at midnight between the analysed days, the daily recorded volume was subtracted from the displayed annual volume. The difference between the annual number of cyclists at midnight between successive days enabled calculating the total number of cyclists recorded in one day, both for 15 and 16 December. It should be emphasized that the conducted measurement did not involve a division into travel directions. The counter connected to the induction loop recorded 775 vehicles on 15 December and 855 on 16 December.
Therefore, over the two measurement days, the counter connected with the induction loop recorded 1630 vehicles. This amounted to 95.5% of the actual number of vehicles that crossed the measurement section. Compared to the actual 1587 bicycles, the device recorded 43 extra vehicles, which means a relative error of 2.7%. Similar to the microwave radar, there were situations where the counter connected to the induction loop failed to record passing bicycles and situations where it recorded passing scooters and personal transporters. Based on video analysis, it was concluded that the counter recorded 96% of the actual number of bicycles passing the measurement section, as well as 93.9% of the scooters and personal transporters.
4.2. Measurement of Traffic Volume at the Bicycle Lane at Świętokrzyska Street
The second of the measurement locations was located in the Śródmieście district at 30 Świętokrzystka street, in the inner center of Warsaw (52.234959 N, 21.006358 E) (
Figure 8). The studied section was located in the immediate vicinity of a pedestrian walkway, separated from the bicycle lane with a greenery belt in some places. An oblong residential building with several stores and eateries on the ground floor was located next to the section. Such locations are usually characterized by an above-average share of electric scooters in the vehicle type structure. Between the bicycle lane and the road, there was a paid car parking space dedicated for perpendicular parking. Due to the proximity of a parking meter and a minor park, one could expect increased pedestrian traffic in the vicinity of the studied area. The nearest intersections were located 120 m from the measurement section towards the east (with Marszałkowska street) and approx. 140 m to the west (with Raoul Wallenberg street). As with the measurements at Stefana Banacha street, the asphalt bicycle lane pavement was wet during the measurement, with no rainfall on either day. The average air temperature during the day, both on 15 and 16 December, was approx. 6 °C. Despite the measurement being conducted in the winter season, no snowfall was recorded during its course. The Figures below illustrate the location of the measurement station and photos showing its equipment.
4.2.1. Video Recording
According to the adopted assumption of conducting comparative analyses, the number of vehicles hand-coded from video footage fully represented the actual number of vehicles crossing the section located within the studied bicycle lane section. Over the two days of measurement covering the bicycle lane located by Świętokrzyska street, namely, the section between Marszałkowska street and Aleja Jana Pawła II, the authors recorded 1786 vehicles, including 1445 bicycles, 327 scooters, and 14 personal transporters. In direction 1, namely, Aleja Jana Pawła II, the studied section was crossed by 1158 vehicles (including 957 bicycles) and in direction 2 (Marszałkowska street), the equipment recorded 628 vehicles (including 488 bicycles).
Table 3 and
Table 4 show the structure type of vehicles recorded in the bicycle lane at Świętokrzyska street, broken down by directions and measurement days.
4.2.2. Microwave Radar
Over the 48 h of measurement (
Figure 9 and
Figure 10), it recorded 1651 vehicles, including 1588 classified as bicycles, 57 at motorcycles, and 6 as cars on the dedicated bicycle path. Based on video footage analysis and according to the adopted procedure, 63 records involving motorcycles and cars were determined as categorization errors and included in further statements as bicycles. Under such an assumption, the counter recorded 1651 bicycles, which, compared to the 1445 bicycles that actually crossed the studied section, amounted to an absolute measurement error of the device of 14.3%. This was largely due to the fact that as many as 327 scooters as 14 personal transporters were recorded within the studied bicycle lane section, which translated to shares in the structure type of 18.3% and 0.8%, respectively. Similar to the measurement point at Stefana Banacha street, there were cases where electric scooters were classified by the counter as bicycles. The microwave radar placed on the bicycle lane at Świętokrzyska street recorded almost 79.2% of scooters and 95.6% of bicycles that crossed the measurement section.
Besides recording the very number of vehicles, the radar also measured their speed; in the case of the station at Świętokrzyska street, the average value was 20.14 km/h. This number was impacted by such factors as a good-quality asphalt pavement, distances from traffic flow intersections higher than 50 m in both directions, and a greenery belt separating the bicycle lane from the walkway. The graph (
Figure 11) below illustrates the number of vehicles moving at particular speeds, rounded to whole numbers.
4.2.3. Perpendicular Radar
Over the two days, the device recorded 1833 vehicles. However, the measurement was conducted without categorization. The device relative error caused by an excessive number of records amounted to 2.6% for all vehicles and 26.9% for bicycles. The studied bicycle lane section was separated from the walkway by a greenery belt. After analysing the video footage, it was concluded that due to the proximity of the car park, the studied section could have been crossed by pedestrians several dozen times. It was still a number several-fold lower than in the case of the measurement at Stefana Banacha street, where the walkway was not separated from the bicycle lane in any manner and the measurement station was located near a bus stop. In the graph (
Figure 12) illustrating traffic volume over the two measurement days, the greatest differences in the number of vehicles recorded with the perpendicular radar and the actual number of vehicles can be seen between 2 and 3 a.m. on 15 December. After analysing the video footage, it was concluded that the measurement section was crossed by one bicycle, six electric scooters, and one pedestrian during that time. All other records were most likely recorded by the beam reflected from passing vehicles or other infrastructure elements located near the measuring device. The duration from 8 a.m. to 2 p.m. was where a significantly greater number of redundant objects recorded by the perpendicular radar was observed. Pedestrians constituted for the largest group during that time.
4.2.4. Induction Loop
The traffic volume measured using an induction loop within the studied bicycle lane section at Świętokrzyska street was calculated using similar conversions, as in the case of the point at Stefana Banacha street. This action was forced by a large contrast between the numbers displayed on the pylon and the surroundings at night, which prevented reading the day traffic volume based on available video footage.
The counter connected with the induction loop recorded 1901 vehicles during the traffic volume measurements. This number is 31.6% higher than the actual number of bicycles, equal to 1445, and 6.4% higher than the actual number of vehicles crossing the section, which amounted to 1786. Additional numerical juxtapositions were found based on traffic data for 10 a.m. on both measurement days. On 15 December, the total number of vehicles recorded from midnight until 10 a.m. was 172 by the induction loop, whereas 166 crossed the measurement section. This means the relative error of the device was equal to 3.6%. On 16 December, this number was equal to 180 for the induction loop counter and 206 for vehicles hand-coded from video footage. Based on this part of the data, the vehicle measurement accuracy was 87.3%. Due to the observed irregularity, further steps were taken aimed at precise observation of the number of vehicles displayed on the pylon. In the course of the analyses, the authors noticed that there were situations at night where one bicycle was counted as several dozen bikes by the counter. Due to the high contrast of the display, it was impossible to accurately determine the number. The situation in question may result from a software error. In light of these circumstances, it was assumed that the data collected by the induction loop in the bicycle lane section at Świętokrzyska street were not a reliable reference point to assess this measurement method.
4.3. Summary
The practical part of the described experiment involved collecting, processing, and comparing traffic volume data for the selected bicycle lane sections. The authors also described the nature of traffic in both locations. Each of the four used measurement methods differed in terms of data collection technology and data recording accuracy. A situation where, for various reasons, measurement data might not fully reflect the actual traffic volume was possible in the case of each method. Such cases include measuring equipment theft, physical device failure, interruption or absence of an active instrumentation power supply source, and the covering of the measurement section by a different object, e.g., a delivery truck. Traffic data covered by this study were collected under favorable weather conditions; however, due to the data collection method by the counters, these factors should not translate to lower or higher measurement accuracy.
Table 5 and
Table 6 show processed and aggregated traffic volume data collected on 15 and 16 December by the measurement points located at Stefana Banacha and Świętokrzyska streets, broken down by measurement method.
5. Conclusions
The purpose of this study is to analyse and evaluate the methods used to measure bicycle traffic volume. Four different measurement methods were used in the study, which included devices such as a video recorder, microwave radar, perpendicular radar, and a meter connected to an induction loop embedded in the asphalt. Measurement through physical counting of vehicles based on video footage should be classified as a method that enables achieving a measurement accuracy of 100%. A properly trained operator is able to categorize passing cyclists according to numerous features, such as sex, bicycle type, helmet worn (or not), sports clothing, or movement direction. In addition, this measurement method enables applying significantly broader categorization options, e.g., vehicle type. This is of particular importance in the face of technological development and the increasing availability of such devices as electric scooters or other electric personal transporters. The obtained measurements can be used to manage the energy of electric vehicles. This measurement method enables studying traffic volume in many locations simultaneously.
The microwave radar was able to record over 95% of the bicycles crossing a measurement section. The applied technology does not lead to errors that involve identifying passing pedestrians as vehicles. The beam emission method enables determining the movement distance and direction of a passing vehicle, its speed, and its distance from the radar. This method is able to moderately record and identify electric scooters and personal transporters. A set of categories that can be assigned by the counter used in the study is limited only to bicycles in the case of a bicycle lane measurement. Furthermore, there may be situations where a person riding a scooter is classified as a cyclist. In light of the above, a microwave radar should achieve the greatest measurement accuracy in sections with the least number of vehicles other than bicycles. In the case of a more diverse type structure, vehicle identification accuracy of the device will decrease, and the error in determining the actual number of cyclists will increase.
The perpendicular radar device measured vehicle traffic volume with the lowest accuracy among the applied methods. The radar beam reflected off objects other than bicycles in many situations, which resulted in a large number of redundant records. Due to the design and data processing method based on beam parameters, the radar recorded almost all traffic, including pedestrians and cyclists, as well as cars passing at a distance of more than 4 m from the bicycle lane. Such situations happened despite setting out a measurement area in the radar-dedicated application. The device is not strictly intended for measuring bicycle traffic volume, which was reflected in practice. A relative measurement error between 25% and 40% is, in the case of many types of possible studies, a factor that disqualifies this measurement method in terms of recording bicycles.
The induction loop embedded in asphalt recorded over 95% of the bicycles crossing the measurement section. There were situations in the course of the study where bicycle presence was not counted, as well as cases where a bicycle was double-counted. Due to the work effort required to install a measurement station, the described measurement method is suitable for continuous, long-term measurement. Owing to a constant power supply and a design resistant to weather conditions, it satisfies fundamental requirements in a manner consistent with the assumptions. Apart from the bicycles themselves, the counter also recorded more than 90% of electric scooters and personal transporters. This means that, just like with a microwave radar, a higher share of non-bicycle vehicles may hinder determining the actual bicycle number. Given the vast measurement period while applying this method, studies aimed at controlling vehicle counting correctness should also be considered. A detailed observation of data displayed in one of the pylons participating in the study enables the conclusion that despite a relatively correct bicycle lane traffic recording, an incorrectly developed software may lead to displaying data encumbered with a significant error.
The measurements conducted made it possible to determine the advantages and disadvantages of the various methods of measuring bicycle traffic volumes. This can be used in the selection of a bicycle traffic volume measurement method for a specific bicycle route. The results of the bicycle traffic volume measurement allow the design and optimization of bicycle routes, including, in particular, for electric bicycles. This allows, on the one hand, for the rational placement of stations for the provision of electric bicycles, and on the other hand, for the optimization of the energy management system used for charging electric bicycles. The perpendicular radar measurement method showed the lowest accuracy in measuring the volume of bicycle vehicles among other methods in the same field. The measurement method of physically counting vehicles from video footage achieved a measurement accuracy level of 100%.
Author Contributions
Conceptualization, P.K. and Z.K.; methodology, P.K., Z.K. and M.R.; software, P.K. and Z.K.; validation, P.K., Z.K. and A.R.; formal analysis, P.K., Z.K. and M.R.; investigation, P.K., Z.K., M.R. and A.R.; resources, P.K. and Z.K.; data curation, P.K. and Z.K.; writing original draft preparation, P.K, Z.K. and M.R.; writing review and editing, P.K., Z.K., M.R. and A.R.; visualization, P.K. and Z.K.; supervision, P.K. and Z.K.; project administration, P.K., Z.K. and A.R; funding acquisition, A.R. All authors have read and agreed to the published version of the manuscript.
Funding
This work was co-financed by Military University of Technology under research project UGB 737.
Institutional Review Board Statement
Not applicable.
Informed Consent Statement
Not applicable.
Data Availability Statement
The data presented in this study are available on request from the corresponding author.
Conflicts of Interest
The authors declare no conflict of interest.
References
- Buehler, R.; Pucher, J. Cycling through the COVID-19 Pandemic to a More Sustainable Transport Future: Evidence from Case Studies of 14 Large Bicycle-Friendly Cities in Europe and North America. Sustainability 2022, 14, 7293. [Google Scholar] [CrossRef]
- Turoń, K.; Kubik, A. Business Innovations in the New Mobility Market during the COVID-19 with the Possibility of Open Business Model Innovation. J. Open Innov. Technol. Mark. Complex. 2021, 7, 195. [Google Scholar] [CrossRef]
- Turoń, K.; Kubik, A.; Chen, F. Electric Shared Mobility Services during the Pandemic: Modeling Aspects of Transportation. Energies 2021, 14, 2622. [Google Scholar] [CrossRef]
- Chen, J.; Zhou, D.; Zhao, Y.; Wu, B.; Wu, T. Life cycle carbon dioxide emissions of bicycle-sharing in China: Production, operation, and recycling. Resour. Conserv. Recycl. 2020, 162, 105011. [Google Scholar] [CrossRef]
- Niu, Z.; Chai, L. Carbon Emission Reduction by Bicycle-Sharing in China. Energies 2022, 15, 5136. [Google Scholar] [CrossRef]
- Bieliński, T.; Dopierała, Ł.; Tarkowski, M.; Ważna, A. Lessons from Implementing a Metropolitan Electric Bike Sharing System. Energies 2020, 13, 6240. [Google Scholar] [CrossRef]
- Baptista, P.; Pina, A.; Duarte, G.; Rolim, C.; Pereira, G.; Silva, C.; Farias, T. From on-road trial evaluation of electric and conventional bicycles to comparison with other urban transport modes: Case study in the city of Lisbon, Portugal. Energy Convers. Manag. 2015, 92, 10–18. [Google Scholar] [CrossRef]
- Lin, H.-H.; Shen, C.-C.; Hsu, I.-C.; Wu, P.-Y. Can Electric Bicycles Enhance Leisure and Tourism Activities and City Happiness? Energies 2021, 14, 8144. [Google Scholar] [CrossRef]
- Vasiutina, H.; Szarata, A.; Rybicki, S. Evaluating the Environmental Impact of Using Cargo Bikes in Cities: A Comprehensive Review of Existing Approaches. Energies 2021, 14, 6462. [Google Scholar] [CrossRef]
- Kwiatkowski, M.A.; Grzelak-Kostulska, E.; Biegańska, J. Could It Be a Bike for Everyone? The Electric Bicycle in Poland. Energies 2021, 14, 4878. [Google Scholar] [CrossRef]
- Turoń, K.; Kubik, A.; Ševčovič, M.; Tóth, J.; Lakatos, A. Visual Communication in Shared Mobility Systems as an Opportunity for Recognition and Competitiveness in Smart Cities. Smart Cities 2022, 5, 802–818. [Google Scholar] [CrossRef]
- Bęczkowska, S.A.; Grabarek, I.; Zysk, Z.; Gosek-Ferenc, K. Physical Activity and Ecological Means of Transport—Functional Assessment Methodology. Int. J. Environ. Res. Public Health 2022, 19, 9211. [Google Scholar] [CrossRef] [PubMed]
- Kosai, S.; Yuasa, M.; Yamasue, E. Chronological Transition of Relationship between Intracity Lifecycle Transport Energy Efficiency and Population Density. Energies 2020, 13, 2094. [Google Scholar] [CrossRef]
- Plazier, P.A.; Weitkamp, G.; van den Berg, A.E. “Cycling was never so easy!” An analysis of e-bike commuters’ motives, travel behaviour and experiences using GPS-tracking and interviews. J. Transp. Geogr. 2017, 65, 25–34. [Google Scholar] [CrossRef] [Green Version]
- Cieśla, M.; Sobota, A.; Jacyna, M. Multi-Criteria decision making process in metropolitan transport means selection based on the sharing mobility idea. Sustainability 2020, 12, 7231. [Google Scholar] [CrossRef]
- Oskarbski, J.; Birr, K.; Żarski, K. Bicycle Traffic Model for Sustainable Urban Mobility Planning. Energies 2021, 14, 5970. [Google Scholar] [CrossRef]
- Grigoropoulos, G.; Hosseini, S.A.; Keler, A.; Kaths, H.; Spangler, M.; Busch, F.; Bogenberger, K. Traffic Simulation Analysis of Bicycle Highways in Urban Areas. Sustainability 2021, 13, 1016. [Google Scholar] [CrossRef]
- Luo, H.; Kou, Z.; Zhao, F.; Cai, H. Comparative life cycle assessment of station-based and dock-less bike sharing systems. Resour. Conserv. Recycl. 2019, 146, 180–189. [Google Scholar] [CrossRef]
- Van Marsbergen, A.; Ton, D.; Nijënstein, S.; Annema, J.A.; van Oort, N. Exploring the role of bicycle-sharing programs in relation to urban transit. Case Stud. Transp. Policy 2022, 10, 529–538. [Google Scholar] [CrossRef]
- Sheth, M.; Butrina, P.; Goodchild, A.; McCormack, E. Measuring delivery route cost trade-offs between electric-assist cargo bicycles and delivery trucks in dense urban areas. Eur. Transp. Res. Rev. 2019, 11, 11. [Google Scholar] [CrossRef]
- Skoczyński, P. Analysis of Solutions Improving Safety of Cyclists in the Road Traffic. Appl. Sci. 2021, 11, 3771. [Google Scholar] [CrossRef]
- Ma, C.; Yang, D.; Zhou, J.; Feng, Z.; Yuan, Q. Risk Riding Behaviors of Urban E-Bikes: A Literature Review. Int. J. Environ. Res. Public Health 2019, 16, 2308. [Google Scholar] [CrossRef] [PubMed] [Green Version]
- Włodarek, P.; Olszewski, P. Traffic safety on cycle track crossings–traffic conflict technique. J. Transp. Saf. Secur. 2020, 12, 194–209. [Google Scholar] [CrossRef]
- Anysz, H.J.; Włodarek, P.; Olszewski, P.; Cafiso, S. Identifying factors and conditions contributing to cyclists’ serious accidents with the use of association analysis. Arch. Civil Eng. 2021, 67, 197–211. [Google Scholar] [CrossRef]
- Murawski, J.; Szczepański, E.; Jacyna-Gołda, I.; Izdebski, M.; Jankowska-Karpa, D. Intelligent mobility: A model for assessing the safety of children traveling to school on a school bus with the use of intelligent bus stops. Eksploat. i Niezawodn. 2022, 24, 695–706. [Google Scholar] [CrossRef]
- Kaziyeva, D.; Loidl, M.; Wallentin, G. Simulating Spatio-Temporal Patterns of Bicycle Flows with an Agent-Based Model. ISPRS Int. J. Geo-Inf. 2021, 10, 88. [Google Scholar] [CrossRef]
- Kucharski, R.; Drabicki, A.; Żyłka, K.; Szarata, A. Multichannel queueing behaviour in urban bicycle traffic. Eur. J. Transp. Infrastruct. Res. 2019, 19, 116–141. [Google Scholar] [CrossRef]
- Dudek, D.; Ostaszewski, P. Pomiary Ruchu Rowerowego; Simrun: Warsaw, Poland, 2000; pp. 4–7. [Google Scholar]
- Krukowicz, T.; Firląg, K.; Sobota, A.; Kołodziej, T.; Novačko, L. The relationship between bicycle traffic and the development of bicycle infrastructure on the example of Warsaw. Arch. Transp. 2021, 60, 187–203. [Google Scholar] [CrossRef]
- Kopta, T. Ruch rowerowy w Polsce na tle innych krajów UE. Stowarzyszenie Inżynierów i Techników Komunikacji Rzeczpospolitej Polskiej, Kraków. Transp. Miej. I Reg 2020, 3, 32–36. [Google Scholar]
- Van Cauwenberg, J.; De Bourdeaudhuij, I.; Clarys, P.; de Geus, B.; Deforche, B. E-bikes among older adults: Benefits, disadvantages, usage and crash characteristics. Transportation 2019, 46, 2151–2172. [Google Scholar] [CrossRef]
- Cherry, C.; Cervero, R. Use Characteristics and Mode Choice Behavior of Electric Bike Users in China, Transport Policy. Pergamon. 2007. Available online: https://www.sciencedirect.com/science/article/abs/pii/S0967070X07000169?via%3Dihub (accessed on 1 January 2023).
- Kwiatkowski, M.A.; Szymanska, D. Cycling policy in strategic documents of Polish cities. Environ. Dev. Sustain. 2021, 23, 10357–10377. [Google Scholar] [CrossRef]
- Ziółkowski, J.G.; Legas, A. Problem of Modelling Road Transport. J. KONBiN 2019, 49, 159–193. [Google Scholar] [CrossRef] [Green Version]
- Czech, P.; Turoń, K.; Urbanczyk, R. Bike-Sharing as an Element of Integrated Urban Transport System. In Advanced Solutions of Transport Systems for Growing Mobility Book Series Advances in Intelligent Systems and Computing; Sierpinski, G., Ed.; Springer International Publishing: Berlin, Germany, 2018; Volume 631, pp. 103–111. [Google Scholar] [CrossRef]
- Theurel, J.; Theurel, A.; Lepers, R. Physiological and cognitive responses when riding an electrically assisted bicycle versus a classical bicycle. Ergonomics 2012, 55, 773–781. [Google Scholar] [CrossRef] [PubMed]
- Chen, Z.; Hu, Y.; Li, J.; Wu, X. Optimal deployment of electric bicycle sharing stations: Model formulation and solution technique. Networks and Spatial Economics. Netw. Spat. Econ. 2019, 20, 99–136. [Google Scholar] [CrossRef]
- Corno, M.; Duz, A.; Savaresi, S.M. Design of a Charge-Sustaining Energy Management System for a Free-Floating Electric Shared Bicycle. IEEE Trans. Control Syst. Technol. 2021, 24, 1–13. [Google Scholar] [CrossRef]
- Lee, K.; Chae, J.; Kim, J. A Courier Service with Electric Bicycles in an Urban Area: The Case in Seoul. Sustainability 2019, 11, 1255. [Google Scholar] [CrossRef] [Green Version]
- Matyja, T.; Kubik, A.; Stanik, Z. Possibility to Use Professional Bicycle Computers for the Scientific Evaluation of Electric Bikes: Velocity, Cadence and Power Data. Energies 2022, 15, 1127. [Google Scholar] [CrossRef]
- Borucka, A.; Kozłowski, E.; Oleszczuk, P.; Swiderski, A. Predictive Analysis of the Impact of the Time of Day on Road Accidents in Poland. Open Eng. 2020, 11, 142–150. [Google Scholar] [CrossRef]
- Sun, Q.; Feng, T.; Kemperman, A.; Spahn, A. Modal shift implications of e-bike use in the Netherlands: Moving towards sustainability? Transp. Res. Part D Transp. Environ. 2020, 78, 102202. [Google Scholar] [CrossRef]
- Pogodzinska, S.; Kiec, M.; D’Agostino, C. Bicycle Traffic Volume Estimation Based on GPS Data. Transp. Res. Procedia 2020, 45, 874–881. [Google Scholar] [CrossRef]
- Rupi, F.; Poliziani, C.; Schweizer, J. Analysing the dynamic performances of a bicycle network with a temporal analysis of GPS traces. Case Stud. Transp. Policy 2020, 8, 770–777. [Google Scholar] [CrossRef]
- Bíl, M.; Andrášik, R.; Kubeˇcek, J. How comfortable are your cycling tracks? A new method for objective bicycle vibration measurement. Transp. Res. Part C Emerg. Technol. 2015, 56, 415–425. [Google Scholar] [CrossRef]
- Zhou, Y.; Dey, K.C.; Chowdhury, M.; Wang, K.C. Process for evaluating the data transfer performance of wireless traffic sensors for real-time intelligent transportation systems applications. IET Intell. Transp. Syst. 2017, 11, 18–27. [Google Scholar] [CrossRef]
- Joo, S.; Oh, C.; Jeong, E.; Lee, G. Categorizing bicycling environments using GPS-based public bicycle speed data. Transp. Res. Part C Emerg. Technol. 2015, 56, 239–250. [Google Scholar] [CrossRef]
- Scott, D.M.; Lu, W.; Brown, M.J. Route choice of bike share users: Leveraging GPS data to derive choice sets. J. Transp. Geogr. 2021, 90, 102903. [Google Scholar] [CrossRef]
- Stawowy, M.; Duer, S.; Paś, J.; Wawrzyński, W. Determining Information Quality in ICT Systems. Energies 2021, 14, 5549. [Google Scholar] [CrossRef]
- Jacyna, M.; Szczepański, E.; Izdebski, M.; Jasiński, S.; Maciejewski, M. Characteristics of event recorders in Automatic Train Control systems. Arch. Transp. 2018, 46, 61–70. [Google Scholar] [CrossRef]
- Krzykowska-Piotrowska, K.; Dudek, E.; Wielgosz, P.; Milanowska, B.; Batalla, J.M. On the Correlation of Solar Activity and Troposphere on the GNSS/EGNOS Integrity. Fuzzy Logic Approach. Energies 2021, 14, 4534. [Google Scholar] [CrossRef]
- Krzykowska-Piotrowska, K.; Dudek, E.; Siergiejczyk, M.; Rosiński, A.; Wawrzyński, W. Is Secure Communication in the R2I (Robot-to-Infrastructure) Model Possible? Identification of Threats. Energies 2021, 14, 4702. [Google Scholar] [CrossRef]
- Krzykowska-Piotrowska, K.; Siergiejczyk, M. On the Navigation, Positioning and Wireless Communication of the Companion Robot in Outdoor Conditions. Energies 2022, 15, 4936. [Google Scholar] [CrossRef]
- Opara, K.; Brzeziński, K.; Bukowicki, M.; Kaczmarek-Majer, K. Road roughness estimation through smartphone-measured acceleration. IEEE Intell. Transp. Syst. Mag. 2022, 14, 1–12. [Google Scholar] [CrossRef]
- Paś, J.; Rosiński, A.; Wetoszka, P.; Białek, K.; Klimczak, T.; Siergiejczyk, M. Assessment of the Impact of Emitted Radiated Interference Generated by a Selected Rail Traction Unit on the Operating Process of Trackside Video Monitoring Systems. Electronics 2022, 11, 2554. [Google Scholar] [CrossRef]
- Siergiejczyk, M.; Kasprzyk, Z.; Rychlicki, M.; Szmigiel, P. Analysis and Assessment of Railway CCTV System Operating Reliability. Energies 2022, 15, 1701. [Google Scholar] [CrossRef]
- Matyja, T.; Kubik, A.; Stanik, Z. Possibility to Use Professional Bicycle Computers for the Scientific Evaluation of Electric Bikes: Trajectory, Distance, and Slope Data. Energies 2022, 15, 758. [Google Scholar] [CrossRef]
- Bugdol, M.; Segiet, Z.; Kręcichwost, M.; Kasperek, P. Vehicle detection system using magnetic sensors. Logistyka 2014, 3, 858–867. [Google Scholar]
- Malinowski, D.; Labuch, J. Poprawa Przepustowości Skrzyżowań w Sieci Miejskiej Poprzez Efektywniejsze Zarządzanie Przepływem Strumienia Pojazdów. 2019. Available online: www.ssmizpolska.pl (accessed on 19 January 2022).
- Markevicius, V. Dynamic Vehicle Detection via the Use of Magnetic Field Sensors; Department of Electronics Engineering: Kaunas, Lithuania, 2016. [Google Scholar]
- Knorr, F.; Schreckenberg, M. Influence of inter-vehicle communication on peak hour traffic flow. Phys. A Stat. Mech. Appl. 2012, 391, 2225–2231. [Google Scholar] [CrossRef]
Figure 1.
Microwave radar installed next to a bicycle lane (own study).
Figure 1.
Microwave radar installed next to a bicycle lane (own study).
Figure 2.
Perpendicular radar and CCTV IP camera (own study).
Figure 2.
Perpendicular radar and CCTV IP camera (own study).
Figure 3.
Location of the measuring station at Stefana Banacha street (own study, based on
www.openstreetmap.org), accessed on 19 January 2022.
Figure 3.
Location of the measuring station at Stefana Banacha street (own study, based on
www.openstreetmap.org), accessed on 19 January 2022.
Figure 4.
Comparison of the number of vehicles recorded by the microwave radar with the actual number of bicycles (own study).
Figure 4.
Comparison of the number of vehicles recorded by the microwave radar with the actual number of bicycles (own study).
Figure 5.
Comparison of the number of vehicles recorded by the microwave radar with the actual number of vehicles crossing the measurement section (own study).
Figure 5.
Comparison of the number of vehicles recorded by the microwave radar with the actual number of vehicles crossing the measurement section (own study).
Figure 6.
Distribution of vehicle speed at the bicycle lane along Stefana Banacha street (own study).
Figure 6.
Distribution of vehicle speed at the bicycle lane along Stefana Banacha street (own study).
Figure 7.
Comparison of the number of vehicles recorded by the perpendicular radar with the actual number of bicycles (own study).
Figure 7.
Comparison of the number of vehicles recorded by the perpendicular radar with the actual number of bicycles (own study).
Figure 8.
Location of the measuring station at Świętokrzyska street (own study, based on
www.openstreetmap.org accessed on 12 December 2022).
Figure 8.
Location of the measuring station at Świętokrzyska street (own study, based on
www.openstreetmap.org accessed on 12 December 2022).
Figure 9.
Comparison of the number of vehicles recorded by the microwave radar with the actual number of bicycles (the measuring station at Świętokrzyska street) (own study).
Figure 9.
Comparison of the number of vehicles recorded by the microwave radar with the actual number of bicycles (the measuring station at Świętokrzyska street) (own study).
Figure 10.
Comparison of the number of vehicles recorded by the microwave radar with the actual number of vehicles (the measuring station at Świętokrzyska street) (own study).
Figure 10.
Comparison of the number of vehicles recorded by the microwave radar with the actual number of vehicles (the measuring station at Świętokrzyska street) (own study).
Figure 11.
Distribution of vehicle speed in the bicycle lane along Świętokrzyska street (own study).
Figure 11.
Distribution of vehicle speed in the bicycle lane along Świętokrzyska street (own study).
Figure 12.
Comparison of the number of vehicles recorded by the perpendicular radar with the actual number of bicycles (the measuring station at Świętokrzyska street) (own study).
Figure 12.
Comparison of the number of vehicles recorded by the perpendicular radar with the actual number of bicycles (the measuring station at Świętokrzyska street) (own study).
Table 1.
Vehicle structure type at the bicycle lane along Stefana Banacha street, broken down by directions (own study).
Table 1.
Vehicle structure type at the bicycle lane along Stefana Banacha street, broken down by directions (own study).
| Category | Direction 1
(veh./Day) | Direction 1
(%) | Direction 2
(veh./Day) | Direction 2
(%) | Total
(veh./Day) | Total
(%) |
|---|
| Bicycles | 815 | 92.5 | 772 | 94.1 | 1587 | 93.3 |
| Scooters | 60 | 6.8 | 44 | 5.4 | 104 | 6.1 |
| Personal transporters | 6 | 0.7 | 4 | 0.5 | 10 | 0.6 |
| Total | 881 | 100.0 | 820 | 100.0 | 1701 | 100.0 |
Table 2.
Vehicle structure type at the bicycle lane along Stefana Banacha street, broken down by measurement days (own study).
Table 2.
Vehicle structure type at the bicycle lane along Stefana Banacha street, broken down by measurement days (own study).
| Category | Day 1
(veh./Day) | Day 1
(%) | Day 2
(veh./Day) | Day 2
(%) | Total
(veh./Day) | Total
(%) |
|---|
| Bicycles | 759 | 92.2 | 828 | 94.3 | 1587 | 93.3 |
| Scooters | 57 | 6.9 | 47 | 5.4 | 104 | 6.1 |
| Personal transporters | 7 | 0.9 | 3 | 0.3 | 10 | 0.6 |
| Total | 823 | 100.0 | 878 | 100.0 | 1701 | 100.0 |
Table 3.
Vehicle structure type at the bicycle lane along Świętokrzyska street, broken down by directions (own study).
Table 3.
Vehicle structure type at the bicycle lane along Świętokrzyska street, broken down by directions (own study).
| Category | Direction 1
(Veh./Day) | Direction 1
(%) | Direction 2
(Veh./Day) | Direction 2
(%) | Total
(Veh./Day) | Total
(%) |
|---|
| Bicycles | 957 | 82.6 | 488 | 77.7 | 1445 | 80.9 |
| Scooters | 193 | 16.7 | 134 | 21.3 | 327 | 18.3 |
| Personal transporters | 8 | 0.7 | 6 | 1.0 | 14 | 0.8 |
| Total | 1158 | 100.0 | 628 | 100.0 | 1786 | 100.0 |
Table 4.
Vehicle structure type at the bicycle lane along Świętokrzyska street, broken down by measurement days (own study).
Table 4.
Vehicle structure type at the bicycle lane along Świętokrzyska street, broken down by measurement days (own study).
| Category | Direction 1
(Veh./Day) | Direction 1
(%) | Direction 2
(Veh./Day) | Direction 2
(%) | Total
(Veh./Day) | Total
(%) |
|---|
| Bicycles | 708 | 80.9 | 737 | 80.9 | 1445 | 80.9 |
| Scooters | 161 | 18.4 | 166 | 18.2 | 327 | 18.3 |
| Personal transporters | 6 | 0.7 | 8 | 0.9 | 14 | 0.8 |
| Total | 875 | 100.0 | 911 | 100.0 | 1786 | 100.0 |
Table 5.
List of all vehicles recorded at the Stefana Banacha street point, broken down by applied measurement method (own study).
Table 5.
List of all vehicles recorded at the Stefana Banacha street point, broken down by applied measurement method (own study).
| Measurement Day | Video
Recording | Microwave
Radar | Perpendicular
Radar | Induction
Loop |
|---|
| 15.12 | 823 | 747 | 1083 | 775 |
| 16.12 | 878 | 807 | 1104 | 855 |
| Total | 1701 | 1554 | 2187 | 1630 |
Table 6.
List of all vehicles recorded at the Stefana Banacha street point, broken down by applied measurement method (own study).
Table 6.
List of all vehicles recorded at the Stefana Banacha street point, broken down by applied measurement method (own study).
| Measurement Day | Video
Recording | Microwave
Radar | Perpendicular
Radar | Induction
Loop |
|---|
| 15.12 | 875 | 815 | 863 | 947 |
| 16.12 | 911 | 836 | 970 | 954 |
| Total | 1786 | 1651 | 1833 | 1901 |
| Disclaimer/Publisher’s Note: The statements, opinions and data contained in all publications are solely those of the individual author(s) and contributor(s) and not of MDPI and/or the editor(s). MDPI and/or the editor(s) disclaim responsibility for any injury to people or property resulting from any ideas, methods, instructions or products referred to in the content. |
© 2023 by the authors. Licensee MDPI, Basel, Switzerland. This article is an open access article distributed under the terms and conditions of the Creative Commons Attribution (CC BY) license (https://creativecommons.org/licenses/by/4.0/).


