Abstract
The purpose of this paper is to address an urgent operational issue referring to optimal power flow (OPF), which is associated with a number of technical and financial aspects relating to issues of environmental concern. In the last few decades, OPF has become one of the most significant issues in nonlinear optimization research. OPF generally improves the performance of electric power distribution, transmission, and production within the constraints of the control system. It is the purpose of an OPF to determine the most optimal way to run a power system. For the power system, OPFs can be created with a variety of financial and technical objectives. Based on these findings, this paper proposes the peafowl optimization algorithm (POA). A powerful meta-heuristic optimization algorithm inspired by collective foraging activities among peafowl swarms. By balancing local exploitation with worldwide exploration, the OPF is able to strike a balance between exploration and exploitation. In order to solve optimization problems involving OPF, using the standard IEEE 14-bus and 57-bus electrical network, a POA has been employed to find the optimal values of the control variables. Further, there are five study cases, namely, reducing fuel costs, real energy losses, voltage skew, fuel cost as well as reducing energy loss and voltage skew, and reducing fuel costs as well as reducing energy loss and voltage deviation, as well as reducing emissions costs. The use of these cases facilitates a fair and comprehensive evaluation of the superiority and effectiveness of POA in comparison with the coot optimization algorithm (COOT), golden jackal optimization algorithm (GJO), heap-based optimizer (HPO), leader slime mold algorithm (LSMA), reptile search algorithm (RSA), sand cat optimization algorithm (SCSO), and the skills optimization algorithm (SOA). Based on simulations, POA has been demonstrated to outperform its rivals, including COOT, GJO, HPO, LSMA, RSA, SCSO, and SOA. In addition, the results indicate that POA is capable of identifying the most appropriate worldwide solutions. It is also successfully investigating preferred search locations, ensuring a fast convergence speed and enhancing the search engine’s capabilities.
1. Introduction
Electricity consumption is increasing immensely, making it increasingly relevant to conduct scientific research in the area of electrical power systems for operation and planning. The complexity and nonlinear nature of electrical power grids require efficient operation within their operating limits [1]. The optimal power flow (OPF) framework is one of the main strategies that might help attain this objective. In order to operate an electric power network, OPF technologies are essential. Power grid management settings are adjusted optimally using optimization techniques while dealing with a variety of restrictions. By focusing on both single and multiple objective frameworks, this article aims at resolving the OPF issue [2,3]. As a result, different power grid requirements will be met from a technical, as well as a financial, perspective. As well as for planning future growth, the OPF findings are necessary for the efficient operation, planning, and management of the current electrical grid. For a particular electrical network, the OPF solution should govern the variables that control or make decisions in a practical area that optimizes predefined objective functions. Often, fuel cost minimization is incorporated as a primary objective function (OF) when formulating the OPF problem, along with other objectives, such as voltage profile enhancement (VPE), real power loss minimization (RPLM), and emissions cost minimization (ECM), based on adapting control variables under both operational and tangible constraints. Conventional optimization methods (COTs) were used in the early decades to solve OPF problems, including linear programming, non-linear programming, mixed integer programming, and interior point methods. Many COTs are used by industry despite their exceptional convergence characteristics. Unlike hill-climbing algorithms, most traditional algorithms are deterministic and cannot locate the most efficient solution on the planet or manage binary or integer variables well. Additionally, COTs cannot address the OPF issue since traditional optimization techniques (apart from linear programming and convex optimization) require starting points. Despite their shortcomings, metaheuristic optimization algorithms are a promising solution for various applications due to their ability to exploit the rapid growth of computational intelligence over the years [4,5,6]. There has been significant progress in solving OPF using multiple metaheuristic optimization techniques over the last ten years, including hybrid approaches, swarm approaches, artificial neural networks with fuzzy logic, and bio-inspired approaches. A summary of the previous approaches to solving this problem can be found in Table 1. These methodologies may be classified according to the single or multiple aims, contributions, and key conclusions of each application.

Table 1.
Applied techniques for the optimal power flow (OPF) issue.
There is no optimization procedure that can achieve the global optimum for every optimization problem. Research is being conducted on contemporary metaheuristic algorithms with the objective of addressing the multi-objective and single-objective aspects of the OPF issue as a non-linear, difficult engineering problem. A variety of engineering applications have benefited from the use of these algorithms because of their simple structure, decreased operator requirements, speedy convergence properties, and enhanced balancing capabilities. POA is a promising tool for solving nonlinear, restricted optimization problems since it is widely used and has a great deal of significance.
Therefore, the following accomplishments of this research might be summed up:
- An innovative approach is presented to solve the OPF issue in power systems. This method guarantees quick convergence and increased search efficiency.
- Describing the five objective functions used in the OPF issue formulation, a number of validations of the suggested approaches have been conducted for both single-objective and multi-objective OPF optimizations. Using pricing and weighting factors, the proposed methods for addressing optimization issues are applied to account for the multi-objective functions (fuel cost, power losses, voltage variation, and emissions).
- A challenging test suite for metaheuristic literary works is evaluated using IEEE 14-bus and IEEE 57-bus testing systems. In statistical evaluations, a boxplot is produced that is highly accurate in reducing the OF with the lowest values, demonstrating the robustness of the proposed POA algorithm.
Following is the breakdown of this essay: Section 2 introduces the OPF’s mathematical formulation model. Section 3 covers the simulation findings and includes the demonstration. This section compares and analyzes the selected metaheuristic algorithms. The study and analysis are summarized and drawn in Section 4.
2. Mathematical Formulation for OPF
OPF often seeks to reduce certain goal functions. An objective function is given by F, and equality and inequality constraints are given by g and h in the network of a power system. The OPF is estimated as follows:
Conditional on:
From Equation (1), x represents the dependent variables, and u represents the control variables. Both and imply a need for equality and inequality. A limitation on equality is indicated by the variable m, whereas an inequality is indicated by the variable p.
The variables () can be expressed by (2):
Here, by (2), a slack bus’s power is indicated by , a load bus’s voltage is indicated by , a generator’s reactive output power is indicated by , and a transmission line’s apparent power flow is indicated by . A load bus is identified by NPQ, a generation bus by NG, and a transmission line by NTL.
The controlled variables (u) can be formulated by (3):
As shown in the equation, represents the generator’s actual output power, represents the generator’s bus voltage, represents the injected shunt compensator’s reactive power, T represents the transformer’s tap setting, NC represents the shunt reactive compensation unit number, and NT represents the transformer number.
2.1. Objective Functions of OPF
The last instance addressed the multi-objective OPF, while the prior three cases dealt with addressing single-objective OPF.
2.1.1. Fuel Costs Minimization
In order to reduce total fuel costs, this objective function is the OPF issue’s main goal. It may be shown as a quadratic polynomial function for every generator using the examples below:
Based on Equation (4), indicates the fuel cost at the ith generator. In addition, the , , and are the cost coefficients.
2.1.2. Generation Emissions Minimization
Pollution may be decreased by limiting the gas thermal power plants release. Here is how the emission gases’ objective function works:
From Equation (5) at ith generators, the emission coefficients are , , , , and .
2.1.3. Active Power Losses Minimization
Minimizing actual power loss is the desired objective function, and it may be demonstrated as follows:
where the transmission conductance, is the transmission lines number, and is the voltages phase difference.
2.1.4. Voltage Deviation Minimization
This objective function, which may be stated as follows, seeks to minimize the variations in the voltage on the load buses from a specified value:
2.1.5. Multi-Objective Functions
Multi-objective problems are defined as problems in which several independent objective functions are optimized simultaneously by the following Equation (8):
From Equation (8), i is the number of objectives.
Multi-objective functions can be solved using the Pareto approach or weight factors as follows:
In order to determine the weighting factors , , and , each goal’s relative importance can be considered. The weighting factors can be considered based on the following formula:
2.2. System Constraints
In the system, there are already a number of restrictions that fall under the following categories:
2.2.1. The Equality Constraints
The equality constraints can be estimated by the following equations:
There are two types of demand for a load on a bus, active and reactive. They are represented by and , respectively. Conductance and susceptibility are represented by and , respectively, surrounded by nodes i and j.
2.2.2. Inequality Constraints
The operation limits for a power system are determined by its equipment, the transmission load, and the voltage of the load buses. It is possible to categorize inequality constraints as follows:
- (a)
- Generators’ active output power
- (b)
- Bus voltages at generators
- (c)
- Generators’ reactive output power
- (d)
- Setting the transformer’s tap
- (e)
- Shunt VAR compensator
- (f)
- A transmission line’s apparent power flow
- (g)
- Voltage boundaries on the load bus
A quadratic penalty formulation of the objective function can be used to easily incorporate the dependent control variables into an optimization solution as follows:
where , , , and are penalty factors with large positive values, and also , , , and are penalty conditions that can be stated as follows:
2.3. Peafowl Optimization Algorithm (POA)
The main inspiration for this algorithm is from the observation of the living habits and behaviors of green peafowls in Yunnan Province in China. Male peafowls are referred to as peacocks, and female peafowls as peahens. Peafowl activities primarily fall into four categories: breeding behavior, food-seeking activity, social behavior, and spatial behavior [31]. The top five solutions to real-world optimization problems are referred to as adult peacocks. The individual roles of these artificial peafowl swarms may vary over time. Therefore, it is necessary to redistribute them based on fitness values after every iteration in order to maintain POA enforcement. Peacocks will rotate around food sources once they have discovered them in order to exhibit and brag to attract peahens’ attention and boost the likelihood of mating. As a result, peahens are likely to use a variety of seeking and approaching strategies throughout the entire search process in order to dynamically control their behavior throughout. In Figure 1, which illustrates the whole execution flowchart of the POA-based OPF, the maximum iteration number is denoted by the symbol .
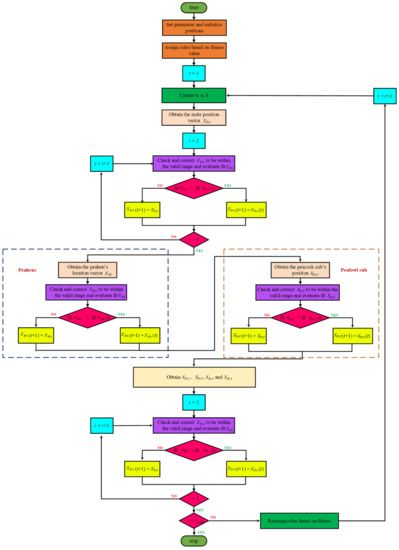
Figure 1.
Flowchart of POA for the OPF problem.
For the POA technique, the control variables of the OPF problem are coded as the positions of the peacocks based on the fitness function (objective function) represented by Equations (4)–(8).
However, the advantages of the POA technique can be deduced as follows:
- During the entire search process, both peahens and peafowl cubs use adaptive seeking and approaching mechanisms. As a result, they are able to dynamically alter their behavior at various stages, thereby maintaining a healthy balance between local exploitation and global exploration. By combining global and local search operators, POA achieves a balance between the two, and prevents local optimum formation.
- In order to find the most effective solutions for today, the five peacocks will rotate and dance as they search throughout the area for solutions. In addition to spinning in situ, the peacock also circles its food source. This is a very unique rotating dance mechanism of the peacock that involves two distinct modes of rotation. There is significance in the fact that a strategy was used to force the present optimal solution to perform a neighboring search, which has never been attempted before. As a result, local optimum situations can be identified.
- As a general rule, POA is designed to explore the optimal search areas and to return the most relevant answers overall.
- The POA outperforms in terms of estimation accuracy, convergence speed, and stability.
3. Simulation Results
A test of the effectiveness of the recommended techniques for single OPF issues has been conducted using the IEEE 14-bus network and the IEEE 57-bus network. The number of populations, the number of iterations, and the number of runs is 50, 200, and 20, respectively. This work is carried out using the MATLAB R2022a programming language and a computer with an Intel® CoreTM i7-8550U processor and 16 GB of RAM. Five case studies are presented in the following sections:
- –
- Minimization of fuel operation costs.
- –
- Reducing transmission power losses to a minimum.
- –
- Minimization of voltage deviation.
- –
- Minimization of fuel operational costs, transmission power losses, and voltage level deviations.
- –
- Minimization of the emission index, fuel operational costs, voltage deviations, and transmission power losses.
3.1. Standard IEEE-14 Bus Test System
A single-line schematic is shown in Figure 2 based on the IEEE 14-bus standard system [1]. An IEEE type-1 exciter is included in three of its five synchronous machines, which are synchronous compensators used solely for reactive power support. There are eleven loads in the system, totaling 259 MW and 81.3 MVAR.
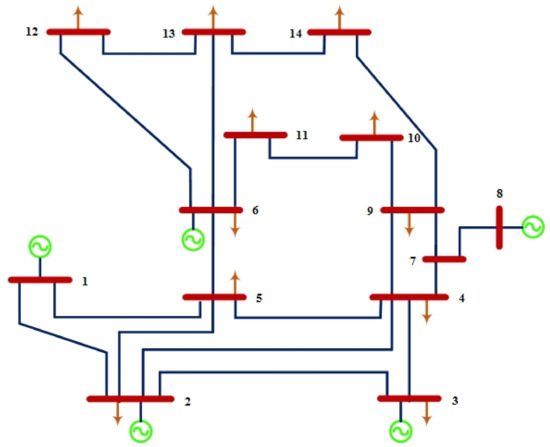
Figure 2.
Standard IEEE 14-bus.
- Case 1: Fuel Cost Minimization
When using the POA algorithm, fuel cost reduction is regarded as the target function. Figure 3 depicts the convergence graph of fuel cost reduction using the POA algorithm. The approach needs 70 iterations to get the optimal solution, demonstrating the remarkable convergence rate of the POA algorithm. Table 2 lists the optimal cost-minimization values and the appropriate changes to the design variables. When the POA algorithm is used, the findings show a considerable reduction in fuel costs to 8078.658 USD/h. Additionally, for this scenario, the average computing time for a single loop is 0.067 s. These outcomes demonstrate how the POA algorithm performs well in terms of solution optimality and quick convergence. To further verify the effectiveness of the POA method, the fuel cost determined using different alternative heuristic optimization techniques is compared with it. Table 2 shows how superior the POA algorithm is to earlier methods. Particularly, the majority of acquired solutions using heuristic optimization algorithms are feasible, primarily due to voltage magnitude accepted at all system load buses, as shown in Figure 4. Comparing the proposed POA’s boxplots to those of other methods, it can be noted that they are extremely tight for reducing fuel costs, with the lowest values as indicated in Figure 5.
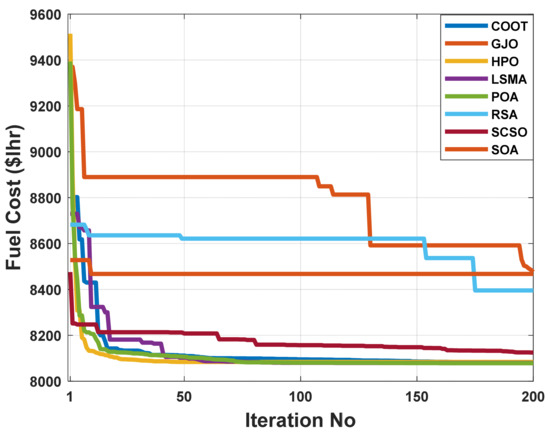
Figure 3.
The convergence characteristics of POA and other compared algorithms for case 1 in a standard IEEE 14-bus test system.
Table 2.
Optimal control variables for IEEE 14-bus test system for minimizing fuel cost.
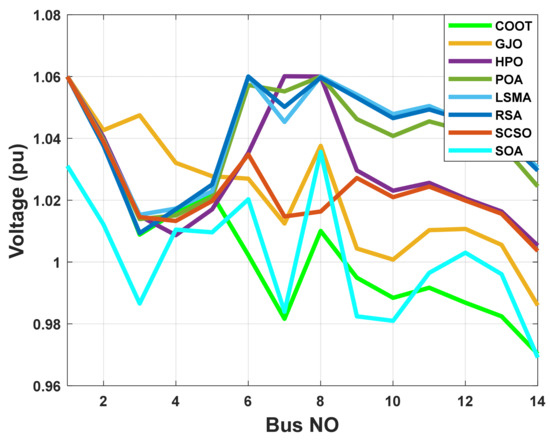
Figure 4.
The voltage profile of the POA and other compared algorithms for case 1 in a standard IEEE 14-bus test system.
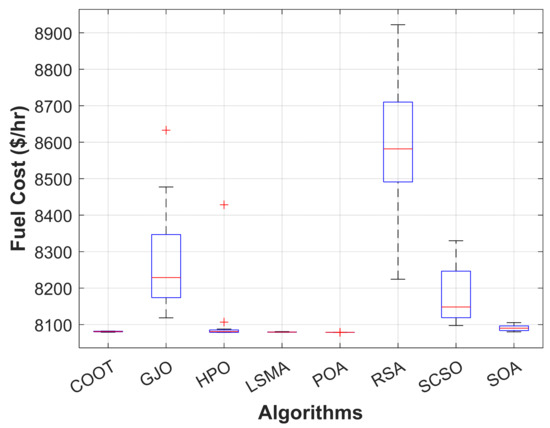
Figure 5.
Boxplot of POA and other compared algorithms for case 1 in a standard IEEE 14-bus test system.
- Case 2: Power Losses Minimization
Real power loss was the desired outcome here. The POA algorithm was utilized to arrive at the most efficient solution, the results of which are given in Table 3. The POA algorithm is extremely useful for establishing the precise settings of the control variable, which diminishes system losses. As a result, when the POA algorithm is used, real power losses are reduced to 0.498 MW. In Figure 6, real power losses utilizing the POA method are steeply convergent while taking other comparative techniques into account. Within 50 iterations, the algorithm reaches the optimum solution, demonstrating how rapidly it converges. The evaluated real power loss is compared to that found before using published population-based optimization techniques in order to assess the performance of the approach. Table 3 demonstrates how the POA algorithm outperforms these prior methods. As shown in Figure 7, heuristic optimization algorithms produce feasible results. The reason for this is the magnitude of voltage accepted on all system load buses. Figure 8 shows a boxplot of results for each approach with further analysis to support the performance of the suggested technique.
Table 3.
Optimal control variables for the IEEE-14 bus test system for minimizing real power loss.
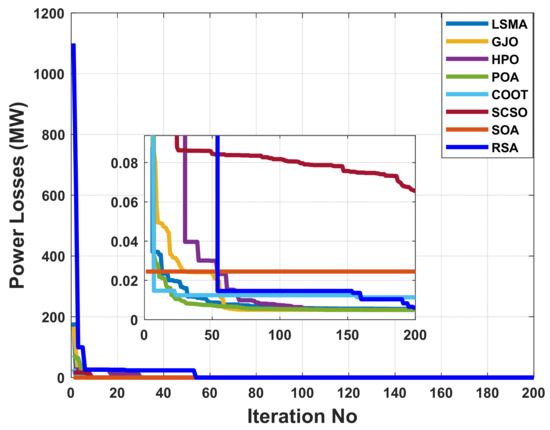
Figure 6.
The convergence characteristics of POA and other compared algorithms for case 2 in a standard IEEE 14-bus test system.
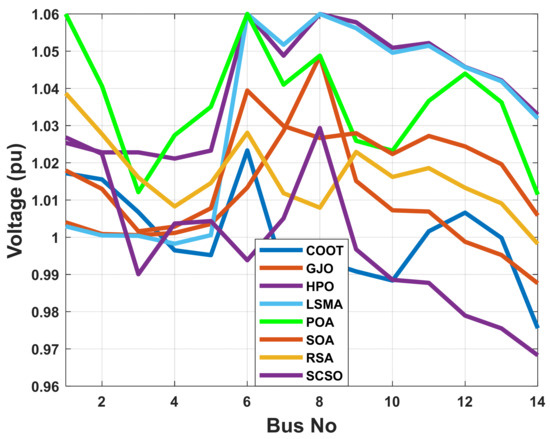
Figure 7.
The voltage profile of the POA and other compared algorithms for case 2 in a standard IEEE 14-bus test system.
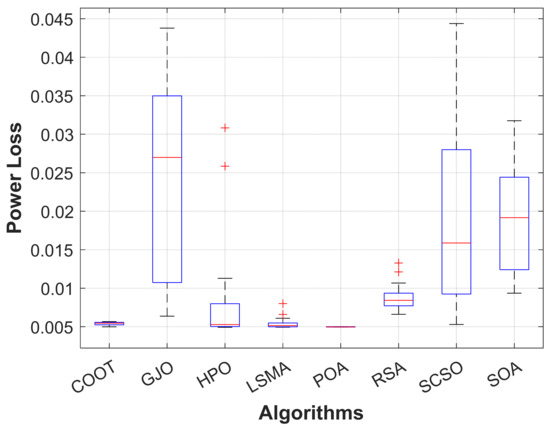
Figure 8.
Boxplot of POA and other compared algorithms for case 2 in a standard IEEE 14-bus test system.
- Case 3: Voltage Deviation Minimization
The aim function to be improved using the POA algorithm in this part is decreasing voltage deviation. In Table 4, it is shown that the voltage deviation index is brought down to 0.032 pu by employing the POA algorithm. The POA method significantly outperforms other population-based optimization strategies in Table 4 and Figure 9 when comparing solutions obtained using these methods. Figure 10 illustrates the voltage profiles of all buses using different proposed methods. Figure 11 displays the boxplots for minimizing the voltage deviation with the lowest values by the proposed POA algorithm.
Table 4.
Optimal control variables for the IEEE 14-bus test system for minimizing voltage deviation.
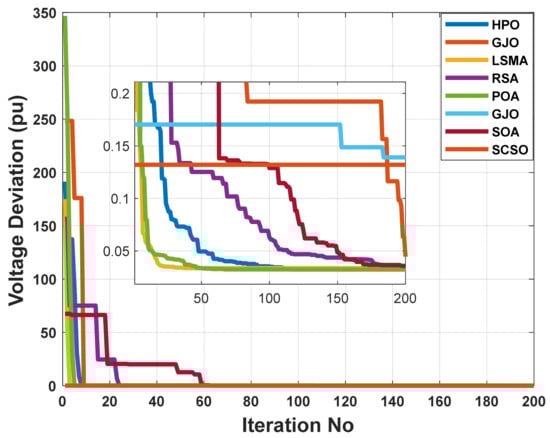
Figure 9.
The convergence characteristics of POA and other compared algorithms for case 3 in a standard IEEE 14-bus test system.
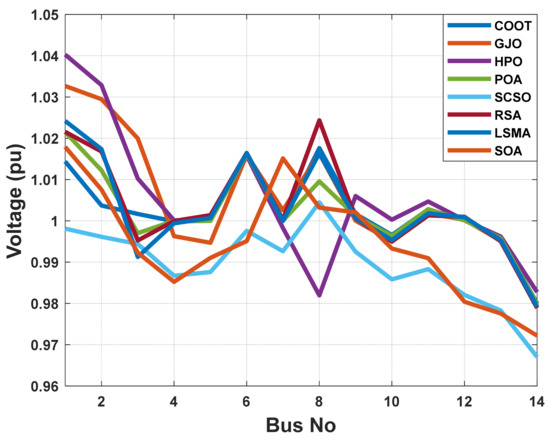
Figure 10.
The voltage profile of the POA and other compared algorithms for case 3 in a standard IEEE 14-bus test system.
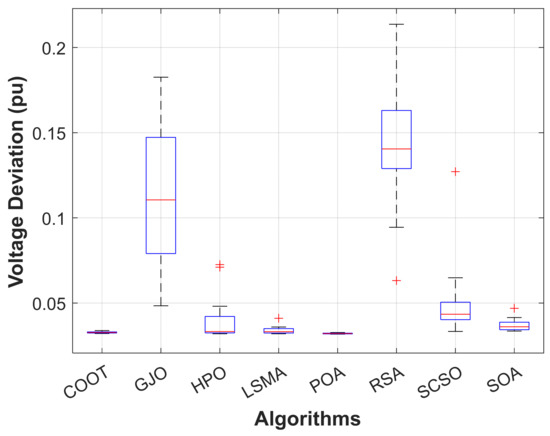
Figure 11.
Boxplot of POA and other compared algorithms for case 3 in a standard IEEE 14-bus test system.
- Case 4: Multi-Objective Function without Emissions Minimization
For maximizing the advantages of the suggested test system, a weighted multi-objective function is provided here that incorporates reduction of fuel operational cost, transmission power loss, and voltage-level deviation. Table 5 illustrates how the multi-objective OPF issue was addressed using the POA and taking other comparative algorithms in the IEEE 14-bus system into account. These results indicate that POA is more efficient than other comparable algorithms for solving the multi-objective OF problem. It has been shown that the total cost function 8106.371 USD/h is superior to all other algorithms, which achieved 8115.557 USD/h, 8183.349 USD/h, 8109.171 USD/h, 8107.896 USD/h, 8394.928 USD/h, 8136.388 USD/h, and 8120.729 USD/h, respectively, by COOT, GJO, HPO, LSMA, RSA, SCSO, and SOA. Figure 12 illustrates that, for all comparison methods, the voltage profiles of all buses are within the predetermined limits, as in prior examples. In addition, Figure 13 demonstrates that despite being compared to other algorithms, the POA still exhibits rapid and smooth convergence properties. When compared to previous approaches, it can be shown that the boxplots of the proposed POA are extremely tight for reducing the OF with the lowest values, as illustrated in Figure 14.
Table 5.
Optimal control variables for the IEEE 14-bus test system for minimizing multi-objective function without emissions.
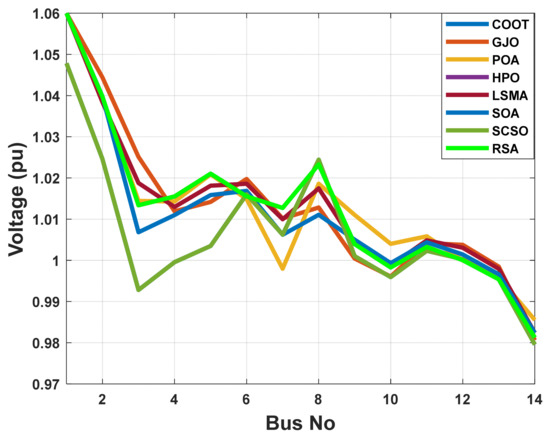
Figure 12.
The voltage profile of the POA and other compared algorithms for case 4 in a standard IEEE 14-bus test system.
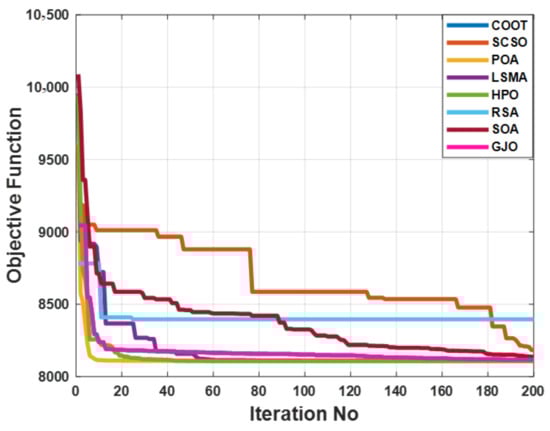
Figure 13.
The convergence characteristics of POA and other compared algorithms for case 4 in a standard IEEE 14-bus test system.
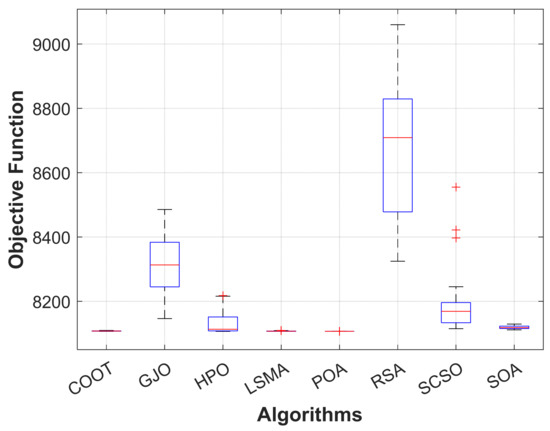
Figure 14.
Boxplot of POA and other compared algorithms for case 4 in a standard IEEE 14-bus test system.
- Case 5: Multi-Objective Function with Emissions Minimization
Table 6 displays the most effective outcomes of using the POA algorithm to solve a multi-objective OPF problem while taking emissions for the IEEE 14-bus testing system into account. The POA outperforms other comparable algorithms, as indicated in this table. Additionally, the POA provides 8106.437 USD/h compared to 8107.453 USD/h, 8502.7213 USD/h, 8114.69152 USD/h, 8107.0404 USD/h, 8303.238 USD/h, 8225.998 USD/h, and 8126.254 USD/h by the COOT, GJO, HPO, LSMA, RSA, SCSO, and SOA, respectively. Figure 15 shows the voltage profile for each bus, and it can be seen that all values are within the set ranges. Additionally, Figure 16 displays the convergence characteristics for this example acquired by POA and other algorithms. As can be seen, POA surpasses all other algorithms due to its rapid speed convergence. As illustrated in Figure 17, the boxplots of the proposed POA are extremely narrow as compared to previous strategies for reducing the OF with the lowest values.
Table 6.
Optimal control variables for the IEEE 14-bus test system for minimizing multi-objective function with emissions.
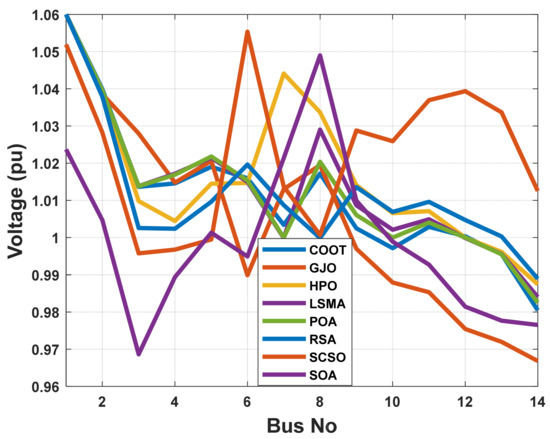
Figure 15.
The voltage profile of the POA and other compared algorithms for case 5 in a standard IEEE 14-bus test system.
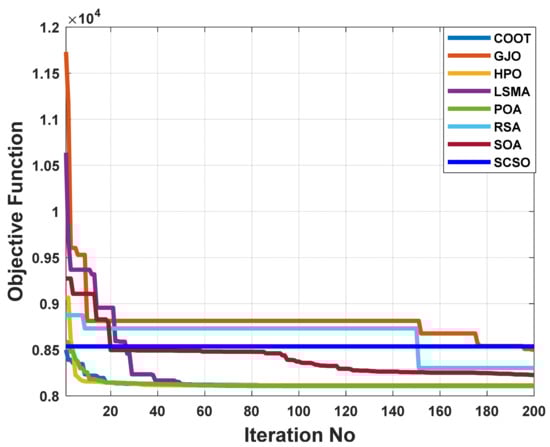
Figure 16.
The convergence characteristics of POA and other compared algorithms for case 5 in a standard IEEE 14-bus test system.
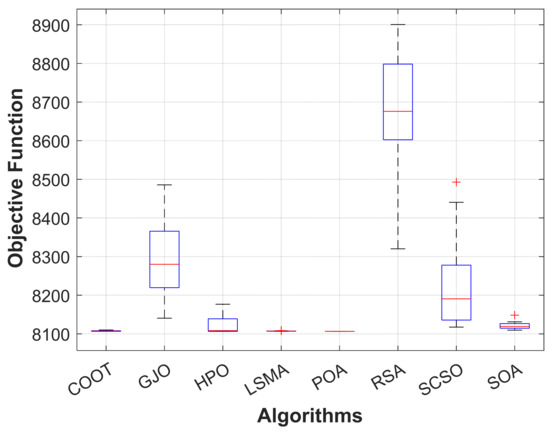
Figure 17.
Boxplot of POA and other compared algorithms for case 5 in a standard IEEE 14-bus test system.
3.2. Standard IEEE 57-Bus Test System
To assess the scalability of the suggested methods, a large-scale IEEE 57-bus test system is taken into consideration. Approximately 1975.9 megawatts are the total capacity of this system as illustrated in Figure 18. This system is made up of seven generators located at buses 1, 2, 3, 6, 8, 9, and 12, and 80 transmission lines.
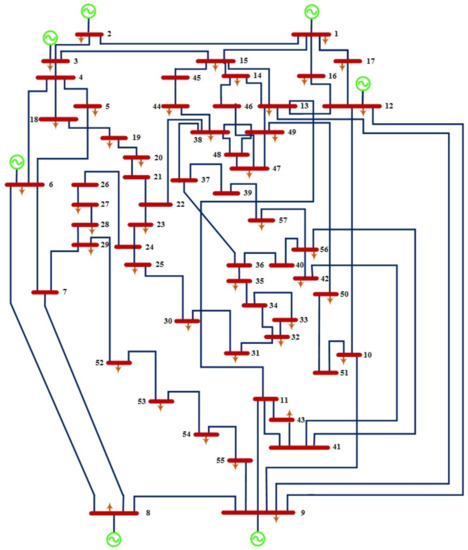
Figure 18.
Standard IEEE 57 bus.
- Case 1: Fuel Cost Minimization
When using the POA algorithm, fuel cost reduction is a target function. Figure 19 depicts the convergence graph of fuel cost reduction using the POA algorithm. The approach needs 40 iterations to get the optimal solution, demonstrating the remarkable convergence rate of the POA algorithm. Table 7 lists the optimal cost-minimization values and the appropriate changes to the design variables. Using the POA algorithm, the findings show a significant reduction in fuel costs to 40687.44 dollars/h. Additionally, for this scenario, the average computing time for a single loop is 2.3 s. These results demonstrate how the POA algorithm performs well in terms of solution optimality and quick convergence. To further verify the effectiveness of the POA method, the fuel cost determined by different alternative heuristic optimization techniques is compared with it. Table 7 shows how superior the POA algorithm is to earlier methods. The majority of solutions found using heuristic optimization techniques are impractical, mainly due to voltage magnitude infringements at one or more system load buses, as shown in Figure 20. Figure 21 displays the boxplots for minimizing the fuel cost with the lowest values by the proposed POA algorithm.
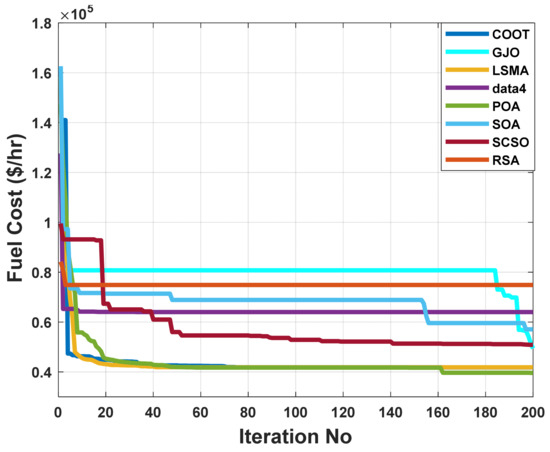
Figure 19.
The convergence characteristics of POA and other compared algorithms for case 1 in a standard IEEE 57-bus test system.
Table 7.
Optimal control variables for IEEE 57-bus test system for minimizing fuel cost.
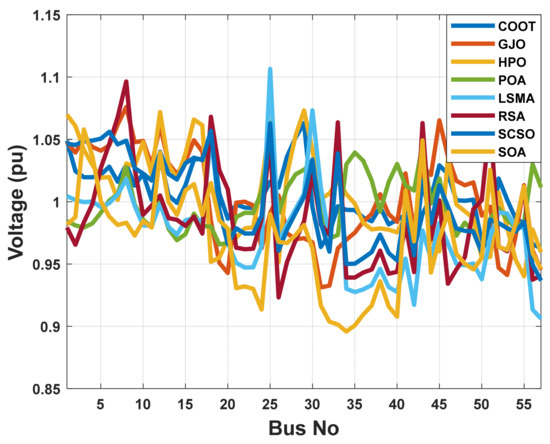
Figure 20.
The voltage profile of the POA and other compared algorithms for case 1 in a standard IEEE 57-bus test system.
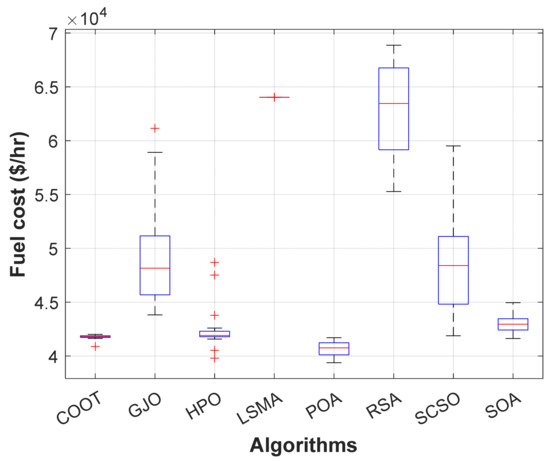
Figure 21.
Boxplot of POA and other compared algorithms for case 1 in a standard IEEE 57-bus test system.
- Case 2: Power Losses Minimization
Real power loss was the desired outcome here. Table 8 shows the results of the POA algorithm used to determine the most appropriate solution. In order to minimize system losses, the POA algorithm is extremely useful for setting the precise parameters of the control variable. Therefore, when the POA algorithm is applied, real power losses are drastically reduced to 17.34087 MW. According to Figure 22, real power losses utilizing the POA method are steeply convergent. Within 20 iterations, the algorithm fully converges to the optimum solution, showing the rapid convergence of the POA algorithm. The evaluated real power loss is compared to that found before using published population-based optimization techniques in order to assess the performance of the approach. Table 8 shows how the POA algorithm outperforms these prior methods. Figure 23 illustrates how most of the solutions found using heuristic optimization techniques are impractical. This is mostly due to voltage magnitude infringements at one or more of the system load buses.
Table 8.
Optimal control variables for the IEEE-57 bus test system for minimizing real power loss.
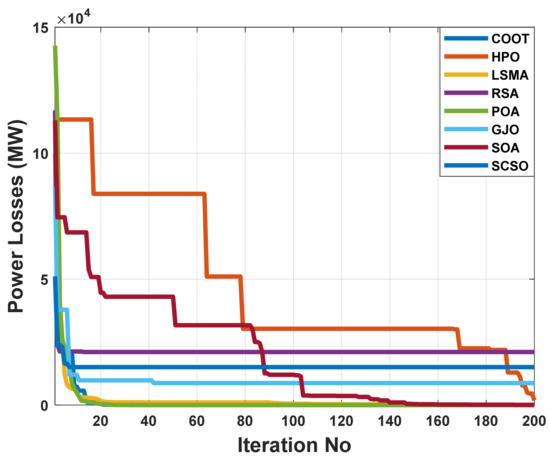
Figure 22.
The convergence characteristics of POA and other compared algorithms for case 2 in a standard IEEE 57-bus test system.
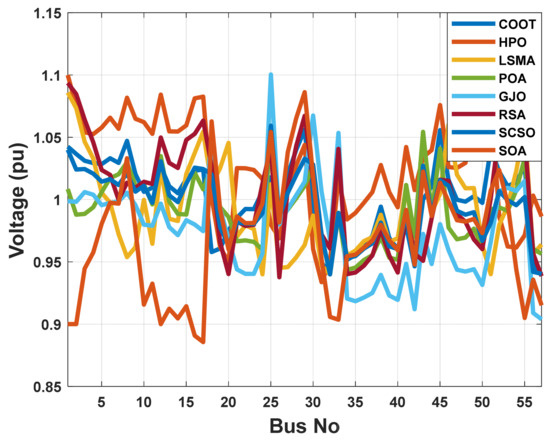
Figure 23.
The voltage profile of the POA and other compared algorithms for case 2 in a standard IEEE 57-bus test system.
- Case 3: Voltage Deviation Minimization
The aim function to be improved using the POA algorithm in this part is decreasing voltage deviation. The voltage profile performance can be illustrated by Figure 24. Figure 25 illustrates the pattern of decreasing system voltage divergence. Table 9 indicates that the voltage deviation index is brought down to 0.755485 pu by using the POA algorithm. The POA method significantly outperforms other population-based optimization strategies in Table 9, which compares solutions obtained using these methods.
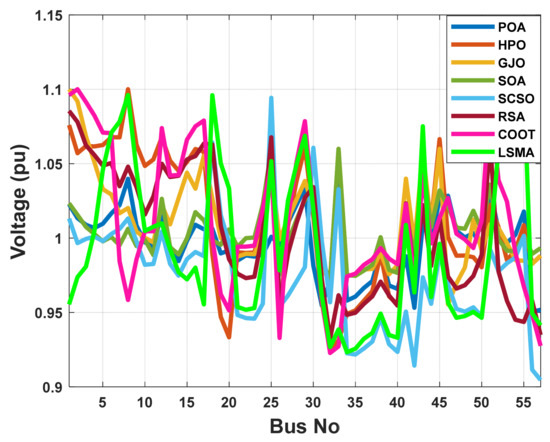
Figure 24.
The voltage profile of the POA and other compared algorithms for case 3 in a standard IEEE 57-bus test system.
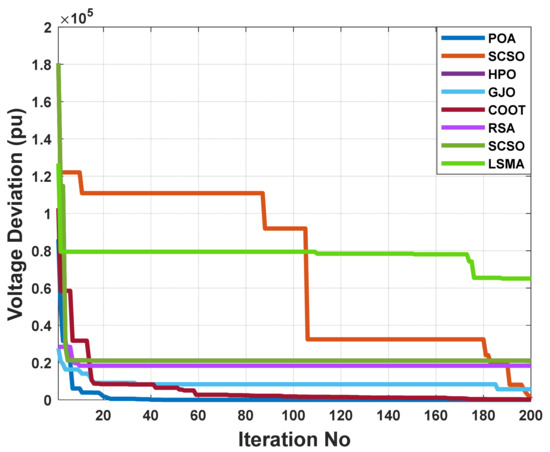
Figure 25.
The convergence characteristics of POA and other compared algorithms for case 3 in a standard IEEE-57 bus test system.
Table 9.
Optimal control variables for the IEEE-57 bus test system for minimizing voltage deviation.
- Case 4: Multi-Objective Function without Emissions Minimization
For maximizing the benefits of the suggested test system, a weighted multi-objective function is provided here. This function combines reductions in fuel operational costs, transmission power losses, and voltage-level deviations. As shown in Table 10, the multi-objective OPF issue has been addressed utilizing the POA and other comparative algorithms within the IEEE 57-bus system. It is evident from these results that POA is more efficient than other comparable algorithms when it comes to solving multi-objective OF problems. There is a superior total cost function of 41,764.3 USD/h compared to all other algorithms, which achieve 41,976.43 USD/h, 43,824.11 USD/h, 42,223.671 USD/h, 64,314.49 USD/h, 63,232.87 USD/h, 45,964.76 USD/h, and 42,897.4 USD/h, respectively, by using COOT, GJO, HPO, LSMA, RSA, SCSO, and SOA. A comparison of the POA with other algorithms demonstrates that the POA exhibits rapid and smooth convergence properties despite being compared with other algorithms as shown in Figure 26. Moreover, Figure 27 illustrates that the voltage profiles of all buses fall within the predetermined limits for POA for all comparison methods.
Table 10.
Optimal control variables for the IEEE 57-bus test system for minimizing multi-objective function without emissions.
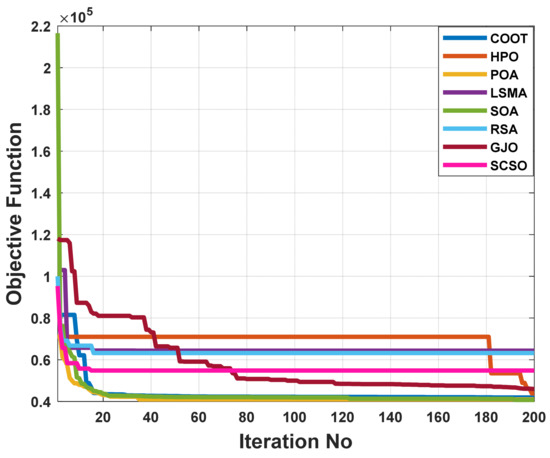
Figure 26.
The convergence characteristics of POA and other compared algorithms for case 4 in a standard IEEE 57- bus test system.
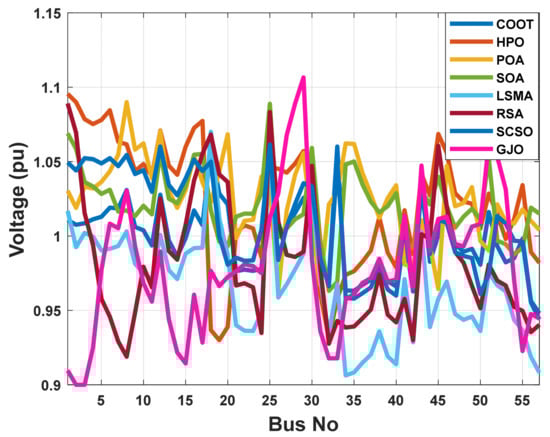
Figure 27.
The voltage profile of the POA and other compared algorithms for case 4 in a standard IEEE 57-bus test system.
- Case 5: Multi-Objective Function with Emissions Minimization
Table 11 displays the most effective outcomes of using the POA algorithm to solve a multi-objective OPF problem while taking emissions for the IEEE 57-bus testing system into account. The POA outperforms other comparable algorithms, as seen in this table. POA is also providing 41,380.89 USD/h against 42,310.05 USD/h, 47,363.09 USD/h, 64,312.7 USD/h, 42,337.87 USD/h, 63,175.39 USD/h, 49,580.09 USD/h, and 43,524.05 USD/h by COOT, GJO, HPO, LSMA, RSA, SCSO, and SOA, respectively. Figure 28 shows the voltage profile for each bus. Additionally, Figure 29 displays the convergence characteristics for this example acquired by POA and other algorithms. As can be seen, POA surpasses all other algorithms due to its rapid speed convergence. As shown in Figure 30, each approach is represented as a boxplot with further analysis supporting its performance.
Table 11.
Optimal control variables for the IEEE 57-bus test system for minimizing multi-objective function with emissions.
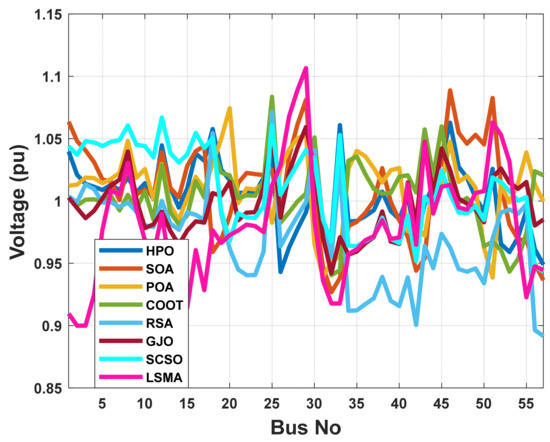
Figure 28.
The voltage profile of the POA and other compared algorithms for case 5 in a standard IEEE 57-bus test system.
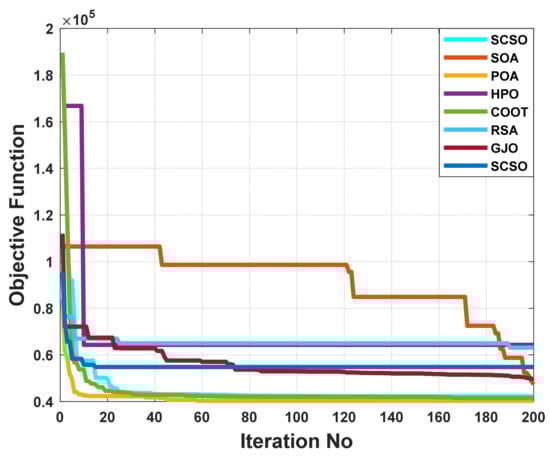
Figure 29.
The convergence characteristics of POA and other compared algorithms for case 5 in a standard IEEE 57-bus test system.
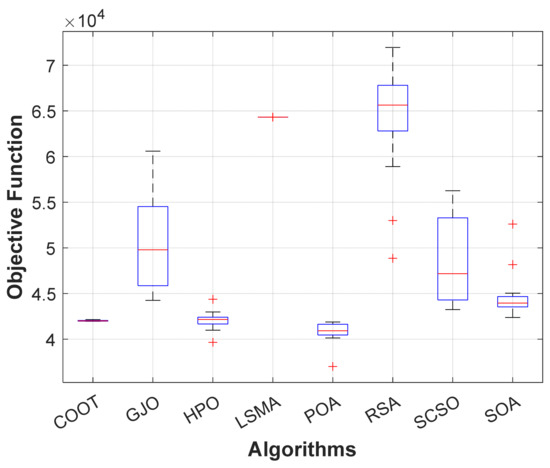
Figure 30.
Boxplot of POA and other compared algorithms for case 5 in a standard IEEE 57-bus test system.
4. Conclusions
In order to address the OPF issue, this study proposes a novel optimization method inspired by peafowl (Pavo muticus/cristatus) called POA. Peafowl swarms demonstrate distinct courting, food-seeking, and chasing behaviors. The following is a summary of the major innovations made in this paper and its results: (a) POA combines global and local exploitation and exploratory searching operators to achieve a reasonable trade-off between the two, and to prevent local optimum formation. There are many examples of peacocks performing rotation dancing operations, peahens and peafowl cubs using adaptive search behavior at various stages of their search, and interactions among peacock species. (b) Instead of remaining motionless, the five peacocks that represent the most effective solutions for today will rotate and dance as they search for solutions throughout the area. Peacocks have a unique rotating dance mechanism that includes two distinct modes of rotation: spinning in-situ and circling the food source. It is significant to note that a strategy is used that forces the present optimal solution to perform a neighboring search which has never been done before. In this way, local optimum situations may be broken out. (c) Both peahens and peafowl cubs employ adaptive seeking and approaching mechanisms during the entire search process in order to dynamically alter their behavior at various stages, thus ensuring a healthy balance between local exploitation and global exploration. (d) A number of analyses were conducted in order to demonstrate the effectiveness and reliability of the proposed POA. According to the simulation results, POA typically explores the optimal searching regions and provides the most appropriate overall answers. (e) POA is used in the estimation of control variables in practical engineering applications to verify its performance in real-world scenarios. Actual case studies have shown that POA outperforms other algorithms in terms of estimation accuracy, convergence speed, and stability.
This study was worthwhile, but there are some critical issues that need to be addressed in the next study. Firstly, it would be possible to address the limitations and restrictions of the proposed technique by reducing the complexity of parameter tweaking. Secondly, in this paper, multi-objective optimization problems are simplified by converting them to a single item before carrying out the actual optimization operation by constructing a weighted sum of all the objectives. The major advantage of the weighted sum method is its ability to identify a single unique solution for actual implementation. In the future, the authors will use the well-known ε-constraint method to generate multiple Pareto optimal solutions. With regard to future extensions of this work, the authors will add some indices such as VSI, and use the Pareto state for the proposed multi-objective function optimization problem. According to the previous discussion that illustrated the developed POA’s superiority, it can open a wide range of future works. In the future, it should be possible to address the limitations and restrictions of the proposed technique. The complexity of parameter tweaking might be further reduced, and the implementation of online estimation may be more challenging. The study of the OPF problem while considering degradation processes is an insightful and fruitful study area that will prove crucial for engineering applications, such as state-of-health monitoring and performance prediction. It can also be extended to real-world applications such as energy management and load management, conventional and smart grid applications, industry and engineering applications, and smart home applications.
Author Contributions
Conceptualization, M.A.T., M.H.A. and A.M.E.-R.; methodology, M.H.A. and M.A.T.; software, M.H.A.; validation, A.M.E.-R., V.N.T. and A.A.F.Y.; formal analysis, M.A.T.; investigation, M.H.A. and M.A.T.; resources, A.M.E.-R., V.N.T. and A.A.F.Y.; data curation, M.H.A. and M.A.T.; writing—original draft preparation, M.H.A. and M.A.T.; writing—review and editing, A.M.E.-R., V.N.T. and A.A.F.Y.; visualization, M.H.A. and M.A.T.; supervision, V.N.T. and A.M.E.-R.; project administration, M.A.T. and M.H.A.; funding acquisition, A.M.E.-R. and A.A.F.Y. All authors have read and agreed to the published version of the manuscript.
Funding
This research received no external funding.
Institutional Review Board Statement
Not applicable.
Informed Consent Statement
Not applicable.
Data Availability Statement
Not applicable.
Conflicts of Interest
The authors declare no conflict of interest or non-financial competing interest.
References
- Tolba, M.A.; Houssein, E.H.; Eisa, A.A.; Hashim, F.A. Optimizing the distributed generators integration in electrical distribution networks: Efficient modified forensic-based investigation. Neural Comput. Appl. 2022, 2022, 1–36. [Google Scholar] [CrossRef]
- Roberge, V.; Tarbouchi, M.; Okou, F. Optimal power flow based on parallel metaheuristics for graphics processing units. Electr. Power Syst. Res. 2016, 140, 344–353. [Google Scholar] [CrossRef]
- Zia, U.; Elkadeem, M.R.; Wang, S.; Azam, M.; Shaheen, K.; Hussain, M.; Rizwan, M. A Mini-review: Conventional and Metaheuristic Optimization Methods for the Solution of Optimal Power Flow (OPF) Problem. In Proceedings of the International Conference on Advanced Information Networking and Applications, Caserta, Italy, 15–17 April 2020; Springer: Berlin/Heidelberg, Germany, 2020; pp. 308–319. [Google Scholar]
- Ali, M.H.; Mehanna, M.; Othman, E. Optimal planning of RDGs in electrical distribution networks using hybrid SAPSO algorithm. IJECE 2020, 10, 6153–6163. [Google Scholar] [CrossRef]
- Ali, M.H.; Kamel, S.; Hassan, M.H.; Tostado-Véliz, M.; Zawbaa, H.M. An improved wild horse optimization algorithm for reliability based optimal DG planning of radial distribution networks. Energy Rep. 2022, 8, 582–604. [Google Scholar] [CrossRef]
- Ali, M.H.; Salawudeen, A.T.; Kamel, S.; Salau, H.B.; Habil, M.; Shouran, M. Single-and Multi-Objective Modified Aquila Optimizer for Optimal Multiple Renewable Energy Resources in Distribution Network. Mathematics 2022, 10, 2129. [Google Scholar] [CrossRef]
- Kusakana, K. Optimal scheduled power flow for distributed photovoltaic/wind/diesel generators with battery storage system. IET Renew. Power Gener. 2015, 9, 916–924. [Google Scholar] [CrossRef]
- Dubey, H.M.; Pandit, M.; Panigrahi, B.K. Hybrid flower pollination algorithm with time-varying fuzzy selection mechanism for wind integrated multi-objective dynamic economic dispatch. Renew. Energy 2015, 83, 188–202. [Google Scholar] [CrossRef]
- Warid, W.; Hizam, H.; Mariun, N.; Abdul-Wahab, N.I. Optimal power flow using the Jaya algorithm. Energies 2016, 9, 678. [Google Scholar] [CrossRef]
- Biswas, P.P.; Suganthan, P.N.; Amaratunga, G.A.J. Optimal power flow solutions incorporating stochastic wind and solar power. Energy Convers. Manag. 2017, 148, 1194–1207. [Google Scholar] [CrossRef]
- Khaled, U.; Eltamaly, A.M.; Beroual, A. Optimal power flow using particle swarm optimization of renewable hybrid distributed generation. Energies 2017, 10, 1013. [Google Scholar] [CrossRef]
- Majumdar, K.; Das, P.; Roy, P.K.; Banerjee, S. Solving OPF problems using biogeography based and grey wolf optimization techniques. IJEOE 2017, 6, 55–77. [Google Scholar] [CrossRef]
- Fathy, A.; Abdelaziz, A. Single-objective optimal power flow for electric power systems based on crow search algorithm. Arch. Electr. Engin. 2018, 67, 123–138. [Google Scholar]
- Pulluri, H.; Naresh, R.; Sharma, V. A solution network based on stud krill herd algorithm for optimal power flow problems. Soft Comput. 2018, 22, 159–176. [Google Scholar] [CrossRef]
- Elattar, E.E.; ElSayed, S.K. Modified JAYA algorithm for optimal power flow incorporating renewable energy sources considering the cost, emission, power loss and voltage profile improvement. Energy 2019, 178, 598–609. [Google Scholar] [CrossRef]
- Khan, I.U.; Javaid, N.; Gamage, K.A.A.; Taylor, C.J.; Baig, S.; Ma, X. Heuristic algorithm based optimal power flow model incorporating stochastic renewable energy sources. IEEE Access 2020, 8, 148622–148643. [Google Scholar] [CrossRef]
- Abdollahi, A.; Ghadimi, A.A.; Miveh, M.R.; Mohammadi, F.; Jurado, F. Optimal power flow incorporating FACTS devices and stochastic wind power generation using krill herd algorithm. Electronics 2020, 9, 1043. [Google Scholar] [CrossRef]
- Al-Kaabi, M.; Al-Bahrani, L. Modified artificial bee colony optimization technique with different objective function of constraints optimal power flow. Int. J. Intell. Eng. Syst. 2020, 13, 378–388. [Google Scholar] [CrossRef]
- Hossain, M.A.; Sallam, K.M.; Elsayed, S.S.; Chakrabortty, R.K.; Ryan, M.J. Optimal power flow considering intermittent solar and wind generation using multi-operator differential evolution algorithm. Preprints 2021, 2021, 2021030228. [Google Scholar] [CrossRef]
- Sulaiman, M.H.; Mustaffa, Z. Solving optimal power flow problem with stochastic wind–solar–small hydro power using barnacles mating optimizer. Control Eng. Pract. 2021, 106, 104672. [Google Scholar] [CrossRef]
- Gupta, S.; Kumar, N.; Srivastava, L.; Malik, H.; Anvari-Moghaddam, A.; Márquez, F.P.G. A robust optimization approach for optimal power flow solutions using Rao algorithms. Energies 2021, 14, 5449. [Google Scholar] [CrossRef]
- Duong, T.L.; Nguyen, N.A.; Nguyen, T.T. Application of Meta-Heuristic Algorithm for Finding the Best Solution for the Optimal Power Flow Problem. Int. J. Intell. Eng. Syst. 2021, 14, 2021. [Google Scholar]
- Daqaq, F.; Ouassaid, M.; Ellaia, R. A new meta-heuristic programming for multi-objective optimal power flow. Electr. Eng. 2021, 103, 1217–1237. [Google Scholar] [CrossRef]
- Chia, S.J.; Abd Halim, S.; Rosli, H.M.; Kamari, N.A.M. Power Loss Minimization using Optimal Power Flow based on Firefly Algorithm. Int. J. Adv. Comput. Sci. Appl. 2021, 12, 9. [Google Scholar]
- Ahmed, M.K.; Osman, M.H.; Shehata, A.A.; Korovkin, N.V. A solution of optimal power flow problem in power system based on multi objective particle swarm algorithm. In Proceedings of the 2021 IEEE Conference of Russian Young Researchers in Electrical and Electronic Engineering (ElConRus), Moscow, Russia, 26–29 January 2021; pp. 1349–1353. [Google Scholar]
- Farhat, M.; Kamel, S.; Atallah, A.M.; Khan, B. Optimal power flow solution based on jellyfish search optimization considering uncertainty of renewable energy sources. IEEE Access 2021, 9, 100911–100933. [Google Scholar] [CrossRef]
- Ali, M.H.; Soliman, A.M.A.; Elsayed, S.K. Optimal power flow using Archimedes optimizer algorithm. Int. J. Power Electron. Drive Syst. 2022, 13, 1390–1405. [Google Scholar] [CrossRef]
- Farhat, M.; Kamel, S.; Atallah, A.M.; Hassan, M.H.; Agwa, A.M. ESMA-OPF: Enhanced slime mould algorithm for solving optimal power flow problem. Sustainability 2022, 14, 2305. [Google Scholar] [CrossRef]
- El-Dabah, M.; Ebrahim, M.A.; El-Sehiemy, R.A.; Alaas, Z.; Ramadan, M.M. A Modified Whale Optimizer for Single-and Multi-Objective OPF Frameworks. Energies 2022, 15, 2378. [Google Scholar] [CrossRef]
- Li, S.; Gong, W.; Wang, L.; Gu, Q. Multi-objective optimal power flow with stochastic wind and solar power. Appl. Soft Comput. 2022, 114, 108045. [Google Scholar] [CrossRef]
- Wang, J.; Yang, B.; Chen, Y.; Zeng, K.; Zhang, H.; Shu, H.; Chen, Y. Novel phasianidae inspired peafowl (Pavo muticus/cristatus) optimization algorithm: Design, evaluation, and SOFC models parameter estimation. Sustain. Energy Technol. Assess. 2022, 50, 101825. [Google Scholar] [CrossRef]


Disclaimer/Publisher’s Note: The statements, opinions and data contained in all publications are solely those of the individual author(s) and contributor(s) and not of MDPI and/or the editor(s). MDPI and/or the editor(s) disclaim responsibility for any injury to people or property resulting from any ideas, methods, instructions or products referred to in the content. |
© 2023 by the authors. Licensee MDPI, Basel, Switzerland. This article is an open access article distributed under the terms and conditions of the Creative Commons Attribution (CC BY) license (https://creativecommons.org/licenses/by/4.0/).