Article

Preparation and Numerical Optimization of TiO2:CdS Thin Films in Double Perovskite Solar Cell

1
Centre of Excellence in Solid State Physics, University of the Punjab, Lahore 54590, Pakistan
2
Wet Chemistry Laboratory, Department of Metallurgical Engineering, NED University of Engineering and Technology, Karachi 75720, Pakistan
3
Department of Physics, University of the Punjab, Lahore 54590, Pakistan
4
Department of Basic Science and Humanities, Dawood University of Engineering and Technology, Karachi 74800, Pakistan
5
Department of Mechanical & Energy Systems Engineering, Faculty of Engineering and Informatics, University of Bradford, Bradford BD7 1DP, UK
6
Department of Physics and Astronomy, College of Science, King Saud University, Riyadh 11451, Saudi Arabia
*
Author to whom correspondence should be addressed.
Energies 2023, 16(2), 900; https://doi.org/10.3390/en16020900
Submission received: 28 November 2022 / Revised: 28 December 2022 / Accepted: 9 January 2023 / Published: 12 January 2023
(This article belongs to the Special Issue Advances in Nanomaterials for Perovskite Photovoltaic Devices)

Abstract

:
This work focuses on preparing TiO2, CdS, and composite TiO2:CdS thin films for photovoltaic applications by thermal evaporation. The suggested materials exhibit very good optical and electrical properties and can play a significant role in enhancing the efficiency of the device. Various microscopy and spectroscopy techniques were considered to investigate the optical, morphological, photoluminescence, and electrical properties. FTIR confirms the material identification by displaying some peaks in the fingerprint region. UV Vis spectroscopy yields high transmission (80–90%) and low absorbance (5–10%) within the spectral region from 500 nm to 800 nm for the composite thin films. The optical band gap values for CdS, TiO2, and TiO2:CdS thin films are 2.42 eV, 3.72 eV, and 3.6 eV. XRD was utilized to analyze the amorphous nature of the thin films, while optical and SEM microscopy were employed to examine the morphological changes caused by the addition of CdS to TiO2. The decrease in the bandgap of the composite thin films was determined by the Tauc plot, which is endorsed due to the band tailing effects. Photoluminescence spectroscopy depicts several emission peaks in the visible region when they are excited at different wavelengths, and the electrical measurement enhances the material conductivity. Furthermore, the proposed electron transport materials (TiO2, CdS, TiO2:CdS) were simulated with different perovskite materials to validate their design by employing the SCAPS-1D program and assess their performance in commercial implementation. The observed results suggest that TiO2:CdS is a promising candidate to be used as an ETM in PSC with enhanced productivity.

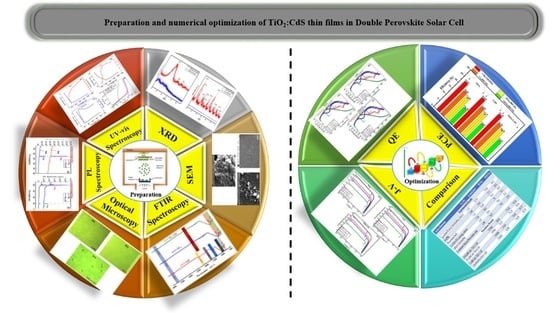
Graphical Abstract

1. Introduction

Titanium dioxide (TiO2) nanomaterials are renowned for their wide range of applications, such as in the photovoltaic, photocatalytic degradation of pollutants, water purification, solar cell, biosensing, and drug delivery, due to their wide bandgap and good optical and electrical properties [1,2,3,4,5,6]. Cadmium sulphide (CdS), a semiconductor compound with a direct bandgap of 2.4 eV, has also drawn considerable interest for a variety of applications, including in photovoltaic devices, photodetectors, light emitting diodes (LEDs), optical filters, and transistors [7,8]. TiO2:CdS thin films may be produced using various techniques, including the sol-gel method, chemical vapor deposition (CVD), and physical vapor deposition (PVD). However, due to them being simple and affordable, thermal evaporation was chosen by the researchers, and it has received a lot of attention due to its capability as an electrode, electron transport material (ETM), and transparent conducting oxide film (TCO) in solar cells [9,10,11,12].
Photovoltaic (PV) development has been exponentially accelerated by the global, escalating energy demand. PSCs have emerged as a promising PV technology due to their excellent optical and electronic properties. Materials that are made of perovskite have been well understood for a long time. Kojima et al. from the Tokyo-based collaboration of Tsutomu Miyasaka created the first perovskite solar cell in 2006 with a PCE of 2.2% [13]. After a few years, they enhanced it to 3.8% [14]. In 2011, a perovskite cell with a nanocrystal size of 2–3 nm attained an efficiency (PCE) of 6.54% within two years [15]. Although there has been a tremendous increase in PSC efficiency and productivity over the previous decade, the current PSC efficiencies have not yet exceeded the maximum theoretical limit [16,17]. One-dimensional (or 1D) nanostructured oxides, such as rutile TiO2, ZnO, and SnO2 nanorods, have been suggested to be potentially better ETMs for highly efficient perovskite devices since the 1D structure theoretically benefits both charge transport and light transmission [18]. In photovoltaic (PV) applications, anatase TiO2 performs better than rutile TiO2 does [19] due to its increased capacity to transport electrons and more acceptable energy levels. However, because of their simplicity in their synthesis, 1D rutile TiO2 nanostructures have been widely employed as ETMs in PSCs. The efficiency of the PSC device is also significantly impacted by the ETM’s design and fabrication [20].
In PSCs, TiO2 is the most widely used ETM, [21,22] although the use of other oxide materials, such as SnO2 [23], ZnO [24,25], Zn2SnO4 [26], and BaSnO3, [27,28], TiO2/SnO2[29], TiO2/ZnO [30], and NiO/TiO2 [31], has also been reported in the literature. Several reports also detail the use of CdS as an ETM in perovskite solar cells and as a buffer layer in CIGS- and CdTe-based solar cells [32,33,34,35]. Numerous TiO2 nanostructures are superior perovskite scaffolds. The extraction of photoinduced electrons from perovskite and subsequent transport of those electrons to an electrode are crucial functions of these TiO2 nanostructures. It was discovered that the TiO2 nanostructure’s crystal phase, morphologies, wettability, and surface states significantly impact the photovoltaic performance of PSCs.
SCAPS-1D has been extensively utilized to examine thin film and planar solar cells to discover how the cell architecture and material properties impact the cells’ performance. Lin et al. designed the PSC structure without the hole transport layer by utilizing the SCAPS simulator and achieved more than 15% efficiency under optimized conditions [36]. S. Chakraborty et al. evaluated the impact of temperature and thickness variations on the performance of a Cs2TiX6-based PSC. They found that the active layer thickness and temperature significantly impacted the efficiency of perovskite solar cells [37]. Karthick et al. fabricated formamidinium-based perovskite cells and studied the effect of series and shunt resistance on the performance of PSC. They obtained a maximum PCE of 21.4%, theoretically, and 15.1%, practically [38]. Nowsherwan et al. made a double perovskite solar cell that did not use a lead component. They studied the effects of different HTMs under the best conditions and obtained an efficiency of more than 24% [39]. Abdel Aziz et al. evaluated and modeled tin-based PSC and obtained a PCE of 14.03% under optimized parameters [40]. Sajjad Hussain et al. designed a lead-free double PSC that yielded a productivity of 24.98% at a photoactive layer thickness of 300 nm [41]. Kumar et al. structured tin-based lead-free PSC and obtained an enhanced output parameters short-circuit current density (Jsc) of 31.20 mA/cm2, an open-circuit voltage (Voc) of 1.81 V, a fill factor (%FF) of 33.72%, and a power conversion efficiency (PCE) of 19.08% after evaluating the best possible parameters [42]. K. Sobayel et al. studied the defects in a tin-based PSC constructed using the SCAPS program and achieved a PCE value of more than 20% under optimum conditions [43]. With the aid of SCAPS, S.Z. Haider and colleagues constructed perovskite solar using CuI as a hole-extracting material that gives a PCE of 21.32% and an FF of 84.53% under optimum conditions [44].
The primary goal of this research was to investigate the optical and electrical properties of TiO2 and TiO2:CdS thin films produced by thermal evaporation to evaluate their efficacy as a viable electron transport medium. The purpose of incorporating CdS into TiO2 was to enhance the transmission, photoconductivity, and optical bandgap to generate a more efficient electron transport layer for the PSC. Moreover, we modelled the suggested electron transport materials (TiO2, CdS, TiO2:CdS) with several perovskite materials using the SCAPS-1D program to confirm their design and assess their performance in a practical application.

2. Experimental

2.1. Sample Preparation

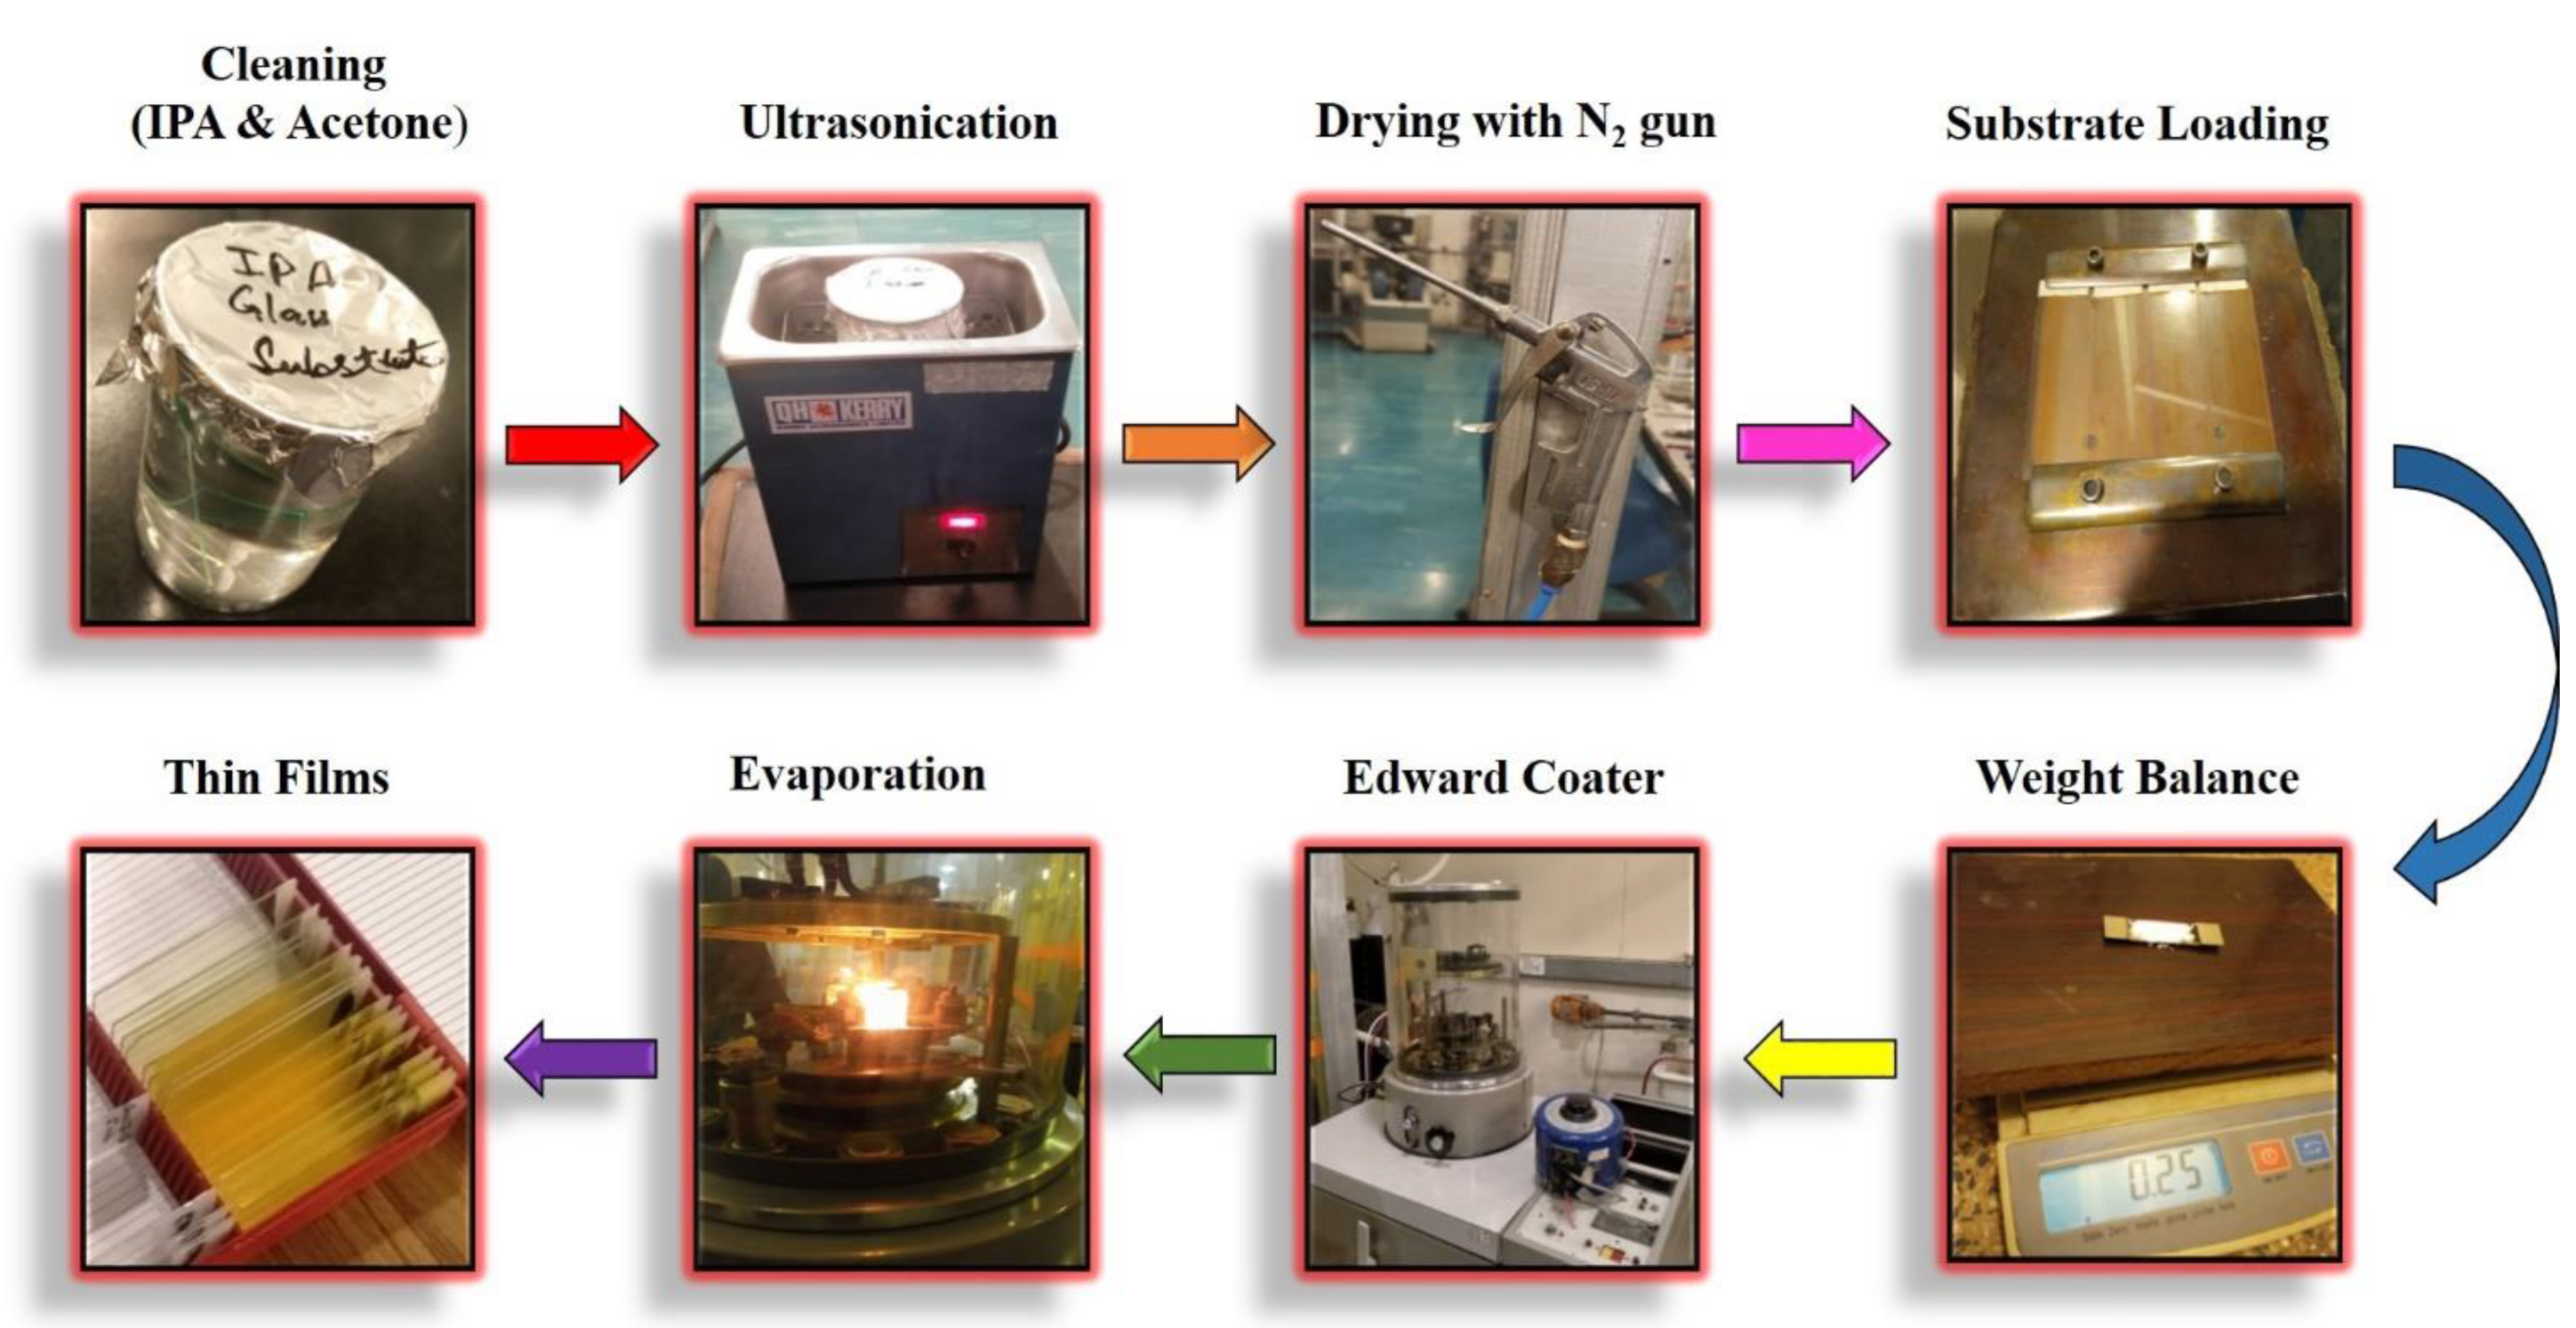
Thermal evaporation is carried out using Edward Coater 306 to fabricate the required thin films. It is a type of physical vapor deposition technique that passes an electric current through a source at low pressure. The schematic representation of thermal evaporation is represented in Figure 1. Evaporation is achievable by producing contact between the source material concerning a surface that is resistively heated through the passage of current [45]. The cleaning of the glass substrates was performed in different steps. Firstly, the glass substrates were cleaned with acetone in an ultrasonic bath for 15 min. Next, these substrates were placed in the beaker containing IPA and kept in the ultrasonic bath for 15 min [46]. The substrates were dried using a nitrogen gun to avoid contamination and eliminate the IPA (Iso Propyl Alcohol) on the substrates, and then, they were placed on a substrate holder. TiO2 and (TiO2)0.7:CdS0.3 (0.25 g) was put in a tungsten boat, and then deposited using the thermal evaporation process by applying an electric current of 50A through a filament at a pressure of about 2 × 10⁻⁵ Torr. The substrate was placed directly above the source at a distance of about 22 cm. The deposition time for all of the samples was maintained at 5 min. The main steps involved in the fabrication of thin films are illustrated in Figure 2.

2.2. Characterization

UV-Vis Shimadzu 1800 was utilized to determine the optical properties of the deposited thin films. This technique measures a sample’s absorbance and scattering of light [47,48]. The resulting spectrum has a 200–1200 nm wavelength range. It provides data on bandgap, absorption, and transmission. The X-ray diffraction technique examines the crystal structure of the deposited thin films. The Cu Kα radiation at the 1.5406 Å wavelength was used to evaluate X-ray diffraction data recorded using the Bruker D8 Advance [49]. The Xpert high score program was used to evaluate the crystal structure of the deposited thin films. The Agilent Carry 630 FTIR spectrometer was used to perform the FTIR. It is a quick and non-destructive method for identifying the presence of chemical bonding in a substance [50,51]. This method typically captures the spectra between 400 and 4000 cm−1. The detector’s output signal acts as the specimen fingerprint and aids in identifying the substance.
The FS5 spectrofluorometer was used to study the deposited thin film’s photoluminescence characteristics [51,52]. It uses fluorescence spectra to provide information regarding the bandgap, chromaticity, and excitation and emission spectra for the substances with a certain composition. The output is calculated by graphing the photon count against the emission wavelength. It encompassed the 200–1000 nm spectral range. Every aspect of the FS5 is fully computer controlled, including the excitation and emission monochromators, bandwidth, and xenon arc lamp. An optical microscope (NOVEX HOLLAND) associated with an integrated CCD camera was used to investigate the micro-topography of the deposited thin films at a magnification of 1000×. The magnification of tiny samples is often accomplished using a lens system and visible light. Additionally, standard light-sensitive cameras can be used to capture micrographs using an optical microscope [53,54]. The SEM analysis was performed using the ZEISS instrument and TESCAN Mira 3 field emission microscope. It is the most often used surface analysis approach for generating high-resolution surface texture and roughness images. The Van der Pauw (VDP) measures the electrical parameters (i.e., average resistivity, mobility, and Hall coefficient) by applying current and monitors voltage along the sample’s perimeter. It enables the evaluation of irregular forms and more typical structures [55].

3. Numerical Modeling of Double Perovskite Solar Cell

Herein, SCAPS (version 3.3.07) was used to design and analyze the simulated photovoltaic cell in various segments [38]. The user is given access to several panels inside the application, enabling them to adjust the settings and form opinions on the outcome. Specifically, Poisson’s and Continuity differential equations serve as the foundation for this software application. These can be mathematically written as:
d dx ϵ x d φ dx = q   p   x n   x + N d + x N a x + p t x n t x
dp n dt = G p p n p n 0 τ p p n µ p dE dx µ p E dp n dx + D p d 2 p n dx 2
dn p dt = G n n p n p 0 τ n + n p µ n dE dx + µ n E dn p dx + D n d 2 n p dx 2
where:
ϵ = dielectric constant;
q = electron charge;
G = Rate of generation;
D = Coefficient of diffusion;
φ = Electrostatic potential;
E = Electric field;
µ n = Electron mobility;
µ p = Hole mobility;
x = thickness;
p(x) = allowed concentration of the holes;
n(x) = allowed concentration of the electrons;
p t x = captured holes;
n t ( x ) = captured electrons;
N d + = Ionized doping concentration of the donor;
N a = Ionized doping concentration of the acceptor;
τ p = lifetime of the hole;
τ n = lifetime of the electron.
Together with the necessary boundary conditions at the interfaces and contacts, these equations produce a system of linked differential equations in the bulk of the layers. This system’s steady state and small signal solutions are computed numerically using SCAPS.
The solution of these differential equations is accomplished by using Gummel-type iteration and numerical differentiation methods, which is the basic concept of this application [56,57]. The numerical panel’s convergence settings include the parameters of this technique. At the start point, each computation begins, given that there is no potential drop over the structure and that the quasi-Fermi levels are all at 0. It is employed as a first estimation, with no illumination and voltage to being used obtain to the equilibrium condition. Under the working point conditions, this equilibrium condition is utilized as an initial approximation to compute the solution. However, the short circuit condition is estimated in a preliminary stage to act as the next initial assumption when the lighting is turned on.
The heterojunction structure that has been carried out in this study is a double perovskite solar cell (d-PSC) cell structure that includes the perovskite material as a photo-harvesting layer. The device contains an absorber layer, HTL (Spiro-MeOTAD), an ETL (TiO2, CdS, TiO2:CdS), transparent conducting oxide (FTO), and a metal contact (Au), as illustrated in Figure 3.

4. Results and Discussion

4.1. UV-Vis Results

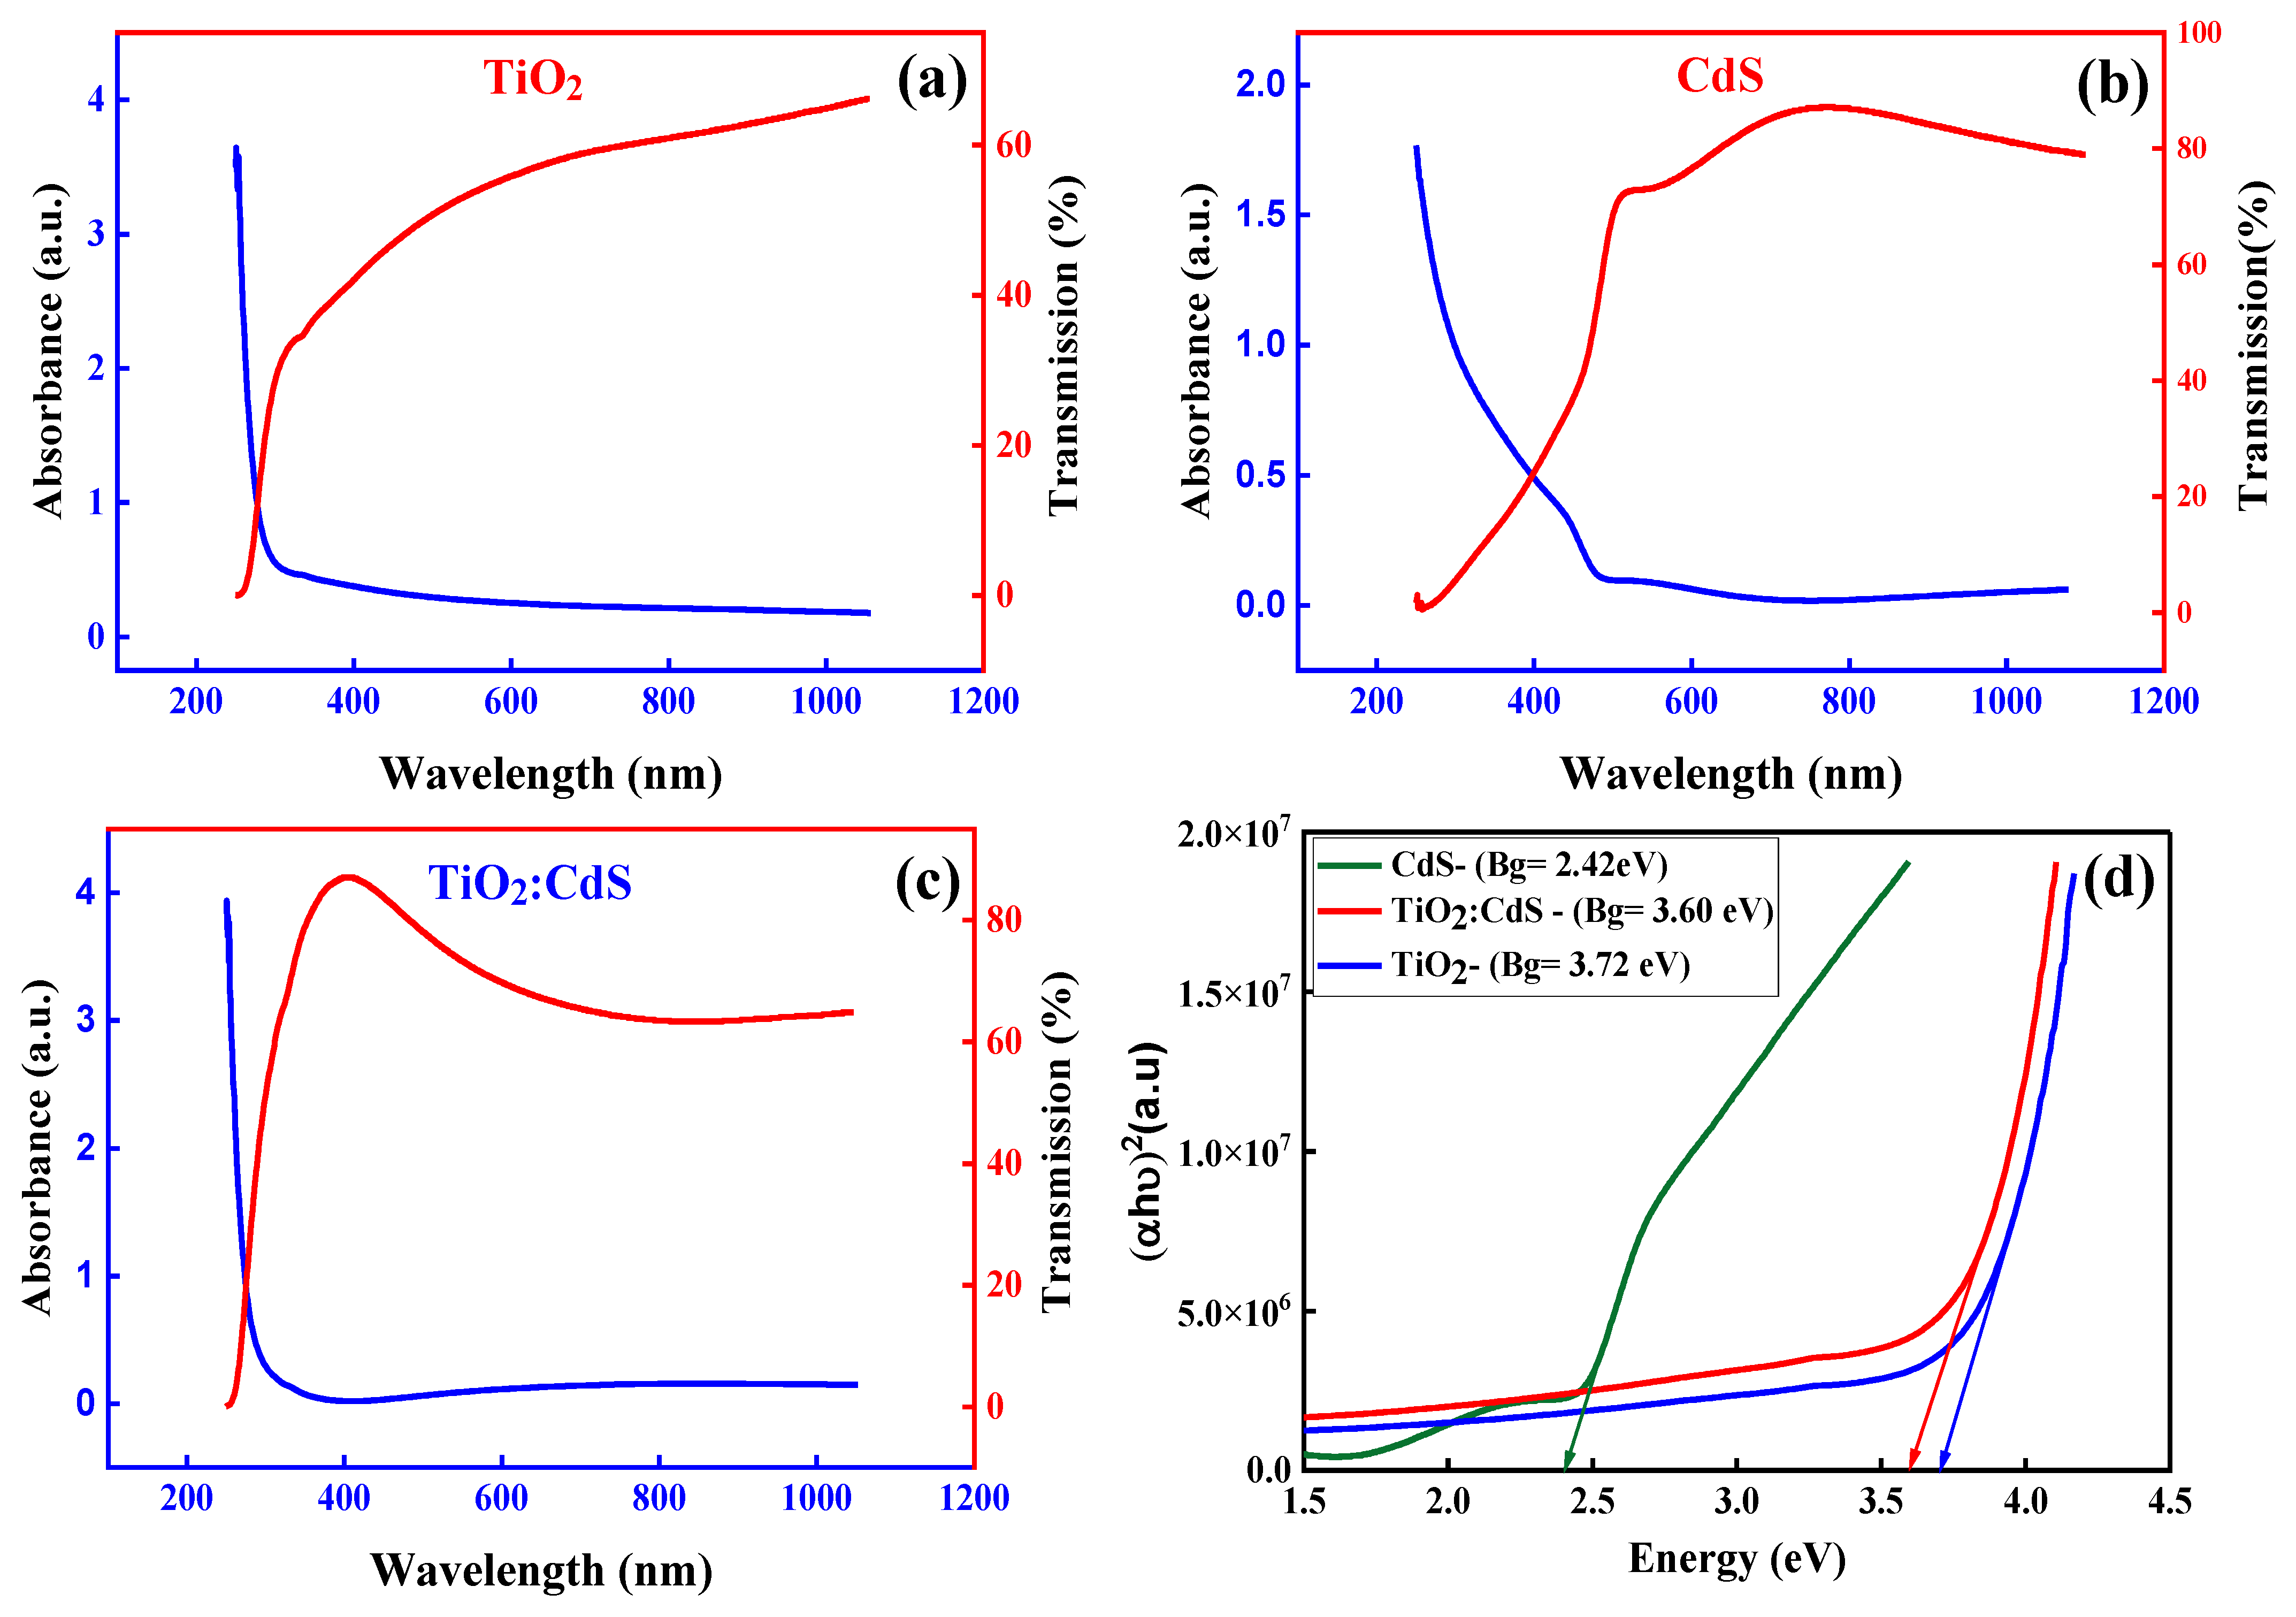
The transmission and absorption spectra acquired in the 200–1200 nm wavelength range were used to evaluate the optical characteristics of the films placed on the glass substrate. Figure 4a–c displays the combined transmission and absorption spectra of TiO2, CdS, and TiO2:CdS thin film. It was observed that with the increase in the wavelength, the transmission increases and the absorption decreases for all of the samples due to a decrease in the incident energy which no longer satisfies the absorption condition. The maximum transmission values observed in the case of CdS and TiO2 were 86% and 70%, respectively, while transmission in the visible area increased substantially to 89% in the case of TiO2:CdS due to structural and morphological changes after CdS inclusion in TiO2. It was also observed that the fundamental absorption edge of TiO2:CdS was shifted towards the high wavelength after incorporating CdS into TiO2. The pure TiO2 film exhibited high absorption in the UV range, and it did not significantly absorb the visible light [58].
However, the TiO2:CdS thin films exhibited the highest transparency in the visible region, which is ascribed to the addition of CdS and agrees with other earlier results [59], making them suitable for use as an ETM in solar cells. In contrast, CdS has a high absorbance in the ultraviolet region, but it has a low absorption in the visible region. It also has high transmittance in the visible range. We normally want a material with an excellent transparency and bandgap for photovoltaic applications. Therefore, TiO2:CdS thin films can be employed as a potential alternatives to other ETMs with enhanced productivity. These results are essential for optoelectronics applications, especially solar cells.

Tauc Plot

The Tauc plot is a method used to estimate the bandgap of deposited thin films by following the relation [60]:
α hv = A hv E g n
where α is the absorption coefficient; hv is incident energy; A is material constant; n corresponds to the transition (n = 0.5 for direct allowed transition, 1.5 for direct forbidden transition, 2 for indirect allowed transition, and 3 for indirect forbidden transition). Herein, n is assumed as 0.5 for determining the bandgap of deposited thin film.
The Tauc plot (Figure 4d) displays the plot between the (αhυ)2 and the energy, which is an efficient approach for determining the optical band gap by conducting extra linear plotting. The bandgap values for CdS and TiO2 were 2.42 and 3.72 eV, respectively. The bandgap values observed for TiO2 and CdS are consistent with those of previous studies [61,62,63]. The band gap value slightly decreased from 3.72 eV to 3.60 eV after adding CdS into TiO2. This might be due to the localization of the energy levels and the band tailing effects caused by overlapping the wave function of the impurity atoms with the wave function of the host material’s atoms.

4.2. XRD Analysis

The Bruker D8 discover diffractometer equipment with Cu Kα X-rays with a wavelength of 1.5406 Å was utilized to conduct the structural analysis of the nano-powder and thin films of TiO2 and CdS. The data were collected with a collection step size and time of 0.02 degrees and one second, respectively. The data were indexed with the help of an analytical procedure, which involved comparing them to a standard reference pattern contained within the Xpert high score library.
Figure 5a depicts the XRD pattern of TiO2 nano-powders and thin films produced on a glass substrate. It was discovered that the XRD pattern of the nano-powders of TiO2 contains anatase and rutile phases, which were used in the deposition of the thin films. The XRD patterns revealed that TiO2 in the anatase phase exhibits significant diffraction peaks at 25°, 48°, and 75° and weak peaks at 38° and 62.6°, while the rutile phase of TiO2 was validated with strong diffraction peaks at 27.44° and 54.4° and weak peaks at 36°, 41.32°, and 68.56° [64], which is in accordance with JCPDS card nos. 01-071-1167 and 01-076-0649, respectively. The deposited thin films of TiO2 showed no peaks, and instead, we recorded diffused XRD profiles because of the amorphous nature of the glass. It could be due to a lattice mismatch between the substrate and the deposited thin films. The XRD pattern of the CdS nano-powders and thin films formed on a glass substrate is depicted in Figure 5b. The results show that the films deposited on glass are amorphous due to the lattice’s disorientation and the glass’s amorphous nature [65]. In contrast, the nano-powder of CdS exhibits a hexagonal wurtzite structure due to the presence of the peaks corresponding to the planes at the (111), (220), (300), and (311) orientations. Which is consistent with JCPDS card no. 01-080-0006 [66].

4.3. FTIR Results

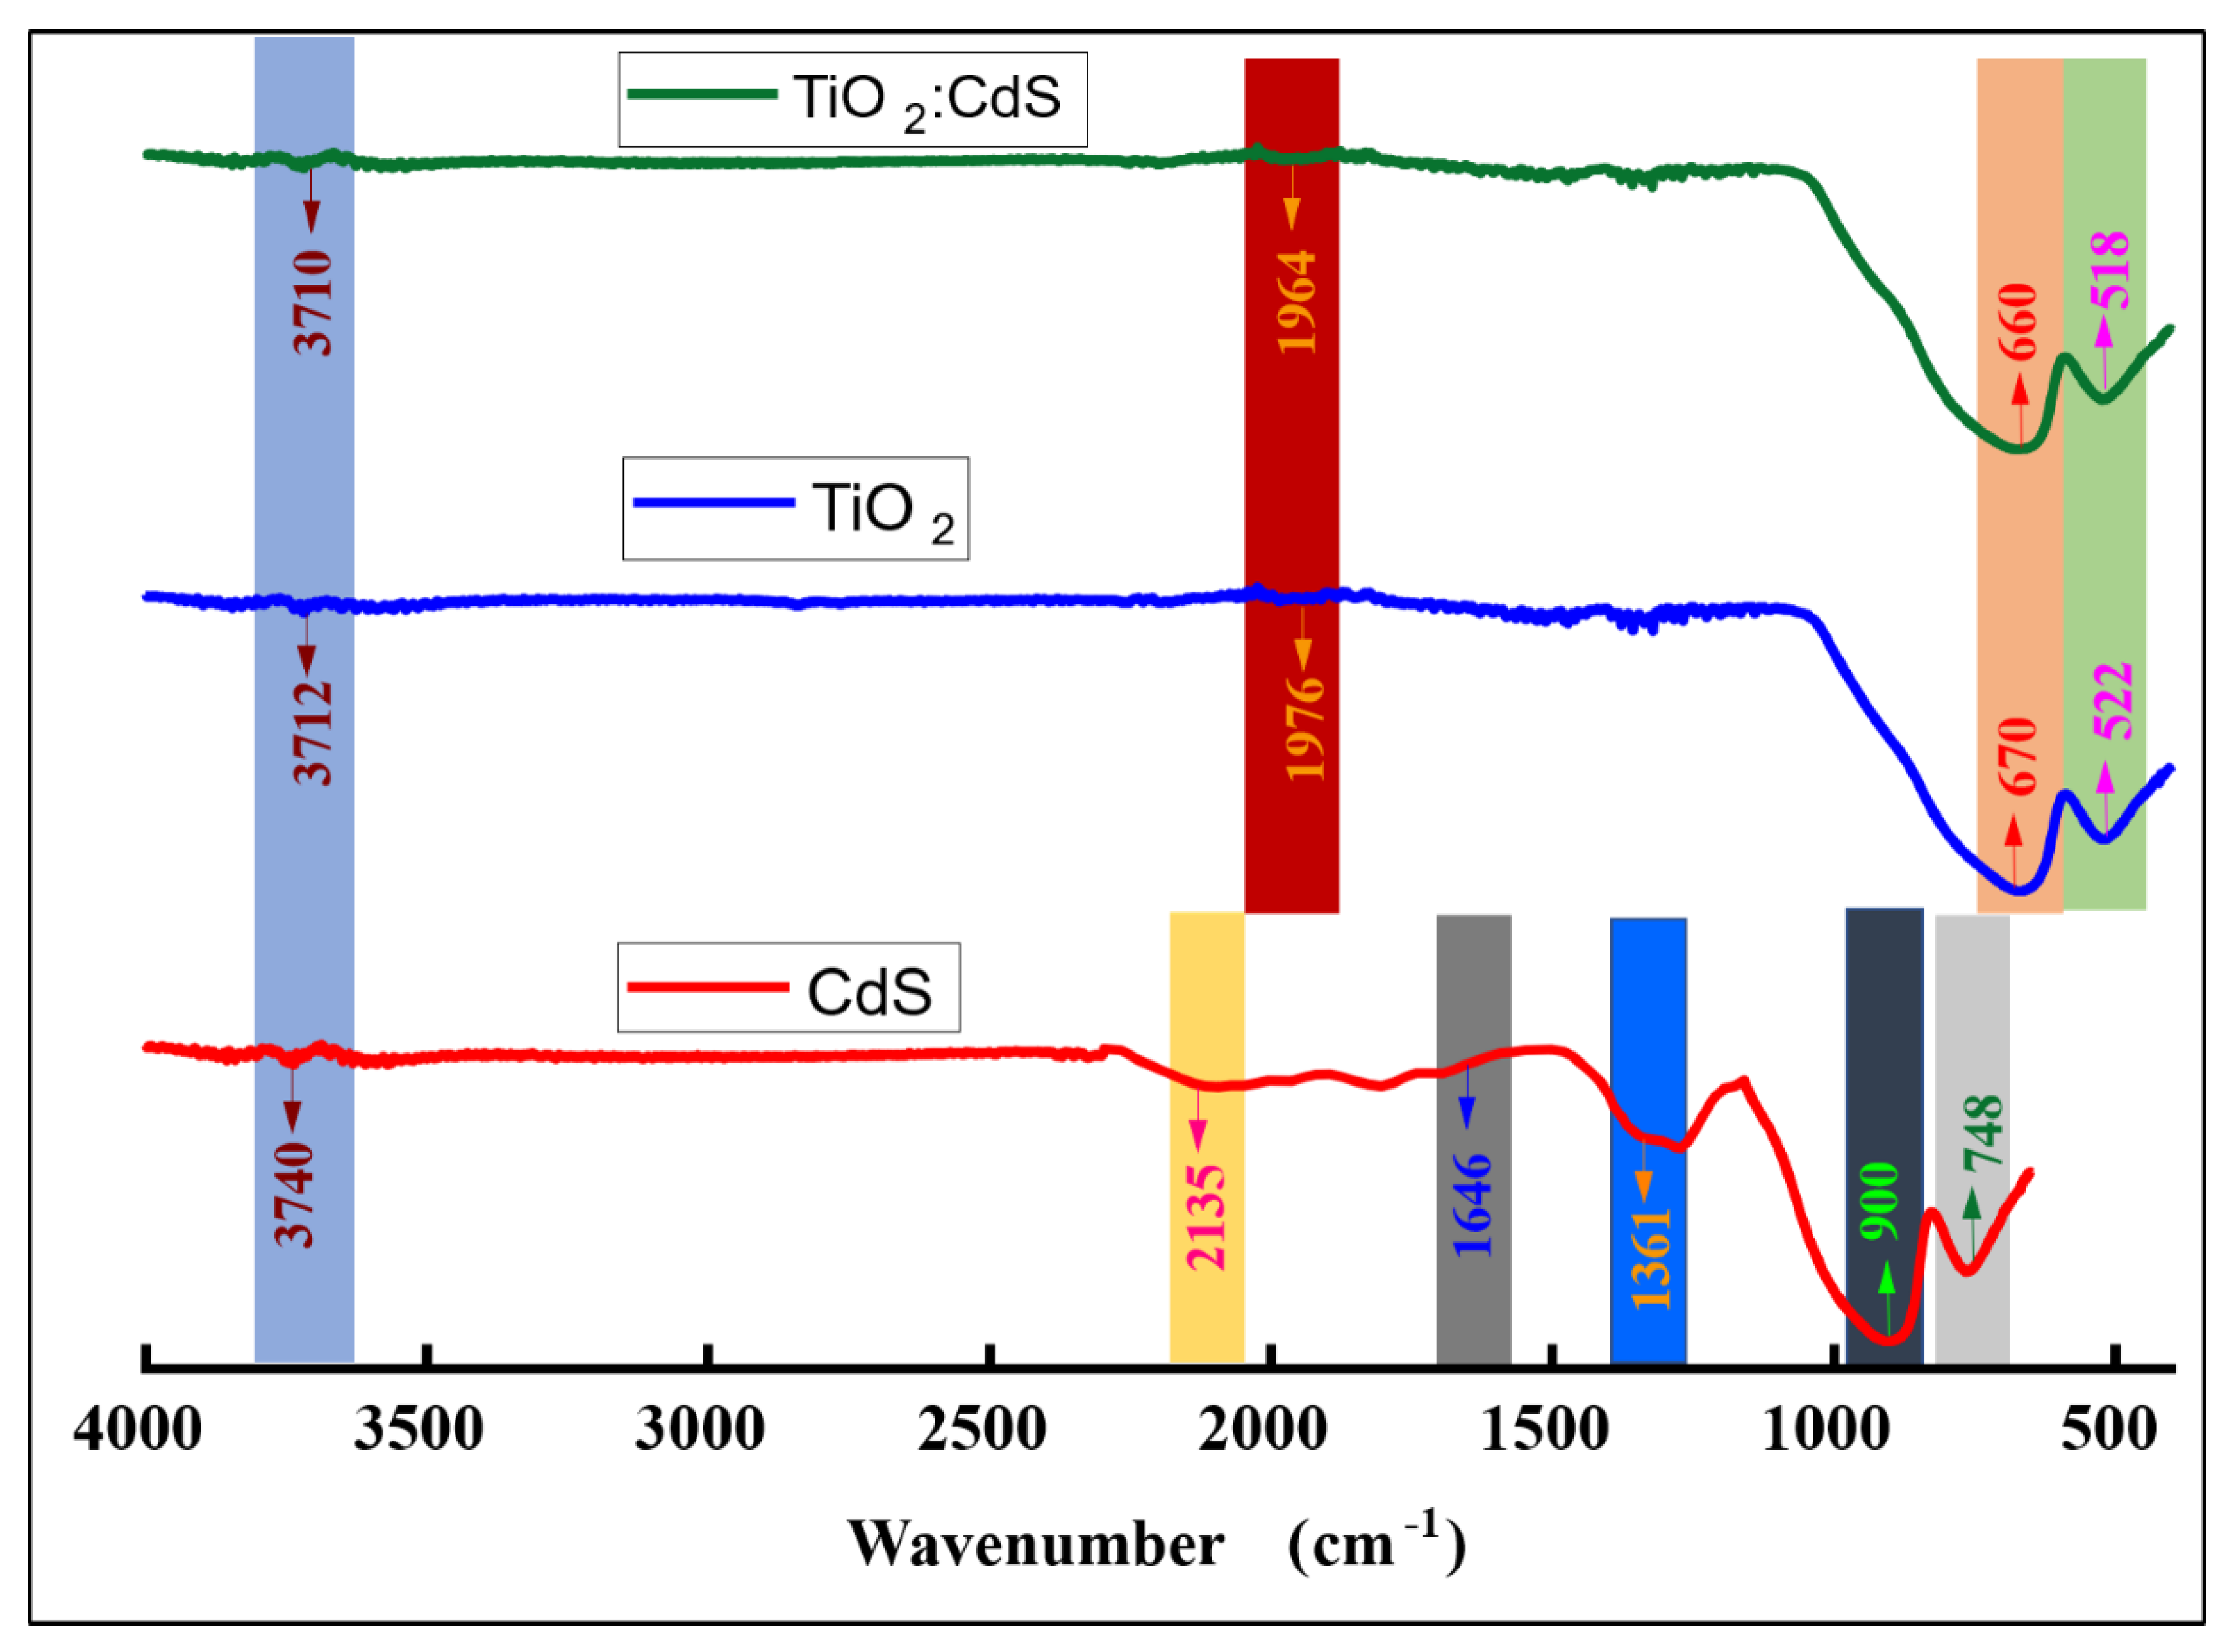
The characteristic peaks of the FTIR spectra along the vibrational mode of TiO2, CdS, and TiO2:CdS are illustrated in Figure 6. An FTIR spectrometer was used to analyze the interaction of the bonds in the deposited thin films of the TiO2 and CdS composite. The range of the instrument was from 400 cm−1 to 4000 cm−1. Figure 6 depicts the typical peaks of the FTIR spectra along the vibrational mode of TiO2, CdS, and TiO2:CdS. The faint absorption band at about 3700 cm−1 is attributed to the OH stretching vibration of water molecules and the moisture in the processed samples. The modest and faint peak at about 1400 cm−1 is due to the existence of water molecules with H-O-H bending vibrations. Since sulfur is considered to be a possible H-bond acceptor, the signal at 1646 cm−1 may have resulted from the –OH bond bending vibrations. A broad peak shows the significant interaction of CdS with the water molecules at 2135 cm−1, which reflects the stretching vibration of the -OH bond. The band at 1361 cm−1 was identified as a typical vibration band of CO ions. Strong band positions in the region of 900–1100 cm−1 may result from the sulphate group’s stretching vibrations. The material peak detected at 748 cm−1 corresponds to the stretching mode of the Cd-S bond [67,68]. The broad band at below 1000 cm−1, with minimum values of 670 cm−1 and 522 cm−1, can be attributed to the typical Ti–O and Ti–O–Ti stretching and bending vibrational modes of TiO2, respectively, as determined by prior published research [69,70]. In contrast, the peaks at 1976 and 1964 cm1 are attributable to O-H stretching vibrations.
In addition, it is very discernible from the figure that with the addition of CdS, variations in the peak intensity, peak broadness, and peak location occurred. These might be attributed to the interaction of CdS in the TiO2 lattice. The figure also demonstrates that the interaction of CdS with TiO2 resulted in a change in the bond length and the mass of the molecule, which caused the related peaks to move towards lower wavenumbers.

4.4. Optical Microscopy

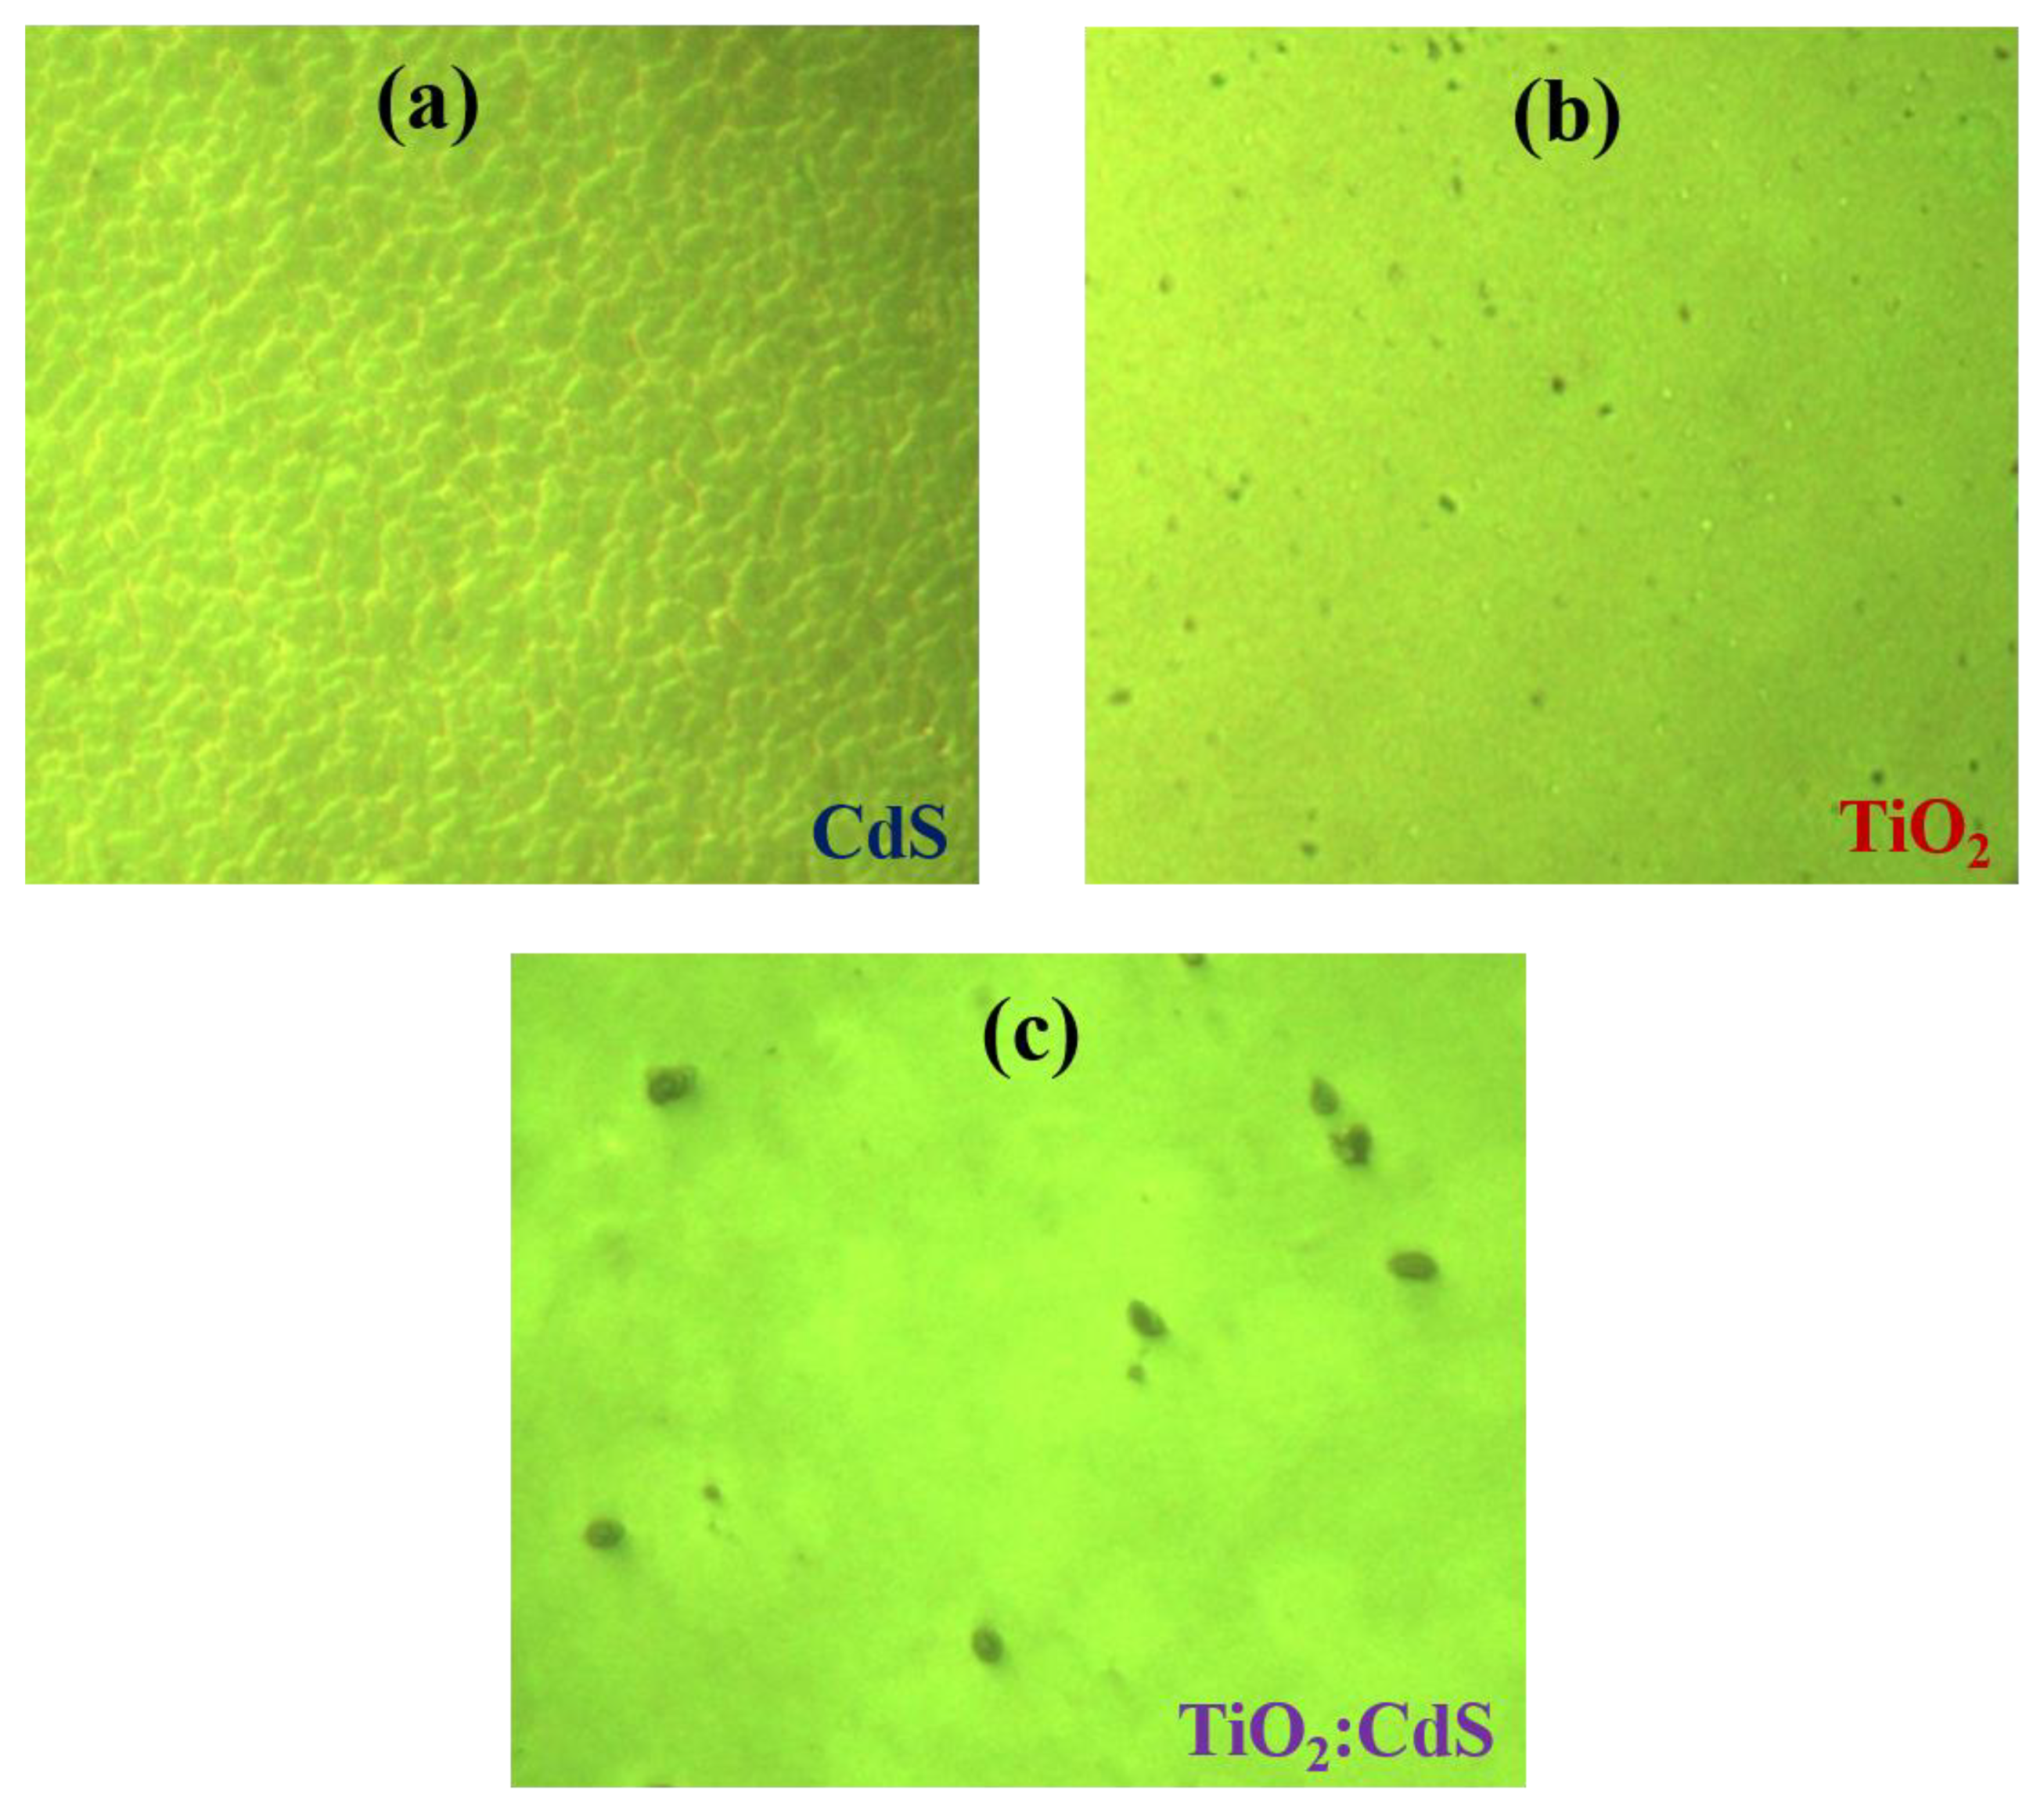
An optical microscope was used to conduct a morphological analysis of the TiO2, CdS, and composite TiO2:CdS thin films, which is recorded in microns. Figure 7a exhibits the granular-like morphology of the CdS thin films. In contrast, Figure 7b depicts a homogenous TiO2 coating that was applied to the glass substrate, with particles scattered equally throughout the whole surface. The surface morphology of the composite thin films changed as the CdS content increased, as seen by the dark patches in Figure 7c, whereas the pure TiO2 films had a bright yellow appearance. The dark spots in the micrographs caused by the increased CdS concentration and grain size are supported by particle accumulation.

4.5. SEM Analysis

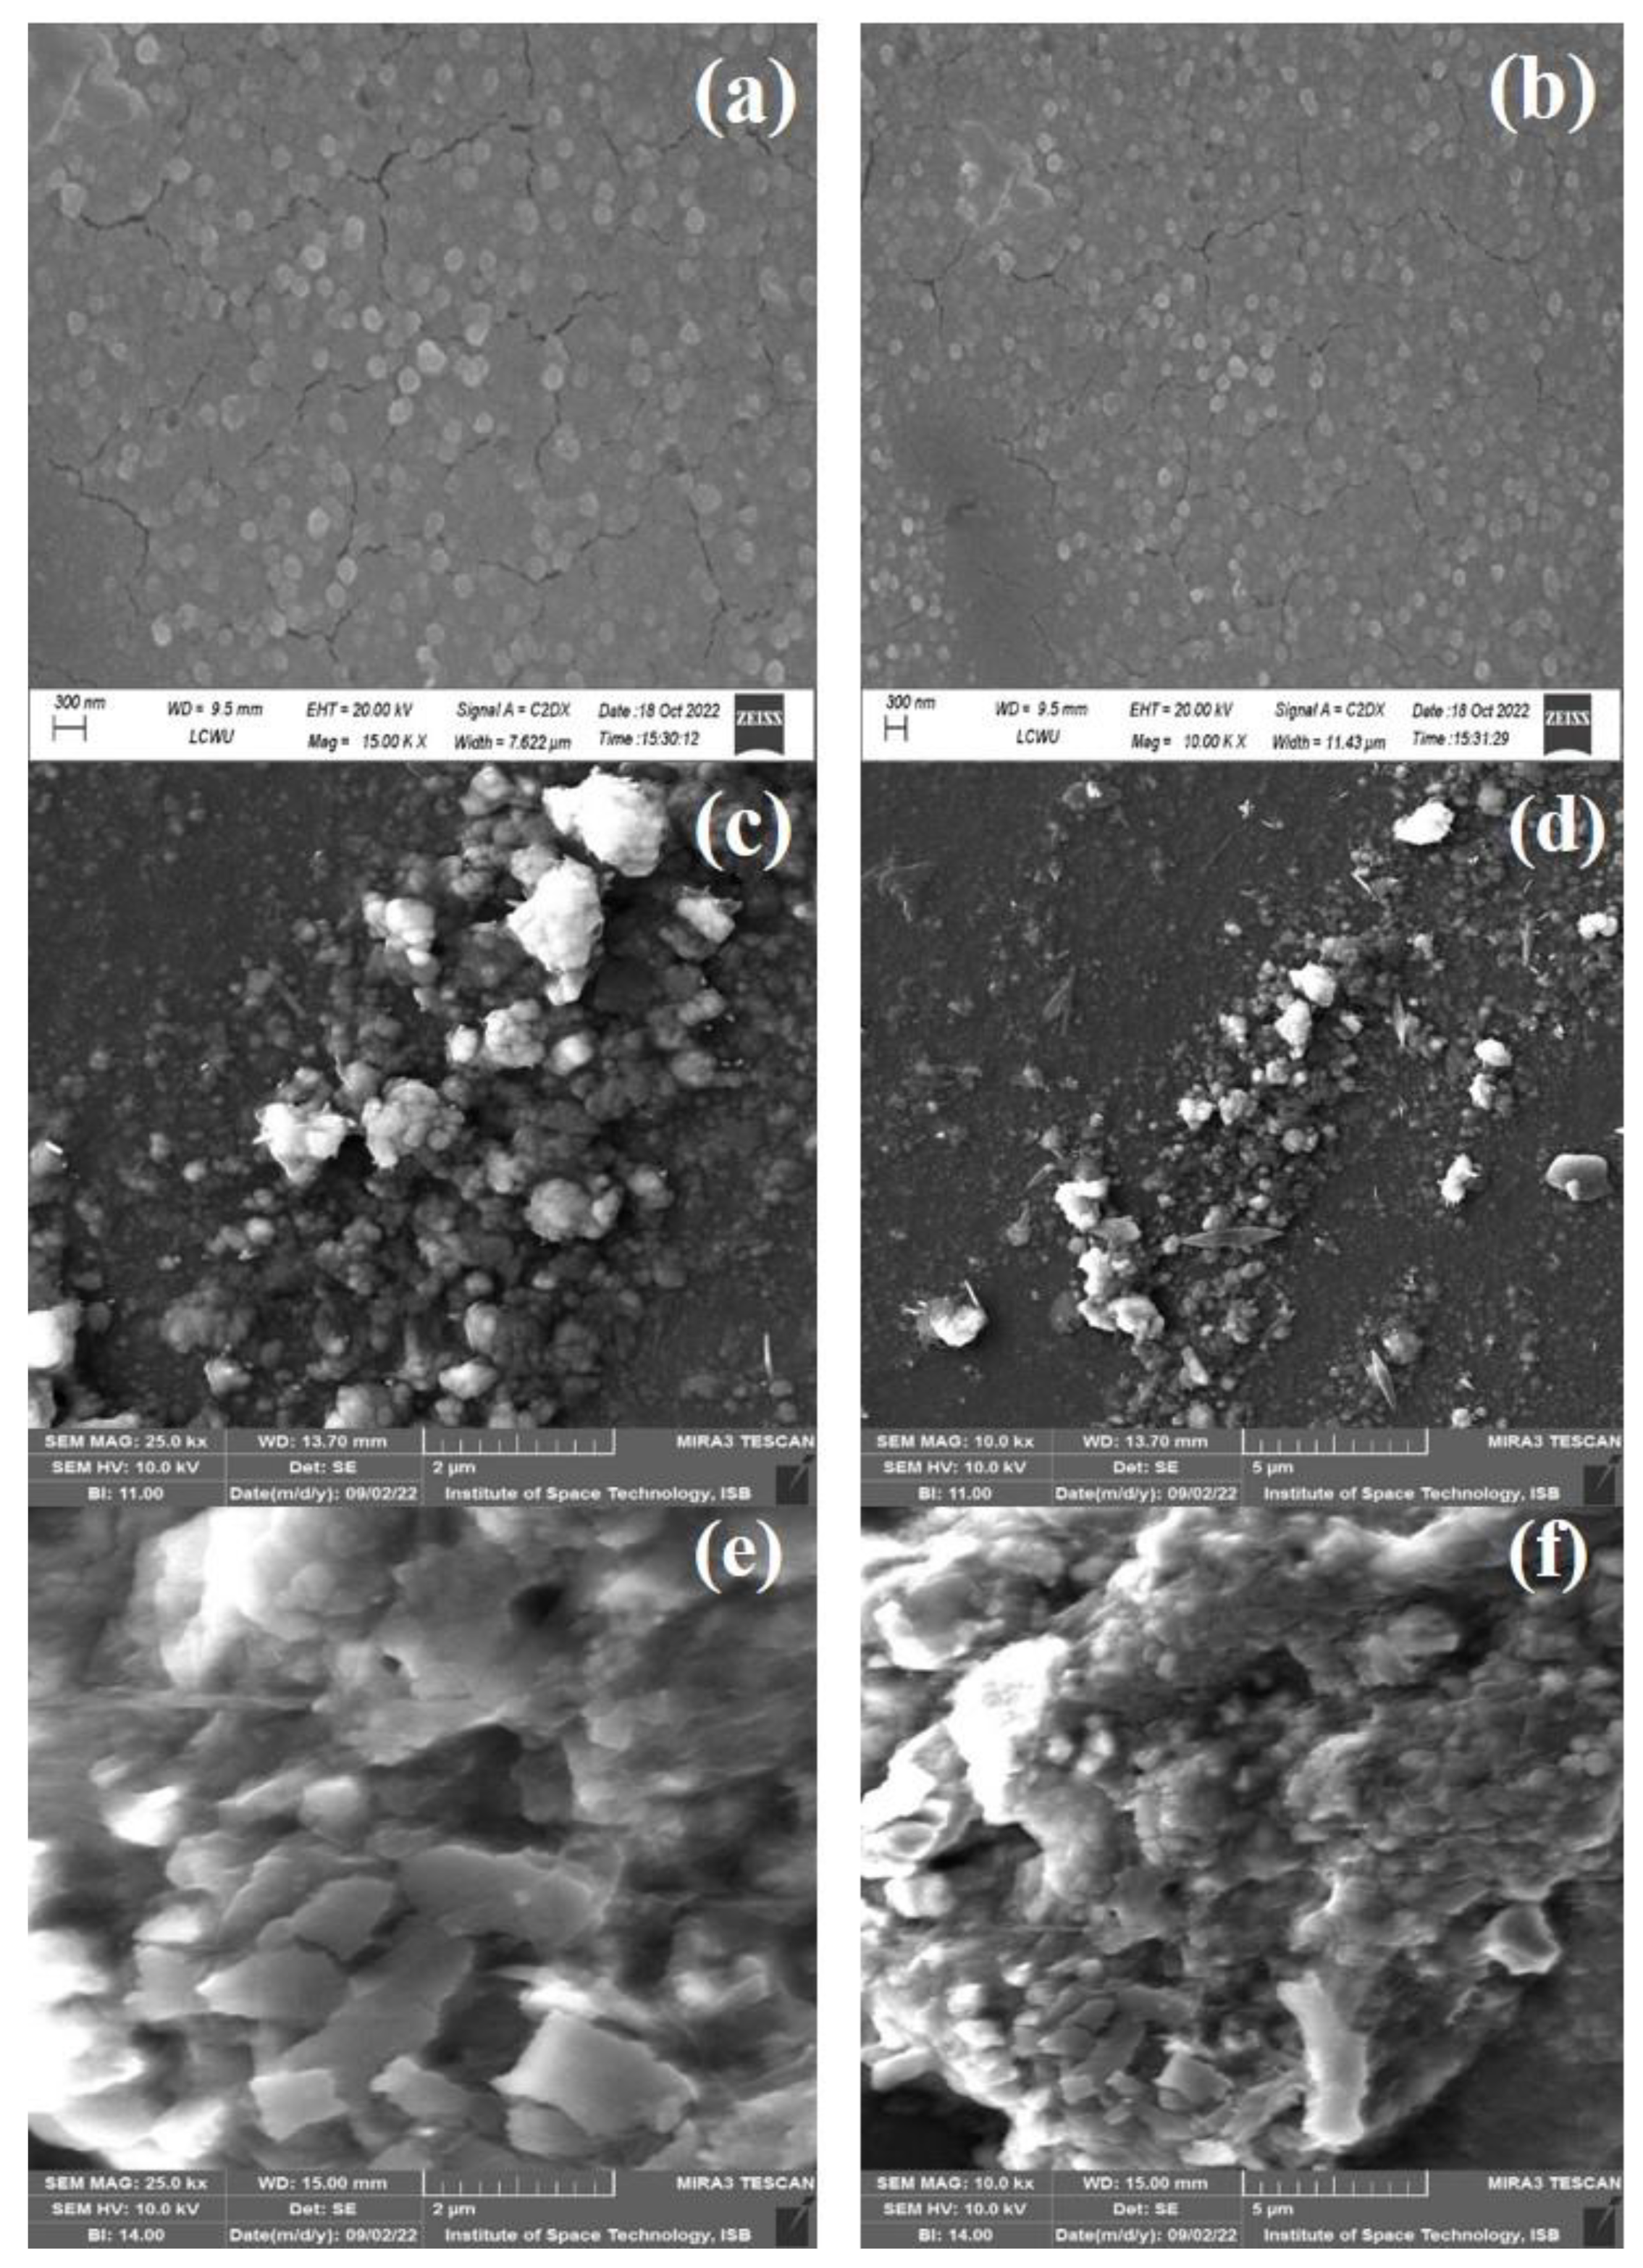
The SEM analysis was carried out at different magnifications with accelerating voltages of 20 KV for CdS and 10 KV for the TiO2 and TiO2:CdS thin films. Figure 8a–f shows an SEM image of the CdS, TiO2 and TiO2:CdS thin films prepared by thermal evaporation. It is illustrated that the CdS thin films comprise homogenous spherical shapes that are similar to grains and have a dense morphology that covers the entire glass substrate, while the TiO2 thin films have a surface that is composed of non-porous, non-uniform spherical grains and a structure that varies in size. The size of the particles was estimated using Image J software: it was observed that the surface is composed of regular-sized agglomerated particles of ~100–150 nm. On the other hand, the TiO2:CdS thin films show a coarser surface, with clusters and agglomerations of grains.

4.6. Photoluminescence (PL) Analysis

To examine the sample’s photoluminescence (PL) properties, the Spectrofluorometer FS5 was used, with a xenon arc lamp acting as an excitatory source. Different emission spectra were obtained using different excitation wavelengths, as shown in Figure 9 and Figure 10. It can be visualized from the PL spectra (Figure 9) that most of the emission peaks were observed in the visible region. The emission peak at 366 nm was due to the recombination of free excitons, and it was in the ultraviolet region. The high intensity of emission peaks observed at 401 nm is due to the radiative recombination of self-trapped exciton (STE) [71,72]. It is a condition where the electron-hole pair loses the ability to move across the crystal lattice.
In contrast, a well-defined emission occurs at 425 nm due to the low indirect transition or presence of shallow transitions trapped near the band edge [73,74]. Both of the samples exhibit a green luminescence spectrum at 552 nm, which is consistent with the luminescence spectra of single and polycrystalline TiO2 that has been published in the literature [75,76]. The peak intensity is also seen to rise following the addition of CdS into the TiO2 thin films due to a reduction of the band gap. The increase in the peak intensity is endorsed due to the band-tailing effects, which enhance the band-to-band recombination of the excited electrons. There are several other reports related to oxygen vacancy defects at the shallow levels [77,78].
Figure 10a depicts the CdS film emission spectra at an excitation wavelength of 360 nm. Emission peaks were observed at 524 nm, 610 nm, and 642 nm. The shift from the donor levels to the valence band is considered to be represented by the peak at 524 nm. The traps and/or surface states are responsible for the peak at 610 nm. A transition in the conduction band between the interstitial Cd donor and acceptor atoms could have caused this emission. The peak at 642 nm in the PL spectra is attributable to the transition caused by CdS, and it is associated with sulfur vacancies [79,80].
Figure 10b depicts the PL spectra of the CdS thin films that were excited at the wavelength at 410 nm. Several emission peaks were observed at different wavelengths. The inter-band transitions are responsible for the 504 nm emission. In general, S-vacancy donors transitioning to the valence band and donor-acceptor pairing recombinations caused the peak. The red emission band at 638 nm in the PL spectra corresponds to a vacancy defect in CdS [79,81].

4.7. Resistivity Measurement

The Van der Pauw technique tests the resistivity of CdS, TiO2, and their composite TiO2:CdS thin films. The voltage changes are monitored at various points by supplying a 1 mA current at multiple points with a magnetic field of 0.2 T. The average resistivity is calculated using the values of 2.7 × 10⁴ ohm-cm, 2.4 × 10⁻² ohm-cm, and 1.2 × 10⁻² ohm-cm for CdS, TiO2, and TiO2:CdS, respectively. Pure TiO2 has been shown to have higher resistivity than TiO2:CdS thin films do, which is supported by incorporating CdS into TiO2. As the resistance decreases, the conductivity increases, thereby improving the electron transportation at the interfaces. This could be due to the decrease in the band gap. This indicates it is a prospective candidate that can used as an ETM in photovoltaic devices, notably PSC.

4.8. J–V Comparison between Different ETMs and Perovskite Materials

In this research study, we used different perovskite materials (CH3NH3PbI3, Cs2BiCuI6, (FA)2BiCuI6, and (MA)2BiCuI6) as an absorber material for PSC. These materials exhibited fine optoelectronic properties such as a high absorbance, low bandgap, high charge transfer, and higher optical conductivity. Herein, we have observed the effect on the performance of PSC by incorporating different electron transport materials (ETM) that we have proposed in this study. According to our findings, double perovskite without lead can be a workable replacement for PSC, and it could even be used in creating PSCs for future generations, even though the lead-based perovskite material has substantially better efficiency rates. However, we normally do not use lead-based material due to toxicity and stability considerations. On the other hand, there are no such issues with double lead-free perovskite. As a result, it can be employed as a photo-harvesting material in future generations of PSCs.
Experimentally, the efficiency of a perovskite solar cell without lead has not surpassed 10%. On the other hand, it has been theorized that certain lead-free double perovskite materials have PCE levels that are greater than 20%. These materials have not yet been subjected experimentally, but their optical, electrical, structural, and other properties are being investigated through density functional theory (DFT). Herein, we modelled a handful of these materials and analyzed their performance characteristics, which were similar to those of typical perovskite-based materials. These materials exhibit unique optoelectronic properties, and they may potentially replace conventional lead-based perovskite materials in future solar cells. This study’s major objective was to analyze the productivity of d-PSC with various ETMs and find out which perovskite and ETM generates the maximum productivity.
All of the simulation settings for the structure’s layers were taken from the research presented in [36,39,41,43,82,83,84,85]. Table 1 and Table 2 provide a comprehensive summary of each of the essential simulation constraints employed in this simulation.
To simplify the device modelling, absorption profiles for all of the layers were added to a simulation that was taken from several works of literature [86,87,88,89] to expedite the process. This device model features two interface defect layers, which are indicated by the letters IL1 (ETM/Photoactive Layer) and IL2 (Photoactive Layer/HTM), to produce a more realistic depiction of the device. The AM1.5G spectrum was employed in this device modelling; its effective temperature was adjusted at 300 K. Additionally, all of the operating point settings and numerical factors were maintained at their actual value. The range of scanning voltage was set to a range of from zero to one volt. The above parameters were utilized throughout this program to run all of the simulations.
Table 1. Material parameters set in simulation.
ParametersFTO [36,41,43,82]TiO2, CdS, TiO2:CdS [41,43,82,85] Perovskite [26,39,41,43,82,87]Spiro-MeOTAD [36,39,41,43]
Thickness (nm)20050, 50, 50200150
Acceptor Density c m 3 00, 0, 00 10 18
Donor Density c m 3 10191017, 1017, 101810170
Bandgap (eV)3.53.72, 2.42, 3.61.62.9
Relative Dielectric Permittivity910, 10, 136.53
Mobility of Electron (cm2/Vs)2020, 100, 352 10 4
Mobility of Hole (cm2/Vs)1010, 25, 152 10 4
Electron Affinity (eV)44, 4, 43.92.2
Defect Density c m 3 10 15 10 15 ,   10 15 , 10 16 2.5 × 10 15 10 15
Table 2. Device parameters set in the simulation.
Interface Defect Density [36,39,41]
IL1 (ETL/Active Layer) Defect Density
IL2 (Active Layer/HTL) Defect Density
2 × 109 cm−2
2 × 109 cm−2
Back Metal Contact Properties [39,40,41]
The electron work function of Au
Surface recombination velocity of the electron
Surface recombination velocity of hole
−5.1 eV
105 cm/s
107 cm/s
Front Metal Contact Properties [39,40,41]
The electron work function of TCO
Surface recombination velocity electron
Surface recombination velocity of hole
−4.4 eV
107 cm/s
105 cm/s
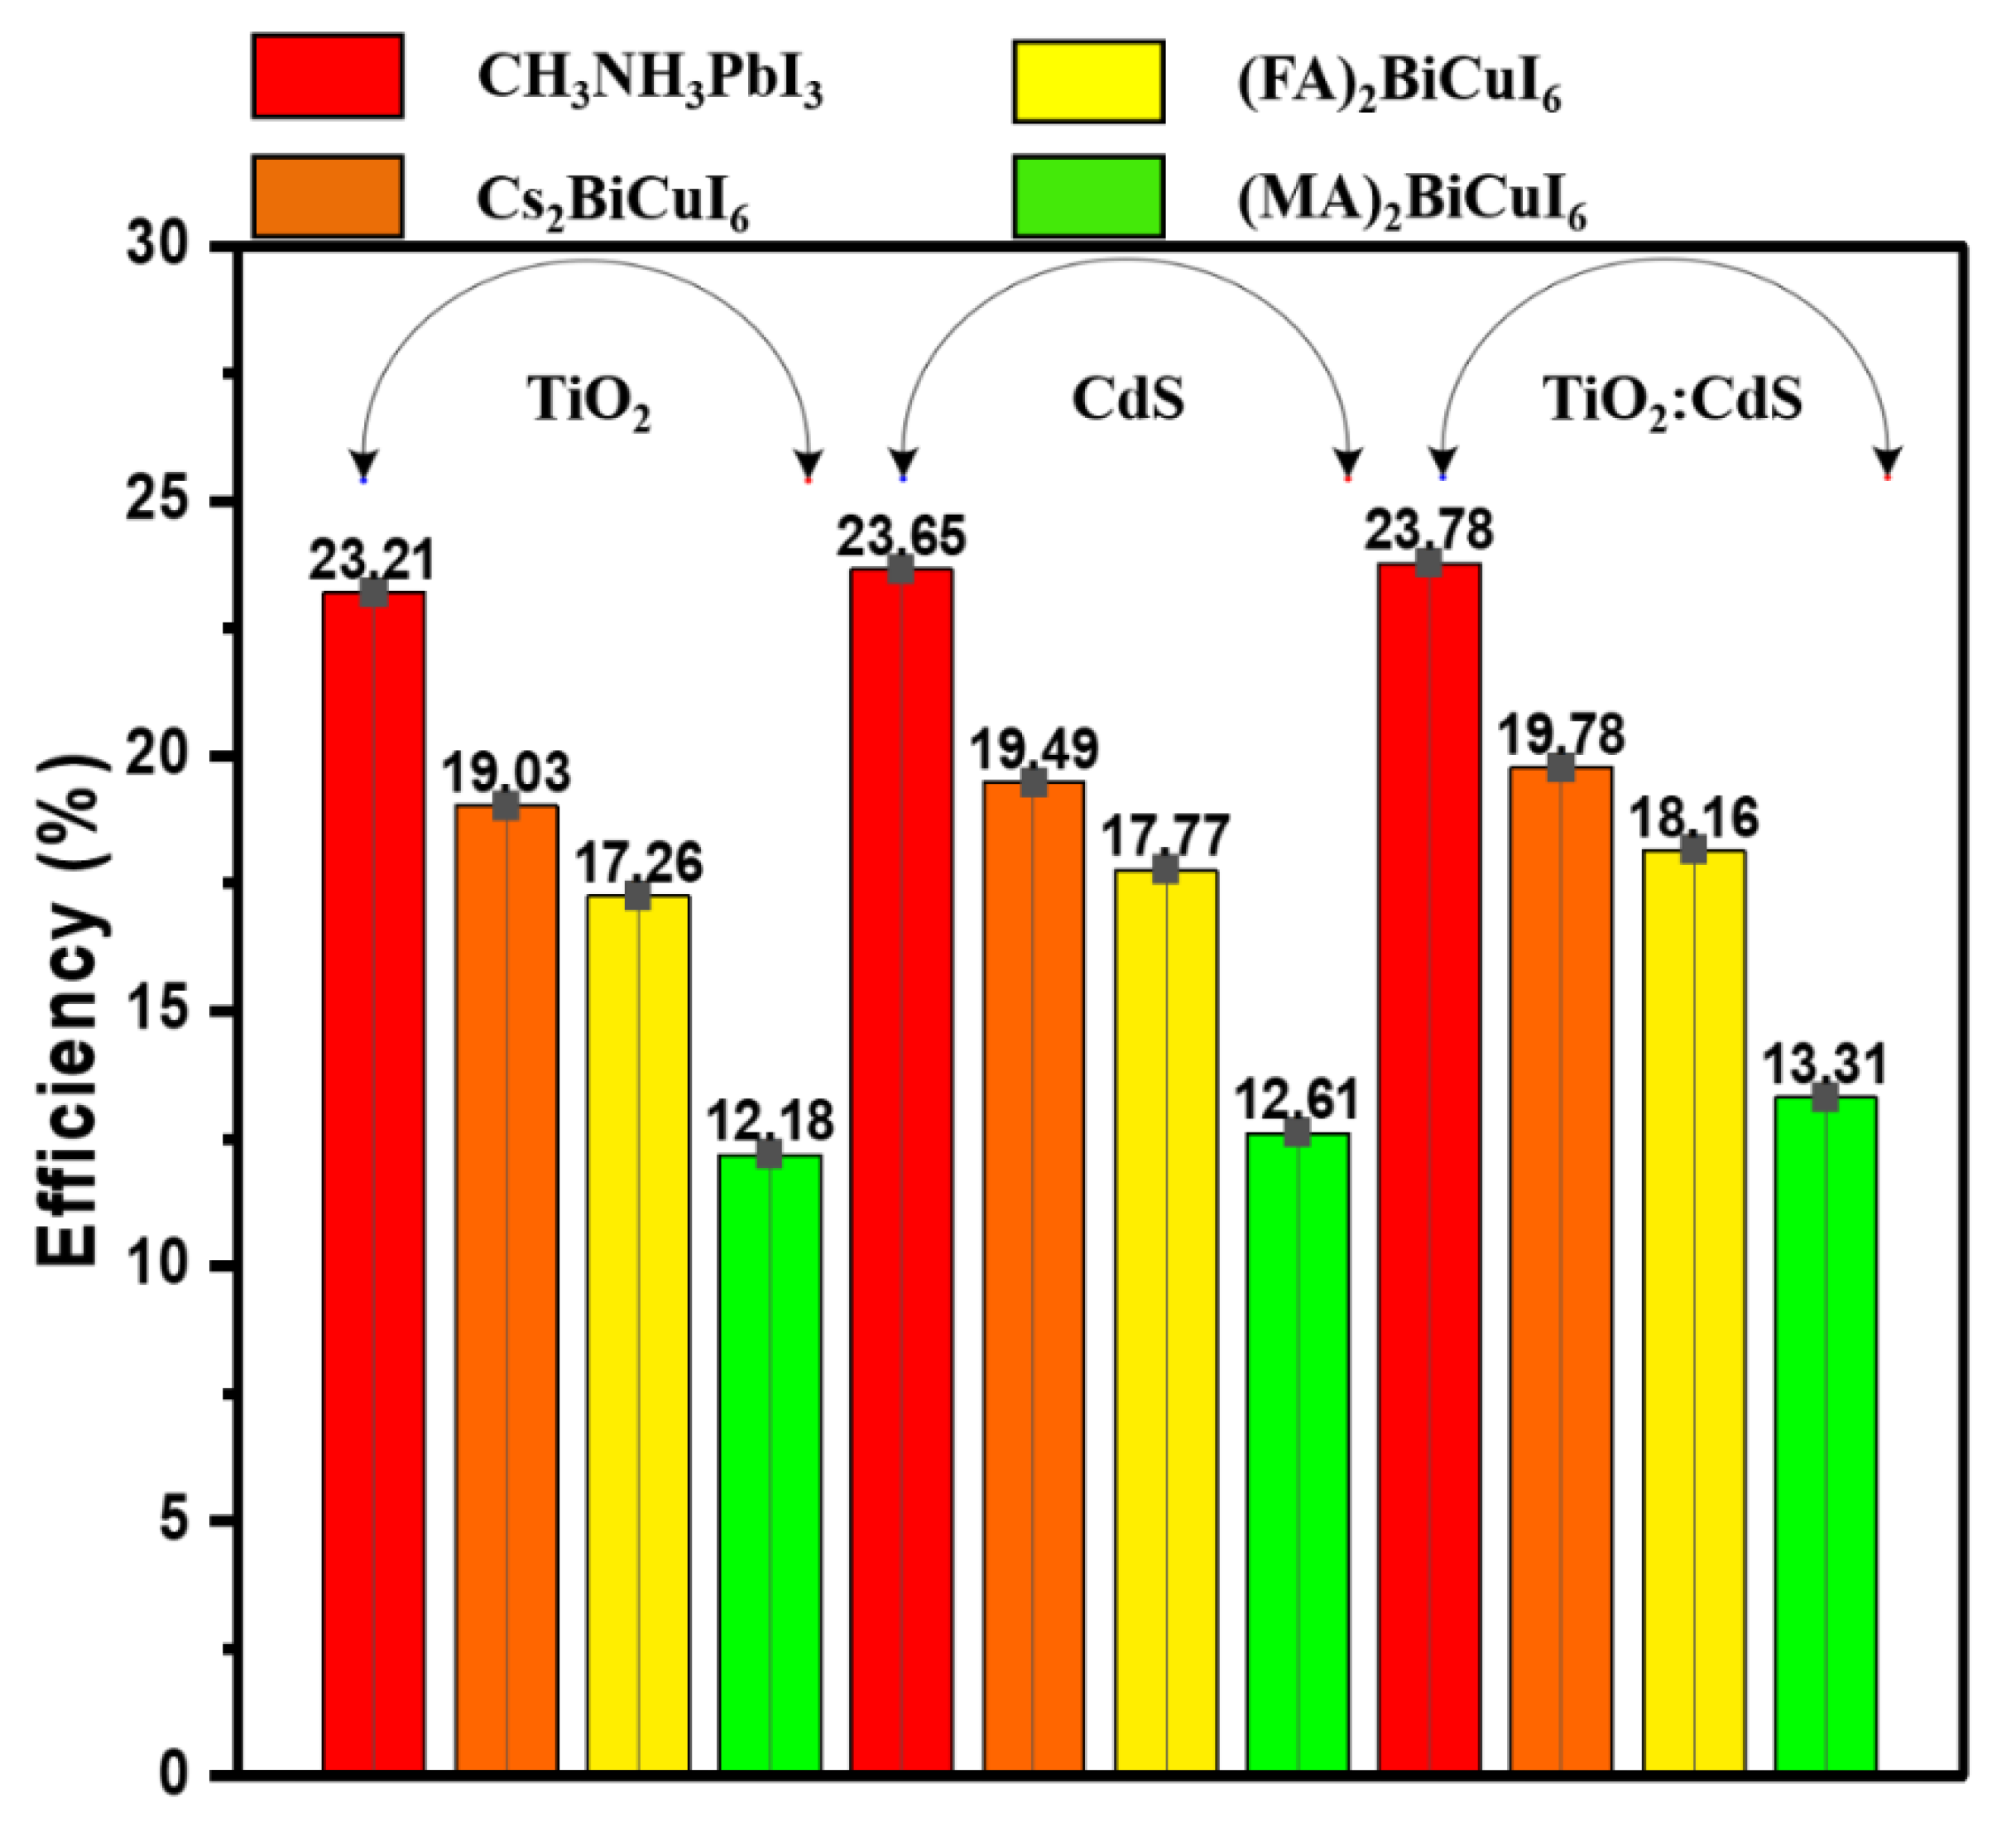
Electron and hole pairs were generated when the photons were present on the perovskite material. The built-in electric field between the electrodes dissociates the electron-hole pair and transports it toward the respective electrodes. The current density–voltage (J–V) curves of the modelled structures are illustrated in Figure 11a–c. These make it clear that the change in the Jsc and Voc values depends on the interaction between the perovskite material and the ETM. The CH3NH3PbI3 and Cs2BiCuI6 molecules display high PCE and Jsc values in comparison to those of the other perovskite materials ((FA)2BiCuI6 and (MA)2BiCuI6)) as these molecules exhibit superior optical and transport properties, such as a high transport rate, a high absorption coefficient, and potentially dielectric properties. A detailed comparison of the performance parameters of different perovskite materials and the ETMS is listed in Table 3. Figure 12 shows a power conversion efficiency (PCE) comparison of all of the photo-harvesting and electron transport materials. Cs2BiCuI6 with TiO2:CdS as an ETM outperforms all of the other double perovskite materials in terms of productivity.
The interaction of double perovskite as a photoactive layer with TiO2:CdS is stronger than that of the other pairs, which results in the efficient extraction, transport, and collection of charge carriers towards the respective electrodes upon the application of light to the photoactive layer. Therefore, it yields better outcomes. The device output parameters such as the Voc, Jsc, FF, and PCE for CH3NH3PbI3 and Cs2BiCuI6-based PSC are 0.9656 V and 0.9589 V, 32.88 mA/cm2 and 27.65 mA/cm2, 74.93% and 74.62%, and 23.78% and 19.77%, respectively.
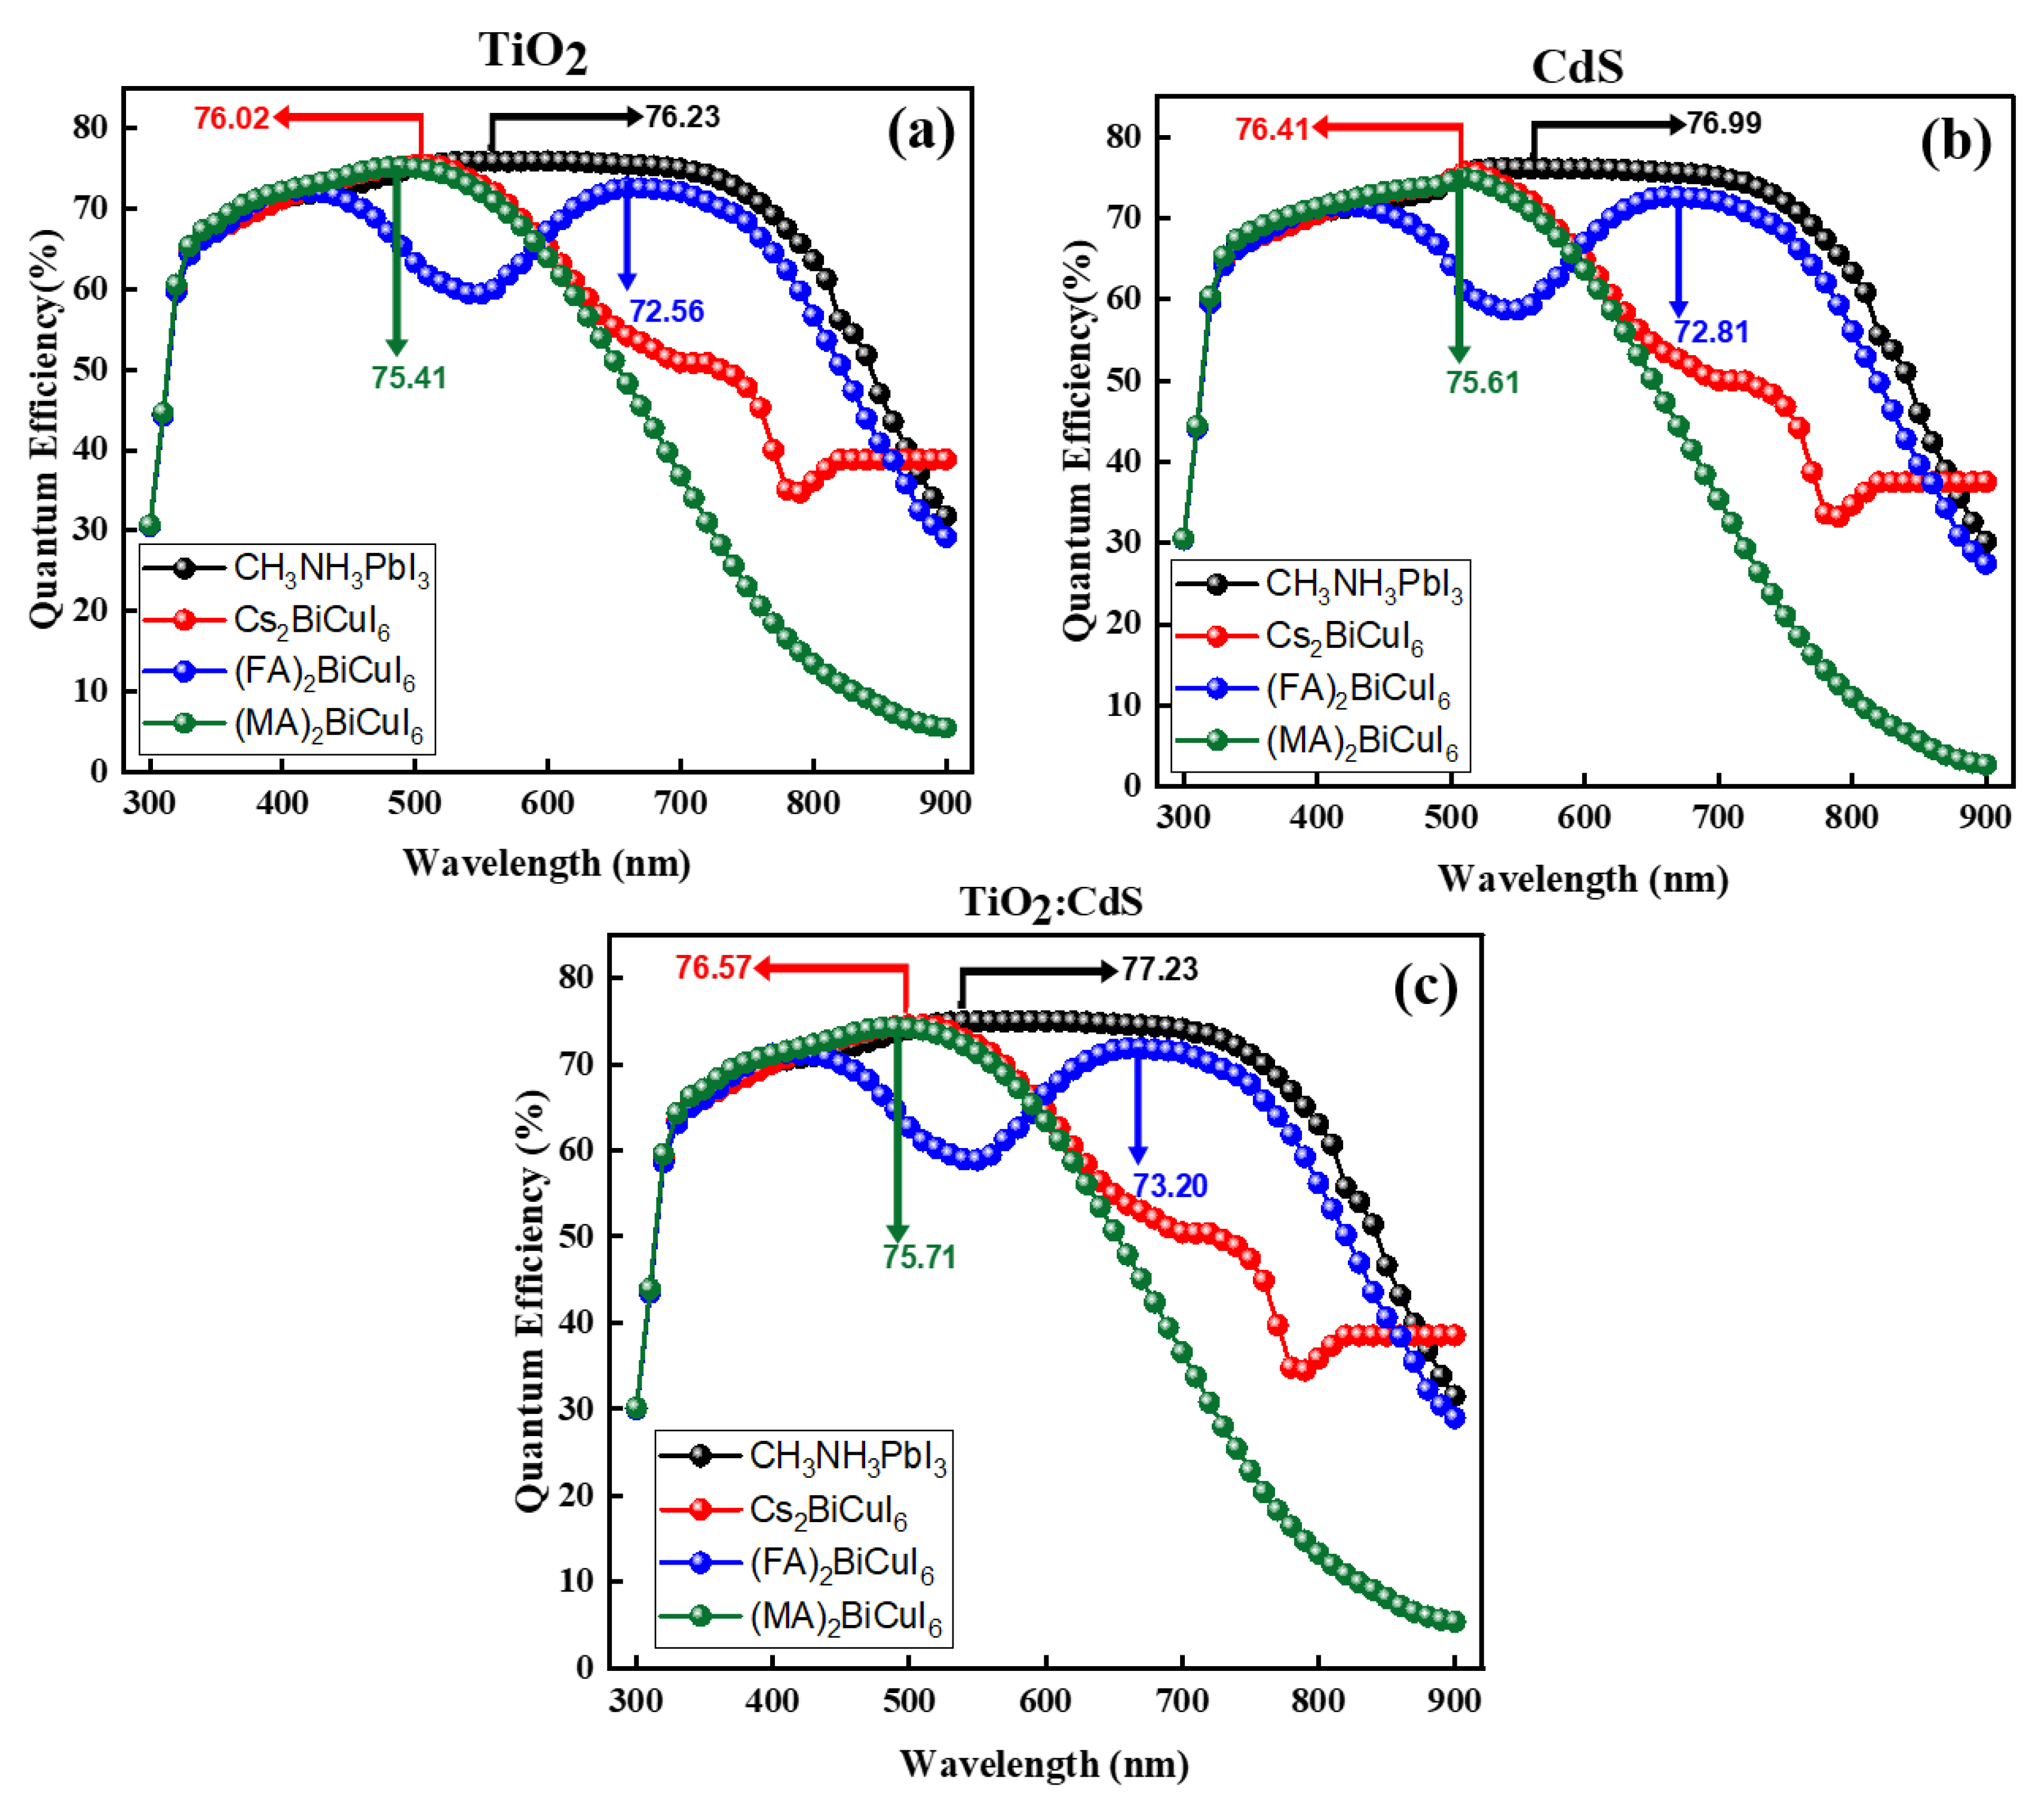
The quantum efficiency (QE) was measured as the ratio of the number of electrons created to the number of photons that were present on the photoactive layer. The QE curves for the different modelled structures are illustrated in Figure 13a–c. The QE graph is ideally a square wave, but it is sometimes reduced due to recombination, reflection losses, and other mechanisms such as surface passivation. It is also defined by the collection probability due to a single wavelength’s generation profile. As a result, the QE is determined by the probability of the charge carriers being transported and extracted toward the respective electrodes. The variation in the QE curves of the different perovskite materials with different ETMs is due to the abovementioned losses. It was analyzed that the best QE value was obtained when TiO2:CdS was employed as ETM. This could be due to its preferable optoelectronic properties and superior interaction with the photo-harvesting material. It is also observed that the maximum values of the QE obtained for the different perovskite materials CH3NH3PbI3, Cs2BiCuI6, (FA)2BiCuI6 and (MA)2BiCuI6 with TiO2:CdS as an ETM are 77.23%, 76.57%, 75.71%, and 73.20%, respectively.
In addition, the numerical analysis of the designed perovskite solar cell (PSC) was also compared with the experimentally published data, which are shown in Table 4. It is analyzed that the results of the simulated device are close to the empirical findings reported in previously published research. Therefore, this work also provides theoretical insight for the future use of PSCs with increased productivity.

5. Conclusions

Herein, TiO2, CdS, and TiO2:CdS thin films were deposited onto a glass substrate by resistive heating thermal evaporation. Different spectroscopy and microscopy techniques were utilized for the thin film characterization. Material identification, photoluminescence studies, and optical characterizations were carried out using an FTIR, FS5 spectrofluorometer and UV-VIS spectroscopy, respectively. The FTIR results confirmed the formation of a TiO2 bond with two sharper peaks at 670 cm−1 and 522 cm−1 and a CdS bond with a sharper peak at 748 cm−1. The highest transmittance value of 89% was observed in the visible region in the composite thin film. The optical band gap values for the deposited films (i.e., CdS, TiO2, TiO2:CdS) were 2.42 eV, 3.72 eV, and 3.6 eV, respectively. This variance may be attributed to the structural and morphological changes in the TiO2 layer caused by the CdS content, as confirmed by XRD, optical, and SEM microscopy. The PL spectra showed several emission peaks at different wavelengths. Most of the peaks occurred in the visible region, which is primarily due to radiative, band-to-band recombination, and vacancy defects. The decrease in the material resistivity after the incorporation of CdS into TiO2 was determined by the Van der Pauw method.
Additionally, the impact of the proposed ETMs on different perovskite materials was evaluated by numerical modelling. The simulation findings showed that TiO2:CdS has superior optoelectronic properties, resulting in a greater PCE than those of the other ETMs. The primary difficulty in obtaining PSC technology is developing improved absorber materials with high efficiency, high stability, and low-cost manufacturing properties. This paper also presents a framework for efficiently utilizing different absorbers, notably Cs2BiCuI6, in PSC device designs.

Author Contributions

Conceptualization, G.A.N.; Resources, S.S.H. and G.A.N.; methodology, A.Z., G.A.N. and A.S.; software, A.Z., G.A.N. and M.R.; formal analysis, M.K., G.A.N., A.Z. and A.A.S.; writing—original draft preparation, A.Z., G.A.N. and A.A.S.; writing—review and editing, G.A.N., M.R., S.N.S.B. and S.S.H.; project administration, S.S.H., M.A.S. and A.A.; funding acquisition, M.A.S. and A.A. All authors have read and agreed to the published version of the manuscript.

Funding

This research was funded by the Researchers Supporting Project (RSP-2023R269) at King Saud University, Riyadh, Saudi Arabia.

Data Availability Statement

The data presented in this study are available from the corresponding author upon request.

Acknowledgments

The authors would like to acknowledge the Researcher’s Supporting Project Number (RSP2023R269), King Saud University, Riyadh, Saudi Arabia, for their support in this work.

Conflicts of Interest

The authors declare no conflict of interest.

Abbreviations

TiO2: Titanium dioxide; CdS: Cadmium Sulfide; LEDs: Light Emitting Diodes; CVD: Chemical Vapor Deposition; PVD: Physical Vapor Deposition; ETM: Electron Transport Material; TCO: Transparent Conducting Oxide Film; PV: Photovoltaic; PSCs: Perovskite Solar Cells; PCE: Power Conversion Efficiency; 1D: One dimensional; ZnO: Zinc Oxide; SnO2: Tin Dioxide; ETMs: Electron Transport Materials; PSC: Perovskite Solar Cell; Zn2SnO4: Zinc Stanate; BaSnO3: Barium Tin Trioxide; CIGS: Copper indium gallium (di)selenide; CdTe: Cadmium Telluride; CuI: Copper Iodide; IPA: Isopropyl Alcohol; g: gram; A: Ampare; UV-Vis: Ultraviolet-Visible; nm: Nanometer; FTIR: Fourier Transform Infrared Spectroscopy; cm−1: per centimeter; CCD: Charge-Coupled Device; VDP: Van der Pauw; HTL: Hole Transport Layer; ETL: Electron Transport Layer; FTO: Au: Gold; %: Percantage; α: Absorption coefficient; h: Planck’s constant; v: frequency; Eg: Energy gap; eV: Electron Volt; Cd: Cadmium; S: Sulphur; Ti: Titanium; O: Oxygen; PL: Photolumniscence; cm: Centimeter; CH3NH3PbI3: Methyl ammonium lead iodide; Cs2BiCuI6: Cesium bismuth copper iodide; (FA)2BiCuI6: Formamidinum bismuth copper iodide; (MA)2BiCuI6: Methyl ammonium bismuth copper iodide; HTM: Hole Transport Material; J: Current Density; V: voltage; Jsc: Short Circuit Density; Voc: Open Circuit Voltage; FF: Fill Factor; N2: Nitrogen gass; cm−3: Per Cubic Centimeter.

References

  1. Bhatti, M.A.; Shah, A.A.; Almaani, K.F.; Tahira, A.; Chandio, A.D.; Willander, M.; Nur, O.; Mugheri, A.Q.; Bhatti, A.L.; Waryani, B.; et al. TiO2/ZnO Nanocomposite Material for Efficient Degradation of Methylene Blue. J. Nanosci. Nanotechnol. 2021, 21, 2511–2519. [Google Scholar] [CrossRef]
  2. Bhatti, M.A.; Gilani, S.J.; Shah, A.A.; Channa, I.A.; Almani, K.F.; Chandio, A.D.; Halepoto, I.A.; Tahira, A.; Bin Jumah, M.N.; Ibupoto, Z.H. Effective Removal of Methylene Blue by Surface Alteration of TiO2 with Ficus Carica Leaf Extract under Visible Light. Nanomaterials 2022, 12, 2766. [Google Scholar] [CrossRef]
  3. Hoffmann, M.R.; Martin, S.T.; Choi, W.; Bahnemann, D.W. Environmental applications of semiconductor photocatalysis. Chem. Rev. 1995, 95, 69–96. [Google Scholar] [CrossRef]
  4. Thompson, T.L.; Yates, J.T. Surface science studies of the photoactivation of TiO2 new photochemical processes. Chem. Rev. 2006, 106, 4428–4453. [Google Scholar] [CrossRef]
  5. Tan, J.; Liu, L.; Li, F.; Chen, Z.; Chen, G.Y.; Fang, F.; Jinsong, G.; Miao, H.; Xiaohong, Z. Screening of Endocrine Disrupting Potential of Surface Waters via an Affinity-Based Biosensor in a Rural Community in the Yellow River Basin, China. Environ. Sci. Technol. 2022, 56, 14350–14360. [Google Scholar]
  6. Baron Jaimes, A.; Jaramillo-Quintero, O.A.; Miranda Gamboa, R.A.; Medina-Flores, A.; Rincon, M.E. Functional ZnO/TiO2 Bilayer as Electron Transport Material for Solution-Processed Sb2S3 Solar Cells. Sol. RRL 2021, 5, 2000764. [Google Scholar] [CrossRef]
  7. Li, H.; Wang, X.; Xu, J.; Zhang, Q.; Bando, Y.; Golberg, D.; Ma, Y.; Zhai, T. One-dimensional CdS nanostructures: A promising candidate for optoelectronics. Adv. Mater. 2013, 25, 3017–3037. [Google Scholar] [CrossRef]
  8. Hullavarad, N.; Karulkar, P. Cadmium sulphide (CdS) nanotechnology: Synthesis and applications. J. Nanosci. Nanotechnol. 2008, 8, 3272–3299. [Google Scholar] [CrossRef]
  9. Müller, J.; Kluth, O.; Wieder, S.; Siekmann, H.; Schöpe, G.; Reetz, W.; Vetterl, O.; Lundszien, D.; Lambertz, A.; Finger, F.; et al. Development of highly efficient thin film silicon solar cells on texture-etched zinc oxide-coated glass substrates. Sol. Energy Mater. Sol. Cells 2001, 66, 275–281. [Google Scholar] [CrossRef]
  10. Yu, F. Internal Polarization Effect in Perovskite Solar Cells; University of Pittsburgh: Pittsburgh, PA, USA, 2016. [Google Scholar]
  11. Conings, B.; Baeten, L.; Jacobs, T.; Dera, R.; D’Haen, J.; Manca, J.; Boyen, H.G. An easy-to-fabricate low-temperature TiO2 electron collection layer for high efficiency planar heterojunction perovskite solar cells. APL Mater. 2014, 2, 081505. [Google Scholar] [CrossRef]
  12. Liu, D.; Kelly, T.L. Perovskite solar cells with a planar heterojunction structure prepared using room-temperature solution processing techniques. Nat. Photonics 2014, 8, 133–138. [Google Scholar] [CrossRef]
  13. Kojima, A.; Teshima, K.; Miyasaka, T.; Shirai, Y. Novel photoelectrochemical cell with mesoscopic electrodes sensitized by lead-halide compounds (2). In ECS Meeting Abstracts; IOP Publishing: Bristol, UK, 2006. [Google Scholar]
  14. Kojima, A.; Teshima, K.; Shirai, Y.; Miyasaka, T. Organometal halide perovskites as visible-light sensitizers for photovoltaic cells. J. Am. Chem. Soc. 2009, 131, 6050–6051. [Google Scholar] [CrossRef] [PubMed]
  15. Im, J.H.; Lee, C.R.; Lee, J.W.; Park, S.W.; Park, N.G. 6.5% efficient perovskite quantum-dot-sensitized solar cell. Nanoscale 2011, 3, 4088–4093. [Google Scholar] [CrossRef] [Green Version]
  16. Anttu, N. Shockley–Queisser detailed balance efficiency limit for nanowire solar cells. ACS Photonics 2015, 2, 446–453. [Google Scholar] [CrossRef]
  17. Sha, W.E.; Ren, X.; Chen, L.; Choy, W.C. The efficiency limit of CH3NH3PbI3 perovskite solar cells. Appl. Phys. Lett. 2015, 106, 221104. [Google Scholar] [CrossRef] [Green Version]
  18. Law, M.; Greene, L.E.; Johnson, J.C.; Saykally, R.; Yang, P. Nanowire dye-sensitized solar cells. Nat. Mater. 2005, 4, 455–459. [Google Scholar] [CrossRef]
  19. Lv, Y.; Cai, B.; Wu, Y.; Wang, S.; Jiang, Q.; Ma, Q.; Liu, J.J.; Zhang, W.H. High performance perovskite solar cells using TiO2 nanospindles as ultrathin mesoporous layer. J. Energy Chem. 2018, 27, 951–956. [Google Scholar] [CrossRef] [Green Version]
  20. Yang, G.; Tao, H.; Qin, P.; Ke, W.; Fang, G. Recent progress in electron transport layers for efficient perovskite solar cells. J. Mater. Chem. A 2016, 4, 3970–3990. [Google Scholar] [CrossRef]
  21. Jeon, N.J.; Noh, J.H.; Kim, Y.C.; Yang, W.S.; Ryu, S.; Seok, S.I. Solvent engineering for high-performance inorganic–organic hybrid perovskite solar cells. Nat. Mater. 2014, 13, 897–903. [Google Scholar] [CrossRef]
  22. Yang, W.S.; Noh, J.H.; Jeon, N.J.; Kim, Y.C.; Ryu, S.; Seo, J.; Seok, S.I. High-performance photovoltaic perovskite layers fabricated through intramolecular exchange. Science 2015, 348, 1234–1237. [Google Scholar] [CrossRef]
  23. Song, J.; Zheng, E.; Bian, J.; Wang, X.F.; Tian, W.; Sanehira, Y.; Miyasaka, T. Low-temperature SnO2-based electron selective contact for efficient and stable perovskite solar cells. J. Mater. Chem. A 2015, 3, 10837–10844. [Google Scholar] [CrossRef]
  24. Kumar, M.H.; Yantara, N.; Dharani, S.; Graetzel, M.; Mhaisalkar, S.; Boix, P.P.; Mathews, N. Flexible, low-temperature, solution processed ZnO-based perovskite solid state solar cells. Chem. Commun. 2013, 49, 11089–11091. [Google Scholar] [CrossRef]
  25. Son, D.Y.; Im, J.H.; Kim, H.S.; Park, N.G. 11% efficient perovskite solar cell based on ZnO nanorods: An effective charge collection system. J. Phys. Chem. C 2014, 118, 16567–16573. [Google Scholar] [CrossRef]
  26. Mali, S.S.; Shim, C.S.; Kim, H.; Patil, P.S.; Hong, C.K. In situ processed gold nanoparticle-embedded TiO2 nanofibers enabling plasmonic perovskite solar cells to exceed 14% conversion efficiency. Nanoscale 2016, 8, 2664–2677. [Google Scholar] [CrossRef]
  27. Shin, S.S.; Yeom, E.J.; Yang, W.S.; Hur, S.; Kim, M.G.; Im, J.; Seo, J.; Noh, J.H.; Seok, S.I. Colloidally prepared La-doped BaSnO3 electrodes for efficient, photostable perovskite solar cells. Science 2017, 356, 167–171. [Google Scholar] [CrossRef]
  28. Zhu, J.; Liu, X.; Geier, M.L.; McMorrow, J.J.; Jariwala, D.; Beck, M.E.; Huang, W.; Marks, T.J.; Hersam, M.C. Layer-by-layer assembled 2D montmorillonite dielectrics for solution-processed electronics. Adv. Mater. 2016, 28, 63–68. [Google Scholar] [CrossRef]
  29. Xie, H.; Yin, X.; Liu, J.; Guo, Y.; Chen, P.; Que, W.; Wang, G.; Gao, B. Low temperature solution-derived TiO2-SnO2 bilayered electron transport layer for high performance perovskite solar cells. Appl. Surf. Sci. 2019, 464, 700–707. [Google Scholar] [CrossRef]
  30. Xu, X.; Zhang, H.; Shi, J.; Dong, J.; Luo, Y.; Li, D.; Meng, Q. Highly efficient planar perovskite solar cells with a TiO2/ZnO electron transport bilayer. J. Mater. Chem. A 2015, 3, 19288–19293. [Google Scholar] [CrossRef]
  31. Chai, W.; Zhu, W.; Chen, D.; Chen, D.; Xi, H.; Chang, J.; Zhang, J.; Zhang, C.; Hao, Y. Combustion-processed NiO/ALD TiO2 bilayer as a novel low-temperature electron transporting material for efficient all-inorganic CsPbIBr2 solar cell. Sol. Energy 2020, 203, 10–18. [Google Scholar] [CrossRef]
  32. Dunlap-Shohl, W.A.; Younts, R.; Gautam, B.; Gundogdu, K.; Mitzi, D.B. Effects of Cd diffusion and doping in high-performance perovskite solar cells using CdS as electron transport layer. J. Phys. Chem. C 2016, 120, 16437–16445. [Google Scholar] [CrossRef]
  33. Wessendorf, C.D.; Hanisch, J.; Müller, D.; Ahlswede, E. CdS as Electron Transport Layer for Low-Hysteresis Perovskite Solar Cells. Sol. RRL 2018, 2, 1800056. [Google Scholar] [CrossRef]
  34. Luo, C.; Jiang, P.; Hu, L.; Bian, M.; Wan, L.; Niu, H.; Mao, X.; Zhou, R.; Xu, J. Constructing CdS-Based Electron Transporting Layers With Efficient Electron Extraction for Perovskite Solar Cells. IEEE J. Photovolt. 2021, 11, 1014–1021. [Google Scholar] [CrossRef]
  35. Gu, Z.; Chen, F.; Zhang, X.; Liu, Y.; Fan, C.; Wu, G.; Li, H.; Chen, H. Novel planar heterostructure perovskite solar cells with CdS nanorods array as electron transport layer. Sol. Energy Mater. Sol. Cells 2015, 140, 396–404. [Google Scholar] [CrossRef]
  36. Lin, L.; Jiang, L.; Qiu, Y.; Yu, Y. Modeling and analysis of HTM-free perovskite solar cells based on ZnO electron transport layer. Superlattices Microstruct. 2017, 104, 167–177. [Google Scholar] [CrossRef]
  37. Chakraborty, K.; Choudhury, M.G.; Paul, S. Numerical study of Cs2TiX6 (X = Br, I, F and Cl) based perovskite solar cell using SCAPS-1D device simulation. Sol. Energy 2019, 194, 886–892. [Google Scholar] [CrossRef]
  38. Karthick, S.; Velumani, S.; Bouclé, J. Experimental and SCAPS simulated formamidinium perovskite solar cells: A comparison of device performance. Sol. Energy 2020, 205, 349–357. [Google Scholar] [CrossRef]
  39. Nowsherwan, G.A.; Hussain, S.S.; Khan, M.; Haider, S.; Akbar, I.; Nowsherwan, N.; Ikram, S.; Ishtiaq, S.; Riaz, S.; Naseem, S. Role of graphene-oxide and reduced-graphene-oxide on the performance of lead-free double perovskite solar cell. Zeitschrift für Naturforschung A 2022, 77, 1083–1098. [Google Scholar] [CrossRef]
  40. Abdelaziz, S.; Zekry, A.; Shaker, A.; Abouelatta, M. Investigating the performance of formamidinium tin-based perovskite solar cell by SCAPS device simulation. Opt. Mater. 2020, 101, 109738. [Google Scholar] [CrossRef]
  41. Hussain, S.S.; Riaz, S.; Nowsherwan, G.A.; Jahangir, K.; Raza, A.; Iqbal, M.J.; Sadiq, I.; Hussain, S.M.; Naseem, S. Numerical modeling and optimization of lead-free hybrid double perovskite solar cell by using SCAPS-1D. J. Renew. Energy 2021, 2021, 6668687. [Google Scholar] [CrossRef]
  42. Kumar, M.; Raj, A.; Kumar, A.; Anshul, A. An optimized lead-free formamidinium Sn-based perovskite solar cell design for high power conversion efficiency by SCAPS simulation. Opt. Mater. 2020, 108, 110213. [Google Scholar] [CrossRef]
  43. Samiul Islam, M.; Sobayel, K.; Al-Kahtani, A.; Islam, M.A.; Muhammad, G.; Amin, N.; Shahiduzzaman, M.; Akhtaruzzaman, M. Defect study and modelling of SnX3-based perovskite solar cells with SCAPS-1D. Nanomaterials 2021, 11, 1218. [Google Scholar] [CrossRef]
  44. Haider, S.Z.; Anwar, H.; Wang, M. A comprehensive device modelling of perovskite solar cell with inorganic copper iodide as hole transport material. Semicond. Sci. Technol. 2018, 33, 035001. [Google Scholar] [CrossRef] [Green Version]
  45. Chen, W.-K. Fundamentals of Circuits and Filters; CRC Press: Boca Raton, FL, USA, 2018. [Google Scholar]
  46. Lisičar Vukušić, J. Multidisciplinary Approach in Industrial Baker′ s Yeast Production: From Manufacture to Integrated Sustainability; Institutionelles Repositorium der Leibniz Universität Hannover: Hannover, Germany, 2019. [Google Scholar]
  47. Förster, H. UV/vis spectroscopy. Molecular Sieves—Science and Technology; Characterization I; Springer: Berlin/Heidelberg, Germany, 2004; pp. 337–426. [Google Scholar]
  48. Picollo, M.; Aceto, M.; Vitorino, T. UV-Vis spectroscopy. Phys. Sci. Rev. 2019, 4. [Google Scholar] [CrossRef]
  49. Ennaoui, A.; Sankapal, B.R.; Skryshevsky, V.; Lux-Steiner, M.C. TiO2 and TiO2–SiO2 thin films and powders by one-step soft-solution method: Synthesis and characterizations. Sol. Energy Mater. Sol. Cells 2006, 90, 1533–1541. [Google Scholar] [CrossRef]
  50. Purkayastha, D.D.; Krishna, M.G. Dopant controlled photoinduced hydrophilicity and photocatalytic activity of SnO2 thin films. Appl. Surf. Sci. 2018, 447, 724–731. [Google Scholar]
  51. Noh, Y.W.; Jin, I.S.; Kim, K.S.; Park, S.H.; Jung, J.W. Reduced energy loss in SnO2/ZnO bilayer electron transport layer-based perovskite solar cells for achieving high efficiencies in outdoor/indoor environments. J. Mater. Chem. A 2020, 8, 17163–17173. [Google Scholar] [CrossRef]
  52. De Sá, R.G.; Arantes, T.M.; de Macedo, E.F.; Dona, L.M.; Pereira, J.C.; Hurtado, C.R.; Varghese, R.J. Photoprotective activity of zirconia nanoparticles. Colloids Surf. B: Biointerfaces 2021, 202, 111636. [Google Scholar] [CrossRef]
  53. Hassan, Q.M.; Manshad, R. Surface morphology and optical limiting properties of azure B doped PMMA film. Opt. Mater. 2019, 92, 22–29. [Google Scholar] [CrossRef]
  54. Bota, V.B.; Turcuș, V.; Mihali, C.V.; Arsene, G.G.; Ivănescu, L.C.; Zamfirache, M.M. Anatomical investigations on Oenothera biennis L. using optical microscopy and scanning electron microscopy (SEM). Res. J. Agric. Sci. 2020, 52, 11. [Google Scholar]
  55. Ramadan, A.; Gould, R.; Ashour, A. On the Van der Pauw method of resistivity measurements. Thin Solid Film. 1994, 239, 272–275. [Google Scholar] [CrossRef]
  56. L Liu, F.; Zhu, J.; Wei, J.; Li, Y.; Lv, M.; Yang, S.; Zhang, B.; Yao, J.; Dai, S. Numerical simulation: Toward the design of high-efficiency planar perovskite solar cells. Appl. Phys. Lett. 2014, 104, 253508. [Google Scholar] [CrossRef]
  57. Burgelman, M.; Nollet, P.; Degrave, S. Modelling polycrystalline semiconductor solar cells. Thin Solid Film. 2000, 361, 527–532. [Google Scholar] [CrossRef]
  58. Mohsin, A.K.; Bidin, N. Effect of CdS thickness on the optical and structural properties of TiO2/CdS nanocomposite film. In Advanced Materials Research; Trans Tech Publications Ltd.: Zurich, Switzerland, 2015. [Google Scholar]
  59. Shi, J.W.; Yan, X.; Cui, H.J.; Zong, X.; Fu, M.L.; Chen, S.; Wang, L. Low-temperature synthesis of CdS/TiO2 composite photocatalysts: Influence of synthetic procedure on photocatalytic activity under visible light. J. Mol. Catal. A Chem. 2012, 356, 53–60. [Google Scholar] [CrossRef]
  60. Ripathi, A.K.; Singh, M.K.; Mathpal, M.C.; Mishra, S.K.; Agarwal, A. Study of structural transformation in TiO2 nanoparticles and its optical properties. J. Alloys Compd. 2013, 549, 114–120. [Google Scholar] [CrossRef]
  61. Ramadan, R.; Manso-Silván, M.; Martín-Palma, R.J. Hybrid porous silicon/silver nanostructures for the development of enhanced photovoltaic devices. J. Mater. Sci. 2020, 55, 5458–5470. [Google Scholar] [CrossRef]
  62. Chrysicopoulou, P.; Davazoglou, D.; Trapalis, C.; Kordas, G. Optical properties of very thin (<100 nm) sol–gel TiO2 films. Thin Solid Film. 1998, 323, 188–193. [Google Scholar]
  63. Sahay, P.P.; Nath, R.K.; Tewari, S. Optical properties of thermally evaporated CdS thin films. Cryst. Res. Technol. J. Exp. Ind. Crystallogr. 2007, 42, 275–280. [Google Scholar] [CrossRef]
  64. Thamaphat, K.; Limsuwan, P.; Ngotawornchai, B. Phase characterization of TiO2 powder by XRD and TEM. Agric. Nat. Resour. 2008, 42, 357–361. [Google Scholar]
  65. Vishwas, M.; Shamala, K.S.; Gandla, S.B. Comparison of optical properties of CdS thin films synthesized by spray pyrolysis and thermal evaporation method. J. Opt. 2022, 51, 736–740. [Google Scholar] [CrossRef]
  66. Kumar, S.; Sharma, J.K. Stable phase CdS nanoparticles for optoelectronics: A study on surface morphology, structural and optical characterization. Mater. Sci. Pol. 2016, 34, 368–373. [Google Scholar] [CrossRef] [Green Version]
  67. Esakkiraj, E.; Kadhar, S.S.A.; Henry, J.; Mohanraj, K.; Kannan, S.; Barathan, S.; Sivakumar, G. Optostructral and vibrational characteristics of Cu:CdS nanoparticles by precipitation method. Optik 2013, 124, 5229–5231. [Google Scholar] [CrossRef]
  68. Slam, M.A.; Haque, F.; Rahman, K.S.; Dhar, N.; Hossain, M.S.; Sulaiman, Y.; Amin, N. Effect of oxidation on structural, optical and electrical properties of CdS thin films grown by sputtering. Optik 2015, 126, 3177–3180. [Google Scholar]
  69. Nam, S.-H.; Cho, S.-J.; Boo, J.-H. Growth behavior of titanium dioxide thin films at different precursor temperatures. Nanoscale Res. Lett. 2012, 7, 89. [Google Scholar] [CrossRef] [PubMed] [Green Version]
  70. Haider, A.J.; Thamir, A.D.; Najim, A.A.; Ali, G.A. Improving efficiency of TiO2: Ag/Si solar cell prepared by pulsed laser deposition. Plasmonics 2017, 12, 105–115. [Google Scholar] [CrossRef]
  71. Abdullah, S.A.; Sahdan, M.Z.; Nafarizal, N.; Saim, H.; Bakri, A.S.; Rohaida, C.C.; Adriyanto, F.; Sari, Y. Photoluminescence study of trap-state defect on TiO2 thin films at different substrate temperature via RF magnetron sputtering. J. Phys. Conf. Ser. 2018, 995, 012067. [Google Scholar] [CrossRef]
  72. Ohta, S.; Sekiya, T.; Kurita, S. Pressure dependence of optical properties of anatase TiO2 single crystal. Phys. Status Solidi B 2001, 223, 265–269. [Google Scholar] [CrossRef]
  73. Abazović, N.D.; Čomor, M.I.; Dramićanin, M.D.; Jovanović, D.J.; Ahrenkiel, S.P.; Nedeljković, J.M. Photoluminescence of anatase and rutile TiO2 particles. J. Phys. Chem. B 2006, 110, 25366–25370. [Google Scholar] [CrossRef]
  74. Daude, N.; Gout, C.; Jouanin, C. Electronic band structure of titanium dioxide. Phys. Rev. B 1977, 15, 3229. [Google Scholar] [CrossRef]
  75. Pham, H.H.; Wang, L.-W. Oxygen vacancy and hole conduction in amorphous TiO2. Phys. Chem. Chem. Phys. 2015, 17, 541–550. [Google Scholar] [CrossRef]
  76. Rajabi, M.; Shogh, S. Defect study of TiO2 nanorods grown by a hydrothermal method through photoluminescence spectroscopy. J. Lumin. 2015, 157, 235–242. [Google Scholar] [CrossRef]
  77. Rahman, M.M.; Krishna, K.M.; Soga, T.; Jimbo, T.; Umeno, M. Optical properties and X-ray photoelectron spectroscopic study of pure and Pb-doped TiO2 thin films. J. Phys. Chem. Solids 1999, 60, 201–210. [Google Scholar] [CrossRef]
  78. Tang, H.; Prasad, K.; Sanjines, R.; Schmid, P.E.; Levy, F. Electrical and optical properties of TiO2 anatase thin films. J. Appl. Phys. 1994, 75, 2042–2047. [Google Scholar] [CrossRef]
  79. Chandekar, K.V.; Shkir, M.; Alshahrani, T.; Khan, A.; AlFaify, S. An in-depth investigation of physical properties of Nd doped CdS thin films for optoelectronic applications. Chin. J. Phys. 2020, 67, 681–694. [Google Scholar] [CrossRef]
  80. Islam, M.A.; Misran, H.; Akhtaruzzaman, M.; Amin, N. Influence of oxygen on structural and optoelectronic properties of CdS thin film deposited by magnetron sputtering technique. Chin. J. Phys. 2020, 67, 170–179. [Google Scholar] [CrossRef]
  81. Kim, D.; Park, Y.; Kim, M.; Choi, Y.; Park, Y.S.; Lee, J. Optical and structural properties of sputtered CdS films for thin film solar cell applications. Mater. Res. Bull. 2015, 69, 78–83. [Google Scholar] [CrossRef]
  82. Tan, K.; Lin, P.; Wang, G.; Liu, Y.; Xu, Z.; Lin, Y. Controllable design of solid-state perovskite solar cells by SCAPS device simulation. Solid-State Electron. 2016, 126, 75–80. [Google Scholar] [CrossRef]
  83. Moreh, A.U.; Momoh, M.; Hamza, B.; Abdullahi, S.; Yahya, H.N.; Namadi, S.; Umar, S. Influence of Substrate Temperature on Electrical Resistivity and Surface Morphology of CuAlS2 Thin Films Prepared by Vacuum Thermal Evaporation Method. UDUS Open Educ. Resour. 2014, 3, 45–147. [Google Scholar]
  84. Pham, H.Q.; Holmes, R.J.; Aydil, E.S.; Gagliardi, L. Lead-free double perovskites Cs2InCuCl6 and (CH3NH3)2InCuCl6: Electronic, optical, and electrical properties. Nanoscale 2019, 11, 11173–11182. [Google Scholar] [CrossRef]
  85. Seck, S.M.; Ndiaye, E.N.; Fall, M.; Charvet, S. Study of Efficiencies CdTe/CdS Photovoltaic Solar Cell According to Electrical Properties by Scaps Simulation. Nat. Resour. 2020, 11, 147–155. [Google Scholar] [CrossRef] [Green Version]
  86. Ball, J.M.; Stranks, S.D.; Hörantner, M.T.; Hüttner, S.; Zhang, W.; Crossland, E.J.; Ramirez, I.; Riede, M.; Johnston, M.B.; Friend, R.H.; et al. Optical properties and limiting photocurrent of thin-film perovskite solar cells. Energy Environ. Sci. 2015, 8, 602–609. [Google Scholar] [CrossRef]
  87. Roknuzzaman, M.; Zhang, C.; Ostrikov, K.K.; Du, A.; Wang, H.; Wang, L.; Tesfamichael, T. Electronic and optical properties of lead-free hybrid double perovskites for photovoltaic and optoelectronic applications. Sci. Rep. 2019, 9, 718. [Google Scholar] [CrossRef] [PubMed] [Green Version]
  88. Banyamin, Z.Y.; Kelly, P.J.; West, G.; Boardman, J. Electrical and optical properties of fluorine doped tin oxide thin films prepared by magnetron sputtering. Coatings 2014, 4, 732–746. [Google Scholar] [CrossRef] [Green Version]
  89. Filipič, M.; Löper, P.; Niesen, B.; De Wolf, S.; Krč, J.; Ballif, C.; Topič, M. CH3NH3PbI3 perovskite/silicon tandem solar cells: Characterization based optical simulations. Opt. Express 2015, 23, A263–A278. [Google Scholar] [CrossRef] [PubMed] [Green Version]
  90. Zhou, H.; Chen, Q.; Li, G.; Luo, S.; Song, T.B.; Duan, H.S.; Hong, Z.; You, J.; Liu, Y.; Yang, Y. Interface engineering of highly efficient perovskite solar cells. Science 2014, 345, 542–546. [Google Scholar] [CrossRef] [PubMed]
  91. Saliba, M.; Matsui, T.; Seo, J.Y.; Domanski, K.; Correa-Baena, J.P.; Nazeeruddin, M.K.; Zakeeruddin, S.; Tress, W.; Abate, A.; Hagfeldt, A.; et al. Cesium-containing triple cation perovskite solar cells: Improved stability, reproducibility and high efficiency. Energy Environ. Sci. 2016, 9, 1989–1997. [Google Scholar] [CrossRef] [Green Version]
  92. Taherianfard, H.; Kim, G.; Byranvand, M.; Choi, K.; Kang, G.; Choi, H.; Tajabadi, F.; Taghavinia, N.; Park, T. Effective Management of Nucleation and Crystallization Processes in Perovskite Formation via Facile Control of Antisolvent Temperature. ACS Appl. Energy Mater. 2020, 3, 1506–1514. [Google Scholar] [CrossRef]
  93. Chen, B.; Bai, Y.; Yu, Z.; Li, T.; Zheng, X.; Dong, Q.; Shen, L.; Boccard, M.; Gruverman, A.; Holman, Z.; et al. Efficient semitransparent perovskite solar cells for 23.0%-efficiency perovskite/silicon four-terminal tandem cells. Adv. Energy Mater. 2016, 6, 1601128. [Google Scholar] [CrossRef]
Figure 1. Schematic diagram of thermal evaporation.
Energies 16 00900 g001
Figure 2. Thin film preparation steps.
Energies 16 00900 g002
Figure 3. Energy band diagram of PSC with ETM (a) TiO2, (b) CdS, and (c) TiO2:CdS.
Energies 16 00900 g003
Figure 4. (a) Absorbance and transmission spectra of TiO2, (b) absorbance and transmission spectra of CdS, (c) absorbance and transmission spectra of TiO2:CdS, and (d) Tauc plot (band gap) of prepared samples.
Energies 16 00900 g004
Figure 5. (a) XRD pattern of TiO2 nanopowder and thin film; (b) XRD pattern of CdS nanopowder and thin film.
Energies 16 00900 g005
Figure 6. FTIR spectra for deposited thin films.
Energies 16 00900 g006
Figure 7. Optical microscopy of (a) CdS, (b) TiO2, and (c) TiO2:CdS thin films at 1000×.
Energies 16 00900 g007
Figure 8. SEM microscopy of (a,b) CdS, (c,d) TiO2, and (e,f) TiO2:CdS thin films.
Energies 16 00900 g008
Figure 9. (a) PL spectra of TiO2 and TiO2:CdS at 250 nm excitation wavelength; (b) PL spectra of TiO2 and TiO2:CdS at 325 nm excitation wavelength.
Energies 16 00900 g009
Figure 10. (a) PL spectra of CdS at 360 nm excitation wavelength; (b) PL spectra of CdS at 410 nm excitation wavelength.
Energies 16 00900 g010
Figure 11. J–V Curve of different perovskite materials with ETM (a) TiO2, (b) CdS, and (c) TiO2:CdS.
Energies 16 00900 g011
Figure 12. Power conversion efficiency comparison of different ETMs and perovskite materials.
Energies 16 00900 g012
Figure 13. QE curve of different perovskite materials with ETM: (a) TiO2, (b) CdS, and (c) TiO2:CdS.
Energies 16 00900 g013
Table 3. Performance comparison of different ETMs and perovskite material.
Active MaterialsVoc (V)Jsc (mA/cm2)FF (%)PCE (%)
TiO2 as ETM
(MA)2BiCuI6 0.943216.9676.1412.18
(FA)2BiCuI60.954423.8575.8217.25
Cs2BiCuI60.957526.4675.1019.02
CH3NH3PbI30.964631.9175.4223.20
CdS as ETM
(MA)2BiCuI6 0.944317.5776.0112.60
(FA)2BiCuI60.955424.5975.6517.76
Cs2BiCuI60.958427.1175.0319.48
CH3NH3PbI30.965432.5375.3223.64
TiO2:CdS as ETM
(MA)2BiCuI60.946118.6375.5313.31
(FA)2BiCuI60.956125.2575.2518.16
Cs2BiCuI60.958927.6574.6219.77
CH3NH3PbI30.965632.8874.9323.78
Table 4. Comparison of published work with simulated device designs.
Active MaterialsVoc (V)Jsc (mA/cm2)FF (%)PCE (%)Ref.
Experimental Results
SpiroMeOTAD/(CH3NH3PbI3)/TiO2:Y1.1322.7575.0119.3[90]
FAPBI31.0624.477.520.1[22]
Perovskite/SnO21.1222.6976.220.9[91]
Cs+/MA+/FA-mixing cations1.1624.07521.1[92]
LBSO/CH3NH3PbI31.0723.478.621.2[27]
Combined Silicon/Perovskite cells1.0816.574.123.0[93]
Simulation Results
(MA)2BiCuI6/TiO2:CdS0.946118.6375.5313.31This Study
(FA)2BiCuI6/TiO2:CdS0.956125.2575.2518.16This Study
Cs2BiCuI6/TiO2:CdS0.958927.6574.6219.77This Study
CH3NH3PbI3/TiO2:CdS0.965632.8874.9323.78This Study
Disclaimer/Publisher’s Note: The statements, opinions and data contained in all publications are solely those of the individual author(s) and contributor(s) and not of MDPI and/or the editor(s). MDPI and/or the editor(s) disclaim responsibility for any injury to people or property resulting from any ideas, methods, instructions or products referred to in the content.