1. Introduction
The current energy crisis has been caused by global warming and an ever-increasing demand for energy. It is becoming more and more essential in today’s society to develop and improve sustainable energy management systems. One of the main sources of renewable energy is the use of solar energy, specifically a photovoltaic (PV) energy management system. This paper looks at one of the key elements of a PV energy management system, the battery charger. Battery charging allows generated solar energy to be stored and used later when the system is not generating from sunlight. It is therefore increasingly important that a traditional conventional solar energy management system provides efficient conversion and inversion to avoid losses. The designed energy management system used in this study contains a battery to provide a supplement of power to the home load when the energy generated from the PV panels is not sufficient to meet the home load demand. This can be during partial shading conditions or even during the night where the load requirements are typically reduced for residential applications. The battery requires a bidirectional charger circuit to allow it to be charged and discharged. It is important to ensure that the DC/DC conversion is highly efficient such that the maximum power point (MPP) is utilized to drive the battery charger circuit in this system. The circuit must utilize the MPP for various environmental conditions.
Figure 1 shows the overall system configuration; it includes the PV source, interleaved switched capacitor H-bridge inverter, and the interleaved bidirectional DC/DC battery charger. The MPPT and PWM control blocks are also shown in
Figure 1.
The circuit and the method of control for the DC/AC inverter that serves an AC home load is shown outside of the dashed box in
Figure 1. The inverter has two switched capacitor stages that are interleaved to provide optimal output characteristics. The two interleaved switched capacitors then feed an H-bridge inverter. The inverter circuit is controlled via a phase-shifted unipolar sinusoidal PWM control strategy with a voltage RMS feedback loop. The AC home load for the proposed system is 240 V, 50 Hz and is fixed at 2 kW. The full description and investigation of this inverter and control strategy is described in [
1]; however, there is no focused description or investigation into the performance of the interleaved battery charger circuit or control strategy. The method proposed in this study has been successfully integrated and combined with the inverter described in [
1] and this study focuses on the performance of the battery charger circuit and how it performs when the input conditions for the PV array vary. The results are then compared with both an interleaved voltage-controlled battery charger and a non-interleaved voltage-controlled battery charger.
1.1. PV Panel and Maximum Power Point Tracking Algorithm
A graphical analysis of a PV array output I-V curve is shown in
Figure 2. The PV array—I-V and P-V characteristics are shown below; the bend of the curve is the theoretical maximum power point (MPP).
Theoretically, when implemented a PV panel will rarely be at the peak power capability. This is the basic principle used for measuring the voltage and current and therefore calculating and tracking the MPP. There are many different methods for MPPT; each has advantages and disadvantages.
The P&O and I&C methods are more complex by nature and require more calculation as they do not rely on reference data for comparison. They also provide a true MPP due to the measuring that is performed as part of the method. The I&C method can determine the MPP without oscillations around MPP whereas the P&O method does oscillate. P&O is more adaptable under varying conditions (temperature and irradiance) and due to the amount of calculation required for the I&C method, the P&O method will dictate a lower sampling frequency for the energy management system.
A study conducted in [
2] summarized the findings of a deep review into all methods of MPPT that have been published from 2015–2020 and it summarized and compared multiple methods [
2,
3]. The main findings from this review centered around categorizing methods into one of three methods. Firstly, online methods where readings and measurements are taken in the form of sensors. Secondly, offline methods that are pre-configured models; based on the PV panel characteristics, the system is configured and controlled to ensure that it reaches optimal conditions. Finally, hybrid methods where systems combine more than one method to effectively track MPP under varying environmental conditions. The conclusion of this analysis stated that hybrid systems are faster and more accurate than conventional systems; however, the complexity leads to installation/integration difficulties for embedded systems. This study focuses on the traditional and modified P&O MPPT “online” methods to avoid pre-configuration and complexity where possible.
Direct Power P&O MPPT is a novel method of MPPT described in [
4]. The objective of this method is to combat the trade-off between a slow but accurate response caused by a small step-size selection for traditional P&O MPPT methods. This is achieved using two methods of control, firstly, by directly controlling load power and voltage control to regulate the output voltage. This method of P&O MPPT is simulated and validated practically to produce efficiency of up to 95%.
A common method to modify the standard P&O method is to amend the step size, as an increased step size reduces the delayed response time of a P&O MPPT sub-system. It is important however to ensure that the step size is not so large that the MPP is not realized as accurately as possible; therefore, a variable step-size is a suitable modification. This is proposed in [
5] where multiple step sizes are utilized by taking the derivative of Ppv and comparing instantaneous power with delayed power. The ratio of the derivative of Ppv/Vpv is compared to the system error. The conclusion of this study shows that the proposed method is substantially faster and more efficient than the conventional method.
Similarly, in [
6] the principle of variable step sizes is also explored via a different method. Taking a standard Ppv curve, this curve is split into four zones and each zone shows similar trends for varying environmental conditions. This method shows minimal output oscillations and efficient reactions to varying environmental conditions. The circuit must be configured for known step changes in irradiance and temperature; this alleviates the need for complex calculation during the MPPT cycle and therefore results in a faster response time to realize the MPP for the PV panel.
Another common P&O modification is the sliding-mode approach as proposed by in [
7]. A sliding-mode controller nominally exhibits an unstable output known as “chattering”; this adaptation aims to limit and minimize the chattering. Whilst this method does improve the MPPT output characteristic compared with other sliding-mode controllers, it is still unstable compared with other adaptations.
It can be concluded from this review that there have been many different attempts to improve and optimize a standalone PV system through modifications to MPPT approaches. The key finding from analysing the existing literature shows that a hybrid model which involves a combination of two different MPPT elements is the most effective and gives a balance of performance when considering efficiency, response time, and stability. The conventional methods are not good enough individually compared to the hybrid models.
Another important finding from the existing literature shows that non-hybrid model approaches do not totally give optimal or improved performance when compared to conventional methods. Novel approaches give a faster response and improved efficiency; however, they do not always give the most stable response. It can also be concluded that many novel approaches involve pre-configuration of the system to a known or expected dataset. Whilst in an ideal situation this is an ideal approach, in practical systems there are always data that are outliers and in the case of standalone PV systems, weather will always change, and therefore irradiance and temperature will also be changing frequently. Given that a standalone PV system will utilize a battery, the requirement is less for a rapid response time, and more for the quality of the power and the system’s ability to adapt to variable conditions. The approach for this study therefore disregards pre-configured systems that are modelled on known datasets as this will ensure that the system is adaptable for many different applications without the need for redesign or complex pre-configurations.
This system focuses on hybrid MPPT systems using P&O as the foundational conventional approach. The approach in this system combines elements of existing novel approaches; this will include a P&O element with a variable step-size.
1.2. Batteries
A basic lithium-ion battery is being modeled due to its advantages as a cheaper battery. Complex and novel battery technologies are expensive and are therefore not a focus for this study. Lithium-ion batteries are lightweight and over a long period of time show better discharge characteristics than other battery types. A nominal battery voltage on the market would be 12 V. In this system, the DC battery voltage is being set to 48 V which is the equivalent of 3 × 12 V batteries connected in series.
Batteries release stored electricity over time in the form of DC power. As current flows through the battery, a chemical reaction starts. Inside each battery, there are cells containing two electrodes. Electrodes are electrical terminals; one is positive and one is negative. A chemical in liquid form usually separates the two electrodes and it is referred to as an electrolyte. These reactions cause electrons to flow around the circuit. There is a limited supply of these chemicals in the battery for these reactions. When the chemicals are depleted, the chemical reaction stops which means that the electrons will no longer flow around the feeding circuit. In a rechargeable battery, these reactions can run in the opposite direction which allows the materials to return to their beginning state. A battery charger is required to ensure this takes place.
When designing a PV energy management system, the size of the battery must be suitable to supply the home load for the system in an event where Vpv is zero. For the longevity of the battery, the battery must not be totally or nearly totally discharged to support the home load when the PV panel is not generating any electricity. This value is usually below 25% of the battery’s value. An optimal battery charge cycle is shown by the four stages presented in
Figure 3. Stage 1: Bulk, a constant current mode stage of battery charging cycle sees the battery charge up to 80% of its capacity. Stage 2: Absorption, a constant voltage mode. For a 12 V battery in this phase of the charging cycle, the battery voltage is held at 14.5 V and the battery current reduces; during this time, the last 20% of the battery is charged. The battery voltage is held at 14.5 until the battery current reaches approximately 5% of its rated current value. Stage 3: Float, a constant voltage mode, when the battery current reaches 5% of its rated current value the battery voltage drops to 13.5 V. This voltage allows the battery to maintain and hold its charge and does not harm or damage the battery. Stage 4: Equalization, a low-current and high-voltage mode; this protects the electrolyte within the battery via a process called de-sulphation. Whilst this paper does not specifically focus on improving battery life expectancy, it is still important to show that the proposed system can protect the battery from over-charging and over-discharging. A state of charge (SOC) controller has been designed as part of the control strategy for the proposed system and is described below in
Section 2.
1.3. Battery Charging in PV Energy Management Systems
To review other battery charging strategies in PV energy management systems, a meta-analysis review has been conducted. The principle of battery charging is converting from DC/DC; as part of this review, many different combinations of forms of DC/DC converter are reviewed and analysed. A key conclusion of the recent published literature is that a combination of DC/DC and DC/AC conversion is a popular and more efficient method of energy management. The control circuits for these combined converters are complex and there is an increased cost, component, and response time of these designs.
As well as a battery, a super capacitor, ultra-capacitor, or hybrid battery can also be used to store the energy generated by a solar PV system. There are multiple papers that explore adding additional energy storage elements in parallel and controlling them using a separate bidirectional DC/DC converter. This principle can be used to charge multiple batteries. The conclusion of this study shows that charging these storage components in this topology improves the lifecycle and longevity of the components [
8,
9,
10]. For this study, the objective is to simplify the circuit and reduce component count where possible to improve on existing methods. The principle of using the latest battery/capacitor components and multiple DC/DC converters does improve efficiency but does not align with some of the target objectives of this study.
A large proportion of the papers reviewed included a DC boost. A PV system sometimes requires a DC boost such that the PV output is high enough to then be inverted to serve a home load (240 V
ac) [
11]. Prior to the inversion, another buck/boost converter is utilized to charge and discharge a battery and therefore the current must flow in both directions. The MPPT controller will control the boost converter and a combination of a voltage control, and a current control stage serves the bidirectional converter.
A dynamic power management strategy has been proposed in [
12]; this system uses a single stage and a single inductor. A novel bidirectional PWM converter and a phase-shifted switch capacitor converter is described in [
13]. The proposed methodology of phase-shifted switch capacitor conversion with conventional approaches such as Ladder, Dickson, Series-Parallel, and Fibonacci. The advantage of this proposed method is a reduction in switches and capacitors; this leads to a faster and more stable output.
The load efficiency is limited to 95.7%. A differential power processing capable system in a novel approach described in [
14] has a 1 to 1 ratio of PV panel to DC/DC converter; however, the DC/DC converters are connected in parallel to form a multiport converter. The system is controlled by a PWM and phase shift control circuit; the overall efficiency of this system is only 93.3%.
A modified z-source dual input DC/DC converter is proposed in [
15]. The principle of this method is to optimize the power loss by reducing the number of switches which improves the overall efficiency of the system.
A multiport converter with battery charging for a DC load supply that uses a PI controller for voltage control is shown in [
16]. This is like the power management scheme in [
17] where the PV system charges a battery using voltage-control and a transformer. Generally, a transformer is used for a grid-tied system, not a standalone system. Another transformer-based topology is outlined in [
18] where the battery charging circuit is split into two sides, low-voltage (battery side) and high-voltage (PV/MPPT-boost side). This study denotes that isolated power electronic converters are more desirable for large power applications compared with non-isolated power electronic converters such as the bidirectional DC/DC converter.
An example of a current-controlled bidirectional converter is described in [
19]. It is simple by design and there are a limited number of components in the topology compared with other methods. There is no current switching across the diode within the topology which reduces the switching loss of the system. Another similar current-based control strategy is outlined in [
20] where the concept of a dual loop passed PI controller is simulated. This control strategy contains a PWM-based feedback loop for inductor current within another feedback loop to control load voltage [
20].
Multiple studies have been published which include a boost converter controlled by MPPT, a multiport converter, new battery or capacitor technology, or fixed reference voltage control strategies. There are many novel methods that have improved efficiency and reduced component count compared to conventional approaches. This study focuses on a conventional interleaved circuit design to maintain simplicity and it includes a modified control strategy by combining a P&O MPPT algorithm with a current controller without the use of a boost converter.
Section 2 describes the topology of the battery charging and control circuit including the parameters selected using figures and tables.
Section 3 shows the results of the study conducted; these are charts created from data collected from MATLAB/Simulink.
Section 4 discusses these results in line with the findings from
Section 1 to give a view on how the proposed system is comparative with the proposed methodology and theory.
Section 5 concludes the study and discusses limitations or additional work to be considered in the future.
2. Materials and Methods
The method of battery charging used for this part of the energy management system circuit is described as a bidirectional buck/boost DC/ DC Converter and
Figure 4 shows the layout of the components in this configuration.
This topology operates in boost (battery discharging mode) or buck (battery charging Mode) and the basic explanation for the modes of this circuit are as follows:
Boost Mode: G2 gate pulse is high, and the Insulated Gate Bipolar Transistor (IGBT) is switched on. During this mode, G1 can exist in one of two states:
- a.
State 1: G2 high and G1 low; this shows the DC/DC converter in a short circuit state. The inductor L5 is charged by the battery voltage.
- b.
State 2: G2 low and G1 low; this shows the DC/DC converter in an open circuit state. The inductor voltage operates in series with the DC link voltage, and this means that C6 charges; therefore, output voltage is boosted up.
Buck Mode: G1 gate pulse is high and the IGBT is switched on; during this mode, G2 can exist in one of two states:
- a.
State 1: G1 is high and G2 is low, and this means the battery will be charging from capacitor C6 and inductor L5.
- b.
State 2: G1 is low and G2 is low, and this means the inductor will be discharged across the freewheeling diode and the voltage across the battery will step down.
The paper takes the principle explained above (as shown in
Figure 4) and interleaves it with a second pair of IGBT switches and inductor. The resulting battery charging circuit is shown in
Figure 5c below.
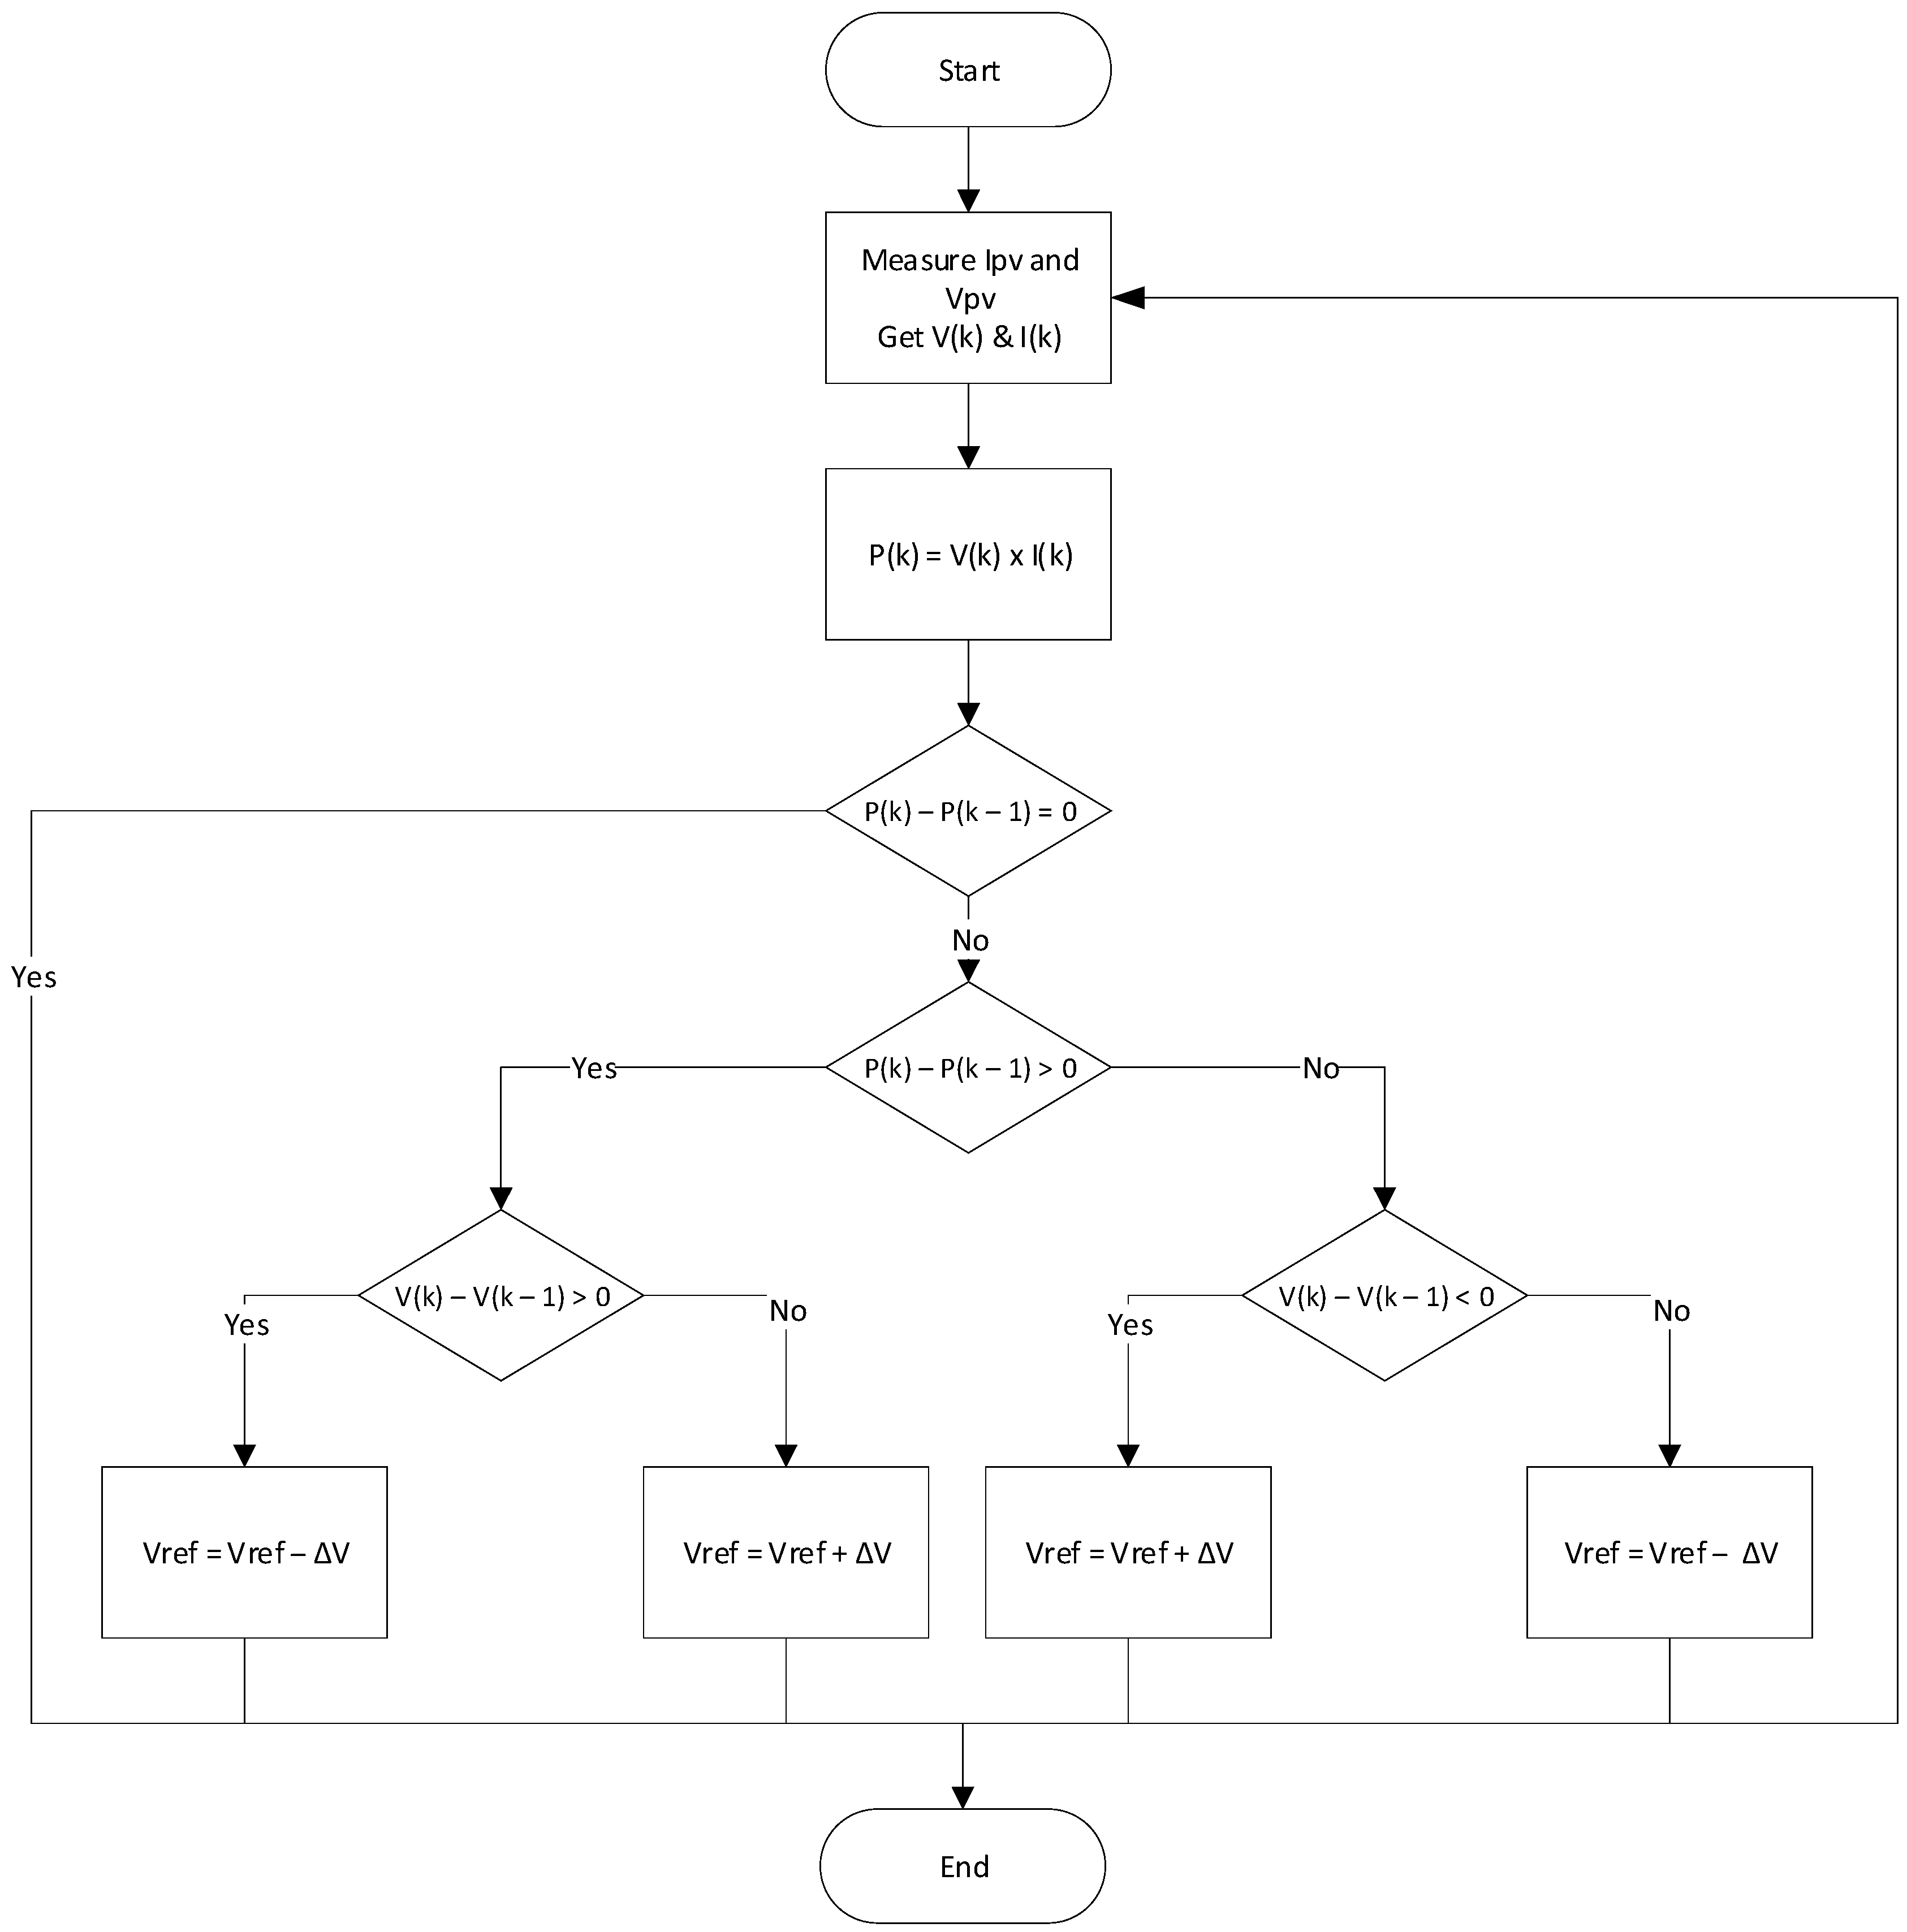
Figure 6 details the P&O algorithm used to track the maximum power point. This algorithm uses the measured I
pv and V
pv from the PV panel as inputs. The current and voltage are then multiplied to calculate power. The controller in the P&O method makes small adjustments to the voltage and takes current and voltage measurements to give the power. When the power increases, the controller adjusts further until an increase in power is no longer detected. The output of the MPPT algorithm is similar to the V
pv graph but it is squarer and more stepped. This method and its nature can result in large oscillations for the output power. The efficiency of this method can be improved by ensuring that the predictive steps used to take the measurements are refined and accurate. The P&O is the most used method for MPPT as it is easy to implement within an energy management system. The output of this algorithm is compared with V
pv; this passes through the PI controller and is then added to the calculated reference charge current. This then feeds the rest of the current control strategy for this system.
Figure 5a shows how the IGBT switches are controlled via pulses to the gate of each IGBT. The principle of this control circuit is to compare the voltage at the MPPT with V
pv and to pass that through a PID controller. A PID controller is used in control circuits that are part of a feedback loop where the basic principle is to calculate the error of a signal and apply a correction. The comparison is done on a process variable and a set point. V
pv is the setpoint and the voltage at the MPPT is the process variable. The error is classed as the difference between V
pv and the MPPT output which is corrected using the PID controller and fed back through the circuit and combined with a reference charge current controller to derive the gate signals that switch IGBT pairs ON/OFF.
To control the second pair of IGBTs (G3, G4) and therefore the current flow through L6, the gate pulses generated from G1 and G2 are phase-shifted by 180 degrees. There are 4 states that this circuit can be split across two modes: charging (buck) or discharging (boost). The filter capacitor C6 is tuned to minimize current ripples. To ensure the battery does not over-charge or over-discharge, the controller shown in
Figure 5b has been included. This does not allow the circuit to operate in the buck if the battery charge reaches 100% and it prevents the circuit from operating in the boost direction if the battery charge reaches 25%.
When the circuit is in charging State A—G1 and G3 are high (or on). The current flows from the PV panel and is halved to pass through the two interleaving stages where it is stored in the two inductors. In charging State B—G1 and G3 are low (or off); this allows the current to flow through the diodes at G2 and G4 which allows energy stored in L5 and L6 to charge the battery.
In discharging State C—G2 and G4 are high (or on); this allows the current to flow from the battery to charge the L5 and L6 inductors. The current is now flowing in the opposite direction (boost) to State A and State B above (buck), demonstrating the bidirectional capability of the circuit to charge and discharge. Finally, in discharging State D—G2 and G4 are low (or off); this allows the current to flow from the inductors to the DC link through the diodes at G1 and at G3.
The values of the components used in the bidirectional battery charger circuit are selected using the following equations. These equations give the critical value ranges for the capacitor C6 and inductors L5 = L6.
Charging mode DC/DC Conversion
Vout:
Discharging Mode DC/DC Conversion Vout
Discharging Mode DC/DC Conversion Duty Cycle
Discharging Mode DC/DC Conversion State 1 Inductor Current
Discharging Mode DC/DC Conversion State 2 Inductor Current
Charging Mode DC/DC Conversion State 3 Inductor Current
Charging Mode DC/DC Conversion State 4 Inductor Current
DC/DC Conversion Inductor Calculations
DC/DC Conversion Capacitor Calculations
Table 1 details the PV source parameters used for this simulation. The PV panel used in this simulation has two inputs, Irradiance and Temperature. The initial state of charge for the battery used in this energy management system is 24.997%, with the battery voltage for the simulation set to 48 Volts. The home load is also set to constant for the purposes of this experiment. The battery parameters shown in
Table 2 below have been selected from a predetermined list of batteries in the MATLAB/Simulink software package (R2021a).
Using Equations (1)–(9), the component values for the circuit in
Figure 5a are shown in
Table 3 below. In
Table 4, the control circuit component parameters are also shown.
Table 5 shows the parameters for the home load that is connected in series with the battery charger circuit in this system.
3. Results
To validate the performance of the control strategy, the next experiment required collecting the data from the four gate pulses and plotting them on the same figure to observe and compare the pulse characteristics. From the simulations carried out,
Figure 7 is a chart of the four gate pulses generated by the combined MPPT and current controller circuit. These are the gate pulses used to control the battery charger circuit. The measured output of the gate pulses shows that
Figure 7a,b are 180 degrees out of phase with
Figure 7c,d; therefore, the IGBTs are controlled as interleaved switch pairs.
To adequately test the system performance, it is necessary to vary the input conditions for the PV panel and observe the system’s response to changes in these variables.
Figure 8 shows how these variables are varied for the duration of the simulated timeframe. The inductor currents L5 and L6 are shown in
Figure 9.
The interleaving of the two inductor currents can be observed when zooming in closer to the inductor current of L5 and L6; this is shown in
Figure 10 where the orange line shows L5 and the blue L6.
Figure 11 shows the state of charge of the battery for the duration of the simulation experiment. The objective of observing this characteristic is to verify that the battery can be charged and discharged to meet the requirements of the energy management system.
The investigation focuses on the battery charger; therefore, the performance of the battery current and voltage should also be observed.
Figure 12 shows how the battery current (blue) and voltage (red) perform for the duration of the simulation, particularly when the input conditions are varied.
To further validate the performance of the circuit,
Figure 13 can also be observed as it shows how the PV power and battery power change as the input conditions vary. It is important that the battery power supplements the 2 kW home load when the PV power drops below the required threshold. The balance of the power can be observed in
Figure 13.
The result of this experiment is displayed in
Figure 14, which shows a comparison of the DC link voltage for three types of battery chargers. The strategy utilized in this global system is the current-controlled interleaved strategy, which is shown in blue. The red line in
Figure 14 shows the DC link voltage for a voltage-controlled interleaved strategy and finally the yellow shows the DC link voltage for a voltage-controlled strategy without an interleaved stage.
4. Discussion
The pulses shown in
Figure 7 confirm that the control strategy successfully interleaves the gates of the two switch pairs. As can be observed from
Figure 8, the temperature decreases from 25 °C to 20 °C at 0.65 s to 0.80 s before moving up from 20 °C at 0.9 s to 40 °C by 1 s. The irradiance stays at 1000 W/m
2 until 1.4 s where it drops to 200 W/m
2 by 1.6 s, at 2 s it increased from 200 W/m
2 to 1000 W/m
2 by 2.2 s before remaining at 1000 W/m
2 until 3 s.
For the control circuit to work as theorized above, the response of the circuit to a change in input voltage should be observed when plotting the inductor current. The inductor current is shown in
Figure 9 and from visual inspection it can be concluded that the inductor current curve tracks with the V
pv and voltage at MPPT, which shows that the intended function of the combined MPPT and current controller works as designed. The battery does not discharge further than 25% to prolong the battery lifecycle and improve/protect long-term battery performance.
The performance of the battery for the duration of the simulation represents important data to gather and analyse.
Figure 11 shows the state of charge of the battery. The initial state of charge of the battery has been set to 24.997% as this will allow a demonstration of the state of charge controller to be observed within the duration of the 3 s data gathering in MATLAB/Simulink.
Figure 11 shows that the battery is charging until the point at which the irradiance falls and when this happens, the battery is required to supplement the 2 kW home load as the PV panel is no longer producing the required power. The battery begins to discharge at 1.5 s to support the 2 kW home load. However, at the point where the battery reaches 25% charge, the state of charge controller circuit prevents the battery charger circuit from discharging the battery (to keep in the nominal range and prolong battery life). In this case, for a standalone system the home load would experience an outage/dip in power.
Looking at
Figure 12, firstly, the scale of the voltage axis is very small in comparison to the scale of the current axis. The change in temperature can be observed via the small decrease and increase in both the battery current and voltage from 0.9 to 1.2 s. This change is not significant enough to cause the battery to stop charging or begin discharging. The state of charge in
Figure 11 shows the curve to be less steep during the same period, which would indicate a reduction in the rate of charge. This shows that the circuit is performing as designed.
When the irradiance falls, it can clearly be observed that the battery is discharging, indicated by the negative current values shown in
Figure 12. The point at which the battery circuit stops discharging and charging is when the battery reaches 25%; this is indicated by 0 amps of current flow in either direction. When the irradiance increases and the PV panel begins to generate power, the battery begins to charge once more, which is again indicated by the positive current values. There are some steady state oscillations that are observed in both the battery current and voltage (and therefore power).
Another way to evaluate the circuit performance is to observe the power for both the PV panel and the battery; this is shown in
Figure 13. The envisaged pattern of behavior is that the battery power should mimic the PV power curve; this would confirm that the battery charging circuit is performing in harmony with the PV panel to supply the home load. The point at which this synchrony is not visible in
Figure 13 is where the battery reaches the 25% discharge threshold. The overall performance of the global system can be validated to operate as required as can be observed in
Figure 13.
Due to the combination of the integrated interleaved battery charger and interleaved switched capacitor H-bridge inverter, the global system is unique in comparison to other published methods. To validate the significance of the proposed control strategy as part of the global system, an experiment was performed where the control of the battery charger within the global system varied. As can be observed from
Figure 14, the response of the proposed system is much faster than the voltage-controlled circuits; the system is also first to reach steady state at approximately 0.4 s compared with 0.55–0.60 s for the voltage-controlled circuits. The proposed system also provides a more stable DC link voltage to the DC/AC Inverter for a longer period when the PV output power begins to fall. This is shown from 0–0.5 where more oscillations are observed from the voltage-controlled strategies in
Figure 14. Also, from 1.5 to 2 s in
Figure 14, the DC link voltage of the proposed system is shown to only begin to drop at the point when the battery reached the 25% discharge threshold. The same behavior was not observed for the two voltage-controlled strategies which saw the DC link voltage drop at the point at which the irradiance dropped.
5. Conclusions
The circuit has been designed to reduce the number of conversion stages compared with conventional approaches in the published literature. The MPPT typically controls a boost converter connected in parallel to the battery charger that is controlled by a voltage controller. Removing the boost converter increases the speed of the response, reduces the number of components required, and improves efficiency by reducing the number of conversions and therefore conversion losses. This modified control strategy which combines P&O MPPT with a current controller to drive the IGBTs used in the circuit configuration is successful in providing the required performance. The results of the study showed that the gate pulses for the four IGBTs align with the expected gate pulses for IGBT switch pairs in an interleaved circuit. The current flowing through the inductors shows similar characteristics to the PV output curve, which shows that the circuit can adapt to detected increases and decreases in PV output.
The circuit’s response to variable environmental conditions was observed to test this circuit further. The results gathered showed that the circuit’s response to irradiance changes aligns with the expectations of an energy management system such that the battery can supplement the home load when the PV output declines below the required threshold.
Some published literature explores the use of different battery technology or super capacitors. The purpose of this study is to provide an off-grid solution that can be widely adopted across multiple different scenarios and applications. A perceived development of this study would be the exploration of newer battery/super capacitor technologies.
The interleaved bidirectional battery charger presented in this study shows the desired response characteristic to variable irradiance that is typically expected for a PV energy management system. As observed from the inductor currents, the results of this study conclude that the combined MPPT and current controller performs as theorized. The response of the circuit is fast with a low current ripple. The proposed approach differs from the published literature due to the reduced components and the single stage of DC/DC conversion (as opposed to the boost converter in parallel). This study could be developed further by gathering practical data to validate the simulations.


