Article

Studies on the Migration of Sulphur and Chlorine in the Pyrolysis Products of Floor and Furniture Joinery

by
Małgorzata Kajda-Szcześniak
* and
Waldemar Ścierski
Department of Technologies and Installations for Waste Management, Faculty of Energy and Environmental Engineering, The Silesian University of Technology, Konarskiego 18, 44-100 Gliwice, Poland
*
Author to whom correspondence should be addressed.
Energies 2023, 16(21), 7446; https://doi.org/10.3390/en16217446
Submission received: 10 October 2023 / Revised: 30 October 2023 / Accepted: 2 November 2023 / Published: 4 November 2023
(This article belongs to the Special Issue Pyrolysis and Gasification of Biomass and Waste II)

Abstract

:
This article discusses research on the low-temperature pyrolysis of waste floor and furniture joinery as an example of chemical recycling. Pyrolysis was carried out at 425 °C to obtain solid, liquid, and gaseous products. In line with the circular economy concept, the waste was transformed into economical and environmentally friendly raw materials suitable for application. Research results related to the chemical composition and properties of pyrolysis products are shown, with particular emphasis on the migration process of acidic impurities, i.e., sulphur and chlorine. In some processes, the presence of such substances can be a problem. Research has shown the high potential for sulphur and chlorine migration in pyrolysis products. It was shown that for woodwork, the most sulphur was discharged with the pyrolysis gas and the least was immobilised in the oil fraction. For vinyl panels, more than 50% of the sulphur was immobilised in the char. Chlorine was immobilised mainly in the char and pyrolysis gas. A high chlorine content of 12.55% was found in the vinyl panel. At the same time, a high chlorine content was also found in the pyrolysis products of these panels. This value is several times higher than in wood-based waste.

1. Introduction

Human existence, the progress of civilisation, and consumerism translate into a constant increase in the amount of municipal and industrial waste generated. Among these wastes are also woodwork and furniture waste. These are generated in the course of renovation services. Due to a number of chemical additives, they are not inert to the environment as waste [1,2,3,4,5,6]. Hence, there is a problem with their proper transformation. The most common method of managing waste flooring and furniture joinery is incineration or co-incineration [7,8,9,10,11]. According to the idea of the circular economy, waste management should be consistent with the waste hierarchy [12,13,14,15,16]. Thus, the aforementioned methods of thermal treatment of selected refurbishment waste are the least desirable by law. For several years, there has been a tendency to reuse wood-based waste, e.g., HDF, for the production of new floorboards. Although this is in line with the principles of the circular economy and sustainable development, it cannot be repeated indefinitely. Returned materials wear out and cannot be reused or recycled.
The circular economy is inextricably linked to the protection of natural resources. It refers to reducing resource consumption, reuse, and recirculation. In circular economy terms, pyrolysis may be a noteworthy solution, which fits into the 3xR hierarchy (reduce, reuse, recycle). Pyrolysis is the process of decomposition of a complex molecule of a chemical compound under the influence of sufficiently high temperatures in an anaerobic environment [14,17,18,19,20,21]. The pyrolysis process is represented by Reaction [22] (1):
C n H m O p B i o m a s s H E A T l i q u i d C x H y O z + g a s C a H b O c + H 2 O + C ( C h a r )
Depending on the temperature used, a distinction is made between low-temperature pyrolysis up to 600 °C and high-temperature pyrolysis up to 1000 °C. The products of waste pyrolysis are char, liquid water–tar–oil fraction, and pyrolysis gas (CO2, CO, CH4, CnHm, H2, H2S, dust, and trace impurities). The qualitative and quantitative properties of the pyrolysis products are determined, among other things, by the type of waste pyrolyzed, the type of reactor, the preparation of the waste feed, the grinding, the residence time of the waste in the reactor, the heating method, and the process temperature [21,22,23,24,25].
Due to the heating rate of the fuel particles (biomass), two main pyrolysis mechanisms can be distinguished, i.e., slow and fast pyrolysis. Carbonization is a slow pyrolysis process. The biomass is heated slowly over a longer period of time, with no access to oxygen and a relatively low temperature of about 400 °C. The dominant product is char [21,22]. According to [21], when the wood temperature increases from 147 to 167 °C, transient moisture is released. In the temperature range from 247 to 267 °C, water chemically bound in the cellulose structure, CO2, CO, small amounts of condensing vapours of acetic acid, methanol, and wood tar are released. Above 267–277 °C, methanol, acetic acid, acetone, lighter hydrocarbons, wood tar, and small amounts of hydrogen are strongly released, and the amount of CO2 and CO released decreases. Above 397°, quasi-graphite layers are formed and the transformation of wood into charcoal (char) is completed. In turn, the goal of fast pyrolysis is the maximum yield of liquid or gaseous products. The heating rate should be from 1 to 10 °C/min and the temperature should be lower than 650 °C in order to obtain bio-oil, or higher than 1000 °C if the dominant product is to be gas [22].
The pyrolysis of biomass [26,27,28,29,30,31,32] and PVC is a well-researched issue [33,34,35,36,37,38]. According to [39,40], biochar obtained as a result of low-temperature pyrolysis of biomass waste can have a wide range of applications, e.g., in the energy industry, as a substrate for the production of activated carbon, and as a pollutant sorbent. Moreover, the authors of [40,41,42,43,44] indicate the possibility of using biochar as activated carbon for the filtration of wastewater from pollutants. It is estimated that by 2025 the demand for activated carbons will reach 2,707,000 Mg. This is dictated by the constantly growing awareness of the need to care for the environment [21]. Biochar rich in elements can be used in agriculture as an additive improving soil quality, increasing the improvement of crops [45]. As reported in [46,47,48], there are reasons to use biochar in the metallurgical, steel, and coking industries. Research on the use of biochar in energy storage technologies is ongoing [40,49]. In the literature, one can find a lot of information about the pyrolysis and co-pyrolysis of PVC, including with biomass or other plastics [11,35,50,51,52,53,54,55].
In contrast, the pyrolysis of wood- and vinyl-based wastes and the derivation of utilisable products from them is only at the stage of discernment. The current topic represents a developing field of research and is a field for scientific analysis.
This article presents research into low-temperature pyrolysis as one of the options for managing waste from flooring and furniture joinery. It is an example of chemical recycling, and the activities described in the article are in line with the idea of a circular economy in both ecological and economic terms. As a result of pyrolysis, problematic waste is transformed into useful products, thus contributing to a reduction in the consumption of natural resources. These are char, oil, and gas. The pyrolysis process can be optimized to promote the synthesis of a specific product of interest. Low-temperature pyrolysis was chosen for two reasons. Firstly, ecological and economic aspects were taken into account and the lowest possible temperature was adopted for the planned tests. Secondly, as the pyrolysis temperature increases, the oil yield increases and the char yield decreases. The authors’ research priority is to focus on the use of chars, hence the choice of pyrolysis at a lower temperature. Currently, the authors are working on the thermal activation of chars in an inert gas atmosphere and the chemical activation of chars using potassium hydroxide, with simultaneous observation of the morphology and structure of chars before and after activation using electron microscopy methods (SEM, TEM, SAED, and EDS). The research is an attempt to obtain, through pyrolysis, activated carbon acting as an adsorbent. Such material can be used in both water and exhaust gas purification techniques.
A study of the literature shows that many scientists are engaged in research describing the pyrolysis process. In the literature [21,22,24,30], this process is explained in detail, but there is no in-depth analysis of the migration of individual elements between the main products of the process. The authors’ works will allow for a better understanding of the pyrolysis process of various substances. Knowledge of the migration of acidic elements (S and Cl) will allow for a more effective design of individual devices included in pyrolysis installation in terms of their resistance to the corrosive effects of pyrolysis products. Moreover, this knowledge will allow the utilitarian use of the raw materials. When indicating the application routes of the resulting pyrolysis products, attention should be paid to the possibility of migration of the elements present in the waste composition into the individual products [23,25,28,56,57]. Hence, the main objective of this article is to assess the degree of migration of sulphur and chlorine into the pyrolysis products obtained.

2. Material Characteristics and Methods

2.1. Materials

The tests of sulphur and chlorine migration in the low-temperature pyrolysis process were carried out on:
  • Waste floor panels made of HDF fibreboard;
  • Waste furniture made of MDF fibreboard;
  • Waste furniture made of chipboard;
  • Waste floor planks made of natural wood;
  • Energy willow chips;
  • Waste floor panels made of vinyl board.
All the waste was obtained in the form of cuttings during the renovation of houses and flats. The exception was energy willow chips, which were obtained from plantations and used in the study for comparative purposes. The examined wood-based waste consists of wood and is loaded with impurities in the form of urea–formaldehyde resins, adhesives, laminates, veneers, and varnishes to varying degrees. Vinyl panels, on the other hand, consist mostly of polyvinyl chloride (PVC). Depending on the manufacturer, it is reinforced with glass or mineral fibres. The additives used in the tested materials can have a significant impact on the course of the pyrolysis process and on the quantity and properties of the obtained pyrolysis products. The comparison of biomass with waste materials based on biomass with the addition of binders and vinyl panels was intended to verify the similarities and differences in the tested materials.
Before carrying out the analysis, samples were cut into 2–3 cm pieces. Low-temperature pyrolysis was carried out. Then, the substrates and char were ground in an IKA laboratory mill into fractions not exceeding 2 mm.

2.2. The Test Stand for Carrying out the Pyrolysis Process

The tests of the low-temperature pyrolysis process were carried out on a test stand consisting of a pyrolysis chamber housing with heaters and insulation, a proper pyrolysis chamber with a volume of 25 dm3, and a pyrolysis gas cooler made of a DN 25 pipe with a length of 1000 mm. The main chamber was electrically heated. The temperature in the bed was measured with a T1 thermocouple and the temperature of the pyrolysis gases with a T2 thermocouple. The stand is shown schematically in Figure 1.
A single experiment consisted of placing a test sample of waste weighing about 1000 g in a chamber at ambient temperature, carefully closing the chamber (in order to cut off the air supply) and starting a set of built-in heaters. After the start of the pyrolysis process inside the chamber, the gas pressure increased above atmospheric pressure. This increase enabled the flow of pyrolysis gas through the cooler–separator system. The heating process of the chamber was completed when the temperature inside it reached 425 °C. The maximum process temperature was not determined randomly. It was determined on the basis of previously conducted pyrolysis tests using thermogravimetric analysis (TG-DTG), which is discussed in more detail in the Results section.
In the cooler, the temperature of the pyrolysis gas was lowered to the ambient temperature. At the same time, the pyrolysis oil accumulating in the separator was collected from the cooler. The pyrolysis gas was removed to the atmosphere through the process gas cleaning system. The process was terminated when no generation of process gases was found. During the tests, the weight of the samples used, the products obtained (char and oil), the temperature, and the duration of the process were also measured. Measurements were read at 10 min intervals. The amount of gas was determined from the balance equations (according to the law of the conservation of mass).
The substance balance for a steady-state process is presented in Equations (2) and (3) below [58]:
Gdi = Gwi
mSW = ∑mP = mCh + mPO + mPG
where:
  • Gdi—amount of substance fed to the pyrolysis chamber, kg;
  • Gwi—amount of substance removed from the pyrolysis chamber, kg;
  • mSW—mass of waste sample, kg;
  • mP—mass of pyrolysis products, kg;
  • mCh—mass of char, kg;
  • mPO—mass of pyrolysis oil, kg;
  • mPG—mass of pyrolysis gas, kg.
  • The mass of the gas was determined from Equation (4):
mPG = mSW − (mCh + mPO)
By analogy, the balances of the S and Cl elements are as follows ((5), (6)) [58]:
mS_SW = mS_Ch + mS_PO + mS_PG
mCl_SW = mCl_Ch + mCl_PO + mCl_PG
where:
  • mS_SW; mCl_SW—mass of sulphur/chlorine in the waste sample, g;
  • mS_Ch; mCl_Ch—mass of sulphur/chlorine content in the char, g;
  • mS_PO; mCl_PO—mass of sulphur/chlorine content in pyrolysis oil, g;
  • mS_PG; mCl_PG—mass of sulphur/chlorine content in the pyrolysis gas, g.
From the equations of the balance of elements, the elementary composition of this gas was determined.
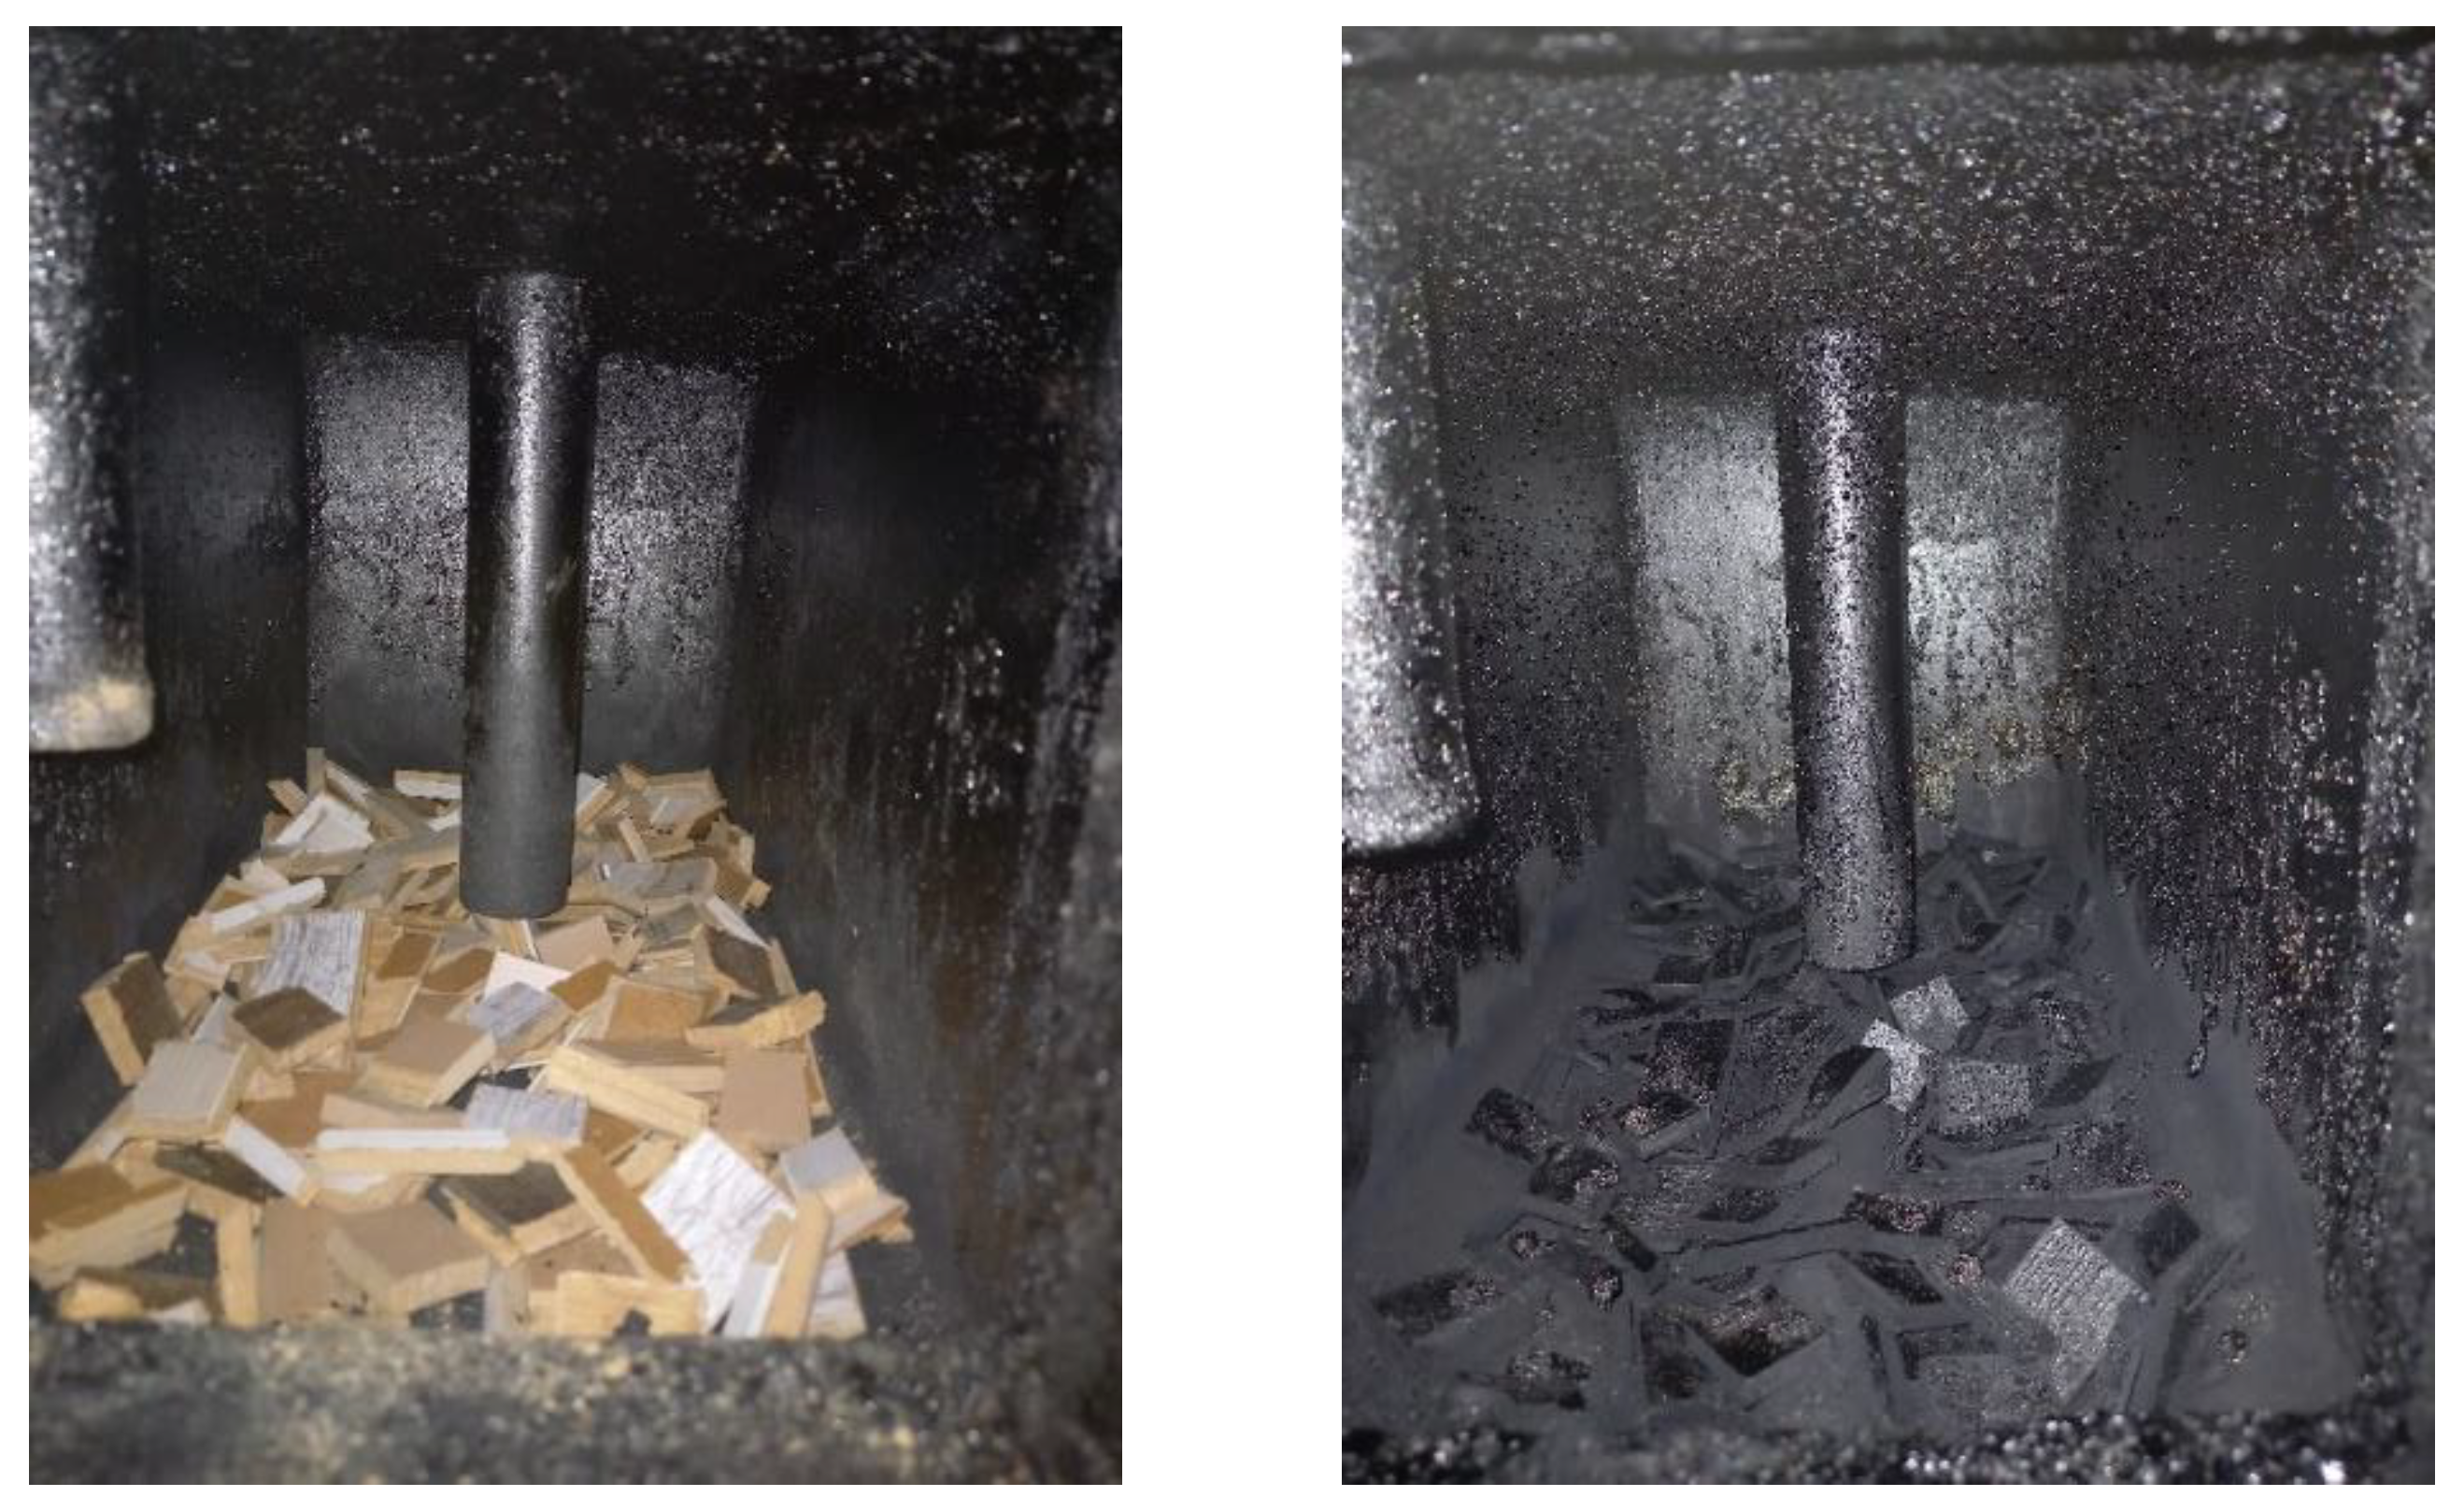
The resulting char was taken directly from the pyrolysis chamber after it had been cooled down to ambient temperature (Figure 2).
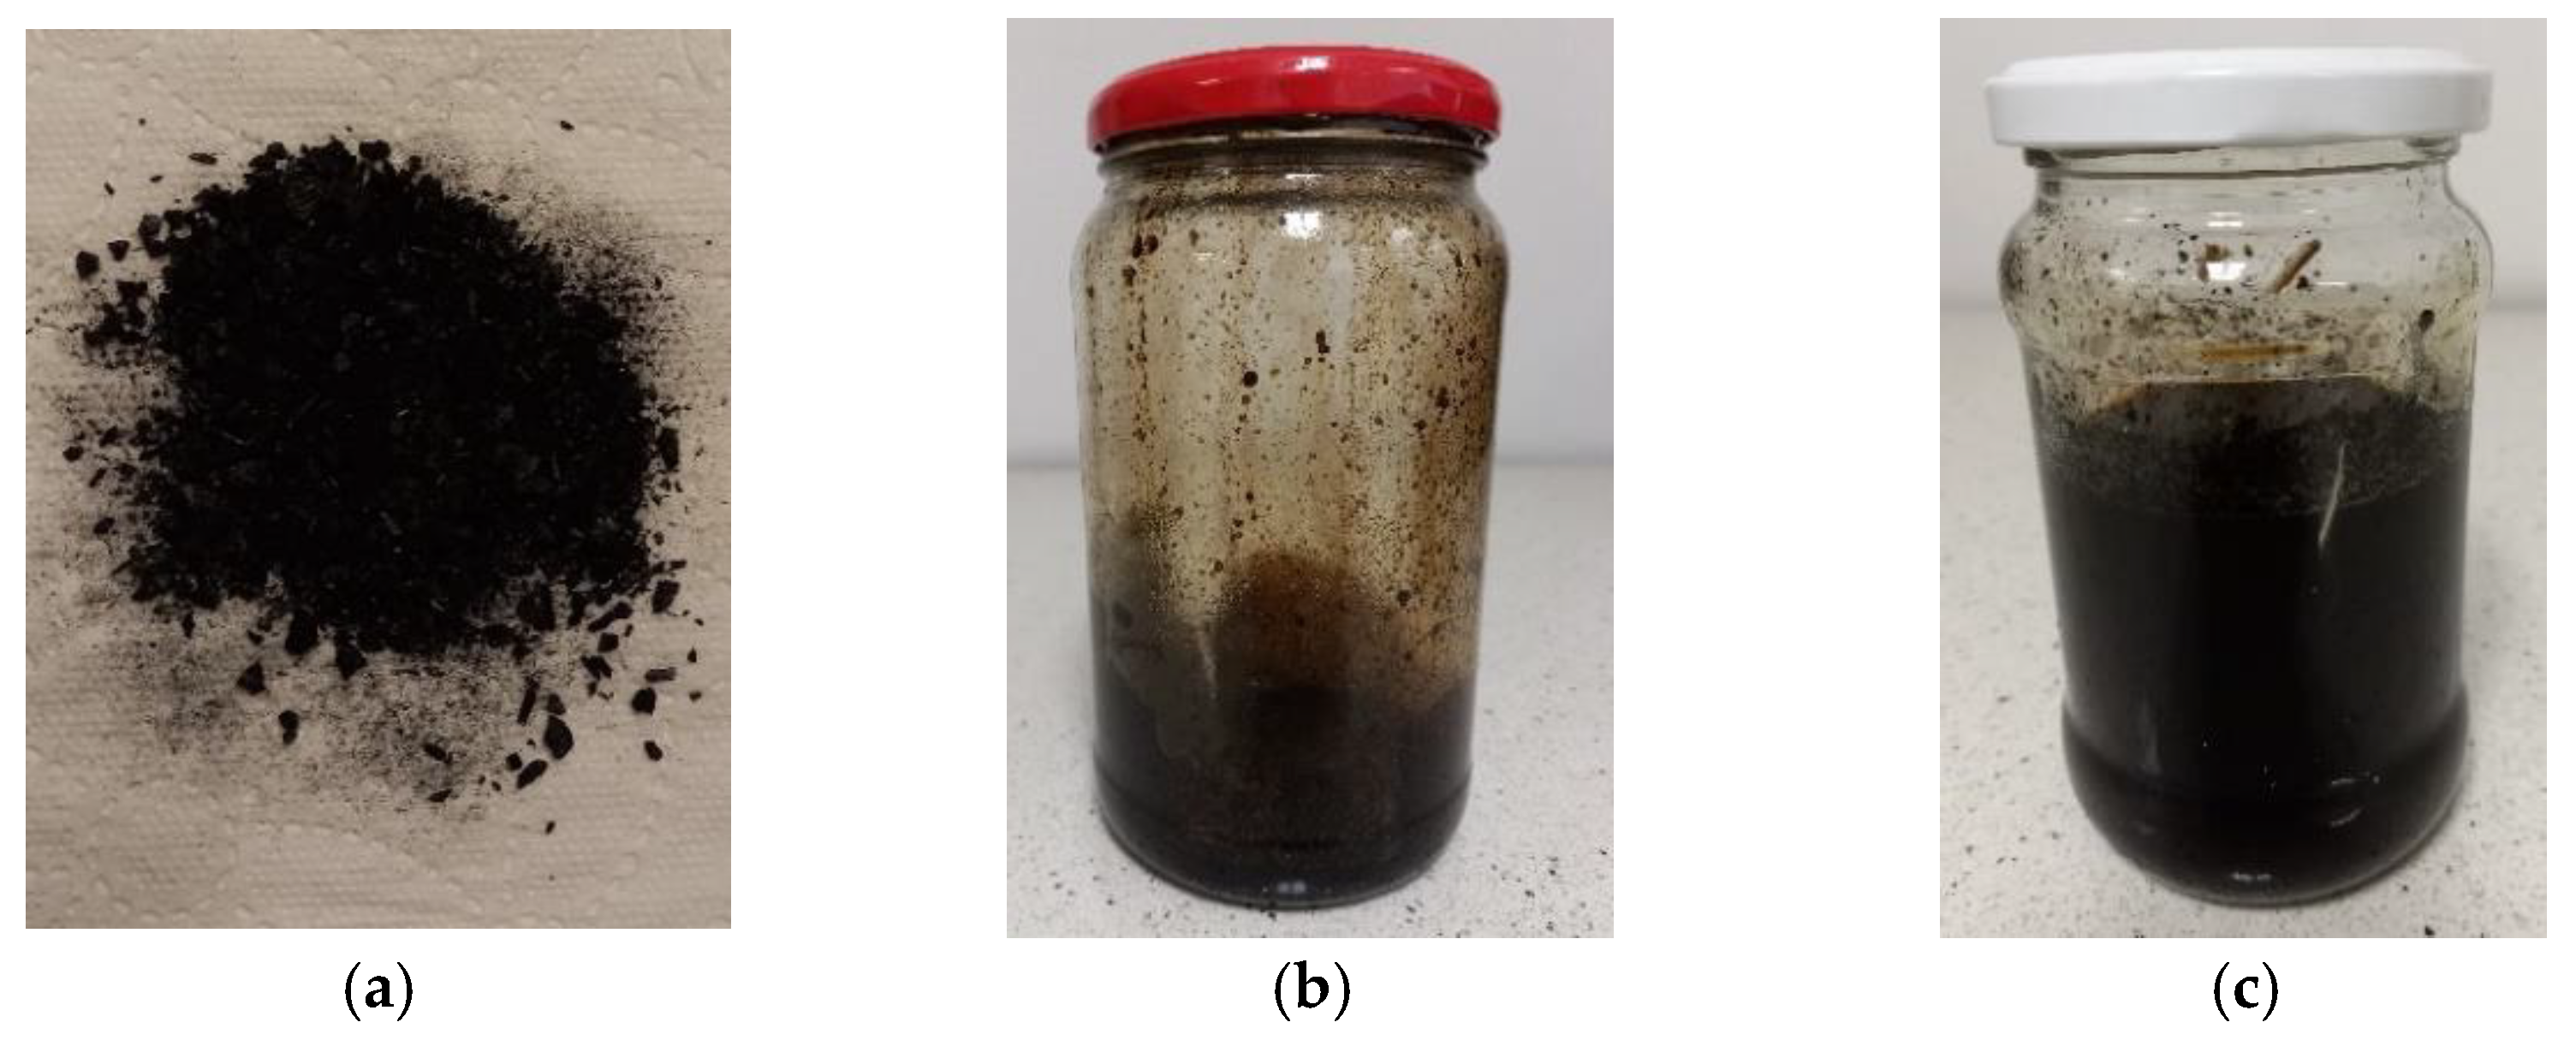
Figure 3 shows examples of pyrolysis products. As a result of the low-temperature pyrolysis process, three products were obtained, i.e., char, pyrolysis oil, and pyrolysis gas. After 24 h from the end of the process, the separation of the oil fraction into oil and contaminated water was observed.

2.3. Sulphur and Chlorine Analysis

The aim of the analysis was to determine the elements S and Cl in the substrates and pyrolysis products. The study was performed using the standards PN-ISO 351:1999 [59] and PN-ISO 587:2000 [60].
The total sulphur content was determined using the high-temperature combustion method and calculated according to Formula (7) [59]:
S = ( V a V b ) × 0.0008 × 100 m , %
where
  • Va—the amount of NaOH used to titrate the waste sample, (cm3);
  • Vb—the amount of NaOH used for the titration of the blank, (cm3);
  • 0.0008—mass of sulphur corresponding to 1 cm3 of 0.05 n sodium hydroxide solution, (g/cm3);
  • m—mass of the waste sample, (g).
The chlorine content was determined using the Eschka mixture and calculated according to Formula (8) [60]:
C l = 3.545 × c × ( V a V b ) m , %
where
  • Va—the amount of AgNO3 used to titrate the waste sample, (cm3);
  • Vb—the amount of AgNO3 used for the titration of the blank, (cm3);
  • c—concentration of silver nitrate(V) solution (0.05), (mol/dm3);
  • m—mass of the waste sample, (g).

3. Results and Discussion

3.1. Pyrolysis Process Parameters

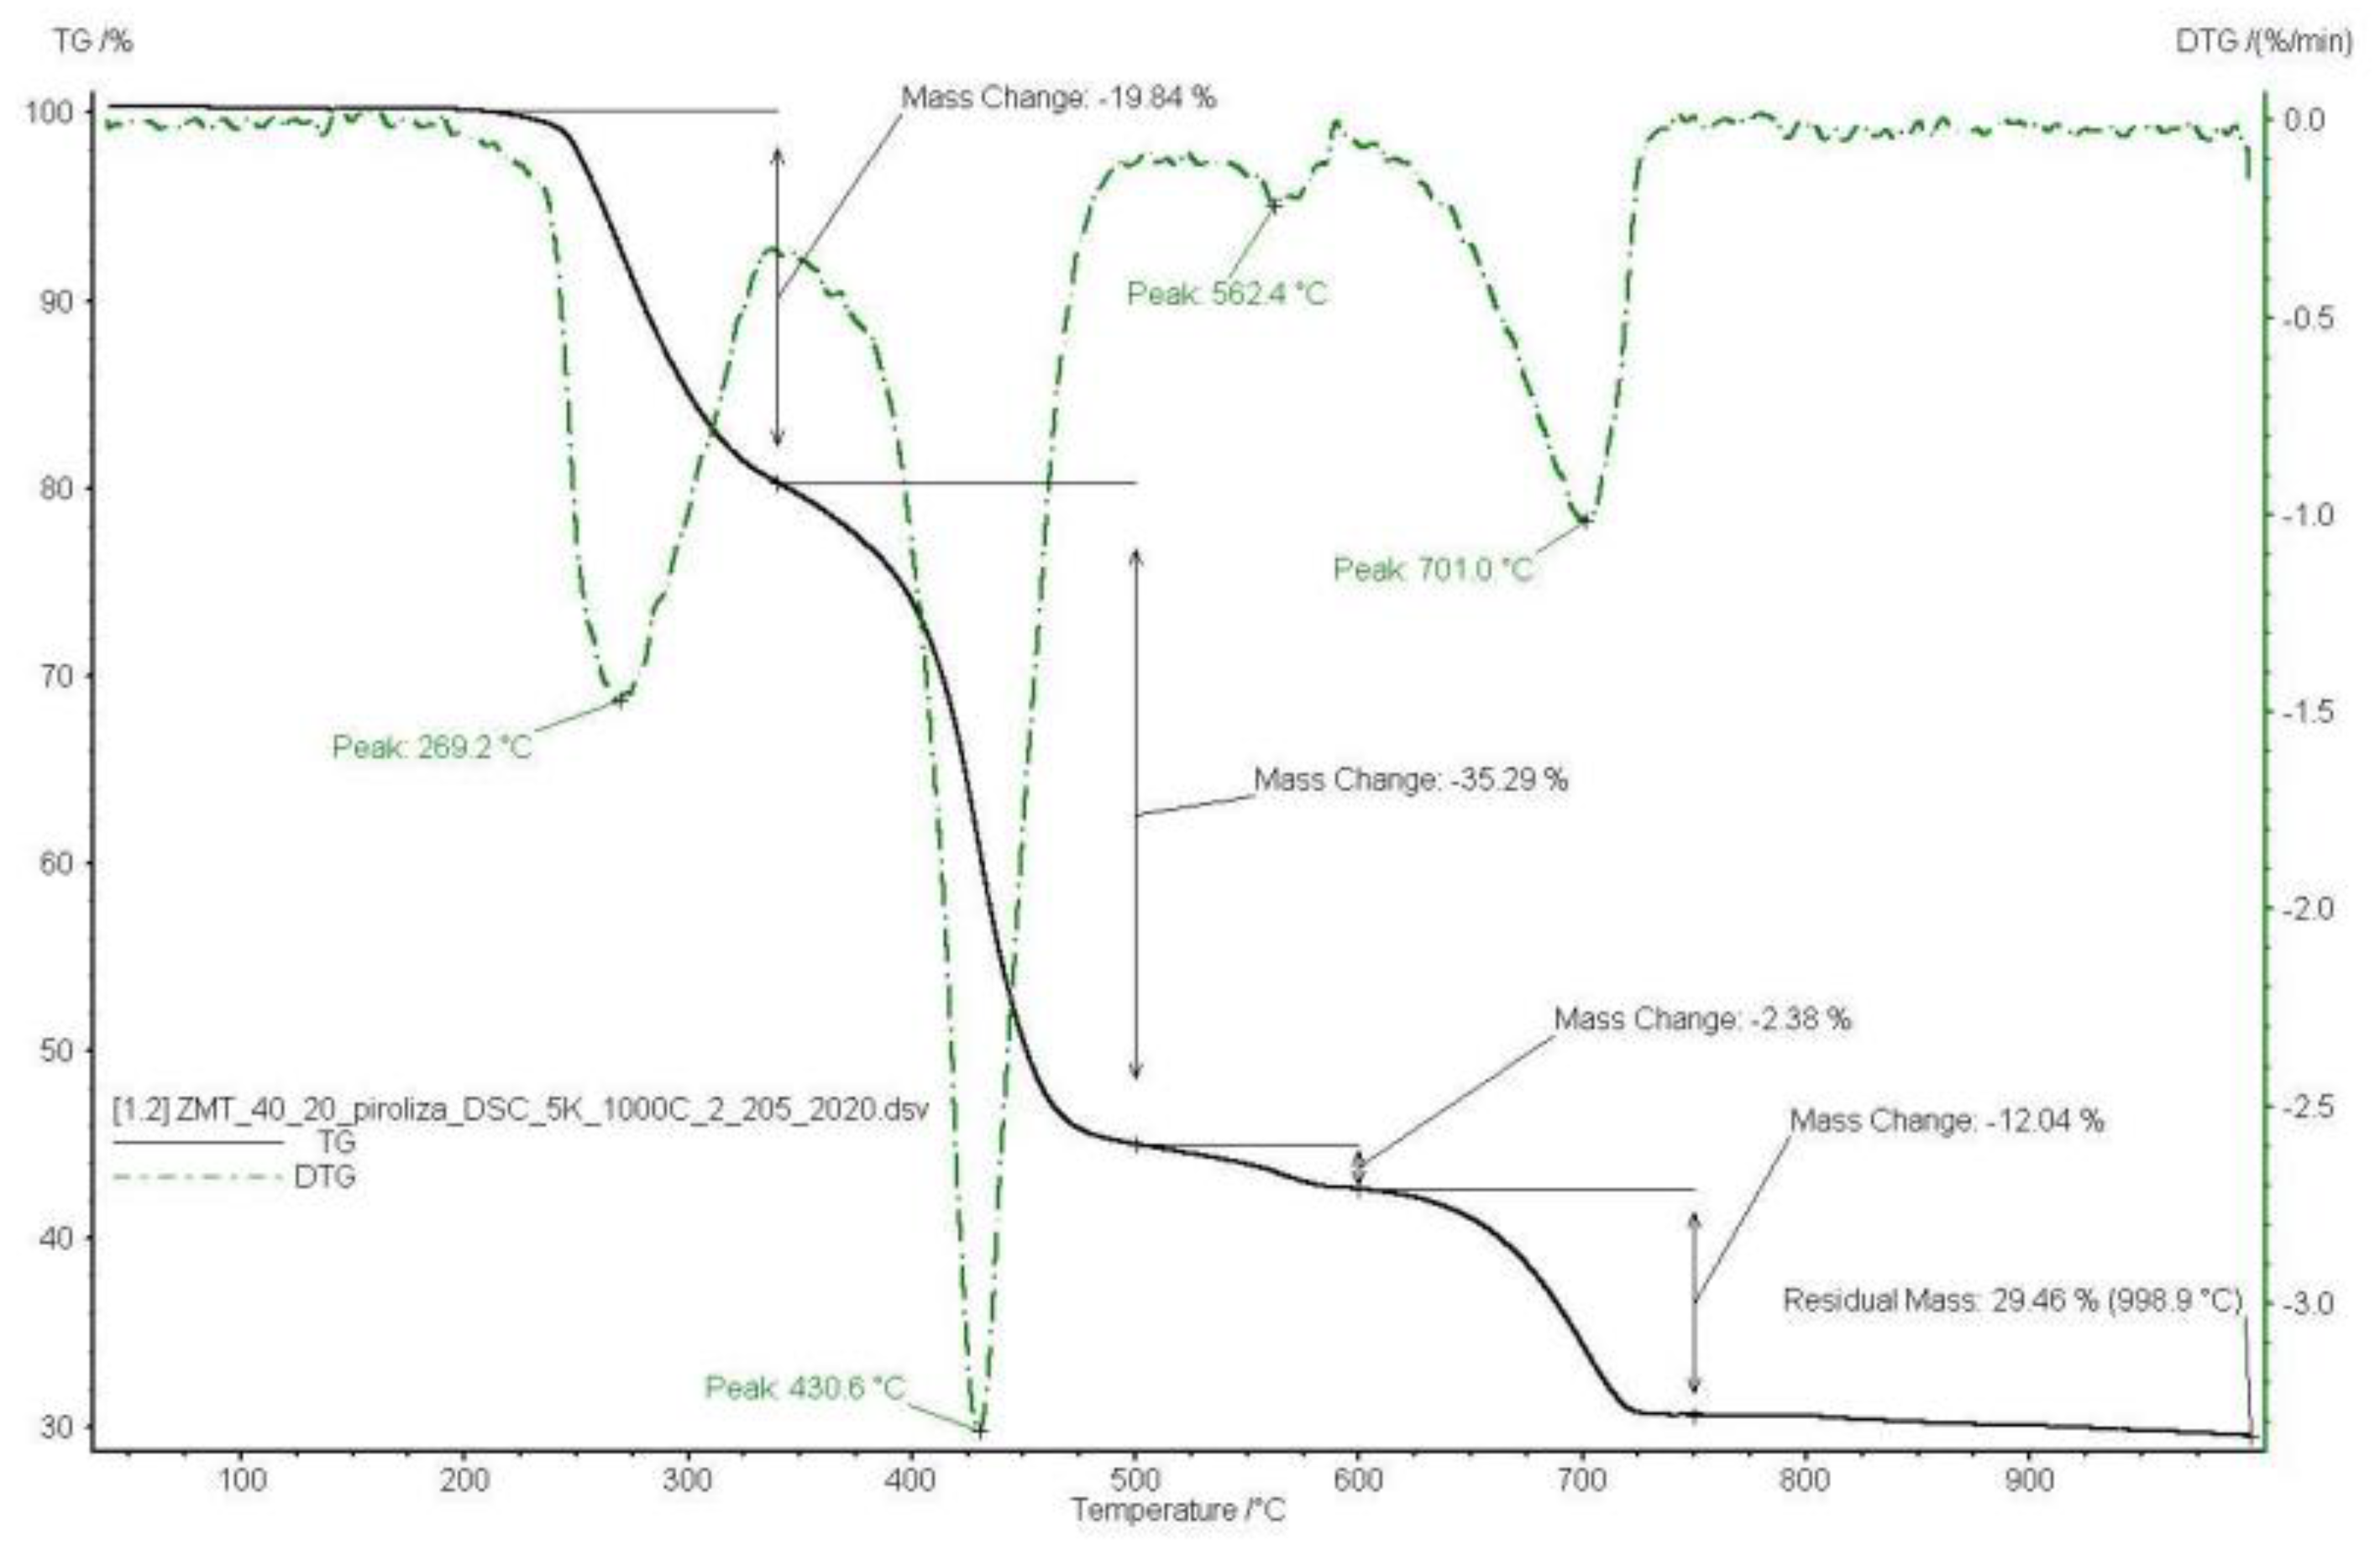
The first research step was to determine the parameters of the pyrolysis process, including temperature. For this purpose, TG/DTG analysis was used, which is designed for the waste discussed in this work. Figure 4 and Figure 5 show an example thermogravimetric analysis for two samples: waste floor panels made of HDF fibreboard and waste floor panels made of vinyl board [4,11]. A similar order of magnitude of mass loss was recorded in TG/DTG tests and in tests performed on a laboratory scale. The greatest weight loss was found for HDF panels in the second stage of the pyrolysis of the material, from approximately 160 to 400 °C. For the vinyl panel, the largest loss was also recorded in the second stage, from approximately 350 to 450 °C.
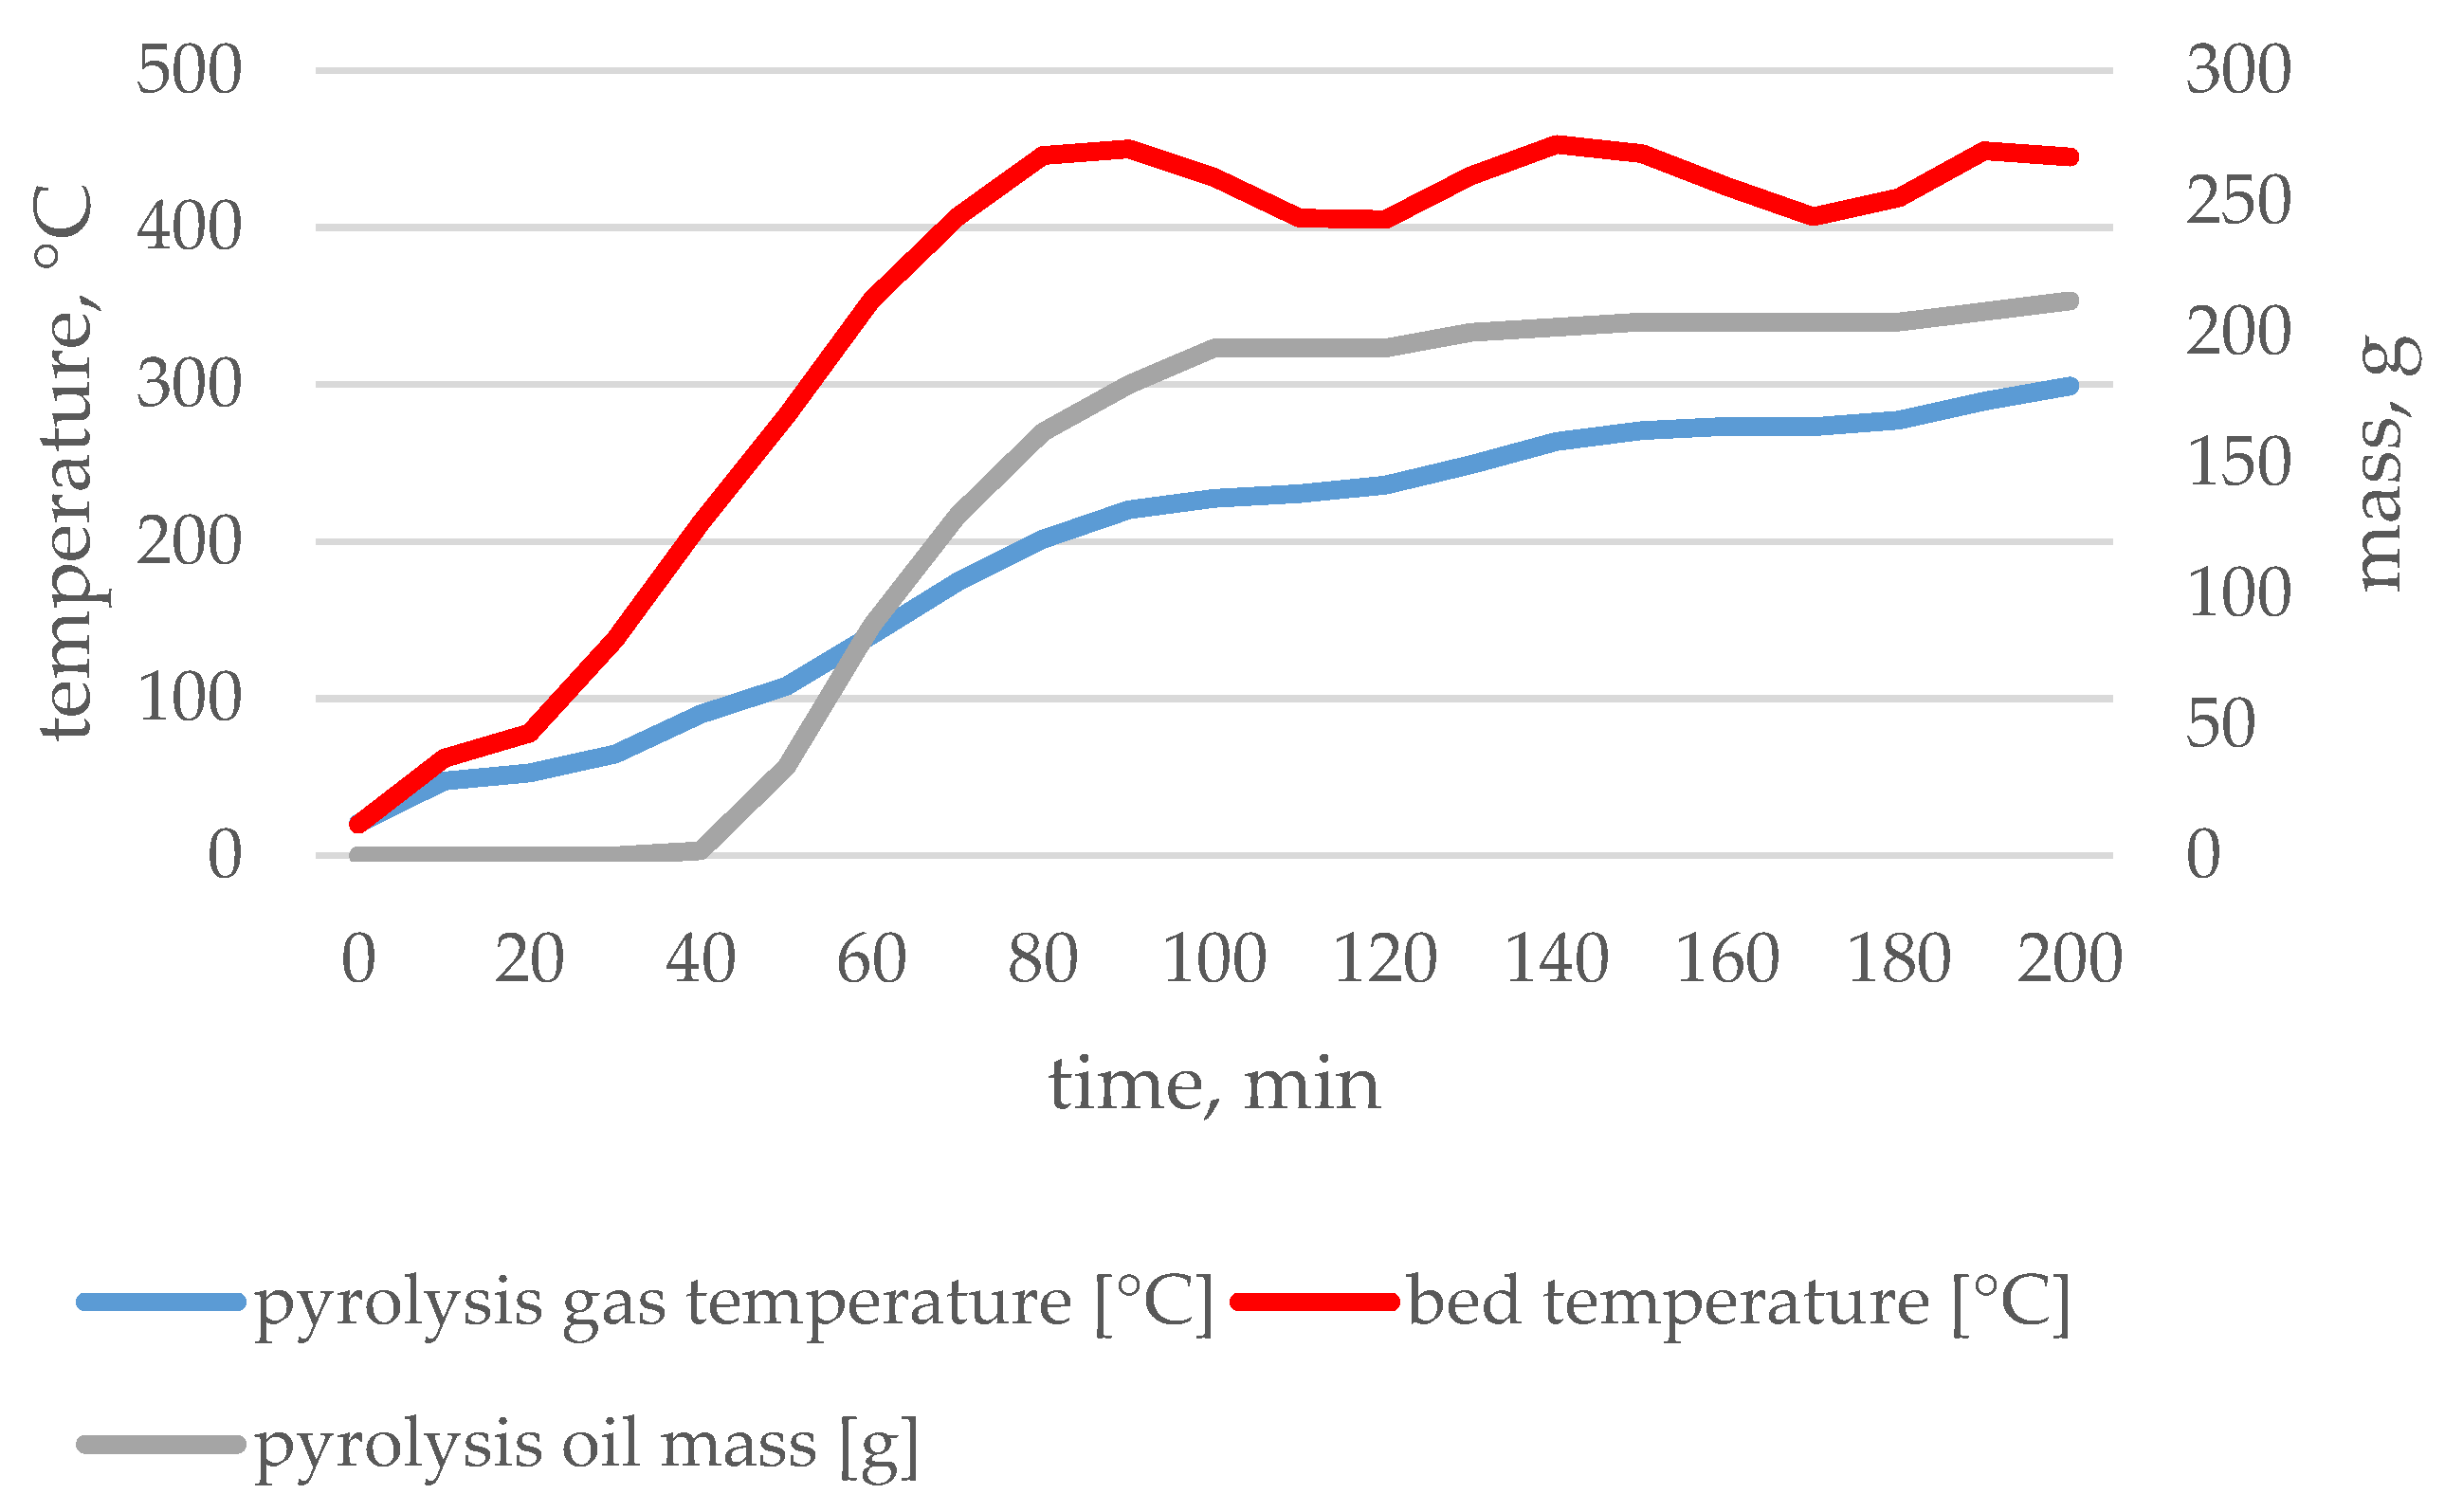
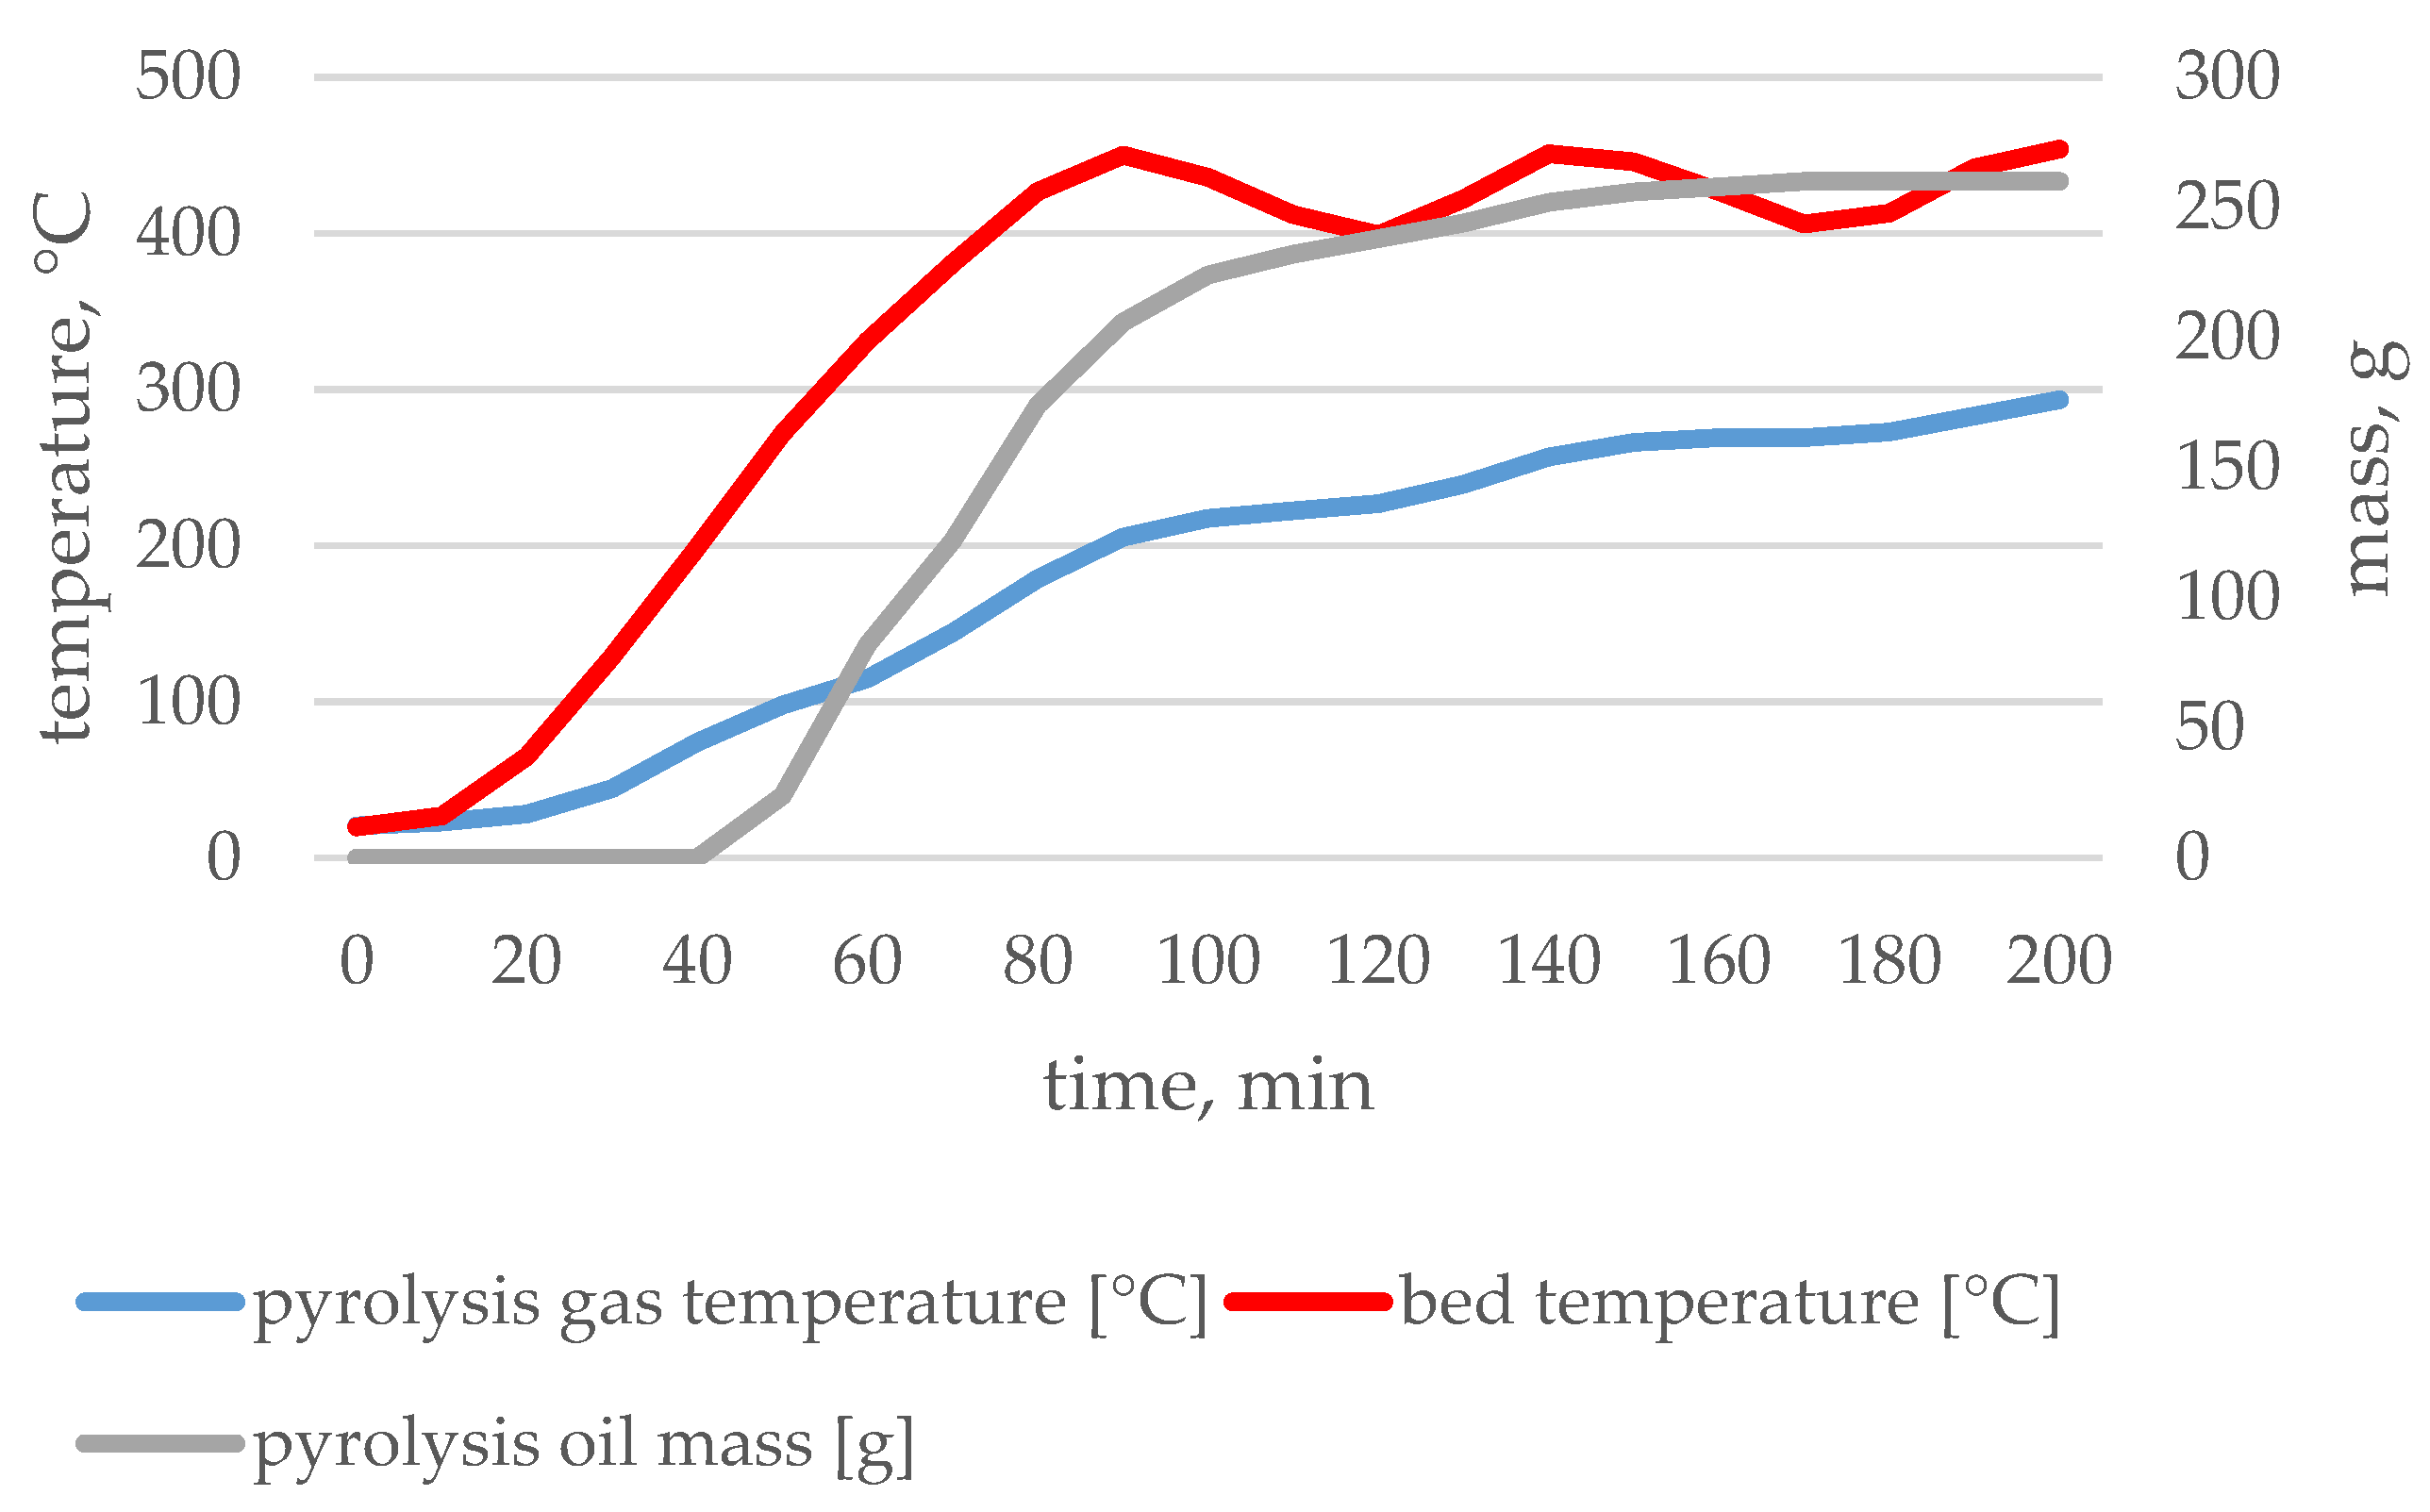
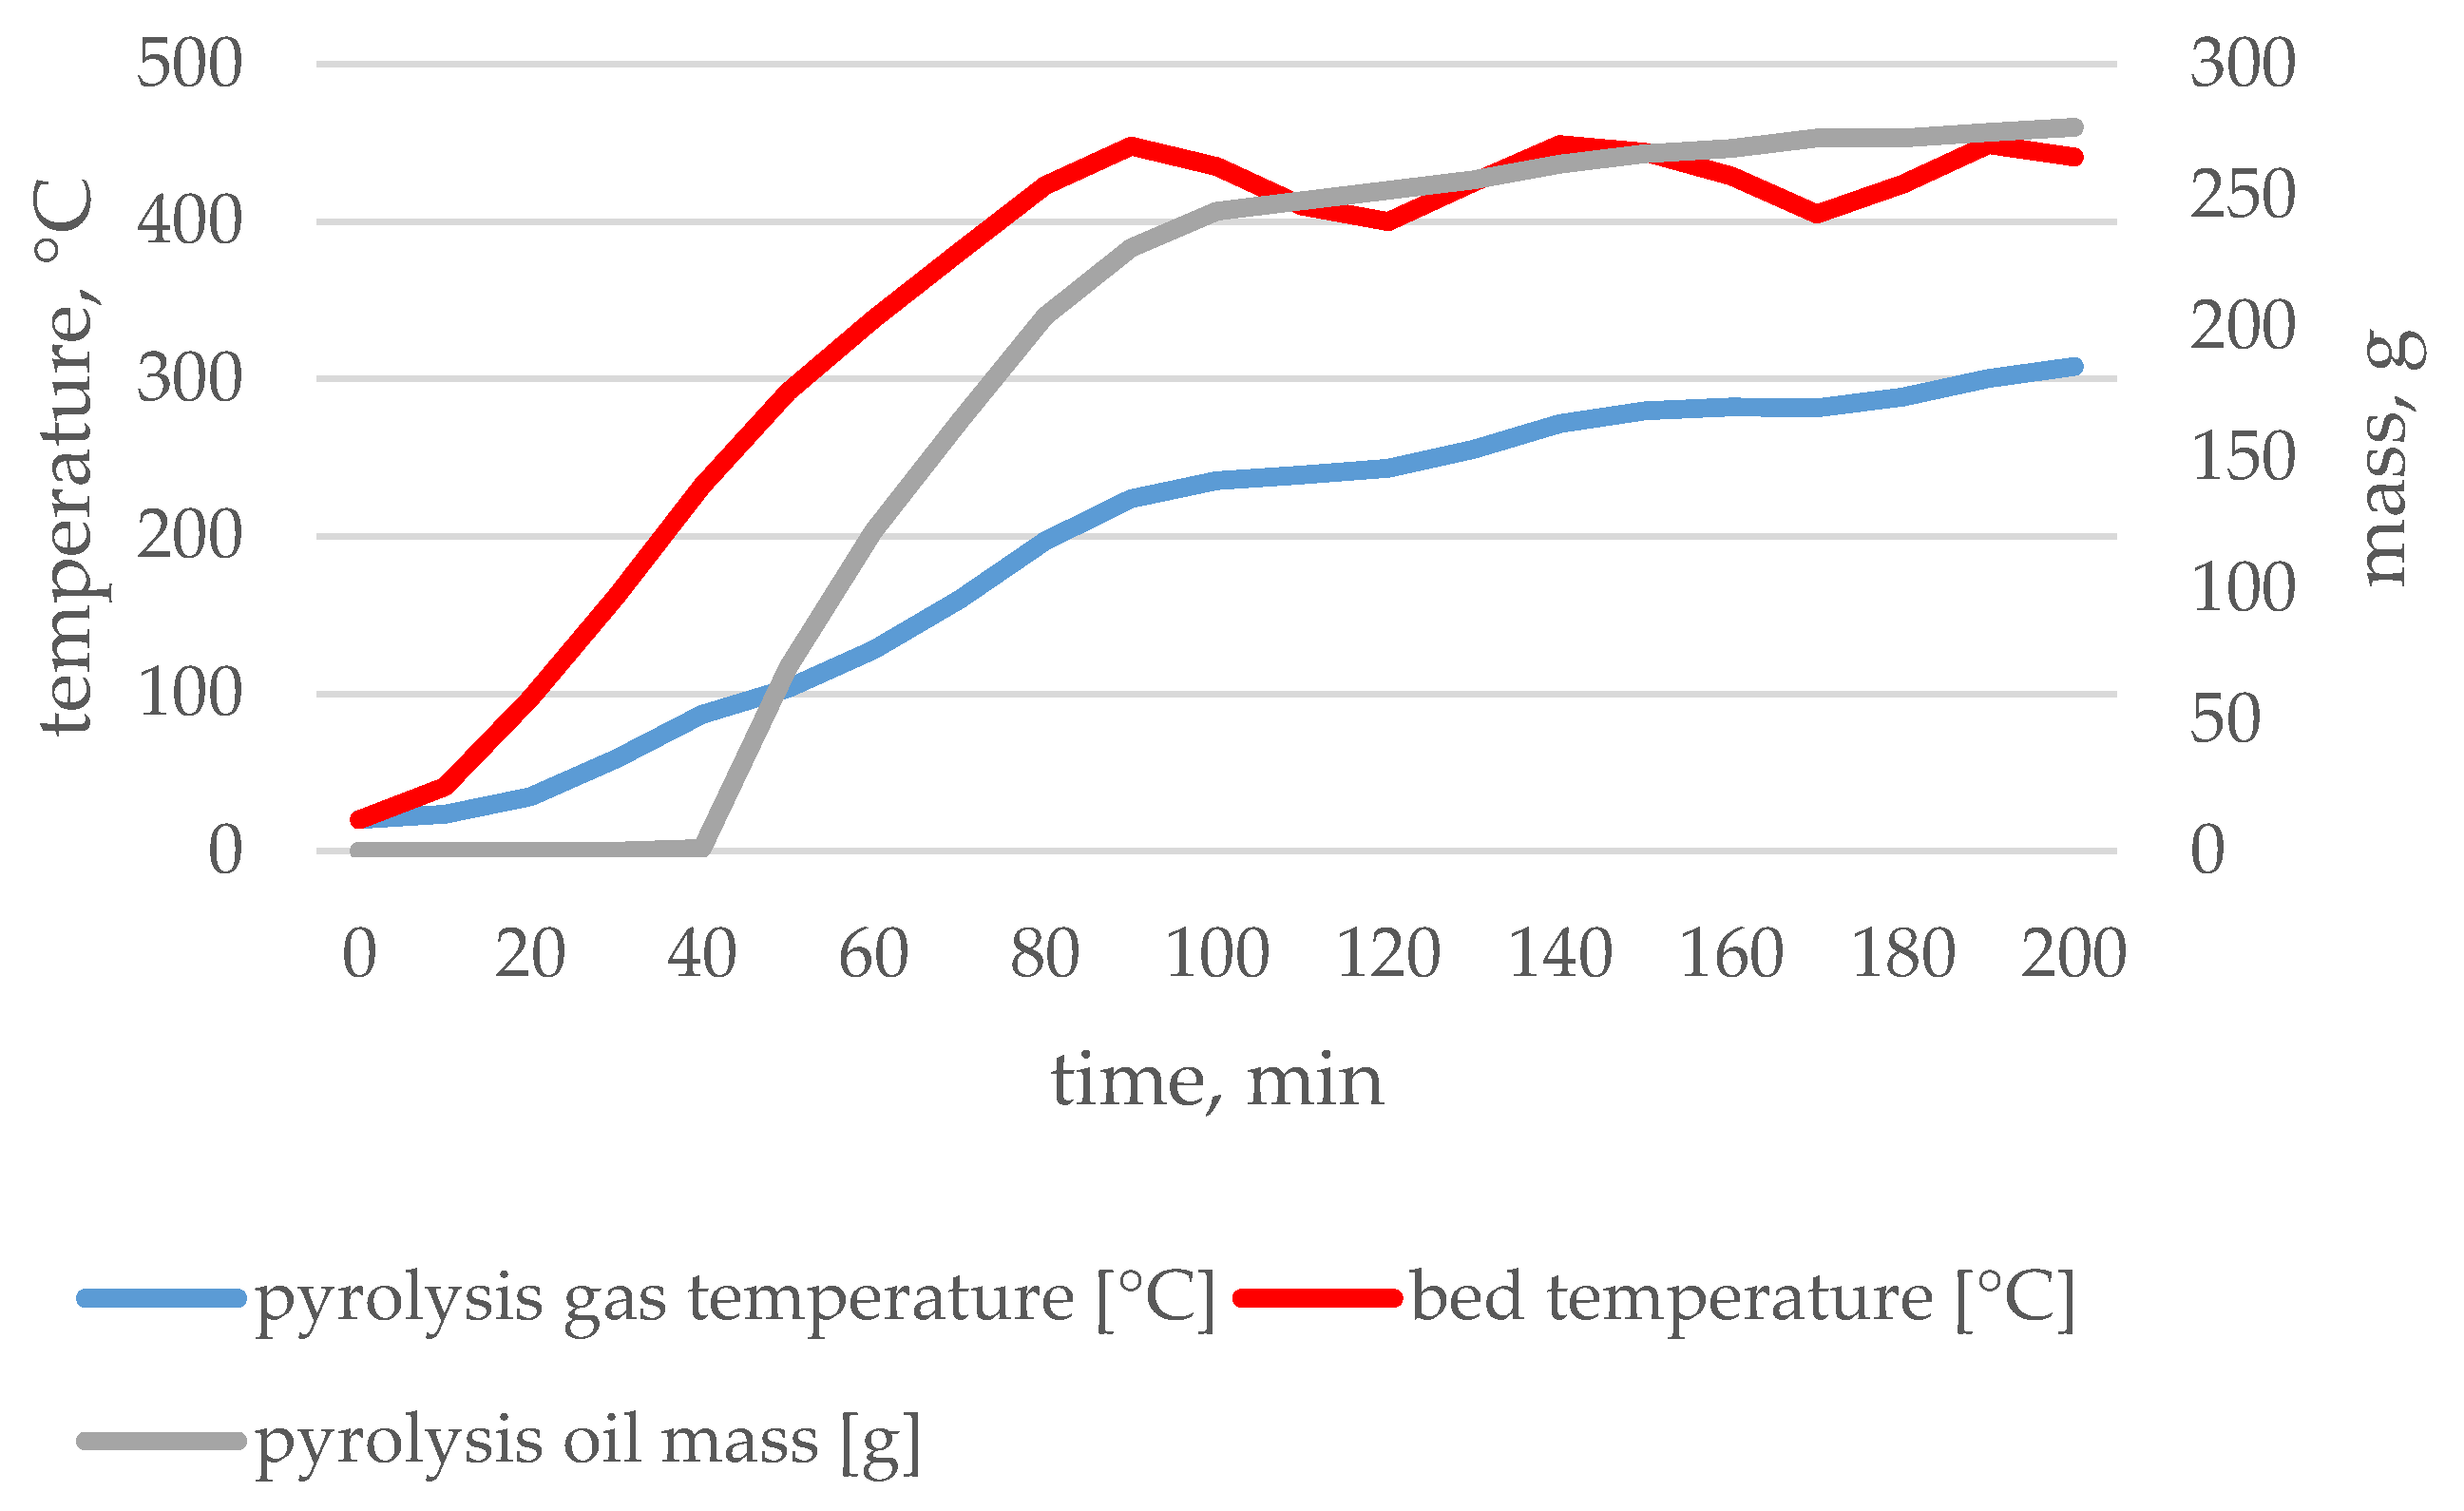
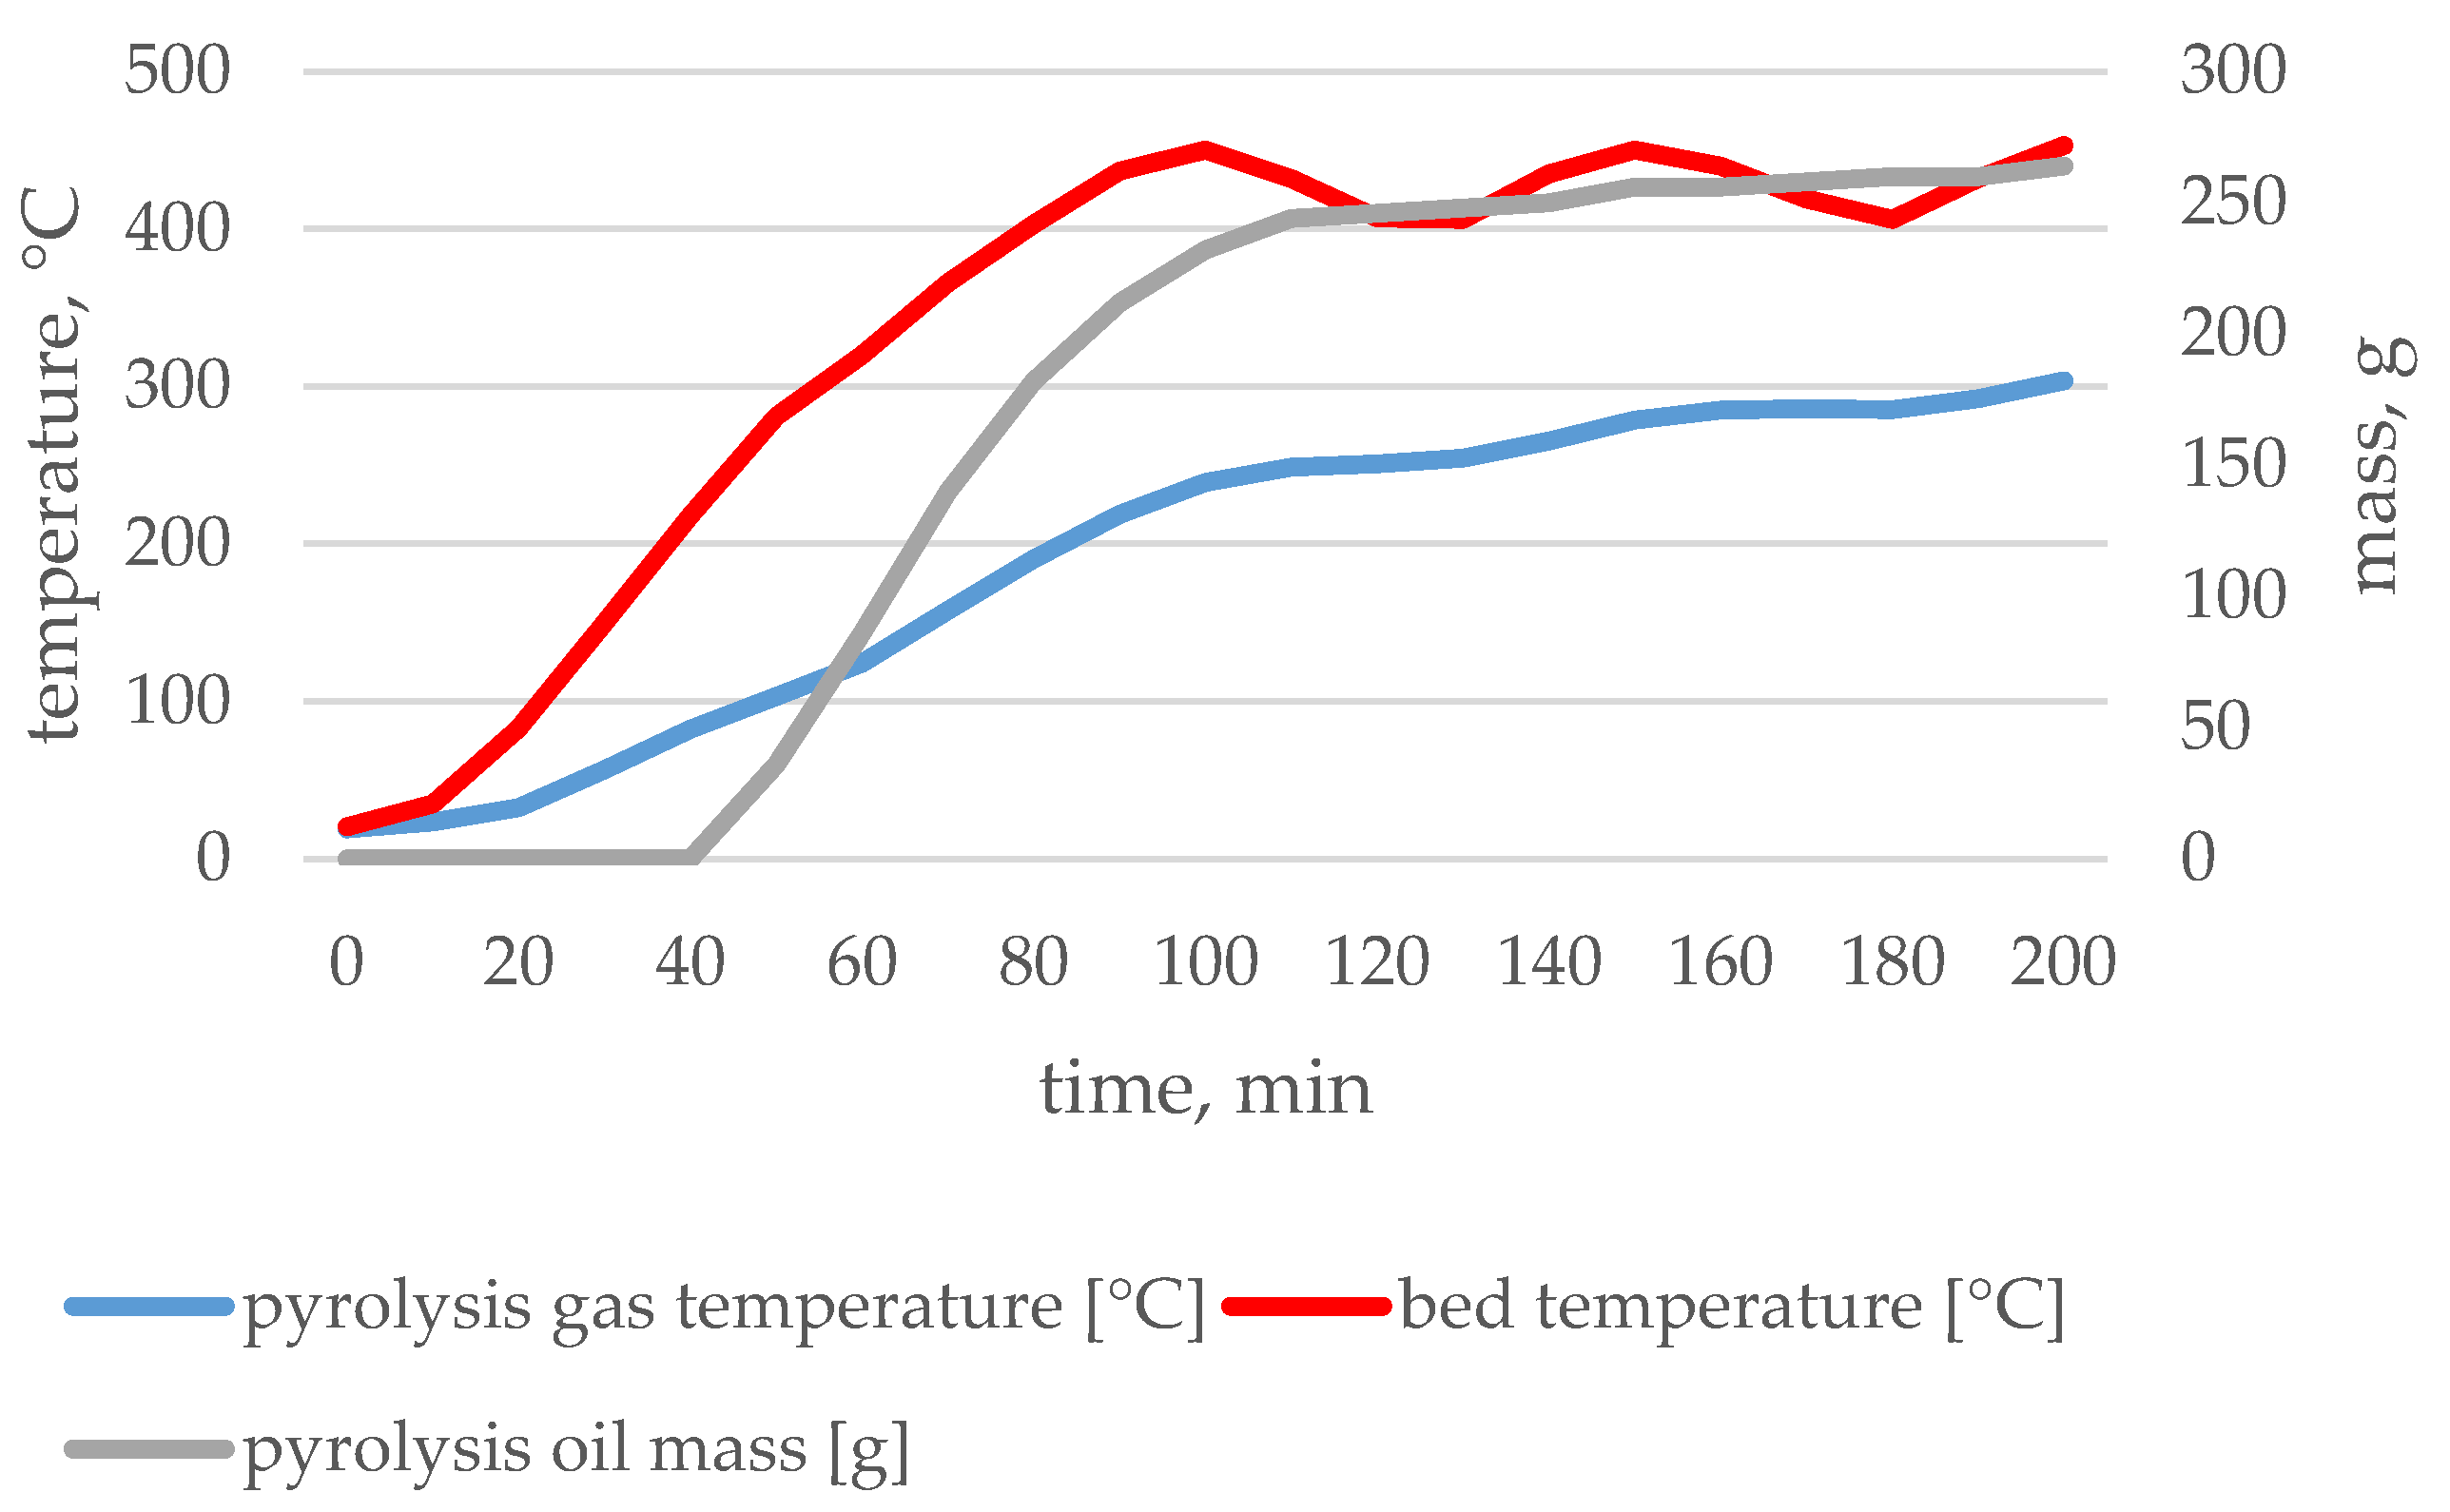
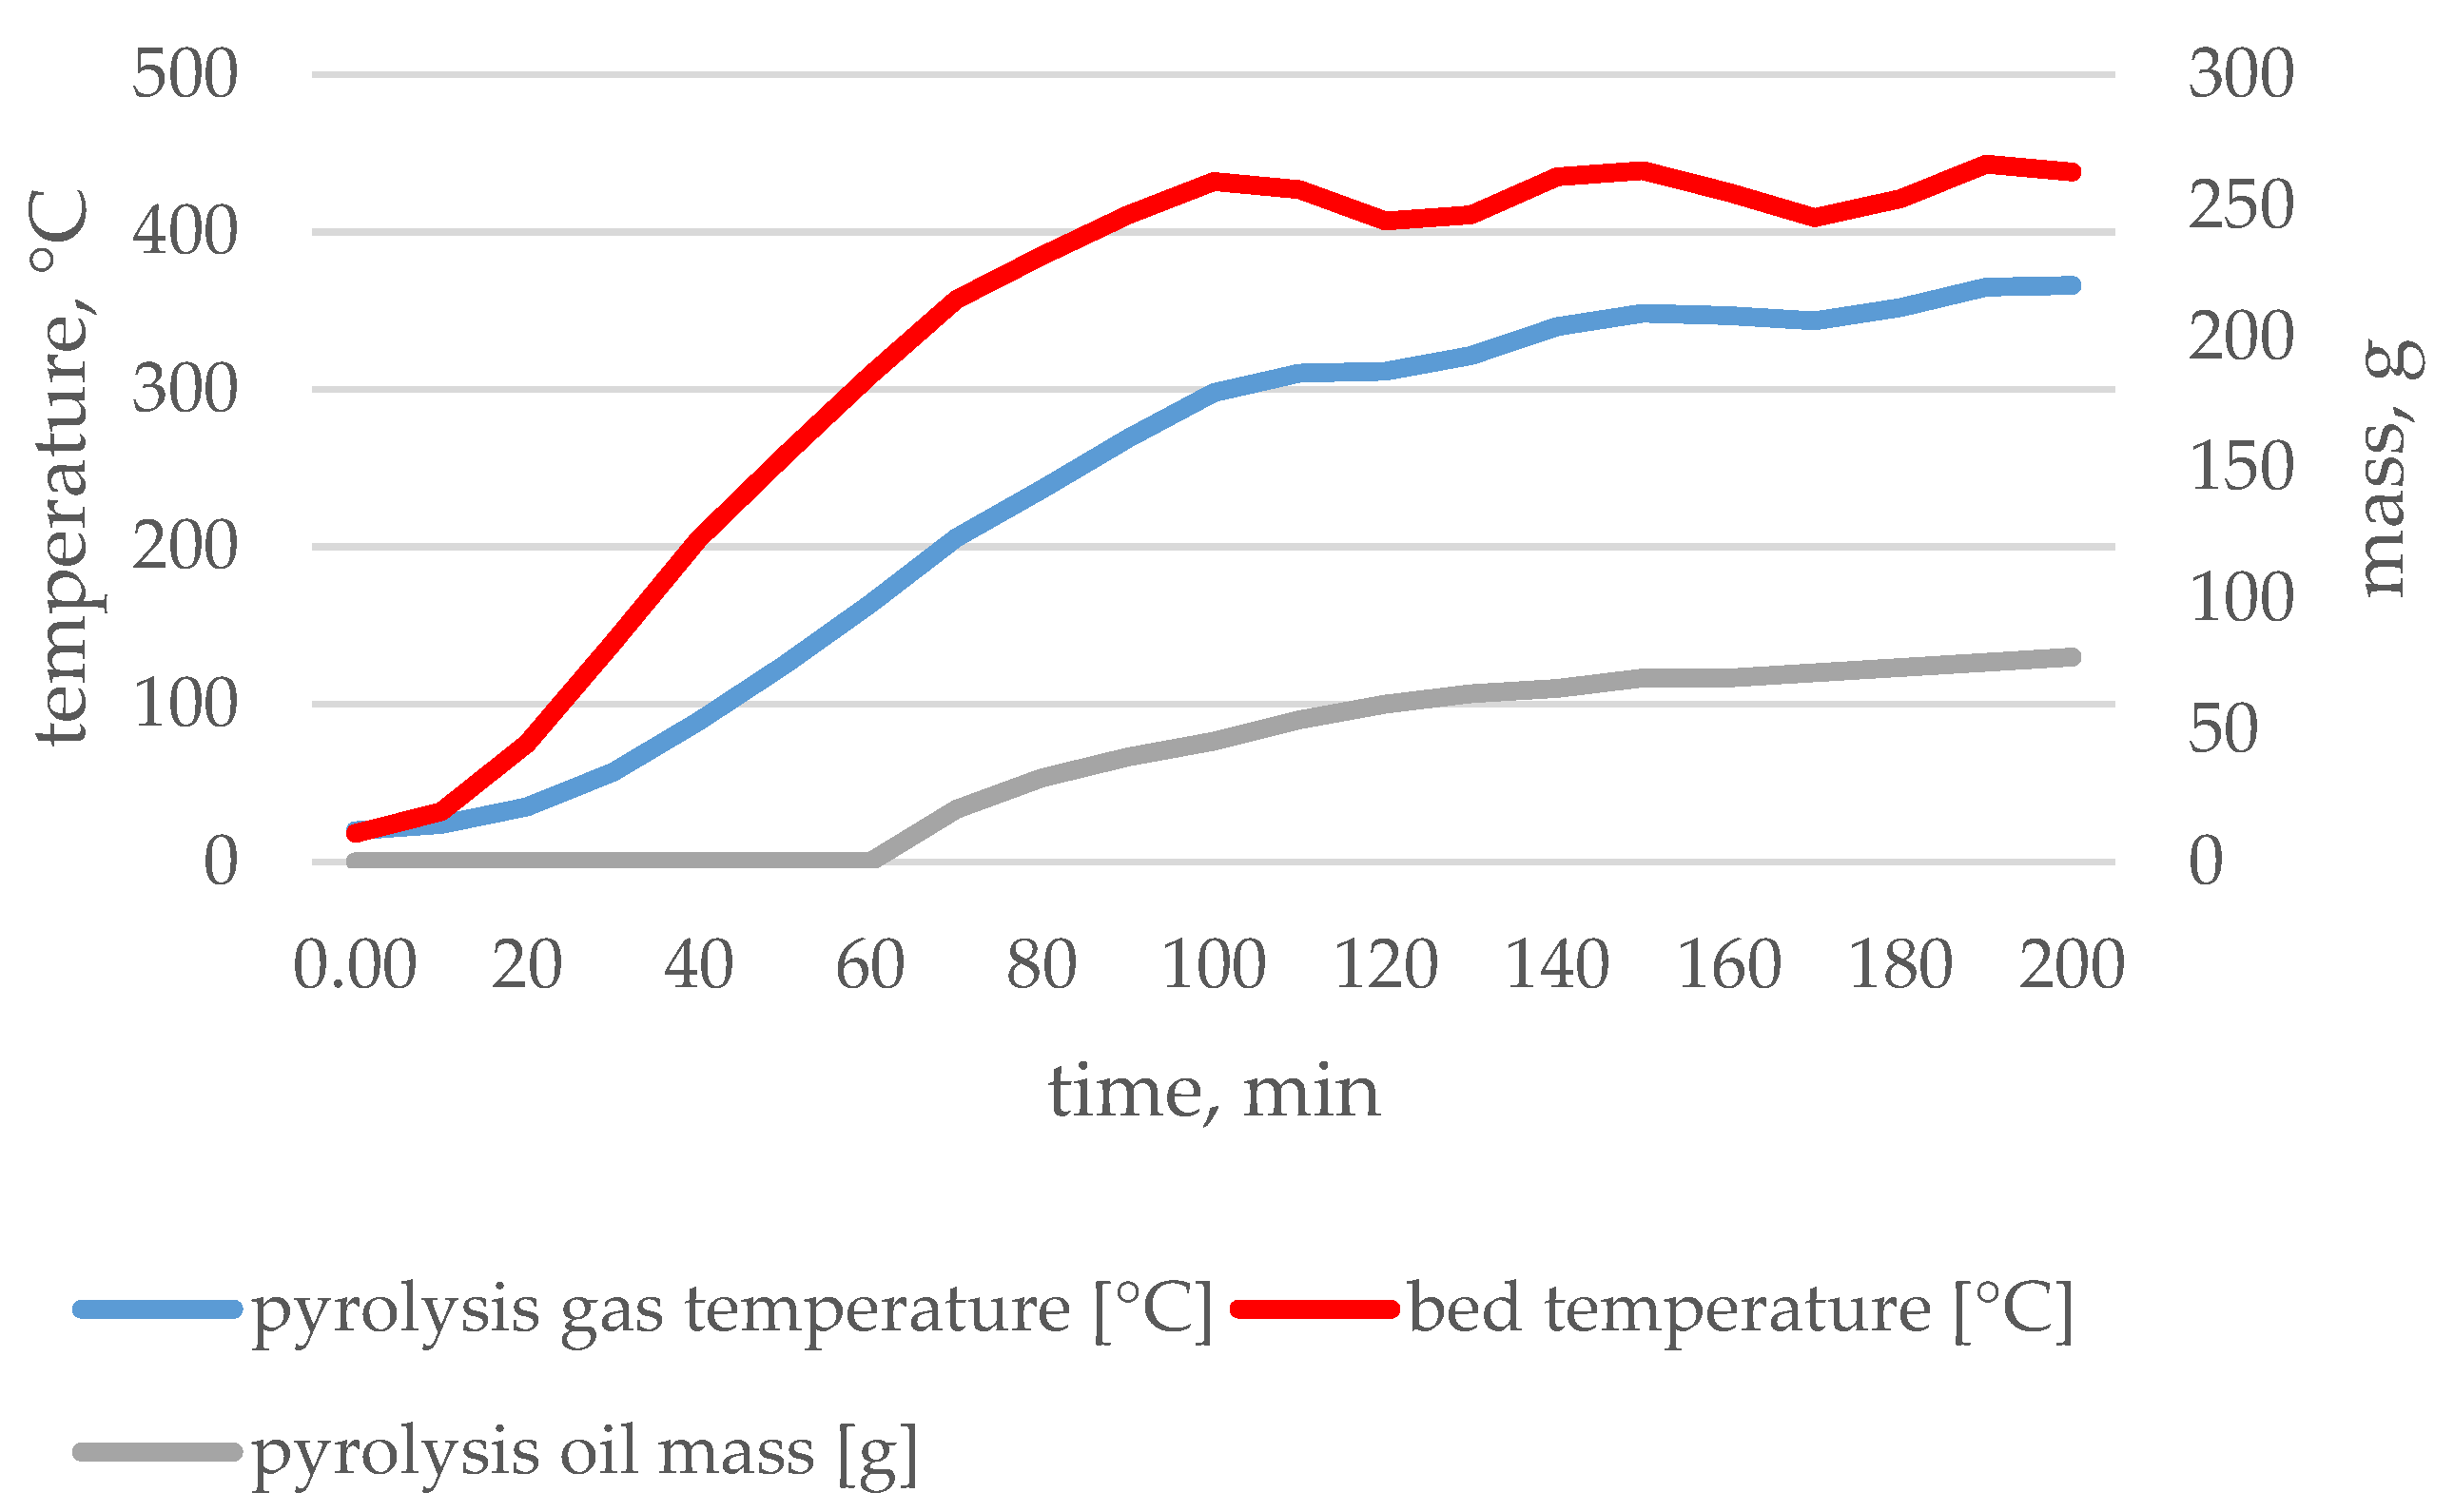
During the experiment, the weight of the samples used, the products obtained, the bed temperature, the temperature of the pyrolysis gas, and the process duration were measured. The results are presented in Figure 6, Figure 7, Figure 8, Figure 9, Figure 10 and Figure 11 and in Table 1.
A single pyrolysis process carried out in laboratory conditions lasted 200 min. It was found that regardless of the pyrolyzed material used in the apparatus, the maximum assumed temperature was (425 °C) achieved between 80 and 100 min of the experiment. For the vinyl panel, the maximum assumed temperature was achieved in the 100th minute of the experiment. Further temperature fluctuations result from the adopted heating control process of the device (following and tracking system). The temperature difference between the bed and the gas at the chamber outlet was in the order of 100–150 °C for the five cases considered, with the exception of trial 6—for vinyl panels the difference was approximately 60 °C. The onset of oil condensation was recorded for five biomass-based trials at 40 min of the experiment. However, for the vinyl record, the beginning of oil condensation took place in the 60th minute of the experiment.
The mass of char ranged from 334 g to 684 g, pyrolysis gas from 194.24 g to 378 g, and oil from 121.76 g to 296.00 g. After 24 h, the pyrolysis oil was stratified into an oil fraction (23.76–77.24 g) and water contaminated with an oil fraction (98–242.47 g). Attention was paid to the several times lower oil yield from vinyl records (121.76 g of oil from 1000 g of input) compared to the other tested samples (224 g to 296 g from 1000 g of input).

3.2. Migration of Acidic Elements (S and Cl)

Based on the low-temperature pyrolysis process, a mass balance was prepared for individual wastes. The results are presented in Table 2. Energy willow and wood-based waste had a similar product mass distribution. It was found that the char constituted approximately 1/3 of the input. The least char was obtained for HDF floor panels at the level of 33.40%, and the highest for furniture made of MDF fibreboard at the level of 41.80%. Differences in the pyrolysis gas balance between the tested samples amounted to a maximum of 2%. Pyrolysis gas accounted for 35.80% of the input for furniture made of MDF fibreboard and 37.80% for natural wood planks.
As a result of the pyrolysis, pyrolysis oil and water contaminated with oily substances were also obtained. For the tested wood-based waste, pyrolysis oil constituted less than 4.63% of the input, while twice as much oil, i.e., 7.72%, was recorded for HDF floor panels. Water contaminated with oil constitutes approximately 20% of the load. A different nature of mass distribution was found for vinyl panels. There are clear differences in the quantities of products obtained. In relation to the tested waste, for vinyl panels, the amount of char was twice as high, amounting to 68.40%, and the amount of pyrolysis gas was twice as low, amounting to 19.42%. Pyrolysis oil and water contaminated with it constituted 2.38% and 9.80% of the input, respectively. These were the lowest recorded values among the tested samples.
The sulphur content was determined in all fractions—Table 3. The exception was pyrolysis gas, for which balance calculations were performed. The tested waste had a sulphur content below 0.65%. In the char from HDF panels, the sulphur content was the highest and amounted to 0.34%, and it was the lowest in the char from natural floors, at 0.015%. For the oil fraction from wood-based waste, sulphur was at a very low level, below 0.08%. Only for the oil fraction from the vinyl panel, a sulphur content of 3.31% was recorded. In the case of pyrolysis gas, the highest sulphur content was found in gas from natural floorboards, which amounted to 1.69%.
The same research was presented in [25] where the sulphur content in waste plastics and their pyrolysis products was determined. A different trend of sulphur migration was found in the case of contaminated foils compared to wood-based waste. The foils had a higher sulphur content of 0.74%. The char had a much higher sulphur content of 0.51%. The sulphur content in the oil fraction was also several times higher, around 2.18%, compared to wood-based waste. The pyrolysis gas, however, contained several times less sulphur than the tested samples, approximately 0.11%. A similar tendency of sulphur decomposition can be seen with waste vinyl panels. For comparison, the authors of [56] state that the typical sulphur content in tires is about 1.6%. The authors of [61] report that the sulphur content in tire char ranged from 2.3% to 2.6%, and in the pyrolysis oil from 1.0% to 1.4%.
Table 4 lists the mass of sulphur in the pyrolysis substrates and products. The highest mass of sulphur was recorded in MDF boards at the level of 4.49 g and in the natural floor at the level of 6.50 g. The mass of sulphur for other waste did not exceed 3 g. The distribution of sulphur is the smallest in the oil fraction. For wood-based waste, it did not exceed 0.23 g. For HDF panels and vinyl panels, the most sulphur was found in the char, 1.14 g and 1.61 g, respectively. In turn, for the remaining tested waste, the migration of sulphur into the pyrolysis gas was found to be the highest. The most sulphur was removed from the pyrolysis gas for the natural floor, at the level of 6.37 g.
Table 5 shows the results of sulphur migration calculations. Based on the results obtained for wood-based waste and willow, it was found that most of the sulphur was removed with the pyrolysis gas. Values ranged from 43.20% to 98.05%. The least amount of sulphur was immobilized in the oil fraction, between 0.23% for natural floorboards and 2.29% for HDF floor panels. In the case of vinyl panels, only 5.69% was removed with gas, 55.43% with char, 27.12% with oil fraction, and 11.76% with contaminated water.
According to [25], for contaminated foils, sulphur migration is as follows: 2.67% is discharged with pyrolysis gas, 13.00% with char, and 84.33% with pyrolysis oil. It shows the opposite distribution compared to wood-based waste.
Table 6 shows the chlorine content in the tested waste and pyrolysis products. Chlorine was determined analytically in feedstocks, chars, and oil fractions. For pyrolysis gas, the presented results come from balance calculations. Chlorine content below the detection limit was recorded in HDF floor panels and their pyrolysis products. The chlorine content in the remaining tested wood-based loads was below 0.73%, which translates into a relatively small amount of chlorine in the pyrolysis products.
Noteworthy is the high chlorine content in the vinyl panel, at 12.55%. This value is several times higher than in wood-based waste. At the same time, high chlorine content was found in the pyrolysis products of vinyl panels. In the char it was 10.61%, in the oil fraction, 8.83%, and in the pyrolysis gas, 25.02%.
The work [23] discusses the content and migration of chlorine in contaminated foils. The chlorine content in the substrate was approximately 1% and was higher than in wood-based waste. In the char, it was several times higher, around 3%, while in the case of waste vinyl flooring, it was three times lower. For oil, it was about 0.25% and for gas 1.6%. According to [23], recycled plastics had a high content of chlorine (8.66%), char (6.65%), oil (3.42%), and gas (19.36%). The distribution is similar for the tested vinyl floor.
Table 7 shows the mass of chlorine in both the tested substrates and pyrolysis products. Considering wood-based waste first, the highest amount of chlorine was found in the MDF board and natural floor, at 6.66 g and 7.30 g, respectively. Very small amounts of chlorine in the pyrolysis oil were recorded in these wastes, below 0.12 g. The highest mass of chlorine was found in the char MDF panel, of the order of 4.93 g. For the rest of the tested wood-based samples, the most chlorine was removed with the pyrolysis gas, and the amount of chlorine did not exceed 6.95 g. In HDF panels and their pyrolysis products, the chlorine content was below the determination level. Vinyl panels were discussed separately, with 125.5 g of chlorine recorded. Very high masses of chlorine were also recorded in their pyrolysis products: char—72.52 g, pyrolysis oil with contaminated water—4.32 g, and pyrolysis gas—48.61 g.
The above tests were necessary to perform chlorine migration calculations, and the results are summarized in Table 8.
Taking into account the above results, chlorine migration is varied and is as follows: for MDF furniture, most of the chlorine is immobilized in the char (74.07%), 23.76% is removed via the pyrolysis gas, and 0.43% with the liquid fraction. For natural flooring and furniture based on chipboard, over 90% goes to the pyrolysis gas, and the remaining part goes to the char (less than 10%) and pyrolysis oil (less than 1%). In the case of vinyl panels, the migration of chlorine is as follows: 57.83% is discharged with the char, 38.73% with the pyrolysis gas, 1.67% with the oil fraction, and 1.77% with water contaminated with oils.
The authors of [23] noted the migration of chlorine for the foil. The most chlorine was removed from the char, at 61.5%, and the least from the oil, at 7.9%. For recycled plastics, the least amount was discharged with oil (9.1%), and the most with gas (75.2%), similar to vinyl waste.

4. Conclusions

In the adopted research methodology and using the existing equipment, a single pyrolysis process lasted 200 min. During this time, the temperature in the bed of the tested substance increased from the ambient temperature to the maximum temperature value adopted, based on previous thermogravimetric tests, among others. The value of this temperature was assumed to be 425 °C. As this temperature increased, the process of thermal decomposition of the tested substance began. Its beginning was assumed to be the appearance of the first drops of pyrolysis oil in the receiver. For the vinyl record, this took place in the 60th minute of the experiment at a bed temperature of 380 °C and a vapour temperature of 200 °C. For the remaining samples, this took place at 40 min and at a bed temperature between 180 and 250 °C, with a vapour temperature of 100 °C.
It has been shown that the elements contained in the waste migrate during the low-temperature pyrolysis process to individual process products. The research was carried out in terms of the migration of acidic elements, i.e., sulphur and chlorine. Due to their reaction, they may cause the corrosion of devices. Therefore, it is important to know the migration of these elements in order to propose specific design solutions in installations for processing this type of waste.
It was found that sulphur in the tested wood-based waste and energy willow migrates mainly to the pyrolysis gas, with the exception of HDF panels, for which sulphur migration is at a comparable level in the char and pyrolysis gas. For vinyl panels, the most sulphur was recorded in the char, and the least in the pyrolysis gas.
For MDF boards and vinyl panels, the highest migration of chlorine to the char was recorded, and the lowest migration to the pyrolysis oil. For HDF panels, the chlorine content was below the determination threshold, hence the degree of migration of this element could not be determined in this case. For the remaining tested samples, the greatest migration observed was to the pyrolysis gas.
Further research is planned into the use of pyrolysis products, with particular emphasis on char and pyrolysis oil. In the next research step, the char will be subjected to thermal and chemical activation in order to obtain activated carbon. Therefore, in order to select the appropriate activation method and its conditions, tests were carried out, including the migration of sulphur and chlorine, which may affect the activation process. In turn, pyrolysis oil can be used as fuel. The tests carried out will allow for the determination of the maximum concentrations of SO2/HCl gaseous pollutants, and thus for the optimal selection of devices responsible for the exhaust gas treatment system (after-combustion chamber, wet and dry adsorption).
In summary, the most important conclusion of the study is to highlight the phenomenon of acidic element migration in the individual products of the pyrolysis process, depending on the input substance to the process. In the samples with a higher content of natural substances (HDF, MDF, natural flooring, chipboard, and energy willow), the elements mostly migrated to pyrolysis gases. In the case of a vinyl panel (without natural substances), the migration of these elements into the char was observed. This information allows for optimal design of pyrolysis equipment at the technical scale. They also highlight problems that can occur when managing/using pyrolysis products in other processes. For example, the high content of acidic elements in vinyl record char may cause problems with its use as activated carbon.

Author Contributions

Conceptualization, M.K.-S. and W.Ś.; methodology, M.K.-S. and W.Ś.; validation, M.K.-S. and W.Ś.; formal analysis, M.K.-S. and W.Ś.; writing—original draft preparation, M.K.-S. and W.Ś.; writing—review and editing, M.K.-S. and W.Ś. All authors have read and agreed to the published version of the manuscript.

Funding

The publication was funded by a subsidy allocated for 2023 (08/030/BK_23/0116).

Data Availability Statement

Not applicable.

Conflicts of Interest

The authors declare no conflict of interest. The funders did not play any role in the design of the study plan.

References

  1. Roffael, E.; Schneider, T.; Dix, B.; Buchholz, T. Zur Hydrophobierung von mitteldichten Faserplatten (MDF) mit Paraffinen. Teil 1: Einfluss der chemischen Zusammensetzung des Paraffins und des Emulgatortyps auf die Hydrophobierung von MDF. Holz. Als. Roh.-Und. Werkst. 2005, 63, 192–203. [Google Scholar] [CrossRef]
  2. Wan, H.; Wang, X.M.; Bary, A.; Shen, J. Recycling wood composite panels: Characterizing recycled materials. BioResources 2014, 9, 7554–7565. [Google Scholar] [CrossRef]
  3. Nicewicz, D. Płyty Pilśniowe MDF (Fibreboard MDF); SGGW: Warszawa, Poland, 2006. [Google Scholar]
  4. Jaworski, T.; Kajda-Szcześniak, M. Research on the Kinetics of Pyrolysis of Wood-Based Panels in Terms of Waste Management. Energies 2019, 12, 3705. [Google Scholar] [CrossRef]
  5. Mu, J.; Lai, Z. Pyrolysis Characteristics of Wood-Based Panels and Its Products; IntechOpen: London, UK, 2017. [Google Scholar] [CrossRef]
  6. Zhang, Y.; He, Z.B.; Xue, L.; Chu, D.M.; Mu, J. Influence of a urea–formaldehyde resin adhesive on pyrolysis characteristics and volatiles emission of poplar particleboard. RSC Adv. 2016, 6, 12850–12861. [Google Scholar] [CrossRef]
  7. Gaze, B.; Wojtko, P.; Knutel, B.; Kobel, P.; Bobrowicz, K.; Bukowski, P.; Chojnacki, J.; Kielar, J. Influence of Catalytic Additive Application on the Wood-Based Waste Combustion Process. Energies 2023, 16, 2055. [Google Scholar] [CrossRef]
  8. Jaworski, T.; Kajda-Szcześniak, M. Study on the Similarity of the Parameters of Biomass and Solid Waste Fuel Combustion for the Needs of Thermal Power Engineering. Sustainability 2020, 12, 7894. [Google Scholar] [CrossRef]
  9. Pikoń, K.; Kajda-Szcześniak, M.; Bogacka, M. Environmental effect of co-combustion of coal with wood waste in low-power boilers. Przem. Chem. 2015, 94, 1548–1550. [Google Scholar] [CrossRef]
  10. Plis, A.; Kotyczka-Morańska, M.; Kopczyński, M.; Łabojko, G. Furniture wood waste as a potential renewable energy source. J. Therm. Anal. Calorim. 2016, 125, 1357–1371. [Google Scholar] [CrossRef]
  11. Kajda-Szcześniak, M.; Czop, M. Comparison of Pyrolysis and Combustion Processes of Vinyl Floor Panels Using Thermogravimetric Analysis (TG-FTIR) in Terms of the Circular Economy. Energies 2022, 15, 1516. [Google Scholar] [CrossRef]
  12. Ustawa o Odpadach (Dz. U. 2013 Poz. 23 z Póz. zm). Available online: https://isap.sejm.gov.pl/isap.nsf/DocDetails.xsp?id=WDU20130000021 (accessed on 27 July 2023).
  13. Landrat, M. Możliwości zagospodarowania odpadów florystycznej gąbki polifenolowej. Przem. Chem. 2017, 96, 1704–1706. [Google Scholar] [CrossRef]
  14. Kirchherr, J.; Reike, D.; Hekkert, M. Conceptualizing the circular economy: An analysis of 114 definitions. Resour. Conserv. Recycl. 2017, 127, 221–232. [Google Scholar] [CrossRef]
  15. Kulczycka, J.; Pędziwiatr, E. Gospodarka o Obiegu Zamkniętym w Polityce i Badaniach Naukowych; IGSMiE PAN: Kraków, Poland, 2019. [Google Scholar]
  16. Sauvé, S.; Bernard, S.; Sloan, P. Environmental sciences, sustainable development and circular economy: Alternative concepts for trans-disciplinary research. Environ. Dev. 2016, 17, 48–56. [Google Scholar] [CrossRef]
  17. Sakthipriya, N. Plastic waste management: A road map to achieve circular economy and recent innovations in pyrolysis. Sci. Total Environ. 2022, 809, 151160. [Google Scholar] [CrossRef]
  18. Poskart, A.; Skrzyniarz, M.; Sajdak, M.; Zajemska, M.; Skibiński, A. Management of Lignocellulosic Waste towards Energy Recovery by Pyrolysis in the Framework of Circular Economy Strategy. Energies 2021, 14, 5864. [Google Scholar] [CrossRef]
  19. Sherwood, J. The significance of biomass in a circular economy. Bioresour. Technol. 2020, 300, 122755. [Google Scholar] [CrossRef] [PubMed]
  20. Andooz, A.; Eqbalpour, M.; Kowsari, E.; Ramakrishna, S.; Cheshmeh, Z.A. A comprehensive review on pyrolysis from the circular economy point of view and its environmental and social effects. J. Clean. Prod. 2023, 388, 136021. [Google Scholar] [CrossRef]
  21. Stelmach, S. Piroliza Odpadów Jako Element Gospodarki o Obiegu Zamkniętym (Pyrolysis of Waste as a Component of Circular Economy); Wyd. Politechnika Śląska: Gliwice, Poland, 2019. [Google Scholar]
  22. Basu, P. Biomass Gasification and Pyrolysis Practical Design and Theory, 2nd ed.; Elsevier: Oxford, UK, 2010. [Google Scholar]
  23. Ścierski, W.; Landrat, M.; Pikoń, K.; Bogacka, M. Analysis of chlorine migration in low temperature pyrolysis process. Przem. Chem. 2019, 98, 1448–1450. [Google Scholar] [CrossRef]
  24. Zaman, C.Z.; Pal, K.; Yehye, W.A.; Sagadevan, S.; Shah, S.T.; Adebisi, G.A.; Marliana, E.; Rafique, R.F.; Johan, R.B. Pyrolysis: A Sustainable Way to Generate Energy from Waste; IntechOpen: London, UK, 2017. [Google Scholar] [CrossRef]
  25. Ścierski, W. Migration of Sulfur and Nitrogen in the Pyrolysis Products of Waste and Contaminated Plastics. Appl. Sci. 2021, 11, 4374. [Google Scholar] [CrossRef]
  26. Gaoa, N.; Li, A.; Quana, C.; Dub, L.; Duan, Y. TG–FTIR and Py–GC/MS analysis on pyrolysis and combustion of pine sawdust. J. Anal. Appl. Pyrolysis 2013, 100, 26–32. [Google Scholar] [CrossRef]
  27. Yaman, S. Pyrolysis of biomass to produce fuels and chemical feedstocks. ChemInform 2004, 45, 651–671. [Google Scholar]
  28. Wu, J.; Wang, L.; Ma, H.; Zhou, J. Investigation of element migration characteristics and product properties during biomass pyrolysis: A case study of pine cones rich in nitrogen. RSC Adv. 2021, 11, 34795–34805. [Google Scholar] [CrossRef] [PubMed]
  29. Park, J.; Lee, Y.; Ryu, C.; Park, Y.-K. Slow pyrolysis of rice straw: Analysis of products properties, carbon and energy yields. Bioresour. Technol. 2014, 155, 63–70. [Google Scholar] [CrossRef]
  30. Demirbas, A.; Arin, G. An Overview of Biomass Pyrolysis. Energy Sources 2002, 24, 471–482. [Google Scholar] [CrossRef]
  31. Liu, Z.; Han, G. Production of solid fuel biochar from waste biomass by low temperature pyrolysis. Fuel 2015, 158, 159–165. [Google Scholar] [CrossRef]
  32. Dhyani, V.; Bhaskar, T. A comprehensive review on the pyrolysis of lignocellulosic biomass. Renew. Energy 2018, 129, 695–716. [Google Scholar] [CrossRef]
  33. Wang, Z.; Wei, R.; Wang, X.; He, J.; Wang, J. Pyrolysis and Combustion of Polyvinyl Chloride (PVC) Sheath for New and Aged Cables via Thermogravimetric Analysis-Fourier Transform Infrared (TG-FTIR) and Calorimeter. Materials 2018, 11, 1997. [Google Scholar] [CrossRef]
  34. Huggett, C.; Levin, B.C. Toxicity of the Pyrolysis and Combustion Products of Poly (Vinyl Chlorides): A Literature Assessment. Fire Mater. 1987, 11, 131–142. [Google Scholar] [CrossRef]
  35. Yu, J.; Sun, L.; Ma, C.; Qiao, Y.; Yao, H. Thermal degradation of PVC: A review. Waste Manag. 2016, 48, 300–314. [Google Scholar] [CrossRef]
  36. Zhu, H.M.; Jiang, X.G.; Yan, J.H.; Chi, Y.; Cen, K.F. TG-FTIR analysis of PVC thermal degradation and HCl removal. J. Anal. Appl. Pyrolysis 2008, 82, 1–9. [Google Scholar] [CrossRef]
  37. Knümann, R.; Bockhorn, H. Investigation of the Kinetics of Pyrolysis of PVC by TG-MS-Analysis. Combust. Sci. Technol. 1994, 101, 285–299. [Google Scholar] [CrossRef]
  38. Miranda, R.; Yang, J.; Roy, C.; Vasilec, C. Vacuum pyrolysis of PVC I. Kinetic study. Polym. Degrad. Stab. 1999, 64, 127–144. [Google Scholar] [CrossRef]
  39. Sieradzka, M.; Kirczuk, C.; Kalemba-Rec, I.; Mlonka-Mędrala, A.; Magdziarz, A. Pyrolysis of Biomass Wastes into Carbon Materials. Energies 2022, 15, 1941. [Google Scholar] [CrossRef]
  40. Sajdak, M.; Muzyka, R.; Gałko, G.; Ksepko, E.; Zajemska, M.; Sobek, S.; Tercki, D. Actual Trends in the Usability of Biochar as a High-Value Product of Biomass Obtained through Pyrolysis. Energies 2023, 16, 355. [Google Scholar] [CrossRef]
  41. Qambrani, N.A.; Rahman, M.M.; Won, S.; Shim, S.; Ra, C. Biochar Properties and Eco-Friendly Applications for Climate Change Mitigation, Waste Management, and Wastewater Treatment: A Review. Renew. Sustain. Energy Rev. 2017, 79, 255–273. [Google Scholar] [CrossRef]
  42. Lehmann, J.; Joseph, S. Biochar for Environmental Management: Science and Technology; Routledge: London, UK, 2012; pp. 1–416. [Google Scholar]
  43. Soffian, M.S.; Abdul Halim, F.Z.; Aziz, F.; Rahman, M.A.; Mohamed Amin, M.A.; Awang Chee, D.N. Carbon-Based Material Derived from Biomass Waste for Wastewater Treatment. Environ. Adv. 2022, 9, 100259. [Google Scholar] [CrossRef]
  44. Treviño-Cordero, H.; Juárez-Aguilar, L.G.; Mendoza-Castillo, D.I.; Hernández-Montoya, V.; Bonilla-Petriciolet, A.; Montes-Morán, M.A. Synthesis and Adsorption Properties of Activated Carbons from Biomass of Prunus Domestica and Jacaranda Mimosifolia for the Removal of Heavy Metals and Dyes from Water. Ind. Crops Prod. 2013, 42, 315–323. [Google Scholar] [CrossRef]
  45. Weng, Z.; van Zwieten, L.; Singh, B.P.; Tavakkoli, E.; Joseph, S.; Macdonald, L.M.; Rose, T.J.; Rose, M.T.; Kimber, S.W.L.; Morris, S.; et al. Biochar Built Soil Carbon over a Decade by Stabilizing Rhizodeposits. Nat. Clim. Chang. 2017, 7, 371–376. [Google Scholar] [CrossRef]
  46. Shukla, I. Potential of Renewable Agricultural Wastes in the Smart and Sustainable Steelmaking Process. J. Clean. Prod. 2022, 370, 133422. [Google Scholar] [CrossRef]
  47. Rose, J.; Adams, T.A. Process Design and Techno-Economic Analysis of Biomass Pyrolysis By-Product Utilization in the Ontario and Aichi Steel Industries; Elsevier Masson SAS: Amsterdam, The Netherlands, 2022; Volume 49, ISBN 9780323851596. [Google Scholar]
  48. Suopajärvi, H.; Dahl, E.; Kemppainen, A.; Gornostayev, S.; Koskela, A.; Fabritius, T. Effect of Charcoal and Kraft-Lignin Addition on Coke Compression Strength and Reactivity. Energies 2017, 10, 1850. [Google Scholar] [CrossRef]
  49. Kouchachvili, L.; Entchev, E. Ag/Biochar Composite for Supercapacitor Electrodes. Mater. Today Energy 2017, 6, 136–145. [Google Scholar] [CrossRef]
  50. Aboulkas, A.; El Harfi, K. Co-pyrolysis of olive residue with poly(vinyl chloride) using thermogravimetric analysis. J. Therm. Anal. Calorim. 2009, 95, 1007–1013. [Google Scholar] [CrossRef]
  51. Czégény, Z.; Jakab, E.; Bozi, J.; Blazsó, M. Pyrolysis of wood—PVC mixtures. Formation of chloromethane from lignocellulosic materials in the presence of PVC. J. Anal. Appl. Pyrol. 2015, 113, 123–132. [Google Scholar] [CrossRef]
  52. Zhou, H.; Long, Y.; Meng, A.; Li, Q.; Zhang, Y. Interactions of three municipal solid waste components during co-pyrolysis. J. Anal. Appl. Pyrolysis 2015, 111, 265–271. [Google Scholar] [CrossRef]
  53. Bittencourt, P.R.S.; Scremin, F. Evolved Gas Analysis of PE: PVC Systems Thermodegradation Under Inert and Oxidizing Atmosphere. J. Polym. Environ. 2019, 27, 612–617. [Google Scholar] [CrossRef]
  54. Xiu, F.-R.; Lu, Y.; Qi, Y. DEHP degradation and dechlorination of polyvinyl chloride waste in subcritical water with alkali and ethanol: A comparative study. Chemosphere 2020, 249, 126138. [Google Scholar] [CrossRef] [PubMed]
  55. Nozue, K.; Tagaya, H. Chemical recycling of waste Poly Vinyl Chloride (PVC) by the liquid-phase treatment. J. Mater. Cycles Waste Manag. 2021, 23, 489–504. [Google Scholar] [CrossRef]
  56. Susa, D.; Haydary, J. Sulphur distribution in the products of waste tire pyrolysis. Chem. Pap. 2013, 67, 1521–1526. [Google Scholar] [CrossRef]
  57. Guo, X.; Zhang, W.; Wang, L.; Hao, J. Comparative study of nitrogen migration among the products from catalytic pyrolysis and gasification of waste rigid polyurethane foam. J. Anal. Appl. Pyrolysis 2016, 120, 144–153. [Google Scholar] [CrossRef]
  58. Szargut, J.; Guzik, A.; Górniak, H. Programowany Zbiór Zadań z Termodynamiki Technicznej; PWN: Warszawa, Poland, 1986. [Google Scholar]
  59. PN-ISO 351:1999; Solid Fuels—Determination of Total Sulphur (High-Temperature Combustion Method). ISO: Geneva, Switzerland. Available online: https://sklep.pkn.pl/pn-iso-351-1999p.html (accessed on 27 July 2023).
  60. PN-ISO 587:2000; Solid Fuels—Determination of Chlorine Content Using Eschka Mixture. ISO: Geneva, Switzerland. Available online: https://sklep.pkn.pl/pn-iso-587-2000p.html (accessed on 27 July 2023).
  61. de Marco Rodriguez, I.; Laresgoiti, M.F.; Cabrero, M.A.; Torres, A.; Chomón, M.J.; Caballero, B. Pyrolysis of scrap tyre. Fuel Process. Technol. 2001, 72, 9–22. [Google Scholar] [CrossRef]
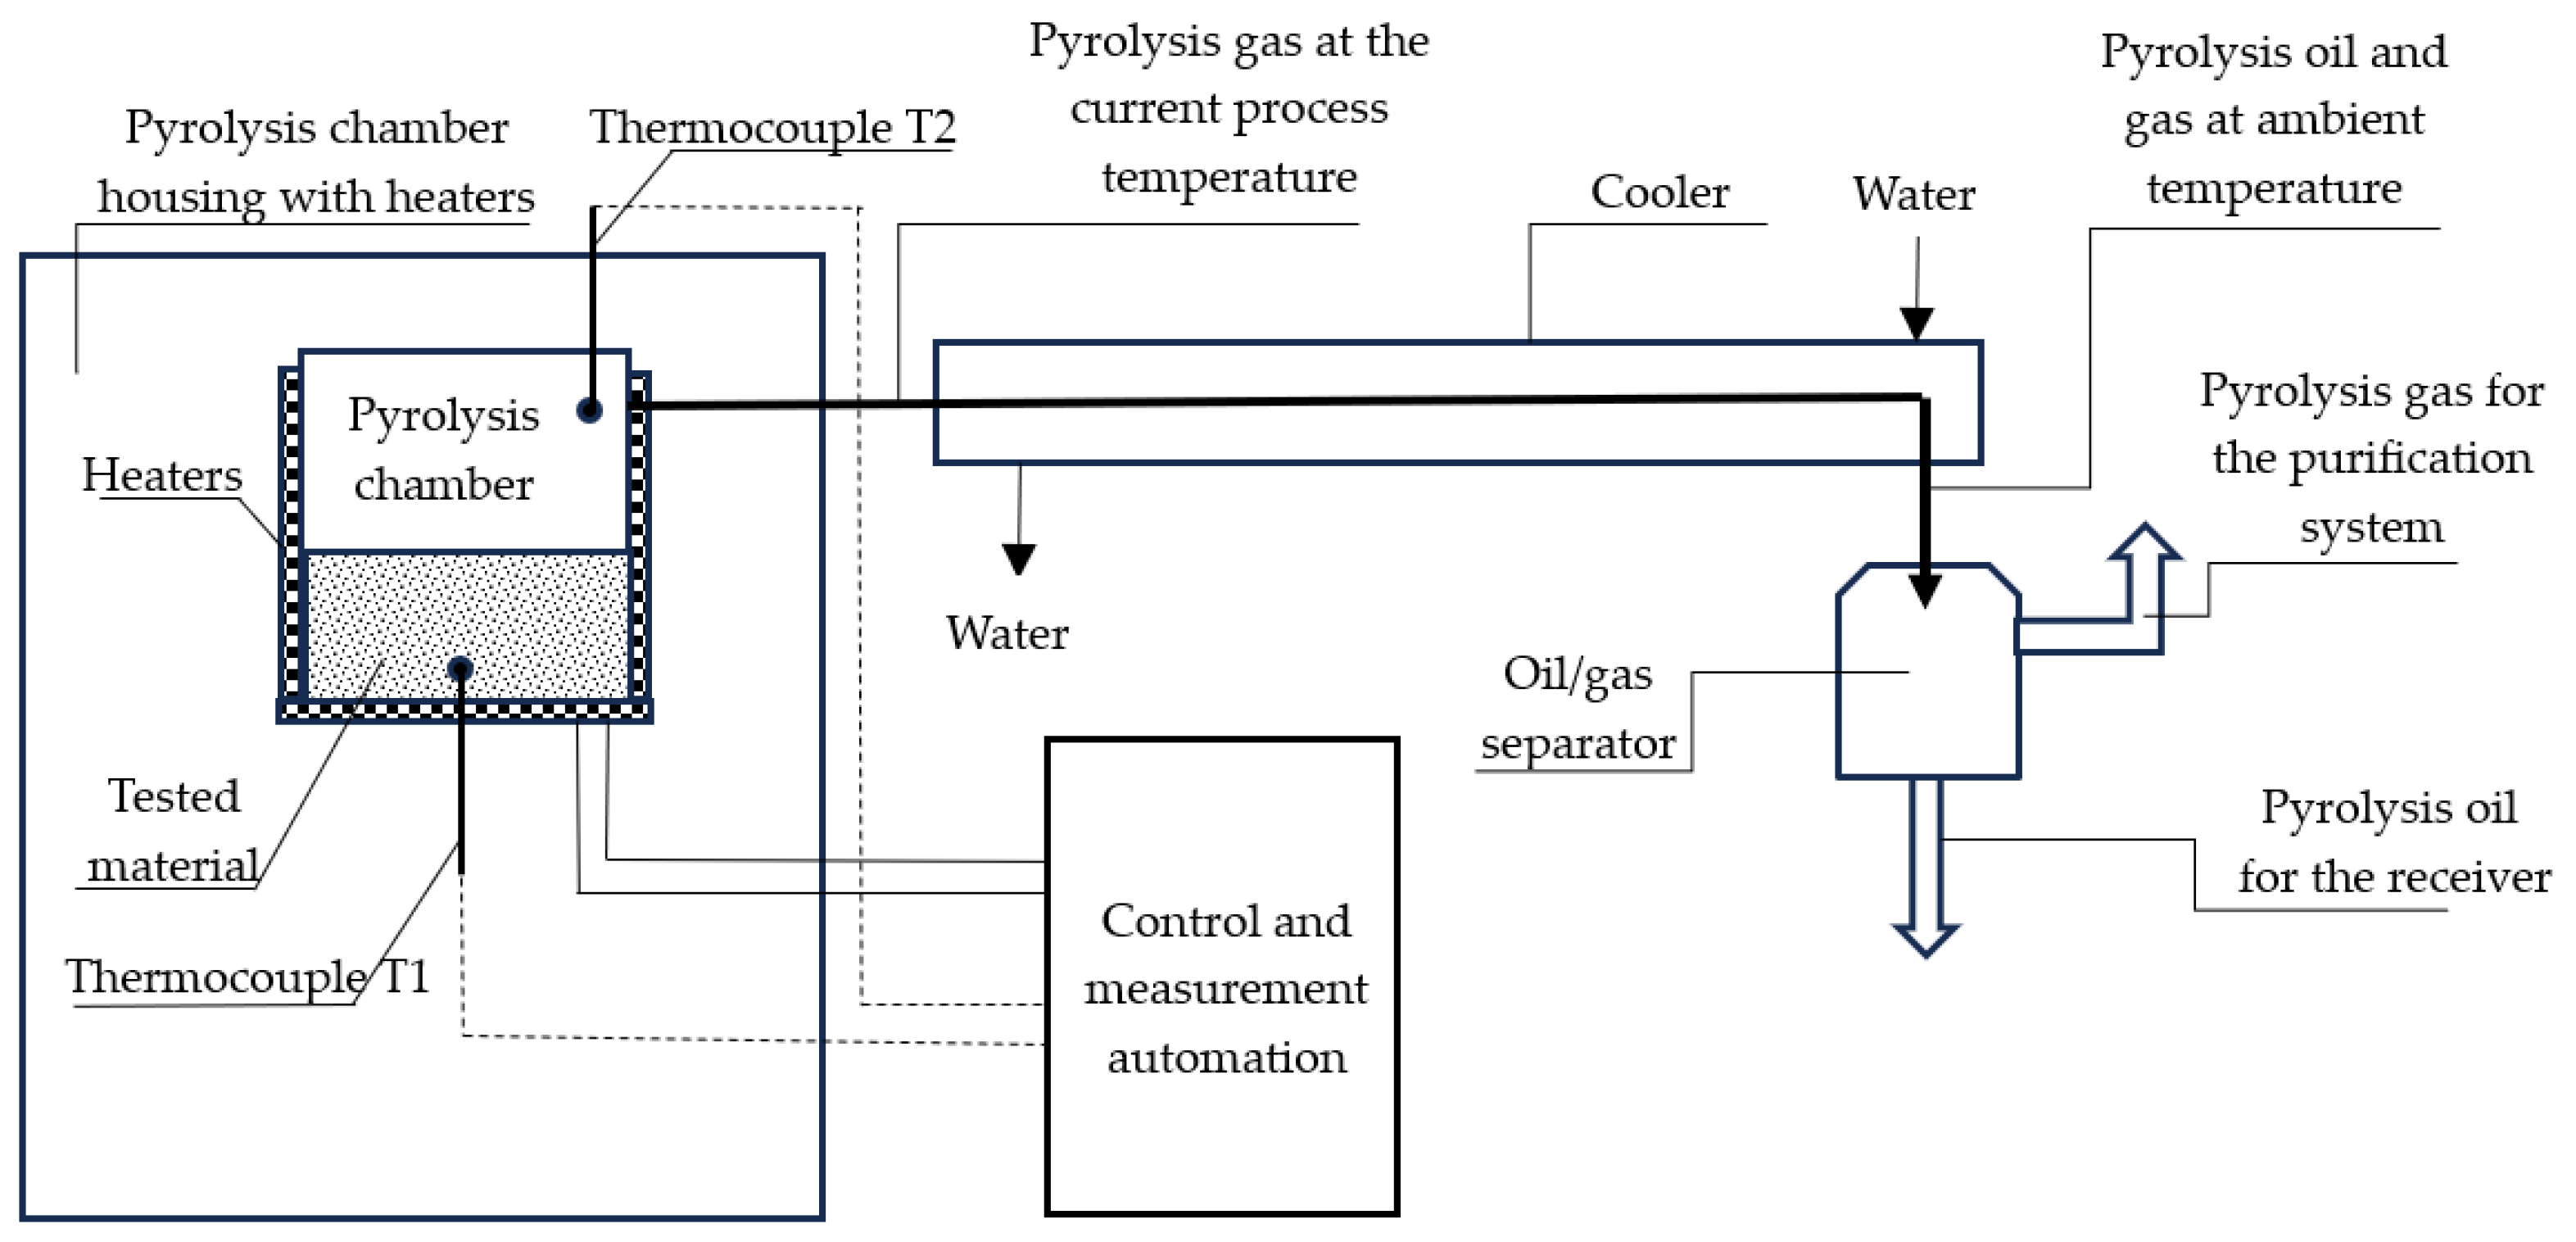
Figure 1. Scheme of the test stand for carrying out the pyrolysis process (author: Waldemar Ścierski).
Energies 16 07446 g001
Figure 2. The pyrolysis chamber before and after the low-temperature pyrolysis process (author: Małgorzata Kajda-Szcześniak).
Energies 16 07446 g002
Figure 3. Examples of pyrolysis products: (a) char, (b) pyrolysis oil, and (c) water contaminated with oil fraction (author: Małgorzata Kajda-Szcześniak).
Energies 16 07446 g003
Figure 4. Thermogravimetric analysis TG/DTG curves of waste floor panels made of HDF fibreboard (own research).
Energies 16 07446 g004
Figure 5. Thermogravimetric analysis TG/DTG curves of waste floor panels made of vinyl board (own research).
Energies 16 07446 g005
Figure 6. Monitored process parameters for waste floor panels made of HDF fibreboard.
Energies 16 07446 g006
Figure 7. Monitored process parameters for waste furniture made of MDF fibreboard.
Energies 16 07446 g007
Figure 8. Monitored process parameters for waste furniture made of chipboard.
Energies 16 07446 g008
Figure 9. Monitored process parameters for waste floor planks made of natural wood.
Energies 16 07446 g009
Figure 10. Monitored process parameters for energy willow chips.
Energies 16 07446 g010
Figure 11. Monitored process parameters for waste floor panels made of vinyl board.
Energies 16 07446 g011
Table 1. Masses of substrates and products, g.
Type of WasteInputCharPyrolytic OilPyrolytic
Gas
Oil-Contaminated WaterOil
HDF floor panel1000.00334.00218.7677.24370.00
MDF furniture board1000.00418.00192.1431.86358.00
Chipboard furniture1000.00356.00242.4741.53360.00
Natural floor plank1000.00346.00229.7346.27378.00
Energy willow1000.00360.00221.1242.88376.00
Vinyl floor panel1000.00684.0098.00023.76194.24
Table 2. Results of mass balance calculations, %.
Type of WasteInputCharPyrolytic OilPyrolytic
Gas
Oil-Contaminated WaterOil
HDF floor panel100.0033.4021.887.7237.00
MDF furniture board100.0041.8019.213.1935.80
Chipboard furniture100.0035.6024.254.1536.00
Natural floor plank100.0034.6022. 974.6337.80
Energy willow100.0036.0022.114.2937.60
Vinyl floor panel100.0068.409.802.3819.42
Table 3. The results of the pyrolysis process in terms of sulphur content, % by mass.
Type of WasteInputCharPyrolytic OilPyrolytic
Gas
Oil-Contaminated WaterOil
HDF floor panel0.240.340.080.070.28
MDF furniture board0.450.220.050.080.95
Chipboard furniture0.210.060.100.050.45
Natural floor plank0.650.0150.030.031.69
Energy willow0.220.050.000.050.53
Vinyl floor panel0.290.230.353.310.09
Table 4. Mass of sulphur in pyrolysis substrates and products, g.
Type of WasteInputCharPyrolytic OilPyrolytic
Gas
Oil-Contaminated WaterOil
HDF floor panel2.401.140.170.061.04
MDF furniture board4.490.940.100.033.40
Chipboard furniture2.100.230.230.021.62
Natural floor plank6.500.050.060.026.37
Energy willow2.200.190.000.021.99
Vinyl floor panel2.901.610.340.790.17
Table 5. The results of sulphur migration calculations, % by mass.
Type of WasteInputCharPyrolytic OilPyrolytic
Gas
Oil-Contaminated WaterOil
HDF floor panel100.0047.327.202.2943.20
MDF furniture board100.0020.872.230.5876.30
Chipboard furniture100.0010.8511.030.9777.15
Natural floor plank100.000.800.920.2398.05
Energy willow100.008.510.000.8890.61
Vinyl floor panel100.0055.4311.7627.125.69
Table 6. The results of the pyrolysis process in terms of chlorine content, % by mass.
Type of WasteInputCharPyrolytic OilPyrolytic
Gas
Oil-Contaminated WaterOil
HDF floor panel0.000.000.000.000.00
MDF furniture board0.671.180.060.090.44
Chipboard furniture0.300.080.000.000.75
Natural floor plank0.730.090.000.071.84
Energy willow0.080.080.000.070.13
Vinyl floor panel12.5510.612.278.8325.02
Table 7. Mass of chlorine in pyrolysis substrates and products, g.
Type of WasteInputCharPyrolytic OilPyrolytic
Gas
Oil-Contaminated WaterOil
HDF floor panel0.000.000.000.000.00
MDF furniture board6.664.930.120.031.58
Chipboard furniture3.000.290.000.002.71
Natural floor plank7.300.320.000.036.95
Energy willow0.800.290.000.030.48
Vinyl floor panel125.5072.572.222.1048.61
Table 8. The results of chlorine migration calculations, % by mass.
Type of WasteInputCharPyrolytic OilPyrolytic
Gas
Oil-Contaminated WaterOil
HDF floor panel0.000.000.000.000.00
MDF furniture board100.0074.071.730.4323.76
Chipboard furniture100.009.550.000.0090.45
Natural floor plank100.004.410.000.4495.15
Energy willow100.0036.000.003.7560.25
Vinyl floor panel100.0057.831.771.6738.73
Disclaimer/Publisher’s Note: The statements, opinions and data contained in all publications are solely those of the individual author(s) and contributor(s) and not of MDPI and/or the editor(s). MDPI and/or the editor(s) disclaim responsibility for any injury to people or property resulting from any ideas, methods, instructions or products referred to in the content.