Abstract
The China Geological Survey (CGS) has carried out a large number of surveys and core drilling over the deepwater area of Qiongdongnan Basin (QDNB) in the South China Sea and discovered the natural gas hydrate system controlled by the gas chimney with a high geothermal gradient. The complex hydrate system consists of a sandy hydrate reservoir distributed around a lateral transition gas-hydrate mixed zone and a free gas zone in the middle. The hydrate and gas are distributed in the same layer, which is thin but potentially valuable for commercial exploitation. In this paper, a geological model of the target hydrate system in QDNB was established based on the results of several rounds of drilling. The method of numerical simulation was utilized to assess the production capacity of the target hydrate system and clarify the evolution of hydrate and gas saturation distribution with different well positions. The simulation results indicate that the producer well built in the center of the highly-saturated hydrate zone has a limited gas production capacity, with a cumulative production of only 7.25 × 10⁶ m3 in 9 years. The well built at the boundary of the hydrate zone can rapidly link up the gas in the transition zone through a large production pressure differential, but it lacks control over the hydrates and its dissociated gas in the transition zone—the cumulative gas production volume from hydrate accounts for only 12.3%. As for the wells built in the transition zone and gas zone, they can directly invoke the free gas production capacity. Free gas is produced as the formation pressure reduces and hydrate is induced to dissociate, making the gas from the hydrate the subsequent production capacity. The cumulative production can exceed 6 × 10⁸ m3 in 9 years. The stable production duration can extend to 2645 days, and the cumulative proportion of gas at the wellhead from hydrate reaches close to 30%. It is necessary to avoid the free water layer. The bottom water coning would improve the water production by 40% and shorten the stable production duration. In summary, the complex hydrate system of this type in the QDNB has the potential for industrialized exploitation. In the future, the well group can be used for the further improvement of the hydrate utilization rate.
1. Introduction
Natural gas hydrates are ice-like cage compounds formed by the interaction of light hydrocarbons and water at high pressure and low temperature [1], which are widely found in the high latitude permafrost, such as the Alaska North Slope, the Mackenzie Delta in Canada, the Qilian Mountains in Qinghai, China [2,3,4,5,6], the edge of the continental slope under deepwater, such as the Black Sea, the Nankai Trough in Japan, the Ulleung Basin in Korea, and the northern South China Sea [7,8,9,10,11,12,13,14]. Under standard conditions, 1 m3 of methane hydrate can yield 164 m3 of methane. Global estimates of the carbon equivalent content in hydrates range from 1 × 10² Gt to 5.6 × 10⁴ Gt [15,16,17,18]. For example, the gas reserves in the Black Sea are estimated to be 7.7 Gt [19].
Due to its wide distribution and large resources, hydrate is regarded as a high-quality and efficient alternative energy source. Some countries are actively carrying out corresponding production tests [20,21]. The China Geological Survey (CGS) has carried out two hydrate production tests in the Shenhu area, South China Sea, in 2017 and 2020 [22,23].
It is generally believed that the capillary force in sediment pores increases the methane concentration required for hydrate generation, decreases the equilibrium temperature, and makes hydrate growth more difficult, so gas hydrates with high saturation are usually discovered from coarse-grained sandy reservoirs [24,25,26,27], e.g., mass flow deposits in the Ulleung Basin and coarse-grained turbidite sands within them play an important role in the enrichment of pore-filled hydrates [28,29]. According to the drilling reports in the Gulf of Mexico, high abundance hydrates with 50–80% saturation are also found in channel deposits with a very low content of clay [30,31,32]. It is generally believed that these high gas hydrate saturations are attributed to the presence of sand-dominated lithology with high porosity and high permeability [33]. However, the results of multiple rounds of drilling and coring conducted by the CGS showed that the orebody in the Shenhu area comprised dispersed hydrate accumulations. The reservoirs were composed of clay silt fine-grained sediments rich in foraminifera, where the average saturation of hydrate cores exceeded 20% and reached a maximum of 47.3%. However, the sand content was less than 10% and silt content was 70–80% [34,35,36,37]. Obviously, hydrates in the Shenhu area are discoveries with large saturation in fine-grained sediments. Due to the shallow storage and light compaction of skeleton particles, part of the pore space is preserved. In addition, the foraminifera fossils also provide a large amount of host space [38]. The porosity of the Shenhu formations is not greatly affected by the fine particles. However, the high content of clay and other fines results in a small volume of individual pores, poor connectivity between pore throats, and even a large number of nano-scale pores and dead pores [39,40], all of which cause the permeability of hydrate reservoirs in the Shenhu area to be significantly lower than that of hydrate reservoirs in other seas. Interpretation of logs at Site W19 shows that the average porosity of the hydrate layer is 0.3 and permeability is 5.5 mD, while the average permeability of the underlying gas layer is only 1.16 mD [41,42]. Low-permeability clayed formations definitely pose problems for the flow. The gas-water flow characteristics of the Shenhu reservoir indicate the high connate water, narrow gas-water two-phase zone, and weak gas flow capacity under the restriction of “water blockage”. In addition, clayed fine-grained reservoirs are extremely sensitive to liquid flow rate, and the permeability decreases irreversibly when the pressure gradient exceeds the threshold. The creep characteristics of clayed soft rocks and particle transport will decrease permeability [43,44], which is a great challenge for hydrate exploitation that relies strongly on pressure drop to break the phase equilibrium.
In recent years, CGS has shifted the focus of exploration and drilling to another promising area, the Qiongdongnan Basin (QDNB). QDNB is located in the western part of the continental slope of the South China Sea, bordering the Xisha Islands and Hainan Island in the north-south direction and between the Pearl River Mouth Basin and Yinggehai Basin in the east-west direction, with water depths ranging from 300 m to 2600 m [45,46]. The CGS has acquired a large volume of 2D seismic data and high-definition 3D seismic data in the deepwater area of QDNB, covering most of the favorable exploration and drilling areas for hydrate. From 2018 to 2021, four hydrate scientific drilling campaigns were carried out in the southern indentation area of QDNB, acquiring corresponding resistivity, gamma, acoustic, density, resistivity imaging, and NMR logging information. The sandy hydrate-bearing cores were discovered, and field data such as CT scans and acoustic tests were also acquired. It is confirmed that the sandy sediments in the deepwater area of the southern QDNB have superior conditions for hydrate accumulation [47,48,49,50]. The type of hydrate formation and output characteristics found so far in the QDNB are similar to those of leakage gas hydrate reservoirs in the Gulf of Mexico and Indian KG Basin [51,52]. Core samples show the hydrates are visible and filled in unconsolidated sediment fractures as blocks, layers, and nodules, which are significantly different from typical dispersed hydrates in the Shenhu area [53]. More importantly, the seismic interpretation shows that the hydrate saturation in the QDNB is extremely high, partially up to 60–80%. The local amplitude enhancement and obvious boundary caused by high saturation hydrate can be identified in the hydrate stability zone [54]. There are usually gas chimneys, faults, and other good channels for deep fluid transport and migration in the lower part of hydrate-bearing sediments [55,56,57]. Temperature logging shows that the geothermal gradient exceeds 100 °C/km, while that of the nearby hydrate layer is only 65 °C/km. The huge difference in geothermal gradient is caused by the continuous convection effect between deep and shallow fluids. It reshapes the shallow temperature-pressure system and changes the hydrate stability zone [58]. Milkov has proposed that after fluids containing supersaturated gas flow from the deep to the shallow hydrate stability zone, hydrocarbon-rich fluid diffuses and gradually cools, and then hydrate grows in a ring around the gas chimney [59]. The discovery of thermogenic shallow gas in the middle of the hydrate drilling target area of the QDNB in 2019 can precisely support the above idea [60]. Such a discovery confirms that the hydrate deposits in the QDNB have a special distribution, where the gas gathers in the middle, and the hydrate distributes around, unlike the conventional type 1 hydrate reservoir [61]. Similar complex hydrate systems are widespread in QDNB, which meet the geological characteristics of “multi-gas co-production” [62].
There have been many studies on the production capacity assessment of different types of hydrate reservoirs, whether using depressurization, thermal stimulation, inhibitor injection, or CO2 replacement [63,64,65,66,67]. For type 2 and 3 hydrate reservoirs with the most economical and simple depressurization method, commercial gas flow can only be obtained when the reservoir properties are superior, including large hydrate layer thickness, high effective permeability, and high original temperature [68,69,70,71]. For type 1 hydrate, the temperature and pressure conditions at the bottom of the hydrate layer are located at the phase equilibrium point; only small changes in pressure and temperature can induce hydrate dissociation. Moreover, a free gas can guarantee gas production even when the hydrate contribution is small at the initial stage. The above studies can predict the production potential of complex hydrate systems in the QDNB.
Therefore, this paper establishes the geological model of the target hydrate system in the QDNB based on the results of multiple rounds of drilling by the CGS. The method of numerical simulation was utilized to assess the capacity of the target hydrate deposit and clarify the evolution of hydrate and gas distribution during exploitation with different well positions. It can provide theoretical and technical support for the optimization of commercial development schemes in the gas hydrate exploration pioneer experimental area of QDNB.
2. Geological Background and Model
A preliminary geological model of the target hydrate reservoir was established with logging data and seismic data in the QDNB. A large number of geological surveys have been carried out in this target zone, including more than 20 drilling and coring wells and adequate high-definition seismic data. The acquired logging and seismic data are interpreted to determine the spatial distribution pattern of key geological parameters, such as porosity, permeability, and phase saturation. It is extremely important to construct the hydrate-gas transition zone. The geological model is also validated with the logging data through Petrel. The water depth is about 1760 m, and the mudline temperature is 3.1 °C. Figure 1 shows the three-dimensional geological model of the target reservoir. The horizontal and vertical span is about 4.8 km and 2.5 km, respectively. The thickness of the sediment is small, usually less than 10 m. The absolute permeability of unconsolidated sandy formations is relatively high (0–400 mD).
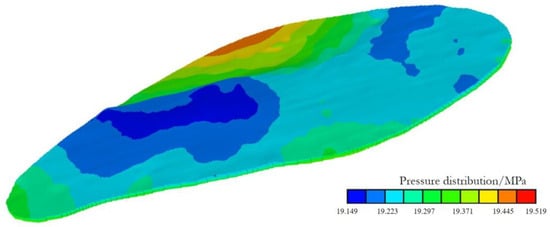
Figure 1.
Three-dimensional geological model of the target system.
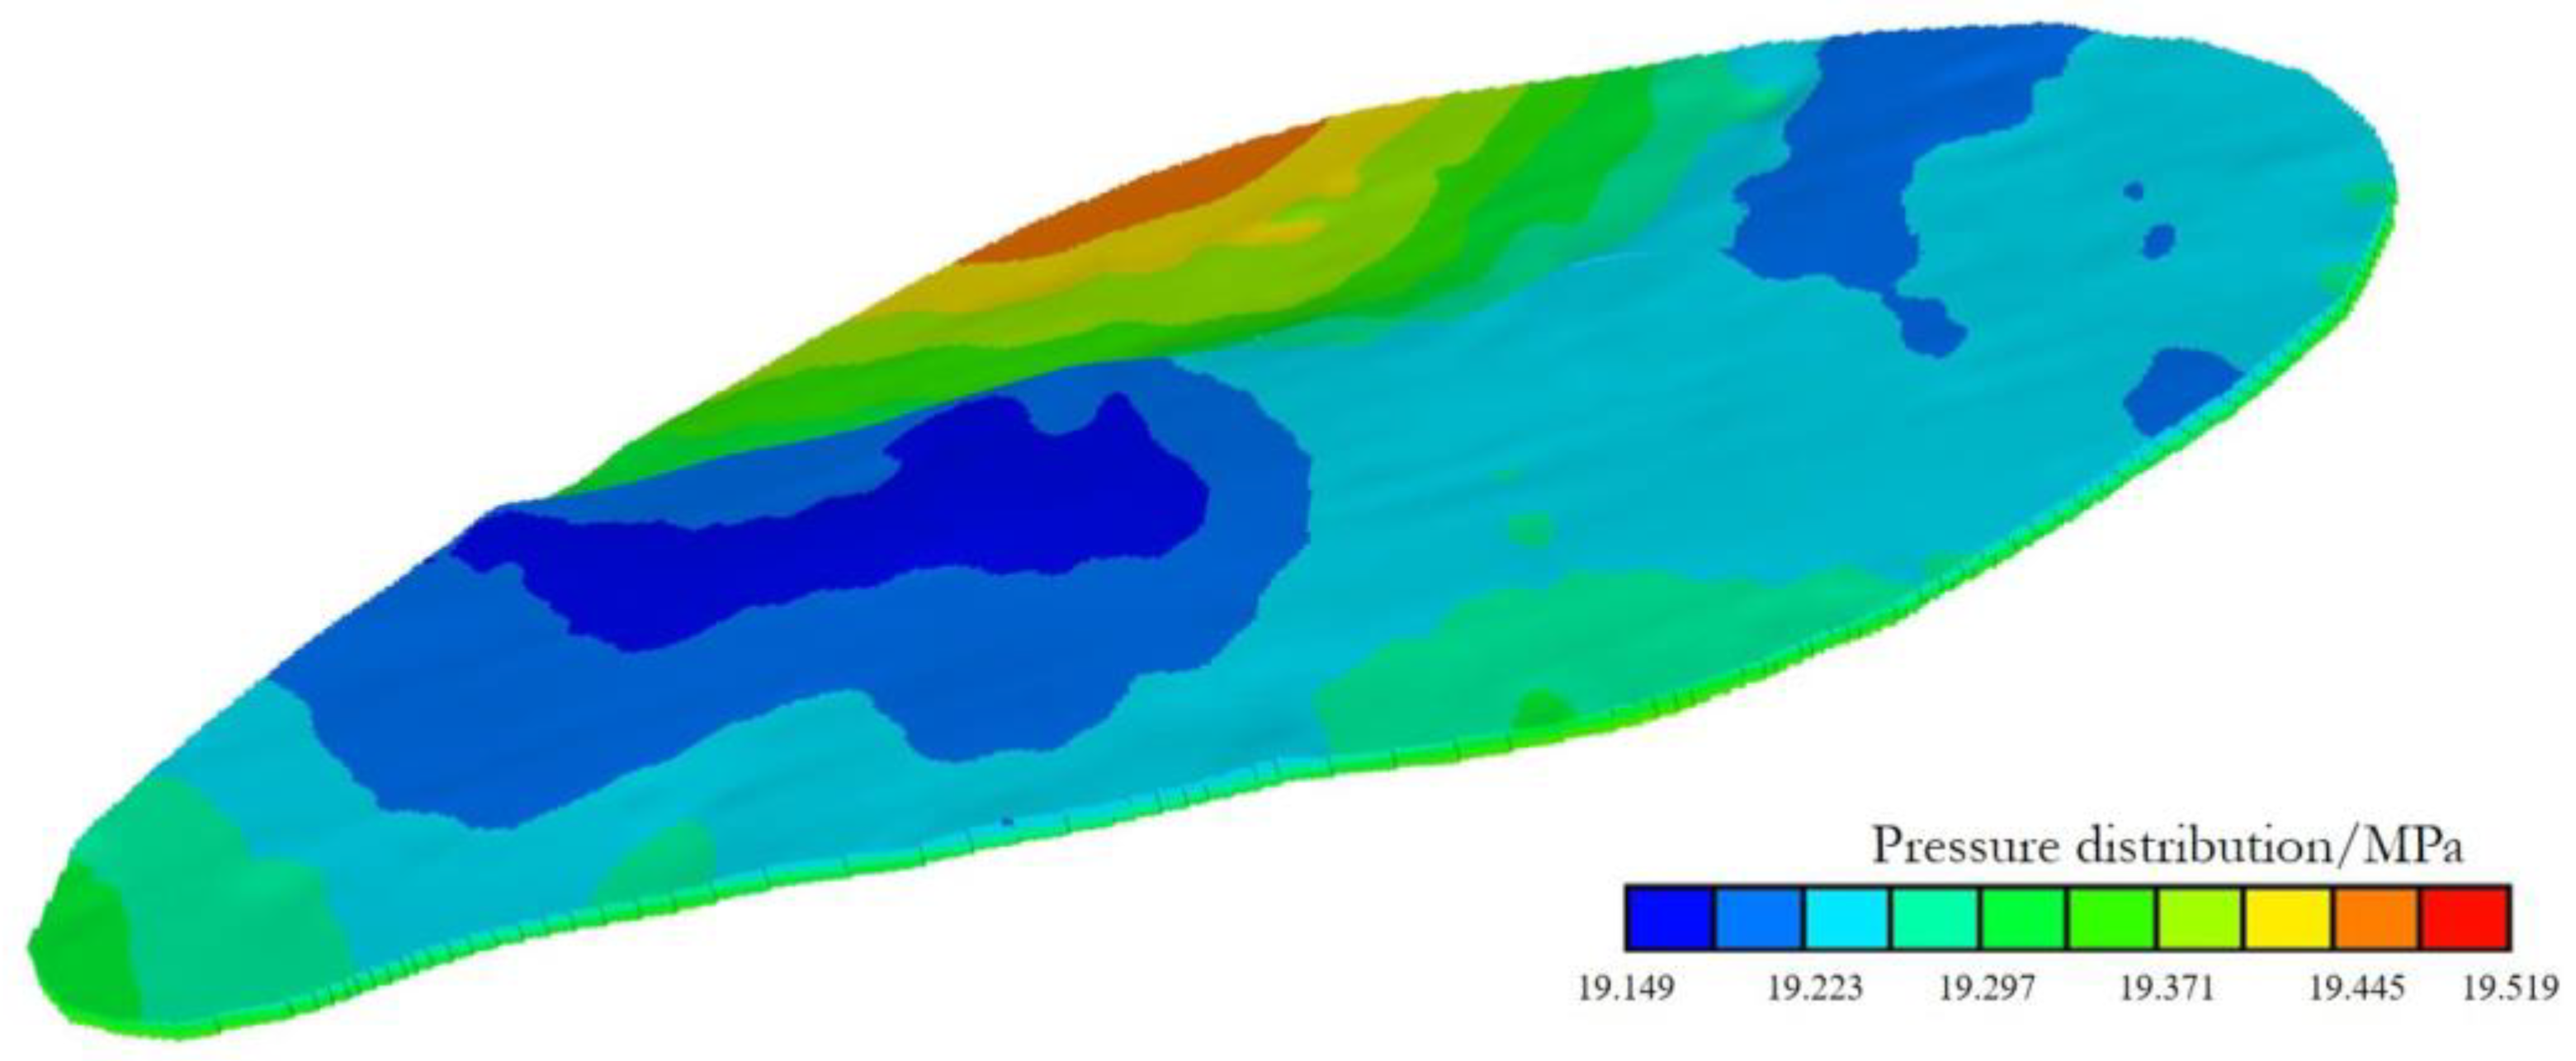
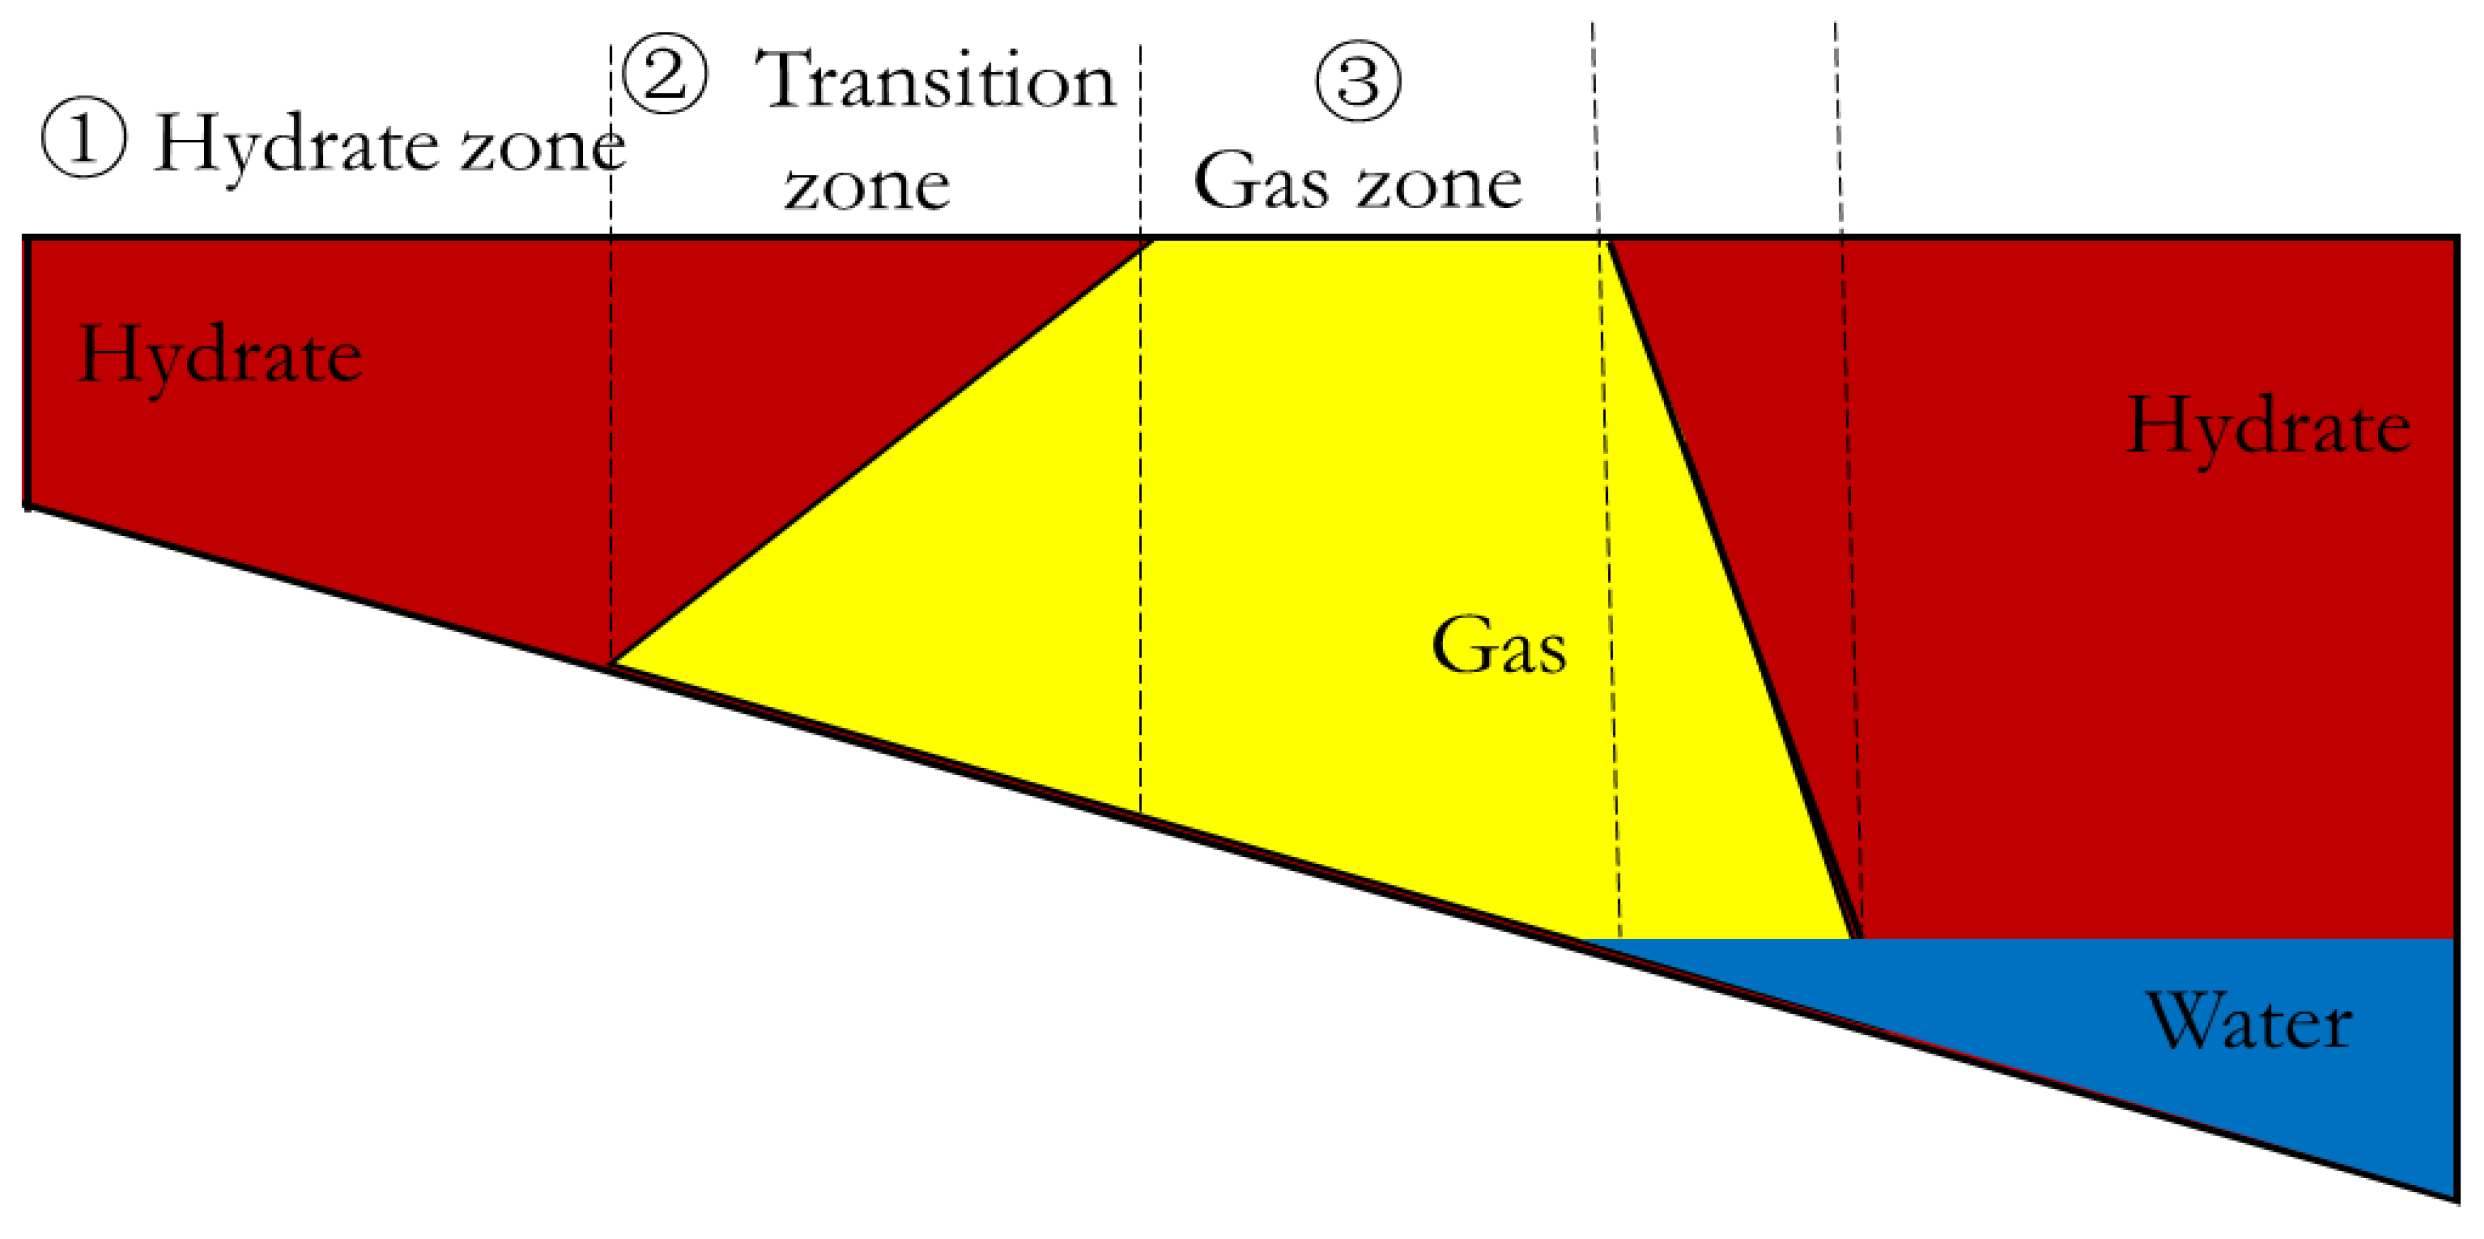
Figure 2 shows the hydrate-gas distribution characteristics of the target hydrate system. The hydrate system is controlled by a high geothermal gradient gas chimney. The hydrate and gas are distributed in the same layer, with the gas in the middle and the hydrate distributed around. The maximum saturation of free gas is up to 75%, and that of the hydrate is 87%. The greater the depth, the larger the extension area of free gas. As shown in Figure 3, there is a large lateral transition zone of hydrate gas in the system. The whole sediment is characterized by strong horizontal heterogeneity, which can be mainly divided into three parts: ① Pure hydrate zone. It is like a type 3 hydrate reservoir. ② Transition zone of hydrate and free gas. It is similar to a type 1 hydrate reservoir, where free gas underlies the hydrate. There is a free water zone under the transition zone in the western part of this system. ③ Free gas reservoir. There is a relatively high-temperature gas reservoir in the center of this system. The strong horizontal heterogeneity also increases the difficulty of well selection during extraction.
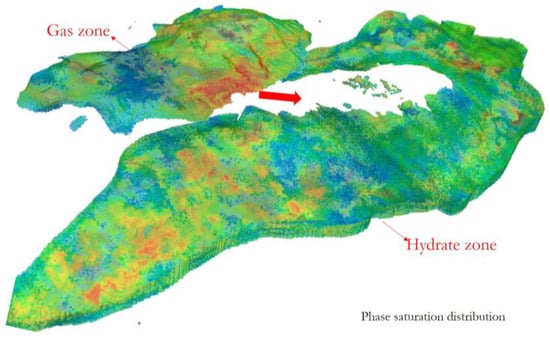
Figure 2.
The distribution of hydrate and gas in the target hydrate system.

Figure 3.
The hydrate system division (hydrate zone, transition zone, and gas zone).
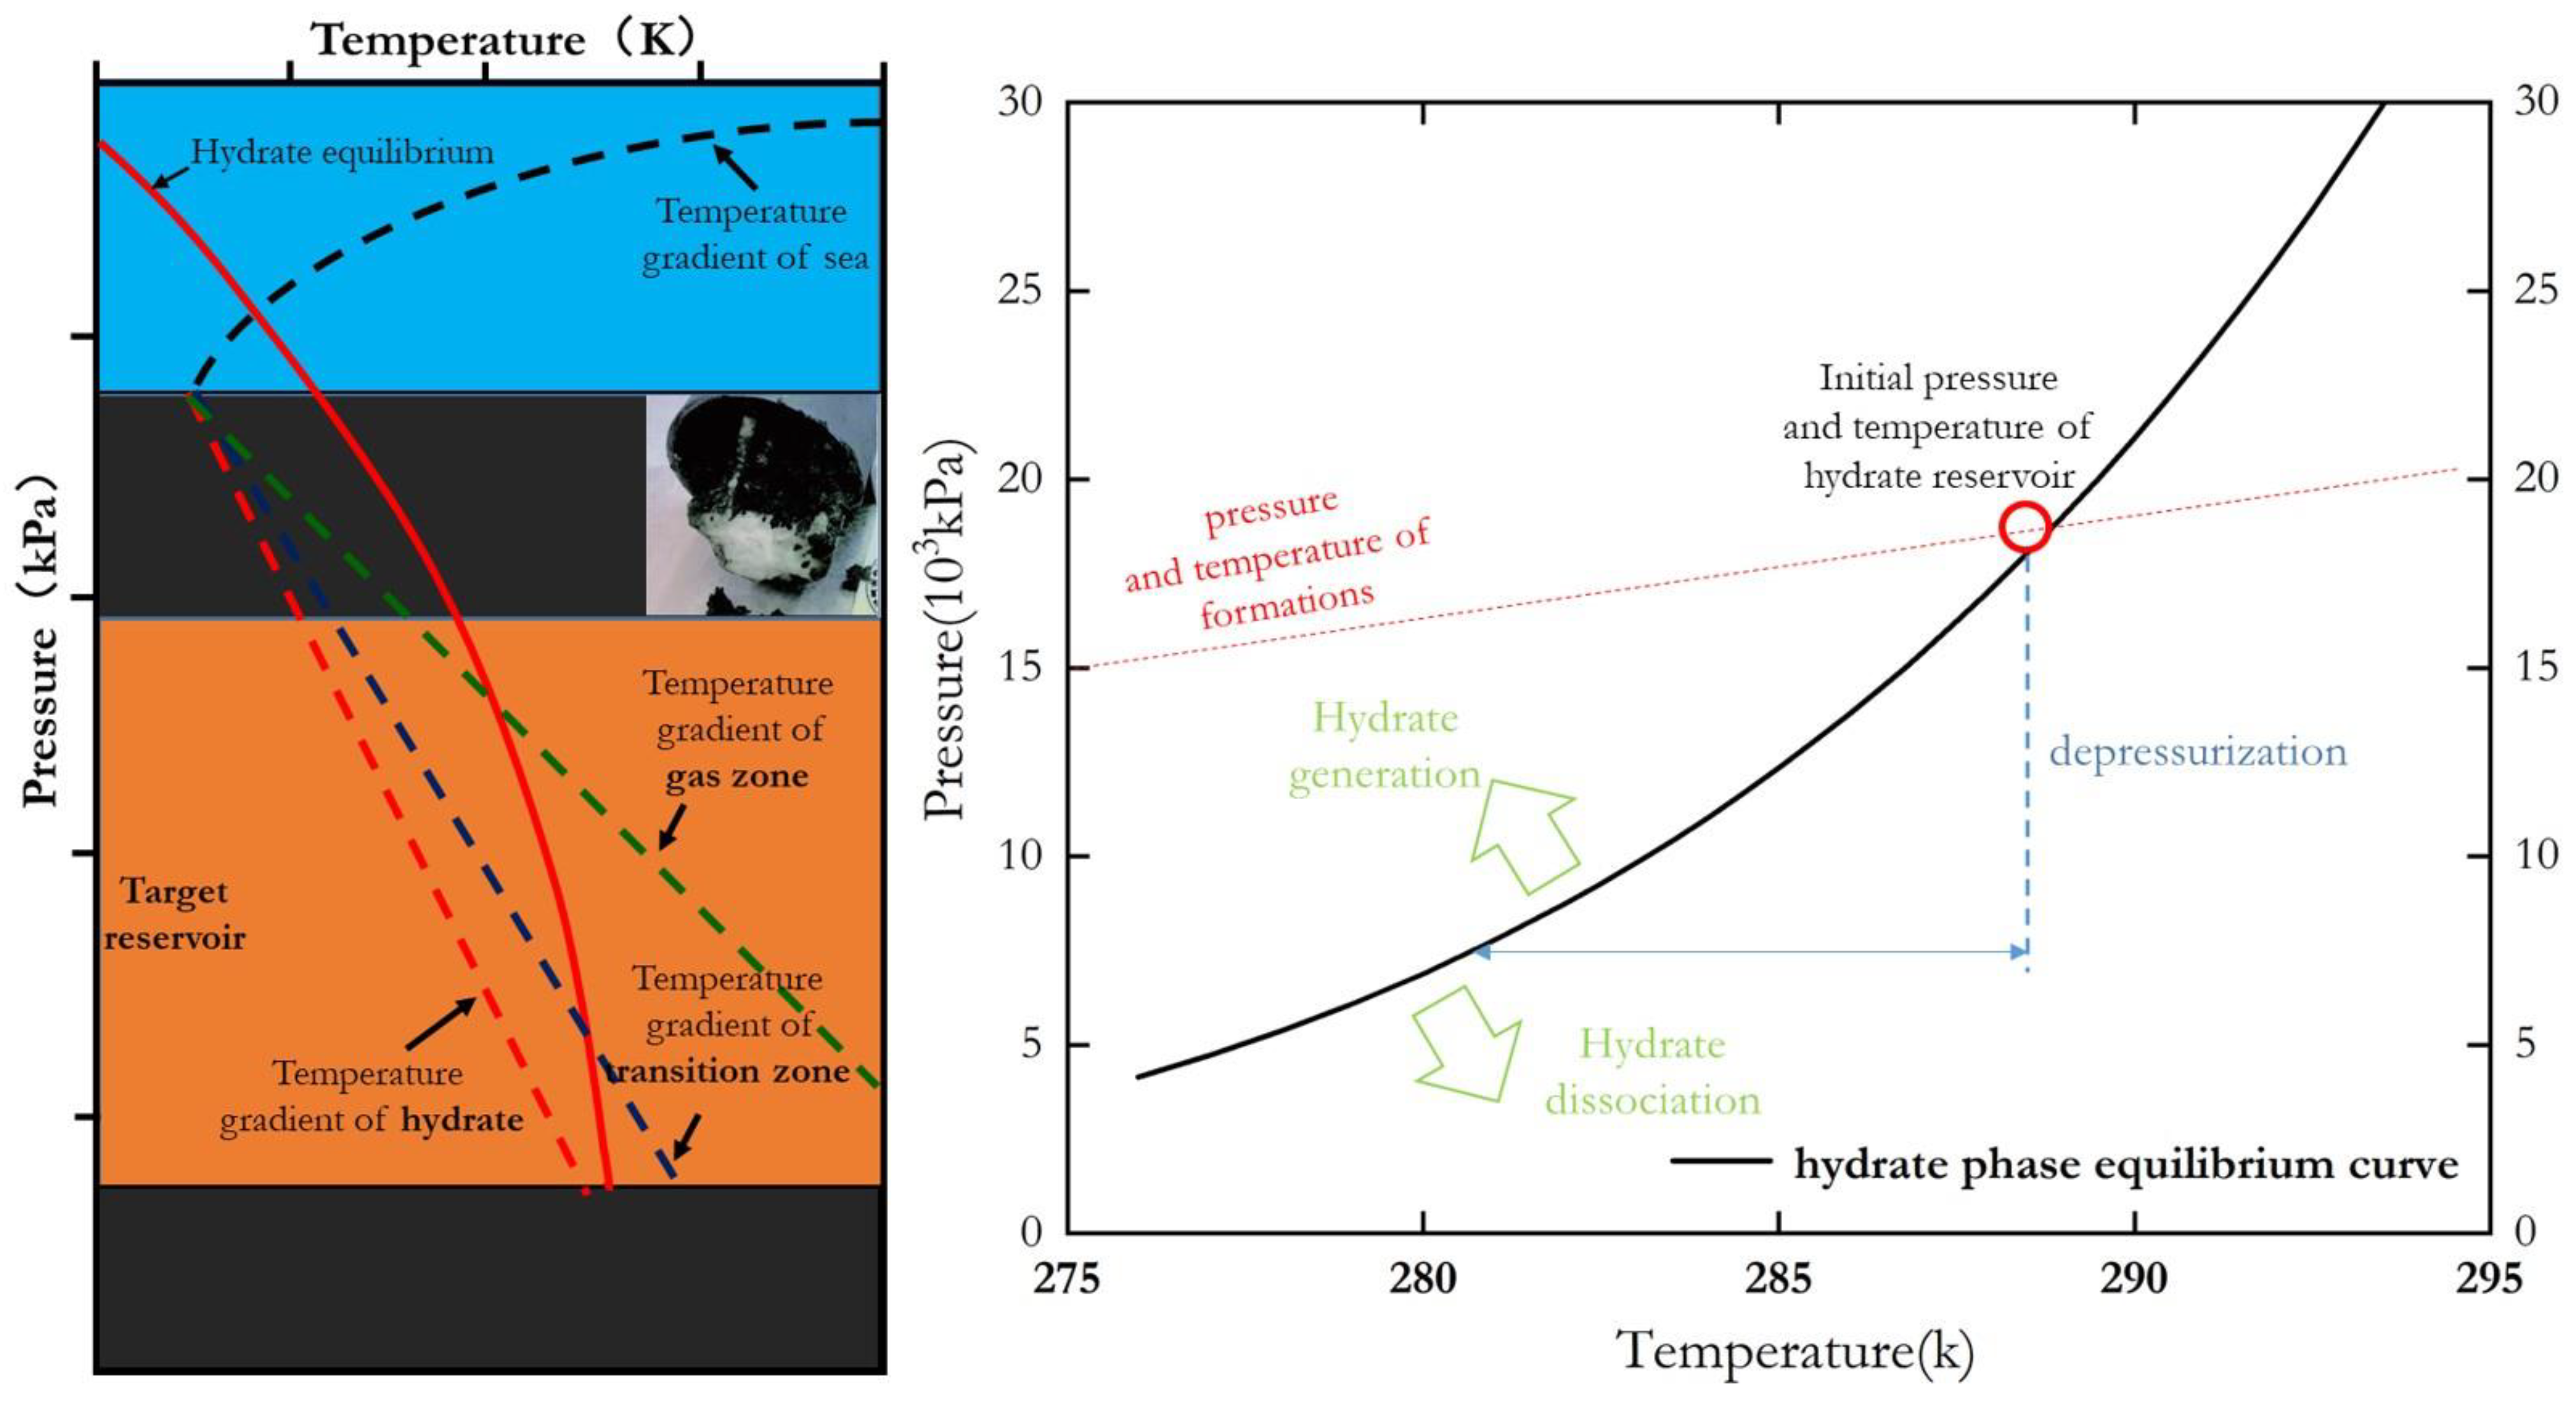
The horizontal heterogeneity is also reflected in the reservoir temperature. The geological background of the differential geothermal gradient of the hydrate system is extremely obvious. The typical drilling wells in this zone reveal that the geothermal gradient ranges from 65 °C/km to 105 °C/km. The geothermal gradient of the gas zone is high and decreases gradually from the transition zone to the pure hydrate zone. Briefly, the gas zone is hot, and the hydrate zone is cold. Figure 4 illustrates the temperature characteristics of the target hydrate system. Due to the lack of technology for deep water temperature logging, the temperature distribution of this system can only be deduced by phase equilibrium in sandy porous media.

Figure 4.
The characteristic of the geothermal gradient and hydrate equilibrium curve in the target system.
The CGS successfully utilized the horizontal well in the second production trial in the Shenhu area, which verified the safety and efficiency of drilling and completing horizontal wells in shallow formations. Theoretically, the large control area of the horizontal well can effectively deal with the strong horizontal heterogeneity of this complex hydrate system. However, it is noted that the thickness of this system is too thin, and the well trajectory control accuracy is of high requirement, so the feasibility of a horizontal well is not high enough. Considering that better reservoir physical properties and stronger mobility can make the single vertical well able to collect distant gas, it is proposed to use a single vertical well for capacity assessment.
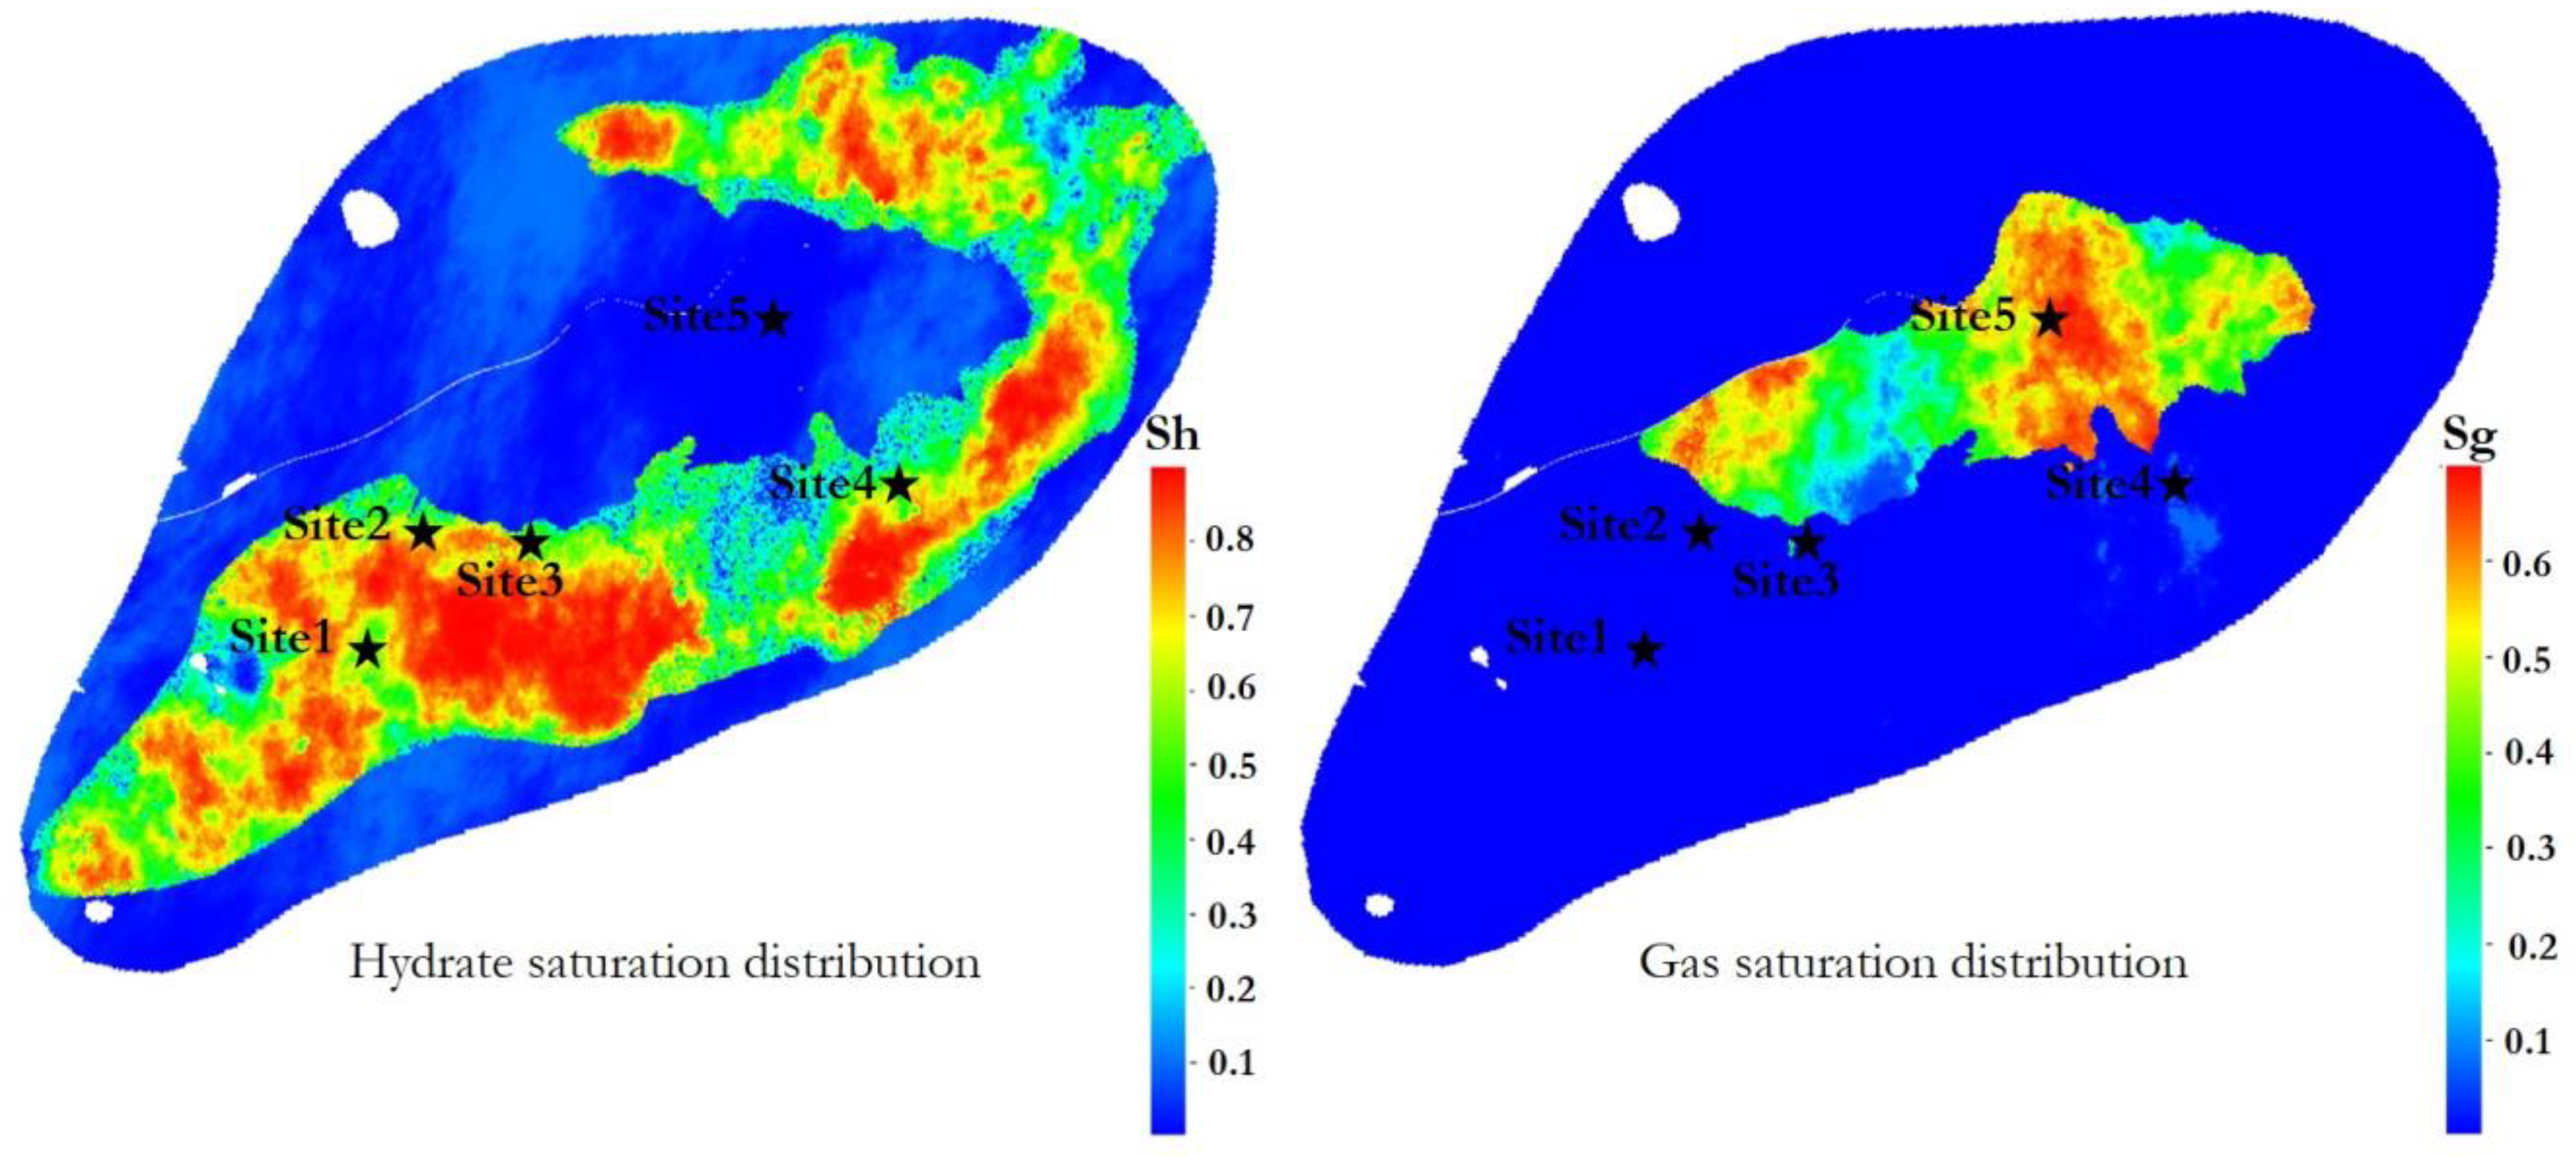
As shown in Figure 5 and Figure 6, the position of the well mainly targets the zone above three different areas, namely the hydrate zone, transition zone, and gas reservoir. The first position in the hydrate zone is Site 1, the center of the highly-saturated hydrate area. The second is Site 2, the boundary of the hydrate zone, which is near the transition zone. The Site 1 depth is at 1894–1900 m, and the Site 2 depth is at 1890–1899 m. For the transition zone, the free water zone is considered separately. Site 3 and Site 4 are established, respectively. The Site 3 depth is at 1893.4–1901.7 m, and it contains a 3.5 m thick hydrate layer and a 4.8 m thick gas layer. The Site 4 depth is 1898.5–1906.9 m, and it includes a 5 m thick hydrate layer, a 1.2 m thick gas layer, and a 2.2 m thick free water layer. Site 5, which is located in the middle of the gas reservoir, is at 1897.4–1904.9 m. Five representative single vertical well positions were initially selected for production capacity simulation.
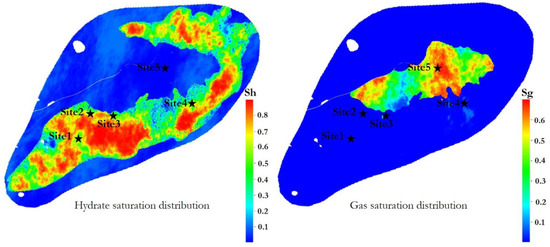
Figure 5.
Position of different wells for capacity simulation.
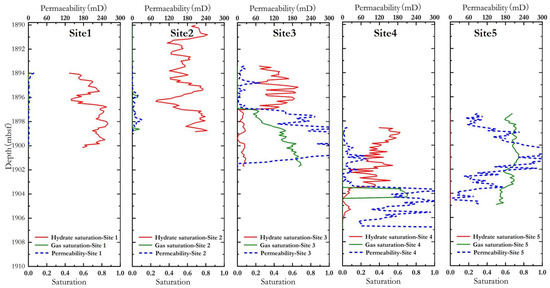
Figure 6.
Depth and sediment properties of different wells for capacity simulation.
For both Site 1 and Site 2, which are in the single hydrate-bearing sediments, a depressurization method with constant well-bottom pressure is adopted for rapid hydrate dissociation stimulation. For Sites 3, 4, and 5 involving gas formation, the stable production rate is used. The multi-parameter scheme for each location is shown in Table 1.

Table 1.
The multi-parameter scheme for simulation.
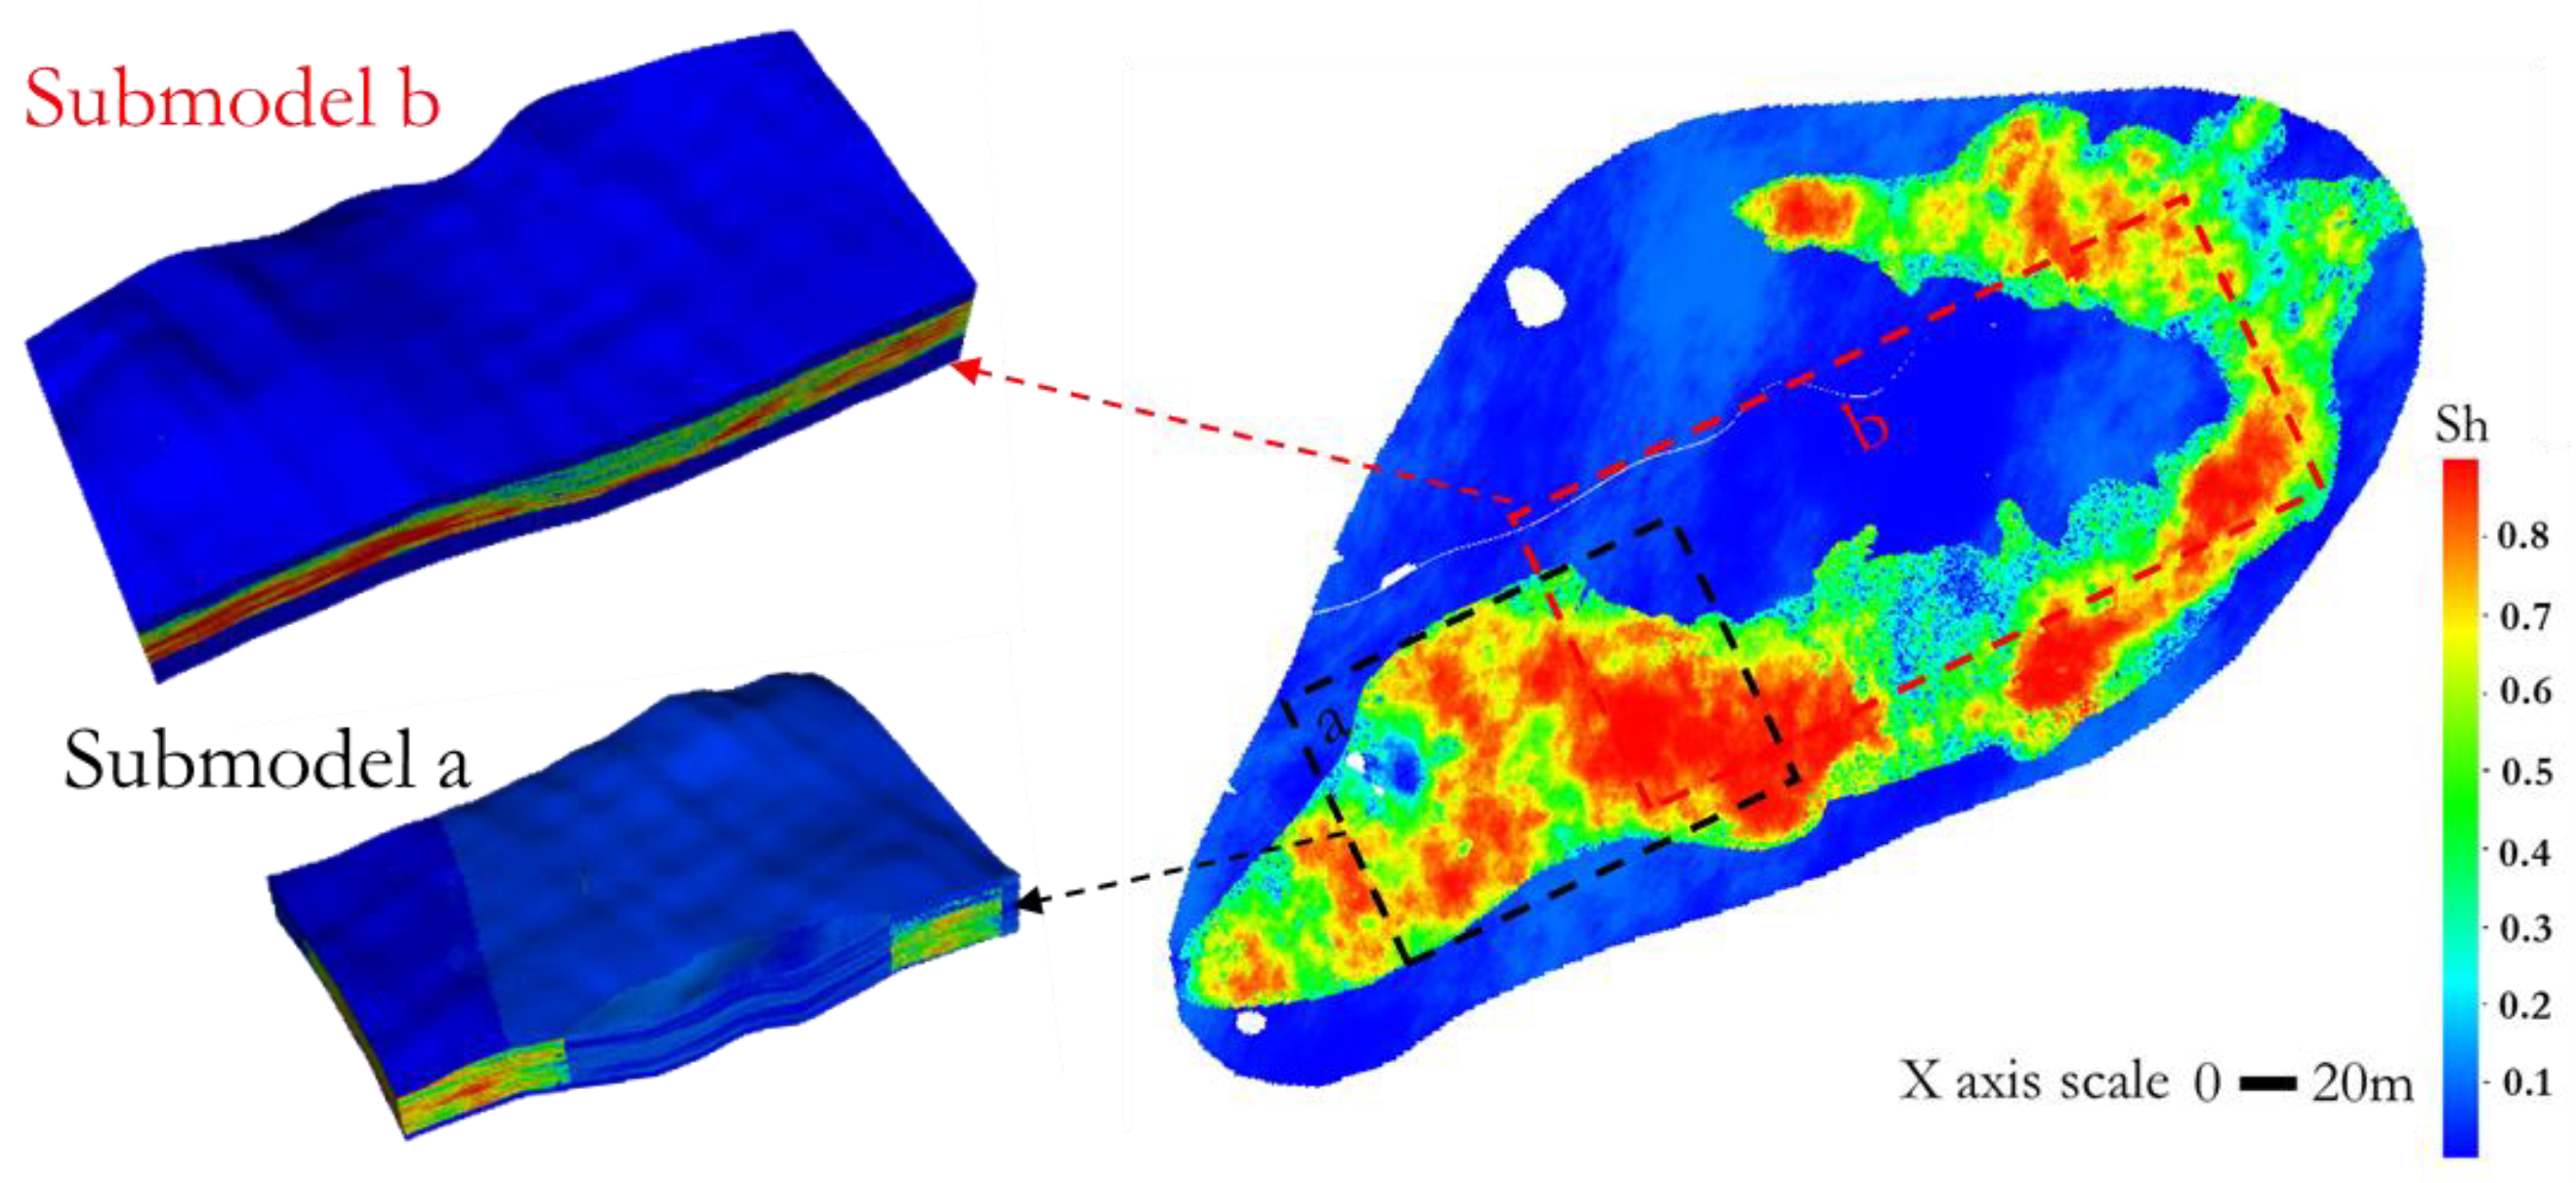
In order to speed up the simulation and reduce the arithmetic pressure, two sub-models were extracted for different sites. The first sub-model, a, is in the hydrate zone, with Site 1 as the center (Figure 7). The whole sub-model a grid is 156 × 101 × 116. The sub-model has a transverse and longitudinal span of 1.56 km and 1.0 km, respectively. The second sub-model, b, is larger and bounded by a fault in the north, including the central gas zone, the transition zone, and part of the hydrate zone. The whole sub-model b, with a grid number of 219 × 97 × 141, spans 2.19 km and 1 km. Sites 2–5 are included in the sub-model b.

Figure 7.
Schematic diagram of sub-model.
3. Mathematical Model
In this study, commercial reservoir simulation software for oil and gas production (CMG) is used to assess the capacity of the target hydrate system. The well-established reservoir numerical simulation model CMG STARS considers the kinetic model of hydrate formation and dissociation. It can simulate the unequal temperature release, fluid flow, and energy change of the gas hydrate reservoir under various complex formation conditions by solving the material and energy conservation equations [72]. It can facilitate embedding the above geological model and well setting. More importantly, it can effectively deal with the mathematical operation and calculation of multi-million grids. Other researchers have validated the results from the model using CMG STARS with other reservoir simulators, such as Tough + Hydrate, HydrateResSim, and MH21. The results obtained are in good agreement with other simulators.
3.1. Material Conservation Equation
In the process of hydrate extraction, solid hydrate decomposes into liquid and gaseous hydrocarbon. The material conservation equation can be divided into two parts: mobile phase (gas and liquid) and non-mobile phase (hydrate). Hydrate formation and dissociation are considered reaction terms. Equation (1) is the mass conservation equation for mobile phase i. Equation (2) is the mass conservation equation for non-mobile phase l.
where V is the total volume of all phases, m3; is the fluid porosity; ρj is the density of each phase, kg/m3; Sj is the saturation of each phase; is the fraction of different components in each phase; Tj is the transmissibility between grids; is the volume of source and sink, m3; , ski are the stoichiometric coefficient of product and reactant. rk is the volumetric reaction rate, mol/(m3·d); is the number of phases; is the number of adjacent grids; is the number of the reactions; is the porosity; Ckl is the content of each non-mobile phase in unit volume, mol/m3.
3.2. Energy Conservation Equation
Heat absorption by hydrate dissociation will lead to a decrease in reservoir temperature, which affects the rate of hydrate dissociation and may cause secondary hydrate or even ice generation. The change in temperature in the hydrate extraction can be expressed as Equation (3)
where Uj is the internal energy of each mobile phase, J. Uj is the internal energy of hydrate, J; Ur is the internal energy of the porous media; Hj is the enthalpy of each mobile phase, J/mol; K is the thermal conductivity, W/(m·K).
3.3. Kinetic Equation of Hydrate Formation and Dissociation
Hydrate formation and dissociation equations are established based on the Vysniauskas–Bishnoi model [73] and Kim–Bishnoi model [74], as shown in Equations (4) and (5).
where nf, nd is the hydrate formation and dissociation rate, mol/m3; , is the intrinsic kinetic rate constants of hydrate formation and dissociation, mol/(m2·kPa·d); E is the activation energy, J/mol; Ahs is the specific surface area of the hydrate, m3/m3, R is the gas constant, J/(mol·K); Pe is the hydrate phase equilibrium pressure, kPa; Pg is gas pressure, kPa; T is temperature, K; Sw is the water saturation.
3.4. Dynamic Equation of Permeability and Porosity
The change in permeability of porous media originates from hydrate formation and dissociation, where the model of porosity change is shown in Equation (6).
where is the volume content of hydrate per unit volume, m3/m3.
Permeability is calculated based on the classical Kozeny–Carman [75], as follows:
where k0 is the initial permeability, 10−3 μm3; N is the power law coefficient, with a value of 3.
The relative permeability of gas and liquid is calculated as follows
where Krw is the relative permeability of liquid; Krg is the relative permeability of gas; n is the power coefficient, n = 3.752; Sw is the liquid saturation; Sirw is the irreducible water saturation; Sg is the gas saturation; Sirg is the irreducible water saturation.
The specific parameters of the hydrate kinetic model and reservoir properties are shown in Table 2.
Table 2.
Specific parameters of hydrate kinetic model and reservoir properties.
4. Evaluation Criteria
For offshore gas production, gas production rate Qg and cumulative gas production volume Vg must be the most important criterion. It is generally believed that considering the complexity and high cost of deepwater operations, the economic production rate of offshore gas fields exceeds 20 × 104 m3/d. The same is true for shallow hydrate systems. The high gas production rate is a must for its commercial production. In addition, a low water production Qw is another criterion to be examined. The larger the production pressure differential, the higher the hydrate dissociation rate. For the depressurization, the liquid column height in the well needs to be continuously controlled by electric submersible pumps. Excessive water production will increase the difficulty in gas-water separation and drop in bottom-hole pressure. Of course, the contribution from hydrate dissociation to gas production rate and cumulative production volume becomes another special evaluation criterion. This paper examines the hydrate dissociation at different sites using the ratio of hydrate contribution to gas production rate at the wellhead and the ratio of hydrate contribution to total production volume at the wellhead as evaluation criteria.
5. Simulation Results and Discussion
5.1. Site 1 Simulation Result
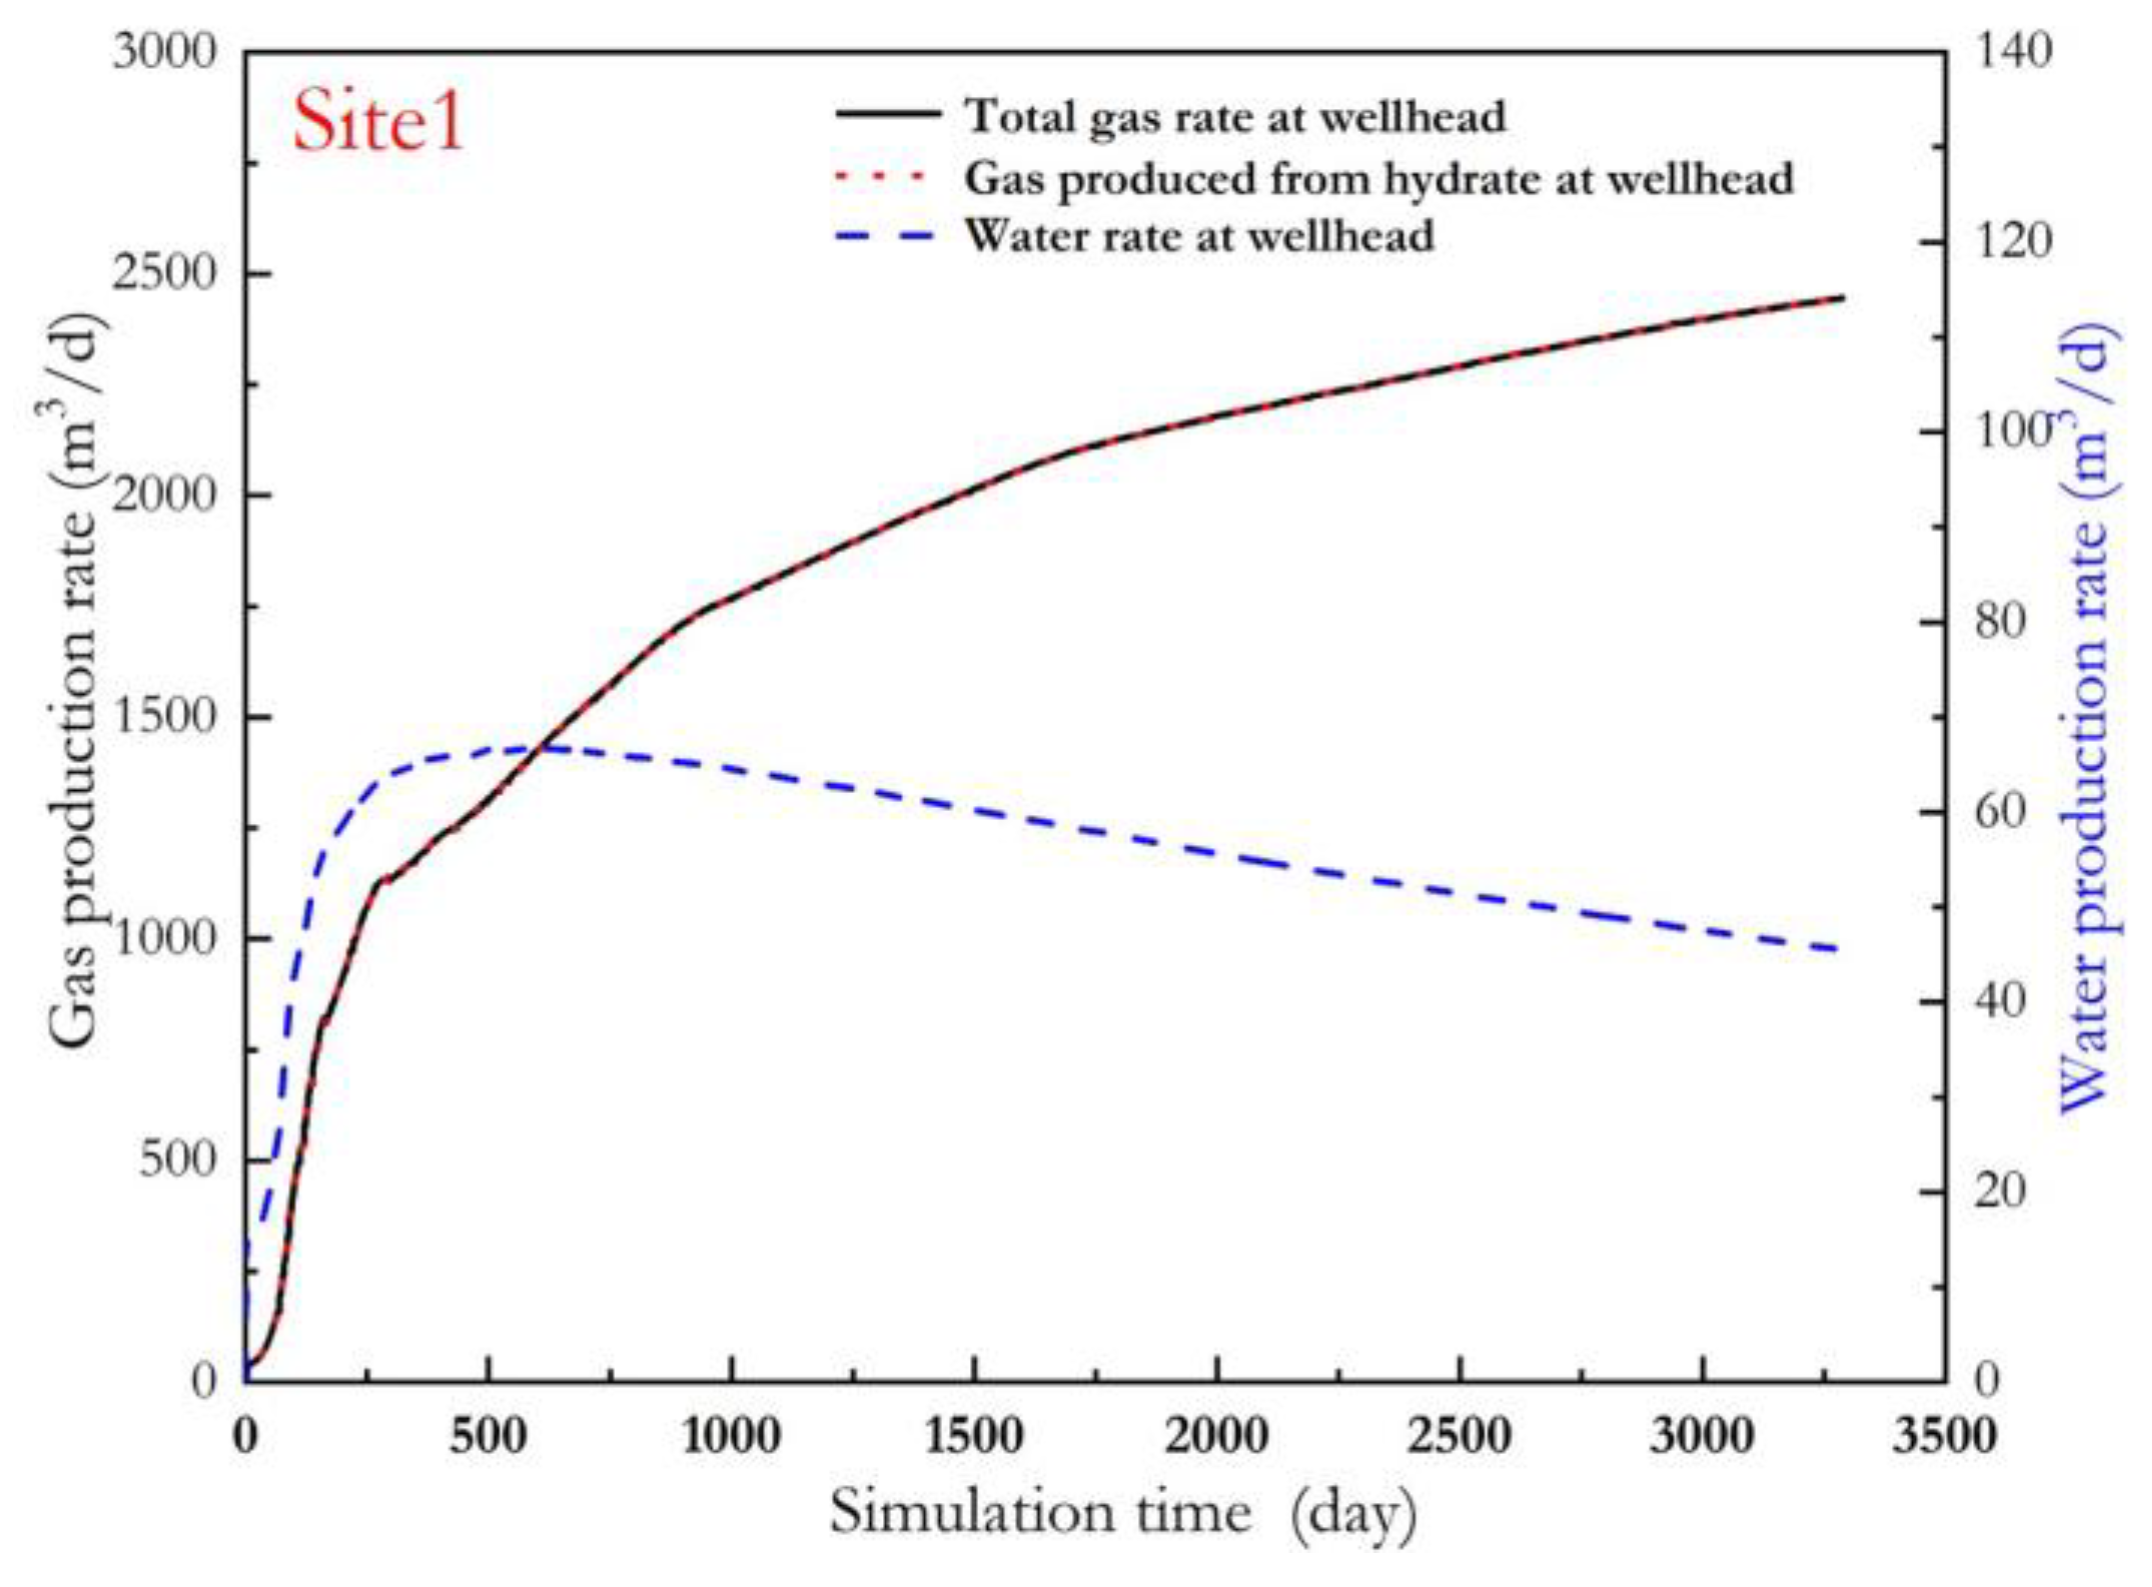
Site 1 is a typical Type 3 hydrate deposit. In the production capacity prediction for Type 3 hydrate deposits, the basic cognition of both semi-analytical and numerical solutions is that the gas production rate gradually grows as the extraction time increases and pressure-front keeps advancing. The simulation result in this paper is also similar. As shown in Figure 8, the gas production rate at the wellhead increases continuously. However, the gas production rate is always not satisfactory, and it cannot break through 2500 m3/d in the 9 years of simulation. The gas is all contributed by hydrate dissociation. The water production rate increases rapidly to a peak of 66 m3/d at the beginning, while the gas production just climbs to 1250 m3/d. The instantaneous gas-water ratio at the wellhead reaches a tough value of 19, which is an extremely undesirable value for gas production. The water rate then gradually declines because the initial pressure drop relies entirely on the discharge of free water in the reservoir. With the pressure front advancing, the pressure gradient of the near-well reservoir declines. In addition, the dissociation of hydrate also increases the space occupied by the gas and reduces the relative permeability of the water phase. Both of them cause the water rate to decline gradually. Overall, the gas production at Site 1 is insufficient, with a 9-year cumulative gas production volume of only 725.5 × 10⁴ m3, making it difficult to meet commercial exploitation requirements.
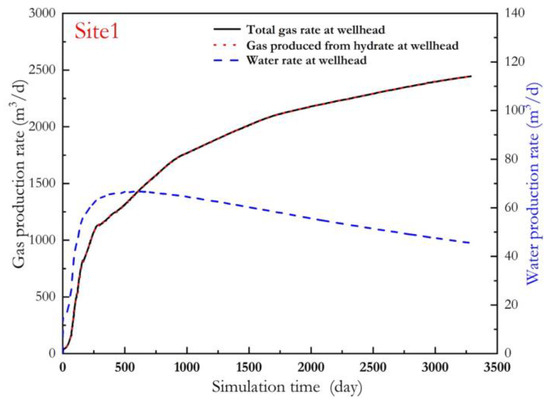
Figure 8.
Variation of total gas water at the wellhead, gas produced from hydrate at the wellhead, and water production with time at Site 1.
Poor gas production determines that Site 1 has no potential for commercial exploitation. There are two major reasons. The first is the special formation property. Even if Site 1 is fully penetrated, the effective thickness is less than 8 m. Compared to the 60 m-thick trail desert in the Nankai Trough, there is an order of magnitude difference. The disadvantage of the single vertical well is exposed, including the small control area and the strong dependence on lateral gas-liquid flow and rapid pressure transfer. The overly high hydrate saturation is also worrying. Although the sandy formations have high absolute porosity and permeability, the hydrate fills the pore space, and the initial effective permeability of porous media is too low. The pressure drop is slow, which directly inhibits the rate of hydrate dissociation driven by pressure differential. Figure 9 shows the evolution of hydrate and gas saturation distribution at Site 1. The hydrate saturation of the upper reservoir is smaller, and the hydrate dissociation front has advanced to 30 m away from the producer well at the end of the simulation. The hydrate saturation of the lower reservoir is greater than 0.7, and the hydrate dissociation front has just advanced to 15 m. It is different for rapid hydrate dissociation without enhancement measures such as fracture fracturing and heat supply, which is an important problem in hydrate commercial development. The second reason is that the location of Site 1 is far away from the free gas. There is a high-saturated hydrate layer with low effective permeability and even lower relative permeability of gas in the middle interval. The free gas cannot be transferred even with a large pressure differential. As seen in Figure 9, the free gas in the southeast direction cannot invade the hydrate zone and naturally cannot support the producer well, resulting in the insufficient capacity of Site 1.
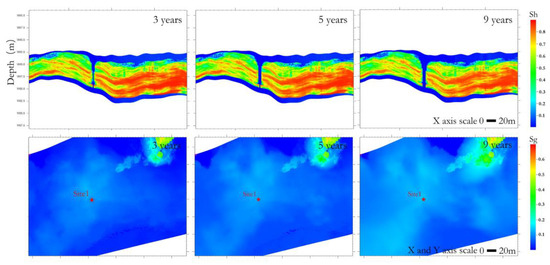
Figure 9.
Evolution of hydrate and gas saturation distribution at Site 1.
5.2. Site 2 Simulation Result
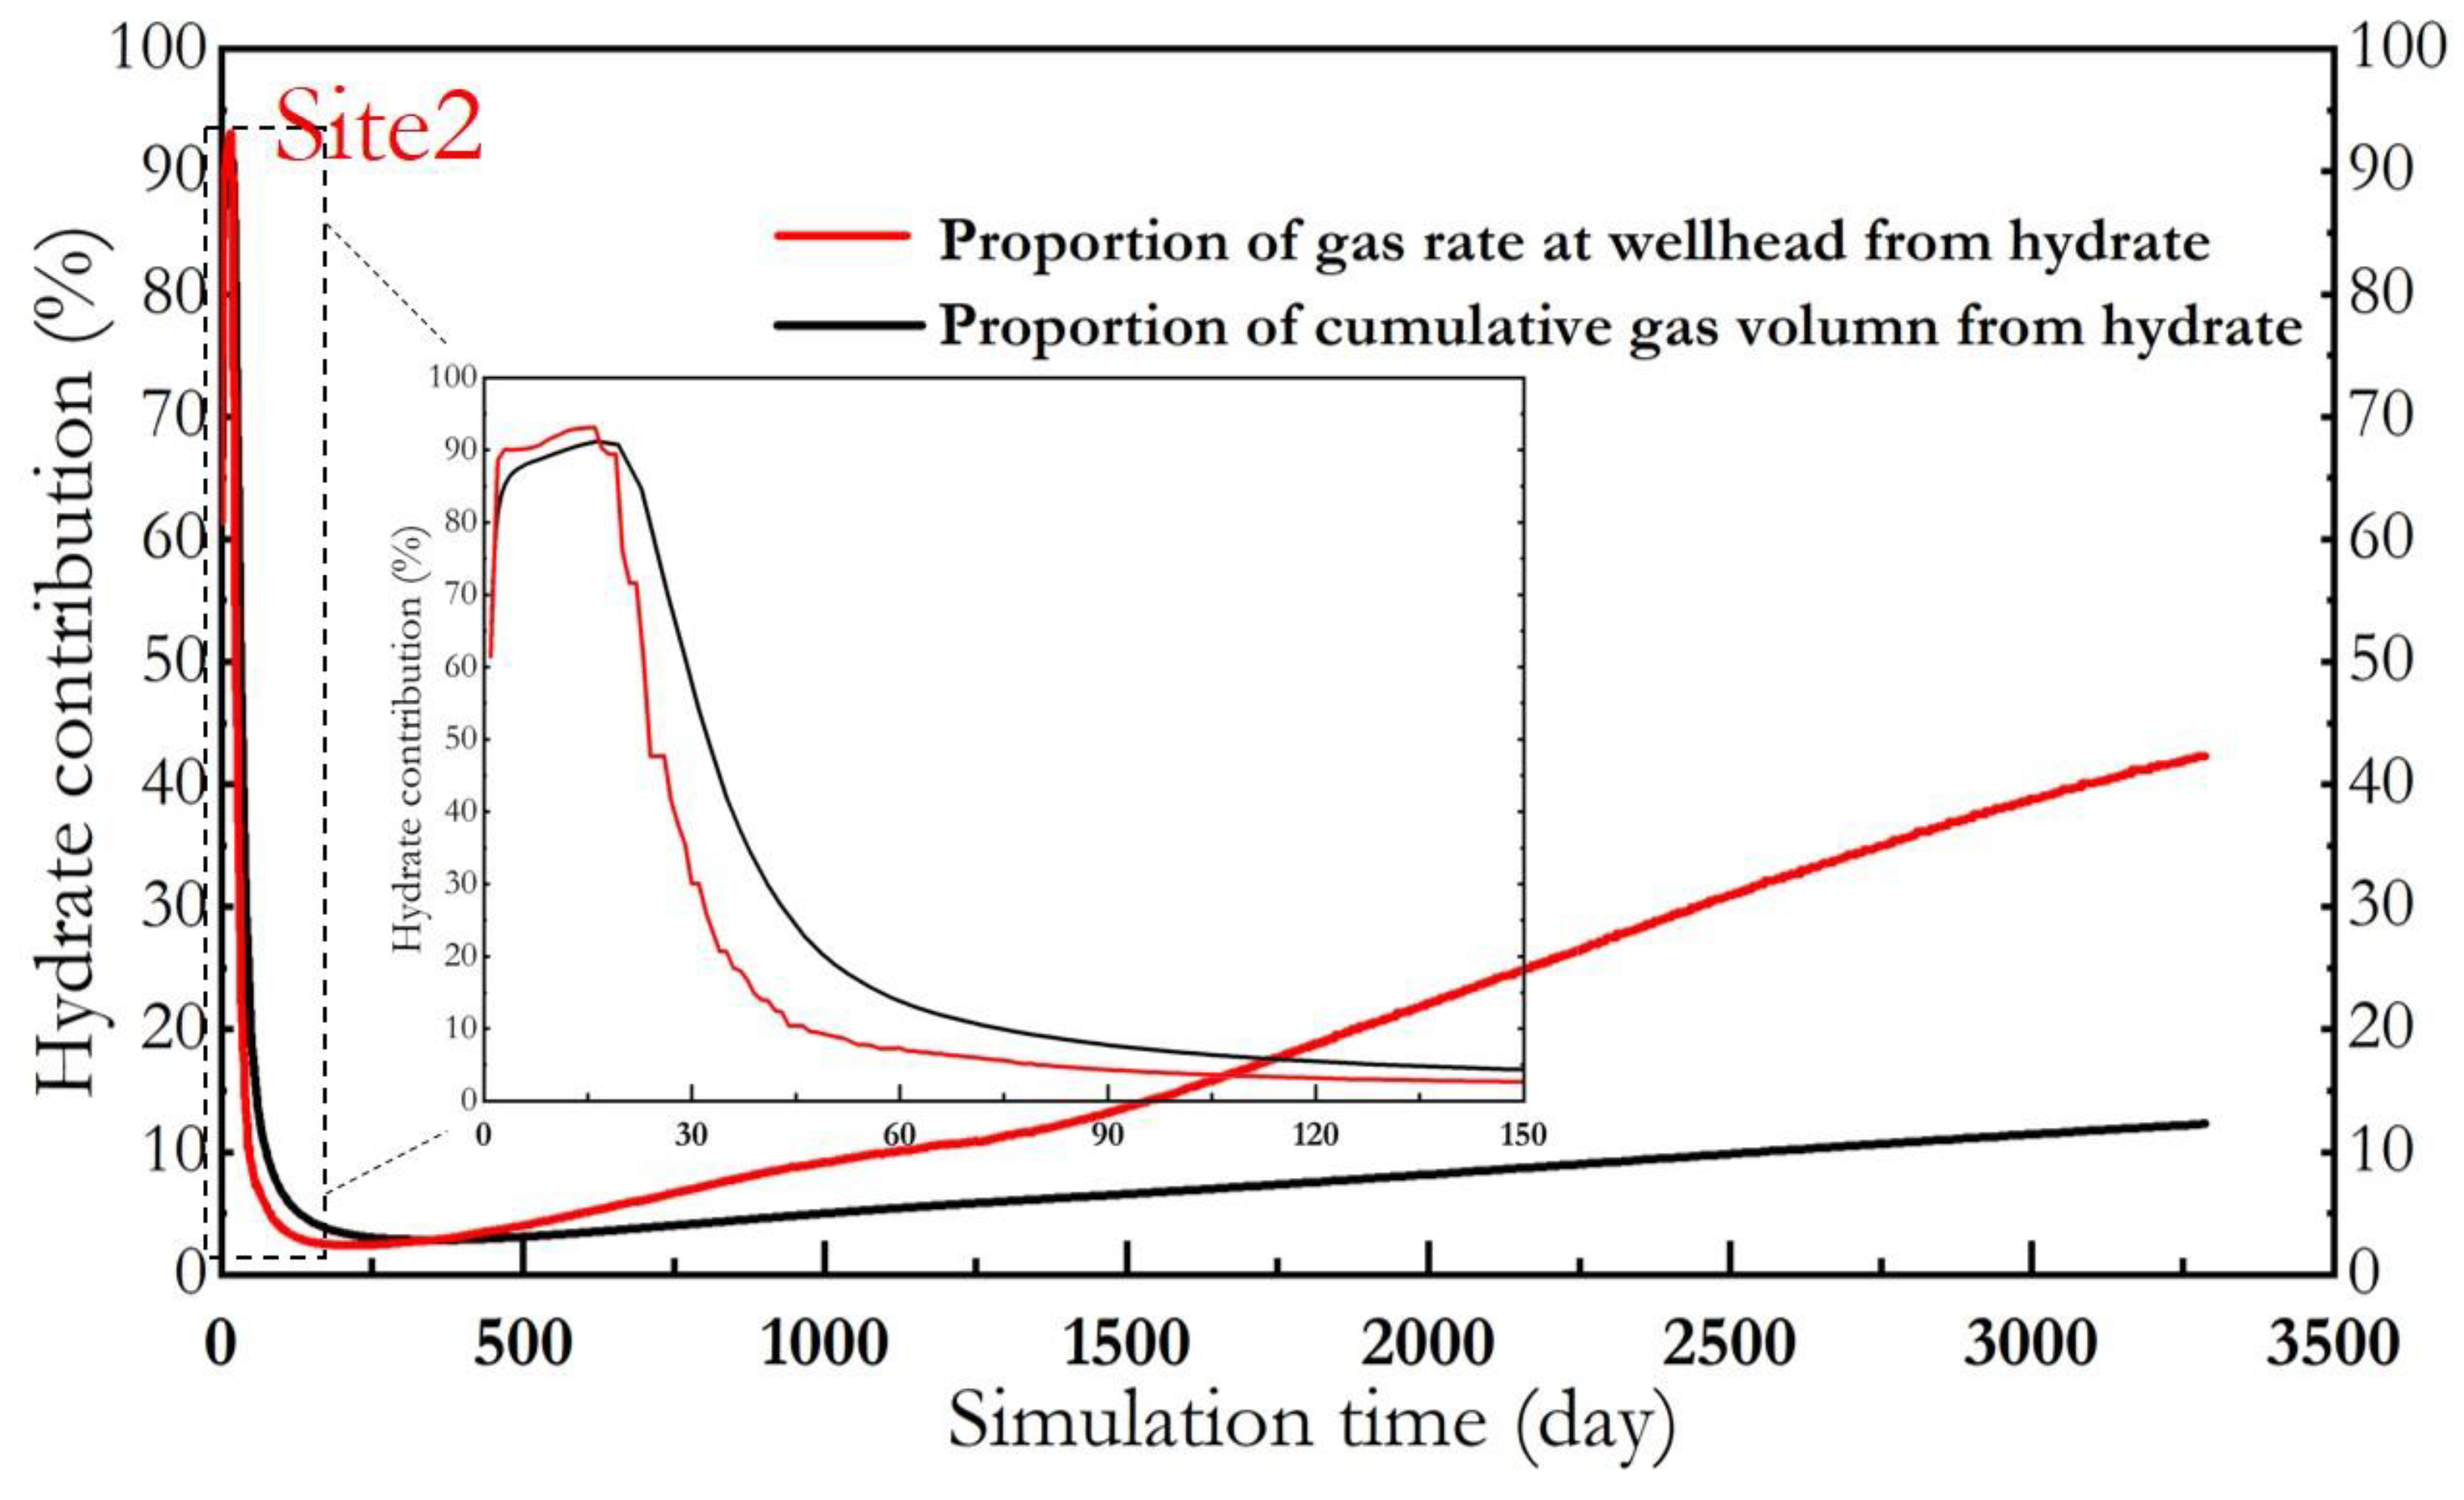
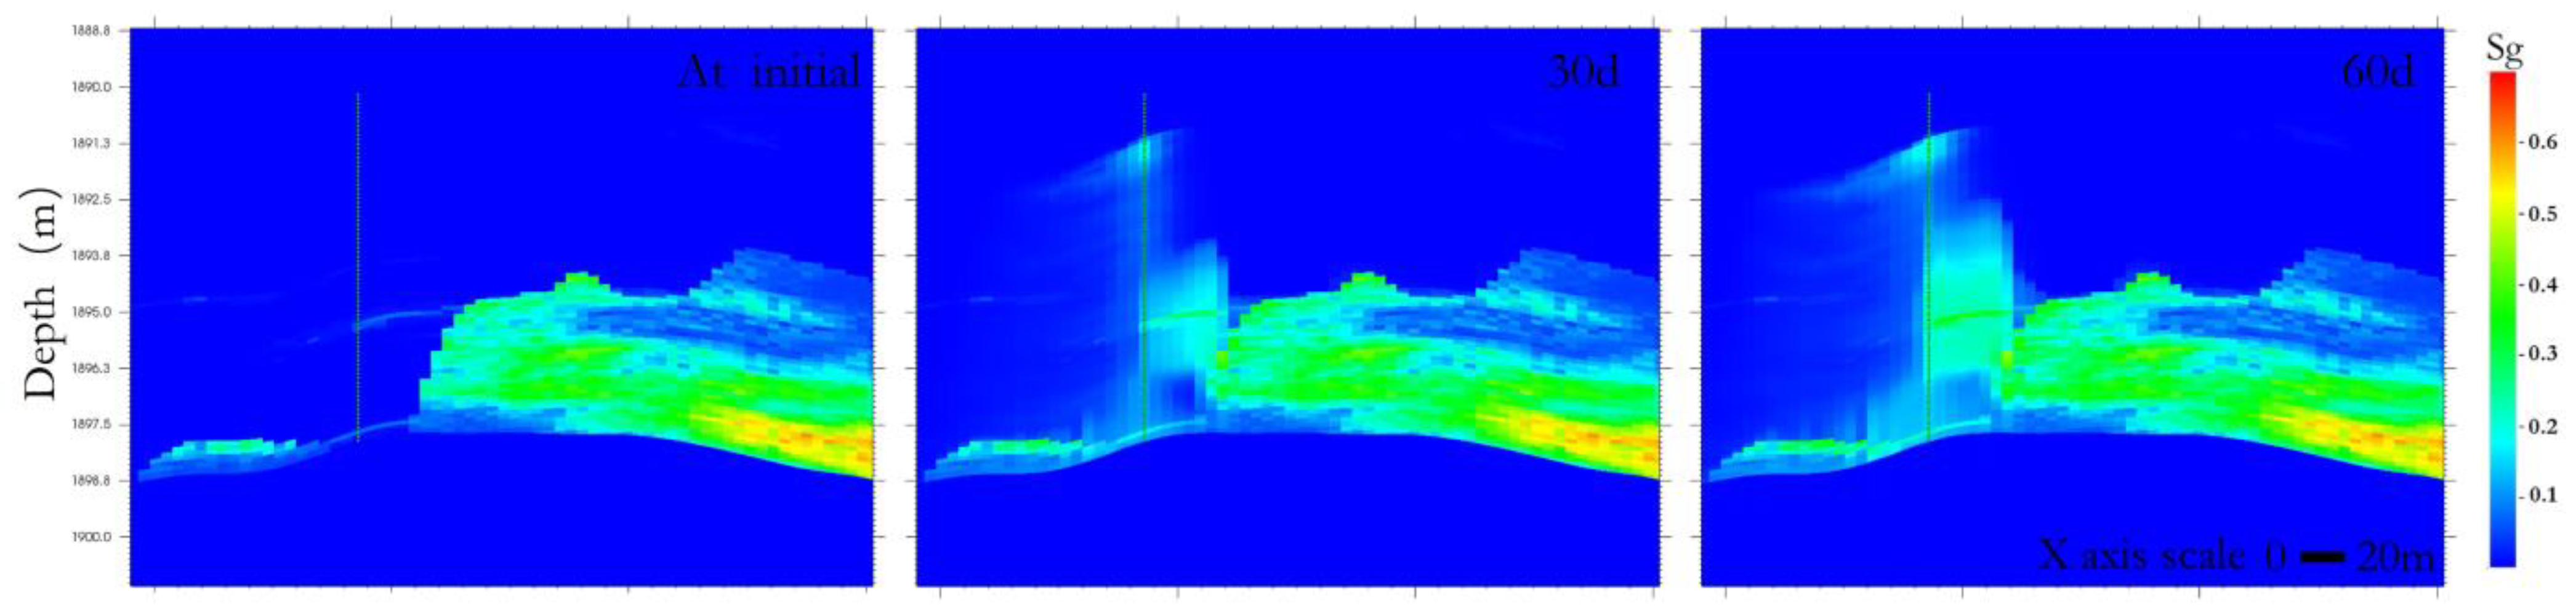
Site 2 is also in the hydrate zone. However, the hydrate saturation around Site 2 is between 0.2 and 0.6, lower than that of Site 1. The initial effective permeability is higher, which is conducive to pore water discharge and pressure drop diffusion. The biggest difference is that Site 2 is close to the transition zone. Setting up this site aims to accelerate the hydrate dissociation rate through a large production pressure differential and communicate with free gas in the transition zone as soon as possible. It aims to drive the effective dissociation of hydrate in the incoming gas direction through the favorable element that the gas temperature is higher than that of the hydrate zone. The total gas rate, gas rate from hydrate, and water production rate at Site 2 are shown in Figure 10. As seen from it, the total gas production rate climbed rapidly in the first 500 days and reached 32.5 × 10⁴ m3/d. It is impossible to support such a large production rate just with hydrate. The producer well at Site 2 effectively connects the free gas in the transition zone. The gas rate produced by hydrate at the wellhead is also growing in the early stage and is close to 1.3 × 10⁴ m3/d by 500 days. Figure 11 shows the instantaneous proportion of gas rate at the wellhead from hydrate and the cumulative proportion of gas at the wellhead from hydrate. When the well opens, the instantaneous proportion of gas rate at the wellhead from hydrate cannot reach 100% because part of the well section is accompanied by the mixed hydrate–gas–water layer. With the great pressure differential and hydrate dissociation, it begins to increase and reaches a peak of 93%. After that, it starts to decrease rapidly, which means the free gas in the transition zone has reached the producer well. Correspondingly, the water rate also grows rapidly during this period, approaching 100 m3/d, which is due to gas invasion into the hydrate zone and elastic drive to water relying on the high volume coefficient of gas. However, the high water rate cannot last long, which also implies that the free gas has established a continuous and stable flow channel to the well. Figure 12 shows the change in gas saturation distribution around the well at the initial point. The gas from the transition zone invades rapidly through the mixed hydrate–gas–water layer, displacing pore water along the way. The gas distribution on the 60th day validates the above point, by which time the gas from the transition zone has successfully established an efficient flow channel to the well. The instantaneous proportion of gas rate at the wellhead from hydrate has dropped rapidly to 7%. Since then, the main driver of reservoir pressure drop has changed from water drainage to gas discharge. The shrinkage in this ratio is not a disadvantage. The expected gas invasion has significantly increased the gas production rate, making Site 2 commercially exploitable. At the end of the simulation, the wellhead cumulative gas production volume is 4.51 × 10⁸ m3. The cumulative gas volume from hydrate contribution is 5552 × 104 m3, accounting for 12.3%. Under the same production pressure differential, the cumulative hydrate contribution of gas in 9 years at Site 2 is much better than that at Site 1, almost 7.7 times.
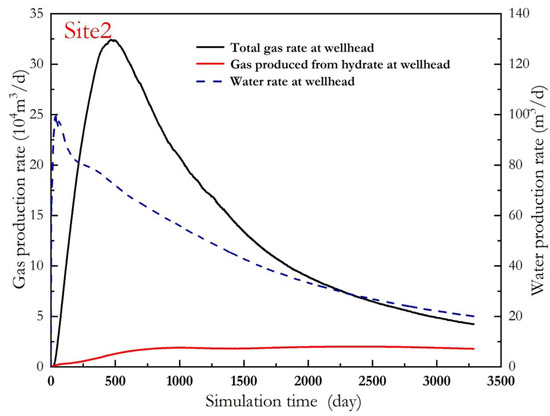
Figure 10.
Variation of total gas water at the wellhead, gas produced from hydrate at the wellhead, and water production with time at Site 2.
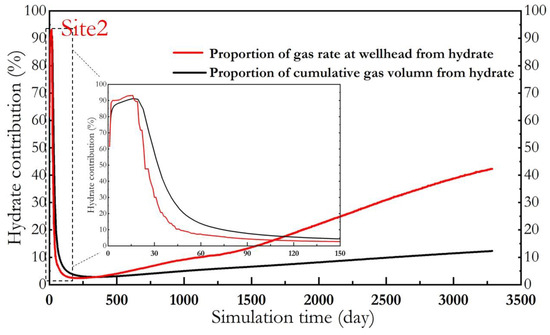
Figure 11.
Instantaneous proportion of gas rate at the wellhead from hydrate and the cumulative proportion of gas at the wellhead from hydrate at Site 2.
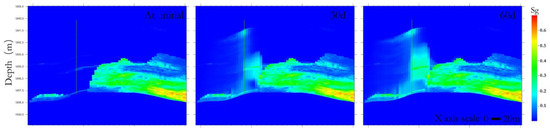
Figure 12.
Change in gas saturation distribution around the producer well.
As can be seen from Figure 10, the gas production rate at the wellhead begins to reduce gradually to 4.23 × 10⁴ m3 after 500 days, where the wellhead gas rate from hydrate grows to 2 × 10⁴ m3. As shown in Figure 11, the instantaneous proportion of gas rate at the wellhead from hydrate reaches 42.3%, and finally, the cumulative proportion of gas at the wellhead from hydrate reaches 12.3%. The main reason for the rise in hydrate contribution is the depletion of the free gas supply. The increase from the hydrate itself is not very significant. After 1000 d, the wellhead gas rate from hydrate stagnates and stays around 2 × 10⁴ m3. To this problem, there are two reasons suggested. One is that the hydrate dissociation driving force is weak, i.e., the pressure drop is not enough or the temperature is too low, and thus, the gas rate produced from the hydrate cannot rise fast enough to support the limited capacity. The other one is that the gas produced by the hydrate cannot be available to the well. These conjectures can be evaluated by the evolution phase saturation distribution.
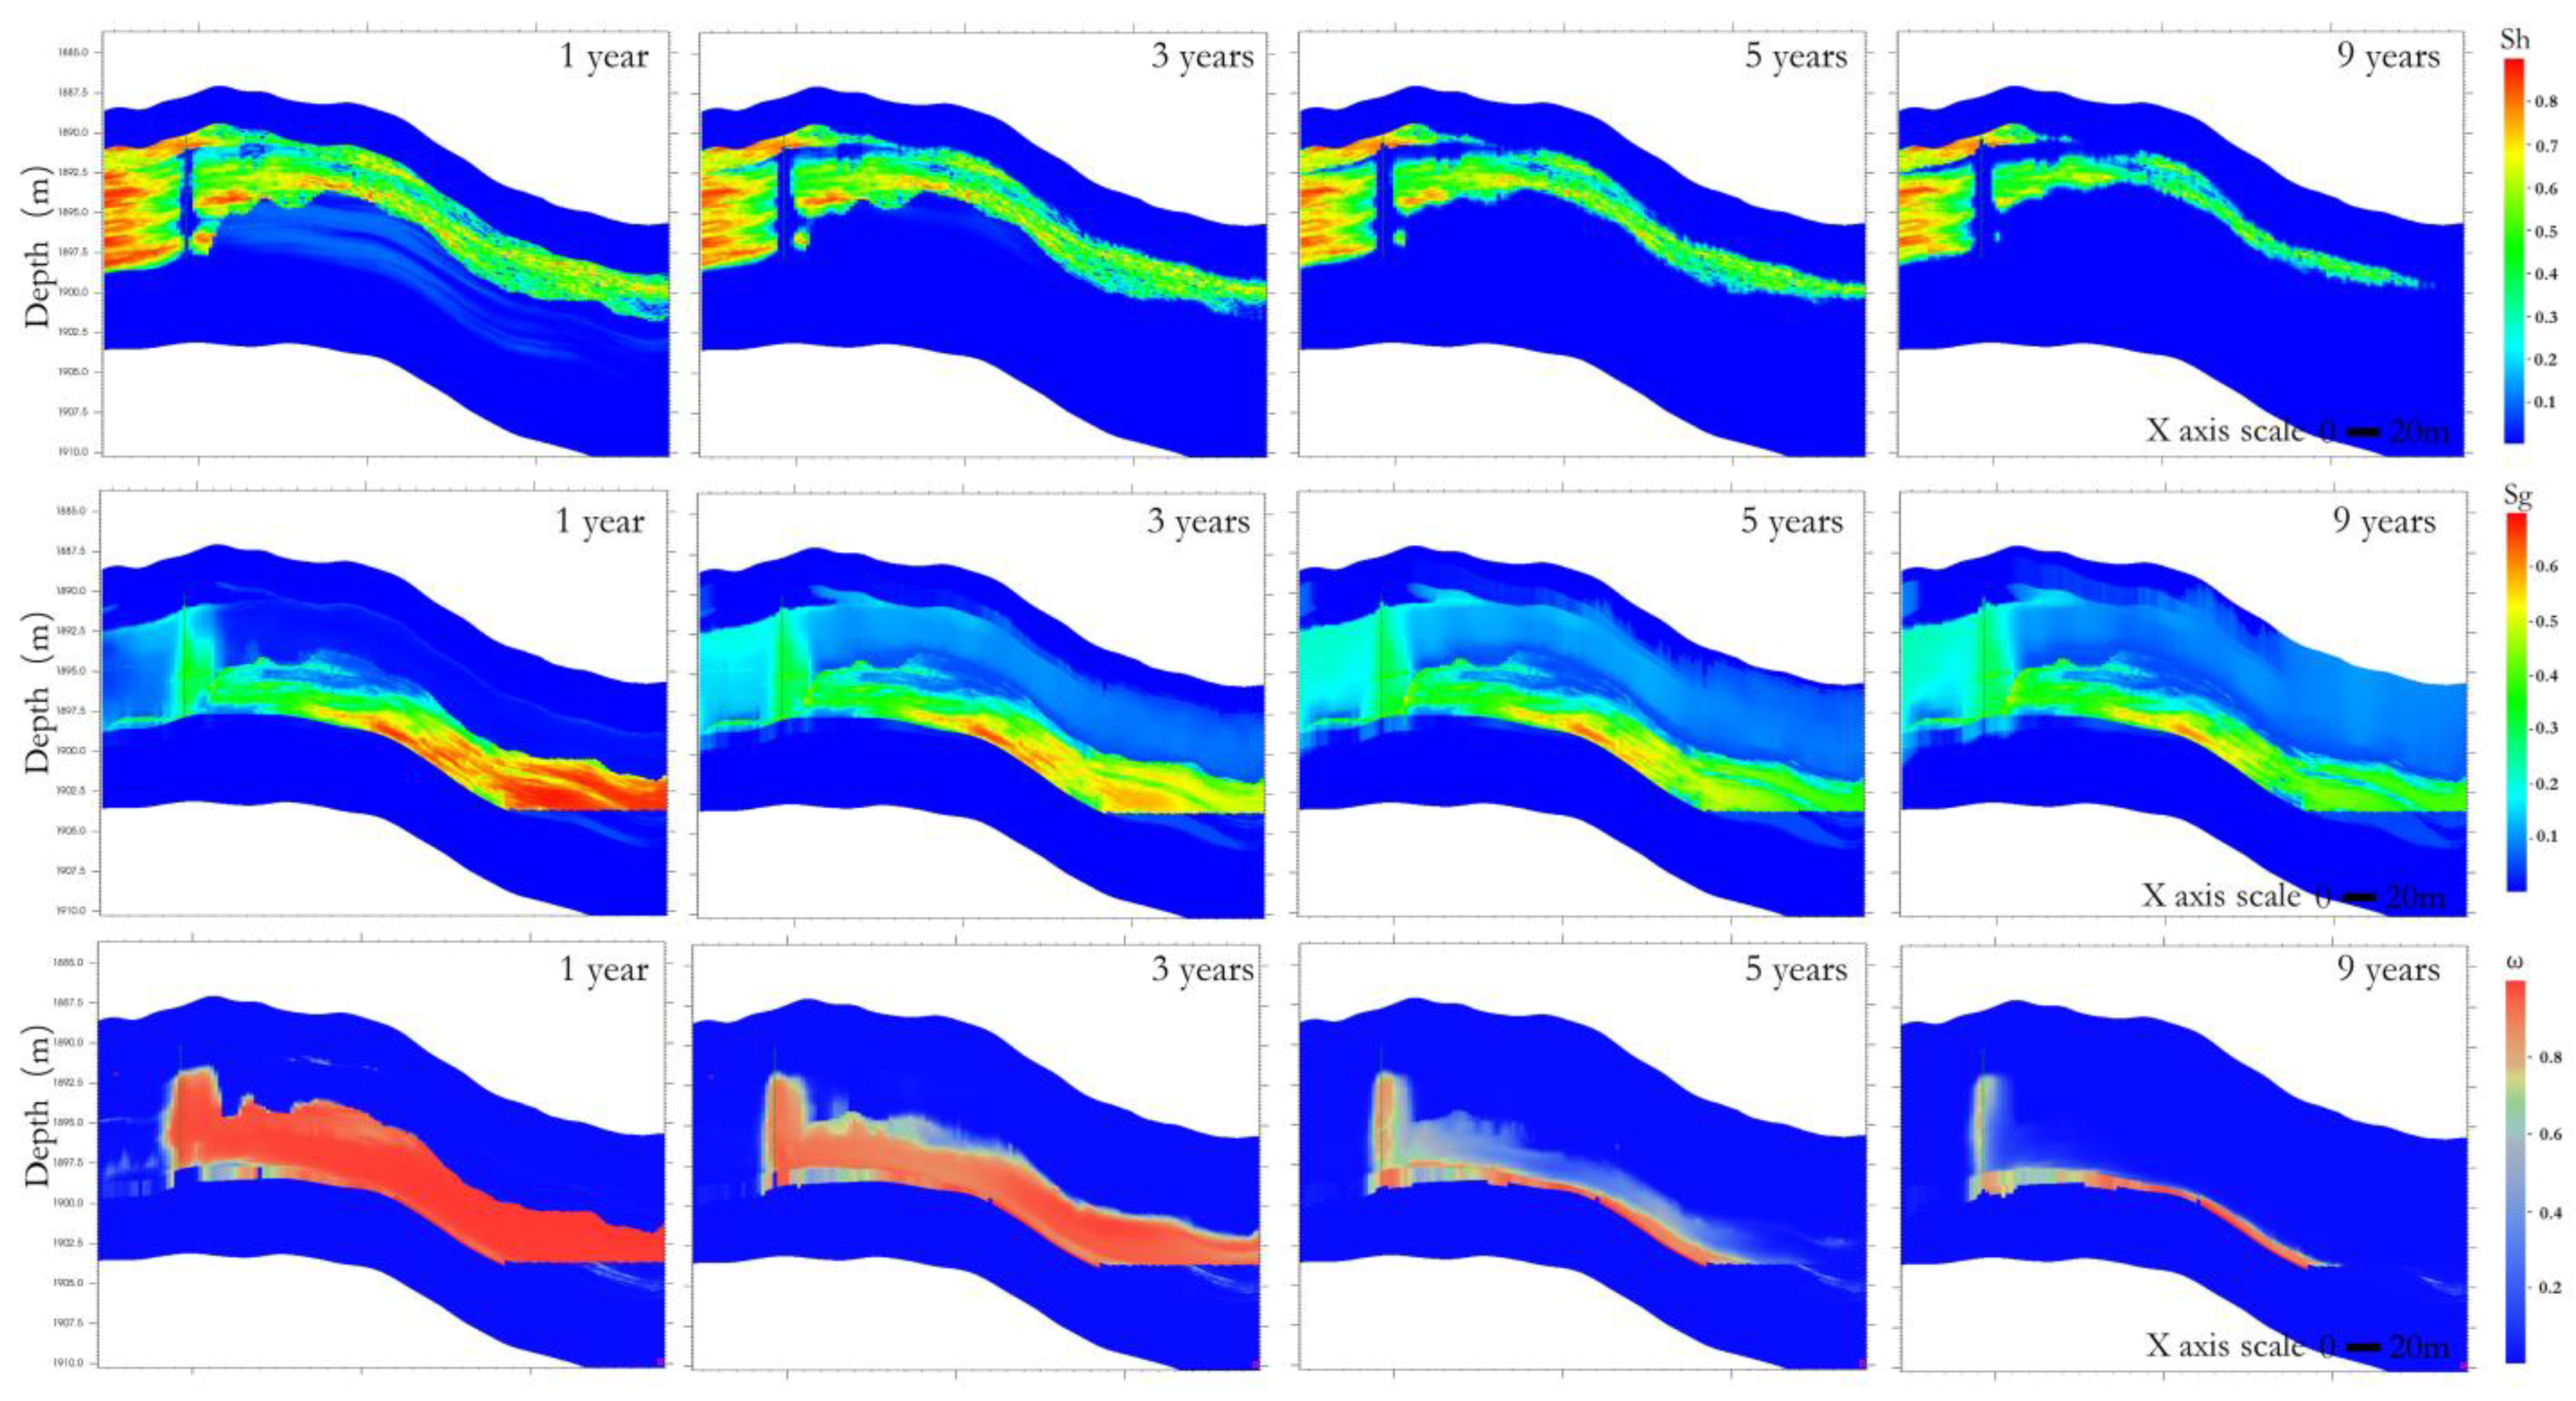
Figure 13 shows the evolution of the hydrate saturation, gas saturation, and the proportion of free gas in the pore ω during extraction. Initially, only hydrate near the well can dissociate. It is noteworthy that the hydrate on the invasion route of gas can dissociate quickly. It is due to the elastic drive of gas, which accelerates the pressure drop in this zone. Moreover, the temperature of the free gas is higher than that of the hydrate, which provides a valuable heat supply. These are all the original design intentions of Site 2. Another main area of hydrate dissociation is the transition zone. The release of gas in the lower part of the transition zone facilitates pressure diffusion and stimulates the hydrate dissociation. However, the dissociated gas does not seem to support the wellhead gas rate. As can be seen from the gas saturation distribution, the dissociated gas in the transition zone increases the gas saturation, but only a small amount of it can flow directly to the well. The distribution of gas content shows that the gas from hydrate dissociation in the transition zone mainly goes to the lower part of the transition zone, filling the space originally occupied by the free gas. It means that the effective gas supply of hydrate at Site 2 mainly comes from the near-well formations. The producer well at Site 2 has weak control over the gas from hydrate dissociation in the transition zone. The free gas content decreases significantly in the later period, corresponding to the shrinkage of the overall gas production rate.
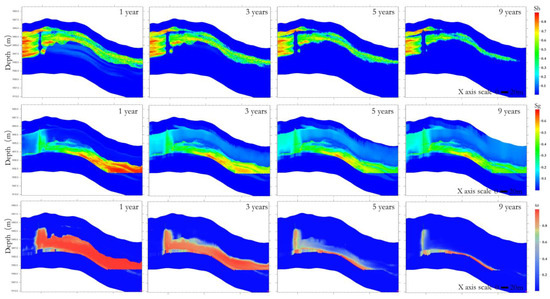
Figure 13.
Evolution of the hydrate saturation, gas saturation, and proportion of free gas in the pore in the reservoir during extraction at Site 2.
5.3. Site 3 Simulation Results
Site 3 is arranged in the transition zone, the lower section of which is in contact with the free gas. According to the production experience of conventional gas fields, this reservoir capacity is sufficient, and non-fixed bottom hole pressure is generally used to control the gas rate at the wellhead. The duration of stable gas production is the key. Site 3 is similar to the type 1 hydrate deposit, which collects free gas to reduce the formation pressure and drives the hydrate dissociation. In this paper, the steady production rates (20 × 104 m3/d, 30 × 104 m3/d, 40 × 104 m3/d) are adopted at Site 3 to compare the stable production duration and evaluate the change in the production dynamic law.
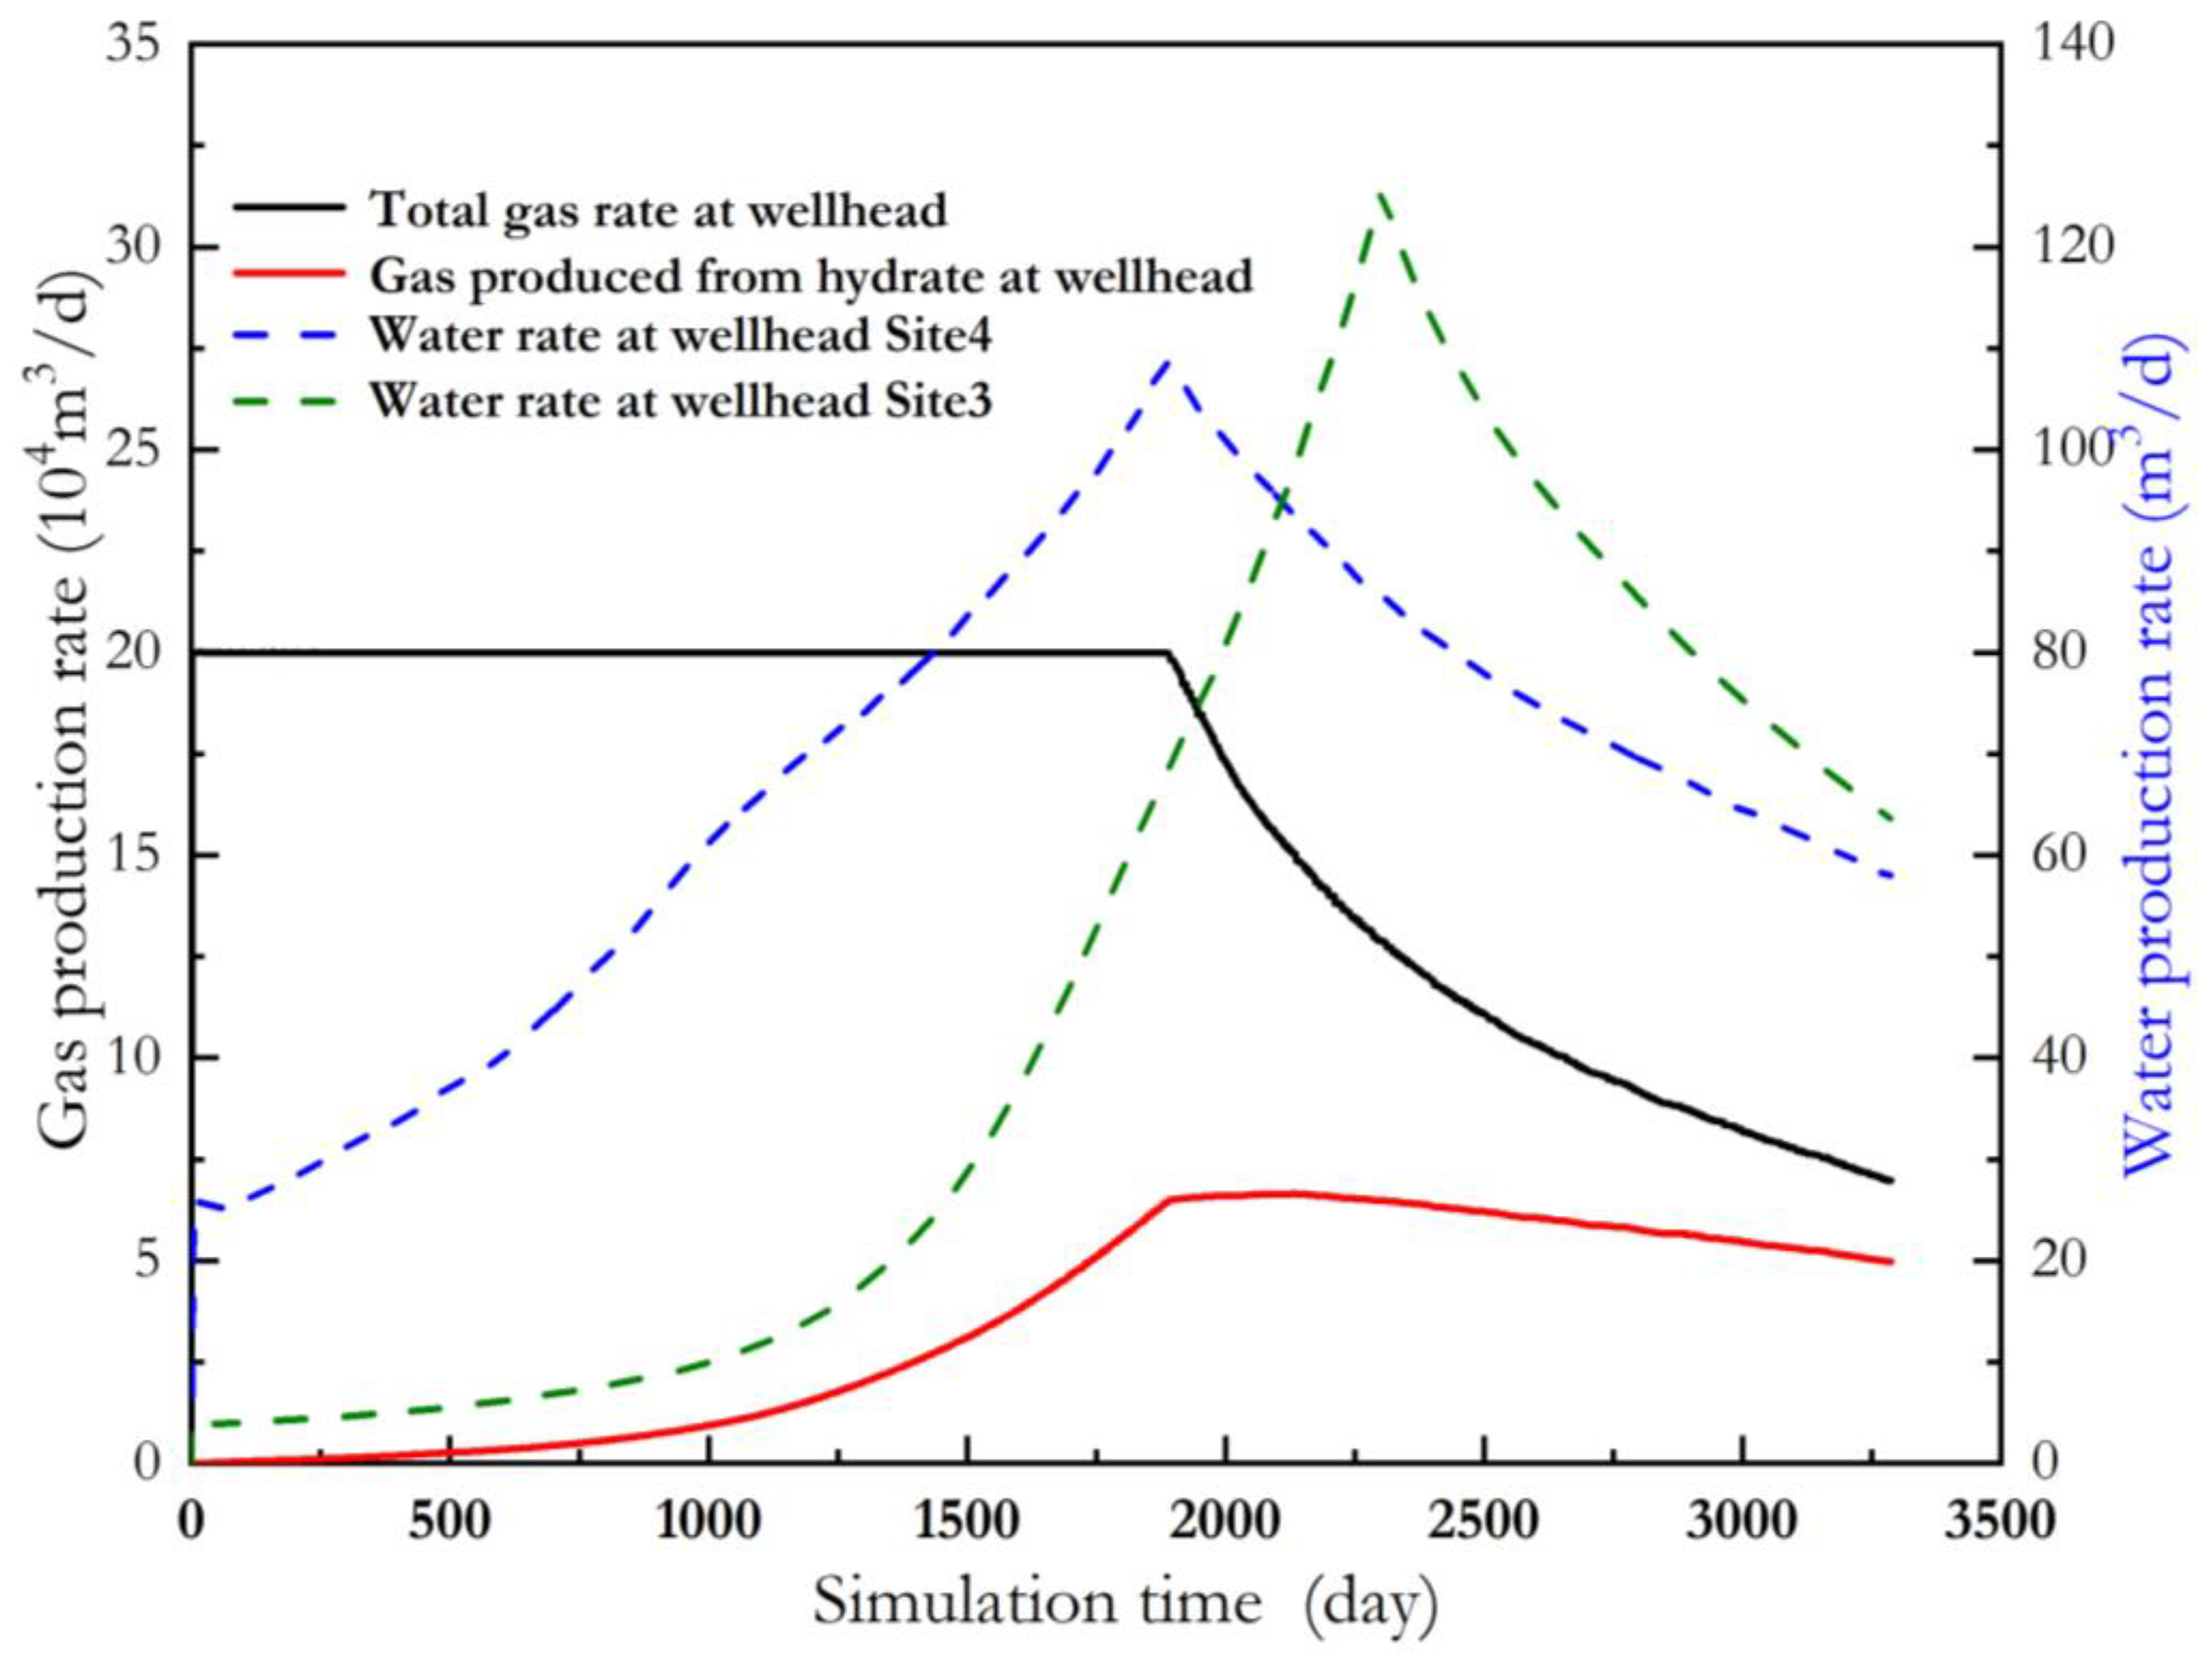
Unlike the gas production from hydrate dissociation, free gas does not need to break the equilibrium condition and complex kinetic reactions. A high and stable gas rate can be obtained as long as the stratum energy is sufficient and the permeability is high. For the underlying free gas with high gas saturation, porosity, and permeability, the relationship between the stable production rate and duration depends on the controllable storage volume of the single well. For the complex hydrate system in the QDNB, what needs to be additionally evaluated in this paper is the effect of different production regimes on hydrate dissociation. It is obvious that the higher the expected gas rate, the shorter the stable production duration. Figure 14 shows the total gas and gas rates from hydrate at the wellhead under different conditions of expected gas rates. For Site 3, the production rate 20 × 104 m3/d can be maintained for 2389 days, 30 × 104 m3/d can be maintained for 1350 days, and 40 × 104 m3/d can be maintained only for 865 days. In order to maintain a stable gas rate, it is inevitable to continuously reduce the bottom-hole pressure and make the pressure differential larger. The hydrate dissociation rate accelerates, thus providing additional capacity replenishment in the stable production stage, where the free gas supply is the main source. From Figure 14, it can be seen that the wellhead gas rate from hydrate reaches its peak at the end of stable production, which prolongs the stable production duration to a certain extent. The higher the stable production rate, the lower the total gas rate at the end of the simulation, with the final gas rate reducing to 6.04 × 10⁴ m3/d for 20 × 104 m3/d and 4.32 × 10⁴ m3/d for 40 × 104 m3/d.
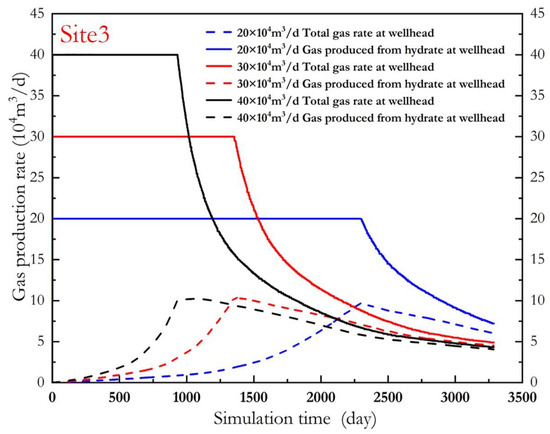
Figure 14.
Variation of total gas production rate and hydrate contribution rate at wellhead under different steady production rates at Site 3.
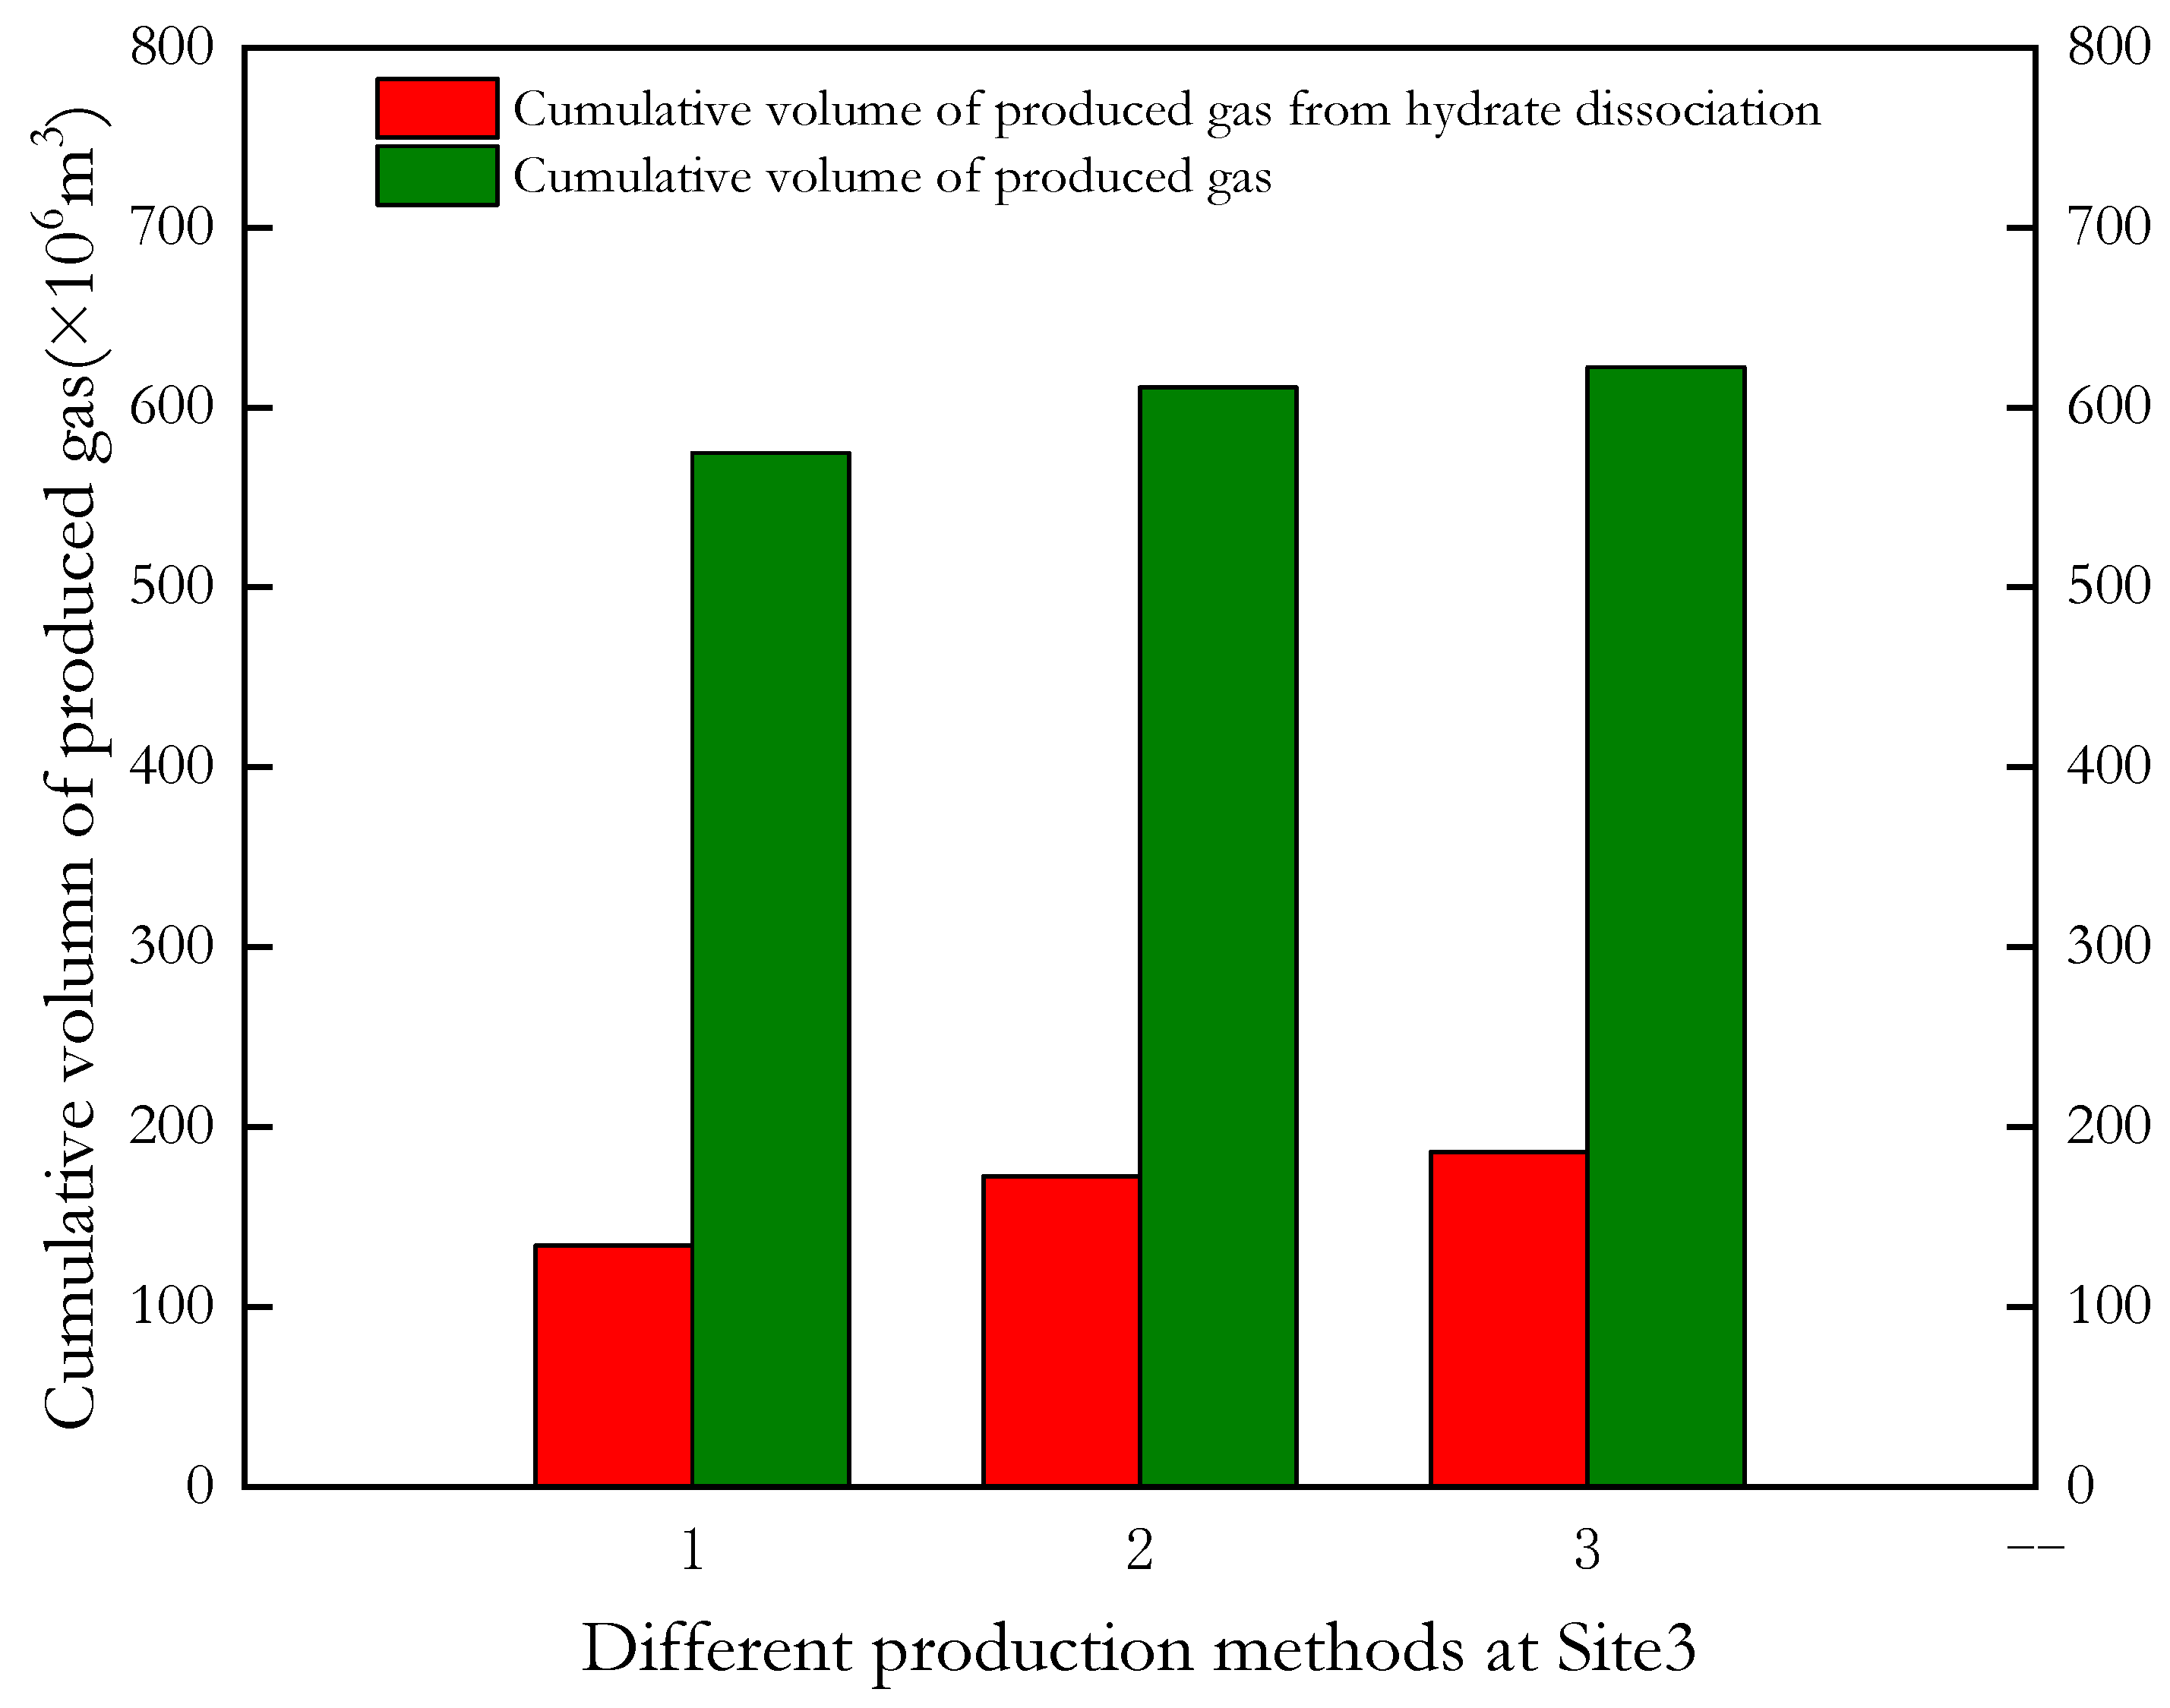
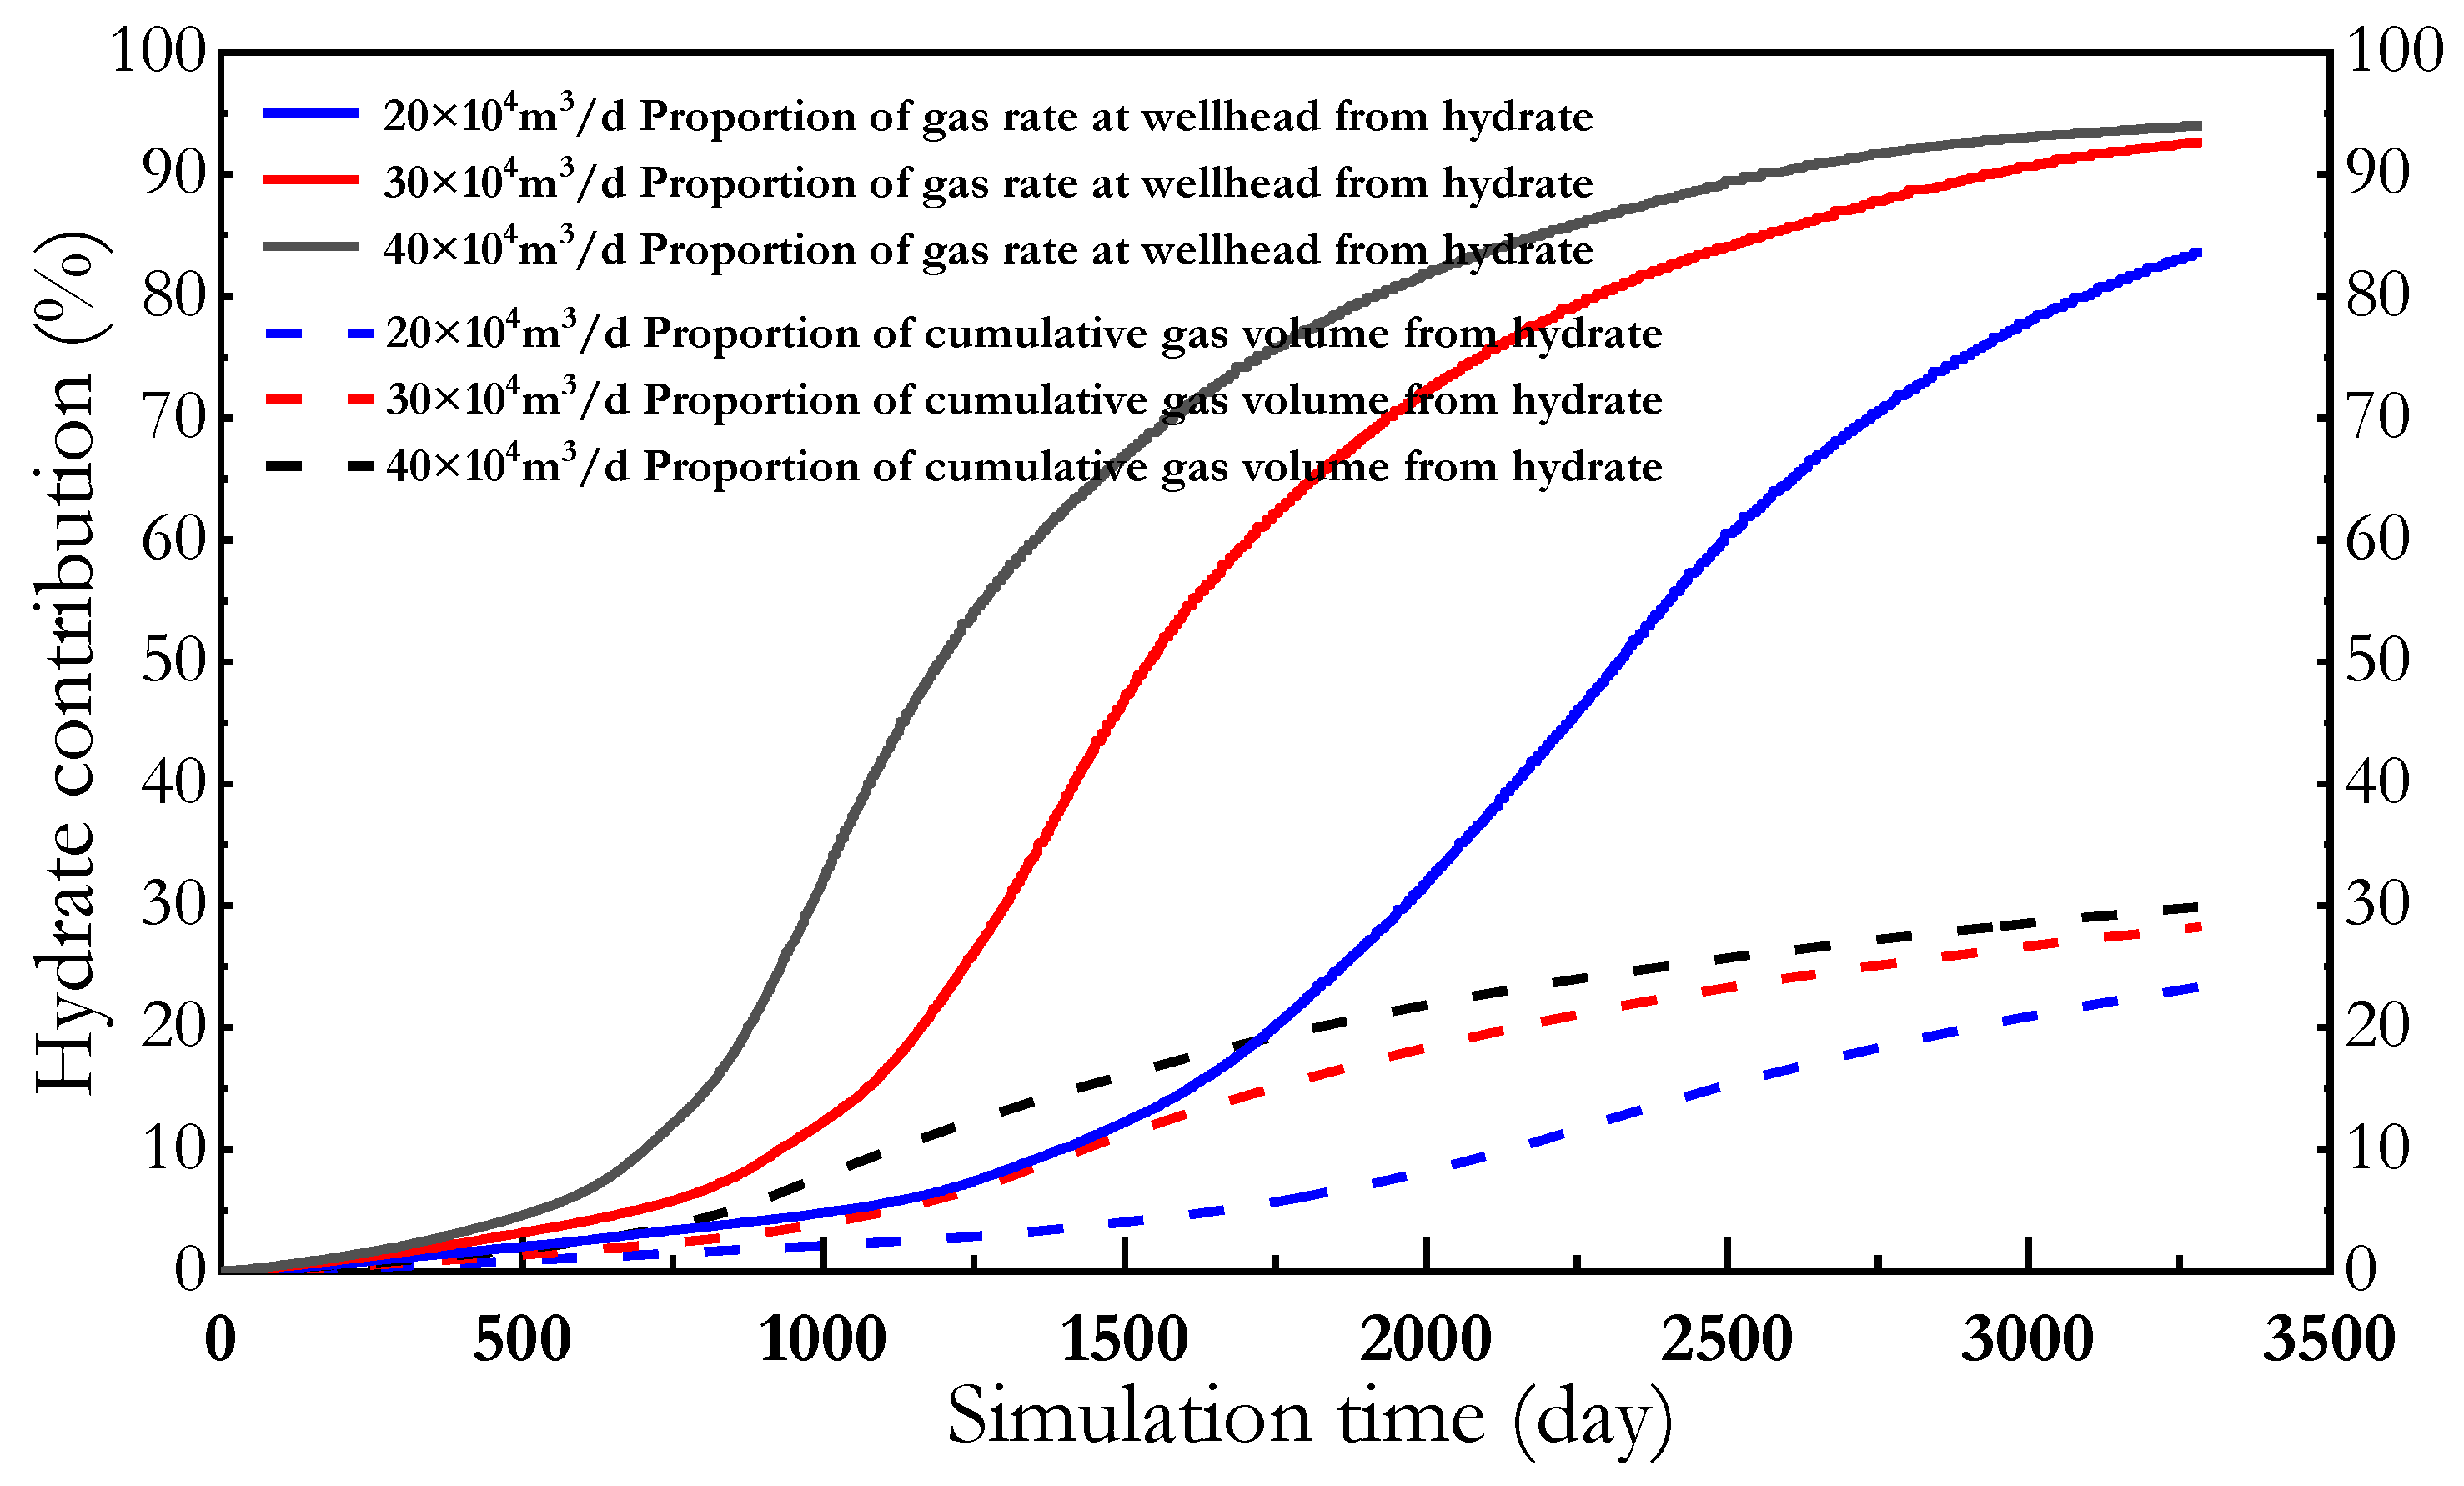
Figure 15 shows the cumulative gas volume and gas from hydrate dissociation at the wellhead. It can be seen that the higher the set gas production rate, the more gas can be produced from Site 3. The increment is not significant. Compared with the stable production rate of 20 × 104 m3/d, the cumulative gas production volume of 40 × 104 m3/d for 9 years is 6.22 × 10⁸ m3, with a slight increase of 0.48 × 10⁸ m3. It is worth noting that the increment almost completely comes from hydrate contribution. It can be inferred that depressurization speed has little effect on the recovery of free gas but much on hydrate dissociation. The larger the initial gas rate, the faster the depressurization speed, the more intense the hydrate dissociation, and the higher the proportion of gas rate and cumulative gas volume from hydrate. Figure 16 shows the instantaneous proportion of gas rate at the wellhead from hydrate and the proportion of cumulative gas volume from hydrate. As shown in Figure 16, the contribution from hydrate is greatly improved. The proportions of cumulative gas volume from hydrate with different stable production rates reach 23.3%, 28.2%, and 29.9%, respectively. The ultimate proportions of gas rate from hydrate reach 83.6%, 92.6%, and 94%, respectively. It also implies the depletion of controllable reserves of free gas at Site 3.
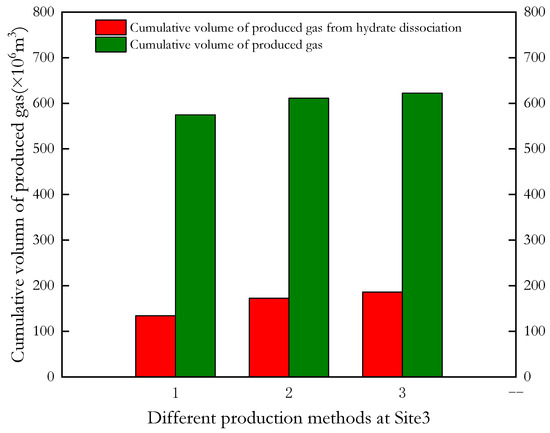
Figure 15.
Cumulative volume of gas produced from hydrate and total gas production under different stable production rates at Site 3.
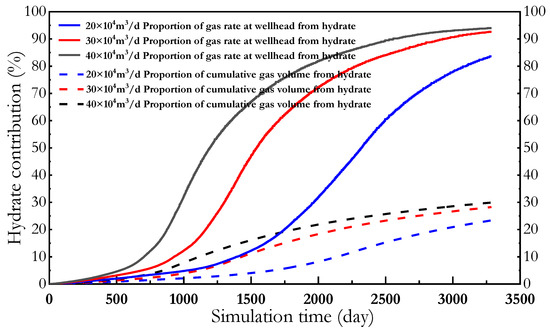
Figure 16.
Instantaneous proportion of gas rate at the wellhead from hydrate and the proportion of cumulative gas volume from hydrate at Site 3.
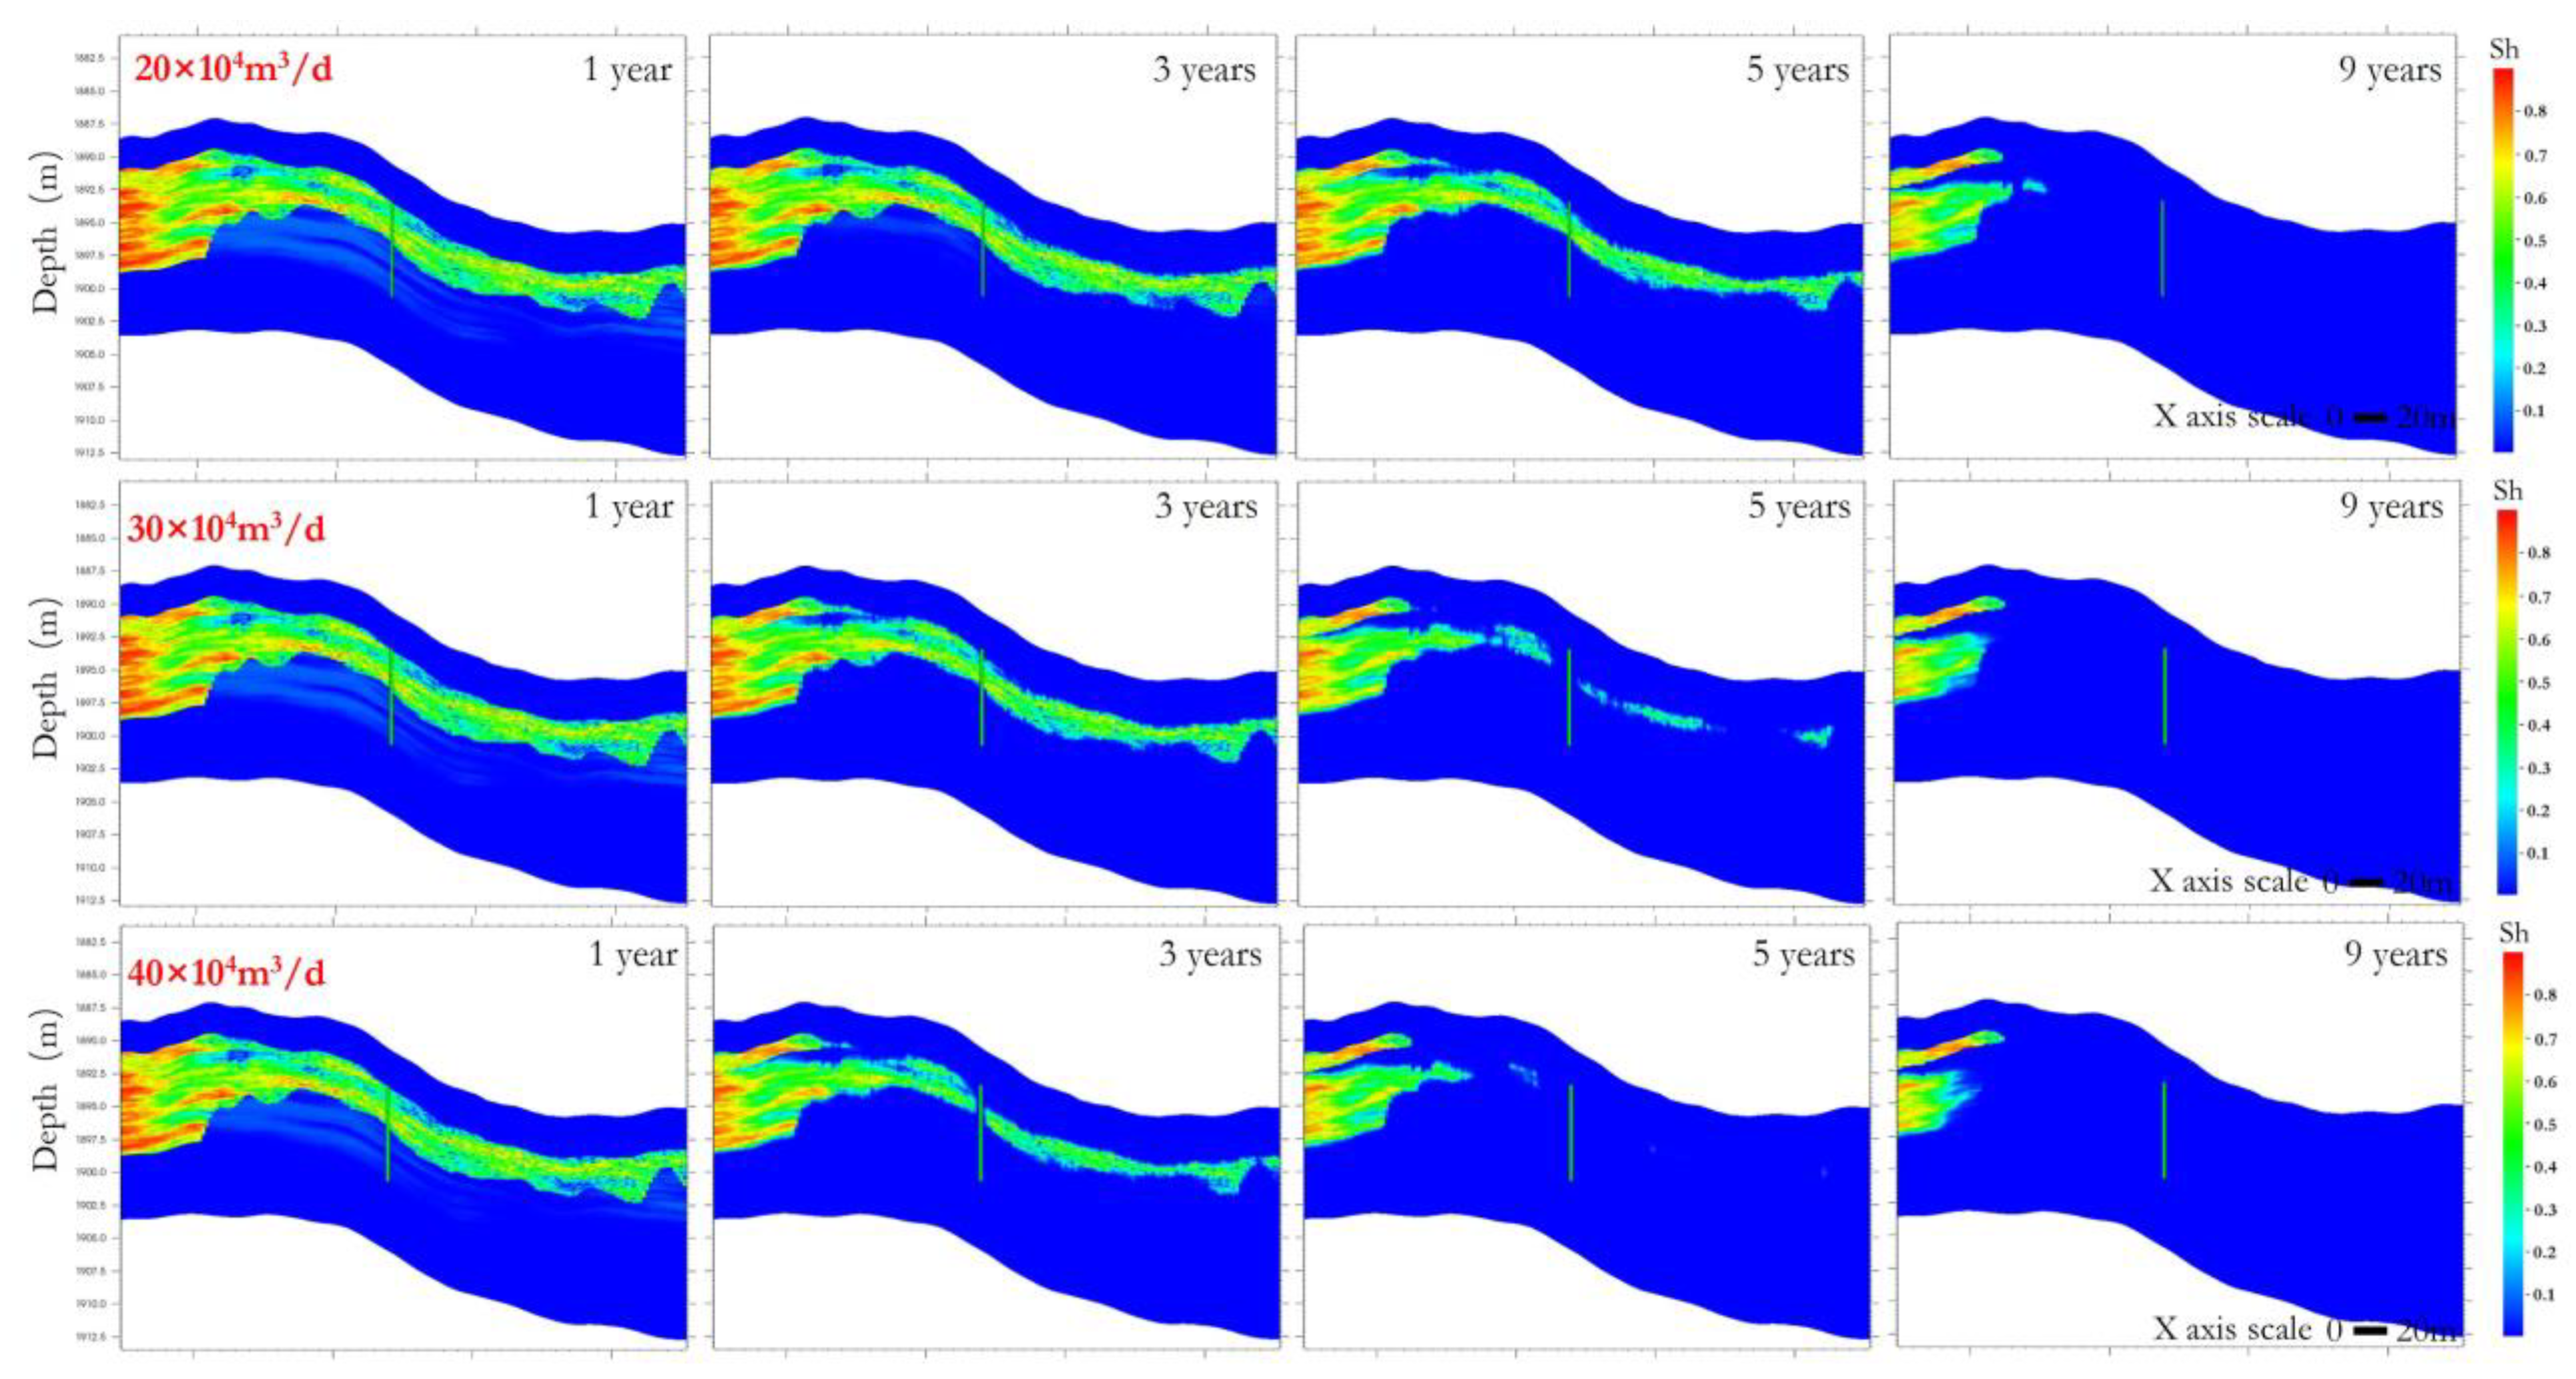
The evolution of hydrate saturation at Site 3 with different stable production rates is shown in Figure 17. The producer well at Site 3 strengthens the control of hydrate in the transition zone. The rapid recovery of free gas becomes an important driving force for hydrate dissociation in the upper part of the transition zone. When the pressure drop is transferred to the hydrate zone, the dissociation occurs from the intersection with the transition zone to the deeper part of the hydrate reservoir. The issue of concern is whether the gas produced from hydrate can be efficiently transported into the well at a distance. Figure 18 shows the evolution of gas saturation with different production rates. The gas saturation in the lower part of the transition zone drops gradually over time. The upper part of the transition zone still has a “water blockage” effect after hydrate dissociation, which hinders the gas produced by the hydrate from flowing into the well quickly.

Figure 17.
Evolution of hydrate saturation with different stable production gas rates at Site 3.
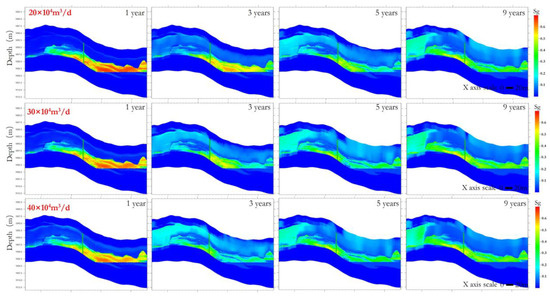
Figure 18.
Evolution of gas saturation with different stable production gas rates at Site 3.
For the gas production in the shallow layer, unlike in the conventional gas reservoir, the temperature is low. The temperature-pressure condition is very close to the hydrate phase equilibrium point. The Joule–Thomson effect will cause the temperature to drop, bringing about hydrate generation around the well, which can significantly reduce the permeability. Fortunately, no hydrate generation problem was found in this simulation, but it is still a concern in the development of a similar hydrate system.
5.4. Site 4 Simulation Results
There is a 2 m thick water layer in the lower part of Site 4. In the development of conventional bottom water reservoirs, due to the deformation of pressure potential, it is easy to cause bottom water invasion. In order to avoid excessive water production, the penetrated layer is set from the hydrate layer to the middle of the gas layer. If the bottom water intrudes into the producer well, it will cause a production decline. To relieve the bottom water invasion, the lower stable production target (20 × 104 m3/d) is adopted. Figure 19 shows the variation in total gas water at the wellhead, gas produced from hydrate at the wellhead, and water production with time at Site 4. The cumulative water volume is 2.21 × 10⁴ m3, which increased by 40.3% compared to the same regime at Site 3 (1.57 × 10⁴ m3). The stable production time is shortened to 1857 days, more than 500 days less. The hydrate dissociation performance is also weakened, with the peak rate of the wellhead gas rate from hydrate reaching only 6.56 × 10⁴ m3.

Figure 19.
Variation of total gas water at the wellhead, gas produced from hydrate at the wellhead, and water production with time at Site 4.
5.5. Site 5 Simulation Results
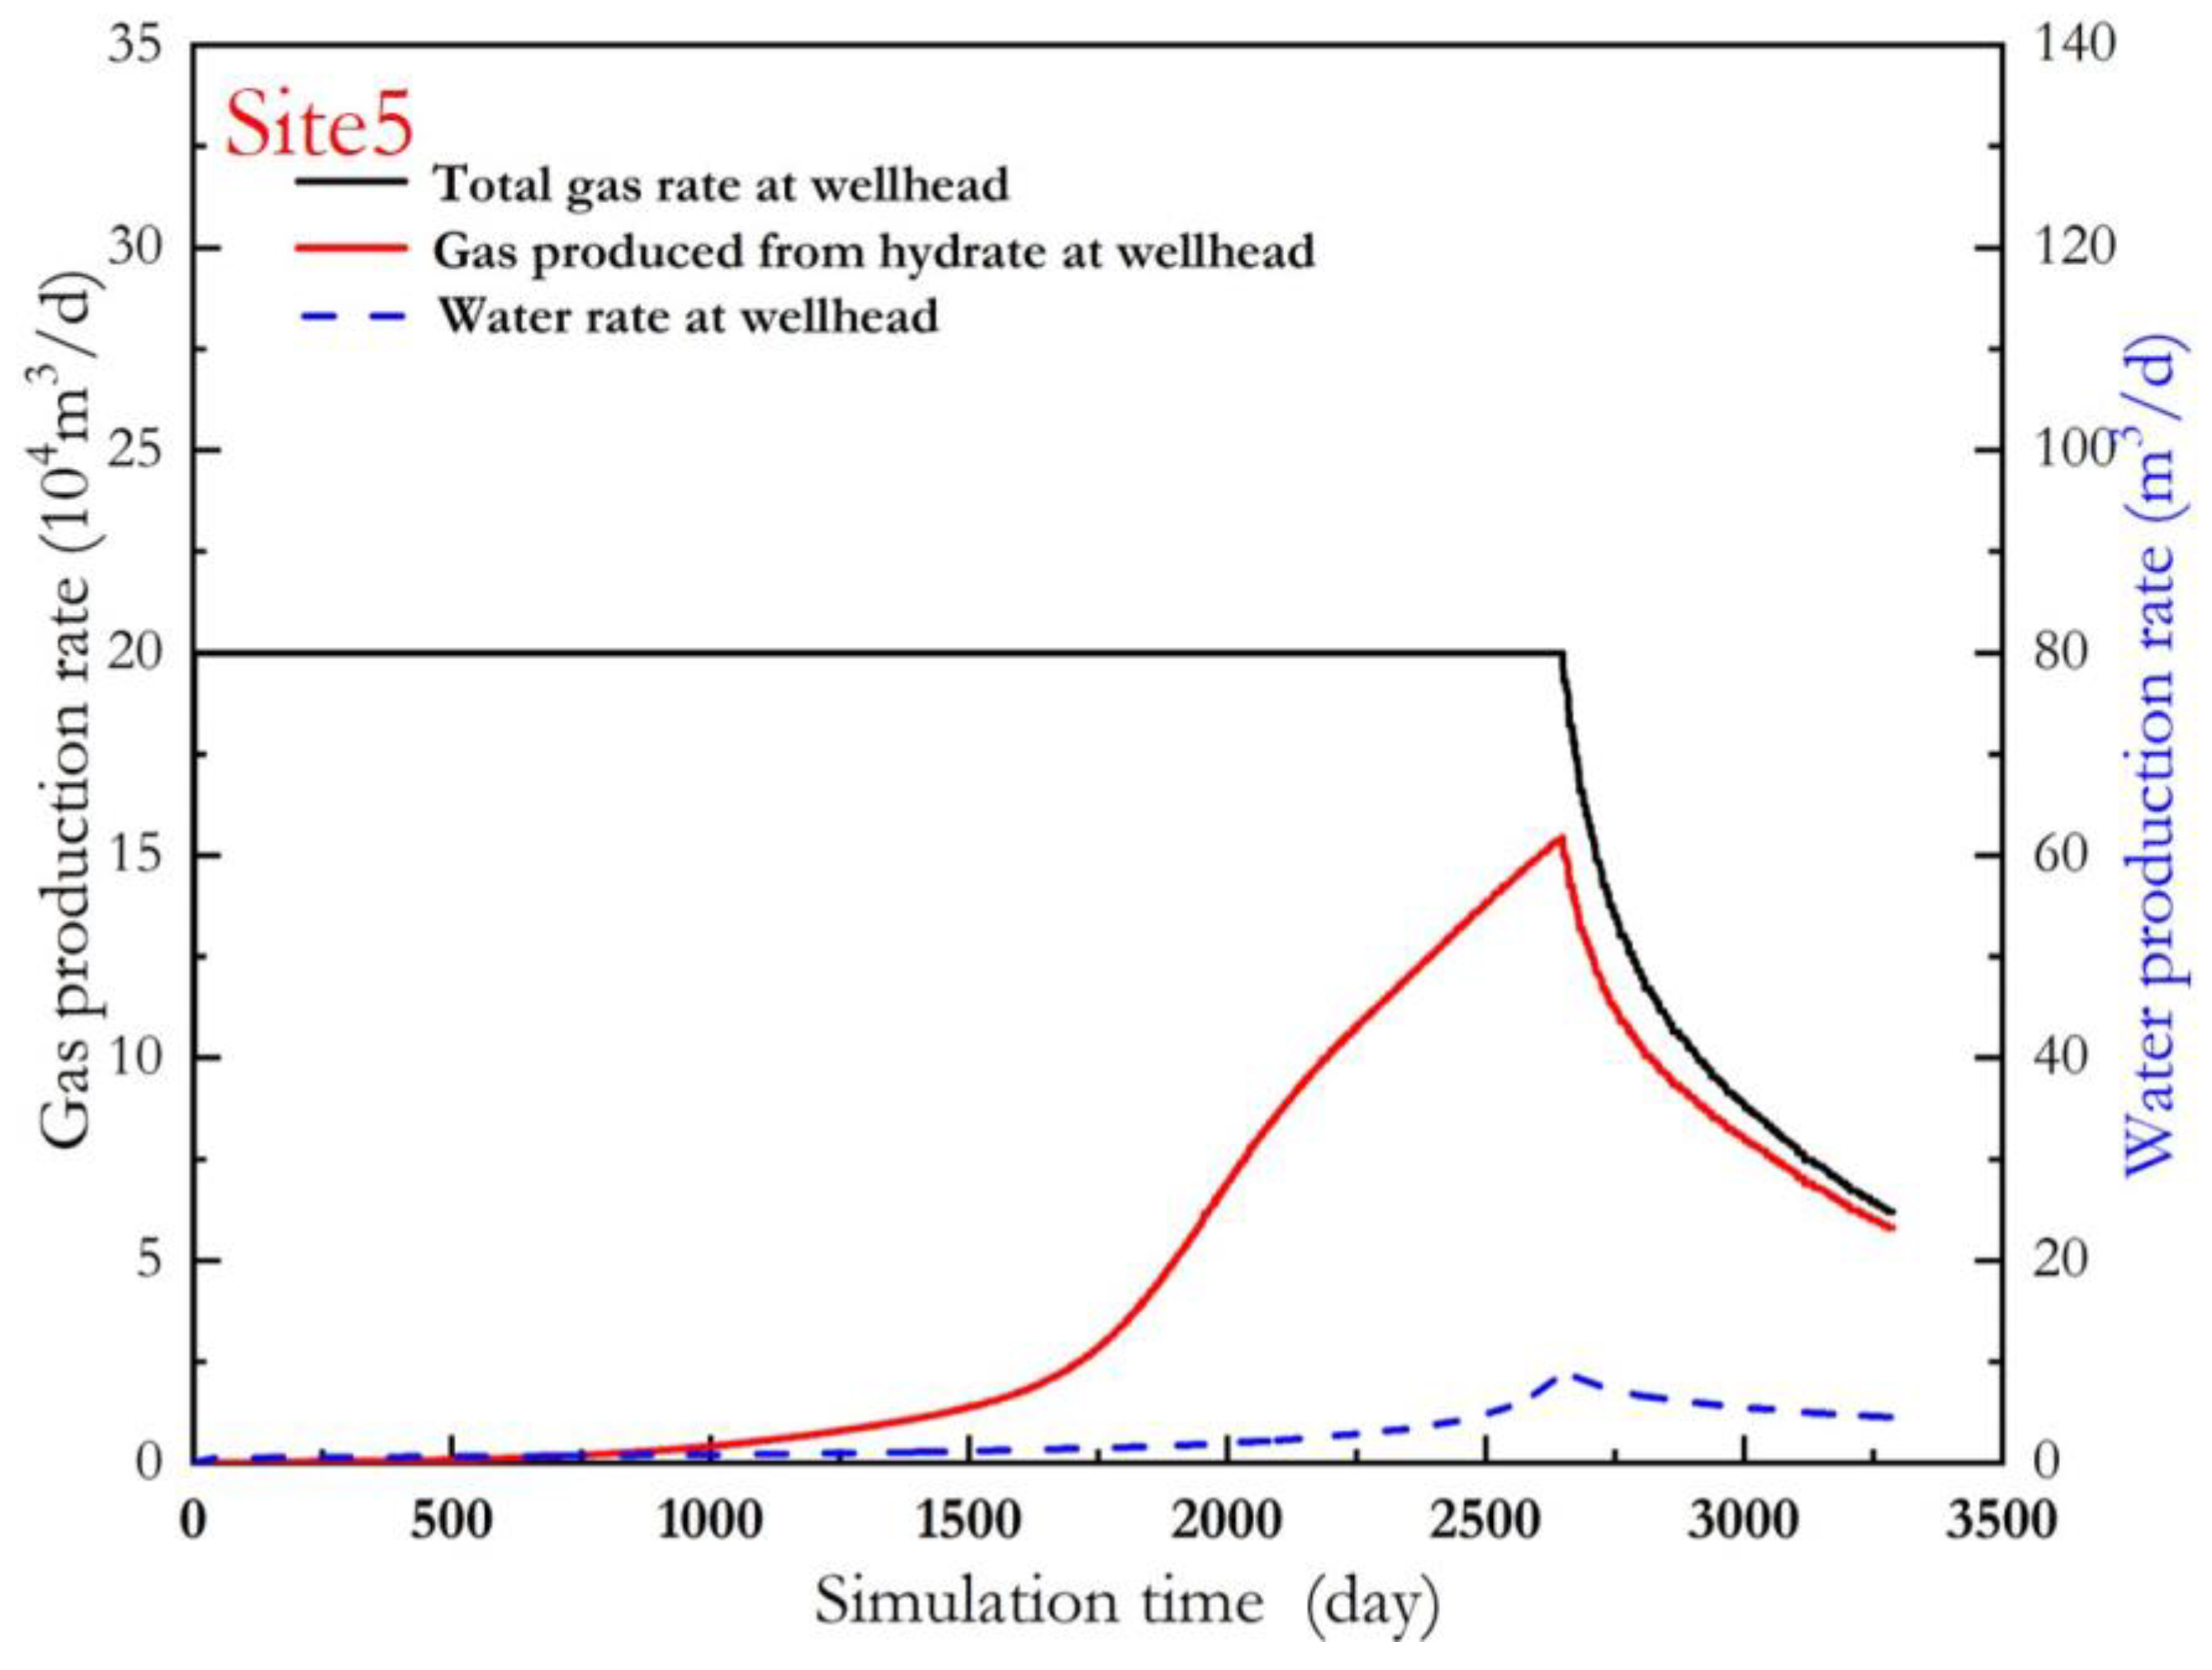
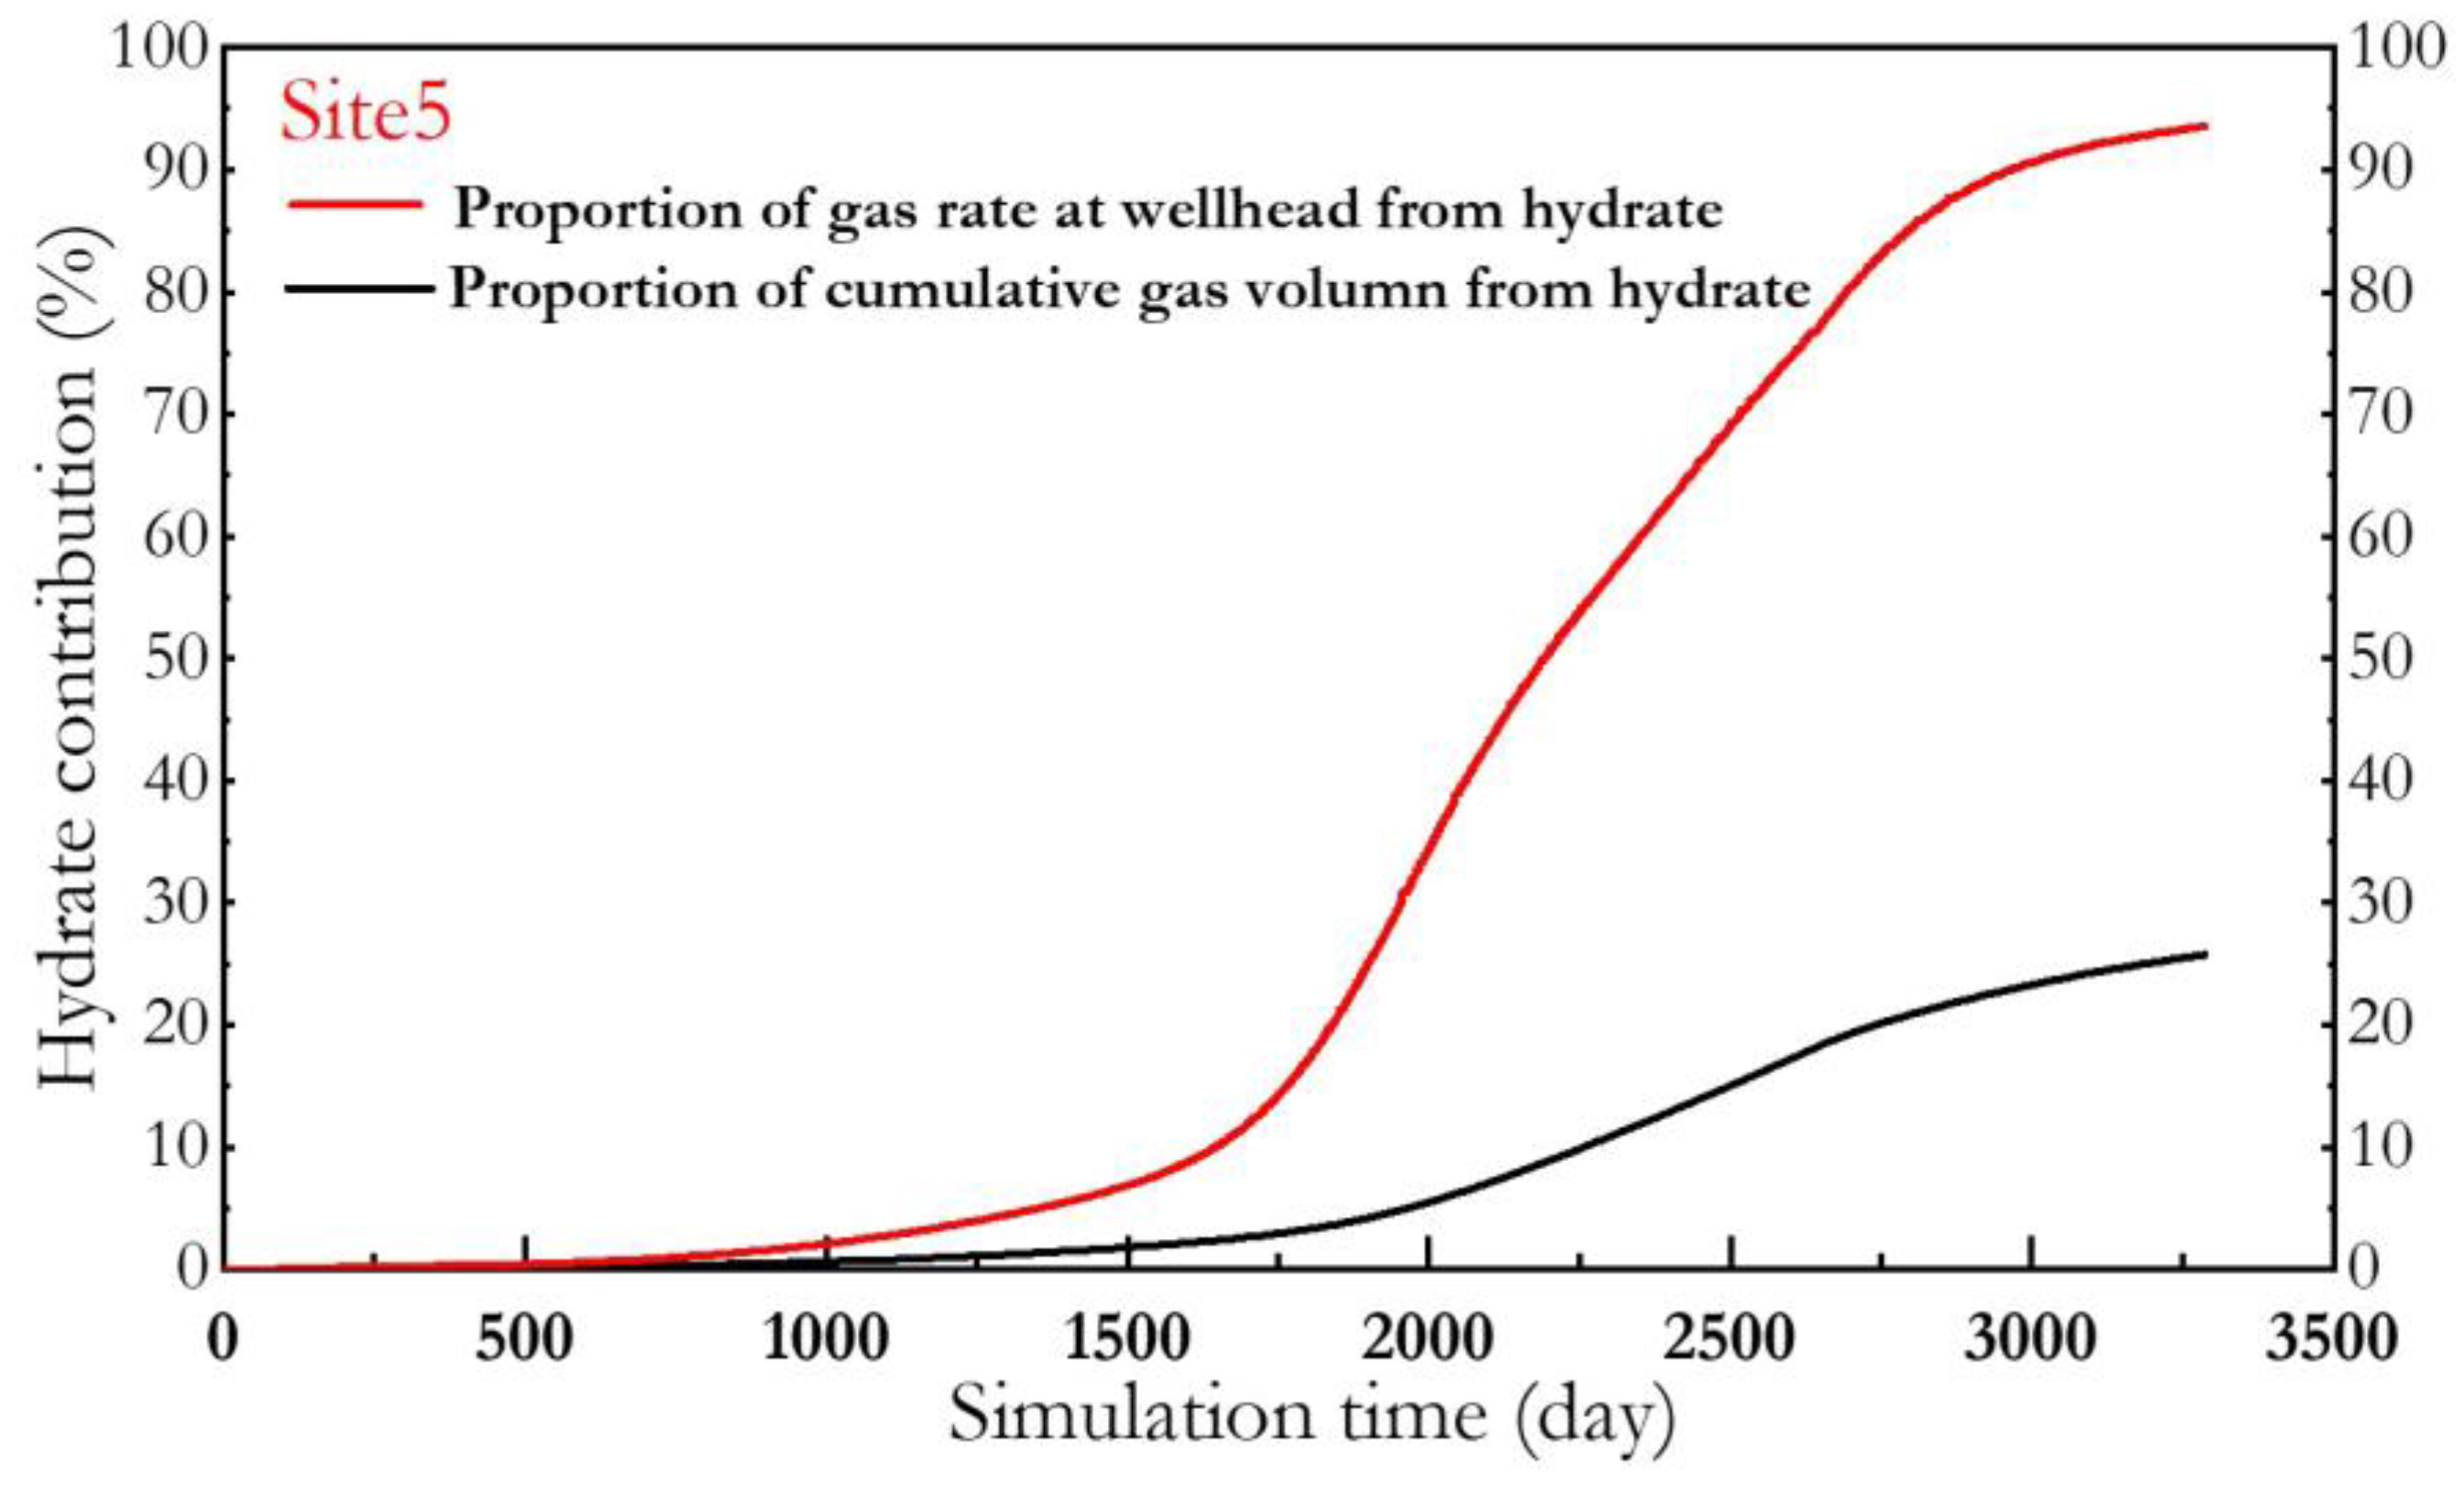
Site 5 is located in the center of the gas zone and is developed with a stable gas rate. Figure 20 shows the total gas rate, the gas rate at the wellhead from hydrate, and the water rate with a stable gas rate of 20 × 104 m3/d. The stable production duration at Site 5 increases slightly to 2645 days. The development strategy of Site 5 is to reduce the reservoir pressure by extracting the free gas in the center of the whole reservoir. Initially, hydrate plays an unimportant role. The gas rate at the wellhead from hydrate rises very slowly to only 1.38 × 10⁴ m3/d on the 1500th day, much lower than other sites. After the recovery of free gas is nearly completed, the gas rate from hydrate begins to rise significantly. At the end of stable production, the hydrate contribution rate reaches 15.3 × 10⁴ m3/d, accounting for nearly 77% (Figure 21). At this point, the free gas recovery is close to the peak. The depletion of the formation energy leads to a decline in the total gas rate. The gas production is dominated gradually by the hydrate dissociation. It is worth noting that there is little water coming out from this site because the formation near the well has a low water saturation and a perfect gas flow channel. In summary, the cumulative gas production volume from Site 5 is 5.94 × 10⁸ m3, which is 3% higher than that of Site 3 under the same method.
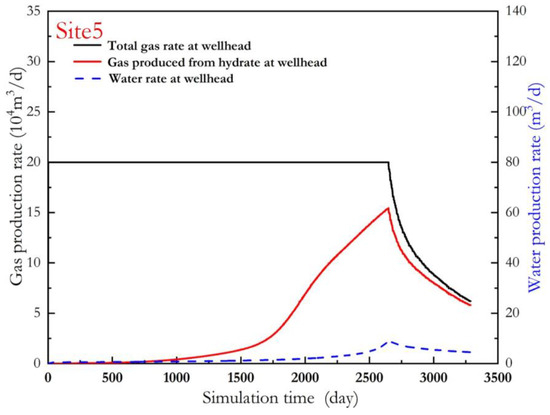
Figure 20.
Variation of total gas water at the wellhead, gas produced from hydrate at the wellhead, and water production with time at Site 5.

Figure 21.
Instantaneous proportion of gas rate at the wellhead from hydrate and cumulative proportion of gas at the wellhead from hydrate at Site 5.
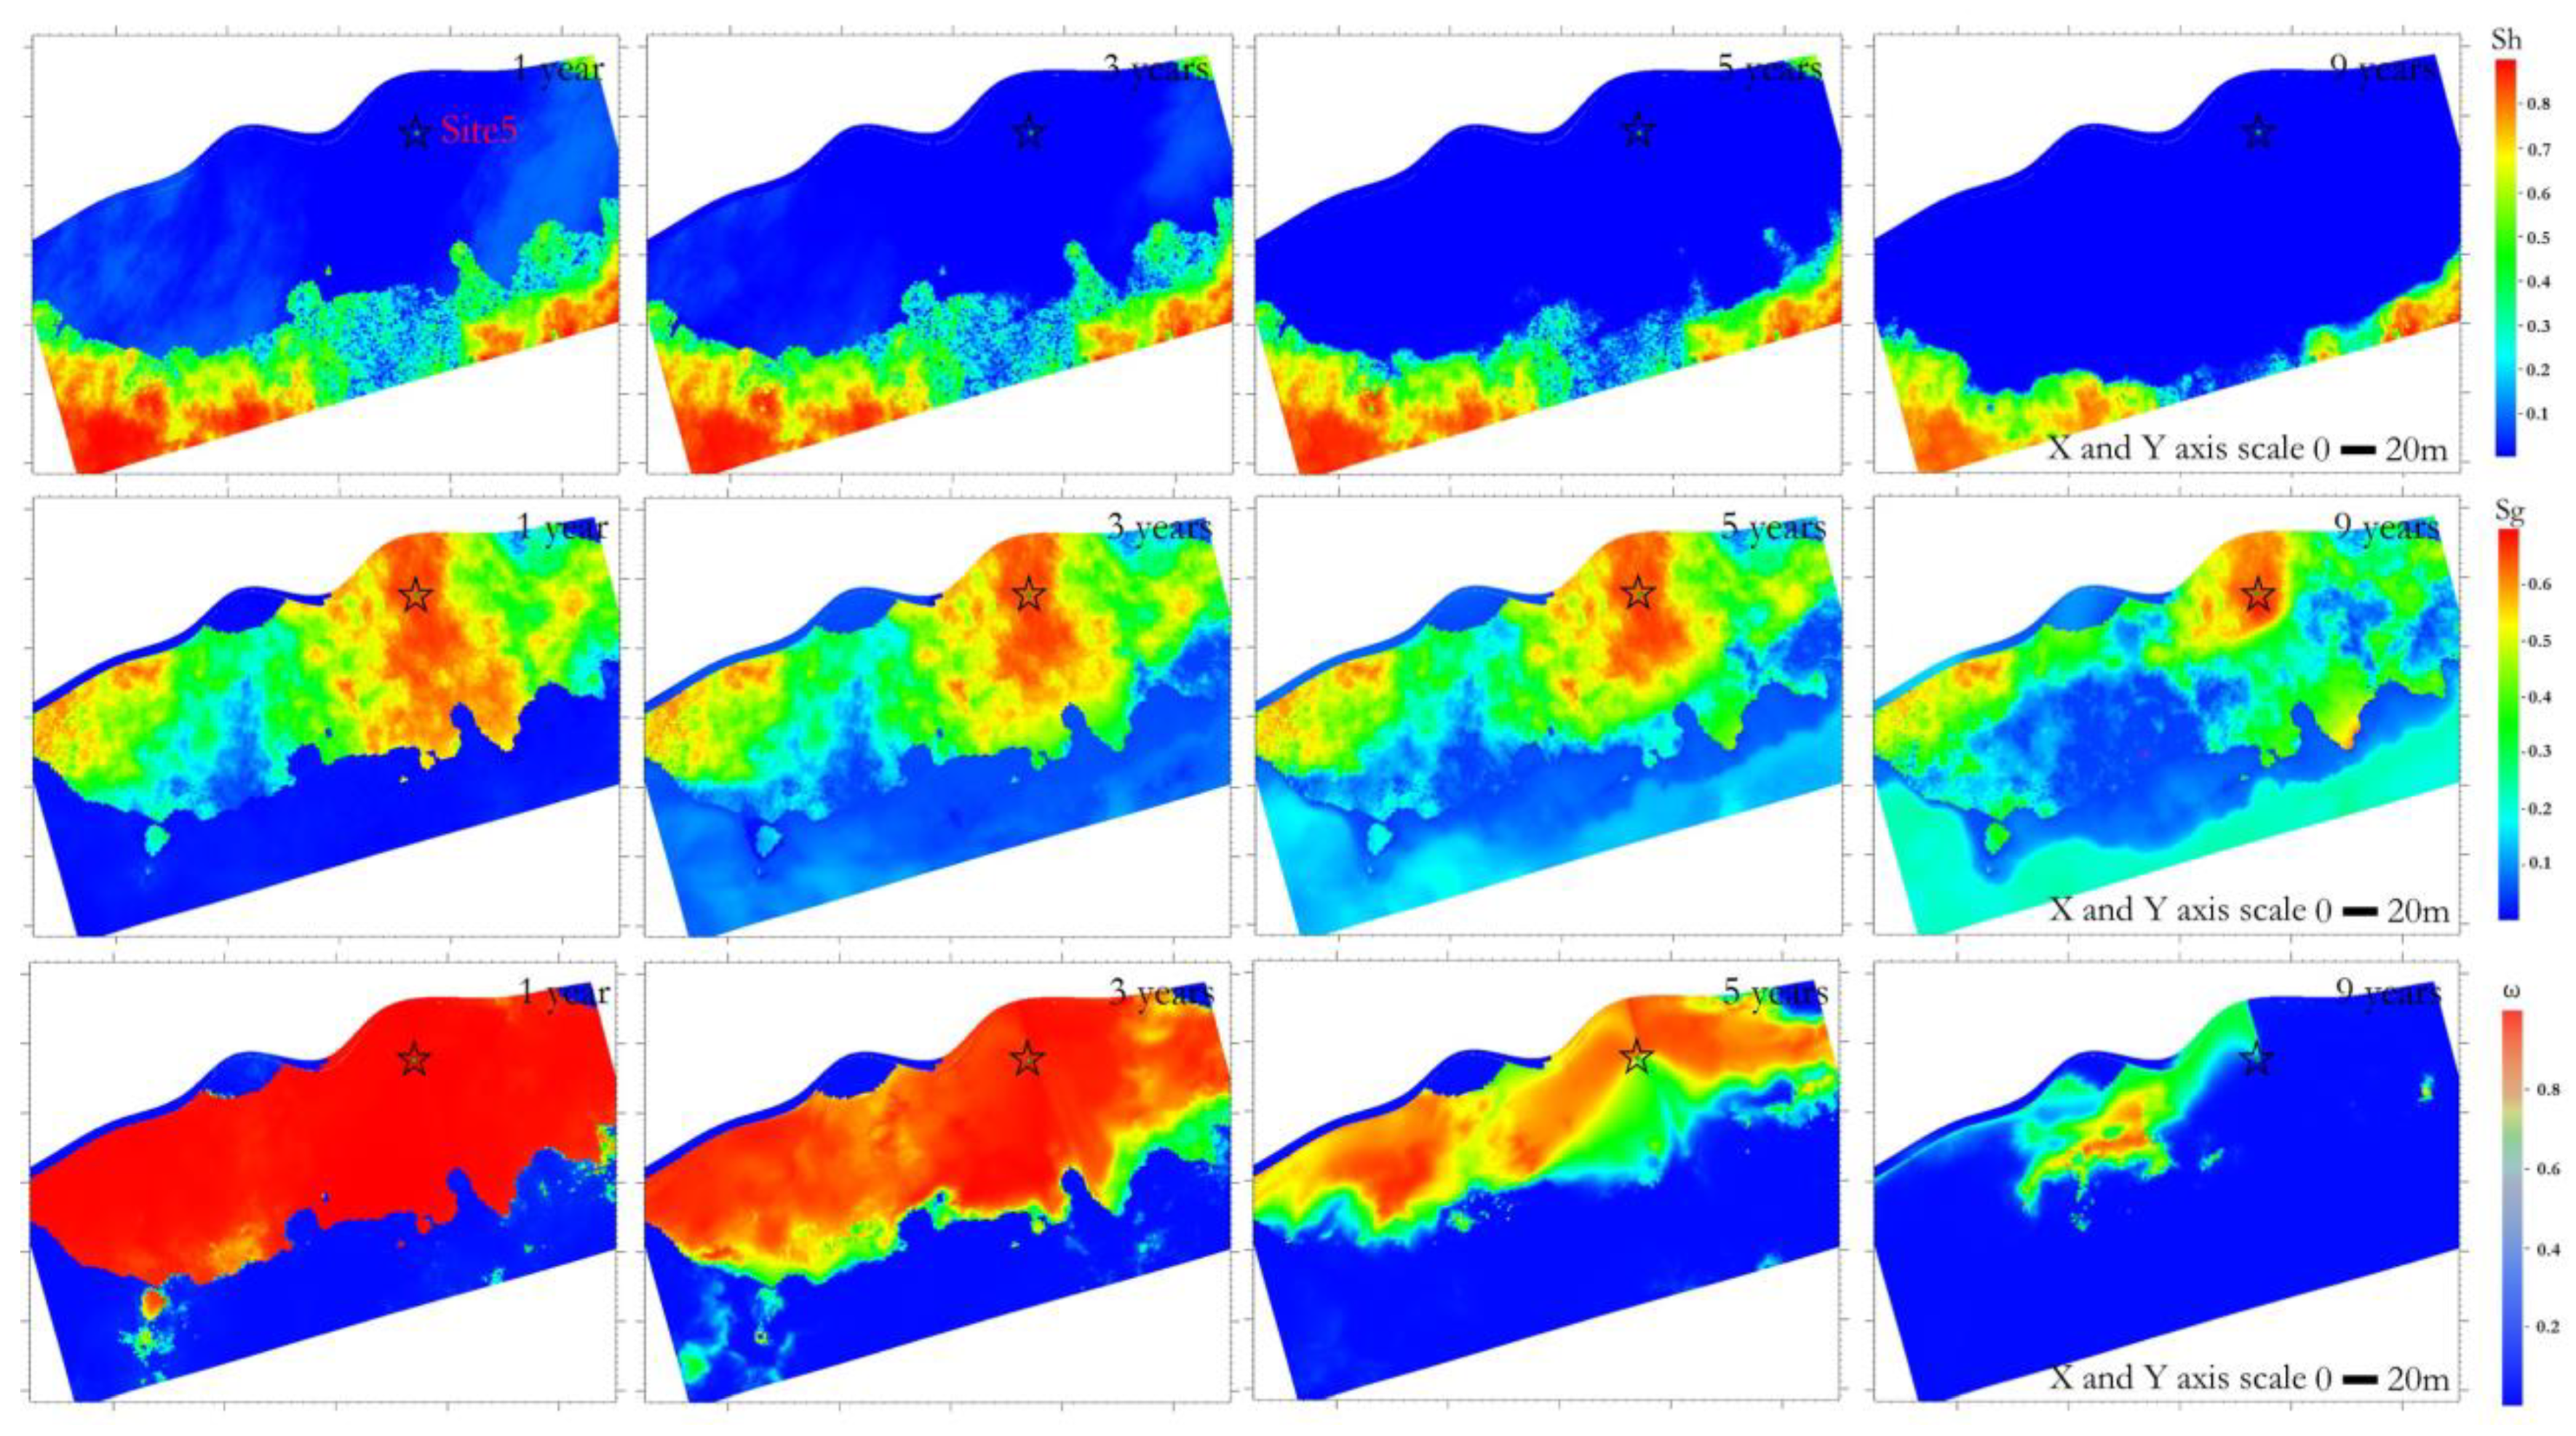
Figure 22 is the cross-sectional view of the hydrate, gas, and free gas ratio distribution in the middle layer of the reservoir. Most of the hydrate is still stable within 3 years. When the pressure drop is transferred to the hydrate zone, the hydrate dissociation front advances gradually from the transition zone to the deep part of the hydrate reservoir. It is found from Figure 22 that the gas replaces the pore space after hydrate dissociation, and the gas enrichment can be seen. However, a wide water zone is formed in the transition zone and keeps expanding toward the producer well. The high water-saturated layer has not yet invaded into the wellbore, so the water production always remains at a very low level.
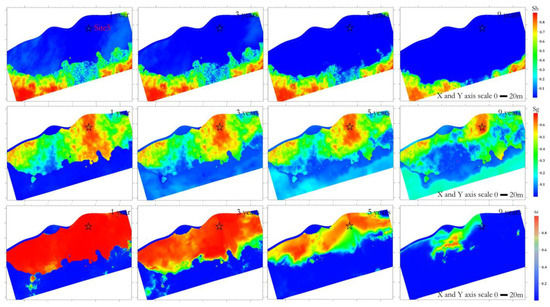
Figure 22.
Evolution of the hydrate saturation, gas saturation, and proportion of free gas in the pore in the reservoir during extraction at Site 5.
6. Summary
This complex gas-hydrate system was discovered in the QDNB and is controlled by a gas chimney evacuation channel with a high geothermal gradient. The hydrate and gas are distributed in the same layer, with the gas in the middle and the hydrate distributed around. In this paper, the commercial potential of this gas-hydrate system is evaluated through conducting production simulations of wells at different sites (Site 1–5). The following summary has been made, including the simulation results, the limitations of this research, and the future target.
- Except for Site 1, the simulation results of all the other sites show that the complex hydrate system in QDNB has commercial development potential. The system is highly inhomogeneous in the transversal direction. Different sites have different production characteristics. The cumulative gas production volume from Site 3 and Site 5 can reach approximately 6 × 10⁸ m3 in 9 years. The production capacity is based on the free gas zone with high saturation and high permeability in the system. Especially in the preliminary stage, it is an important support for gas production and a significant channel for pressure diffusion. The wellhead gas rate from hydrate dissociation starts to rise in the middle stage when the free gas recovery is nearly completed. The hydrate dissociation can extend the duration of stable production and increase the extraction life of the gas-hydrate system.
- The producer well in the highly saturated hydrate zone at Site 1 is far away from the free gas. The hydrate-filled pore causes a very low effective permeability and slow pressure diffusion. The free gas cannot invade the hydrate zone and support gas production. All the gas produced is from hydrate dissociation. Coupled with the fact that the reservoir itself is thin and no innovative production enhancements are used to drive rapid hydrate dissociation, the hydrate zone at Site 1 cannot obtain commercial gas flow by depressurization. The 9-year cumulative production volume is only 7.25 × 10⁶ m3. Therefore, Site 1 can only be used as a scientific trial field.
- The producer well at Site 2 is near the edge of the hydrate zone and close to the transition zone. With the large pressure differential, the free gas from the lower part of the transition zone can effectively invade the hydrate zone and enter the wellbore in the short term. The elastic energy of gas can quickly drive the water of the hydrate zone into the well, making the rapid hydrate dissociation in the gas-affected area. After the breakup of free gas, the gas rate can be increased, and the peak gas rate reaches 32 × 104 m3/d. However, the intensity of hydrate dissociation is insufficient. Although the ultimate ratio of instantaneous gas rate can climb to more than 40%, the cumulative gas production volume from hydrate accounts for only 12.3%.
- As for the well of the sites in the transition zone, it directly invokes the free gas capacity. Free gas is produced as the formation pressure reduces and hydrate is induced to dissociate, making the gas from the hydrate the subsequent production capacity. For example, with the initial stable production rate of 30 × 104 m3/d at Site 3, the cumulative gas volume at the wellhead from hydrate can reach 1.73 × 10⁸ m3, and the total gas volume is 6.1 × 10⁸ m3. Due to the high quality of the free gas zone, the smooth gas flow channel is ensured, and the recovery rate of free gas from a single vertical well is close to 90%, which can meet the commercial development demand. The cumulative gas production volume from hydrate accounts for up to 29.9%. Notably, any producer well laid above the water zone would result in a 40% increase in water production and a decrease in stable production length. Avoiding the water layer in developing a hydrate system of this type is recommended.
- The producer well built in the gas zone (Site 5) can acquire the longest stable production duration. The well is far away from the hydrate zone, so the gas rate from the hydrate rises very slowly. After the recovery of free gas is nearly completed, the gas rate from hydrate begins to rise significantly. The water output at this site is small. Building a single vertical well in the gas zone is recommended to exploit the complex hydrate system of QDNB.
- A single vertical well still faces the defect of a small control area when facing a large area of an inhomogeneous reservoir. The control here means the ability to collect the gas produced by hydrate. The simulation found that the “water belt” is easy to form after the hydrate dissociation, which hinders the transport of dissociated gas into the well. In the future, we can try to exploit these hydrate systems with the well group to improve the utilization rate of hydrate.
- There are definitely some limitations in the assessment. The amount of in situ core is scarce. The key parameters of the geological model cannot be examined by pressure-preserving core experiments, such as saturation and permeability. The geological model needs further validation and improvement. In addition, the in situ formation mechanical test has not been carried out. The mechanical properties are not considered seriously in the simulation. It is generally known that, for shallow hydrate reservoirs, the porosity will be reduced due to the increase in the effective stress, which will affect the efficiency of gas production if the formation fails. Therefore, the assessment in this paper is actually an optimistic result.
- There are many such complex hydrate systems with hydrate-gas mixing in the QDNB, including surveyed and unproven. The CGS will increase the survey efforts and the number of cores in the future. More experiments on the flow characteristics of in-situ hydrate layers must be carried out to improve the accuracy of capacity assessment.
7. Conclusions
- The discovered complex hydrate system in the QDNB, with gas and hydrate distributing in the same layer, has commercial development potential.
- The simulation results show that wells located in the transition and gas zones have significant gas production capacity. To this single deposit, the maximum stable production duration with a gas rate of 20 × 104 m3/d can last more than 2600 days.
- The hydrate dissociation can extend the duration of stable production and increase the extraction life of such a gas-hydrate system—the cumulative gas production volume from hydrate accounts for up to 29.9%.
- The well in the highly saturated hydrate zone has a limited gas production capacity. The low effective permeability and slow pressure diffusion make that unfavorable result. This innovative simulation method should be used to further improve the contribution from hydrate dissociation.
Author Contributions
Writing—original, L.Y.; Funding acquisition, H.L.; Writing—review and editing, L.Z.; Project administration, C.X.; Investigation, Z.K.; Software, X.L. and H.Y.; Supervision, Y.W. All authors have read and agreed to the published version of the manuscript.
Funding
This project was financially supported by the Guangdong Province Basic and Applied Basic Research Foundation (No. 2022A1515011902), Guangdong Province Marine Economic Development Special Fund Project (No. [2022]46), Guangzhou Science and Technology Projects (No. 202206050002). The geological survey projects of the China Geological Survey (DD20221700, DD20230063).
Data Availability Statement
Not applicable.
Conflicts of Interest
The authors declare that they have no known competing financial interests or personal relationships that could have appeared to influence the work reported in this paper.
References
- Sloan, E.D. Fundamental principles and applications of natural gas hydrates. Nature 2003, 426, 353–359. [Google Scholar] [CrossRef] [PubMed]
- Cherskiy, V.P.; Tsarev, V.P.; Nikitin, S.P. Investigation and prediction of conditions of accumulation of gas resource in gas-hydrate pools. Pet. Geol. 1984, 21, 84–89. [Google Scholar]
- Kvenvolden, K.A.; Lorenson, T.D. The global occurrence of natural gas hydrate. Geophys. Monogr. 2001, 124, 87–98. [Google Scholar] [CrossRef]
- Dallimore, S.R.; Uchida, T.; Collett, T.S. Scientific results from JAPAX/JNOC/GSC Mallik 2L-38 gas hydrate research well, Mackenzie Delta, Northwest Territories, Canada. Geol. Surv. Can. Bull. 1999, 544, 295–311. [Google Scholar]
- Liu, C.L.; Meng, Q.G.; He, X.L.; Li, C.F.; Ye, Y.G.; Lu, Z.Q.; Zhu, Y.H.; Li, Y.H.; Liang, J.Q. Comparison of the characteristics for natural gas hydrate recovered from marine and terrestrial areas in China. J. Geochem. Explor. 2015, 152, 67–74. [Google Scholar] [CrossRef]
- Fang, H.; Xu, M.C.; Lin, Z.Z.; Zhong, Q.; Bai, D.W.; Liu, J.X.; Pei, F.G.; He, M.X. Geophysical characteristics of gas hydrate in the Muli area, Qinghai province. J. Nat. Gas Sci. Eng. 2017, 37, 539–550. [Google Scholar] [CrossRef]
- Schicks, J.M.; Haeckel, M.; Janicki, G.; Spangenberg, E.; Thaler, J.; Giese, R.; Strauch, B.; Heeschen, K.; Priegnitz, M.; Luzi-Helbing, M.; et al. Development, test, and evaluation of exploitation technologies for the application of gas production from natural gas hydrate reservoirs and their potential application in the Danube Delta, Black Sea. Mar. Pet. Geol. 2020, 120, 104488. [Google Scholar] [CrossRef]
- Ewa, B.; Matthias, H. Basin-scale estimates on the petroleum components generation in the Western Black Sea basin based on the 3-D numerical model. Mar. Pet. Geol. 2019, 113, 104122. [Google Scholar] [CrossRef]
- Chazallon, B.; Rodriguez, C.T.; Ruffine, Y.; Carpentier, Y.; Riboulot, Y. Characterizing the variability of natural gas hydrate composition from a selected site of the Western Black Sea, off Romania. Mar. Pet. Geol. 2020, 124, 104785. [Google Scholar] [CrossRef]
- Konno, Y.; Fujii, T.; Sato, A.; Akamine, K.; Naiki, M.; Masuda, Y.; Yamamoto, K.; Nagao, J. Key findings of the world’s first offshore methane hydrate production test off the coast of Japan: Toward future commercial production. Energy Fuels 2017, 31, 2607–2616. [Google Scholar] [CrossRef]
- Tamaki, M.; Fujii, T.; Suzuki, K. Characterization and prediction of the gas hydrate reservoir at the second offshore gas production test site in the eastern Nankai Trough, Japan. Energies 2017, 10, 1678. [Google Scholar] [CrossRef]
- Yoon, S.H.; Sohn, Y.K.; Chough, S.K. Tectonic, sedimentary, and volcanic evolution of a back-arc basin in the East Sea (Sea of Japan). Mar. Geol. 2014, 352, 70–88. [Google Scholar] [CrossRef]
- Wang, X.J.; Collett, T.S.; Lee, M.W.; Yang, S.X. Geological controls on the occurrence of gas hydrate from core, downhole log, and seismic data in the Shenhu area, South China Sea. Mar. Geol. 2014, 357, 272–292. [Google Scholar] [CrossRef]
- Yu, X.H.; Wang, J.Z.; Liang, J.Q.; Li, S.L.; Kuang, Z.G.; Li, W. Depositional characteristics and accumulation model of gas hydrates in northern South China Sea. Mar. Pet. Geol. 2014, 56, 74–86. [Google Scholar] [CrossRef]
- Klauda, J.B.; Sandler, S.I. Global distribution of methane hydrate in ocean sediment. Energy Fuels 2005, 19, 459–470. [Google Scholar] [CrossRef]
- Makogon, Y.F. Natural gas hydrates—A promising source of energy. J. Nat. Gas Sci. Eng. 2010, 2, 49–59. [Google Scholar] [CrossRef]
- Pinero, E.; Marquardt, C.; Hensen, C.; Haeckel, M.; Wallmann, K. Estimation of the global inventory of methane hydrates in marine sediments using transfer functions. Biogeosciences 2013, 10, 959–975. [Google Scholar] [CrossRef]
- Wallmann, K.; Pinero, E.; Burwicz, E.; Haeckel, M.; Ruepke, L. The global inventory of methane hydrate in marine sediments: A theoretical approach. Energies 2012, 5, 2449–2498. [Google Scholar] [CrossRef]
- Oleg, B.; Kateryna, S.; Vasyl, L.; Mykhailo, P.; Pavlo, S. Research into dissociation zones of gas hydrate deposits with a Heterogeneous structure in the Black Sea. Energies 2021, 14, 1345. [Google Scholar] [CrossRef]
- Takahashi, H.; Yonezawa, T.; Fercho, E. Operation Overview of the 2002 Mallik gas hydrate production research well program at the Mackenzie Delta in the Canadian Arctic. In Proceedings of the Offshore Technology Conference, Houston, TX, USA, 5–8 May 2003. [Google Scholar] [CrossRef]
- Moridis, G.J.; Collett, T.S.; Pooladi-Darvish, M.; Hancock, S.H.; Santamarina, C.; Boswell, R.; Kneafsey, T.J.; Rutqvist, J.; Kowalsky, M.B.; Reagan, M.T. Challenges, Uncertainties and Issues Facing Gas Production from Hydrate Deposits in Geologic Systems. In Proceedings of the SPE Unconventional Gas Conference, Pittsburgh, PA, USA, 23–25 February 2010. [Google Scholar] [CrossRef]
- Li, J.F.; Ye, J.L.; Qin, X.W.; Qiu, H.J.; Wu, N.Y.; Lu, H.L.; Xie, W.W.; Lu, J.A.; Peng, F.; Xu, Z.Q.; et al. The first offshore natural gas hydrate production test in South China Sea. China Geol. 2018, 1, 5–16. [Google Scholar] [CrossRef]
- Ye, J.L.; Qin, X.W.; Xie, W.W.; Lu, H.L.; Ma, B.J.; Qiu, H.J.; Liang, J.Q.; Lu, J.A.; Kuang, Z.G.; Lu, C.; et al. Main progress of the second gas hydrate trial production in the South China Sea. Geol. China 2020, 47, 557–568, (In Chinese with English Abstract). [Google Scholar] [CrossRef]
- Uchida, T.; Takeya, S.; Chuvilin, E.M.; Ohmura, R.; Nagao, J.; Yakushev, V.S.; Istomin, V.A.; Minagawa, H.; Hideo-Narita, T.E. Decomposition of methane hydrates in sand, sandstone, clays, and glass beads. J. Geophys Res. 2004, 109, B05206. [Google Scholar] [CrossRef]
- Liu, X.L.; Flemings, P.B. Capillary effects on hydrate stability in marine sediments. J. Geophys. Res. 2011, 116, B07102. [Google Scholar] [CrossRef]
- Daigle, H.; Dugan, B. Pore size controls on the base of the methane hydrate stability zone in the Kumano Basin, offshore Japan. Geophys. Res. Lett. 2014, 41, 8021–8028. [Google Scholar] [CrossRef]
- Li, Z.D.; Tian, X.; Li, Z.; Xu, J.Z.; Zhang, H.X.; Wang, D.J. Experimental study on growth characteristics of pore-scale methane hydrate. Energy Rep. 2020, 6, 933–943. [Google Scholar] [CrossRef]
- Ryu, B.J.; Collett, T.S.; Rield, M.; Kim, G.Y.; Chun, J.H.; Bahk, J.J.; Lee, J.Y.; Kim, J.H.; Yoo, D.G. Scientific results of the Second Gas Hydrate Drilling Expedition in the Ulleung Basin (UBGH2). Mar. Pet. Geol. 2013, 47, 1–20. [Google Scholar] [CrossRef]
- Yoo, D.G.; Kang, N.K.; Yi, B.Y.; Kim, G.Y.; Ryu, B.J.; Lee, K.; Lee, G.H.; Riedel, M. Occurrence and seismic characteristics of gas hydrate in the Ulleung Basin, East Sea. Mar. Pet. Geol. 2013, 47, 236–247. [Google Scholar] [CrossRef]
- Torres, M.E.; Trehu, A.M.; Cespedes, N.; Kastner, M.; Wortmann, U.G.; Kim, J.H.; Long, P.; Malinverno, A.; Pohlman, J.W.; Riedel, M.; et al. Methane hydrate formation in turbidite sediments of northern Cascadia, IODP Expedition 311. Earth Planet. Sci. Lett. 2008, 271, 170–180. [Google Scholar] [CrossRef]
- Boswell, R.; Collett, T.S.; Frye, M.; Shedd, W.; Mcconnell, D.R.; Shelander, D. Subsurface gas hydrates in the northern Gulf of Mexico. Mar. Pet. Geol. 2012, 34, 4–30. [Google Scholar] [CrossRef]
- Santra, M.; Flemings, P.B.; Scott, E. Evolution of gas hydrate-bearing deep-water channel-levee system in abyssal Gulf of Mexico: Levee growth and deformation. AAPG (Am. Assoc. Pet. Geol.) Bull. 2020, 104, 1921–1944. [Google Scholar] [CrossRef]
- Ewa, B.; Thomas, R.; Klaus, W.; Wolf, R.; Matthisa, H.; Christian, H. 3-D basin-scale reconstruction of natural gas hydrate system of the Green Canyon, Gulf of Mexico. Geochem. Geophys. Geosyst. 2017, 18, 1959–1985. [Google Scholar] [CrossRef]
- Yang, S.X.; Zhang, H.Q.; Wu, N.Y.; Su, X.; Schultheiss, P.; Holland, M. High concentration hydrate in disseminated forms obtained in Shenhu area, north slope of south China sea. In Proceedings of the 6th ICGH, Vancouver, BC, Canada, 6–10 July 2008. [Google Scholar]
- Wu, N.Y.; Yang, S.X.; Zhang, H.Q.; Liang, J.Q.; Wang, H.B.; Lu, J.A. Gas hydrate system of Shenhu area, Northern South China Sea: Geochemical results. J. Geol. Res. 2011, 2011, 370298. [Google Scholar] [CrossRef]
- Liu, C.L.; Ye, Y.G.; Meng, Q.G.; He, X.L.; Lu, H.L.; Zhang, J.; Liu, J.; Yang, S.X. The characteristics of gas hydrates recovered from Shenhu area in the South China Sea. Mar. Geol. 2012, 307–310, 22–27. [Google Scholar] [CrossRef]
- Jiang, H.; Su, M.; Lei, X.H.; Kuang, Z.G.; Wu, N.Y.; Liu, L.H.; Yang, R. Distribution of fine-grained turbidites on canyon ridges in the Shenhu area of northern South China Sea and its implications. Mar. Geol. Quat. Geol. 2018, 38, 52–62, (In Chinese with English Abstract). [Google Scholar]
- Chen, F.; Su, X.; Lu, H.F.; Zhou, Y.; Zhang, C. Relations between Biogenic component (foraminifera) and highly saturated hydrates distribution from Shenhu area, northern South China Sea. J. China Univ. Geosci. 2013, 38, 907–915, (In Chinese with English Abstract). [Google Scholar] [CrossRef]
- Lei, G.; Liao, Q.Z.; Patil, S.; Yang, Z. Effect of clay content on permeability behavior of argillaceous porous media under stress dependence: A theoretical and experimental work. J. Pet. Sci. Eng. 2019, 179, 787–795. [Google Scholar] [CrossRef]
- Motoi, O.; Kiyofumi, S.; Jun, Y.; Akira, K.; Masato, K.; Yoshihiro, K.; Michihiro, M.; Yusuke, J.; Jiro, N.; Norio, T. Lithological properties of natural gas hydrate–bearing sediments in pressure-cores recovered from the Krishna-Godavari Basin. Mar. Pet. Geol. 2019, 108, 439–470. [Google Scholar] [CrossRef]
- Zhang, W.; Liang, J.Q.; Lu, J.A.; Wei, J.G.; Su, P.B.; Fang, Y.X.; Guo, Y.Q.; Yang, S.X.; Zhang, G.X. Accumulation features and mechanisms of high saturation natural gas hydrate in Shenhu Area, northern South China Sea. Pet. Explor. Dev. 2017, 44, 708–719. [Google Scholar] [CrossRef]
- Sun, J.X.; Zhang, L.; Ning, F.L.; Lei, H.W.; Liu, T.L.; Hu, G.W.; Lu, H.L.; Lu, J.A.; Liu, C.L.; Jiang, G.S.; et al. Production potential and stability of hydrate-bearing sediments at the site GMGS3-W19 in the South China Sea: A preliminary feasibility study. Mar. Pet. Geol. 2017, 86, 447–473. [Google Scholar] [CrossRef]
- Cai, J.C.; Xia, Y.X.; Lu, C.; Bian, H.; Zou, S.M. Creeping microstructure and fractal permeability model of natural gas hydrate reservoir. Mar. Pet. Geol. 2020, 115, 104282. [Google Scholar] [CrossRef]
- Yu, L.; Zhang, L.; Zhang, R.; Ren, S.R. Assessment of natural gas production from hydrate-bearing sediments with unconsolidated argillaceous siltstones via a controlled sandout method. Energy 2018, 160, 654–667. [Google Scholar] [CrossRef]
- Yao, B.C.; Zeng, W.J.; Hayes, D.E. Special Report on China-US Cooperation in the South China Sea Geology; China University of Geosciences Press: Wuhan, China, 1994; pp. 51–52. [Google Scholar]
- Zhao, Z.X.; Sun, Z.; Wang, Z.F.; Sun, Z.P.; Liu, J.B.; Zhang, C.M. The high-resolution sedimentary filling in Qiongdongnan Basin, northern south China Sea. Mar. Geol. 2015, 361, 11–24. [Google Scholar] [CrossRef]
- Wei, J.G.; Liang, J.Q.; Lu, J.A.; Zhang, W.; He, Y.L. Characteristics and dynamics of gas hydrate systems in the northwestern South China Sea-Results of the fifth gas hydrate drilling expedition. Mar. Pet. Geol. 2019, 110, 287–298. [Google Scholar] [CrossRef]
- Ye, J.L.; Wei, J.G.; Liang, J.Q.; Lu, J.A.; Lu, H.L.; Zhang, W. Complex gas hydrate system in a gas chimney, South China Sea. Mar. Pet. Geol. 2019, 104, 29–39. [Google Scholar] [CrossRef]
- Liang, J.Q.; Zhang, W.; Lu, J.A.; Wei, J.G.; Kuang, Z.K.; He, Y.L. Geological occurrence and accumulation mechanism of natural gas hydrates in the eastern Qiongdongnan Basin of the South China Sea: Insights from site GMGS5-W9–2018. Mar. Geol. 2019, 418, 106042. [Google Scholar] [CrossRef]
- Meng, M.M.; Liang, J.Q.; Lu, J.A.; Zhang, W.; Kuang, Z.K.; Fang, Y.X.; He, Y.L.; Deng, W.; Huang, W. Quaternary deep-water sedimentary characteristics and their relationship with the gas hydrate accumulations in the Qiongdongnan Basin, Northwest South China Sea. Deep Sea Res. Part I 2021, 177, 103628. [Google Scholar] [CrossRef]
- Cook, A.E.; Goldberg, D.; Kleinberg, R.L. Fracture-controlled gas hydrate systems in the northern Gulf of Mexico. Mar. Pet. Geol. 2008, 25, 932–941. [Google Scholar] [CrossRef]
- Riedel, M.; Collett, T.S.; Kumar, P.; Sathe, A.V.; Cook, A. Seismic imaging of a fractured gas hydrate system in the Krishna–Godavari Basin offshore India. Mar. Pet. Geol. 2010, 27, 1476–1493. [Google Scholar] [CrossRef]
- Zhang, W.; Liang, J.Q.; Lu, J.A.; Meng, M.M.; He, Y.L.; Deng, W.; Feng, J.X. Characteristics and controlling mechanism of typical leakage gas hydrate reservoir forming system in the Qiongdongnan Basin, northern South China Sea. Nat. Gas Ind. 2020, 40, 90–99, (In Chinese with English Abstract). [Google Scholar] [CrossRef]
- He, Y.L.; Liang, J.Q.; Shi, W.Z.; Kuang, Z.K.; Deng, W.; Wang, R.; Xu, L.T.; Du, H. Influencing factors and accumulation modes of gas hydrate in the South low uplift and its surrounding area of Qiongdongnan Basin. Earth Sci. 2021, 5, 1711–1727, (In Chinese with English Abstract). [Google Scholar] [CrossRef]
- Xie, Y.H.; Zhang, G.C.; Sun, Z.P.; Zeng, Q.; Zhao, Z.; Guo, S. Reservoir forming conditions and key exploration technologies of Lingshui 17–2 giant gas field in deepwater area of Qiongdongnan Basin. Petrol. Res. 2019, 4, 1–18. [Google Scholar] [CrossRef]
- Zhang, W.; Liang, J.Q.; Su, P.B.; Gong, Y.H.; Lin, L.; Liang, J.; Huang, W. Distribution and characteristics of mud diapirs, gas chimneys, and bottom simulating reflectors associated with hydrocarbon migration and gas hydrate accumulation in the Basin, northern slope of the South China Sea. Geol. J. 2018, 54, 3556–3573. [Google Scholar] [CrossRef]
- Chen, Z.G.; Jiang, T.; Kuang, Z.G.; Chen, C.; Xiong, P.F.; Chen, Y. Accumulation characteristics of gas hydrate-shallow gas symbiotic system in Qiongdongnan Basin. Earth Sci. 2022, 47, 1619–1634, (In Chinese with English Abstract). [Google Scholar] [CrossRef]
- Huang, W.; Zhang, W.; Liang, J.Q.; Shang, J.J.; Meng, M.M.; Shan, C.C. Comparative study of gas hydrate accumulation system in the Qiongdongnan Basin of the South China Sea and the Ulleung Basin of Korea. J. China Uni. Min. Tech. 2020, 50, 363–380, (In Chinese with English Abstract). [Google Scholar] [CrossRef]
- Milkov, A.V. Worldwide distribution of submarine mud volcanoes and associated gas hydrates. Mar. Geol. 2000, 167, 29–42. [Google Scholar] [CrossRef]
- Huang, S.Z.; Li, F.; Song, P.; Hu, B.; Sun, W.Y. Study on geophysical identification technology of ultra deep water and shallow gas reservoirs in Qiongdongnan Basin. Earth Sci. 2022, 339, 1–11, (In Chinese with English Abstract). [Google Scholar]
- Moridis, G.J.; Kowalsky, M.B.; Pruess, K. Depressurization-induced gas production from Class 1 hydrate deposits. SPE J. Res. Eva. Eng. 2007, 10, 458–481. [Google Scholar] [CrossRef]
- Zhu, J.T.; Deng, Y.; Guo, M.G.; Song, P.; Xiong, X.F.; Mao, X.F.; Li, F.; Huang, S.Z.; He, Y.; Ren, T. Mineralization conditions and accumulation pattern of the gas hydrate in Qiongdongnan basin floor plain. China Offshore Oil Gas 2020, 32, 10–19, (In Chinese with English Abstract). [Google Scholar]
- Xue, K.P.; Liu, Y.; Yu, T.; Yang, L.; Zhao, J.F.; Song, Y.C. Numerical simulation of gas hydrate production in shenhu area using depressurization: The effect of reservoir permeability heterogeneity. Energy 2023, 271, 126948. [Google Scholar] [CrossRef]
- Wei, R.P.; Xia, Y.Q.; Wang, Z.F.; Li, Q.P.; Lv, X.; Leng, S.D.; Zhang, L.X.; Zhang, Y.; Xiao, B.; Yang, S.X.; et al. Long-term numerical simulation of a joint production of gas hydrate and underlying shallow gas through dual horizontal wells in the South China Sea. Appl. Energy 2022, 320, 119235. [Google Scholar] [CrossRef]
- Zhao, E.M.; Hou, J.; Du, Q.J.; Liu, Y.G.; JI, Y.K.; Bai, Y.J. Numerical modeling of gas production from methane hydrate deposits using low-frequency electrical heating assisted depressurization method. Fuel 2021, 290, 120075. [Google Scholar] [CrossRef]
- Meret, S.; Al-Raoush, R.I.; Jung, J.W.; Alshibli, K.A. Comprehensive literature review on CH4-CO2 replacement in microscale porous media. J. Pet. Sci. Eng. 2018, 178, 48–62. [Google Scholar] [CrossRef]
- Gajanayake, S.; Gamage, R.P.; Wanniarachchige, P.; Zhang, D. Quantification of CO2 replacement in methane gas hydrates: A molecular dynamics perspective. J. Nat. Gas. Eng. 2022, 98, 104396. [Google Scholar] [CrossRef]
- Li, S.X.; Li, S.; Zhang, R.Y.; Li, Q.P.; Pang, W.X. Strategies for gas production from Class 2 hydrate accumulations by depressurization. Fuel 2021, 286, 119380. [Google Scholar] [CrossRef]
- Moridis, G.J.; Reagan, M.T. Estimating the upper limit of gas production from Class 2 hydrate accumulations in the permafrost: 1. Concepts, system description, and the production base case. J. Pet. Sci. Eng. 2011, 76, 194–204. [Google Scholar] [CrossRef]
- Yang, S.W.; Lang, X.M.; Wang, Y.H.; Wen, Y.G.; Fan, S.S. Numerical simulation of Class 3 hydrate reservoirs exploiting using horizontal well by depressurization and thermal co-stimulation. Energy Convers. Manag. 2014, 77, 298–305. [Google Scholar] [CrossRef]
- Moridis, G.J.; Sloan, E.D. Gas production potential of disperse low-saturation hydrate accumulations in oceanic sediments. Energy Convers. Manag. 2007, 48, 1834–1849. [Google Scholar] [CrossRef]
- Uddin, M.; Coombe, D.; Law, D.; Gunter, B. Numerical studies of gas hydrate formation and decomposition in a geological reservoir. In Proceedings of the SPE Gas Technology Symposium, Calgary, AB, Canada, 15–18 May 2006. [Google Scholar] [CrossRef]
- Vysniauskas, A.; Bishnoi, P.R. A kinetic study of methane hydrate formation. Chem. Eng. Sci. 1983, 38, 1061–1072. [Google Scholar] [CrossRef]
- Kim, H.C.; Bishnoi, P.R.; Heidemann, R.A.; Rizvi, S.S.H. Kinetics of methane hydrate decomposition. Chem. Eng. Sci. 1987, 42, 1645–1653. [Google Scholar] [CrossRef]
- Carman, P.C. Fluid flow through granular beds. Trans. Inst. Chem. Eng. 1937, 15, 150–166. [Google Scholar] [CrossRef]


Disclaimer/Publisher’s Note: The statements, opinions and data contained in all publications are solely those of the individual author(s) and contributor(s) and not of MDPI and/or the editor(s). MDPI and/or the editor(s) disclaim responsibility for any injury to people or property resulting from any ideas, methods, instructions or products referred to in the content. |
© 2023 by the authors. Licensee MDPI, Basel, Switzerland. This article is an open access article distributed under the terms and conditions of the Creative Commons Attribution (CC BY) license (https://creativecommons.org/licenses/by/4.0/).