Model-Driven Membrane Electrode Assembly Design for High-Performing Open-Cathode Polymer Electrolyte Membrane Fuel Cells


Abstract
:
1. Introduction
2. Methodology
3. Results and Discussion
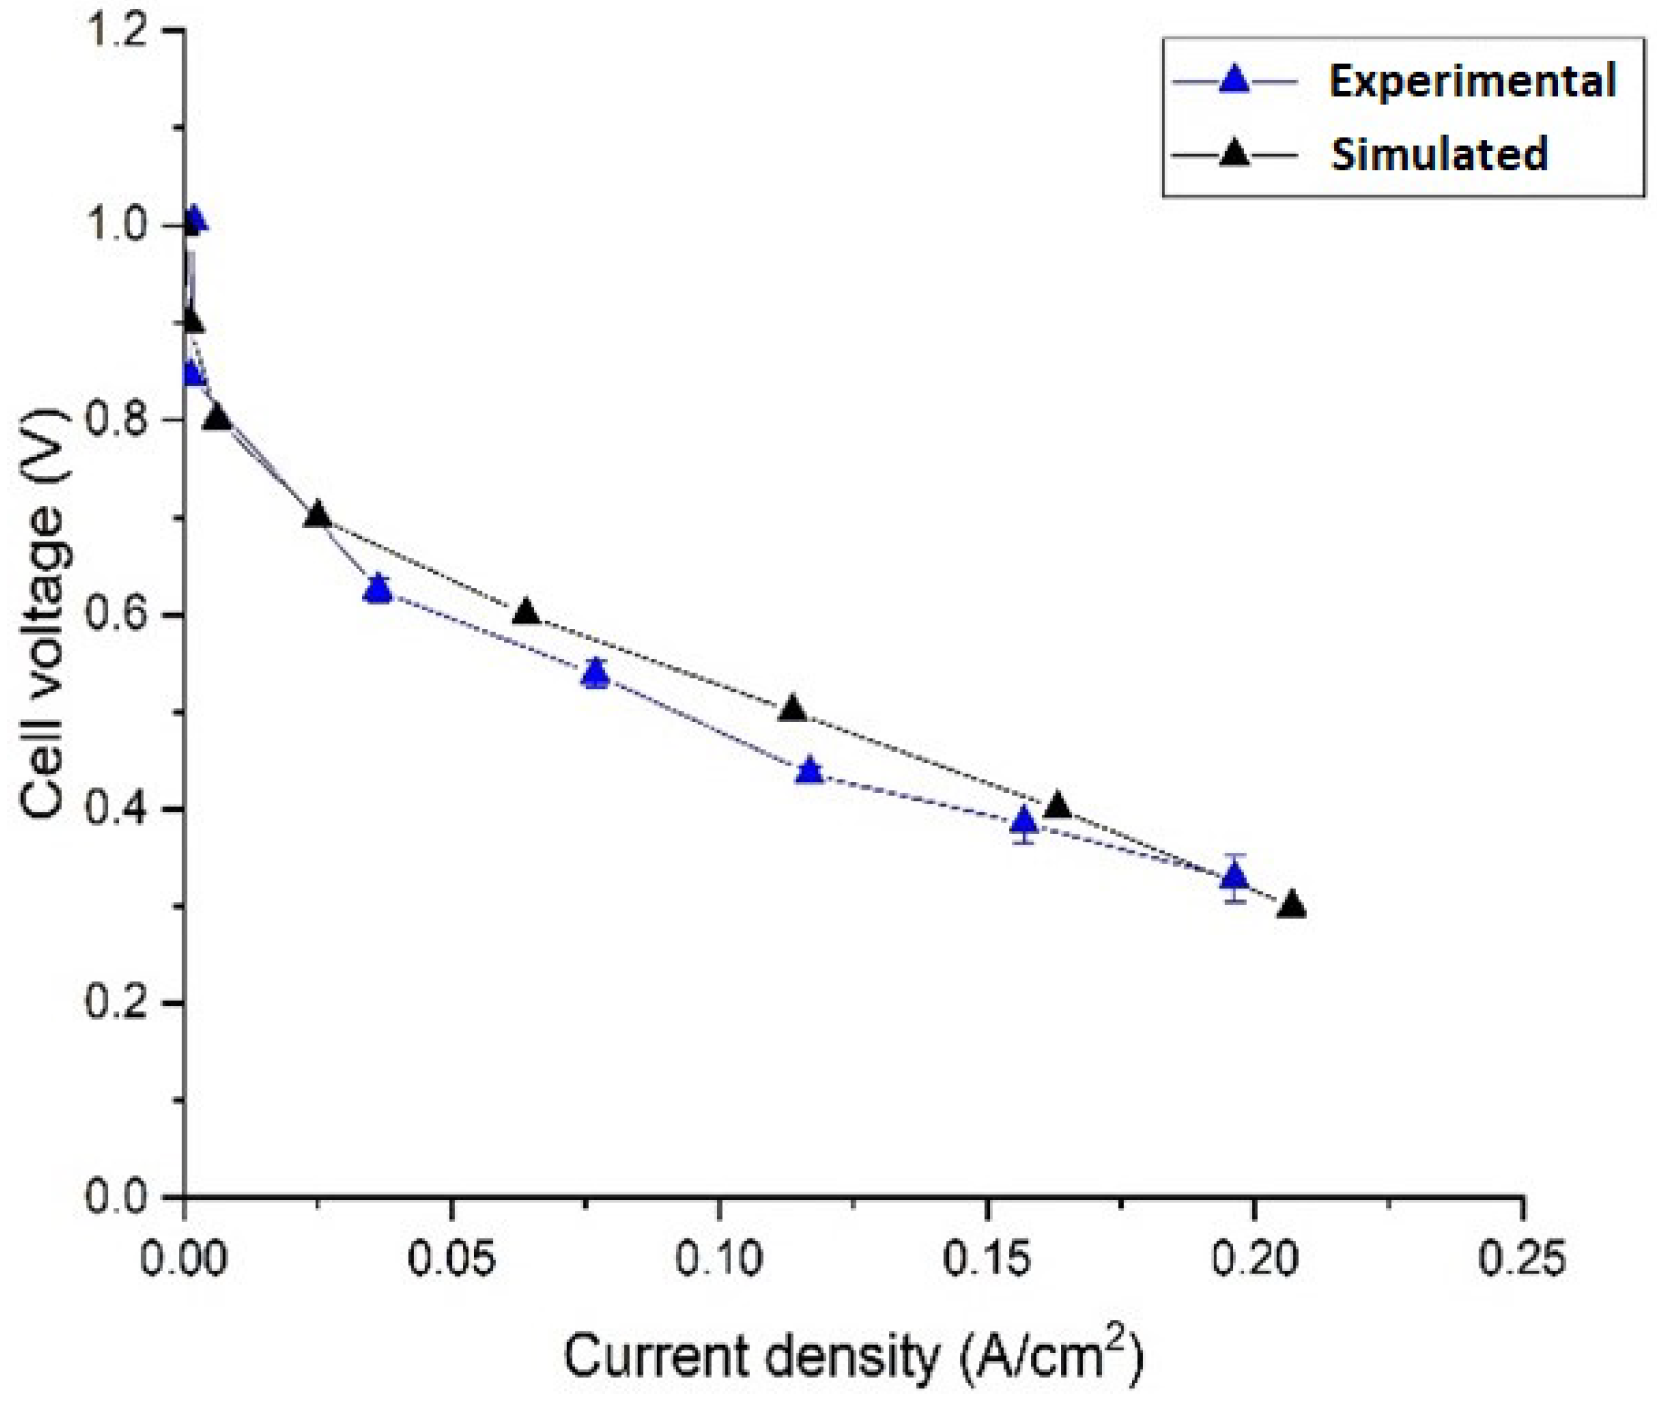
3.1. Model Validation
3.2. Parametric Results
3.2.1. PEM Parametric Design
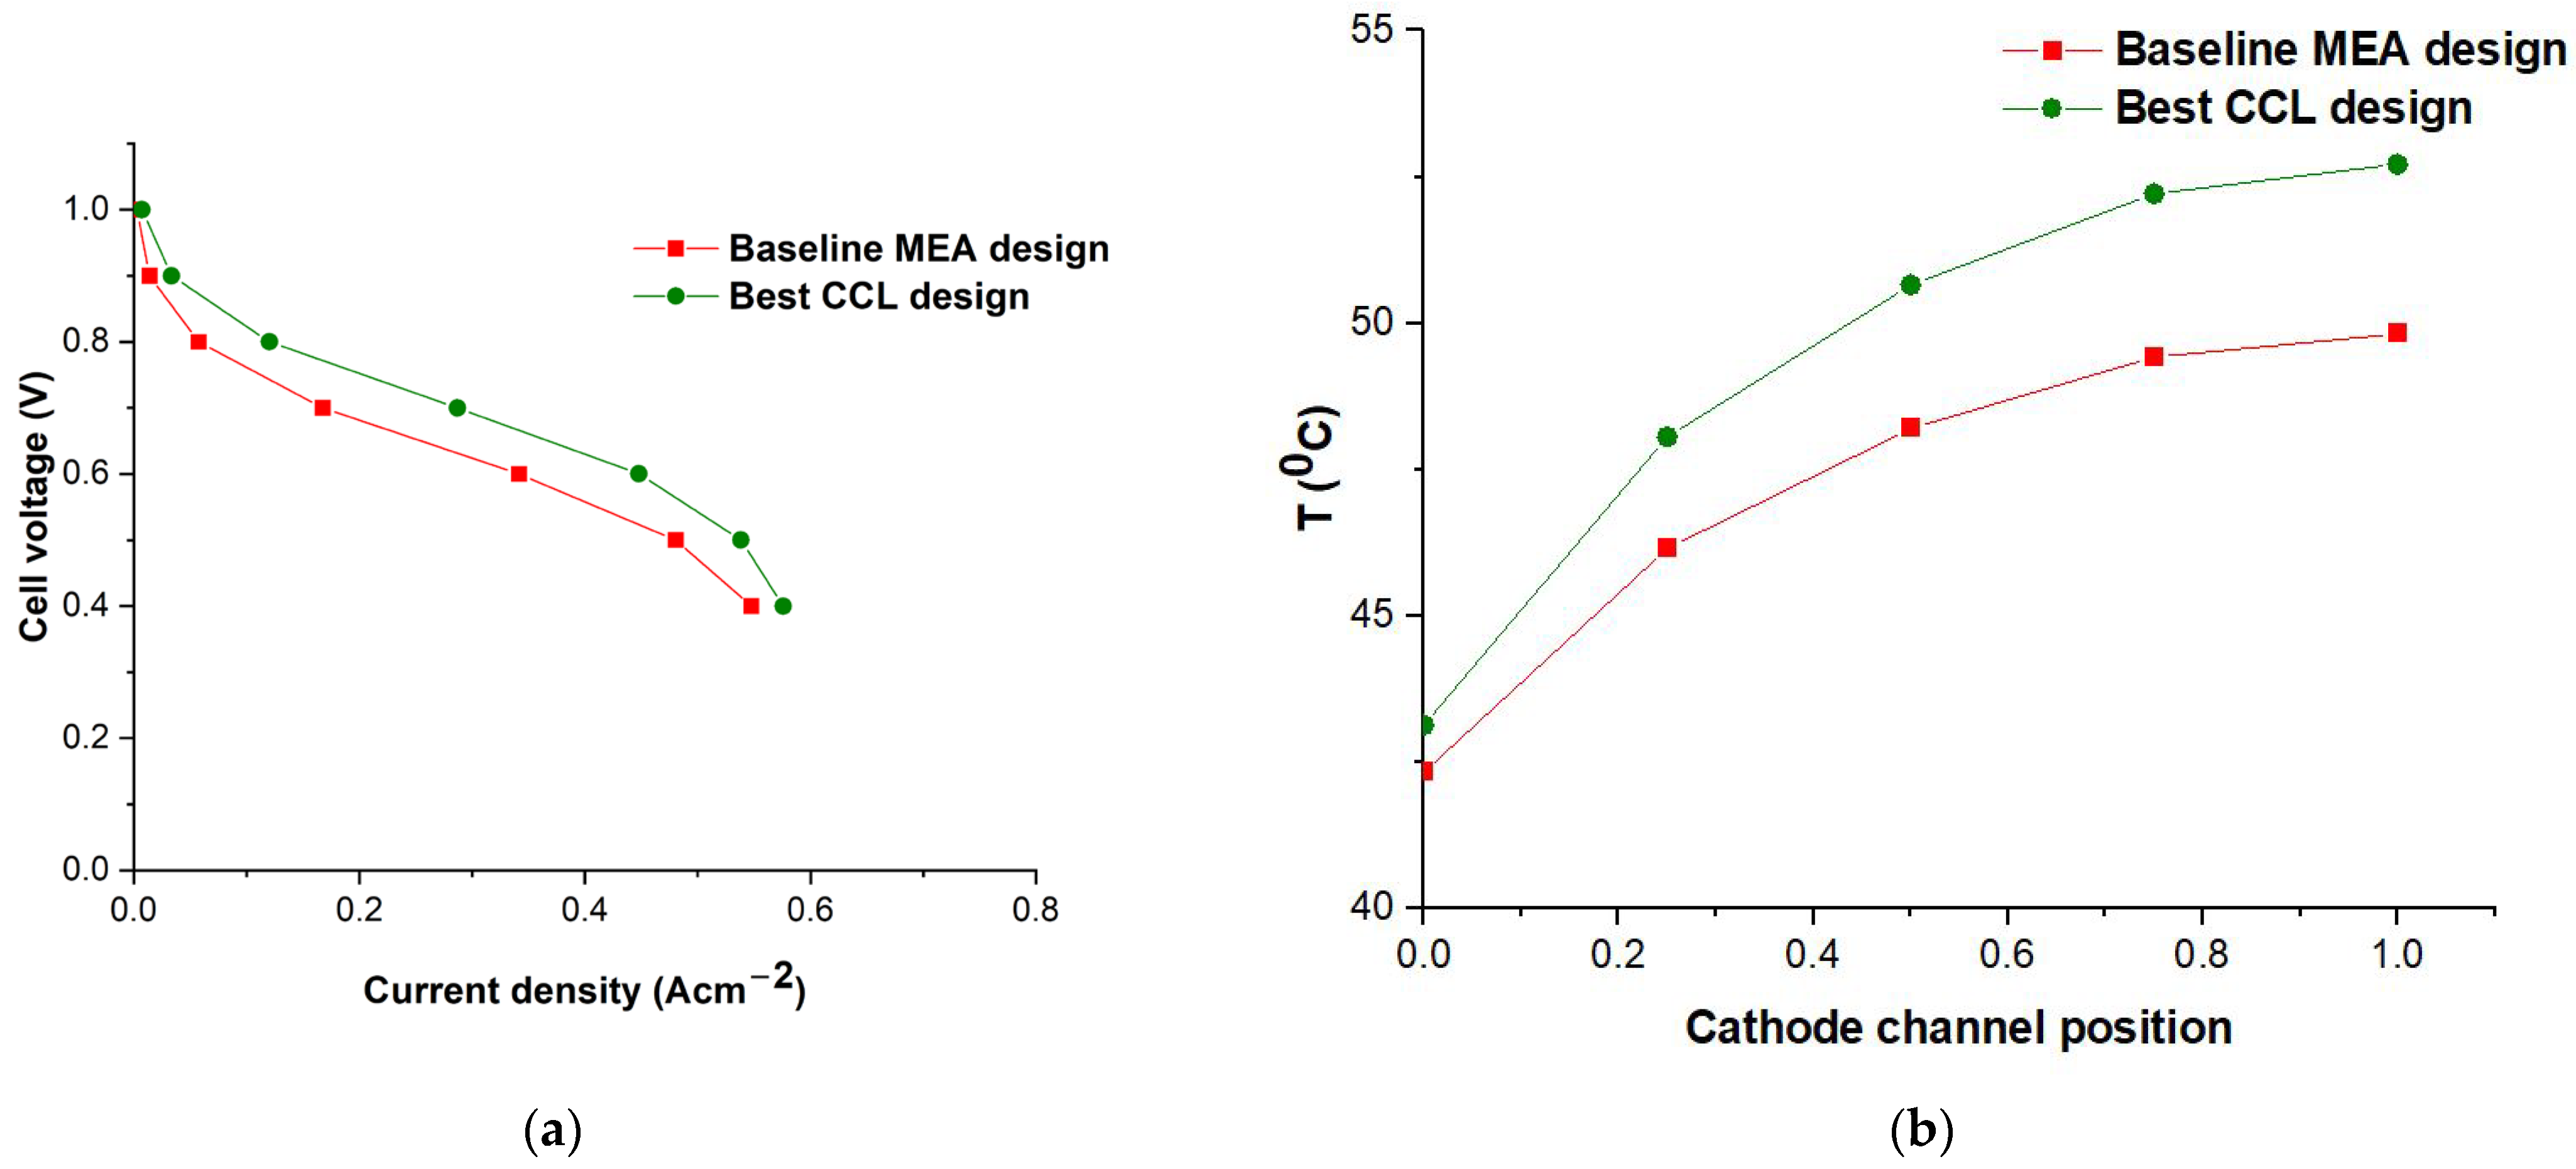
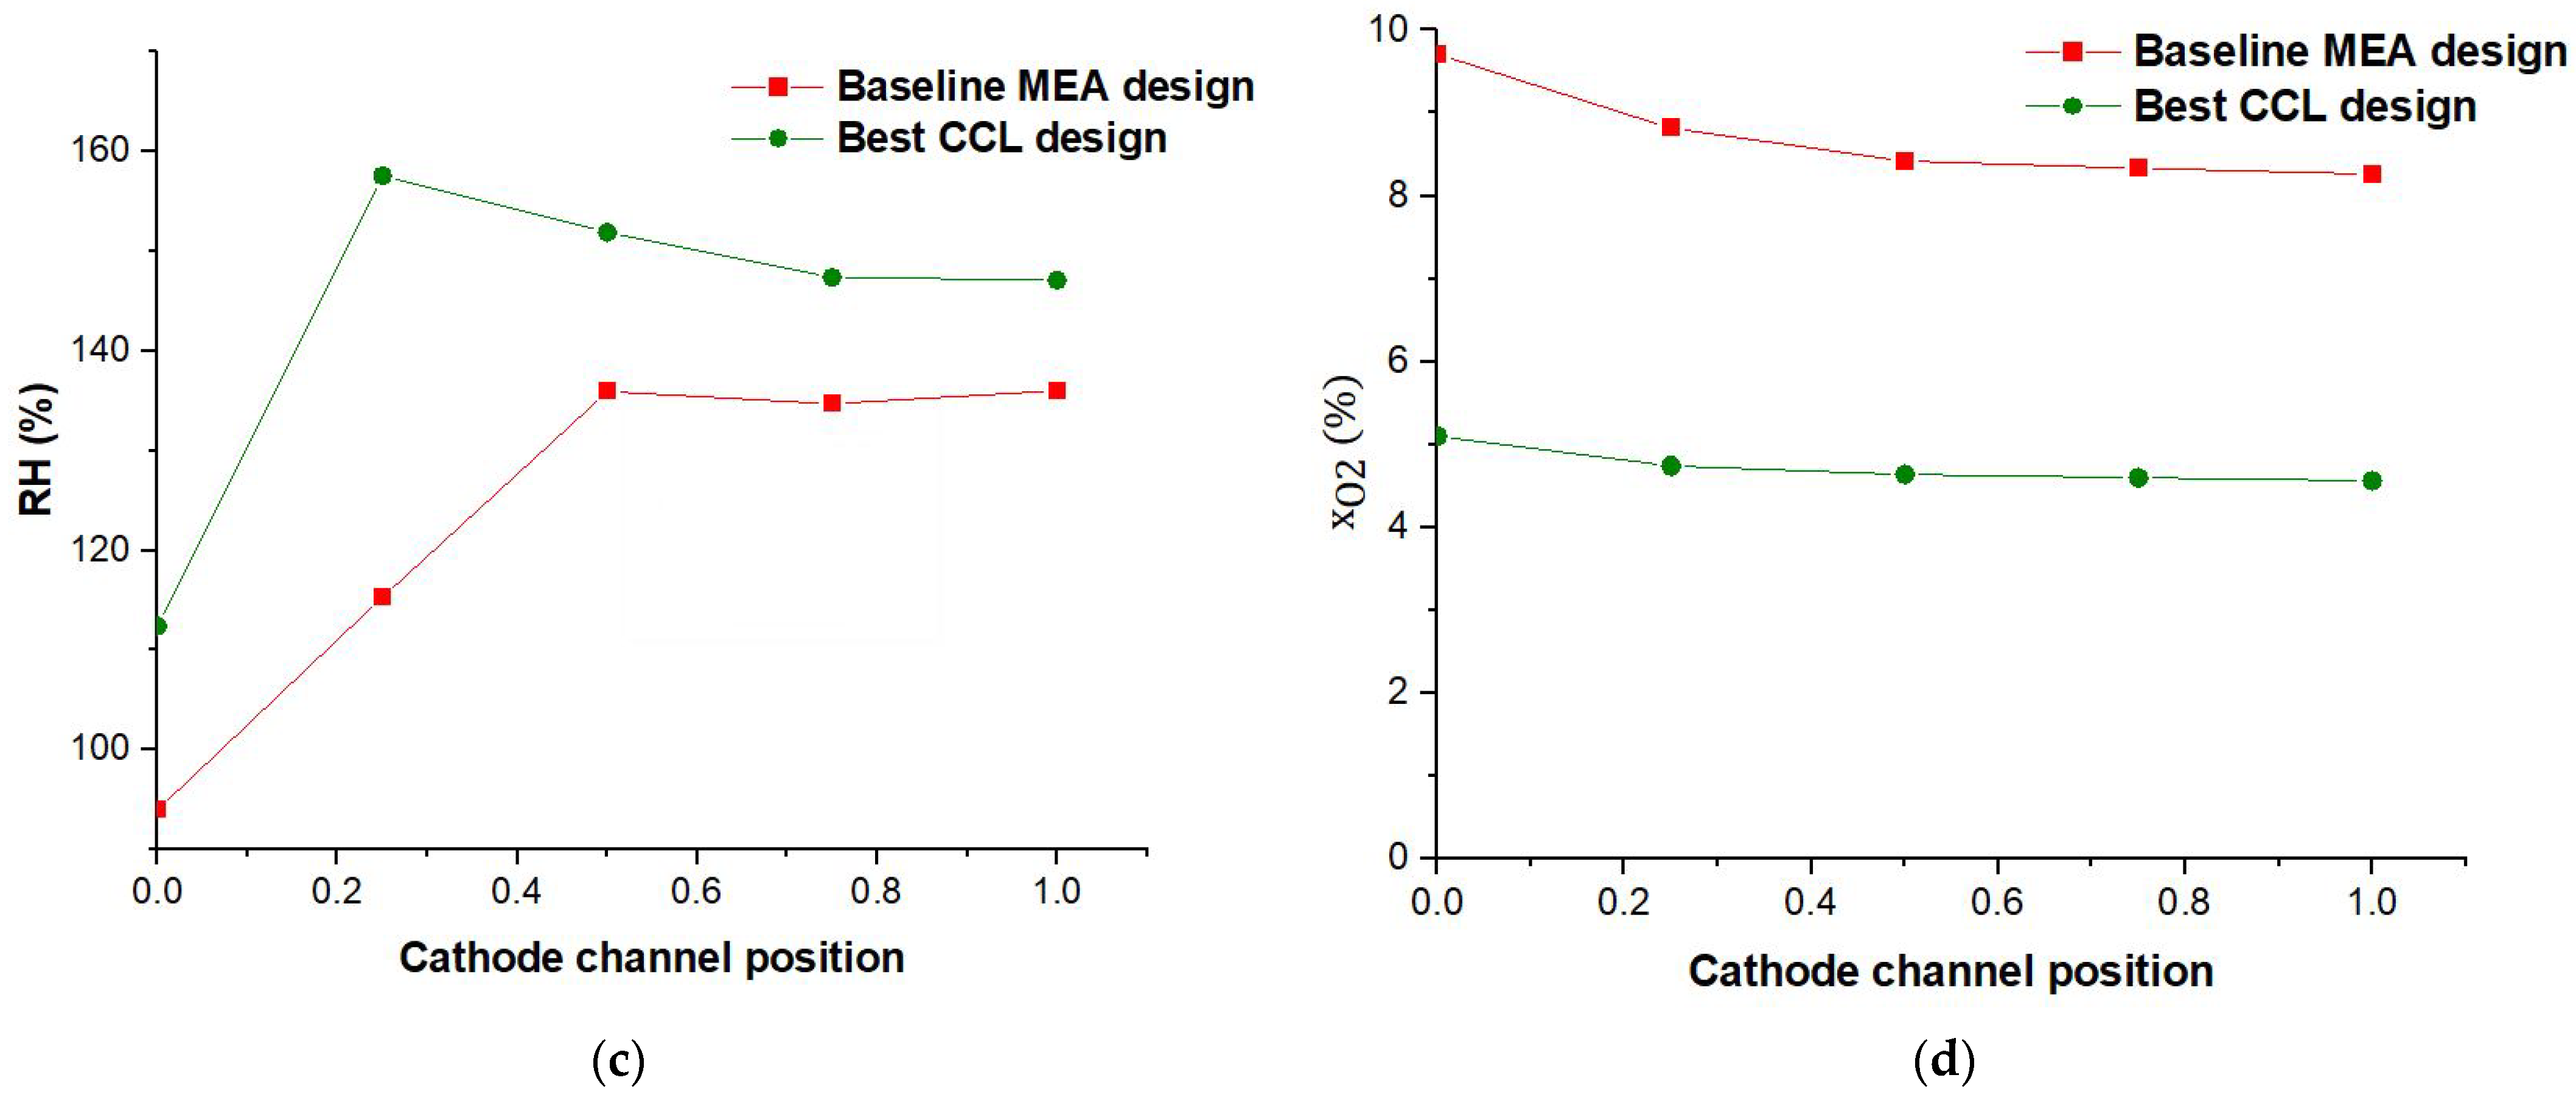
3.2.2. Cathode CL Parametric Design
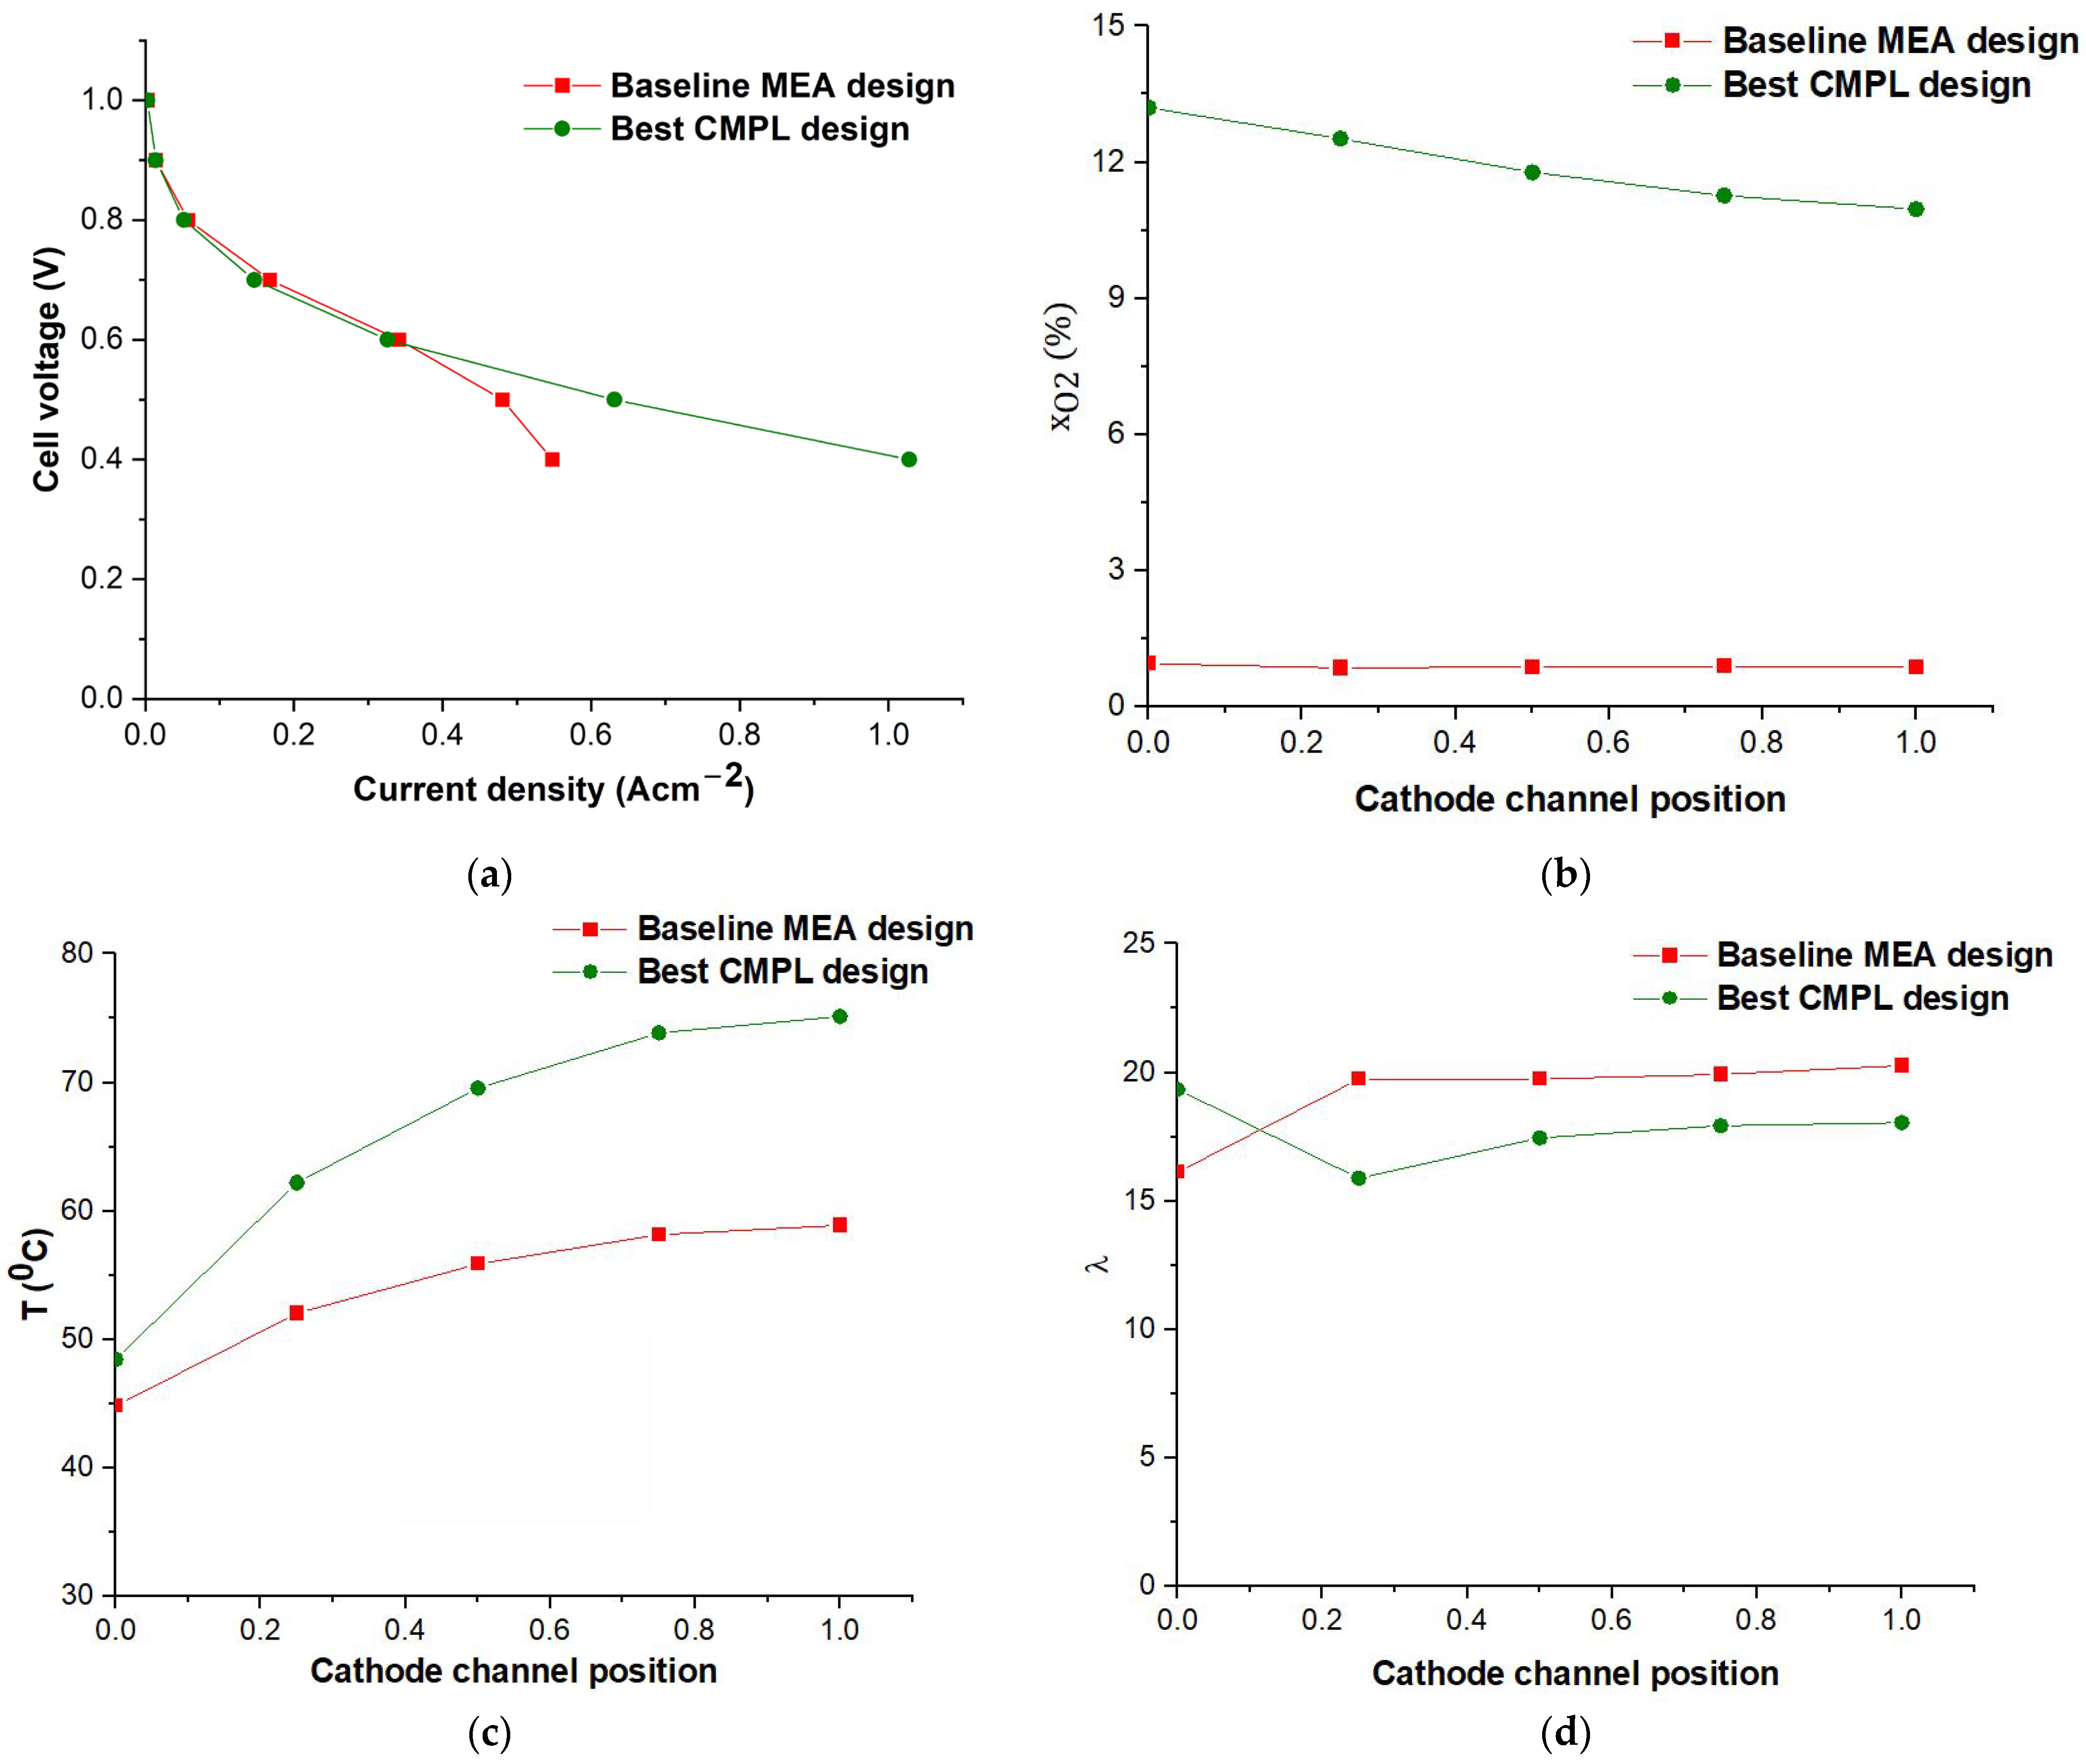
3.2.3. Cathode MPL Parametric Design
3.3. DoE Analysis
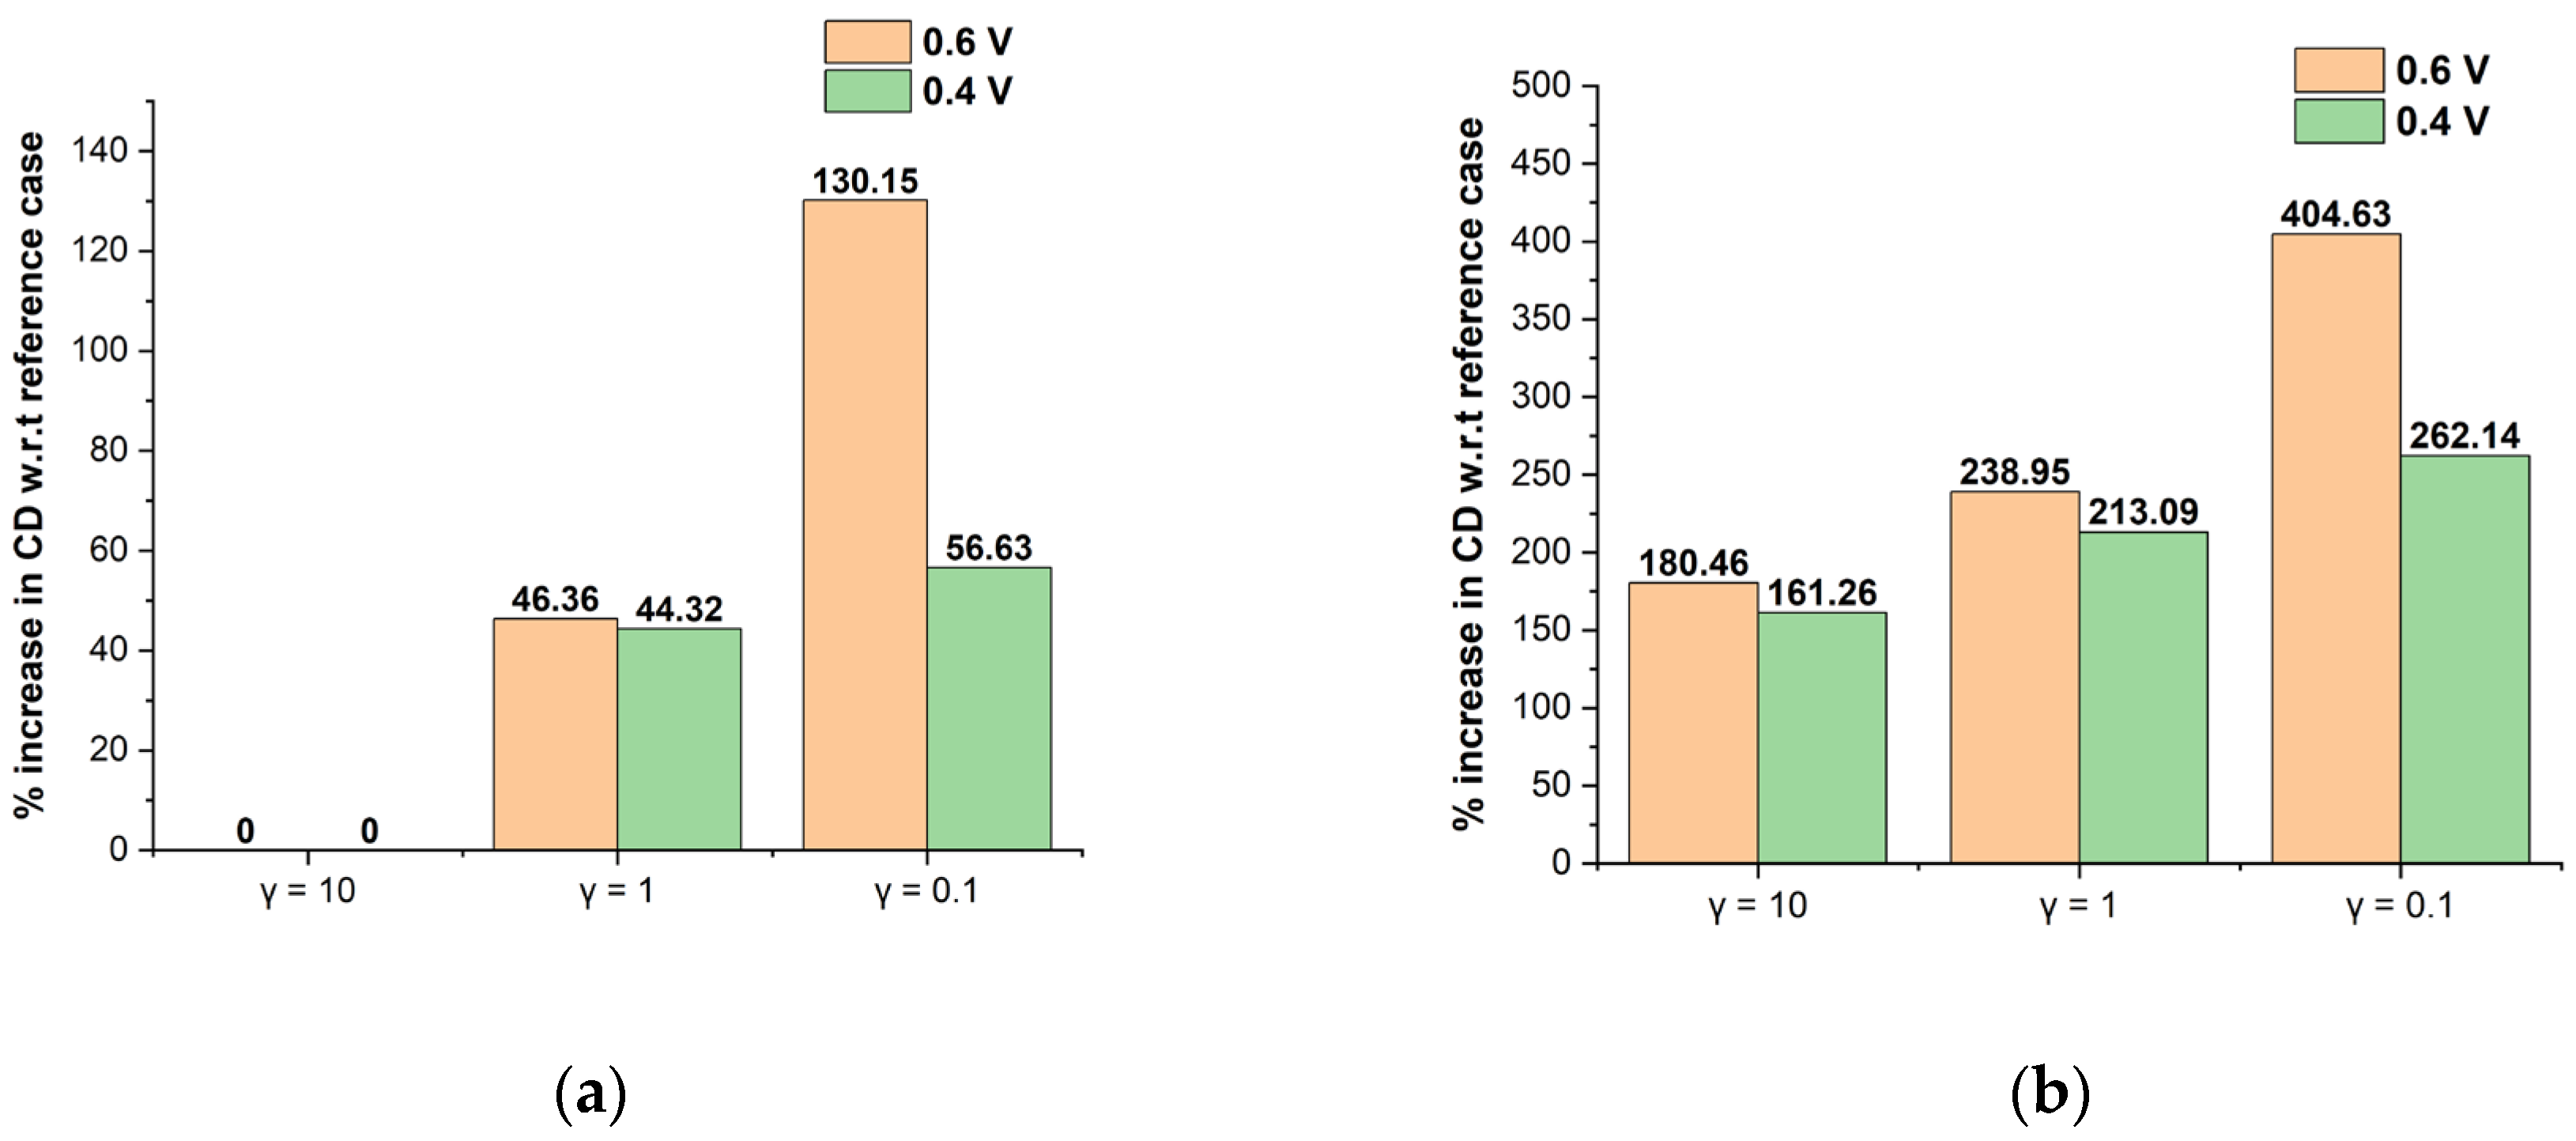
3.4. γ Interaction with Optimized MEA Design
4. Conclusions
Author Contributions
Funding
Data Availability Statement
Conflicts of Interest
Nomenclature
| Vapour phase saturation | |
| Active specific surface area (m−1) | |
| Active electrochemical area (m2) | |
| Molar concentration of ith species (mol m−3) | |
| D | Gas phase diffusivity (m s−1) |
| F | Faraday’s constant (C mol−1) |
| j | Current density (A m−2) |
| Platinum loading (g m−2) | |
| Percentage platinum on carbon (%) | |
| P | Pressure (Pa) |
| R | Gas constant (J mol−1 K−1) |
| S | Source |
| ti | Thickness of ith domain (m) |
| T | Temperature (K) |
| Velocity vector (m s−1) | |
| V | Volume (m3) |
| Volumetric flow rate (m3 s−1) | |
| W | Weight (kg) |
| Ionomer loading (%) | |
| Mole fraction of oxygen (%) | |
| Greek symbols | |
| αi | Charge transfer coefficient at ith electrode |
| Water sorption/desorption rate constant (s−1) | |
| εi | Volume fraction of ith domain |
| Overpotential (V) | |
| λ | Water content |
| Effective electrolyte conductivity of ith domain (S m−1) | |
| Σ | Summation |
| ϕi | Potential at ith electrode (V) |
| Acronyms | |
| 3D | Three dimensional |
| ANOVA | Analysis of variance |
| BC | Boundary condition |
| BPP | Bi-polar plate |
| CL | Catalyst layer |
| CCL | Cathode catalyst layer |
| CD | Current density |
| CMPL | Cathode microporous layer |
| DoE | Design of experiments |
| FF | Flow field |
| GDL | Gas diffusion layer |
| H | High |
| L | Low |
| MEA | Membrane electrode assembly |
| MPL | Microporous layer |
| MT | Mass transfer |
| ORR | Oxygen reduction reaction |
| PEM | Polymer electrolyte membrane |
| PEMFC | Polymer electrolyte membrane fuel cell |
| Pt | Platinum |
| Pt/C | Platinum on carbon |
| RH | Relative humidity |
| VLB | Voltage loss breakdown |
| Subscripts | |
| a | Anode |
| c | Cathode |
| C | Carbon |
| eff | Effective |
| in | Inlet |
| ion | Ionomer |
| m | Membrane |
| mol | Molar |
| ohm | Ohmic |
| ref | Reference |
| s | Solid |
| sat | Saturation |
| v | Volumetric |
References
- Çabukoglu, E.; Georges, G.; Küng, L.; Pareschi, G.; Boulouchos, K. Fuel cell electric vehicles: An option to decarbonize heavy-duty transport? Results from a Swiss case-study. Transp. Res. Part D Transp. Environ. 2019, 70, 35–48. [Google Scholar] [CrossRef]
- Eriksson, E.; Gray, E. Optimization and integration of hybrid renewable energy hydrogen fuel cell energy systems—A critical review. Appl. Energy 2017, 202, 348–364. [Google Scholar] [CrossRef]
- Ahmadi, P.; Kjeang, E. Comparative life cycle assessment of hydrogen fuel cell passenger vehicles in different Canadian provinces. Int. J. Hydrogen Energy 2015, 40, 12905–12917. [Google Scholar] [CrossRef]
- Wee, J.-H. Contribution of fuel cell systems to CO2 emission reduction in their application fields. Renew. Sustain. Energy Rev. 2010, 14, 735–744. [Google Scholar] [CrossRef]
- Wee, J.-H. Carbon dioxide emission reduction using molten carbonate fuel cell systems. Renew. Sustain. Energy Rev. 2014, 32, 178–191. [Google Scholar] [CrossRef]
- Chan, C.C. The State of the Art of Electric, Hybrid, and Fuel Cell Vehicles. Proc. IEEE 2007, 95, 704–718. [Google Scholar] [CrossRef]
- Meyer, Q.; Himeur, A.; Ashton, S.; Curnick, O.; Clague, R.; Reisch, T.; Adcock, P.; Shearing, P.R.; Brett, D.J. System-level electro-thermal optimisation of air-cooled open-cathode polymer electrolyte fuel cells: Air blower parasitic load and schemes for dynamic operation. Int. J. Hydrogen Energy 2015, 40, 16760–16766. [Google Scholar] [CrossRef]
- Shahsavari, S.; Bahrami, M.; Kjeang, E. Computational Analysis of Heat Transfer in Air-Cooled Fuel Cells. In Proceedings of the ASME 2011 9th International Conference on Fuel Cell Science, Engineering and Technology Collocated with ASME 2011 5th International Conference on Energy Sustainability, FUELCELL 2011, Washington, DC, USA, 7–10 August 2011; pp. 799–808. [Google Scholar]
- Andisheh-Tadbir, M.; Desouza, A.; Bahrami, M.; Kjeang, E. Cell level modeling of the hygrothermal characteristics of open cathode polymer electrolyte membrane fuel cells. Int. J. Hydrogen Energy 2014, 39, 14993–15004. [Google Scholar] [CrossRef]
- Wang, Y.; Diaz, D.F.R.; Chen, K.S.; Wang, Z.; Adroher, X.C. Materials, technological status, and fundamentals of PEM fuel cells—A review. Mater. Today 2020, 32, 178–203. [Google Scholar] [CrossRef]
- Olabi, A.; Wilberforce, T.; Abdelkareem, M.A. Fuel cell application in the automotive industry and future perspective. Energy 2020, 214, 118955. [Google Scholar] [CrossRef]
- Mench, M.M. Fuel Cell Engines; John Wiley & Sons: Hoboken, NJ, USA, 2008. [Google Scholar]
- Kim, B.J.; Kim, M.S. Studies on the cathode humidification by exhaust gas recirculation for PEM fuel cell. Int. J. Hydrogen Energy 2012, 37, 4290–4299. [Google Scholar] [CrossRef]
- Kolde, J.A.; Bahar, B.; Wilson, M.S.; Zawodzinski, T.A.; Gottesfeld, S. Advanced Composite Polymer Electrolyte Fuel Cell Membranes. ECS Proc. Vol. 1995, 1995, 193–201. [Google Scholar] [CrossRef]
- Liu, W.; Suzuki, T.; Mao, H.; Schmiedel, T. Development of Thin, Reinforced PEMFC Membranes through Understanding of Structure-Property-Performance Relationships. ECS Trans. 2013, 50, 51–64. [Google Scholar] [CrossRef]
- Serov, A.; Artyushkova, K.; Niangar, E.; Wang, C.; Dale, N.; Jaouen, F.; Sougrati, M.-T.; Jia, Q.; Mukerjee, S.; Atanassov, P. Nano-structured non-platinum catalysts for automotive fuel cell application. Nano Energy 2015, 16, 293–300. [Google Scholar] [CrossRef]
- Thompson, S.T.; Papageorgopoulos, D. Platinum group metal-free catalysts boost cost competitiveness of fuel cell vehicles. Nat. Catal. 2019, 2, 558–561. [Google Scholar] [CrossRef]
- Nanadegani, F.S.; Lay, E.N.; Sunden, B. Effects of an MPL on water and thermal management in a PEMFC. Int. J. Energy Res. 2019, 43, 274–296. [Google Scholar] [CrossRef]
- Yan, S.; Yang, M.; Sun, C.; Xu, S. Liquid Water Characteristics in the Compressed Gradient Porosity Gas Diffusion Layer of Proton Exchange Membrane Fuel Cells Using the Lattice Boltzmann Method. Energies 2023, 16, 6010. [Google Scholar] [CrossRef]
- Blanco, M.; Wilkinson, D.P. Investigation of the effect of microporous layers on water management in a proton exchange membrane fuel cell using novel diagnostic methods. Int. J. Hydrogen Energy 2014, 39, 16390–16404. [Google Scholar] [CrossRef]
- Nanadegani, F.S.; Lay, E.N.; Sunden, B. Computational analysis of the impact of a micro porous layer (MPL) on the characteristics of a high temperature PEMFC. Electrochim. Acta 2020, 333, 135552. [Google Scholar] [CrossRef]
- Kandlikar, S.G.; Lu, Z. Thermal management issues in a PEMFC stack—A brief review of current status. Appl. Therm. Eng. 2009, 29, 1276–1280. [Google Scholar] [CrossRef]
- Pourrahmani, H.; Moghimi, M.; Siavashi, M. Thermal management in PEMFCs: The respective effects of porous media in the gas flow channel. Int. J. Hydrogen Energy 2019, 44, 3121–3137. [Google Scholar] [CrossRef]
- Zhang, G.; Kandlikar, S.G. A critical review of cooling techniques in proton exchange membrane fuel cell stacks. Int. J. Hydrogen Energy 2012, 37, 2412–2429. [Google Scholar] [CrossRef]
- Sasmito, A.; Lum, K.; Birgersson, E.; Mujumdar, A. Computational study of forced air-convection in open-cathode polymer electrolyte fuel cell stacks. J. Power Sources 2010, 195, 5550–5563. [Google Scholar] [CrossRef]
- Wasselynck, G.; Auvity, B.; Olivier, J.-C.; Trichet, D.; Josset, C.; Maindru, P. Design and testing of a fuel cell powertrain with energy constraints. Energy 2012, 38, 414–424. [Google Scholar] [CrossRef]
- Tadbir, M.A.; Shahsavari, S.; Bahrami, M.; Kjeang, E. Thermal Management of an Air-Cooled PEM Fuel Cell: Cell Level Simulation. In Proceedings of the ASME 2012 10th International Conference on Fuel Cell Science, Engineering and Technology Collocated with the ASME 2012 6th International Conference on Energy Sustainability, FUELCELL 2012, San Diego, CA, USA, 23–26 July 2012; pp. 453–459. [Google Scholar]
- Liu, W.; Wan, L.; Liu, J.; Zhao, M.; Zou, Z. Performance improvement of the open-cathode proton exchange membrane fuel cell by optimizing membrane electrode assemblies. Int. J. Hydrogen Energy 2015, 40, 7159–7167. [Google Scholar] [CrossRef]
- Santarosa, D.; Pinto, D.; Silva, V.; Silva, R.; Rangel, C. High performance PEMFC stack with open-cathode at ambient pressure and temperature conditions. Int. J. Hydrogen Energy 2007, 32, 4350–4357. [Google Scholar] [CrossRef]
- Barreras, F.; López, A.M.; Lozano, A.; Barranco, J.E. Experimental study of the pressure drop in the cathode side of air-forced Open-cathode proton exchange membrane fuel cells. Int. J. Hydrogen Energy 2011, 36, 7612–7620. [Google Scholar] [CrossRef]
- Kreesaeng, S.; Chalermsinsuwan, B.; Piumsomboon, P. Effect of Channel Designs on Open-Cathode PEM Fuel Cell Performance: A Computational Study. Energy Procedia 2015, 79, 733–745. [Google Scholar] [CrossRef]
- Zhao, C.; Xing, S.; Chen, M.; Liu, W.; Wang, H. Optimal design of cathode flow channel for air-cooled PEMFC with open cathode. Int. J. Hydrogen Energy 2020, 45, 17771–17781. [Google Scholar] [CrossRef]
- Kiattamrong, S.; Sripakagorn, A. Effects of the Geometry of the Air Flowfield on the Performance of an Open-Cathode PEMFC—Transient Load Operation; Elsevier: Amsterdam, The Netherlands, 2015; Volume 79. [Google Scholar]
- Thomas, S.; Bates, A.; Park, S.; Sahu, A.; Lee, S.C.; Son, B.R.; Kim, J.G.; Lee, D.-H. An experimental and simulation study of novel channel designs for open-cathode high-temperature polymer electrolyte membrane fuel cells. Appl. Energy 2016, 165, 765–776. [Google Scholar] [CrossRef]
- Thomas, S.; Kwon, O.; Lee, S.C.; Park, S.; Choi, G.; Choi, J. Optimized Flow Distribution for Enhancing Temperature Uniformity across an Open Cathode PEM Fuel Cell Stack. ECS Trans. 2013, 58, 243–249. [Google Scholar] [CrossRef]
- Sagar, A.; Chugh, S.; Sonkar, K.; Sharma, A.; Kjeang, E. A computational analysis on the operational behaviour of open-cathode polymer electrolyte membrane fuel cells. Int. J. Hydrogen Energy 2020, 45, 34125–34138. [Google Scholar] [CrossRef]
- Wu, B.; Li, B.; Liu, W.; Liu, J.; Zhao, M.; Yao, Y.; Gu, J.; Zou, Z. The performance improvement of membrane and electrode assembly in open-cathode proton exchange membrane fuel cell. Int. J. Hydrogen Energy 2013, 38, 10978–10984. [Google Scholar] [CrossRef]
- Meyer, Q.; Ronaszegi, K.; Pei-June, G.; Curnick, O.; Ashton, S.; Reisch, T.; Adcock, P.; Shearing, P.R.; Brett, D.J. Optimisation of air cooled, open-cathode fuel cells: Current of lowest resistance and electro-thermal performance mapping. J. Power Sources 2015, 291, 261–269. [Google Scholar] [CrossRef]
- Sagar, A.; Chugh, S.; Sharma, A.; Kjeang, E. Strategic ionomer design for high performing fuel cells with open cathode. Int. J. Hydrogen Energy 2022, 47, 1940–1946. [Google Scholar] [CrossRef]
- Omrani, R.; Shabani, B. Review of gas diffusion layer for proton exchange membrane-based technologies with a focus on unitised regenerative fuel cells. Int. J. Hydrogen Energy 2019, 44, 3834–3860. [Google Scholar] [CrossRef]
- Kitahara, T.; Nakajima, H.; Mori, K. Hydrophilic and hydrophobic double microporous layer coated gas diffusion layer for enhancing performance of polymer electrolyte fuel cells under no-humidification at the cathode. J. Power Sources 2012, 199, 29–36. [Google Scholar] [CrossRef]
- Atkinson, R.W.; Rodgers, J.A.; Hazard, M.W.; Stroman, R.O.; Gould, B.D. Influence of cathode gas diffusion media porosity on open-cathode fuel cells. J. Electrochem. Soc. 2018, 165, F1002–F1011. [Google Scholar] [CrossRef]
- Atkinson, R.W.; Hazard, M.W.; Rodgers, J.A.; Stroman, R.O.; Gould, B.D. Influence of Gas Diffusion Media Compression on Open-Cathode Fuel Cells. J. Electrochem. Soc. 2019, 166, F926–F934. [Google Scholar] [CrossRef]
- Shahsavari, S.; Desouza, A.; Bahrami, M.; Kjeang, E. Thermal analysis of air-cooled PEM fuel cells. Int. J. Hydrogen Energy 2012, 37, 18261–18271. [Google Scholar] [CrossRef]
- Navarro, A.; Gómez, M.; Daza, L.; Molina-García, A.; López-Cascales, J. Influence of the gas diffusion layer on the performance of an open cathode polymer electrolyte membrane fuel cell. Int. J. Hydrogen Energy 2022, 47, 7990–7999. [Google Scholar] [CrossRef]
- Meyer, Q.; Ashton, S.; Boillat, P.; Cochet, M.; Engebretsen, E.; Finegan, D.P.; Lu, X.; Bailey, J.J.; Mansor, N.; Abdulaziz, R.; et al. Effect of gas diffusion layer properties on water distribution across air-cooled, open-cathode polymer electrolyte fuel cells: A combined ex-situ X-ray tomography and in-operando neutron imaging study. Electrochim. Acta 2016, 211, 478–487. [Google Scholar] [CrossRef]
- Atkinson, R.W.; Garsany, Y.; Rodgers, J.A.; Hazard, M.W.; Stroman, R.O.; Gould, B.D. Influence of Cathode Catalyst Layer Ionomer on Air-Cooled, Open-Cathode Fuel Cells. ECS Trans. 2017, 80, 461–475. [Google Scholar] [CrossRef]
- Brèque, F.; Ramousse, J.; Dubé, Y.; Agbossou, K.; Adzakpa, P. Sensibility study of flooding and drying issues to the operating conditions in PEM Fuel Cells. Int. J. Energy Environ. 2010, 1, 1–20. [Google Scholar]
- Shin, S.-J.; Lee, J.-K.; Ha, H.-Y.; Hong, S.-A.; Chun, H.-S.; Oh, I.-H. Effect of the catalytic ink preparation method on the performance of polymer electrolyte membrane fuel cells. J. Power Sources 2002, 106, 146–152. [Google Scholar] [CrossRef]
- Cho, Y.-H.; Park, H.-S.; Cho, Y.-H.; Jung, D.-S.; Park, H.-Y.; Sung, Y.-E. Effect of platinum amount in carbon supported platinum catalyst on performance of polymer electrolyte membrane fuel cell. J. Power Sources 2007, 172, 89–93. [Google Scholar] [CrossRef]
- Marquis, J.; Coppens, M.-O. Achieving ultra-high platinum utilization via optimization of PEM fuel cell cathode catalyst layer microstructure. Chem. Eng. Sci. 2013, 102, 151–162. [Google Scholar] [CrossRef]
- Liu, Y.; Murphy, M.W.; Baker, D.R.; Gu, W.; Ji, C.; Jorne, J.; Gasteiger, H.A. Proton Conduction and Oxygen Reduction Kinetics in PEM Fuel Cell Cathodes: Effects of Ionomer-to-Carbon Ratio and Relative Humidity. J. Electrochem. Soc. 2009, 156, B970–B980. [Google Scholar] [CrossRef]
- Cao, T.-F.; Lin, H.; Chen, L.; He, Y.-L.; Tao, W.-Q. Numerical investigation of the coupled water and thermal management in PEM fuel cell. Appl. Energy 2013, 112, 1115–1125. [Google Scholar] [CrossRef]
- El Hannach, M.; Singh, R.; Djilali, N.; Kjeang, E. Micro-porous layer stochastic reconstruction and transport parameter determination. J. Power Sources 2015, 282, 58–64. [Google Scholar] [CrossRef]
- Nam, J.H.; Kaviany, M. Effective diffusivity and water-saturation distribution in single- and two-layer PEMFC diffusion medium. Int. J. Heat Mass Transf. 2003, 46, 4595–4611. [Google Scholar] [CrossRef]
- Weber, A.Z.; Newman, J. Effects of Microporous Layers in Polymer Electrolyte Fuel Cells. J. Electrochem. Soc. 2005, 152, A677. [Google Scholar] [CrossRef]
- Zhou, J.; Shukla, S.; Putz, A.; Secanell, M. Analysis of the role of the microporous layer in improving polymer electrolyte fuel cell performance. Electrochim. Acta 2018, 268, 366–382. [Google Scholar] [CrossRef]


| Layer | Parameter (Unit) | Parametric Levels |
|---|---|---|
| Cathode catalyst layer (CCL) | CCL thickness ( (µm)) | 15, 30 |
| CCL porosity ( (%)) | 20, 40, 60 | |
| Ionomer loading at CCL ( (%)) | 20, 40, 60 | |
| (%) at CCL | 20, 40, 60 | |
| Polymer electrolyte membrane (PEM) | PEM thickness ( (µm)) | 10, 25, 50 |
| Cathode microporous layer (CMPL) | CMPL thickness ( (µm)) | 30, 60, 90 |
| CMPL porosity (%)) | 40, 60 |
| Design Factor | Level (High) | Level (Low) |
|---|---|---|
| PEM Design | ||
| CCL Design | ||
| CMPL Design |
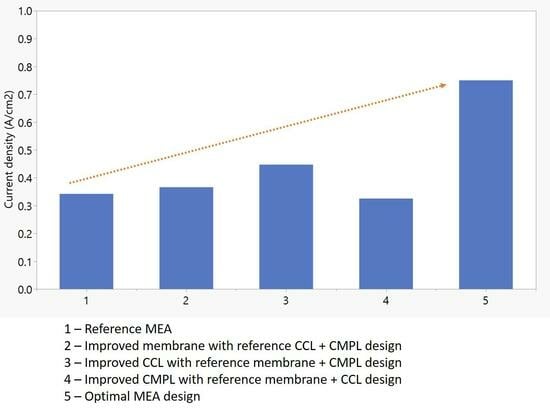
| Sl.no. | PEM Design Level | CCL Design Level | CMPL Design Level | I (A cm−2) at 0.6 V | % (Increase/Decrease) in CD at 0.6 V w.r.t Base Case | I (A cm−2) at 0.4 V | % (Increase/Decrease) in CD at 0.4 V w.r.t Base Case |
|---|---|---|---|---|---|---|---|
| 1 | L | L | L | 0.342 | 0.00 | 0.548 | 0.00 |
| 2 | H | L | L | 0.366 | 7.11 | 0.556 | 1.48 |
| 3 | L | H | L | 0.447 | 30.9 | 0.570 | 4.20 |
| 4 | H | H | L | 0.468 | 36.9 | 0.576 | 5.20 |
| 5 | L | L | H | 0.325 | −4.68 | 1.028 | 87.7 |
| 6 | H | L | H | 0.418 | 22.5 | 1.170 | 114 |
| 7 | L | H | H | 0.602 | 76.3 | 1.279 | 133 |
| 8 | H | H | H | 0.750 | 119 | 1.266 | 131 |
| Source | DF | Adj SS | Adj MS | F-Value | p-Value |
|---|---|---|---|---|---|
| Model | 5 | 0.146307 | 0.029261 | 77.16 | 0.013 |
| Linear | 3 | 0.121305 | 0.040435 | 106.62 | 0.009 |
| PEM | 1 | 0.010224 | 0.010224 | 26.96 | 0.035 |
| CCL | 1 | 0.083232 | 0.083232 | 219.46 | 0.005 |
| CMPL | 1 | 0.027848 | 0.027848 | 73.43 | 0.013 |
| Two-Way Interactions | 2 | 0.025003 | 0.012501 | 32.96 | 0.029 |
| PEM × CMPL | 1 | 0.004802 | 0.004802 | 12.66 | 0.071 |
| CCL × CMPL | 1 | 0.020200 | 0.020200 | 53.26 | 0.018 |
| Error | 2 | 0.000759 | 0.000379 | ||
| Total | 7 | 0.147066 |
| Source | DF | Adj SS | Adj MS | F-Value | p-Value |
|---|---|---|---|---|---|
| Model | 3 | 0.80742 | 0.269141 | 105.38 | 0.000 |
| Linear | 2 | 0.79580 | 0.397898 | 155.79 | 0.000 |
| CCL | 1 | 0.01892 | 0.018915 | 7.41 | 0.053 |
| CMPL | 1 | 0.77688 | 0.776881 | 304.17 | 0.000 |
| Two-Way Interactions | 1 | 0.01163 | 0.011628 | 4.55 | 0.100 |
| CCL × CMPL | 1 | 0.01163 | 0.011628 | 4.55 | 0.100 |
| Error | 4 | 0.01022 | 0.002554 | ||
| Total | 7 | 0.81764 |
Disclaimer/Publisher’s Note: The statements, opinions and data contained in all publications are solely those of the individual author(s) and contributor(s) and not of MDPI and/or the editor(s). MDPI and/or the editor(s) disclaim responsibility for any injury to people or property resulting from any ideas, methods, instructions or products referred to in the content. |
© 2023 by the authors. Licensee MDPI, Basel, Switzerland. This article is an open access article distributed under the terms and conditions of the Creative Commons Attribution (CC BY) license (https://creativecommons.org/licenses/by/4.0/).
Share and Cite
Sagar, A.; Chugh, S.; Kjeang, E. Model-Driven Membrane Electrode Assembly Design for High-Performing Open-Cathode Polymer Electrolyte Membrane Fuel Cells. Energies 2023, 16, 7472. https://doi.org/10.3390/en16227472
Sagar A, Chugh S, Kjeang E. Model-Driven Membrane Electrode Assembly Design for High-Performing Open-Cathode Polymer Electrolyte Membrane Fuel Cells. Energies. 2023; 16(22):7472. https://doi.org/10.3390/en16227472
Chicago/Turabian StyleSagar, Anand, Sachin Chugh, and Erik Kjeang. 2023. "Model-Driven Membrane Electrode Assembly Design for High-Performing Open-Cathode Polymer Electrolyte Membrane Fuel Cells" Energies 16, no. 22: 7472. https://doi.org/10.3390/en16227472