Article

Model-Driven Membrane Electrode Assembly Design for High-Performing Open-Cathode Polymer Electrolyte Membrane Fuel Cells

1
School of Mechatronic Systems Engineering, Simon Fraser University, 250-13450 102 Avenue, Surrey, BC V3T 0A3, Canada
2
Alternative Energy-1 Department, Indian Oil R&D Centre, Sector-13, Faridabad 121007, India
*
Author to whom correspondence should be addressed.
Energies 2023, 16(22), 7472; https://doi.org/10.3390/en16227472
Submission received: 15 September 2023 / Revised: 27 October 2023 / Accepted: 3 November 2023 / Published: 7 November 2023
(This article belongs to the Section A5: Hydrogen Energy)

Abstract

:
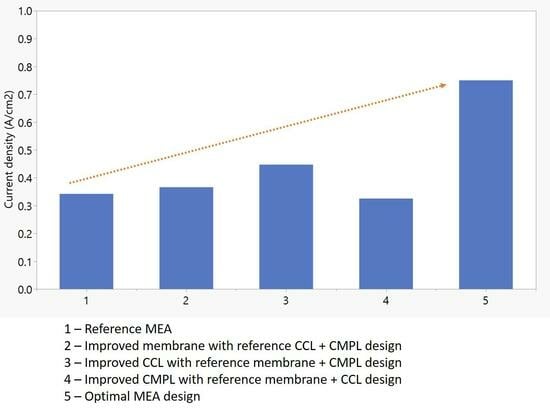
Open-cathode fuel cells use air cooling to effectively reduce system cost. However, due to the challenging hygrothermal environment, they generally suffer from low performance compared to conventional, liquid-cooled cells. A pre-validated, three-dimensional computational model is used in the present work to determine the effects of different sub-component designs, namely the polymeric membrane, composition of the cathode catalyst layer (CCL), and structure of the cathode microporous layer (CMPL), on the performance of an open-cathode fuel cell. This comprehensive parametric study performed on a total of 90 cases shows the increment in current density to be 7% and 31% by improvising the membrane and CCL design, respectively, at 0.6 V. A steep increase of 87% is also achieved by strategically modifying the CMPL design at 0.4 V operation. An overall increment of 119% and 131% in current density is achieved for the best membrane electrode assembly (MEA) design at 0.6 and 0.4 V, respectively, as compared to the baseline design. These improvements are achieved by collective improvements in kinetics, oxygen mass transport, ohmic resistance, self-heating, and water retention in the ionomer phase. The proposed MEA design could facilitate open-cathode fuel cell stacks with 2× higher power output or 56% lower weight and materials cost for a given power demand.

Graphical Abstract

1. Introduction

Global energy demand has increased multiple folds over the last few decades, and the combustive emissions of fossil fuels have continued to escalate climate change concerns. Global decarbonization goals therefore target increased penetration of renewable and sustainable, low-carbon energy systems. For instance, the use of renewable hydrogen in fuel cells is a promising alternative to internal combustion engines that is technologically mature and could reduce emissions by greater margins once used at commercial scales [1,2,3,4,5,6]. Polymer electrolyte membrane fuel cells (PEMFCs) are a commonly used fuel cell type for various applications including portable, automotive, and stationary applications [7,8,9]. The membrane electrode assembly (MEA), which generally consists of a polymer electrolyte membrane (PEM) sandwiched in between anode and cathode electrodes (catalyst layers (CLs)) backed by gas diffusion layers (GDLs), is an integral part of the PEMFC. The design and fabrication of suitable materials, components, and MEAs control the overall cell performance, and continuous research in this field has brought significant improvement in PEMFC efficiency [10].
The low temperature operation of PEMFCs makes them a suitable candidate for automotive applications [11]. Conventional PEMFCs use liquid coolant for extracting the heat produced inside the system, which flows through coolant channels present at the bipolar plates [12]. The coolant loop needs to be additionally managed using an external chiller to maintain a constant stack temperature during operation [13]. This whole setup adds extra cost and space to the total footprint of the PEMFC system. The automotive requirements of producing high-power-density and low-cost fuel cells have led to tangible advancements in fuel cell design. The use of thinner reinforced membranes as compared to conventional PEMs has been demonstrated to reduce ohmic losses, resulting in increased power density [14,15]. Reduced Pt loading and the use of other non-Pt group catalysts have also been explored for cost reduction [16,17]. The increasing demand for high-power-density PEMFC systems to be operated at elevated current densities necessitates good water management at the cell level. This led to the microporous layer (MPL) being used widely in modern PEMFCs, considering its ability to improve water management [18,19,20]. However, these advances generally require active gas humidification and thermal management via liquid cooling [21,22,23].
The open-cathode PEMFC design is an alternative to the conventional liquid-cooled design where the cathode side channels are open and ambient air is used as oxidant as well as coolant [24]. This concept has the distinct advantage of a lower system complexity since it eliminates the need for liquid cooling, active humidification, and other balance-of-plant components [25]. Figure 1a shows a schematic of the conventional liquid-cooled PEMFC system design, which includes a separate cooling loop integrated with pumps for recirculation of the coolant across the fuel cell stack, whereas, for open-cathode PEMFCs, fans are used to flow the ambient air across the open channels on the cathode side, which also serves as a cooling medium as depicted in Figure 1b. Reductions in space, weight, and cost are key factors that make the open-cathode design a potential candidate for motive applications [26]. However, these stacks are generally only used for low to moderate power applications up to a 5 kW power requirement as compared to conventional liquid-cooled stacks, which are used for higher power requirements. The open-cathode stacks show lower performance as compared to conventional liquid-cooled stacks due to complex thermal and water management [9,27]. In the literature, most MEA design and optimization studies have focused on liquid-cooled PEMFCs, which generally operate at fully humidified operating conditions with low oxygen stoichiometry. In contrast, open-cathode PEMFCs operate in dry conditions, low operating temperatures, and at high airflow rates [28]. The airflow distribution for open-cathode cells has been widely studied, focusing on the fan and air plenum configuration along with geometric optimization of the flow field plates [9,28,29,30,31,32]. Importantly, open-cathode cells experience high temperature gradients and non-uniform conditions along the channel [33,34]. They are also greatly influenced by ambient conditions, namely the temperature and relative humidity (RH) of the ambient air. Operation in hot and humid ambient conditions is considered favourable, whereas membrane dry-out is anticipated in hot and arid environments [35,36]. Wu et al. [37] reported an experimental analysis on the cell performance of open-cathode PEMFCs and found dehydration to be crucial. The use of electro-thermal performance mapping was proposed by Meyer et al. [38] to identify the ideal operating point for an open-cathode PEMFC considering the trade-offs between various operating conditions and their impact on cell efficiency and power density. Catalyst coated-membrane-type MEAs showed higher performance than gas diffusion electrode based MEAs due to better membrane–catalyst-layer contact. A thicker CL with a low Pt loading of 20% was found to provide stable cell performance through better water-holding capacity at the expense of increased protonic and mass transport resistance [28]. Strategic selection of the ionomer having a lower water sorption/desorption rate constant was similarly proposed to enhance the water retention capability at the CL of open-cathode cells [39]. Generally, in PEMFCs, the GDL controls the water management through its hydrophobicity and porous structure [40]. However, considering the water retention of open-cathode PEMFCs, hydrophilic GDLs were found to perform better than hydrophobic ones [41]. Furthermore, a decreased cathode GDL porosity was found to improve thermal management and cell hydration, thus reducing ohmic resistance [42]. This was attributed to improved thermal and electrical contact at the MEA interfaces. High GDL compression also furnished similar performance improvement. However, high compression and less porous GDLs may have the negative side effect of poor oxygen transport to the cathode CL, which is typically critical for open-cathode PEMFCs [43]. The GDL thermal conductivity effect studied in a modelling work for open-cathode cells suggested an insignificant impact on the thermal profile for such systems [44]. On the contrary, an experimental study recommended the use of a novel GDL having high hydrophobicity to achieve better cell hydration, which was also linked to the lower thermal conductivity of such GDLs [45]. This GDL garnered high cell performance for open-cathode systems due to decreased internal cell resistance. A holistic approach to collectively designing anode and cathode GDLs was advocated based on ex situ X-ray tomography and in operando neutron imaging data [46].
There is plenty of literature on the effect of membrane selection on conventional liquid-cooled cells. However, dedicated investigation of membrane selection for open-cathode PEMFCs is absent, despite the need for a better understanding of the technology and its limitations. One study reported the effect of ionomer equivalent weight (EW) on open-cathode cell performance [47], but other CL properties have not been studied in detail so far. Similarly, the effect of GDL porosity and compression on open-cathode cell performance is reported in isolation while not considering the effects of other related parameters [40,41,46]. Thus, more comprehensive parametric studies are needed to achieve the necessary fundamental understanding of the key couplings of the relatively complex open-cathode PEMFC system. Most of the existing literature on MEA design for open-cathode PEMFCs has been empirically developed without robust fundamental knowledge of the underlying characteristics within the unique open-cathode fuel cell environment, often leading to conflicting findings that are likely influenced by the system design and other external factors. The objective of the present work is to overcome these challenges by strategically designing MEA materials and improvising the overall MEA design for open-cathode cells through improved water and thermal management. The purposefully designed MEA is intended to increase the overall current and power densities of an open-cathode fuel cell for a given ambient condition. This approach can increase the applicability of open-cathode PEMFCs to high power requirements while maintaining the same form factor of the stack and minimizing the overall weight and cost of the system. The present study, therefore, uses a computational modelling approach wherein the intrinsic coupling between the various governing physics is adequately captured, hence enabling robust predictions of the overall performance of open-cathode fuel cells. A 3D computational model of an open-cathode PEMFC is developed to simulate the fuel cell performance for a wide variety of MEA designs featuring targeted variations in the cathode catalyst layer (CCL), PEM, and cathode microporous layer (CMPL) components using a parametric study approach. The first phase of this work screens the individual parameters involved at the component level to assess their impact on the overall cell performance. Next, a full factorial design of experiments (DoE) analysis is performed based on two levels of CCL, PEM, and CMPL design as factors, and the highest-performing MEA design set is evaluated by considering both main effects and interaction effects and other critical parameters of the DoE. The best-case design is chosen for each component of the CCL, PEM, and CMPL using a comparative study based on the 3D computational model evaluation.

2. Methodology

The three-dimensional, two-phase computational open-cathode fuel cell model which was developed and validated in our previous work [36] is used to perform the parametric study concerning the various MEA design parameters as reported in Table 1.
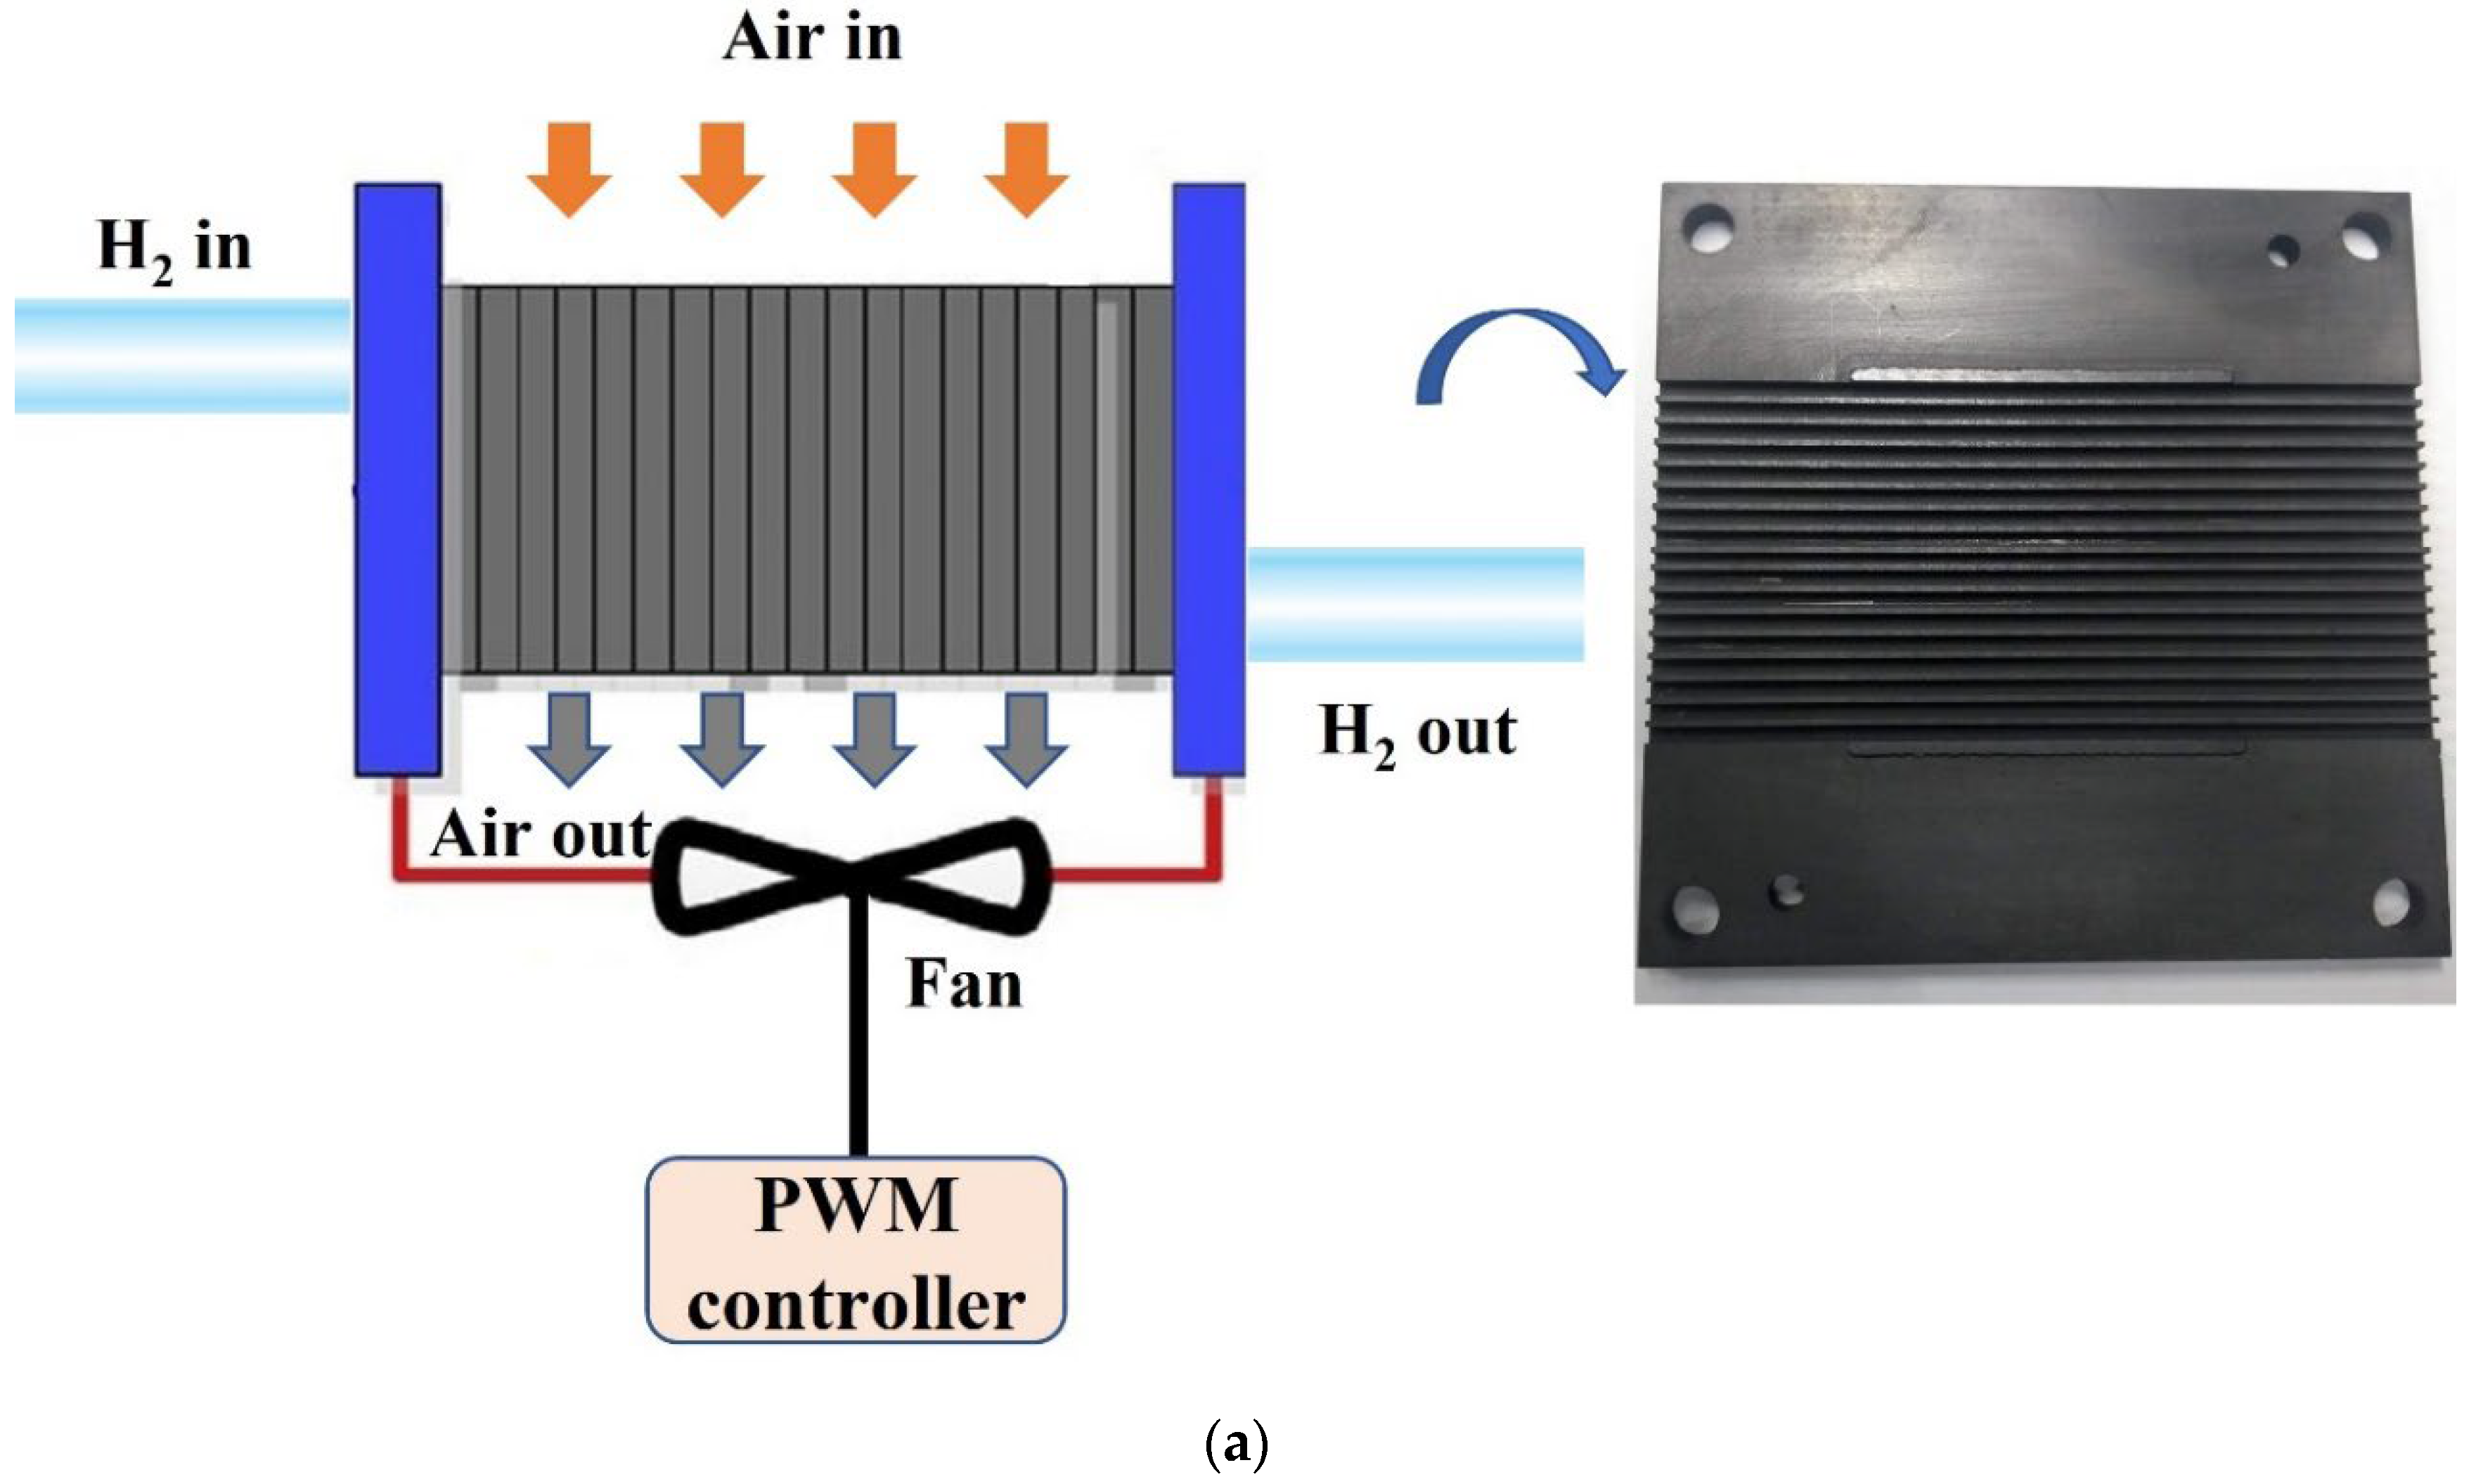
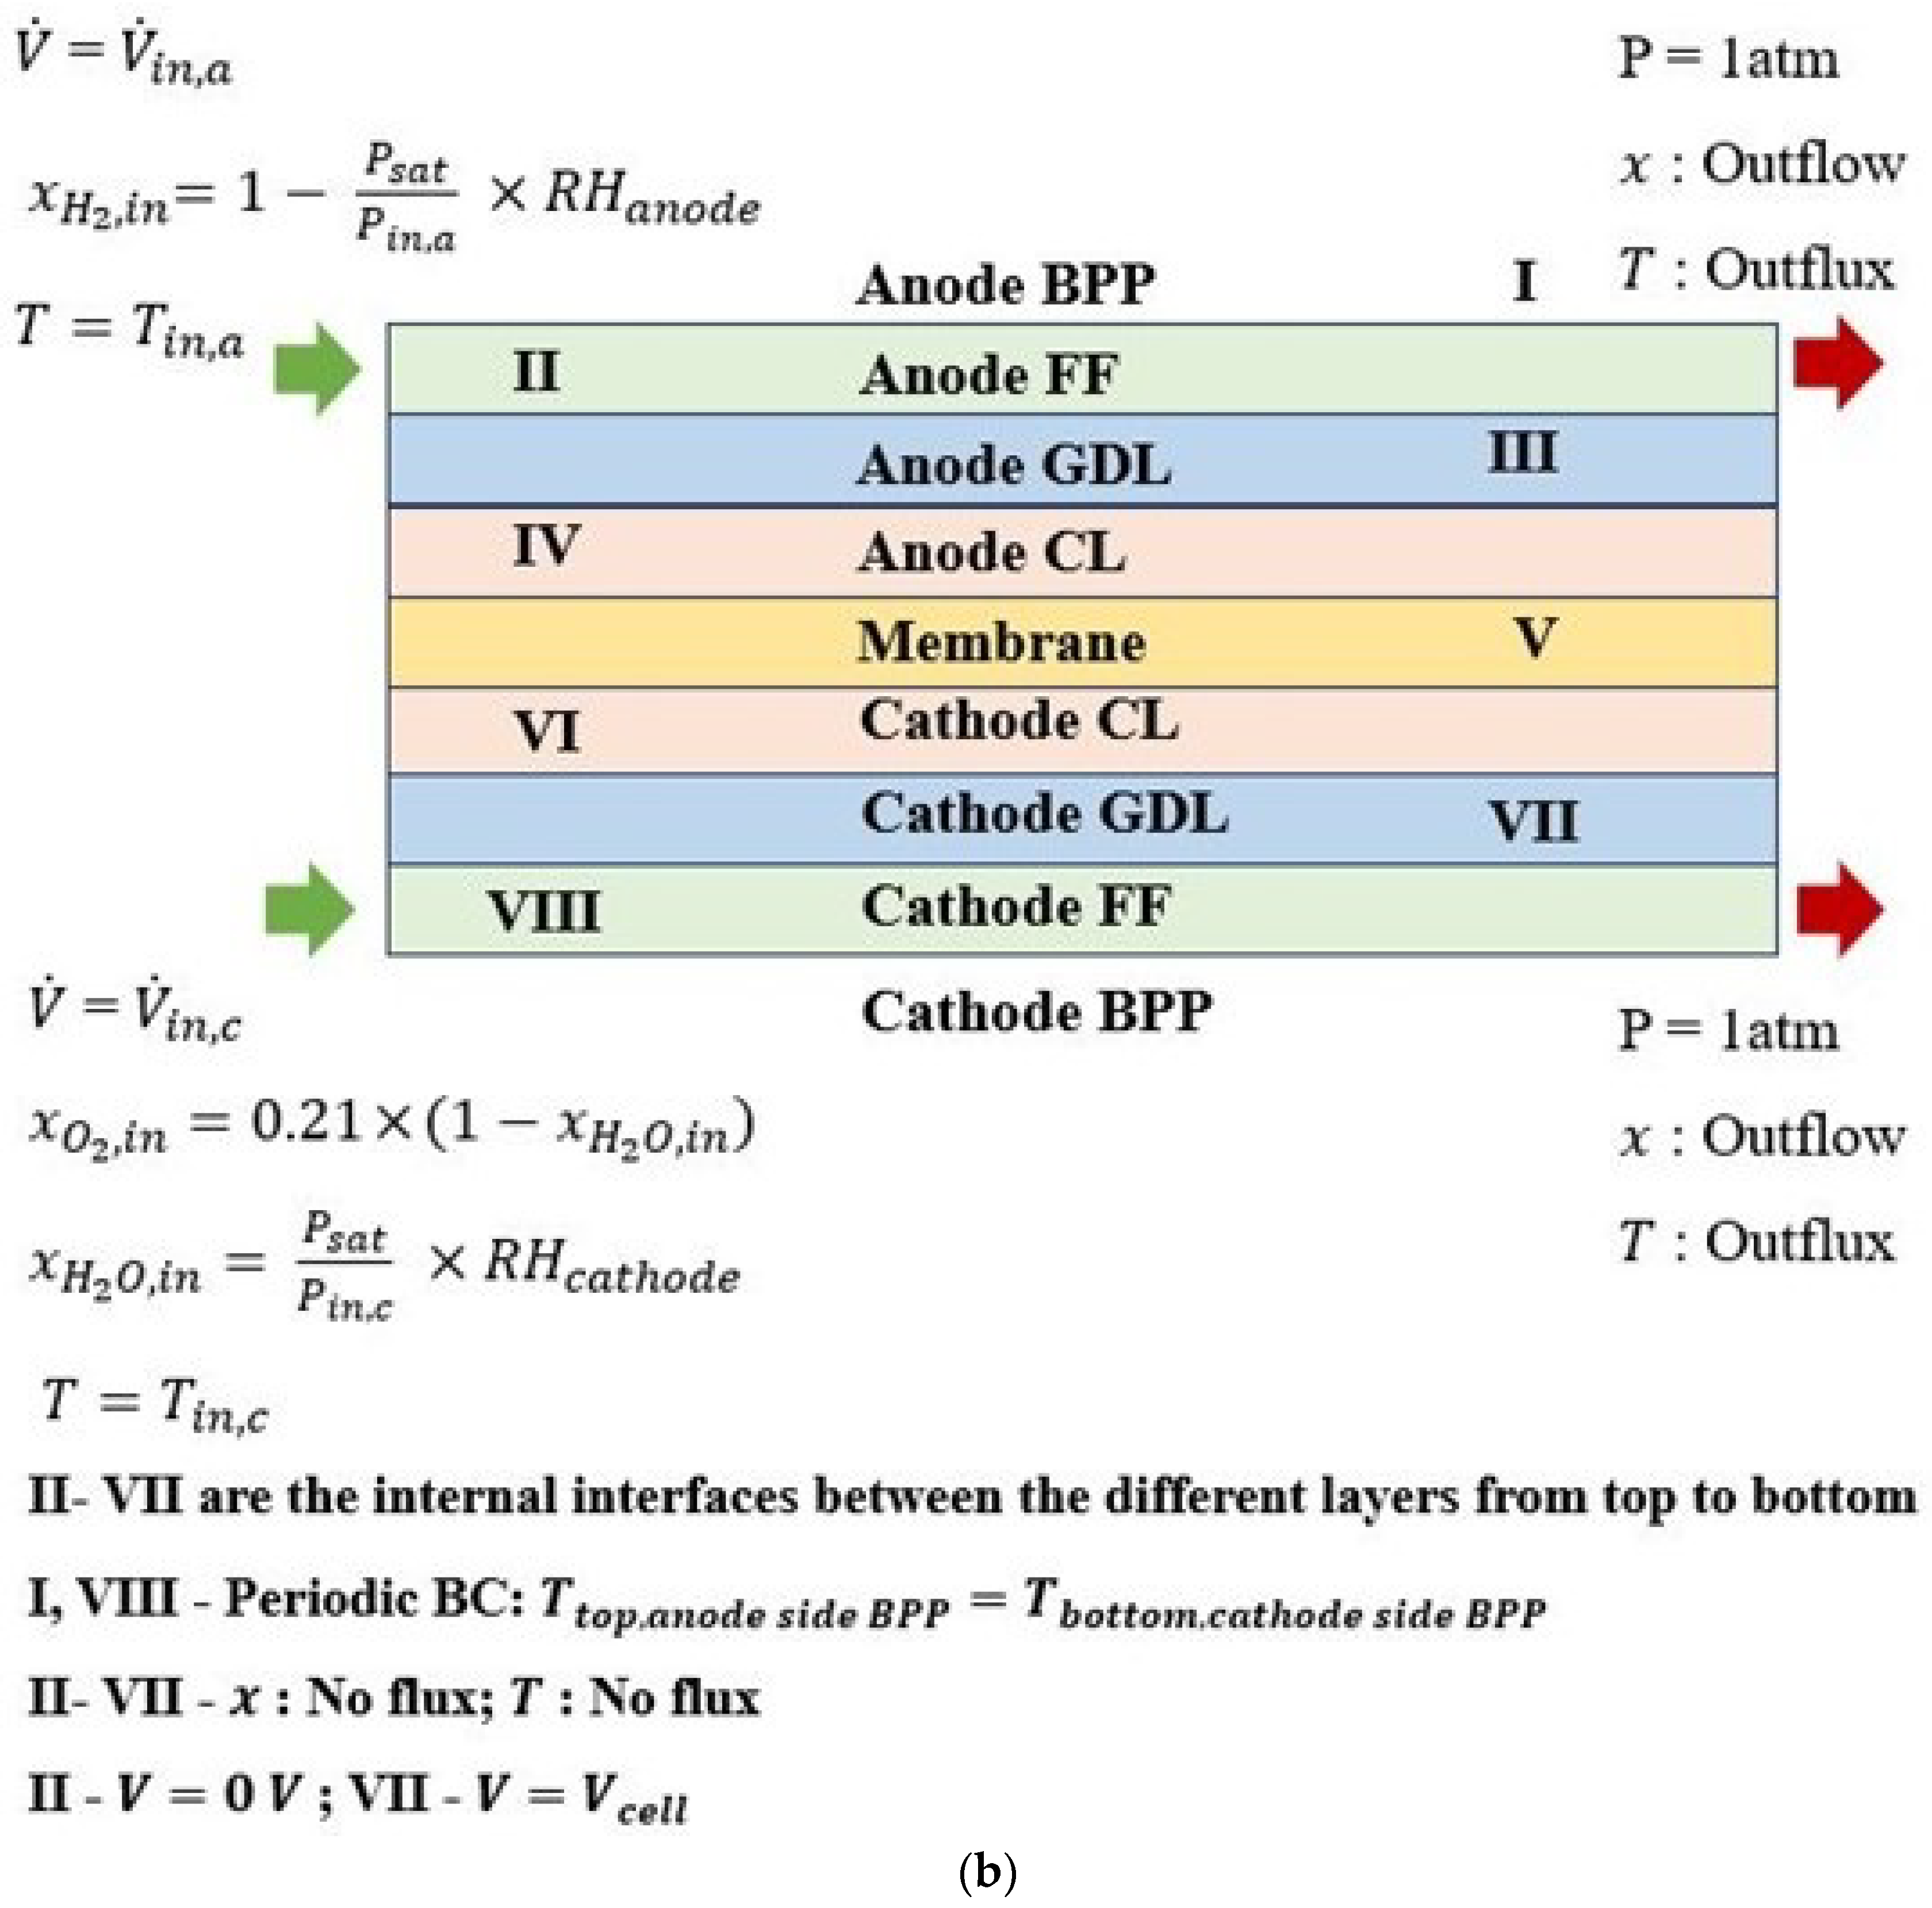
The set of governing equations, namely momentum conservation, mass conservation, species transport, heat transport, charge conservation, and two-phase water transport, guiding the transport phenomena in open-cathode cells are solved with intricate couplings, as detailed elsewhere [36]. The model geometry and boundary conditions are shown in Figure 2. Considering the periodic repetition of cells within the full stack and a similar periodicity of straight, parallel open-cathode channels at the cell level, a single channel/rib domain (Figure 2) is taken as the focus of this study to evaluate the overall performance characteristics of the open-cathode system. The single channel/rib on each side of the electrode is further halved considering the symmetric condition, which is the final computational domain for this study, including the MEA sandwiched in between. The approximations are made to minimize the computational cost for model evaluation. The length of the channels is 50 mm, and the widths of the anode and cathode channels are 0.75 and 2.0 mm, respectively. The anode and cathode ribs are 1.05 and 0.425 mm wide, whereas the overall height of the anode and cathode channels are 0.7 and 2.0 mm, respectively. The baseline MEA design is considered to consist of a 190 μm Sigracet® carbon-paper-based GDL from SGL Carbon and a 15 μm CL on each electrode with a 50 μm Nafion® 212 membrane sandwiched in between. The Pt loading for this baseline design is 0.5 mg cm−2 for each electrode. All domains in the computational model are discretized using tetrahedral and quad meshes with sufficient boundary layers in the flow channels to capture the onset of fully developed flow. The model is created in a COMSOL 5.4 Multiphysics platform using the battery and fuel cells module, which uses a finite element analysis method for solving coupled phenomena and multiphysics problems. COMSOL Multiphysics was chosen as it provides flexibility to add user-defined correlations and couplings for the direct and indirect variables at the user interface platform itself without running separate codes/programs. Segregated solution steps for individual dependent variables with a final coupled step following a direct solving approach are used to execute the model. All simulation results are evaluated at a fixed operating condition of ambient air at 40 °C and 40% RH considering a typical hot and dry condition. The air flow rate at the cathode inlet is 2.5 nlpm, whereas the anode inlet is assigned a hydrogen flow rate of 0.5 nlpm at 40 °C and 60% RH. The partially humidified condition on the anode side is intended to mimic the average anode RH for dead-end mode operation [48]. The model assumptions include incompressible, laminar flow; ideal gases; impermeable membrane; and zero contact resistance at the interfaces. Two-phase water transport is used, with vapour and dissolved phases (in ionomer) being the two phases in which water can be present. Vapour phase water transport (1) is solved in gas flow channels, GDLs, and CLs, whereas dissolved phase water transport is solved using (2) in CLs and membrane. In (1), ρ is the gas mixture density, u is the velocity vector, P is the pressure, μ is the kinematic viscosity, and S m o m is the momentum source term. The local water content in the CLs and membrane is calculated based on the net osmotic drag and diffusion between anode and cathode CLs governed by (2) and (3). Here, D d is the back-diffusion coefficient, S d is the source term, F is Faraday’s constant, and C d is the net water concentration in the dissolved phase. The water uptake by the ionomer phase present in the CLs is calculated by an expression which is proportional to the gradient of local water content λ and equilibrium water content λe, which is a function of vapour phase saturation a [36]. The water produced at the cathode CL is assumed to be in the dissolved phase rather than in vapour form [36], which facilitates more efficient water transport in the system. The ionomer water adsorption/desorption rate constant is an important parameter in this regard, as discovered and extensively discussed in our previous work [39]. This parameter, γ, is fixed at 0.1 s−1 for this work, which gives the maximum water retention capability while operating open-cathode cells in dry environments. More specifically, a low γ of 0.1 s−1 was found to give higher cell performance than the higher γ values of 10 s−1 and 1.0 s−1 with better membrane and CCL hydration and improved reaction kinetics [39]. Thus, γ = 0.1 s−1 is taken as the baseline parameter for the ionomer design in the present work.
ρ u · u = P + μ 2 u + S m o m
· D d C d + · n d F j m = S d
S d = γ ρ m E W   ( λ e λ )
The present parametric study focuses on a set of selected MEA design parameters related to the individual sub-components, namely the membrane, CLs, and GDLs, as specified in Table 1, and utilizes the computational model to simulate their respective effects on cell performance for open-cathode PEMFCs. The main emphasis is on the CCL, which is typically the MEA sub-component with the greatest influence on the performance of PEMFCs. The CCL is a thin, porous layer generally composed of carbon-supported electrocatalyst and ionomer mixed in a certain ratio which decides the overall microstructure of the electrode [49]. The net volume of the CCL, V C C L , is calculated from (4), where t C C L is the thickness, and A c e l l   is the geometrical active area of the CCL. The solid volume of the CCL has agglomerates of Pt, C, and ionomer. The individual weights of Pt, C, and ionomer are represented by W P t , W C , and W i o n , respectively, and are calculated from (5), (6) and (7), where m P t is the Pt loading, P t / C is the percentage of Pt on carbon, and w t i o n is the ionomer loading in weight percentage. The individual volume fractions of Pt, C, and ionomer represented by ε P t , ε C , and ε i o n , respectively, and the overall void fraction, ε C C L are calculated from (9), (10), (11) and (12). The CCL design is considered to be based on four parameters, namely CCL thickness ( t C C L ) , CCL porosity ( ε C C L ) , ionomer loading ( w t i o n ) (wt%), and %Pt/C ( P t / C ) having 2, 3, 3, and 3 parametric levels, respectively, as listed in Table 1 [50,51]. The parametric levels for the PEM and CMPL are also mentioned in Table 1 along with the CCL. The PEM is parametrized at three levels of thickness, and the microporous layer introduced between the GDL and the CL on the cathode side has two parameters, namely cathode MPL thickness ( t C M P L ) and cathode MPL porosity ( ε C M P L ) . The anode CL and GDL properties are kept fixed in this study, considering the relatively rapid hydrogen oxidation reaction at the anode, which has limited influence on the overall cell performance [52].
V C C L = t C C L × A c e l l  
W P t = A c e l l   × m P t
W C = W P t + C × ( 1 P t / C )
W i o n = w t i o n × W P t + C ( 1   w t i o n )
W P t + C = W P t P t / C
ε i o n = ( W i o n ρ i o n ) V C C L
ε C = ( W C ρ C ) V C C L
ε P t = ( W P t ρ P t ) V C C L
ε C C L = 1 ε i o n ε C ε P t
Charge conservation at the CLs is governed by (13) and (14), where σ s , e f f is the effective electrical conductivity, and σ m , e f f is the effective ionic conductivity. ϕ s , j s are the electrode potential and current density, whereas ϕ m , j m are the electrolyte potential and current density, respectively. σ s , e f f and σ m , e f f are calculated from (15) and (16) using a Bruggeman’s approximation with ε i o n as the electrolyte volume fraction and ε s as the electrode volume fraction (17). σ s and σ m are the bulk electrode electrical conductivity and bulk electrolyte ionic conductivity, respectively. The electrochemical reactions are governed by the Butler–Volmer Equations (18) and (19), where j a 0 , j c 0 , c i , c i , r e f , α i , and η i are the exchange current density at anode and cathode, molar concentration of ith species, reference molar concentration of ith species, ith electrode transfer coefficient, and ith electrode overpotential, respectively. For the given pure Pt/C catalyst, j a 0 , j c 0 are taken as constants as 50 A m−2 and 1.2 mA m−2 at the anode and cathode, respectively. Also, j v , a , a v   , S P t , R , and T are the volumetric current density, effective Pt surface area per unit volume of CL, specific active surface area of Pt, universal gas constant, and local temperature, respectively, used in (18)–(21) [53]. The summation of activation overpotential and mass transfer (MT) overpotential represented by ηact+MT is obtained from the steady-state solution achieved after running a fuel cell simulation at given operating conditions using (18) and (19). The voltage loss breakdown (VLB) used in the present work uses ηact+MT to quantify the percentage of individual losses out of the total voltage loss, which is a summation of ηact+MT and ohmic overpotential (ηohm). ηohm is calculated using (22), where t i , ϵ i o n , i , and σ m , i are the thickness, ionomer volume fraction, and effective electrolyte conductivity, respectively, for each component, and j is the operating current density.
. σ s , e f f ϕ s = j s
. σ m , e f f ϕ m = j m
σ s , e f f = ε s 1.5 × σ s
σ m , e f f = ε i o n 1.5 × σ m
ε s = 1 ε C L
j s , a = j a 0 c H 2 c H 2 , r e f 0.5 ( e α a F η a R T     e α c F η a R T )
j s , c = j c 0 c O 2 c O 2 , r e f ( e α a F η c R T     e α c F η c R T )
j v , a = j s , a × a v   ; j v , c = j s , c × a v  
a v = m P t S P t t C L 1 ϵ C L
η o h m , i = t i ϵ i o n , i × σ m , i × j
u .   c i = .   D e f f ,     M P L c i + S m o l
D e f f , M P L = ( D b u l k , e f f ,   M P L 1 + D K n ,   M P L 1 ) 1
D b u l k , e f f ,   M P L =   D b u l k ,   M P L × ( 1 ( 1 ε M P L ) 0.46 )
D K n ,   M P L = 2 3   r ¯   8 R T Π M k
The MPL serves as a buffer layer for water transport between the GDL and the CL [54], and the present work includes the macro-scale modelling of mass transport at the MPL being governed by the convection–diffusion Equation (23) where u is the fluid velocity, c i is the ith species molar concentration, D e f f ,   M P L is the effective diffusion coefficient, and S m o l is the molar source term (zero in the MPL). The diffusion in the MPL is governed by mixed (Bosanquet) diffusion represented by (24), where D b u l k , e f f ,   M P L is the bulk diffusion coefficient, and D K n ,   M P L is the Knudsen diffusion coefficient. Since micropores are present in the MPL, the Knudsen diffusion is limiting and dominates the species transport in the MPL. The bulk diffusion follows an empirical approximation (25) to calculate the D b u l k , e f f ,   M P L , where D b u l k ,   M P L and ε M P L are the bulk diffusion coefficient and the porosity of the MPL [55,56]. D K n ,   M P L is calculated using (26), where r ¯ is the average pore radius for mass transport, and M k is the molecular mass of the kth gas species.
The design set at t C C L = 15   μ m , ε C C L = 20 % , w t i o n = 20 % , P t / C = 20 % , t P E M = 50   μ m , t C M P L = 90   μ m , and ε C M P L = 40 % is considered as the baseline MEA design for this work based on previously reported works on open-cathode PEMFCs [36,39]. Subsequent parametric studies are performed by running the model with parametric values from Table 1 to understand the sensitivity of the listed parameters to the overall performance of open-cathode cells. The cell performance is accessed by noting the change in current density with reference to the baseline MEA design while operating at cell voltages of 0.6 V and 0.4 V for each case. For each of the layers mentioned in Table 1, the parametric values resulting in maximum and minimum current density are obtained and further assessed in terms of temperature, RH, and average O2 mole fraction distributions at the CCL, which are deterministic to the overall cell performance. The VLB is also performed for the maximum and minimum performing cases to establish the dominant effect responsible for such trends as compared to the baseline MEA design. The maximum and minimum performing designs of the CCL are obtained by evaluating a total of 54 cases from the different permutations of the CCL parameters while the corresponding PEM and CMPL parameters are fixed at the baseline values. The maximum and minimum performing designs for PEM and CMPL are similarly determined by evaluating 3 and 6 different parameter combinations, respectively. Once the maximum and minimum performing cases are obtained based on the parametric evaluation for the PEM, CCL, and CMPL components, a full factorial design of experiments (DoE) study is performed to achieve the highest-performing design set at the MEA level. The three factors for the DoE are taken as PEM, CCL, and CMPL, each with two levels, namely high (H) and low (L), taken as the maximum and minimum performing design sets from the parametric evaluation performed earlier. Thus, a total of eight MEA design cases are evaluated computationally to achieve the final design set at the MEA level having the highest performance. Both main effects and interaction effects of the three components are calculated and analyzed by performing this DoE, since coupled effects between MEA components are anticipated.

3. Results and Discussion

3.1. Model Validation

The two-phase computational model discussed in the previous section and used in this work was previously validated with experimental data for various cases of open-cathode PEMFC operation. Figure 3 shows the comparative polarization curve for one of these cases where the experimental data obtained for running the open-cathode single cell at an ambient condition of 50 °C and 30% RH are presented together with the corresponding simulation results for the same cell design and operating conditions. The polarization curves show a reasonably good agreement between experimental and simulated results with experimental measurement uncertainty below 5% over different current densities. This shows that the model is capable of capturing the unique performance characteristics of open-cathode PEMFCs, which generally feature greater variability than liquid-cooled PEMFCs due to higher internal gradients, whereas the lower current densities obtained are due to the cell being operated in dry conditions which pose higher ohmic losses. This validated model is used in subsequent sections to perform parametric design at the component level of the MEA.

3.2. Parametric Results

3.2.1. PEM Parametric Design

With respect to the baseline MEA design when the CCL and CMPL parameters are kept constant and only the PEM design is changed parametrically, as per Table 1, the current density (CD) is increased by 7.1% at 0.6 V and by 1.5% at 0.4 V, respectively, when the PEM thickness is changed from 50 μm to 10 μm. These results are illustrated in Figure 4. The minor increments in CD can be attributed to the decreased ohmic resistance offered by the thinner membrane. However, the performance boost is limited by the other MEA design constraints of the CCL and CMPL which remain at baseline levels. The interaction effect of the PEM thickness with other component changes is explained in the subsequent section to understand the overall open-cathode cell performance dependence on PEM thickness.

3.2.2. Cathode CL Parametric Design

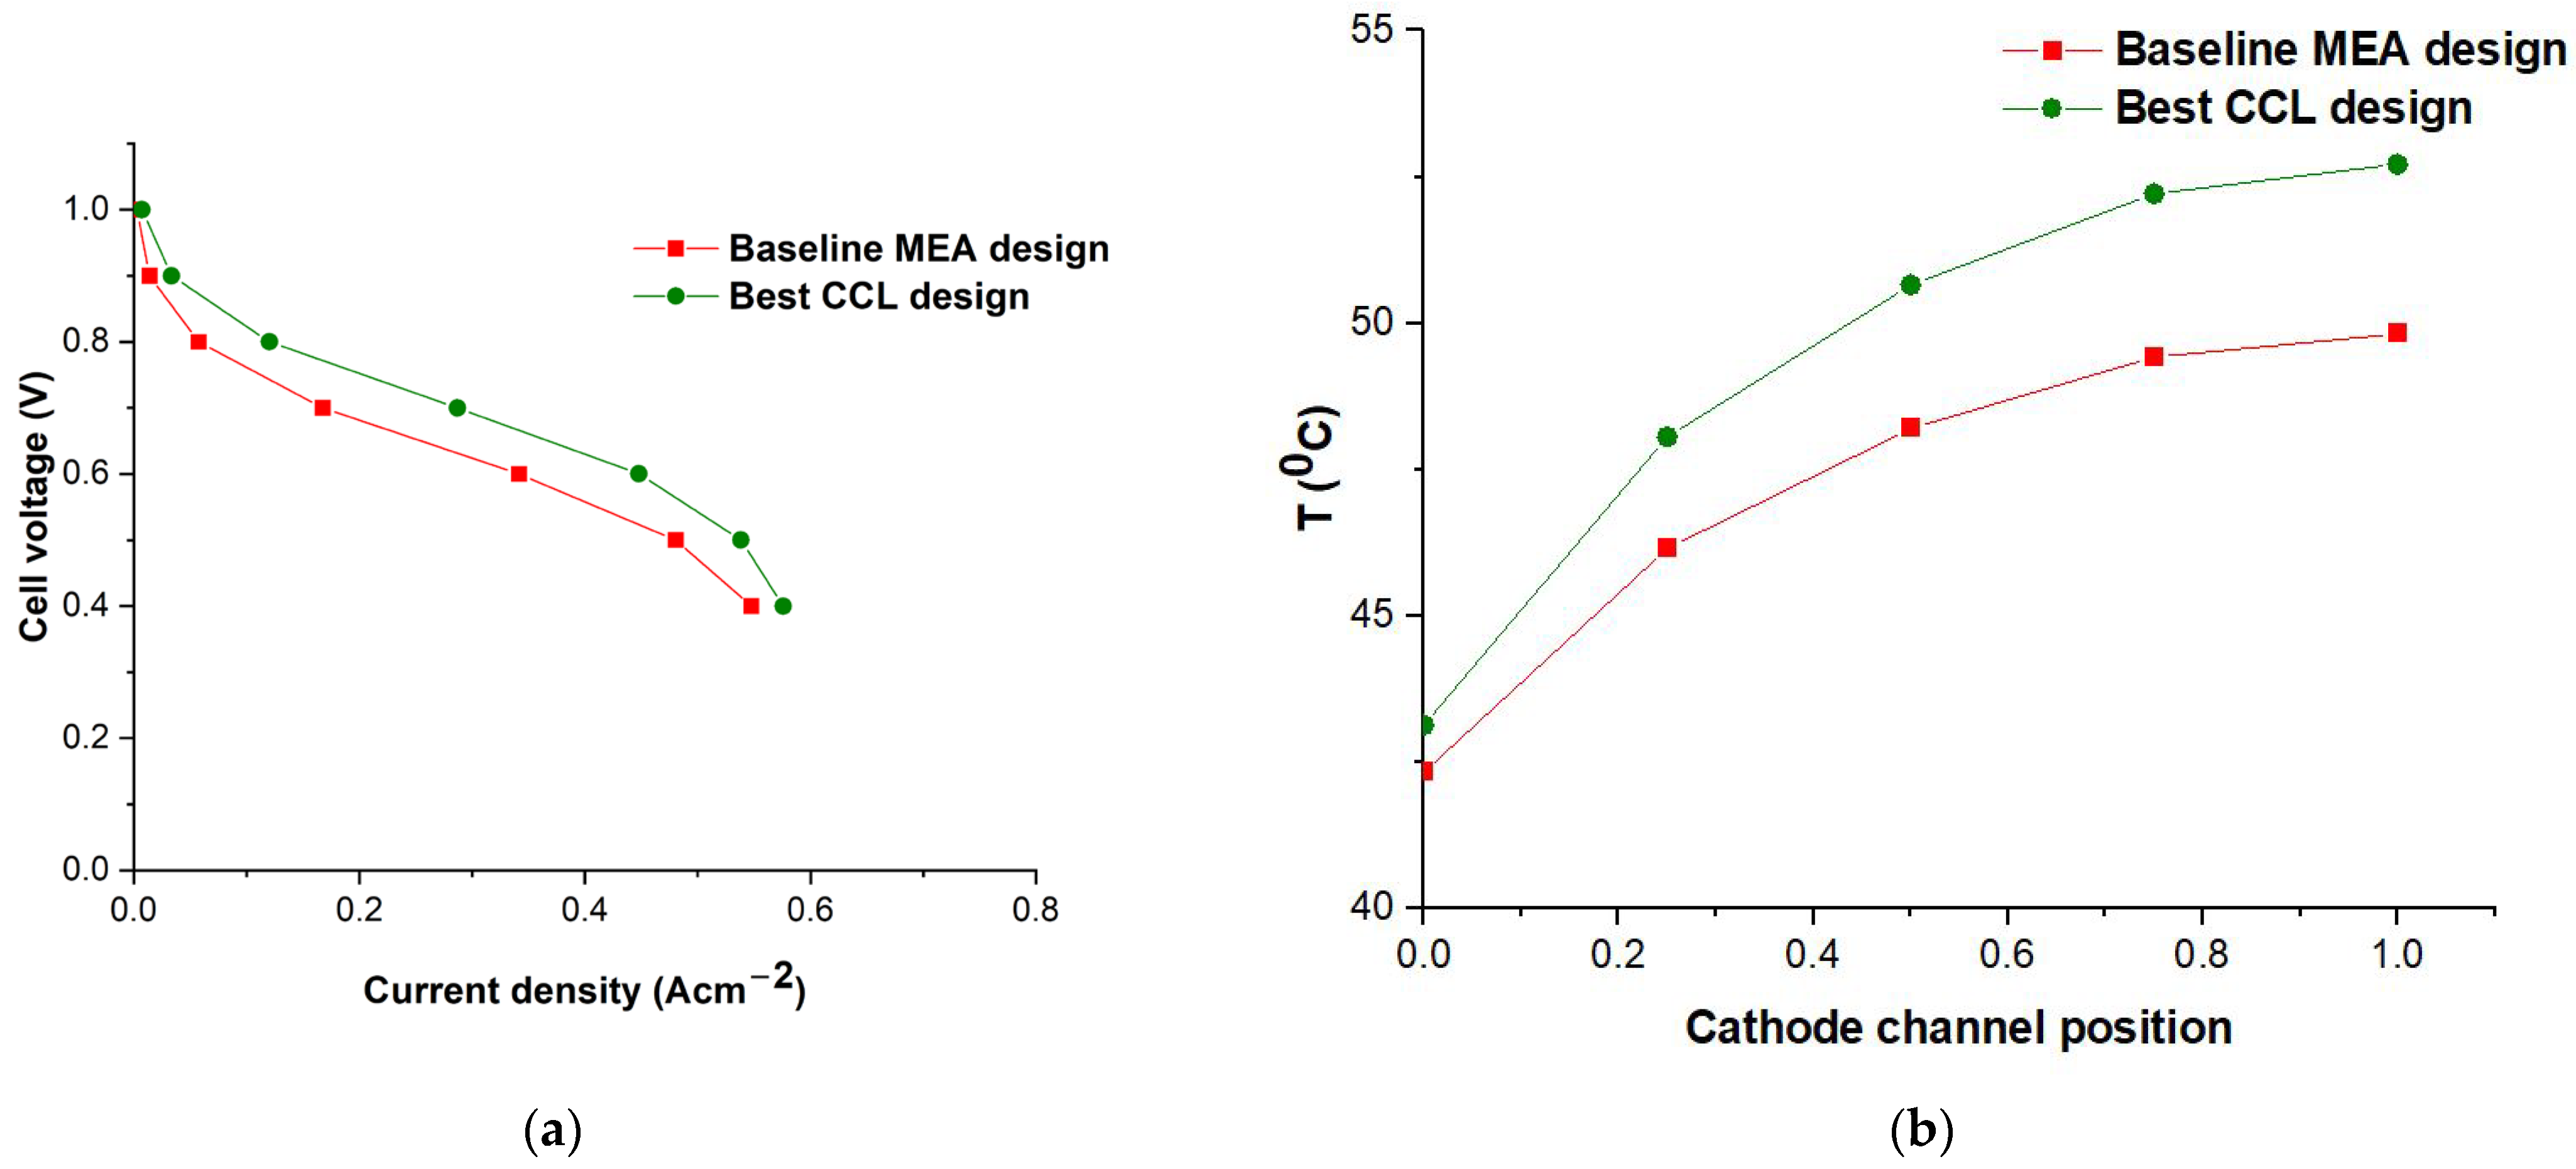
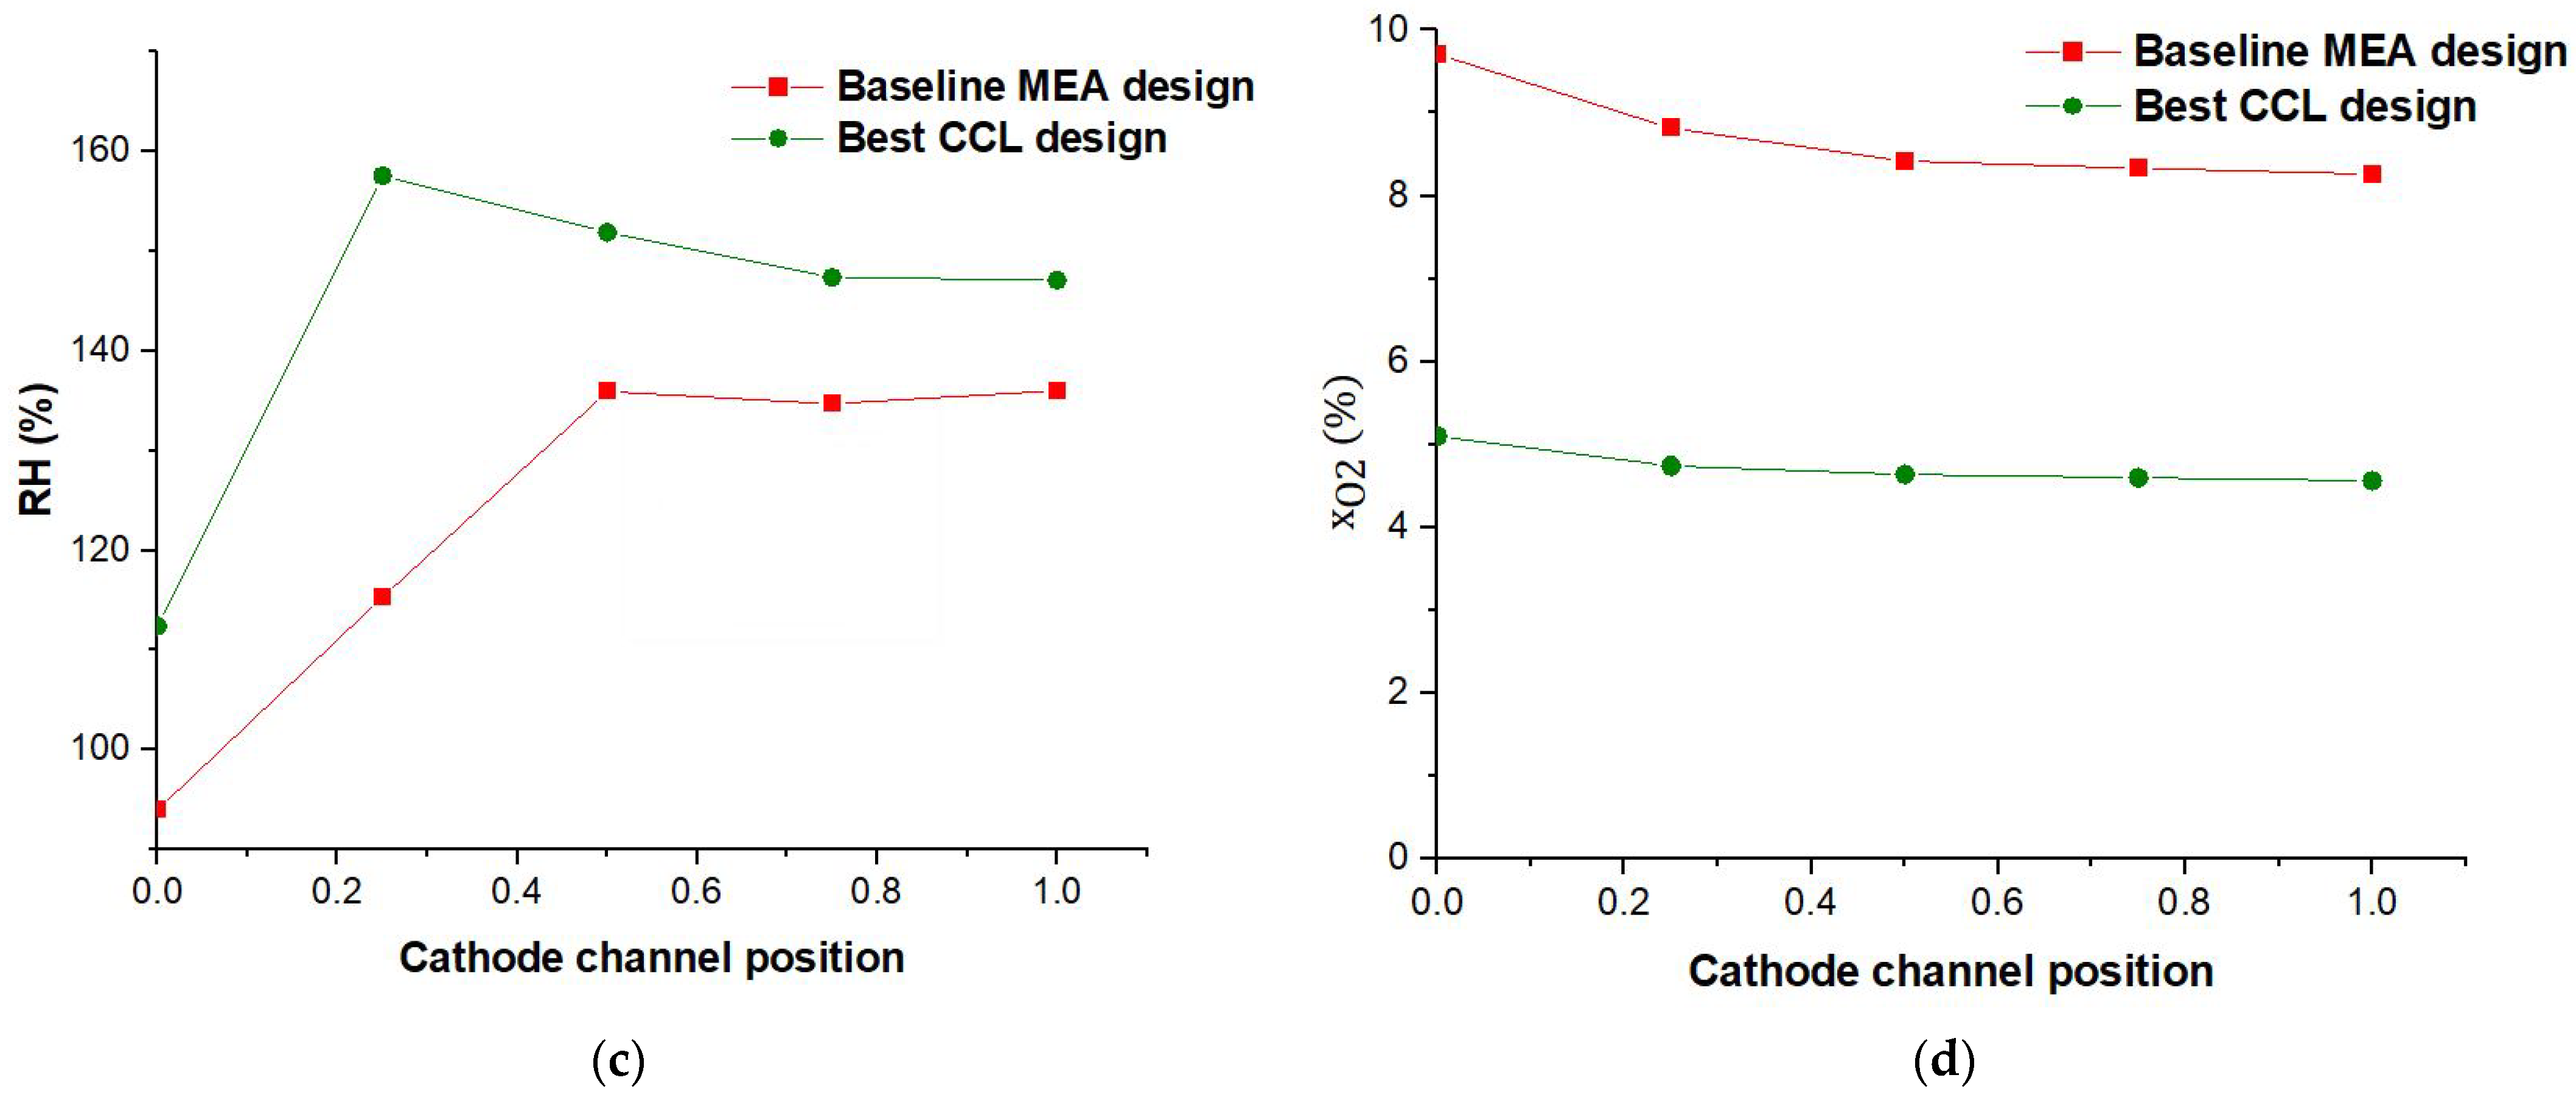
With respect to the baseline MEA design set at t C C L = 15   μ m , ε C C L = 20 % , w t i o n = 20 % , P t / C = 20 % , t P E M = 50   μ m , t C M P L = 90   μ m , and ε C M P L = 40 % , the individual effects of the parameters listed for the CCL in Table 1, namely t C C L ,   ε C C L , w t i o n , and P t / C , are evaluated to ascribe the interdependence on the overall cell performance for open-cathode cells. When t C C L is increased from 15   μ m to 30   μ m , the m P t doubles to 0.88 mg cm−2 as compared to 0.44 mg cm−2, and the CD increases by 9.4% and 1.2% at 0.6 V and 0.4 V, respectively, as compared to the baseline. The main reason for the improved performance is the higher Pt loading resulting from the greater CCL thickness, noting that m P t is proportional to t C C L while keeping other factors constant. Thus, the overall increase in CD comes at the expense of a very high Pt loading spread volumetrically. Similarly, when P t / C is increased from 20% to 60% while keeping the other electrode parameters at the baseline reference, the overall Pt loading increases from 0.44 mg cm−2 to 2.0 mg cm−2, which is undesirable for preparation considering the high material cost of such a CCL design. Equivalent trends are also obtained for ε C C L and w t i o n when parameterized individually as per Table 1. The CCL design is thus found interlinked in the different variables associated with it. Thus, the parametric design analysis of the CCL is performed by evaluating a total of 54 cases obtained from the feasible permutations of the selected design variables, namely t C C L ,     ε C C L , w t i o n , and P t / C as specified in Table 1. The individual cases that result in very high Pt loading (above 1 mg Pt cm−2) are discarded considering the cost implication. Out of the remaining subset of 40 cases, the CCL design with t C C L = 15   μ m , ε C C L = 40 % , w t i o n = 40 % , and P t / C = 60 % gives the highest CD of 0.45 A cm−2 at 0.6 V as compared to 0.34 A cm−2 for the baseline case. The use of high Pt content ( P t / C ) is acceptable given the objective of strategic MEA design, which imparts enhanced current/power density compared to the baseline conditions. The cases that give relatively high cell performance at the expense of a high Pt/C ratio are considered feasible since the specific Pt loading per kW of power produced can still be lower. Figure 5a shows the comparative polarization curve for the base case and the CCL design case with the highest cell performance. There is an overall shift from the base case at all operating current densities with a nearly 30% increment in current density observed at 0.6 V. The gap narrows down at lower cell voltages and is merely 4.2% at 0.4 V. The reasons for the increased CD for this modified CCL design are established by reviewing the trends (Figure 5b–d) of T, RH, and ηact+MT. The average temperature for the best CCL design case increases by 2–3 °C at the cathode outlet region as compared to the base case. This can be attributed to increased heat generation due to the higher current density at 0.6 V, which is influenced by the higher levels of w t i o n and P t / C for the best CCL design case as compared to the baseline. The increment in w t i o n from 20% to 40% provides improved proton conductivity, whereas the P t / C increment from 20% to 60% aids the oxygen reduction reaction (ORR), which in turn leads to higher CD and thereby increased temperature levels. The increment in average temperature from inlet to outlet shows a similar trend to that reported for open-cathode cells in the literature [36] and is attributed to self-heating at the cell level. The ΔT from inlet to outlet is roughly 10 °C for the best CCL design as compared to 7.5 °C for the base case. From Figure 5c, the RH at the CCL increases by up to 40% at the cathode inlet region for the best CCL design as compared to the base case. The difference in RH decreases somewhat towards the outlet and remains 10–15% higher. The elevated RH can be attributed to the increment in w t i o n and P t / C for the best CCL design as compared to the base case, which facilitates higher CD resulting in a higher amount of water produced at the CCL. The relative drop in ΔRH towards the outlet can be explained by the increased self-heating observed in the temperature plots (Figure 5b). Overall, however, it is noteworthy that both cases exhibit adequate hydration at the CCL, so membrane dry-out is unlikely. The O2 mole fraction at the CCL shows a reverse trend versus the T and RH profiles, as seen in Figure 5d, as it decreases for the best CCL design as compared to the base case. The decrease in O2 mole fraction is related to the increased consumption of O2 due to the increased CD obtained for the best CCL design. The two cases show a similar ohmic loss (ηohm) fraction of 16% out of the total polarization losses, as calculated using (22). With increased CD, ηohm increases for a fixed design case. For the best CCL design, however, this is compensated by increased ionomer fraction in the CCL and increased proton conductivity facilitated by improved hydration.

3.2.3. Cathode MPL Parametric Design

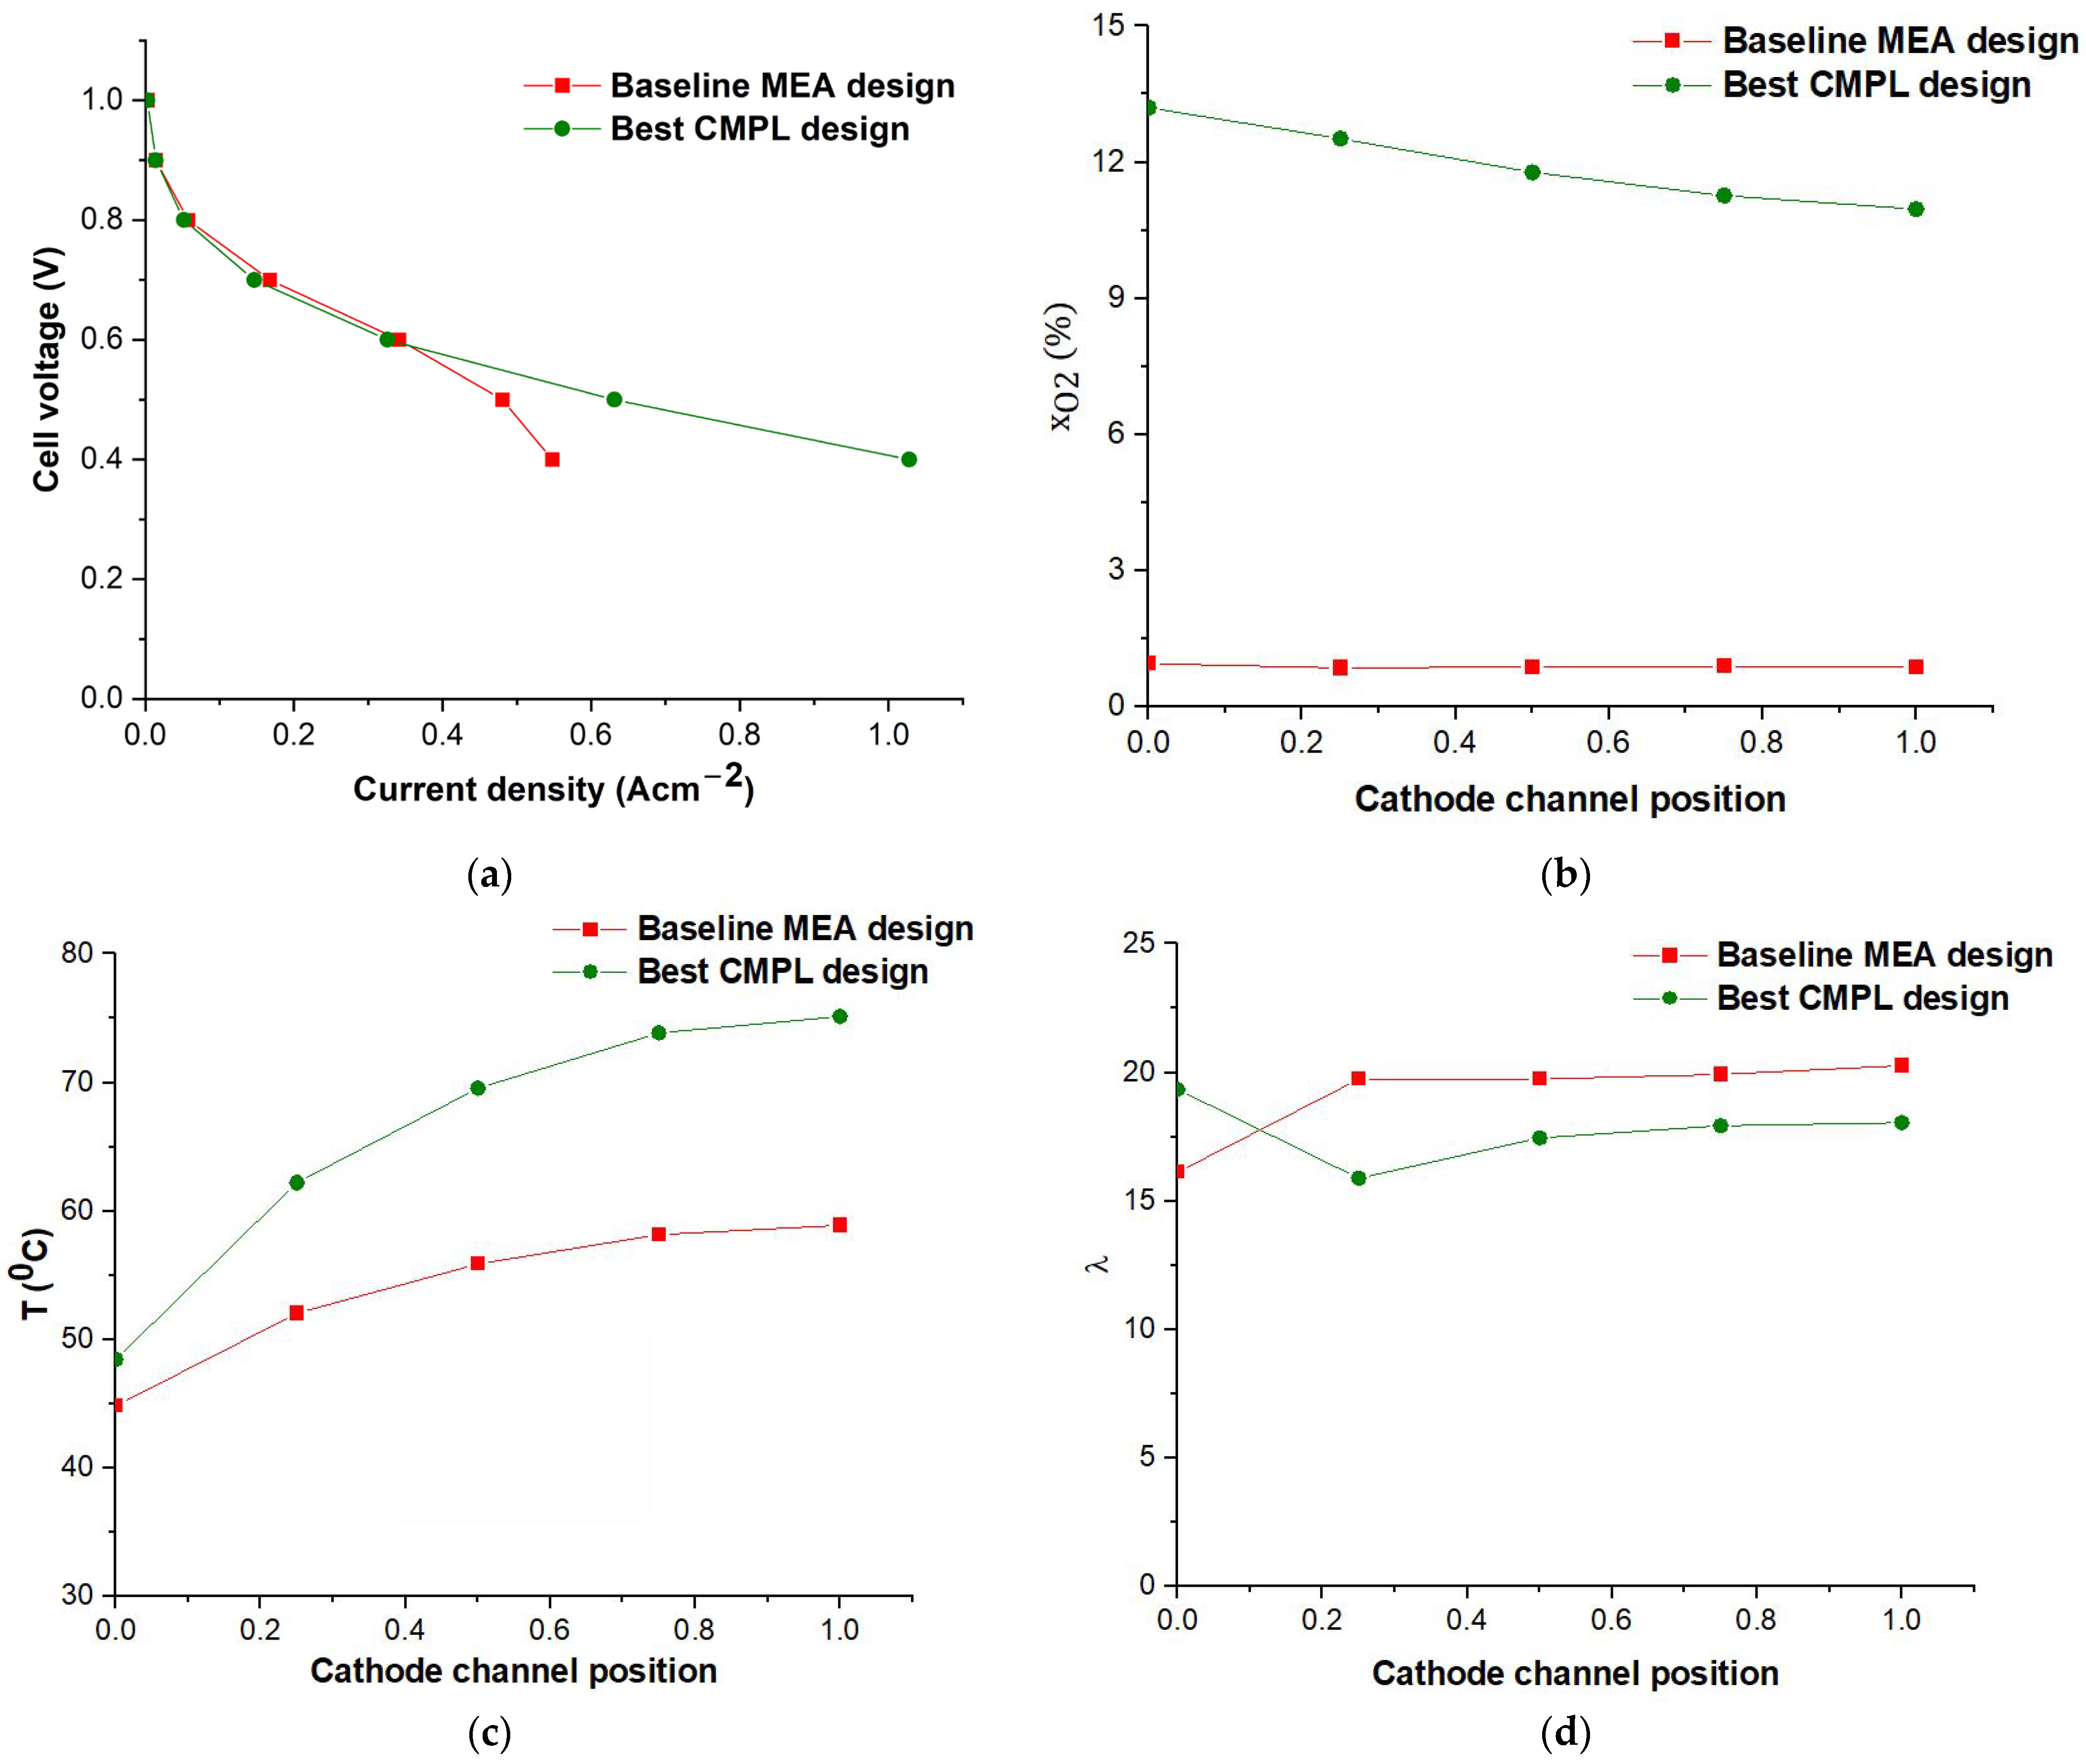
The effect of CMPL design on open-cathode fuel cell performance is analyzed by changing the CMPL thickness and porosity as compared to the base case. The CMPL thickness is varied at three levels of 30, 60, and 90 µm, whereas the CMPL porosity is kept at two different levels of 40% and 60%. A total of five different cases are evaluated, and the results in terms of CD are compared. When the CMPL thickness is reduced while keeping the porosity constant, the cell performance is found to increase. Similarly, increased porosity at a fixed CMPL thickness also leads to performance improvement. Hence, the thinnest CMPL (30 µm) with the highest porosity (60%) is found to maximize the open-cathode cell performance at both cell voltages (0.6 and 0.4 V) and is therefore considered the best CMPL design. Figure 6a shows the comparative polarization results for the base case and the best CMPL design case. The increment in cell performance is found to be achieved primarily in the mass transport region when operated at lower cell voltages. Figure 6b shows that the O2 mole fraction at the CCL at 0.4 V is greatly improved for the best CMPL design as compared to the base case. For the base case, the O2 availability is minimal and shows signs of O2 scarcity at high current density operation, whereas, for the obtained best CMPL design, the thin MPL with high porosity provides substantially lower oxygen diffusion resistance between the channel and the CCL. Thus, the best CMPL design is able to sustain good oxygen availability at the CCL despite the higher CD and rate of oxygen conversion. Moreover, the average CCL temperature in the outlet region is found to increase by nearly 15 °C for the best CMPL design as compared to the base case, as depicted in Figure 6c [57]. This effect can be attributed to the increased reactant availability at the CCL, which intensifies the rate of ORR and thus generates more heat. Synergistically, the increased CCL temperature for the best CMPL design also aids the ORR by improving the cell kinetics, which results in increased CD as depicted in Figure 6a. However, it is important to monitor and control the temperature of such open-cathode cells for safety, since overheating could conceivably occur under abnormal events. Interestingly, the water content (λ) at the PEM for the best CMPL design remains lower throughout the cell as compared to the base case, as evident from Figure 6d. This is a consequence of the increased ORR and higher heat generation which implicates overall drying of the CCL and the PEM and is common to an open-cathode system. This critical effect is further investigated in Figure 7, featuring the full cathode side RH profiles in the two comparative cases. The RH is maximum at the CCL as compared to other parts of the cathode side and remains oversaturated for the base case, whereas for the best CMPL design the RH at the CCL drops from roughly 80% at the inlet to 40% at the outlet. Also, the RH drops further to 20% at the cathode flow channel outlet. This drying effect can be attributed to heat generation due to the high ORR rate and CD of the best CMPL design, unlike the base case, and complements the λ trend at the PEM from Figure 6d. Also, it can be concluded that even though drying is evident in such operating cases for open-cathode systems, strategic CMPL design can achieve considerably improved cell performance.

3.3. DoE Analysis

The DoE analysis is performed using statistical software (Minitab 17) for three MEA design variables termed as factors, namely PEM, CCL, and CMPL, with two levels at high (H) and low (L) as per Table 2. The maximum and minimum performing design cases obtained from the parametric evaluation of the three individual layers, namely the PEM, CCL, and CMPL, are taken as the two distinct levels termed H and L, respectively. A total of eight simulations are run at these design levels, and the resultant CD at 0.6 and 0.4 V is used as the response to evaluate the main and interaction effects of these factors using a full factorial design. Table 3 lists the individual responses in terms of CD for these eight different cases of the DoE. The change in CD with respect to the design case with all three factors at their low level is also tabulated to understand the significance of the design changes. For the operation of open-cathode PEMFC at 0.6 V, case-8 having an HHH design space shows the highest performance with an increment of 119% in CD compared to the base case, i.e., case-1 (LLL), whereas case-7 and case-8 are found to have the highest performance among all the eight DoE cases with LHH and HHH design for PEM, CCL, and CMPL, respectively, for operation at 0.4 V. A detailed understanding of the DoE results is evaluated based on ANOVA analysis performed with a 95% significance level at 0.6 and 0.4 V, for which the details are listed in Table 4 and Table 5, respectively. The three-way interaction effect is analyzed as an initial step of DoE at each cell voltage; however, this high-order interaction is found to be minimal for both cell voltages and hence eliminated for the final analysis of the data. At medium current density (0.6 V), the effect of CCL design is maximum followed by CMPL and PEM in terms of main effects, all three being statistically significant. Also, the CCL and CMPL interaction effect is significant as compared to the less significant PEM and CMPL interaction. The PEM and CCL interaction effect is not significant and hence neglected from the final DoE analysis at 0.6 V shown in Table 4 and Figure 8. The interaction plot (Figure 8a) reveals the nature of these interactions: concurrently high levels (HH) of PEM and CCL, and more importantly, concurrently high levels (HH) of CCL and CMPL have a particularly beneficial impact on the CD of the open-cathode cell operated at 0.6 V. This further reveals significant coupling between the design of the individual MEA layers that should be considered when designing open-cathode MEAs and fuel cells. The DoE results at high current density (0.4 V) show the CMPL main effect to be heavily dominant as compared to those of the CCL and PEM, with the main effect of PEM being negligible. The interaction of CCL and CMPL is dominant among the two-way interactions, which is consistent with the outcome at 0.6 V, whereas the other two-way interactions are insignificant and hence neglected from the final DoE analysis at 0.4 V (Table 5 and Figure 8c,d). Interestingly, this outcome suggests that the open-cathode cell performance at 0.4 V is statistically independent of the PEM thickness (10–50 µm) within the present scope of the DoE. This outcome, however, is influenced by the very strong impact of the CMPL design. The ANOVA analysis thus justifies the increase in CD with an enhanced level design of CCL and CMPL at both 0.6 V and 0.4 V. This is in adherence to the individual parametric study where CCL and CMPL were found to be influential but further shows their important coupled effect. At 0.4 V, the CMPL design dominance can be attributed to the well-managed oxygen mass transport achieved with a thin, highly porous CMPL as compared to an inferior CMPL design. Also, most notably at 0.6 V, the combined CCL and CMPL design elevation (thin, high-porosity CMPL and CCL; high ionomer loading; and high Pt/C ratio) contributes reduced ohmic resistance paired with favourable reaction kinetics, which leads to an overall performance enhancement for open-cathode PEMFCs. At this specific condition, the cell performance can be additionally enhanced by PEM design (i.e., thin membrane) via further reduction in ohmic loss.
A comparative analysis of the baseline MEA design (LLL: case-1) and the optimum MEA design achieved (HHH: case-8) from the DoE analysis is conducted to estimate the potential benefits for the fuel cell power system, with the main results shown in Figure 9. For a nominal 200 cm2 electrode active area operated at a rated voltage of 0.6 V, the net power produced per cell would be 41.0 W for the baseline MEA design, whereas the optimum MEA design would reach 90.6 W, a net improvement of 121%. Considering these values, when a 1 kW-rated stack is built using the optimum MEA design, only 11 cells of 200 cm2 are required as compared to 25 cells for the baseline MEA design. This shows that upon strategic MEA design specifically for open-cathode requirements, the net stack weight and estimated materials cost could be reduced by 56% per kW of power output. The new MEA design could also enable a doubling of the power output of a given stack size.

3.4. γ Interaction with Optimized MEA Design

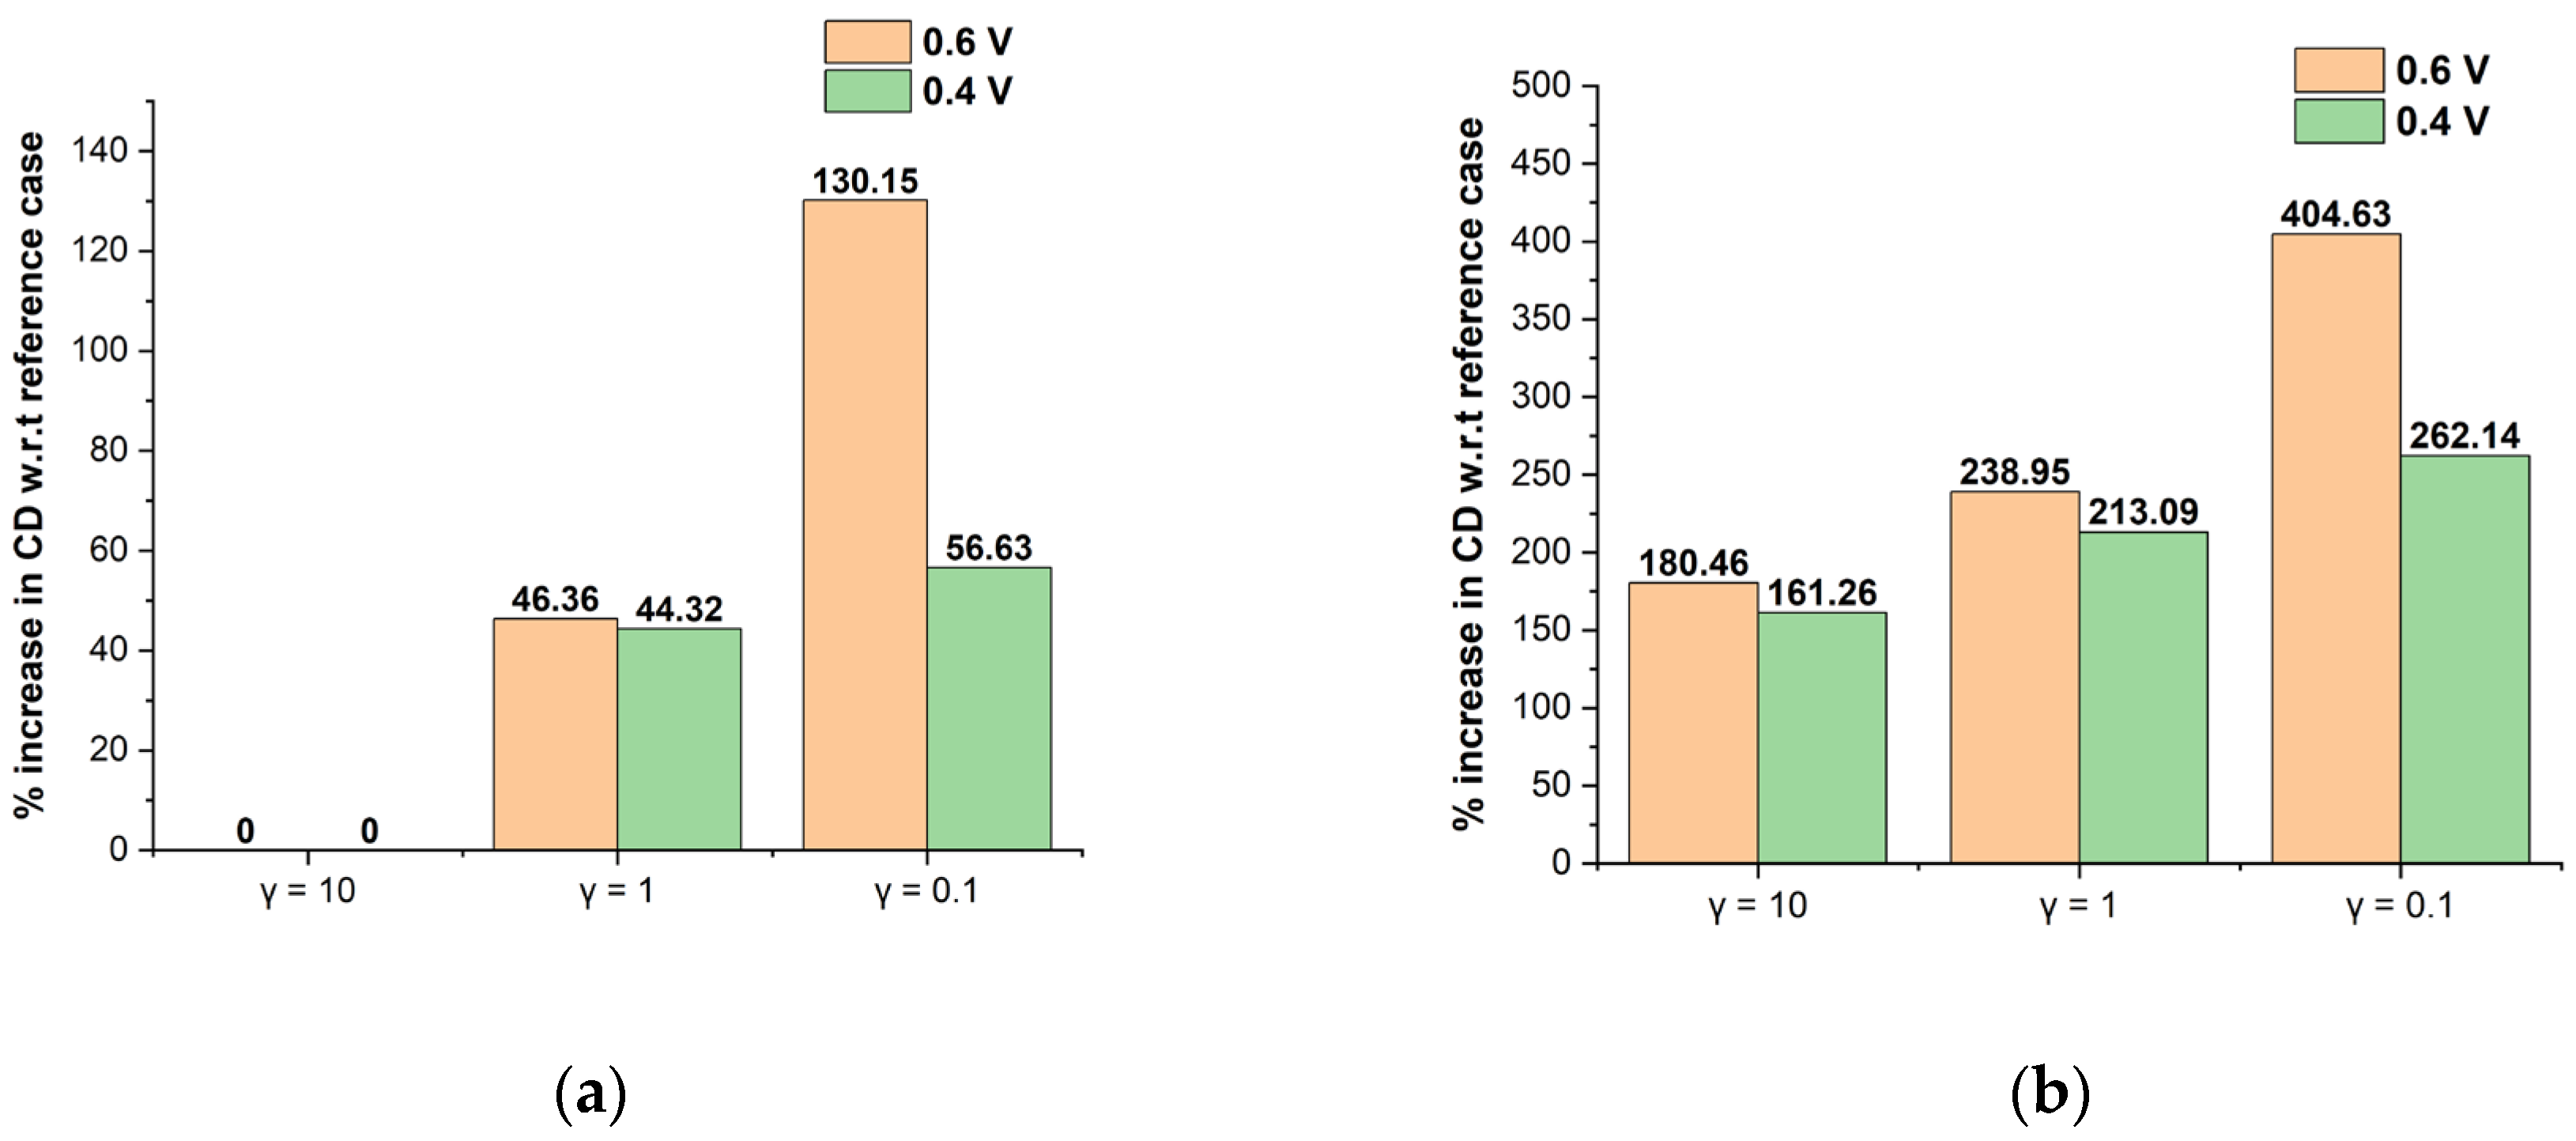
The sorption/desorption rate constant of the ionomer (γ) is an important factor influencing the CCL design, as presented in our previous work [39]. The effect of γ at three levels of 10, 1, and 0.1 s−1 is simulated for the reference case and the best optimized case from prior discussions to analyze the interaction of γ with the optimum MEA design space for open-cathode cells. From Figure 10, the change in γ is found to bring a CD improvement of 130% at 0.6 V and 57% at 0.4 V for the reference design space when varied from 10 to 0.1. For the same change in γ for the optimized MEA design space, the increment is 224% at 0.6 V and 100% at 0.4 V, respectively. The effect of γ on the cell performance of open-cathode PEMFCs by providing optimum water retention in the ionomer phase at the CCL is evident in all cases. Interestingly, this trend reveals the coupling between favourable γ improvement and favourable design space for the MEA. Decreased γ with improved MEA design is found to boost the performance by complementing each other. This can be attributed to the improved water retention in the dissolved phase contributed by lower γ and better water and O2 transport facilitated by improved CMPL and CCL design. The combination presented as an optimized MEA design with γ = 0.1 s−1 is found to optimize thermal and water management for open-cathode PEMFCs and elevate the cell performance close to that of a conventional liquid-cooled design.

4. Conclusions

In the present work, a model-driven approach was used to investigate the impact of selected MEA design parameters on the cell performance of an open-cathode PEM fuel cell system operated at a typical dry ambient condition of 40 °C and 40% RH. A pre-validated 3D computational fuel cell model developed specifically for open-cathode PEMFCs was utilized for this purpose. In the first phase, a parametric screening study was performed on a comprehensive set of design parameters for the PEM, CCL, and CMPL sub-components, whereas each component change was treated individually while the other components were kept at the baseline level. The PEM thickness showed the least sensitivity towards the CD as the MEA performance metric of interest. For the CCL, out of 40 design cases evaluated with Pt loading below 1 mg cm−2, the most influential factors were high ionomer loading to improve proton conductance and a high P t / C   ratio to enhance the oxygen reduction kinetics, which collectively led to a higher CD and thereby increased cell temperature. Overall, the thin CCL design with moderate porosity and ionomer loading and a high P t / C ratio gave the highest CD of 0.45 A cm−2 at 0.6 V as compared to 0.34 A cm−2 for the baseline design. Similarly, a thin CMPL design with high porosity was found to enhance the CD by means of lower oxygen diffusion resistance, with the strongest effect observed at 0.4 V. This design was able to sustain good oxygen availability at the CCL despite the higher CD and rate of oxygen conversion. The kinetics were also promoted by the higher internal cell temperature reached due to the increased heat generation within the cell at elevated CD. However, drying of the membrane was also evident as a consequence of this, which restricted the overall performance.
In the second phase of this work, a statistical analysis using full factorial DoE was performed for the MEA design using three factors, namely the PEM, CCL, and CMPL, with their high- and low-performing design cases obtained from the parametric study. At 0.6 V, the CCL showed the maximum significance over the CMPL and PEM factors in terms of individual effect, whereas the CCL and CMPL interaction was the most significant interaction effect. A synergistic benefit was observed from the combination of high-performing CCL and CMPL designs, which can be attributed to concurrent improvements in reaction kinetics and reduced ohmic resistance. On the other hand, at 0.4 V, the CMPL showed the strongest individual effect while the CCL and CMPL interaction was yet again the key interaction effect of significance. This was attributed to the well-managed oxygen transport and self-heating achieved with the thin, highly porous CMPL design as compared to the inferior baseline design. Overall, the strategic MEA design that leverages the jointly improved CCL, CMPL, and PEM designs was shown to more than double the CD performance at both 0.6 and 0.4 V, as the collective benefits of this MEA design were able to induce simultaneous improvements in kinetic, ohmic, and mass transport properties aided by elevated cell temperature while retaining sufficient moisture to maintain good membrane hydration. A low rate of water sorption/desorption at the ionomer was also shown to be beneficial for the overall cell performance by virtue of improved water retention at the CCL under the relatively dry operating environment experienced by open-cathode PEMFCs. At the rated operating cell voltage of 0.6 V, the power produced by a single cell using an optimum MEA design is 121% higher as compared to a cell having the baseline MEA design, which would effectively double the power output of a given stack size. Also, a 56% reduction in stack weight and estimated materials costs could be achieved per kW of power by strategically selecting the optimum MEA design as compared to the baseline MEA design. In summary, it is important to consider the significant coupling between the design of the individual MEA layers when designing open-cathode MEAs and fuel cells. Subject to strategic design improvements and further experimental research, the performance of open-cathode cells could eventually approach that of liquid-cooled cells, thus unlocking opportunities for greater power output and further cost reduction with simplified open-cathode fuel cell systems.

Author Contributions

Conceptualization, A.S., S.C. and E.K.; Methodology, A.S. and E.K.; Validation, A.S.; Formal analysis, A.S.; Investigation, A.S.; Resources, S.C. and E.K.; Writing—original draft, A.S.; Writing—review & editing, E.K.; Supervision, S.C. and E.K.; Funding acquisition, S.C. and E.K. All authors have read and agreed to the published version of the manuscript.

Funding

This work was supported by the Indian Oil R&D Centre, Faridabad, India, and Simon Fraser University, Canada, under the SFU-IOCL joint PhD mobility agreement (F113388 dated 12 May 2014). This research was undertaken, in part, thanks to funding from the Canada Research Chairs program.

Data Availability Statement

The data presented in this study are available on request from the corresponding author. The data are not publicly available due to confidentiality terms enforced by the participating institutions Indian Oil Corporation Limited and Simon Fraser University.

Conflicts of Interest

The authors declare no conflict of interest.

Nomenclature

a Vapour phase saturation
a v Active specific surface area (m−1)
A c e l l Active electrochemical area (m2)
c i Molar concentration of ith species (mol m−3)
DGas phase diffusivity (m s−1)
FFaraday’s constant (C mol−1)
jCurrent density (A m−2)
m P t Platinum loading (g m−2)
P t / C Percentage platinum on carbon (%)
PPressure (Pa)
RGas constant (J mol−1 K−1)
SSource
tiThickness of ith domain (m)
TTemperature (K)
u Velocity vector (m s−1)
VVolume (m3)
V ˙ Volumetric flow rate (m3 s−1)
WWeight (kg)
w t i o n Ionomer loading (%)
x O 2 Mole fraction of oxygen (%)
Greek symbols
αiCharge transfer coefficient at ith electrode
γ Water sorption/desorption rate constant (s−1)
εiVolume fraction of ith domain
η Overpotential (V)
λWater content
σ i Effective electrolyte conductivity of ith domain (S m−1)
ΣSummation
ϕiPotential at ith electrode (V)
Acronyms
3DThree dimensional
ANOVAAnalysis of variance
BCBoundary condition
BPPBi-polar plate
CLCatalyst layer
CCLCathode catalyst layer
CDCurrent density
CMPLCathode microporous layer
DoEDesign of experiments
FFFlow field
GDLGas diffusion layer
HHigh
LLow
MEAMembrane electrode assembly
MPLMicroporous layer
MTMass transfer
ORROxygen reduction reaction
PEMPolymer electrolyte membrane
PEMFCPolymer electrolyte membrane fuel cell
PtPlatinum
Pt/CPlatinum on carbon
RHRelative humidity
VLBVoltage loss breakdown
Subscripts
aAnode
cCathode
CCarbon
effEffective
inInlet
ionIonomer
mMembrane
molMolar
ohmOhmic
refReference
sSolid
satSaturation
vVolumetric

References

  1. Çabukoglu, E.; Georges, G.; Küng, L.; Pareschi, G.; Boulouchos, K. Fuel cell electric vehicles: An option to decarbonize heavy-duty transport? Results from a Swiss case-study. Transp. Res. Part D Transp. Environ. 2019, 70, 35–48. [Google Scholar] [CrossRef]
  2. Eriksson, E.; Gray, E. Optimization and integration of hybrid renewable energy hydrogen fuel cell energy systems—A critical review. Appl. Energy 2017, 202, 348–364. [Google Scholar] [CrossRef]
  3. Ahmadi, P.; Kjeang, E. Comparative life cycle assessment of hydrogen fuel cell passenger vehicles in different Canadian provinces. Int. J. Hydrogen Energy 2015, 40, 12905–12917. [Google Scholar] [CrossRef]
  4. Wee, J.-H. Contribution of fuel cell systems to CO2 emission reduction in their application fields. Renew. Sustain. Energy Rev. 2010, 14, 735–744. [Google Scholar] [CrossRef]
  5. Wee, J.-H. Carbon dioxide emission reduction using molten carbonate fuel cell systems. Renew. Sustain. Energy Rev. 2014, 32, 178–191. [Google Scholar] [CrossRef]
  6. Chan, C.C. The State of the Art of Electric, Hybrid, and Fuel Cell Vehicles. Proc. IEEE 2007, 95, 704–718. [Google Scholar] [CrossRef]
  7. Meyer, Q.; Himeur, A.; Ashton, S.; Curnick, O.; Clague, R.; Reisch, T.; Adcock, P.; Shearing, P.R.; Brett, D.J. System-level electro-thermal optimisation of air-cooled open-cathode polymer electrolyte fuel cells: Air blower parasitic load and schemes for dynamic operation. Int. J. Hydrogen Energy 2015, 40, 16760–16766. [Google Scholar] [CrossRef]
  8. Shahsavari, S.; Bahrami, M.; Kjeang, E. Computational Analysis of Heat Transfer in Air-Cooled Fuel Cells. In Proceedings of the ASME 2011 9th International Conference on Fuel Cell Science, Engineering and Technology Collocated with ASME 2011 5th International Conference on Energy Sustainability, FUELCELL 2011, Washington, DC, USA, 7–10 August 2011; pp. 799–808. [Google Scholar]
  9. Andisheh-Tadbir, M.; Desouza, A.; Bahrami, M.; Kjeang, E. Cell level modeling of the hygrothermal characteristics of open cathode polymer electrolyte membrane fuel cells. Int. J. Hydrogen Energy 2014, 39, 14993–15004. [Google Scholar] [CrossRef]
  10. Wang, Y.; Diaz, D.F.R.; Chen, K.S.; Wang, Z.; Adroher, X.C. Materials, technological status, and fundamentals of PEM fuel cells—A review. Mater. Today 2020, 32, 178–203. [Google Scholar] [CrossRef]
  11. Olabi, A.; Wilberforce, T.; Abdelkareem, M.A. Fuel cell application in the automotive industry and future perspective. Energy 2020, 214, 118955. [Google Scholar] [CrossRef]
  12. Mench, M.M. Fuel Cell Engines; John Wiley & Sons: Hoboken, NJ, USA, 2008. [Google Scholar]
  13. Kim, B.J.; Kim, M.S. Studies on the cathode humidification by exhaust gas recirculation for PEM fuel cell. Int. J. Hydrogen Energy 2012, 37, 4290–4299. [Google Scholar] [CrossRef]
  14. Kolde, J.A.; Bahar, B.; Wilson, M.S.; Zawodzinski, T.A.; Gottesfeld, S. Advanced Composite Polymer Electrolyte Fuel Cell Membranes. ECS Proc. Vol. 1995, 1995, 193–201. [Google Scholar] [CrossRef]
  15. Liu, W.; Suzuki, T.; Mao, H.; Schmiedel, T. Development of Thin, Reinforced PEMFC Membranes through Understanding of Structure-Property-Performance Relationships. ECS Trans. 2013, 50, 51–64. [Google Scholar] [CrossRef]
  16. Serov, A.; Artyushkova, K.; Niangar, E.; Wang, C.; Dale, N.; Jaouen, F.; Sougrati, M.-T.; Jia, Q.; Mukerjee, S.; Atanassov, P. Nano-structured non-platinum catalysts for automotive fuel cell application. Nano Energy 2015, 16, 293–300. [Google Scholar] [CrossRef]
  17. Thompson, S.T.; Papageorgopoulos, D. Platinum group metal-free catalysts boost cost competitiveness of fuel cell vehicles. Nat. Catal. 2019, 2, 558–561. [Google Scholar] [CrossRef]
  18. Nanadegani, F.S.; Lay, E.N.; Sunden, B. Effects of an MPL on water and thermal management in a PEMFC. Int. J. Energy Res. 2019, 43, 274–296. [Google Scholar] [CrossRef]
  19. Yan, S.; Yang, M.; Sun, C.; Xu, S. Liquid Water Characteristics in the Compressed Gradient Porosity Gas Diffusion Layer of Proton Exchange Membrane Fuel Cells Using the Lattice Boltzmann Method. Energies 2023, 16, 6010. [Google Scholar] [CrossRef]
  20. Blanco, M.; Wilkinson, D.P. Investigation of the effect of microporous layers on water management in a proton exchange membrane fuel cell using novel diagnostic methods. Int. J. Hydrogen Energy 2014, 39, 16390–16404. [Google Scholar] [CrossRef]
  21. Nanadegani, F.S.; Lay, E.N.; Sunden, B. Computational analysis of the impact of a micro porous layer (MPL) on the characteristics of a high temperature PEMFC. Electrochim. Acta 2020, 333, 135552. [Google Scholar] [CrossRef]
  22. Kandlikar, S.G.; Lu, Z. Thermal management issues in a PEMFC stack—A brief review of current status. Appl. Therm. Eng. 2009, 29, 1276–1280. [Google Scholar] [CrossRef]
  23. Pourrahmani, H.; Moghimi, M.; Siavashi, M. Thermal management in PEMFCs: The respective effects of porous media in the gas flow channel. Int. J. Hydrogen Energy 2019, 44, 3121–3137. [Google Scholar] [CrossRef]
  24. Zhang, G.; Kandlikar, S.G. A critical review of cooling techniques in proton exchange membrane fuel cell stacks. Int. J. Hydrogen Energy 2012, 37, 2412–2429. [Google Scholar] [CrossRef]
  25. Sasmito, A.; Lum, K.; Birgersson, E.; Mujumdar, A. Computational study of forced air-convection in open-cathode polymer electrolyte fuel cell stacks. J. Power Sources 2010, 195, 5550–5563. [Google Scholar] [CrossRef]
  26. Wasselynck, G.; Auvity, B.; Olivier, J.-C.; Trichet, D.; Josset, C.; Maindru, P. Design and testing of a fuel cell powertrain with energy constraints. Energy 2012, 38, 414–424. [Google Scholar] [CrossRef]
  27. Tadbir, M.A.; Shahsavari, S.; Bahrami, M.; Kjeang, E. Thermal Management of an Air-Cooled PEM Fuel Cell: Cell Level Simulation. In Proceedings of the ASME 2012 10th International Conference on Fuel Cell Science, Engineering and Technology Collocated with the ASME 2012 6th International Conference on Energy Sustainability, FUELCELL 2012, San Diego, CA, USA, 23–26 July 2012; pp. 453–459. [Google Scholar]
  28. Liu, W.; Wan, L.; Liu, J.; Zhao, M.; Zou, Z. Performance improvement of the open-cathode proton exchange membrane fuel cell by optimizing membrane electrode assemblies. Int. J. Hydrogen Energy 2015, 40, 7159–7167. [Google Scholar] [CrossRef]
  29. Santarosa, D.; Pinto, D.; Silva, V.; Silva, R.; Rangel, C. High performance PEMFC stack with open-cathode at ambient pressure and temperature conditions. Int. J. Hydrogen Energy 2007, 32, 4350–4357. [Google Scholar] [CrossRef]
  30. Barreras, F.; López, A.M.; Lozano, A.; Barranco, J.E. Experimental study of the pressure drop in the cathode side of air-forced Open-cathode proton exchange membrane fuel cells. Int. J. Hydrogen Energy 2011, 36, 7612–7620. [Google Scholar] [CrossRef]
  31. Kreesaeng, S.; Chalermsinsuwan, B.; Piumsomboon, P. Effect of Channel Designs on Open-Cathode PEM Fuel Cell Performance: A Computational Study. Energy Procedia 2015, 79, 733–745. [Google Scholar] [CrossRef]
  32. Zhao, C.; Xing, S.; Chen, M.; Liu, W.; Wang, H. Optimal design of cathode flow channel for air-cooled PEMFC with open cathode. Int. J. Hydrogen Energy 2020, 45, 17771–17781. [Google Scholar] [CrossRef]
  33. Kiattamrong, S.; Sripakagorn, A. Effects of the Geometry of the Air Flowfield on the Performance of an Open-Cathode PEMFC—Transient Load Operation; Elsevier: Amsterdam, The Netherlands, 2015; Volume 79. [Google Scholar]
  34. Thomas, S.; Bates, A.; Park, S.; Sahu, A.; Lee, S.C.; Son, B.R.; Kim, J.G.; Lee, D.-H. An experimental and simulation study of novel channel designs for open-cathode high-temperature polymer electrolyte membrane fuel cells. Appl. Energy 2016, 165, 765–776. [Google Scholar] [CrossRef]
  35. Thomas, S.; Kwon, O.; Lee, S.C.; Park, S.; Choi, G.; Choi, J. Optimized Flow Distribution for Enhancing Temperature Uniformity across an Open Cathode PEM Fuel Cell Stack. ECS Trans. 2013, 58, 243–249. [Google Scholar] [CrossRef]
  36. Sagar, A.; Chugh, S.; Sonkar, K.; Sharma, A.; Kjeang, E. A computational analysis on the operational behaviour of open-cathode polymer electrolyte membrane fuel cells. Int. J. Hydrogen Energy 2020, 45, 34125–34138. [Google Scholar] [CrossRef]
  37. Wu, B.; Li, B.; Liu, W.; Liu, J.; Zhao, M.; Yao, Y.; Gu, J.; Zou, Z. The performance improvement of membrane and electrode assembly in open-cathode proton exchange membrane fuel cell. Int. J. Hydrogen Energy 2013, 38, 10978–10984. [Google Scholar] [CrossRef]
  38. Meyer, Q.; Ronaszegi, K.; Pei-June, G.; Curnick, O.; Ashton, S.; Reisch, T.; Adcock, P.; Shearing, P.R.; Brett, D.J. Optimisation of air cooled, open-cathode fuel cells: Current of lowest resistance and electro-thermal performance mapping. J. Power Sources 2015, 291, 261–269. [Google Scholar] [CrossRef]
  39. Sagar, A.; Chugh, S.; Sharma, A.; Kjeang, E. Strategic ionomer design for high performing fuel cells with open cathode. Int. J. Hydrogen Energy 2022, 47, 1940–1946. [Google Scholar] [CrossRef]
  40. Omrani, R.; Shabani, B. Review of gas diffusion layer for proton exchange membrane-based technologies with a focus on unitised regenerative fuel cells. Int. J. Hydrogen Energy 2019, 44, 3834–3860. [Google Scholar] [CrossRef]
  41. Kitahara, T.; Nakajima, H.; Mori, K. Hydrophilic and hydrophobic double microporous layer coated gas diffusion layer for enhancing performance of polymer electrolyte fuel cells under no-humidification at the cathode. J. Power Sources 2012, 199, 29–36. [Google Scholar] [CrossRef]
  42. Atkinson, R.W.; Rodgers, J.A.; Hazard, M.W.; Stroman, R.O.; Gould, B.D. Influence of cathode gas diffusion media porosity on open-cathode fuel cells. J. Electrochem. Soc. 2018, 165, F1002–F1011. [Google Scholar] [CrossRef]
  43. Atkinson, R.W.; Hazard, M.W.; Rodgers, J.A.; Stroman, R.O.; Gould, B.D. Influence of Gas Diffusion Media Compression on Open-Cathode Fuel Cells. J. Electrochem. Soc. 2019, 166, F926–F934. [Google Scholar] [CrossRef]
  44. Shahsavari, S.; Desouza, A.; Bahrami, M.; Kjeang, E. Thermal analysis of air-cooled PEM fuel cells. Int. J. Hydrogen Energy 2012, 37, 18261–18271. [Google Scholar] [CrossRef]
  45. Navarro, A.; Gómez, M.; Daza, L.; Molina-García, A.; López-Cascales, J. Influence of the gas diffusion layer on the performance of an open cathode polymer electrolyte membrane fuel cell. Int. J. Hydrogen Energy 2022, 47, 7990–7999. [Google Scholar] [CrossRef]
  46. Meyer, Q.; Ashton, S.; Boillat, P.; Cochet, M.; Engebretsen, E.; Finegan, D.P.; Lu, X.; Bailey, J.J.; Mansor, N.; Abdulaziz, R.; et al. Effect of gas diffusion layer properties on water distribution across air-cooled, open-cathode polymer electrolyte fuel cells: A combined ex-situ X-ray tomography and in-operando neutron imaging study. Electrochim. Acta 2016, 211, 478–487. [Google Scholar] [CrossRef]
  47. Atkinson, R.W.; Garsany, Y.; Rodgers, J.A.; Hazard, M.W.; Stroman, R.O.; Gould, B.D. Influence of Cathode Catalyst Layer Ionomer on Air-Cooled, Open-Cathode Fuel Cells. ECS Trans. 2017, 80, 461–475. [Google Scholar] [CrossRef]
  48. Brèque, F.; Ramousse, J.; Dubé, Y.; Agbossou, K.; Adzakpa, P. Sensibility study of flooding and drying issues to the operating conditions in PEM Fuel Cells. Int. J. Energy Environ. 2010, 1, 1–20. [Google Scholar]
  49. Shin, S.-J.; Lee, J.-K.; Ha, H.-Y.; Hong, S.-A.; Chun, H.-S.; Oh, I.-H. Effect of the catalytic ink preparation method on the performance of polymer electrolyte membrane fuel cells. J. Power Sources 2002, 106, 146–152. [Google Scholar] [CrossRef]
  50. Cho, Y.-H.; Park, H.-S.; Cho, Y.-H.; Jung, D.-S.; Park, H.-Y.; Sung, Y.-E. Effect of platinum amount in carbon supported platinum catalyst on performance of polymer electrolyte membrane fuel cell. J. Power Sources 2007, 172, 89–93. [Google Scholar] [CrossRef]
  51. Marquis, J.; Coppens, M.-O. Achieving ultra-high platinum utilization via optimization of PEM fuel cell cathode catalyst layer microstructure. Chem. Eng. Sci. 2013, 102, 151–162. [Google Scholar] [CrossRef]
  52. Liu, Y.; Murphy, M.W.; Baker, D.R.; Gu, W.; Ji, C.; Jorne, J.; Gasteiger, H.A. Proton Conduction and Oxygen Reduction Kinetics in PEM Fuel Cell Cathodes: Effects of Ionomer-to-Carbon Ratio and Relative Humidity. J. Electrochem. Soc. 2009, 156, B970–B980. [Google Scholar] [CrossRef]
  53. Cao, T.-F.; Lin, H.; Chen, L.; He, Y.-L.; Tao, W.-Q. Numerical investigation of the coupled water and thermal management in PEM fuel cell. Appl. Energy 2013, 112, 1115–1125. [Google Scholar] [CrossRef]
  54. El Hannach, M.; Singh, R.; Djilali, N.; Kjeang, E. Micro-porous layer stochastic reconstruction and transport parameter determination. J. Power Sources 2015, 282, 58–64. [Google Scholar] [CrossRef]
  55. Nam, J.H.; Kaviany, M. Effective diffusivity and water-saturation distribution in single- and two-layer PEMFC diffusion medium. Int. J. Heat Mass Transf. 2003, 46, 4595–4611. [Google Scholar] [CrossRef]
  56. Weber, A.Z.; Newman, J. Effects of Microporous Layers in Polymer Electrolyte Fuel Cells. J. Electrochem. Soc. 2005, 152, A677. [Google Scholar] [CrossRef]
  57. Zhou, J.; Shukla, S.; Putz, A.; Secanell, M. Analysis of the role of the microporous layer in improving polymer electrolyte fuel cell performance. Electrochim. Acta 2018, 268, 366–382. [Google Scholar] [CrossRef]
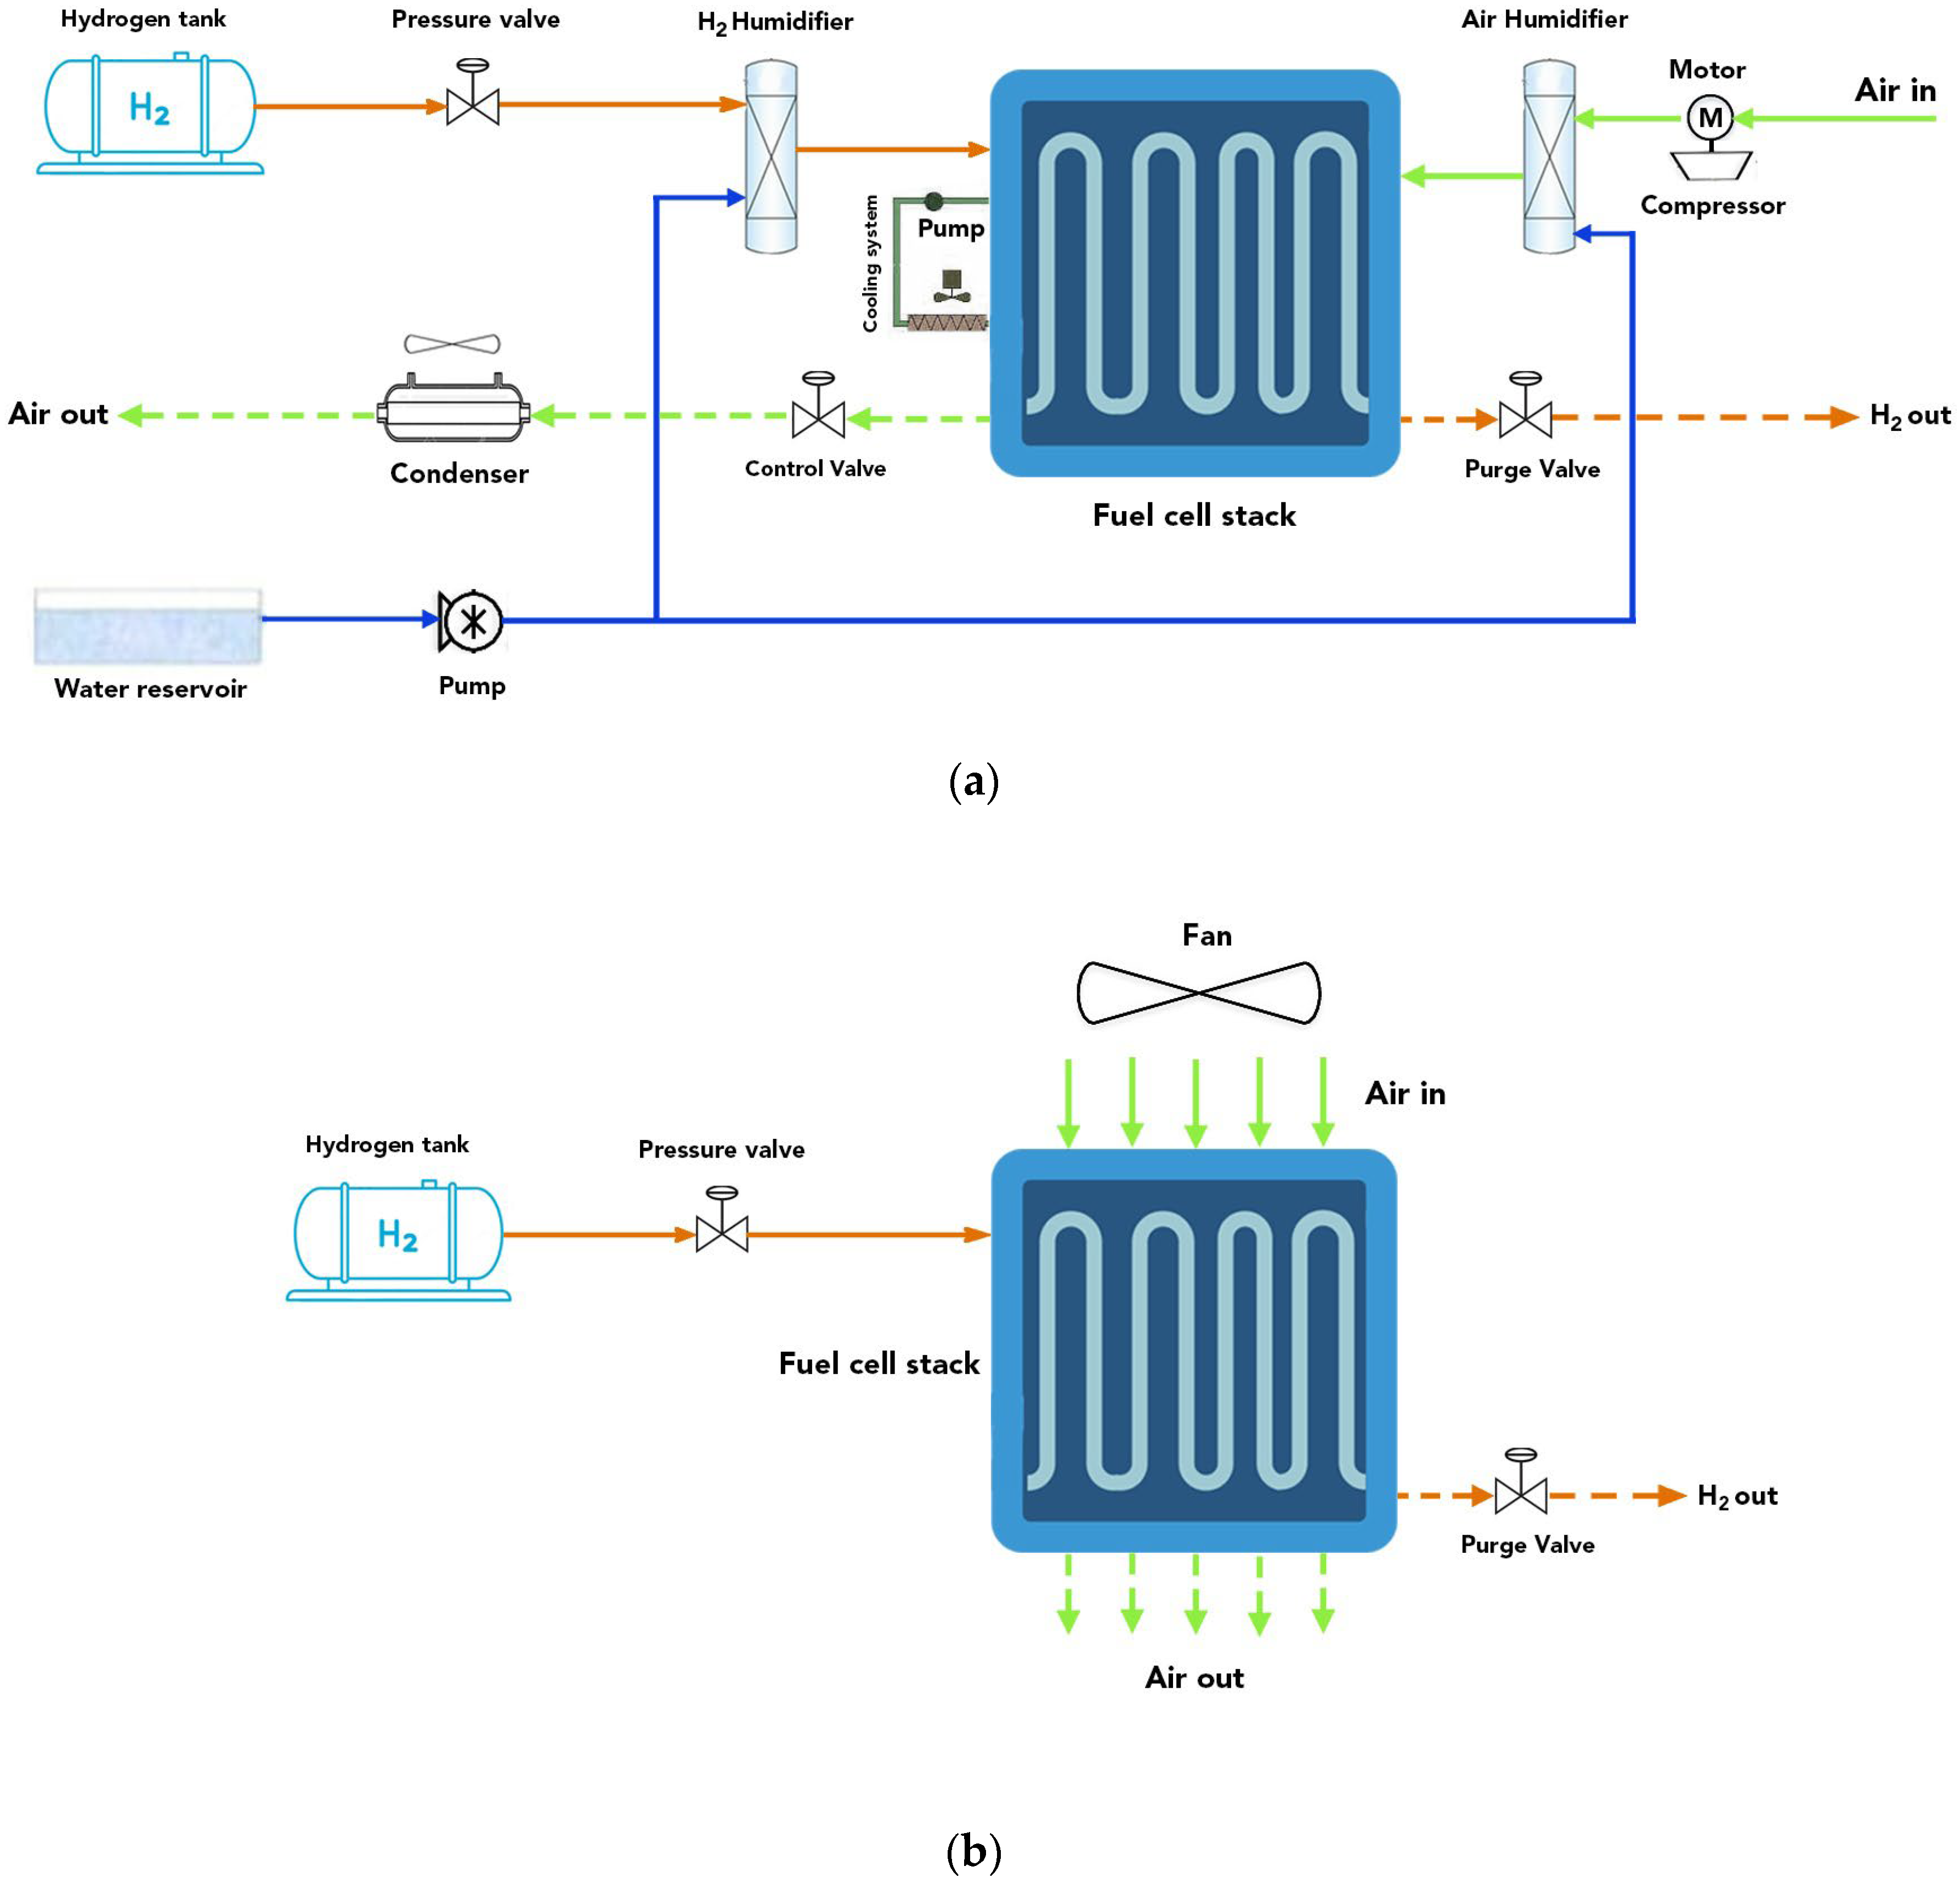
Figure 1. Schematics of (a) conventional liquid-cooled and (b) open-cathode PEMFC systems.
Energies 16 07472 g001
Figure 2. (a) Schematic of an open-cathode PEM fuel cell stack with the open-cathode flow field (FF) in the bipolar plate (BPP) of a single cell portrayed on the right. (b) Cross-sectional, along-the-channel view of the 3D computational domain with annotated interfaces (indicated by Roman numerals) and boundary conditions (BCs).
Energies 16 07472 g002aEnergies 16 07472 g002b
Figure 3. Model validation on an open-cathode single cell operating at ambient condition of 50 °C and 30% RH.
Energies 16 07472 g003
Figure 4. Effect of PEM thickness on current densities at 0.6 V and 0.4 V.
Energies 16 07472 g004
Figure 5. Comparative (a) polarization curves and average (b) temperature, (c) RH, and (d) O2 mole fraction profiles at the CCL across the cell length at 0.6 V for the baseline MEA design case and best CCL design case.
Energies 16 07472 g005aEnergies 16 07472 g005b
Figure 6. Comparative (a) polarization curves and average (b) O2 mole fraction profiles, (c) temperature at the CCL, and (d) water content (λ) of the PEM across the cell length at 0.4 V for the baseline MEA design case and best CMPL design case.
Energies 16 07472 g006
Figure 7. Simulated RH profiles of the cathode side (flow channel, GDL, MPL, and CCL) for the (a) reference case and (b) optimum CMPL design at 0.4 V.
Energies 16 07472 g007
Figure 8. (a) DoE interaction plot at 0.6 V; (b) Pareto chart at 0.6 V; (c) DoE interaction plot at 0.4 V; and (d) Pareto chart at 0.4 V.
Energies 16 07472 g008
Figure 9. (a) Number of cells required per kW power production and (b) power produced by each cell for baseline vs. optimum MEA design.
Energies 16 07472 g009
Figure 10. Relative increase in CD as an effect of γ for the (a) reference case and (b) optimum MEA design.
Energies 16 07472 g010
Table 1. Parametric design of MEA components for simulation and performance comparison of open-cathode PEMFCs.
LayerParameter (Unit)Parametric Levels
Cathode catalyst layer (CCL)CCL thickness ( t C C L (µm))15, 30
CCL porosity ( ε C C L (%))20, 40, 60
Ionomer loading at CCL ( w t i o n (%))20, 40, 60
P t / C (%) at CCL20, 40, 60
Polymer electrolyte membrane (PEM)PEM thickness ( t P E M (µm))10, 25, 50
Cathode microporous layer (CMPL)CMPL thickness ( t C M P L (µm))30, 60, 90
CMPL porosity ( ε C M P L (%))40, 60
Table 2. List of DoE design factors and levels.
Design FactorLevel (High)Level (Low)
PEM Design t P E M = 10   μ m t P E M = 50   μ m
CCL Design t C C L = 15   μ m
ε C C L = 40 %
w t i o n = 40 %
p e r P t / C = 60 %
t C C L = 15   μ m
ε C C L = 20 %
w t i o n = 20 %
p e r P t / C = 20 %
CMPL Design t C M P L = 30   μ m
ε C M P L = 60 %
t C M P L = 90   μ m
ε C M P L = 40 %
Table 3. Comparative current densities at 0.6 V and 0.4 V for various DoE cases.
Sl.no.PEM Design LevelCCL Design LevelCMPL Design LevelI (A cm−2) at 0.6 V% (Increase/Decrease) in CD at 0.6 V
w.r.t Base Case
I (A cm−2) at 0.4 V% (Increase/Decrease) in CD at 0.4 V
w.r.t Base Case
1LLL0.3420.000.5480.00
2HLL0.3667.110.5561.48
3LHL0.44730.90.5704.20
4HHL0.46836.90.5765.20
5LLH0.325−4.681.02887.7
6HLH0.41822.51.170114
7LHH0.60276.31.279133
8HHH0.7501191.266131
Table 4. ANOVA table for the DoE at 0.6 V.
SourceDFAdj SSAdj MSF-Valuep-Value
Model50.1463070.02926177.160.013
Linear30.1213050.040435106.620.009
PEM10.0102240.01022426.960.035
CCL10.0832320.083232219.460.005
CMPL10.0278480.02784873.430.013
Two-Way Interactions20.0250030.01250132.960.029
PEM × CMPL10.0048020.00480212.660.071
CCL × CMPL10.0202000.02020053.260.018
Error20.0007590.000379
Total70.147066
Table 5. ANOVA table for the DoE at 0.4 V.
SourceDFAdj SSAdj MSF-Valuep-Value
Model30.807420.269141105.380.000
Linear20.795800.397898155.790.000
CCL10.018920.0189157.410.053
CMPL10.776880.776881304.170.000
Two-Way Interactions10.011630.0116284.550.100
CCL × CMPL10.011630.0116284.550.100
Error40.010220.002554
Total70.81764
Disclaimer/Publisher’s Note: The statements, opinions and data contained in all publications are solely those of the individual author(s) and contributor(s) and not of MDPI and/or the editor(s). MDPI and/or the editor(s) disclaim responsibility for any injury to people or property resulting from any ideas, methods, instructions or products referred to in the content.