1. Introduction
Unconventional oil and gas reservoirs have gained significant global attention as conventional reserves have become depleted and the demand for petroleum resources continues to rise. Among these reservoirs, shale oil has emerged as a crucial contributor to maintaining the energy balance [
1,
2,
3]. However, the exploitation of shale oil resources presents substantial challenges [
4,
5]. Shale oil production currently faces challenges such as low yields and rapid decline in well productivity. The intricate micro/nano–scale pore–throat network units and the adsorption behavior of organic matter between mineral grains are critical factors influencing the flow of crude oil. The flowability of crude oil is significantly influenced by the complex physicochemical properties derived from the shale surface [
6,
7]. These properties are directly related to wettability, which characterizes and describes the interactions between the solid and liquid phases [
8]. Wettability serves as a direct indicator of the extent and capability of these factors to affect the flow behavior of oil. Indeed, a detailed understanding of wettability is crucial for enhancing shale oil recovery. CO
2 sequestration techniques commonly used in tight shale are influenced by various factors, such as fluid properties and surface characteristics. The key lies in understanding the micro– and nanoscale solid–liquid interactions, which include phenomena like changes in pH and the acidification of rocks when CO
2 dissolves in reservoir water, altering wettability within the reservoir. Therefore, gaining further insights into solid–liquid interactions is fundamental to enhancing CO
2–enhanced oil recovery efficiency, and it can also provide valuable guidance for the storage and utilization of carbon dioxide. Nevertheless, conventional macroscopic evaluation techniques struggle to accurately characterize these intricate patterns. Therefore, it is crucial to develop accurate and comprehensive assessment methods to understand solid–liquid interactions at micro– and nanoscales in shale formations.
Wettability, which describes the interfacial tension relationships between solid, liquid, and gas phases, is influenced by several factors [
9,
10,
11]. These factors include surface roughness, temperature, pressure, mineral compositions, and organic matter [
12]. Among these factors, surface roughness plays a crucial role in determining interfacial tension and, subsequently, wettability. The roughness of the solid surface affects the contact area and the degree of wetting by different phases [
13]. Temperature and pressure variations can also alter the interfacial tension, thereby impacting wettability behavior. Furthermore, the mineral composition and organic matter within reservoir formations are recognized as primary factors governing shale wettability [
6,
7,
14,
15,
16]. The distribution of minerals within the formation also plays a vital role in determining the overall wettability characteristics of a sample. Reservoirs rich in quartz, feldspar, and clay minerals tend to exhibit hydrophilic behavior, as quartz surfaces possess strong water–attracting capabilities [
17,
18]. Additionally, expandable clay minerals exhibit significant water absorption and swelling behavior [
19], which can modify the roughness and surface forces at the solid–liquid interface. This, in turn, has a profound impact on the overall wettability state of the reservoir. Additionally, organic matter plays a crucial role in modifying the interfacial forces between solids and liquids [
20]. One example is asphaltene, which possesses hydrophobic aromatic cores and hydrophilic polar groups. Asphaltene has the ability to spontaneously adsorb onto solid surfaces, thereby influencing the distribution of charged particles and interfacial tension at the solid–liquid interface [
21]. This adsorption of asphaltene onto solids has been observed to alter surface wettability. Moreover, when asphaltene is adsorbed at the oil–water interface, it can affect surface potential, interfacial tension, and other related properties [
22,
23,
24]. Moreover, the non–uniform and stochastic distribution of minerals and organic matter within shale formations leads to a heterogeneous distribution of mixed wettability, with the presence of oil–wet zones being particularly significant. These oil–wet zones have a detrimental effect on the efficiency of oil recovery. It has been observed that even after water flooding, substantial amounts of trapped oil remain on rock surfaces, indicating the limited micro–scale mobility of shale oil [
25]. Based on this observation, Xi et al. [
5] conducted a study to explore the relationship between mineral types, trapped oil, and pore structure in mixed–wettability shale reservoirs. The results revealed that macroscopic wettability outcomes were directly influenced by different laminae, mineral types, and the distribution of organic matter within the reservoir. Many researchers have extensively studied the interrelationships among the factors influencing wettability [
9,
10]. Their findings have further demonstrated and elucidated the complexity of shale wettability, which pose higher demands on the accuracy and applicability of wettability characterization methods [
26].
In order to clarify and evaluate the wettability of samples, many testing methods have been proposed by predecessors. The measurement of contact angles between the wall surface and liquid droplets has been the most widely used method to quantify surface wettability [
27,
28,
29]. Contact angle measurement is a valuable and robust theoretical model; however, its initial application was focused on macroscopic wettability and is subject to limitations imposed by various external factors. Challenges arise when the droplets being tested exhibit rolling behavior or when the sample surface is rough, making accurate contact angle determination difficult [
30]. Furthermore, these measurements fail to capture the local wettability variations resulting from chemical heterogeneity or mineral distribution. Notably, several researchers [
25,
26,
31] have observed different contact angles within adjacent areas, indicating the presence of trapped oil even within contact angles associated with water–wet conditions. This underscores the direct influence of microscale wettability distribution on contact angle measurements and the limited representativeness of this method. Nevertheless, other methods, such as the Amott wettability index, USBM method, and spontaneous imbibition, face challenges in accurately characterizing neutral wettability, being influenced by pore–throat structures, surface roughness, and the fact that they are complex and time–consuming [
20,
26,
32,
33,
34,
35,
36]. Nevertheless, nuclear magnetic resonance only allows for the analysis of wettability variations between pore–throat channels of different diameters [
20,
36,
37,
38]. To gain a more comprehensive understanding of the specific microscopic influences on wettability, it is crucial to integrate these approaches with other techniques. In recent years, molecular dynamic simulations have become increasingly popular [
39,
40], enabling a detailed exploration of molecular interactions and movements at the microscale. However, these simulations do not provide a quantitative assessment of wettability for different samples. Therefore, there is a pressing need to develop new wettability evaluation methods that offer enhanced accuracy and applicability, particularly in assessing microscale rough surfaces.
AFM serves as a robust tool in the realm of scientific exploration. By leveraging the mechanical interactions generated when a flexible cantilever probe comes into contact with a solid surface, coupled with the knowledge of the cantilever’s elasticity, AFM enables the measurement of both surface topography and adhesion forces [
41,
42]. This technique has found extensive utility across various domains, including medicine, biology, and mineralogy, exemplifying its versatility and significance [
43]. In recent years, atomic force microscopy (AFM) has gained popularity for conducting nanoscale investigations. Initially utilized for the surface scanning of rocks to generate 2D and 3D topographic maps [
44], AFM has evolved to provide mechanical information by the development of droplet probes, which has enabled the measurement of nanoscale mechanical of interaction between oil droplets and solid surfaces. Shi et al. [
21] conducted a study focusing on the surface forces of model oil droplets, including toluene and heptol, and their interactions with shale samples after oil washing. The findings revealed that the hydrophobic interactions on the surface of hydrophobic mica can overcome the steric hindrance caused by asphaltene interfacial adsorption, resulting in strong adhesion and attachment of the oil droplets. Later on, researchers explored surface modifications of gold–coated AFM probes using different chemical reagents to investigate specific interaction mechanisms between functional groups and solids, offering insights into dominant mechanical actions at the experimental level [
45,
46,
47]. For instance, employing probe–based techniques to delineate adhesion curves between crude oil and calcite/dolomite has facilitated the understanding of the interactions between carbonate reservoir surfaces and crude oil [
48]. Notably, AFM allows for the evaluation of mechanical properties between solids and liquids at the nanoscale, utilizing probes with radii ranging from 20 to 40 nm [
49,
50,
51]. This range encompasses the majority of the smallest mineral sizes. The use of atomic force microscope probes can reduce the errors caused by surface roughness in measurements and enable a more precise and qualitative assessment of rocks using various types of probes. However, it is important to note that, to date, the numerical values of adhesion forces measured by AFM have not been directly linked to rock wettability. Instead, AFM has been utilized as a complementary tool in wettability research. Further investigations are required to integrate AFM measurements with other methods to comprehensively assess the microscopic wettability differences in shale reservoirs.
In this study, a combination of electron microscopy and surface morphology measurements was employed to identify distinct feature areas in the samples. Based on this foundation, an analysis was conducted to examine the correlation between mineral content, surface roughness, and wettability. To assess the adhesion forces between the sample surface and specific oil components, modified gold–sulfur bond probes were utilized to simulate the contact process between oil and rock. Additionally, hydrophilicity measurements of the sample surface were conducted using hydroxyl–functionalized AFM probes. The molecular interactions between the chemical probes and the sample surface provided insights into the variations in adhesion forces at the interface of the sample and water/oil droplets, directly associated with wettability. By coupling the shale surface force–distance curves obtained using two different probes, a dimensionless wettability index was established to evaluate wettability characteristics at microscale point locations. This research using the application of AFM in exploring wettability demonstrated its feasibility and addressed the challenges associated with microscale wetting measurements, laying a solid foundation for further investigations to enhance studies aimed at improving oil displacement efficiency.
4. Discussion
4.1. The Influence of Surface Roughness on Contact Angle
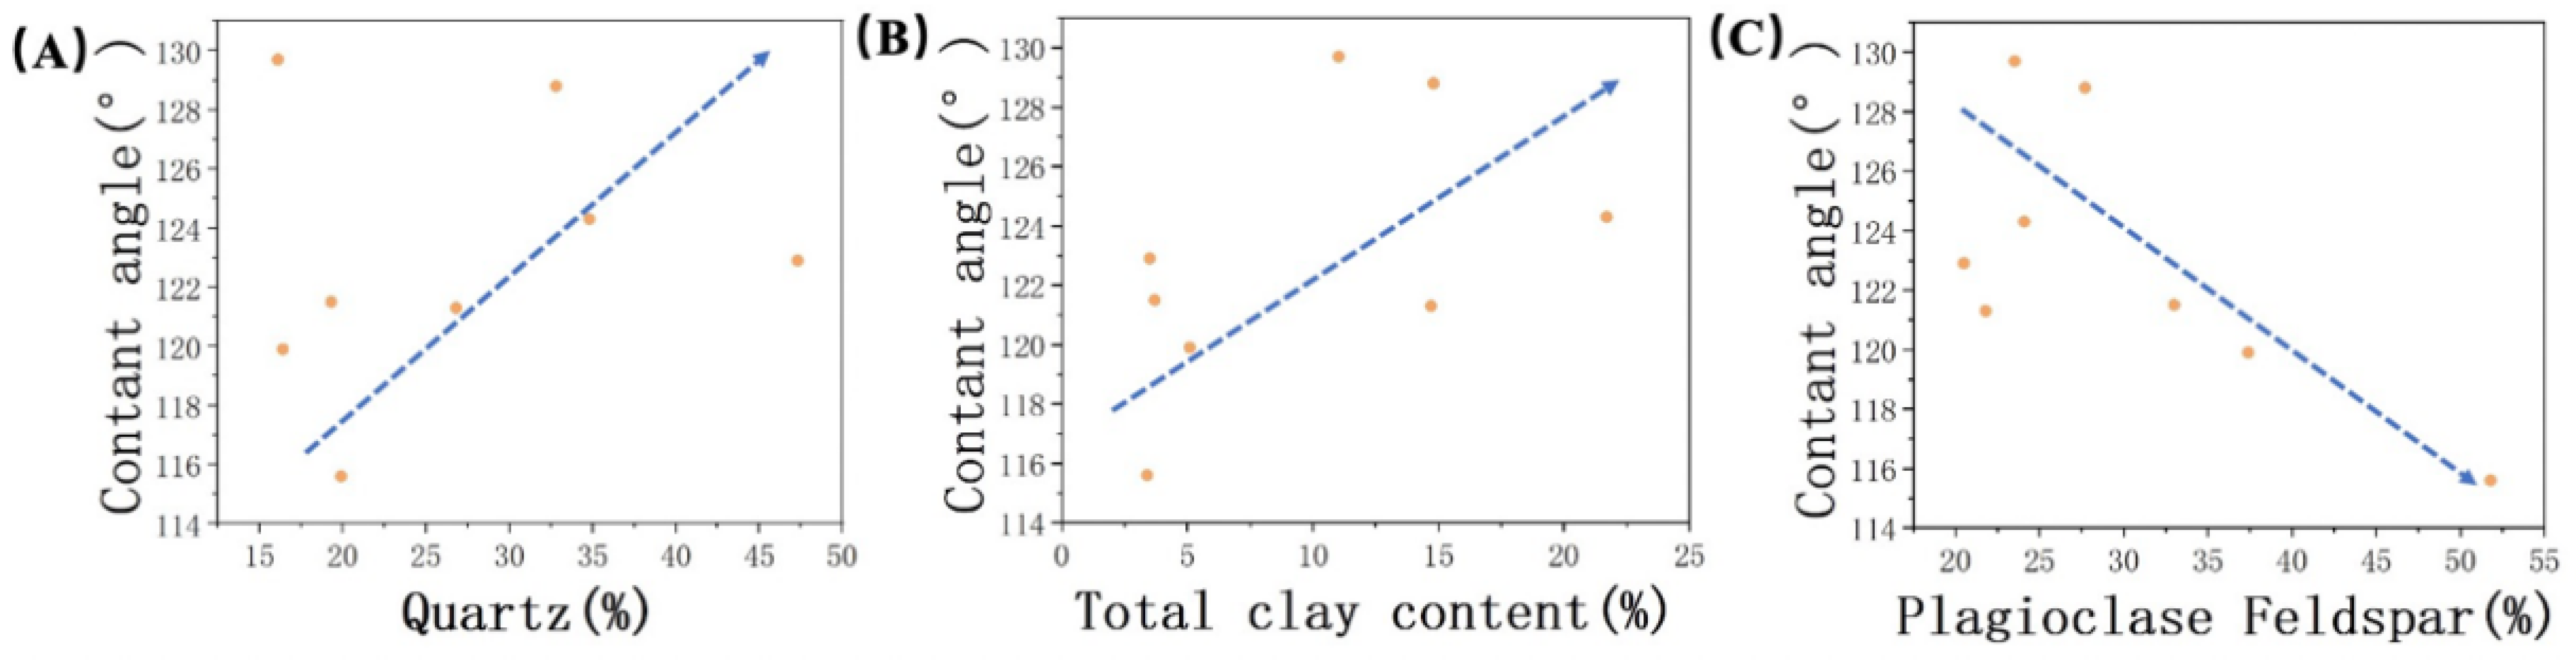
In this study, we conducted a comprehensive analysis of the relationship between contact angle and average roughness based on the data presented in
Table 2 and
Table 3. The results are graphically depicted in
Figure 9, providing valuable insights into the observed trends. Our analysis revealed a clear and consistent linear increase in the contact angle as the average roughness of the samples increased. The correlation coefficients (R
2) obtained were 0.93 and 0.97 for the two experiments, indicating a strong positive relationship between these two variables. This observation suggests that surface roughness plays a crucial role in determining the contact angle. Observed phenomenon can be attributed to the differences in the effective contact area caused by surface roughness. As the roughness of the surface increased, it created variations in the actual contact area between the sample and the liquid phase. Consequently, this disparity in contact area influenced the wetting behavior of the liquid on the surface, resulting in larger contact angles. Moreover, the presence of surface irregularities induced by increased roughness led to a higher proportion of the surface being occupied by air, which further reduced the wetting ability of the liquid and contributed to the observed increase in contact angle.
Young’s equation has been widely used to evaluate wetting behavior and describes the wetting properties of materials based on interfacial tension. However, its applicability is limited to ideal flat surfaces that are uniform and smooth (as illustrated in
Figure 1). Recognizing the influence of surface roughness, Wenzel introduced the concept of relative roughness to modify Young’s equation, aiming to represent the wetting behavior of natural samples [
57,
58]. In the Wenzel model, the liquid droplet fully penetrates and fills the surface asperities and pores. However, the Wenzel model is suitable for contact angles less than 90° and does not adequately describe the behavior of “liquids standing on the surface of a sample”. Therefore, it is necessary to use the Cassie model to discuss and analyze issues with contact angles greater than 90° [
59]. In the Cassie model, the hydrophobic surface causes the liquid to be repelled, resulting in air being trapped between the liquid and solid interface. This phenomenon obstructs the contact between the liquid and the surface being measured, leading to measurement errors. The Cassie model can be described by the following equation:
In the equation, represents the apparent contact angle of the composite surface; represent the area ratios occupied by the gas and liquid phases on the solid surface (where ); represent the intrinsic contact angles at the solid–liquid and gas–liquid interfaces, respectively.
It is important to note that both the Wenzel and Cassie models have their respective limitations and assumptions. The Wenzel model assumes complete wetting and uniform surface roughness, while the Cassie model assumes air trapping and non–wetting behavior. Real–world surfaces often exhibit complex characteristics, including a combination of roughness, heterogeneity, and surface chemistry, which may require more sophisticated models or experimental approaches to accurately describe their wetting behavior.
Based on previous research, it has been established that increased surface roughness on hydrophobic surfaces exacerbates their hydrophobicity. This finding is consistent with the experimental results of our study, where the contact angles of samples from two different shale areas showed a positive correlation with roughness. When comparing JB with JA, the latter exhibited much higher roughness with its uneven surface, providing more favorable conditions for gas entrapment and fewer sites available for water molecules to reside. This further hinders the contact between the liquid and solid surface, enhancing the hydrophobic behavior. As a result, an increase in observed contact angles with increasing roughness can be expected.
4.2. The Effect of Mineral Content and Organic Matter on Contact Angle
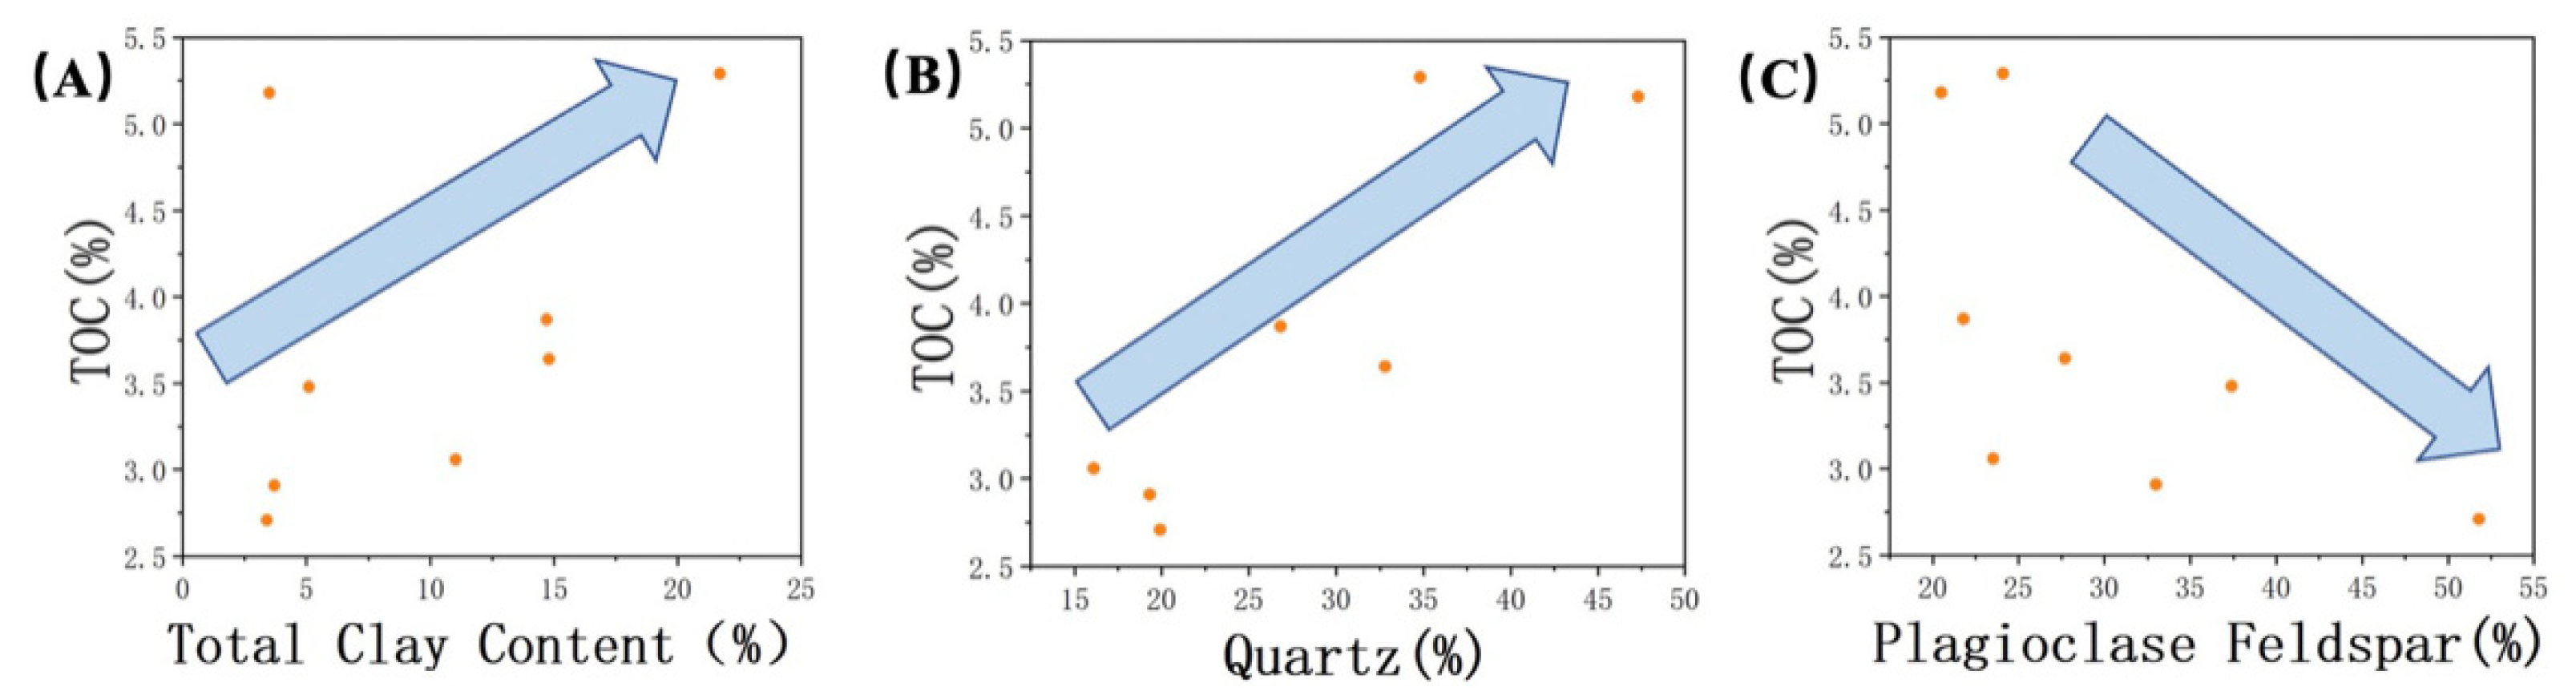
By comparing the average contact angles, it was observed that JA exhibited stronger oil–wetting behavior compared to JB. To infer the mineralogical control on wetting properties, an assessment of the surface mineralogy of the studied samples was conducted. In our analysis of typical minerals found in the Xinjiang region, we found that the content of quartz and clay minerals exhibited a positive correlation with oil–wettability, while the presence of plagioclase feldspar exhibited an inverse relationship (
Figure 10). Indeed, this observation aligns with the discussion in
Section 3.2 regarding the relationship between different minerals and surface roughness. The observed trend can be attributed to changes in surface roughness, thus confirming the influence of surface roughness on contact angle. The rougher surface texture of minerals like quartz and clay minerals effectively hinders the contact between water droplets and the rock surface. This results in the hydrophobic parts of the surface being unable to make complete contact with the water droplets, enhancing the expression of hydrophobicity and promoting a higher contact angle. On the other hand, plagioclase feldspar, as a representative mineral with a smoother surface, does not impede the instant contact between the liquid and solid phases.
Based on the above research, we also observed that the wettability of the samples is influenced by the degree of mineral modification by the crude oil. Although, previous researchers [
20] classified clay minerals in the Lucaogou Formation samples as hydrophilic minerals. However, it is important not to overlook the interrelationship between clay minerals and organic matter, as they are commonly co–developed within shale formations (as shown in
Figure 6A). These two components can have a significant influence on each other.
The wetting behavior of clay is predominantly controlled by residual organic matter, and the process of mineral modification by organic matter on shale wetting cannot be completely ruled out. Otherwise, this may lead to a biased representation of water wetting behavior in areas with relatively low organic matter content. Organic matter is considered to be the primary contributor to oil–wetting behavior, as highlighted by Passey et al. [
52]. They proposed that organic matter adsorbed on hydrophilic rocks can cause a transition from hydrophilic to oil–wet surfaces, ultimately exhibiting oil–wet characteristics in the rock’s pore structure. Therefore, the presence of organic matter adds complexity to the wetting behavior of shale, as the wetting properties of organic–rich shale are influenced by both mineral composition and organic matter. Su et al. [
28] found that shale rocks exhibiting mixed wetting behavior have a higher total organic carbon (TOC) content compared to water–wet rocks. This is attributed to the wetting behavior on the oil–wet rock surface primarily being influenced by the characteristics of organic matter. Consistent with the TOC results in this study (as shown in
Table 1), the oil–wetting behavior is found to be enhanced with increasing TOC, with JA exhibiting higher TOC content compared to JB. Therefore, the occurrence and modification of organic matter on the rock surface are considered to be the fundamental factors influencing the formation of shale pore oil–wetting behavior. Areas with a longer exposure to organic matter attachment are more likely to exhibit higher oil–wetting characteristics. This is one of the reasons why sample JA in this study showed stronger oil–wetting behavior compared to JB. Further discussion and analysis on this topic can be found in the following two subsections.
4.3. The Influence of Wall Oil/Water Adhesion Forces on Wettability
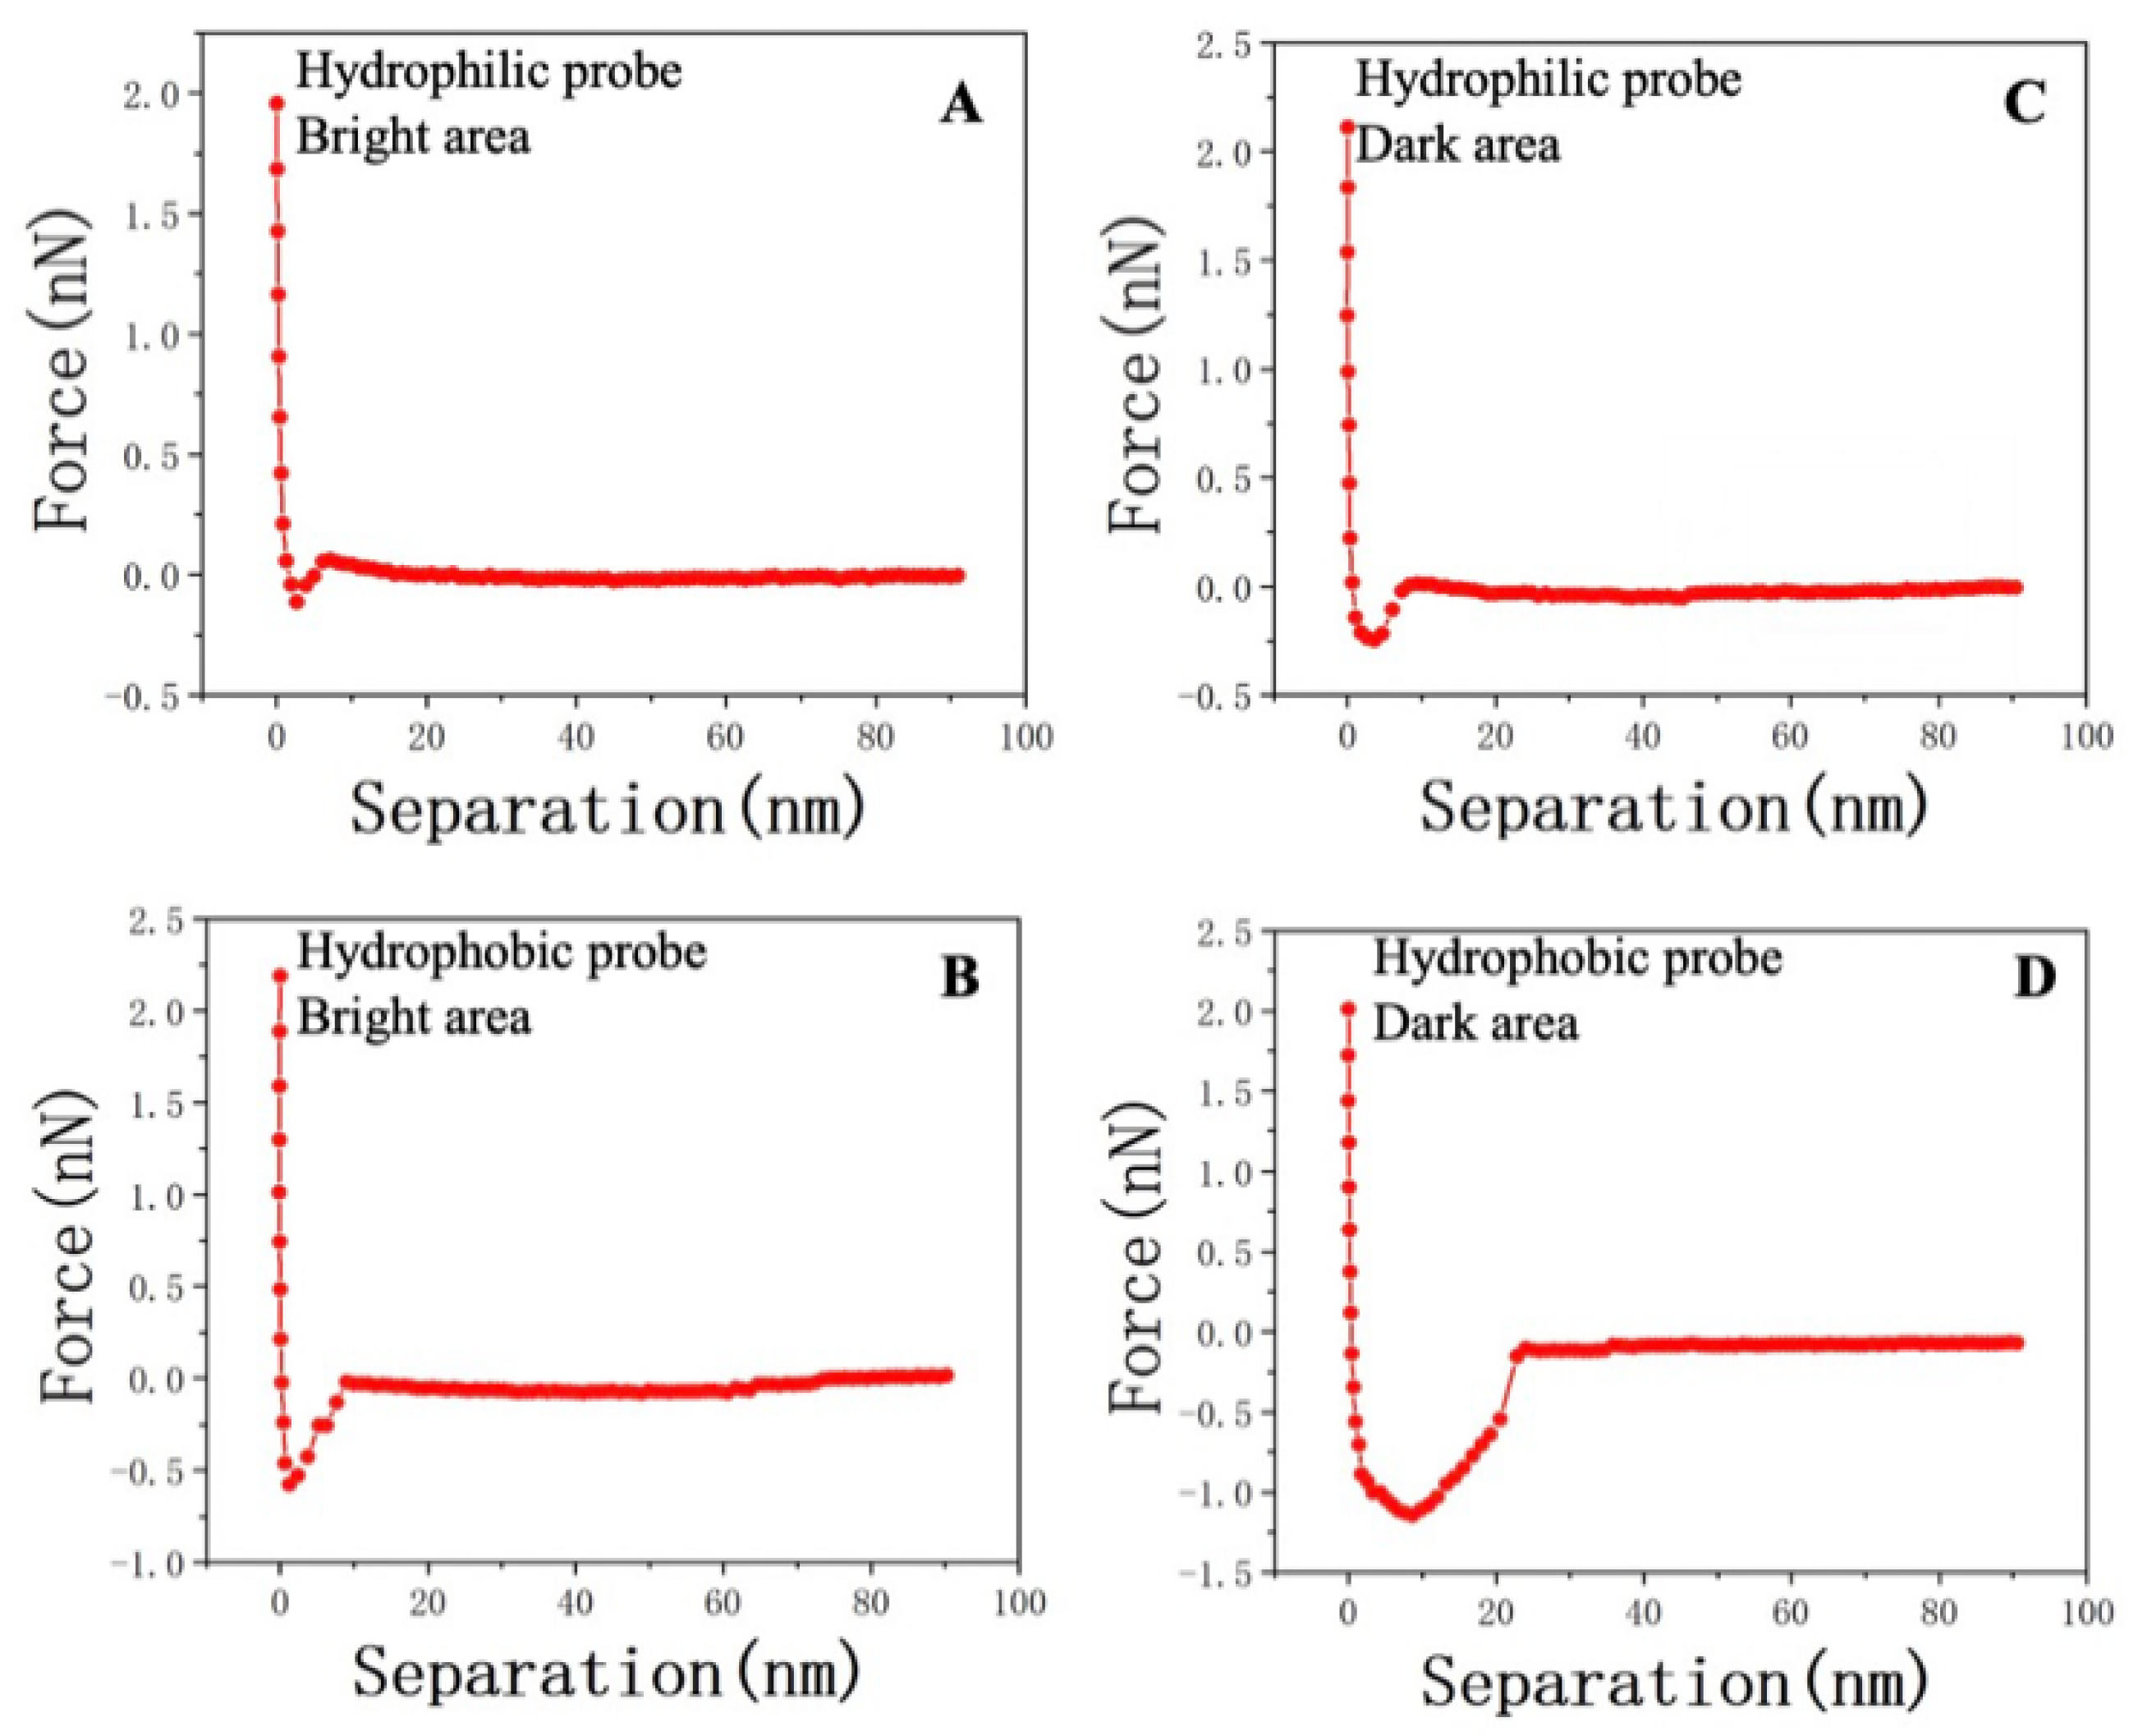
Regarding the measurement results of the contact angle, we employed atomic force microscopy (AFM) to investigate the adhesive forces of water and oil in different feature areas. Subsequently, we compared the obtained values using a Gaussian fitting and found a strong correlation between the fitted curves and the data, with correlation coefficients of 0.96 and 0.92, respectively.
Figure 11 displays the Gaussian distributions (solid lines) fitted to the data. Notably, the water adhesive force on the sample surface was predominantly distributed around 0.35 ± 0.2 nN/m, which was significantly lower than the oil adhesive force, exhibiting a prominent peak at 0.94 ± 0.5 nN/m. Then, we examined the differences in adhesive forces between oil and water during the retraction process and their corresponding discrepancies (
Table 5), which shed light on the governing factors of wettability. The results indicated that the oil adhesion forces in both types of characteristic regions were higher than the water adhesion forces (
Figure 12).
However, there is a larger difference between oil and water adhesion forces in DA. In contrast, BA exhibited lower discrepancies (
Figure 13). This observation implies that the oil droplet contributed significantly more to the wetting performance in DA compared to BA. Above, we discussed how the presence of organic matter can simultaneously enhance oil–wetting and water–wetting properties. However, it is worth noting that the wetting performance achieved by the oil droplet is notably stronger, underscoring its dominant role in determining wettability. This finding aligns with previous studies that highlighted the influence of organic matter on the surface properties, particularly its propensity to transform the surface from hydrophilic to hydrophobic. Furthermore, the higher interaction of gold–sulfur bonds observed on the DA surface compared to the bright surface corroborated the contribution of DA to the sample’s oil–wetting characteristics. To validate the universality of this pattern, we applied the same analysis to the data from other samples, as presented in
Table 5. The consistent findings across multiple samples provided further support for the observed trend.
In order to investigate the relationship between shale adhesion forces and wettability, we conducted a fitting analysis of the oil/water adhesion force difference and the sum of the forces and proposed an AFM–based method to assess reservoir wettability. By measuring the adhesion forces at the oil–solid and water–solid interfaces, we established a dimensionless wettability index, denoted as
I, to characterize the strength of wettability at the nanoscale. The specific formula is as follows:
In the equation, represents the magnitude of the adhesion force between oil and solid, and represents the magnitude of the adhesion force between water and solid. When 0 ≤ I ≤ 1, the sample is considered oil–wet, and when −1 ≤ I < 0, the sample is considered water–wet. Since the wettability index is normalized, its maximum value is 1. This evaluation method is still applicable to water–wet rock cores with a wettability index less than 0.
The wettability between the two distinct areas was assessed using the newly developed AFM evaluation method. The results, presented in
Table 6, compare the average wettability indices of the BA and DA in each rock core. The adhesion behavior exhibited by hydrophobic and hydrophilic surfaces differed significantly under the two probes, highlighting the contrasting oil–rock/water–rock interactions that serve as the foundation for the nanomechanical wettability evaluation method. The findings revealed that the average wettability index of BA in each rock core sample was consistently lower than that of DA, indicative of a stronger hydrophobic nature in DA. These outcomes imply that the presence of DA contributes to enhanced hydrophobic behavior.
A comparative analysis was conducted on the wetting index (I) for different regions. Significant differences were observed in the wetting index (I) for samples JA–2, JB–3, and JB–4 compared to the other samples (
Figure 14). In comparison to DA, BA contributed to a stronger oil–wetting behavior. Through comparison, it was observed that these three samples exhibited smaller roughness values within their respective regions (as shown in the
Table 3), with the BA occupying a larger area. In the case of similar oil–wetting characteristics, the presence of more extensive pore throats associated with the development of larger pores in plagioclase feldspar was observed. This provides more space for the retention of organic matter, resulting in a higher concentration of organic material within the pore throats developed in BA. This process also laid the foundation for the surface modification of plagioclase feldspar in the corresponding regions, leading to a stronger surface modification effect and higher oil–wetting behavior in those areas.
It is also noteworthy that samples JB–3 and JB–4 exhibited a lower development of clay minerals compared to other samples in the JB region. The lower content of clay minerals in these samples is one of the factors contributing to the weaker oil–wetting behavior observed in DA. In addition, a discussion was conducted on the oil–wetting behavior of the surface of sample JB–8, which exhibited similar roughness to sample JB–3. It was found that the oil–wetting behavior in the DA of sample JB–8 was significantly higher than that in the BA. This is different from the observations in samples JA–2, JB–3, and JB–4, where the wetting indices in both areas were very similar. The discrepancy in oil–wetting behavior between the DA and BA of sample JB–8 can be attributed to the differences in the development of large–radius pores. The bright region of sample JB–8 exhibited fewer large–radius pores, which led to a greater retention of organic matter in situ. This facilitated stronger chemical modifications in DA. Indeed, the discussions highlighted the significant influence of organic matter distribution on the surface modification and wetting behavior of shale rocks. The location and concentration of organic matter play a crucial role in determining the wetting characteristics of shale formations.
This observation provides valuable insights into the wettability characteristics of the examined shale reservoirs and underscores the significance of comprehending the spatial distribution and variability of wettability within the reservoir.
The AFM wettability evaluation method was concurrently analyzed with the contact angle method to verify the accuracy of the AFM approach. To facilitate a more intuitive representation of oil wettability, the contact angle measurements were transformed into dimensionless values for direct comparison, as shown in Equation (7):
In the equation, θ represents the contact angle between gas, water, and the solid surface measured using the sessile drop method. When 0 ≤ W ≤ 1, the sample is considered oil–wet, and when −1 ≤ W < 0, the sample is considered water–wet. Ensuring the cleanliness of the sample surface and the interior of the pipette during the measurement process is crucial. Therefore, in the preparation process, distilled water and nitrogen gas were used to clean the surface residues of the shale, and the pipette and dropper were also cleaned to ensure the accuracy of the experimental results.
The established AFM wettability index (I) was compared to the wettability index (W) obtained through the contact angle method, facilitating a comprehensive analysis of the differences in solid–liquid interface interactions. This comparison allowed for a deeper understanding of the factors influencing wettability on shale surfaces. The comparison between the two methods revealed that the AFM wettability evaluation method provided consistent and complementary results to the contact angle measurements. By utilizing dimensionless values obtained from the contact angle method, a quantitative comparison was made between the two techniques, effectively highlighting both their similarities and differences in assessing oil wettability.
The obtained results from both the AFM wettability index (I) and the contact angle–based wettability index (W) indicated a preference for oil–wet behavior. However, there are notable differences in the degree of oil–wettability, which can be attributed to the influence of surface roughness. The use of AFM probes with a specific radius offered an advantage by minimizing the impact of surface inhomogeneity during the measurement process. As described by the data in
Table 7. The wettability index (W) revealed that the JB sample exhibited a wettability range of 0.27 to 0.4 under different roughness conditions. Conversely, the JA sample demonstrated comparable differences in the wettability index, indicating a stronger hydrophobic nature attributed to the presence of surface roughness. Furthermore, by analyzing the discrepancies between I and W, the samples JA–2, JA–4, JA–6, and JB–8 exhibited significant differences in their wetting results, which can be attributed to the incomplete representation of oil–wettability by the contact angle. The rough areas of these four samples demonstrated the highest oil–wetting characteristics among the experimental samples. The strong heterogeneity in these regions prevented the water droplet from fully contacting the sample surface, thereby inhibiting the complete expression of higher oil–wetting characteristics. As a result, this discrepancy between the contact angle (W) and the wetting index (I) values was observed, indicating the limitations of the contact angle measurement in fully capturing the oil–wetting behavior.
In summary, the AFM method offers an enhanced level of precision in evaluating surface wettability properties by effectively addressing the impact of roughness and providing valuable insights into the intrinsic wettability of the rock core. As a result, this method demonstrated applicability in assessing wettability for reservoirs.
4.4. The Impact of Mixed Wetting Distribution on Overall Reservoir Wettability
The non–uniqueness of wettability magnitudes is apparent from the varied values of the wettability index (I) obtained at different points on the samples. Deglint et al. [
7] proposed that microscale contact angles indicate the wetting behavior ranging from hydrophilic to mixed–wetting, while macroscopic contact angle values reflect the phenomenon of mixed wetting. This suggests that the wetting distribution at the microscale has a significant influence on the overall wetting behavior. The heterogeneous distribution of minerals and organic matter contributes to the diverse wettability properties observed on the surface of the rock core, which is the fundamental cause of mixed wettability. However, it is important to note that all measured locations on the samples in this study consistently exhibited oil–wet behavior, including both DA and BA. The presence of hydrophilic minerals did not result in any water–wet sites due to the extended immersion of the samples in oil–bearing formations. This prolonged exposure led to the formation of an oil film and surface modifications, promoting the development of oil–wettability. Meanwhile, the development of oil–wetting characteristics was related to the difference in pore sizes between adjacent regions. When large pores are extensively developed, more organic matter tends to enter these larger pore throats and undergo wetting modifications on a larger scale and over a larger range of the mineral surface. These factors contribute to the overall sample, exhibiting a more pronounced oil–wet state.

 ,
, 


