Abstract
Poland is an important producer of rapeseed used in the biofuel industry. The rate of production of the biofuel industry increased after Poland’s accession to the European Union (EU). The reasons for these changes are numerous, of which the European Union’s energy policy is the most important. This paper aims to analyze the performance of the biofuel industry in Poland in view of changes in the market. Moreover, I evaluated changes in the biofuel industry after Poland’s accession to the EU. In addition, I analyzed the fixed and current assets of the Polish biofuel. The hypothesis that the price of rapeseed oil is the key determinant of profitability in the biodiesel industry was formulated. A statistical analysis proved the second hypothesis stating that the net profit of biodiesel companies depends on biodiesel production to the greatest extent. The time range of the analysis was 2005–2021. To analyze the economic performance of the biofuel industry in Poland, these changes were used. A regression analysis to find factors influencing the economic performance of the biofuel industry was used. More and more oils are used for the production of first-generation biofuels. Refined rapeseed oil also increased from 386.5 thousand tons to 780.6 thousand tons. Such numbers demonstrate the development of biofuel markets.
1. Introduction
The food processing sector generates 18% of total industrial sales in Poland. Poland is an important food producer and exporter in the European Union (EU). In 2012, the oil and fat industry had a 2.3% share of the Polish food market [1]. Meat, dairy, confectionery, fruit and vegetable, tobacco, and secondary grain processing were the most profitable sectors of the food industry [2,3,4].
The Polish agrifood market is relatively competitive because of low processing and labor costs [5]. According to Mroczek [6], employment in the Polish food processing industry reached 410,000 people in 2010. Germany (838,000), France (599,000), and the United Kingdom (425,000) were the only EU countries with higher employment in the food sector [7].
More than 90% of esters are derived from rapeseed oil. The production of esters increased from less than 100,000 tons per year in 2005–2007 to more than 740,000 tons in 2015; 880,000 tons in 2017; and 1004,00 tons in 2021 [8].
Biofuels play a very important role in sustainability development in the world [9]. They are renewable energy sources that are environmentally friendly. The most important problem with biofuels is that first-generation biofuels are based on food crops. That is why their utilization enhances competition in the market. Biofuels can be derived from chemical conversion from biomass and any enriched chemicals obtained in biological processes. The primary biofuel products include liquid, gas, and solid forms [10].
Biodiesel and bioethanol may be easier to commercialize than other alternative fuels, considering performance, infrastructure, and other factors [11]. However, the development of biofuels depends on the policy of the European Union (EU) and local governments obeying the rules [12]. The development of biofuels in the world depends on technology, which can be used for processing agricultural food products [13]. However, the rapidly growing biofuel industry has a significant potential role in tackling the issues of environmental pollution and climate change, apart from the production of renewable energy [14]. Biofuels have an impact on nanotechnologies and other technologies [15]. The biggest share of biofuel production is biomass, which has low pollution emissions. Solid biofuel is one of the forms that is storable and transportable with low heating costs [16]. Even though biofuels are a promising source of renewable energy sources, the biofuel industry is still in its initial stage because of many barriers to its development, including technical, economic, social, and regulatory dimensions [17]. The share of biofuels in energy consumption is increasing because they reduce fossil fuel dependence and mitigate climate impacts. They are useful in greenhouse gas reduction (GHG); however, the process is still under discussion [18,19].
The literature describing biofuel development is extensive. Johnson and Gonzales [20] analyzed the economics of biofuels. They found that biodiesel is environmentally friendly and has a high cetane number (CN). It emits less pollutants than its non-renewable counterpart, diesel. Government policy describes biodiesel production as an important policy and business. The use of biodiesel is important because its production decreases reliance on foreign oil and equalizes energy markets. Gebremariam and Marchetti [21] analyzed the economics of biodiesel production. They found that biodiesel has a higher cost of production, has less energy content compared with fossil diesel, and releases nitrogen oxide while burning. Verma and Sharma [22] found that production technology is important for efficient and cost-effective production. The optimum biodiesel production reaction temperature should range from 50 to 60 °C. Saluja et al. [23] pointed out many advantages of biodiesel production. They found that it is derived from renewable sources, causes less dependence on conventional fuels, and has safer handling and storage processes. It has good lubricity and is biodegradable. Moreover, biodiesel is highly biodegradable. It does not emit aromatic compounds or other substances that are toxic to the environment and people. It can also improve the rural economy because farmers can increase their income [24]. It also has disadvantages, for example, sensitive oxidation, higher viscosity, a higher cloud point, higher nitrogen oxide (NO) emissions, and a higher price. Noushabadi et al. [25] found that biodiesel oil quality depends on its cetane number (CN), which plays a crucial role in ignition characteristics. This factor can impact engine efficiency, noise levels, and exhaust emissions. Jåstad et al. [26] found that, currently, many biofuels are produced from food crops and palm oil, which creates competition in the market. The production of forest-based biofuels is needed to fill an increasing demand for renewable energy sources. Forest-based biodiesel can be utilized in transportation and other sectors.
However, little attention has been paid to the economic situation of biodiesel producers. My intention was to fill in the scientific gap concerning the economic performance of biodiesel producers. To obtain scientific findings, multiple regression analysis was used, and the main characteristics of the equations are described in this paper. The statistical analysis helped to discover factors shaping the performance of fat and biodiesel producers in Poland. The development of renewable energy sources, including biofuels, has been well recognized in the literature. However, little attention has been paid to the state and development of the biofuel industry.
The main aim of this study was to analyze the performance of the biofuel industry in Poland. An attempt was made to answer the following questions:
- How did the performance of the biofuel industry change after Poland’s accession to the EU?
- What is the liquidity and profitability of the biofuel industry?
The following research hypotheses were formulated:
Hypothesis 1 (H1):
The cost of goods sold is the key determinant of profitability in the biodiesel industry because of increasing functioning costs and competition in the international market.
Hypothesis 2 (H2):
The net profit of biodiesel companies depends on biodiesel production to the greatest extent, and this is an effect of the scale economy.
This paper is divided into five sections. The first section is the introduction. This section contains a review of the literature on food security and eco-efficiency in the EU. The materials and methods are described in the second section. The results are presented in the third section and discussed in the fourth section. Conclusions are formulated in the last section of the paper.
1.1. Performance of Polish Biofuel Producers
The oilseed-processing sector is a part of the agrifood industry. After Poland joined the EU, this sector developed rapidly as Poland gained access to the European market and became eligible for EU funds [27]. The market for vegetable and animal oils and fats has a small share (4.63%) of total sales in the food industry. The margarine and edible fat market has an even smaller share of total food sales, mainly because it comprises a small number of companies.
According to Rosiak [28], rapeseed production became the most rapidly growing sector in the agrifood industry after Poland joined the EU. Biodiesel production is expected to increase in the coming years, and it will generate higher profits than cereal production. The high demand for biodiesel esters in railway transport, aviation, water transport (both inland water and sea transport), and agriculture will drive the growth of the biodiesel market [29]. Piwowar [30] noted that the supply of fuel biocomponents exceeds domestic demand, and there are plans to increase the ethanol threshold for biofuels to harness this growth potential.
The biodiesel sector is very important in the process of renewable energy source acquisition. Poland is an important producer of rapeseed, which is the primary source of biodiesel production [31].
Investments in the biofuel sectors increased considerably after Poland joined the EU. As a new EU Member State, Poland had to rapidly adapt its agrifood industry to EU standards, which required massive investments [32]. In the following years, investments in the food sector enabled Polish food suppliers to upgrade their production equipment. At present, Poland is one of the leading agrifood producers in the EU. According to Szymańska and Luszlowa [33], long-term investments in the food industry are financed mainly by fixed assets, including bank loans.
Investments drive economic growth because they enable entrepreneurs to reinstate depreciated assets, introduce new technologies, and adapt their production facilities to EU standards. In 2017, fixed-asset investments in the Polish food processing sector reached PLN 8468.8 million [34]. These investments supported modernization and improved the competitive advantage of food-processing companies. An improvement in productive capacity enabled agrifood producers to meet domestic demand and export their products [35].
1.2. Biodiesel Development in Sustainable Development Concept
The most important energy sources include fossil fuels, nuclear resources, and renewable energy sources [36]. The utilization of renewable energy sources is a policy-driven process that can help to improve security, the climate, and economic development [37]. Biodiesel production is an example of a renewable energy source, the aim of which is to reduce environmental pollution. The current situation in the global energy market is not stable because of greenhouse gas (GHG) emissions, global warming, and the depletion of fossil fuels [38]. Economic growth and living standards improvement can be realized by increasing demand for energy. Population growth and economic growth are the main forces of energy consumption [39].
Biodiesel development has the potential to reduce dependency on fossil fuels. However, its production depends to a large extent on the supply of rapeseed and the supply chain [40,41]. The depletion of fossil fuels is caused by their constant use in energy production, and this is causing environmental degradation all over the world. Biodiesel and bioethanol are alternatives to diesel and fuel, and they are friendly to the environment, financially reasonable, and available [42]. Renewable energy sources, including biodiesel, have environmental advantages over conventional fuels, and this is why they strengthen the concept of sustainable development [43]. Moreover, biodiesel leads to less dependency on fossil fuels. Biodiesel has good lubricity, is biodegradable, has a higher flash point compared with conventional fuels, and leads to a reduction in exhaust emissions [44]. Moreover, biodiesel has minimal toxicity and almost no emission of aromatic compounds, which are destructive to the environment. In the whole life-cycle, including cultivation, growth of plants, oil production, and other stages, biodiesel has a small net contribution of carbon dioxide (CO2).
Biofuels can be divided into four generations [38,45]:
First generation: These are mainly produced from agricultural products, for example, biodiesel from rapeseed and bioethanol from corn;
Second generation: These are produced from plants with no agricultural value, such as miscanthus and others. These trees have no nutritious value and, therefore, can be grown on poor-quality land;
Third generation: These are mainly produced by using genetically modified biomass;
Fourth generation: These are made from algae and other non-conventional biomasses.
Renewable energy sources, including biodiesel, require constant investments in technology. The investments should be directed toward agriculture, which is the main producer of sources of first-generation biodiesel (rapeseed) and waste, including crop residues and livestock excreta, for example, crop straw [46]. Agriculture plays a very important role not only in energy production but primarily as the main source of food for people and feed for livestock. Moreover, agriculture delivers many benefits, including carbon shortage and soil protection [47]. It also delivers substrates for biogas production, including animal manure [48]. Agriculture also delivers biomass for alternative energy sources and to replace fossil fuels. The use of biomass with high-capacity plans is the best way to produce electricity [49].
The environmental issue in renewable energy production is very important and concerns forest depletion, ozone layer holes, the contamination of the environment, and competition for agricultural resources [50]. Economic growth should be based on different sources of energy, including renewable energy sources. Fossil fuels are not enough to cover the need for energy [48].
2. Materials and Methods
2.1. Data Sources
Economic performance is a key factor in evaluating the development of the biofuel sector. The performance of the biofuel industry has improved, and employment increased in that sector after Poland joined the EU [34]. To evaluate the changes in the economic performance of the biofuel sector in Poland, I used different data and methods of analysis. The basic source of literature is the balance sheets of the companies producing biodiesel in Poland. The list of companies producing biofuels in Poland includes those published on the Ministry of Agriculture and Rural Development website. Rapeseed is increasingly used in the production of biofuels. The performance of the biofuel sector was evaluated based on the financial statements of the leading biofuel producers and distributors in Poland, including PKN Orlen, Lotos Biopaliwa, Vratislavia-Biodiesel S.A., Komagra, and other companies. The analyzed period was 2005–2021.
The balance sheets include detailed data, including fixed assets and current assets. To develop the analysis, I analyzed the data on long-term receivables, long-term investments, and intangible assets.
I also analyzed current assets, including inventories, short-term receivables, and short-term investments. Long-term liabilities and short-term liabilities were also analyzed. To complete the analysis, I evaluated the sales revenue and cost of goods sold. The data were completed through an analysis of net profit and operating profit (EBIT).
2.2. Methods
Market factors that influence the performance of biofuel producers were evaluated with the use of multiple regression analysis based on the data obtained from the analyzed agricultural holdings. The following equation was used to estimate the regression model:
where
Yi = α + β1∙x1 + β2∙x2 + … + βi∙xi + εi for i = 1, 2, 3 … n
y—dependent variable;
x—independent variables;
α—constant;
β1, β2, …—regression coefficients;
εi—random variable.
Partial and semi-partial correlations were calculated to determine the contribution of each variable to the regression equation [51]. A partial correlation measures the unique contribution of an independent variable to the total variation in the dependent variable. Squared partial correlation measures the residual variance in the dependent variable, which is explained by the independent variable by controlling for the effects of other independent variables on the dependent variable. In turn, a semi-partial correlation does not account for the effects of other variables on the dependent variable, and squared semi-partial correlation measures the total variance explained by a given independent variable. The overall significance of the regression model was determined with the F-test.
A regression equation was used to calculate the strength of the relationship (forward stepwise multiple regression) between response (dependent) and explanatory (independent) variables (Figure 1). The mean values and standard deviations of the analyzed factors, correlation coefficients, and multiple regression equations are presented in tables. The regression equation was evaluated with the use of the F-test, and the correlation coefficient was evaluated with the use of Student’s t-test at a significance level of 0.05.
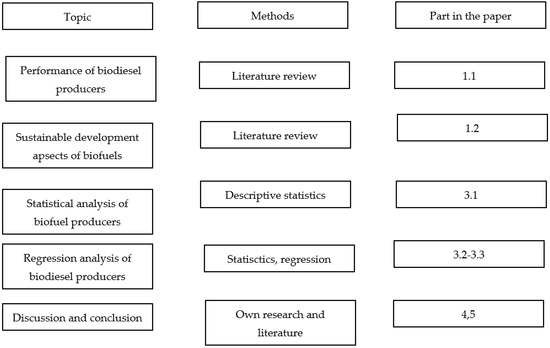
Figure 1.
Diagram of conducted research. Source: Own elaborations based on research.
Net profit, Y1, was used as the dependent variable to identify market factors that influenced the performance of biodiesel producers. The net profit of the examined producers was directly influenced by exogenous variables, X1–X5. The following fixed-based indicators affected net profits in the biodiesel sector:
X1—biodiesel production;
X2—cost of goods sold;
X3—monthly consumption of rapeseed oil;
X4—fixed assets;
X5—rapeseed exports.
3. Results
3.1. Performance of Polish Biofuel Producers
A balance sheet is a document containing a summary as of a specific date—in terms of value—of a company’s assets and the sources of its financing. This document is prepared in the form of a two-sided table. The left side shows—divided into basic items by type—the company’s assets, and the right side shows liabilities, e.g., sources of asset financing, which consist of equity.
All assets of an enterprise in terms of value are referred to as assets. However, the equity capital, external capital, and profit at the company’s disposal, which are the sources of asset financing, e.g., property, are called liabilities. So, the balance sheet is an important document for closing accounts of an entity’s reporting period. It is then called final [52].
Tangible fixed assets are most often represented in an enterprise by owned and constructed fixed assets: buildings, structures, machines, devices, means of transport, tools, livestock, perpetual usufruct rights to land, and rights to residential premises. Tangible fixed assets are used in the enterprise for more than one year and are valued mainly at net value, i.e., the difference between gross value and the amount of depreciation.
At the same time, the closing balance is a document for the opening of the second, subsequent reporting period of the entity, for which it becomes the opening balance or initial balance. The closing balance of one reporting period, being, at the same time, the opening balance for the next period, allows for the maintenance of so-called balance sheet continuity, which is one of the main principles upon which accounting is based. If certain conditions are met—such as, for example, the unchanged structure and content of individual balance sheet items—balance sheet continuity allows for the comparison and assessment of the activity of an entity (company) and its financial effects in subsequent reporting periods [52].
In 2021, the average value of fixed assets in the examined companies reached PLN 25,059 million, whereas current assets were estimated at PLN 14,775 million and accounted for nearly 31% of total assets (Table 1). Between 2005 and 2021, fixed assets increased by nearly 122%, and current assets increased by around 155%.

Table 1.
Value (PLN ‘000) and fixed-base and chain-base indicators of fixed assets and current assets in biofuel companies.
In the analyzed period, the average return on fixed assets reached 11.7, ranging from 16.5 in 2005 to 2.12 in 2014 [8]. These changes could be attributed to numerous factors, mostly long-term debt and investment. The observed fluctuations also resulted from the EU’s biofuel policy, which increased the demand for rapeseed oil and biofuels. The return on fixed assets was highest in 2005, 2007, 2017, and 2021, which could explain the observed increase in profits and changes in capital structure [52].
The second group of enterprise assets is current assets, which are most often used up completely in one production process or in one financial year. Current assets change their form by participating in the production process and are transformed into finished products. Current assets are divided into inventories, short-term receivables, cash, and short-term investments [53].
Current assets in the analyzed companies increased from PLN 5.8 million in 2005 to nearly PLN 14.7 million in 2021 (by 155.3%). Current assets accounted for 26.8% of total assets in 2005, 30.9% of total assets in 2017, and 29.6 in 2021 (Table 1). The above increase had positive implications because it increased liquidity, decreased the costs of assets, and improved productivity [53].
The production of biodiesel depends on many factors; among them, macroeconomics is important. Some of them are associated with increased demand. Another is changes in oil prices, and when they become expensive, the production of biofuels should increase. Another factor regards changes in gross domestic product (GDP), which are described as positively correlated. Moreover, interest rates are important; however, their relationship is negative. Inflation also has an impact, and it should be positively correlated with biofuel production. Currency exchange rates may also impact biofuel production, and expensive foreign raw materials may decrease the production of biofuels. The domestic consumption of rapeseed oil may increase competition and increase prices and production [54].
Another group of factors with an impact on biodiesel production is associated with internal factors depending on enterprise equipment. Fixed assets comprise long-term receivables, long-term investments, and intangible assets (Table 2). Businesses embark on long-term investments to purchase new equipment and machinery and to improve the production process.
Table 2.
Value (PLN ‘000) and fixed-base and chain-base indicators of long-term receivables, long-term investments, and intangible assets in biofuel companies.
Long-term receivables are receivables with a repayment period of more than one year from the balance sheet date. However, in balance sheets prepared in accordance with the Polish Accounting Act, there is a certain exception to this rule, because trade receivables are not recognized as long-term receivables, which are always included in short-term receivables but are treated separately. Long-term receivables peaked in 2010 at PLN 121,393,300.
Long-term investments include assets such as long-term deposits, long-term loans granted, and securities (stocks, shares, bonds, treasury bills). The main benefit of owning these assets is the increase in their value or revenues from the sale of these assets. Real estate and intangible assets not used by the entity but acquired to achieve economic benefits (income, increase in value, other benefits) in accordance with the Accounting Act are presented in the balance sheet in the group of long-term investments
Investments are important in the development of biodiesel enterprises. They depend on production technology, the production scale, and the market price of used materials [21]. Moreover, the cost of labor, transportation, associated insurance, taxes, and other factors are important. Biodiesel companies need financial certainty and policy certainty because taxes may disturb the development of the sector. The policy should be flexible enough to allow for investments [55].
In the first six years after Poland’s accession to the EU, the analyzed companies invested heavily in improving their production facilities and adapting them to EU standards. The value of long-term investments was highest in 2008 (PLN 878,680,80). This situation was the result of requirements that Polish enterprises had to fulfill. After accession, Polish enterprises had to invest significantly to meet European Union (EU) quality standards. The enterprises had to improve production safety and environmental issues. The recycling process had to be introduced to the companies. They had to limit emissions of CO2 and other greenhouse gases. Moreover, the enterprises had to invest in soundproofing silencers to reduce noise.
Intangible assets are important for biodiesel enterprises, as well as for others. Intangible assets are property rights acquired by an entity, classified as fixed assets, suitable for economic use, with a useful expected economic life longer than one year, intended for the entity’s needs. These include copyrights, rights to inventions, know-how, goodwill, and the costs of completed development work and other factors. The value of intangible assets continued to increase in the examined period. Intangible assets were highest in 2021, marking an increase of 306.4% from 2005.
3.2. Current Assets of Biofuels Industry
Current assets include inventories, short-term receivables, and short-term investments. Inventories are components of current assets, which include goods, materials, finished products, and work in progress. Materials are consumed in one production cycle and include basic materials, auxiliary materials, spare parts of machines and devices, fuel, and packaging. Finished products are goods produced in the production process and are sold on the market. The goods do not change their form and are intended for sale in trading companies. Work in progress includes semi-finished products that change their form during production. Short-term receivables are funds due to the company for the sale of products and goods, which should be transferred to it divided into periods: up to 12 months and over 12 months. Cash means funds in a bank account or on hand.
The value and structure of current assets determine a company’s liquidity. Inventories are an important component of current assets. High inventory levels are undesirable because they tie up capital in stocks. Inventory levels are influenced by two groups of factors. Firstly, agrifood producers are unable to fully synchronize their inventory levels (streams of produced vs. sold goods) because of seasonal differences in the supply and demand for plant-based products. The second group of factors is associated with supply chain uncertainty [56]. In the investigated companies, inventory levels were highest in 2021 at PLN 6329 million. Inventory levels increased by more than 179.4% between 2005 and 2021 (Table 3).
Table 3.
Value (PLN ‘000) and fixed-base and chain-base indicators of inventories, short-term receivables, and short-term investments in biofuel companies.
Short-term receivables generally increased in the analyzed period, with some variations. This parameter was highest in 2021 (PLN 5384 million), marking an increase of nearly 149.5% from 2005.
Greater fluctuations were observed in short-term investments, which were lowest in 2005 (PLN 1,362,263,000) and highest in 2021 (PLN 3806 million) (an increase of 179%). The value of short-term investments increased by nearly 114% between 2005 and 2021.
Liability levels are important measures not only of enterprise conditions but also of vulnerability to external crises and general conditions of development [57].
Foreign capital constitutes another group of sources of financing for a company’s activities. They include the liabilities of enterprises toward other market participants, such as banks, institutions, other enterprises, and others. An important feature of modern enterprises is having liabilities at a specific level. Economically vibrant enterprises finance their current business activities using external capital, the availability of which on the market is systematically increasing. However, savings and the generated profit are allocated to other, more profitable ventures. Considering the criterion of the payment date, liabilities are divided into long-term (payment date longer than one year) and short-term (repayment does not exceed one year). In enterprises, it is advisable to have capital that remains at one’s disposal longer, so the more long-term capital there is, the more secure the company’s situation is [52].
Investment projects often require external sources of funding. However, high debt can undermine a company’s financial stability. Long-term liabilities include loans with a payback period longer than one year. In the analyzed companies, long-term liabilities were lowest in 2005 (PLN 4,186,770,000) and highest in 2021 (PLN 10,142 million) (an increase of 142.3%). The value of long-term liabilities increased by nearly 80% between 2005 and 2021 (Table 4).
Table 4.
Value (PLN ‘000) and fixed-base and chain-base indicators of long-term and short-term liabilities in biofuel companies.
Short-term liabilities consist of short-term loans that are obtained mainly to finance current production needs. Short-term liabilities peaked in 2021 (PLN 10,732 million), marking an increase of more than 110% from 2005.
Sales are a mainstream revenue in the biofuel industry. In the analyzed companies, sales revenues peaked in 2021, marking an increase of nearly 162% from 2005 (Table 5). Biofuel sales decreased in the following years. Sales revenues increased by nearly 95% between 2005 and 2021.
Table 5.
Value (PLN ‘000) and fixed-base and chain-based indicators of sales revenues and the cost of goods sold in the biofuel sector.
Every business activity generates costs on the one hand and revenues and financial results on the other. When conducting non-agricultural business activities, an individual always incurs some costs.
Costs are one of the basic economic categories in accounting that occur in every business entity, and the type of business activity does not matter.
Market conditions and profitability have an impact on the biofuel industry. Cost production has an impact on the biofuel industry. The production and production costs of biofuels depend on technological risks [58].
Production costs and raw material purchases, mainly rapeseed, are the key cost elements in the biofuel sector. These costs are higher in biofuel production than in the fossil fuel sector [59]. Other costs in biofuel production are associated with technological processes, as well as waste and by-product management [60]. In the analyzed companies, sales costs were highest in 2021, marking an increase of nearly 136% from 2005.
Net profits influence a company’s performance and growth. Net profits in the Polish biofuel sector fluctuated in the analyzed period. The examined companies reported losses in 2008 (−PLN 28,390,000) and 2014 (−PLN 879,383,000). In 2008, the reported losses were associated mainly with large-scale investments and the global financial crisis. In turn, the losses reported in 2014 resulted from high long-term and short-term debt (Table 6).
Table 6.
Value (PLN ‘000) and fixed-base and chain-base indicators of operating profit (EBIT) and the net profit of biofuel companies.
Despite the losses sustained in 2008 and 2014, biofuel companies generated profits in the remaining years of the analysis. However, net profit varied across the examined years. In the analyzed companies, net profit reached PLN 3890 million in 2021, marking an increase of 50% from 2005.
An EBIT (earnings before deducting interest and taxes) analysis also delivers interesting results. In accountancy, this value can be calculated as sales minus operating costs and is a very good indicator for comparing results for various enterprises regardless of the costs of their use of financial leverage and tax burdens. It reached the highest value in 2021, PLN 4,885,178,3, which proves the improvement of the economic situation of biodiesel enterprises in the market.
3.3. Regression Analysis of Biofuel Industry
Biodiesel can be considered a potential replacement for fossil fuels. The potential of biodiesel was evaluated in the literature. A regression analysis helped to find out the strength of the impact of each variable. The regression and neural network technique was used. This is a powerful mathematical tool for prediction [61].
The extent to which the situation in the rapeseed market influenced the performance of biofuel producers was evaluated based on net profits as the dependent variable Y1. The dependent and independent variables are presented in the Methods section. The results of the analysis are presented in Table 7, Table 8 and Table 9. The net profit of biofuel producers was influenced by the following variables: X1—biodiesel production (%), X2—cost of goods sold (%), X3—monthly consumption of rapeseed oil (%), X4—fixed assets (%), and X5—rapeseed exports (%). The strongest impacts were X2—cost of goods sold and X1—biodiesel production. This can be explained by the increasing direct and indirect cost of costs of goods sold. They generally depend on the situation in the market. Transport is important because the costs of completing deliveries and collective packaging increase. Moreover, biodiesel companies need to have transport insurance and other protections. Indirect costs are also important because biodiesel enterprises have to cover marketing and advertisement. In addition, administrative costs increase with the requirements of the European Union (EU) because biodiesel enterprises have to employ specialists from the market. The net profit of biodiesel companies depended on biodiesel production, which was an effect of the scale economy. Fixed assets in the biodiesel enterprises also impacted the net profits. Their value has an impact on net profits because better-equipped entities can increase production and reduce costs. The net profits of biodiesel entities depend on the demand side, too. The consumption of both biodiesel and rapeseed oil increases prices and incomes. The export of biodiesel is increasing each year; however, the balance is still negative, suggesting major demand for biodiesel, which is an important renewable energy source in the market. The regression model fit well with the observed data (R2 = 0.997; p = 0.000).
Table 7.
The results of the multiple regression analysis describe the relationships between the dependent variable, Y1 (net profit of biofuel companies), and the independent variables.
Table 8.
The results of forward stepwise regression describe the relationship between the dependent variable, Y1 (net profit of biofuel companies), and the independent variables.
Table 9.
Partial and semi-partial correlations between the dependent variable, Y1 (net profit of biofuel companies), and the independent variables in the regression model.
Two hypotheses were analyzed in the model [62]. The null hypothesis, H0, postulates that none of the modeled variables influenced profits in the biofuel sector. In turn, hypothesis H1 posits that at least one variable is significantly correlated with the profits reported by biofuel companies. The null hypothesis was rejected in the F-test because some independent variables were significantly correlated with gross profits in biofuel companies (Table 8). Therefore, Student’s t-distribution was examined in the regression analysis.
The analysis revealed that there are no grounds for rejecting the null hypothesis at the significance level of α = 0.05, which implies that at least one independent variable is significantly correlated with gross profits in the biofuel sector and that the slope of the regression line is statistically significant (Table 8).
The analysis revealed that gross profits in the biofuel sector are mainly affected by the following variables: X2—cost of sales and X1—biodiesel production (Table 9).
Semi-partial correlations were calculated to determine the proportion of unexplained variance in the dependent variable that is explained by the first predictor [63]. The results were used to estimate the individual effects of independent variables on the dependent variable.
Semi-partial correlations are smaller than partial correlations, but their distribution is similar. The highest p-values were noted for two variables: X5—rapeseed exports and X4—fixed assets (Table 9).
4. Discussion
Vegetable fats have numerous applications. They are used in the food processing industry to produce edible oils, butter, margarine, bread, and canned foods. Rapeseed meal and oil cake are highly abundant in protein, and they are used in the production of feed concentrates for livestock. The demand for rapeseed meal and oil cake increased after many countries banned the use of meat and bone meal in the production of animal feed [64]. Vegetable oils also have numerous applications in the chemical industry, including the production of soap, detergents, varnish, and oil-based paint. In the petrochemical industry, rapeseed is processed into biodiesel esters [65].
The oilseed market is developing rapidly in Poland and other countries around the world. Oilseed crops are not only processed into edible oils but are also used in the production of biofuels [66,67]. The EU mandated that 10% of transport fuels should come from renewable energy sources (biocomponents) by 2020 [68,69]. In Poland, biocomponents accounted for 7.1% of transport fuels in 2013, and their share increased to 8.5% in 2018, which points to a growing demand for rapeseed [8].
A higher demand for rapeseed oil in the biofuel sector can contribute to an increase in the production and competitiveness of rapeseed relative to wheat. The EU’s biofuel policy will significantly influence the performance of the rapeseed market. However, a proposal was made to reduce the share of biocomponents in transport fuels from 10% to 7%, which could decrease the demand for rapeseed oil by 2020 [70,71].
Our research demonstrated the development of the biofuel industry in Poland. The reasons for this development are numerous. The European Union (EU), including Poland, has experienced important biodiesel development because of the production of rapeseed. More rapeseed is used for biodiesel production than for edible oils. The demand for first-generation biofuels is increasing. The sown area of rapeseed in Poland is increasing. The prices of rapeseed are higher compared with other sources. Finally, COVID-19 and the war between Russia and Ukraine broke the supply chains of agricultural products. However, bioenergy will play a key role in the future supply of renewable energy sources [72]. Green energy will play a key role not only in renewable energy source development but also in economic growth [73].
The main determinant is undoubtedly the price of rapeseed oil. This oil is used for both the production of edible oils and biodiesel. However, the price of oil is determined by various factors, among which, the supply side is important. The delivery of rapeseed to the market is stable, and that is why the economic performance is at a good level.
5. Conclusions
Both microeconomic and macroeconomic factors that affected the gross profit of vegetable oil and fat producers were examined. The first hypothesis describing, that the price of rapeseed oil is the key determinant of profitability in the biodiesel industry, was positively verified. The second hypothesis, that the net profit of biodiesel companies depends on biodiesel production to the greatest extent, was verified. The study demonstrated that gross profits in the biofuel industry were influenced mainly by the price of rapeseed oil. Therefore, the research hypothesis was positively validated.
Microeconomic and macroeconomic factors also exerted a considerable impact on the performance of biofuel companies. The most important microeconomic variables were the cost of goods sold and fixed assets. In turn, the net profit of biofuel companies was determined based on biodiesel production, the monthly consumption of rapeseed oil, and rapeseed exports. Our research proved that gross profits in the biofuel sector are affected mainly by the following variables, X2—cost of goods sold and X1—biodiesel production, which proved to have a large impact on the economic factor. The results verify Hypothesis 1 and Hypothesis 2 positively. Statistical analysis is a useful tool in evaluating factors determining economic performance [74]. Statistical analysis including regression and other models such as Gaussian process regression (GPR) can be used because it can achieve high efficiency in terms of the estimation and evaluation of biodiesel producers and properties [75]. The analysis showed the impact of factors from the demand side. This can be particularly visible in X3—the monthly consumption of rapeseed oil and X5—rapeseed exports. Growing demand for renewable energy sources increases the need for rapeseed for biodiesel production.
The results of this study indicate that both microeconomic and macroeconomic factors affect the performance of biofuel producers. Their status is largely determined by changes in the market related to rapeseed production and prices. Information pertaining to the business environment, as well as statistical data, should be analyzed to improve the financial performance of these companies. The conditions of the EU market also play an important role because the performance of leading rapeseed producers affects production and commerce in Poland.
In summary, the rapeseed market can be expected to grow because of high demand for rapeseed in the vegetable oil and biofuel sectors despite recent advances in the production of second- and third-generation biofuels. Steep competition for raw materials will drive rapeseed prices in the Polish and global markets, which will improve the performance of rapeseed producers. The competitiveness of biodiesel producers will depend on flexible subsidy schemes, but they will lose this competitiveness in terms of low oil prices and expensive feedstock processes [76].
Funding
The results presented in this paper were obtained as part of a comprehensive study financed by the University of Warmia and Mazury in Olsztyn, Faculty of Agriculture and Forestry, Department of Agrotechnology and Agribusiness (Grant. No 30.610.012-110). The project was financially supported by the Minister of Education and Science under the program entitled ‘Regional Initiative of Excellence’ for the years 2019–2023, project No. 010/RID/2018/19, amount of funding: PLN 12,000,000.
Institutional Review Board Statement
Not applicable.
Informed Consent Statement
Not applicable.
Data Availability Statement
Data are contained within the article.
Conflicts of Interest
The author declares no conflict of interest.
Nomenclature
| CN | Cetane number |
| CO2 | Carbon dioxide |
| EBIT | Earnings before deducting interest and taxes |
| EU | European Union |
| GHG | Greenhouse gas |
| GDP | Gross domestic product |
| GPR | Gaussian process regression |
| NO | Nitrogen oxide |
| PLN | Polish zloty |
| RED | Renewable energy directive |
| RES | renewable energy source |
References
- Cegiełka, A. ‘’Clean label” as one of the leading trends in the meat industry in the world and in Poland—A review. Rocz. Panstw. Zakl. Hig. 2020, 71, 43–55. [Google Scholar] [CrossRef] [PubMed]
- Firlej, K.; Żmija, D. The specificity of knowledge management in the food industry in Poland. Econ. Manag. 2017, 1, 83–97. [Google Scholar] [CrossRef]
- Firlej, K. Analysis of the Factors Increasing the Competitiveness of the Food Industry Enterprises Results. 2014. Available online: https://depot.ceon.pl/handle/123456789/6808 (accessed on 25 September 2023).
- Andrzejuk, A. Comparison of Agriculture Biotechnology and its Spatial Diversification among Different Countries of the World. Problems of Warld Agriculture 2017, 17, 11–20. [Google Scholar] [CrossRef]
- Mrówczyńska-Kamińska, A.; Poczta, W. Creation and Distribution of p[Roducts of the Agriculture and Food Industries in View of Their Interdependency with the National Economy: A Comparative Sectoral Analysis of the Agri-Food Sectors in Poland and Germany. Federal Ministry of Food, Agriculture and Consumer Protection. 2013. Available online: https://buel.bmel.de/index.php/buel/article/view/MrowczynskaKaminskaPoczta/MrowczynskaKaminskaPoczta-pdf (accessed on 1 October 2023).
- Mroczek, R. The position of the food industry in Poland’s food chain at the turn of the 20th to the 21 st century. Zesz. Nauk. Szkoły Glównej Gospod. Wiej. W Warszawie—Probl. Rol. Swiat. 2018, 18, 23–37. [Google Scholar] [CrossRef]
- Tereszczuk, M.; Mroczek, R. Labor productivity and concentration of food production in the Polish food industry against the EU-28. Zesz. Nauk. Szkoły Glównej Gospod. Wiej. W Warszawie—Probl. Rol. Swiat. 2018, 18, 299–308. [Google Scholar] [CrossRef]
- Rynek Rzepaku–Stan i Perspektywy, IERiGŻ-PiB, ARR, MRiRW, Warszawa 2005–2022; IERiGŻ-PiB, ARR, MRiRW: Warszawa, Poland, 2023.
- Rosen, M.A. Environmental sustainability tools in the biofuel industry. Biofuel Res. J. 2018, 17, 751–752. [Google Scholar] [CrossRef]
- Rodionova, M.V.; Poudyal, R.S.; Tiwari, I.; Zharmukhamedov, S.K.; Nam, H.G.; Zayadan, B.K.; Bruce, B.D.; Hou, H.J.M.; Allakhverdiev, S.I. Biofuel production: Challenges and opportunities. Int. J. Hydrogen Energy 2017, 42, 8450–8461. [Google Scholar] [CrossRef]
- Bamigun, B.; Sigamoney, R.; von Blottnitz, H. Commercialisation of biofuel industry in Africa: A review. Renew. Sustain. Energy Rev. 2008, 12, 690–711. [Google Scholar] [CrossRef]
- Ponte, S. Roundtabling’ sustainability: Lessons from the biofuel industry. Geoforum 2014, 54, 261–271. [Google Scholar] [CrossRef]
- Nizami, A.; Rehan, M. Towards nanotechnology-based biofuel industry. Biofuel Res. J. 2018, 18, 798–799. [Google Scholar] [CrossRef]
- Rai, D.; da Silva, S.S. Nanotechnology for Bioenergy and Biofuel Production. 2017. Available online: https://link.springer.com/book/10.1007%2F978-3-319-45459-7 (accessed on 3 October 2023).
- Gupta, V.K.; Touhy, M.G. Biofuel Technologies Recent Developments; Springer: Berlin/Heidelberg, Germany, 2013. [Google Scholar]
- Zhou, Y.; Zhang, Z.; Zhang, Y.; Wang, Y.; Yu, Y.; Ji, F.; Ahmad, R.; Dong, R. A comprehensive review on densified solid biofuel industry in China. Renew. Sustain. Energy Rev. 2016, 54, 1412–1428. [Google Scholar] [CrossRef]
- Narwane, V.S.; Yadav, V.S.; Raut, R.D.; Narkhede, B.E.; Gardas, B.B. Sustainable development challenges of the biofuel industry in India based on integrated MCDM approach. Renew. Energy 2021, 164, 298–309. [Google Scholar] [CrossRef]
- Martin, M.; Wetterlund, E.; Hackl, R.; Holmgren, K.M.; Peck, P. Assessing the aggregated environmental benefits from by-product and utility synergies in the Swedish biofuel industry. Biofuels 2020, 11, 683–698. [Google Scholar] [CrossRef]
- Gurgel, A.; Reilly, J.M.; Paltsev, S. Potential Land Use Implications of a Global Biofuels Industry. J. Agric. Food Ind. Organ. 2007, 5, 2. [Google Scholar] [CrossRef]
- Johnson, T.; Gonzalez, B. Economics of biofuels. Does biodiesel make cents? AIA Global. Associatioon of Industry Analytics Global. Available online: https://www.aia-global.org/resources/The%20Economics%20of%20Biofuels.pdf (accessed on 9 November 2023).
- Gebremarian, S.N.; Marchetti, J.M. The effect of economic variables on a bio-refinery for biodiesel production using calcium oxide catalyst. Biofuels Bioprod. Biorefin. 2019, 13, 1133–1382. [Google Scholar] [CrossRef]
- Verma, P.; Sharma, M.P. Dwivedi G. Operational and Environmental Impact of Biodiesel on Engine Performance. Int. J. Renew. Res. 2015, 5, 961–970. [Google Scholar]
- Sing, N.; Kaushal, R.; Saluja, R.K. Storage stability analysis of biodiesel prepared from jatropha oil. J. Adv. Res. Dyn. Control. Syst. 2019, 11, 1083–1090. [Google Scholar]
- Gebremariam, S.N.; Marchetti, J.M. Process simulation and techno-economic performance evaluation of alternative technologies for biodiesel production from low value non-edible oil. Biomass Bioenergy 2021, 149, 106102. [Google Scholar] [CrossRef]
- Noushabadi, A.S.; Dashti, A.; Raji, M.; Zarei, A.; Mohammadi, A.H. Estimation of cetane numbers of biodiesel and diesel oils using regression and PSO-ANFIS models. Renew. Energy 2020, 158, 465–473. [Google Scholar] [CrossRef]
- Jåstad, E.O.; Bolkesjø, T.F.; Trømborg, E.; Rørstad, P.K. Large-scale forest-based biofuel production in the Nordic forest sector: Effects on the economics of forestry and forest industries. Energy Convers. Manag. 2019, 184, 374–388. [Google Scholar] [CrossRef]
- Szczepaniak, I.; Szajner, P. Challenges of Energy Management in the Food Industry in Poland in the Context of the Objectives of the European Green Deal and the “Farm to Fork” Strategy. Energies 2022, 15, 9090. [Google Scholar] [CrossRef]
- Rosiak, E. Domestic rapeseed market. Rośliny Oleiste 2016, 37, 11–20. Available online: https://www.cabdirect.org/cabdirect/abstract/20173296290 (accessed on 20 September 2023).
- Bełdycka-Bórawska, A.; Jankowski, K.J.; Rokicki, T.; Gostkowski, M. Area under Rapeseed Cultivation as a Factor Differentiating the Economic Performance of Biodiesel Producers. Energies 2021, 14, 8568. [Google Scholar] [CrossRef]
- Piwowar, A.; Dziku’c, M. Bioethanol Production in Poland in the Context of Sustainable Development-Current Status and Future Prospects. Energies 2022, 15, 2582. [Google Scholar] [CrossRef]
- Bórawski, P.; Holden, L.; Bełdycka-Bórawska, A. Perspectives of photovoltaic energy market development in the European Union. Energy 2023, 270, 126804. [Google Scholar] [CrossRef]
- Gołaś, Z.; Bieniasz, A. Empirical Analysis of the Influence of Inventory Management on Financial Performance in the Food Industry in Poland. Eng. Econ. 2016, 3, 264–275. [Google Scholar] [CrossRef]
- Szymańska, E.J.; Lukoszová. Liquidity and Profitability of Meat Processing Enterprises in Poland. Probl. Agric. Econ. 2021, 4, 135–153. Available online: https://ssrn.com/abstract=4049046 (accessed on 3 September 2023). [CrossRef]
- Drożdz, J.; Mroczek, R. Food industry—Development in the conditions of external environment changes. Przemysł Spożywczy 2020, 74, 6–13. [Google Scholar] [CrossRef]
- Sobocinska, M.; Mazurek-Łopacinska, K.; Skowron, S.; Graczyk, A.; Kociszewski, K. The Role of Marketing in Shaping the Development of the Market of Organic Farming Products in Poland. Sustainability 2021, 13, 130. [Google Scholar] [CrossRef]
- Qazi, A.; Hussain, F.; Rahim, N.A.; Hardaker, G.; Alghazzawi, D.; Shaban, K.; Haruna, K. Towards sustainable energy: A systematic review of renewable energy sorces, technologies, and Public opinions. IEEE Access 2019, 7, 63837–63851. [Google Scholar] [CrossRef]
- Benedek, J.; Sebestyén, T.-T.; Bartók, B. Evaluation of renewable energy sources in peripheral areas and renewable energy-based development. Renew. Sustain. Energy Rev. 2018, 90, 516–535. [Google Scholar] [CrossRef]
- Bórawski, P.; Holden, L.; Bórawski, M.B.; Mickiewicz, B. Perspectives of Biodiesel Development in Poland against the Background of the European Union. Energies 2022, 15, 4332. [Google Scholar] [CrossRef]
- Gebremariam, S.N.; Marchetti, J.M. Biodiesel production technologies: Review. AIMS Energy 2017, 5, 425–457. [Google Scholar] [CrossRef]
- Alizadeh, R.; Lund, P.D.; Soltanisehat, L. Outlook on biofuels in future studies: A systematic literature review. Renew. Sustain. Energy Rev. 2020, 134, 110326. [Google Scholar] [CrossRef]
- Masjuki, H.H.; Kalam, M.A.; Mofijur, M.; Shahabuddin, M. Biofuel: Policy, standardization and recommendation for syustainable future energy supply. Energy Procedia 2013, 42, 577–586. [Google Scholar] [CrossRef]
- Verma, P.; Sharma, M.P. Review of process parameters for biodiesel production from different feedstocks. Renew. Sustain. Energy Rev. 2016, 62, 1063–1071. [Google Scholar] [CrossRef]
- Gebrremariam, S.N.; Marchetti, J.M. Economics of biodiesel production: Review. Energy Convers. Manag. 2018, 168, 74–84. [Google Scholar] [CrossRef]
- Saluja, R.K.; Kumar, V.; Sham, R. Stability of biodiesel—A review. Renew Sustain. Energy Rev. 2016, 62, 866–881. [Google Scholar] [CrossRef]
- Biernat, K. Perspektywy rozwoju biopaliw. Paliwa 2013, 4, 56–59. [Google Scholar]
- Gao, Z.; Alshehri, K.; Li, Y.; Qian, H.; Sapsford, D.; Cleall, P.; Harbottle, M. Advances in biological techniques for sustainable lignocellulosic waste utilization in biogas production. Renew. Sustain. Energy Rev. 2022, 170, 112995. [Google Scholar] [CrossRef]
- Bumbiere, K.; Gancone, A.; Pubule, J.; Kirsanovs, V.; Vasarevicius, S.; Blumberga, D. Ranking of bioresources for biogas production. Environ. Clim. Technol. 2020, 24, 368–377. [Google Scholar] [CrossRef]
- Hijazi, O.; Munro, S.; Zerhusen, B.; Effenberger, M. Review of life cycle assessment for biogas production in Europe. Renew. Sustain. Energy Rev. 2016, 54, 1291–1300. [Google Scholar] [CrossRef]
- Vac, S.-C.; Popita, G.-E. Biomass: Economical, social and environmental aspects in biogas plants implementation. J. Environ. Prot. Ecol. 2015, 16, 1212–1220. [Google Scholar]
- Berhe, T.G.; Tesfahuney, R.G.; Desta, G.A.; Mekonnen, S. Biogas plant distribution for rural household sustainable energy supply in Africa. Energy Policy Res. 2017, 4, 10–20. [Google Scholar] [CrossRef]
- Stanić, S.; Željko, V.; Račić, Z.V. Analysis of Macroeconomic Factors Effect to Gross Domestic Product of Bosnia and Herzegovina Using the Multiple Linear Regression Model. Economics 2019, 7, 91–97. [Google Scholar] [CrossRef]
- Zawadzka, D.; Strzelecka, A.; Szafraniec-Siluta, E. Debt as a Source of Financial Energy of the Farm—What Causes the Use of External Capital in Financing Agricultural Activity?A Model Approach. Energies 2021, 14, 4124. [Google Scholar] [CrossRef]
- Zabolotnyy, S.; Wasilewski, M. The Concept of Financial Sustainability Measurement: A Case of Food Companies from Northern Europe. Sustainability 2019, 11, 5139. [Google Scholar] [CrossRef]
- Borychowski, M. Determinants for liquid biofuels production in Poland after 2006—Model approach. J. Agribus. Rural. Dev. 2017, 2, 263–277. [Google Scholar] [CrossRef]
- Miller, N.; Christensen, A.; Park, J.E.; Baral, A.; Malins Ch Searle, S. Measuring and Addressing Investment Risk in the Second-Generation Biofuels Industry; International Council on Clean Transportantion: Washington, DC, USA, 2013. [Google Scholar]
- Baran, J. Supply chain management in agri-food processing enterprises. J. Mod. Sci. 2018, 39, 217–230. [Google Scholar] [CrossRef]
- Catäo, L.A.V.; Milesi-Ferretti, G.M. External liabilities and crises. J. Int. Econ. 2014, 94, 18–32. [Google Scholar] [CrossRef]
- Pries, F.; Talebi, A.; Schillo, S.; Lemay, M.A. Risks affecting the biofuels industry: A US and Canadian company perspective. Energy Policy 2016, 97, 93–101. [Google Scholar] [CrossRef]
- Bartniczak, B. State aid for biofuels in Poland. Econ. Environ. Stud. 2014, 4, 441–452. [Google Scholar]
- Dołęgowska, S. Biofuels—A step towards sustainable development. Probl. Ekorozw. Probl. Sustain. Dev. 2009, 4, 117–121. [Google Scholar]
- Kumar, S. Comparison of linear regression and artificial network technique for prediction of a soybean biodiesel yield. Energy Sources PART A Recovery Utylization Environ. Eff. 2020, 42, 1425–1435. [Google Scholar] [CrossRef]
- Dudzińska, M.; Prus, B.; Cellmer, R.; Bacior, S.; Kocur-Bera, K.; Klimach, A.; Trystuła, A. The Impact of Flood Risk on the Activity of the Residential Land Market in a Polish Cultural Heritage Town. Sustainability 2020, 12, 10098. [Google Scholar] [CrossRef]
- Kim, S. p-value calculation methods for semi-partial correlation coefficients. Commun. Stat. Appl. Methods 2022, 29, 397–402. [Google Scholar] [CrossRef] [PubMed]
- Rosiak, E.; Łopaciuk, W.; Szajner, P.; Grochowska, R. Global Production of Biofuels in the Context of Food Security; Institute of Agriculture and Food Economics—National Research Institute. Available online: https://depot.ceon.pl/handle/123456789/7894 (accessed on 5 September 2023).
- Bełdycka-Bórawska, A.; Bórawski, P.; Holden, L.; Rokicki, T.; Klepacki, B. Factors Shaping Performance of Polish Biodiesel Producers Participating in the Farm Accountancy Data Network in the Context of the Common Agricultural Policy of the European Union. Energies 2022, 15, 7400. [Google Scholar] [CrossRef]
- Boczar, P.; Błażejczyk-Majka, L. Characteristics of Vegetable Oil Consumers in Poland in a View of Sustainable Consumption Principles. Acta Sci. Pol. Oeconomia 2015, 4, 15–26. [Google Scholar]
- Boczar, P. Możliwości Produkcji Rzepaku w Polsce i Zmiany Kierunków Jego Wykorzystania. Wyd; Uniwersytetu Przyrodniczego w Poznaniu: Poznań, Poland, 2014. (In Polish) [Google Scholar]
- Directive 2009/30/EC of the European Parliament and of the Council of 23 April 2009 amending Directive 98/70/EC as regards the specification of petrol, diesel and gas-oil and introducing a mechanism to monitor and reduce greenhouse gas emissions and amending Council Directive 1999/32/EC as regards the specification of fuel used by inland waterway vessels and repealing Directive 93/12/EEC. Available online: https://eur-lex.europa.eu/LexUriServ/LexUriServ.do?uri=OJ:L:2009:140:0088:0113:EN:PDF (accessed on 2 October 2023).
- Gadzicka, W. Legal and formal analysis of chosen provisions of Directive 2009/30/EC and of the Act of 25 August 2006 on the fuel quality monitoring and control system. Stud. Pr. Prawnicze Adm. I Ekon. 2019, 29, 171–181. [Google Scholar] [CrossRef]
- Izdebski, W.; Jakubowski, Z.; Skudlarski, J.; Zając, S.; Mazev, G.E.; Zaika, S.A. Stan i perspektywy produkcji rzepaku w Polsce i na Ukrainie w aspekcie produkcji biopaliw transportowych. Zesz. Nauk. SGGW Warszawie Probl. Rol. Swiat. 2014, 14, 80–89. [Google Scholar]
- Izdebski, W.; Kryś, P.; Skudlarski, J.; Zając, S.; Maznev, G.; Zaika, S. Opportunities and barriers to development of biofuels for transport in Poland—Experience for Ukraine. Technol. Audit. Prod. Reserves 2014, 3, 23–27. [Google Scholar]
- Roman, M.; Roman, M.; Roman, K. The forecast of economic processes of selected agricultural products in the development of bioenergy and agritourism activity in Poland. Proc. Int. Sci. Conf. Hradec Econ. Days 2018, 8, 246–247. [Google Scholar]
- Łącka, I. The Role of Green Energy in the Economic Growth of the World. In Green Energy. Green Energy and Technology; Bąk, I., Cheba, K., Eds.; Springer: Cham, Switzerland, 2023. [Google Scholar] [CrossRef]
- Kim, S. Ppcor: An R Package for a Fast Calculation to Semi-partial Correlation Coefficients. Commun. Stat. Appl. Methods 2015, 22, 665–674. [Google Scholar] [CrossRef]
- Pustokhina, I.; Seraj, A.; Hafsan, H.; Mostafavi, S.M.; Alizadeh, S.M. Developing a robust model based on the Gaussian process regression approach to predict biodiesel properties. Hindawi Int. J. Chem. Eng. 2021, 2021, 5650499. [Google Scholar] [CrossRef]
- Ghoddusi, H. Price risk for biofuel producers in a deregulated market. Renew. Energy 2017, 114, 394–407. [Google Scholar] [CrossRef]

Disclaimer/Publisher’s Note: The statements, opinions and data contained in all publications are solely those of the individual author(s) and contributor(s) and not of MDPI and/or the editor(s). MDPI and/or the editor(s) disclaim responsibility for any injury to people or property resulting from any ideas, methods, instructions or products referred to in the content. |
© 2023 by the author. Licensee MDPI, Basel, Switzerland. This article is an open access article distributed under the terms and conditions of the Creative Commons Attribution (CC BY) license (https://creativecommons.org/licenses/by/4.0/).