Article

Study on the Evolution Law of Wellbore Stability Interface during Drilling of Offshore Gas Hydrate Reservoirs

1
School of Petroleum Engineering, China University of Petroleum (East China), Qingdao 266580, China
2
CNPC Offshore Engineering Company Limited, Beijing 100028, China
*
Author to whom correspondence should be addressed.
Energies 2023, 16(22), 7585; https://doi.org/10.3390/en16227585
Submission received: 18 October 2023 / Revised: 9 November 2023 / Accepted: 11 November 2023 / Published: 15 November 2023
(This article belongs to the Section H1: Petroleum Engineering)

Abstract

:
The study of wellbore stability in offshore gas hydrate reservoirs is an important basis for the large-scale exploitation of natural gas hydrate resources. The wellbore stability analysis model in this study considers the evolution of the reservoir mechanical strength, wellbore temperature, and pressure parameters along the depth and uses plastic strain as a new criterion for wellbore instability. The wellbore stability model couples the hydrate phase transition near the wellbore area under the effect of the wellbore temperature and pressure field and the ‘heat–fluid–solid’ multifield evolution characteristics, and then simulates the stability evolution law of the wellbore area during the drilling process in the shallow seabed. The research results show that, owing to the low temperature of the seawater section and shallow formation, the temperature of the drilling fluid in the shallow layer of the wellbore can be maintained below the formation temperature, which effectively inhibits the decomposition of hydrates in the wellbore area. When the wellbore temperature increases or pressure decreases, the hydrate decomposition rate near the wellbore accelerates, and the unstable area of the wellbore will further expand. The research results can provide a reference for the design of drilling parameters for hydrate reservoirs.

1. Introduction

Energy is an important basis for the development of human society. Owing to population growth and social development, the expanding energy demand and increasingly severe environmental problems have stimulated the rapid development of low-carbon clean energy [1,2,3]. As a new type of clean energy source, natural gas hydrates have a wide distribution, large reserves, and high energy density, and they have recently attracted extensive interest worldwide [4,5,6]. At present, scholars have conducted research on stratigraphic subsidence in the Gulf of Mexico, the Yuling Basin in South Korea, the KG Basin in India, and the Nankai Trough in Japan [7,8,9,10,11,12].
The safe and efficient drilling of offshore hydrate reservoirs is important for resource development [13,14,15]. Because of the shallow burial depth, weak cementation, instability, and lack of dense caprock of marine gas hydrates, the drilling window of hydrate production wells is narrow [16,17]. In contrast to traditional oil and gas reservoirs, the temperature change of the drilling fluid in the wellbore has a greater impact on the stability of the wellbore in the hydrate reservoir section [18,19,20,21]. Many scholars have performed a series of studies on the stability of hydrate reservoirs during drilling and have obtained some general understanding. Ayoub et al. established a wellbore stability evaluation model of a hydrate deposition reservoir under the coupling of heat, fluid, and mechanics but simplified the multiphase flow of the reservoir caused by hydrate decomposition [22]. Cheng et al. established a transient, two–phase, fluid-solid coupling mathematical model for drilling hydrate reservoirs and focused on the influence of mud density and temperature on wellbore stability [23]. Rutqvist et al. studied wellbore stability during the drilling and depressurization of hydrate reservoirs and analyzed the evolution law of the yield range around the wellbore [7]. Wang et al. derived an analytical solution for the coupling of temperature, seepage pressure, and stress displacement fields during hydrate drilling and analyzed the impact of hydrate decomposition on wellbore stability [24]. Sun et al. studied the wellbore stability rule under the condition of drilling–fluid invasion based on the SH2 well in the Shenhu area of the South China Sea, by considering the influence of drilling fluid salinity [25]. Li et al. established a thermal fluid-solid coupling numerical model considering hydrate decomposition and analyzed the evolution law of the stress field and plastic region caused by the change in the temperature pressure field, as well as the change in mechanical properties before and after hydrate decomposition [26]. Liao et al. proposed a fully coupled wellbore reservoir model and analyzed the mass and heat transfer laws between the wellbore and reservoir and the behavior of wellbore yield failure [27].
Existing research has shown that wellbore instability may be caused by the decomposition of wellbore hydrates during drilling. However, most studies assume that the mechanical properties of the formation remain unchanged or ignore the evolution law of the temperature and pressure fields in the wellbore. Cheng et al. proposed a porous thermoelastic model to analyze the thermodynamics of natural gas hydrates and wellbore stability [28]. However, the formation parameters were obtained from the completed drilling data, and the differences in the mechanical strength of the sedimentary layers at different depths and the evolution law of the wellbore temperature and pressure field along the wellbore depth were not thoroughly studied.
Therefore, the evolution law of the reservoir mechanical strength with depth is established in this study based on a mechanical test of argillaceous siltstone in the South China Sea. Combined with the evolution law of the wellbore temperature and pressure field along the depth during drilling is analyzed in detail. The research results can provide a theoretical reference for the design of safe drilling windows for hydrate reservoirs.

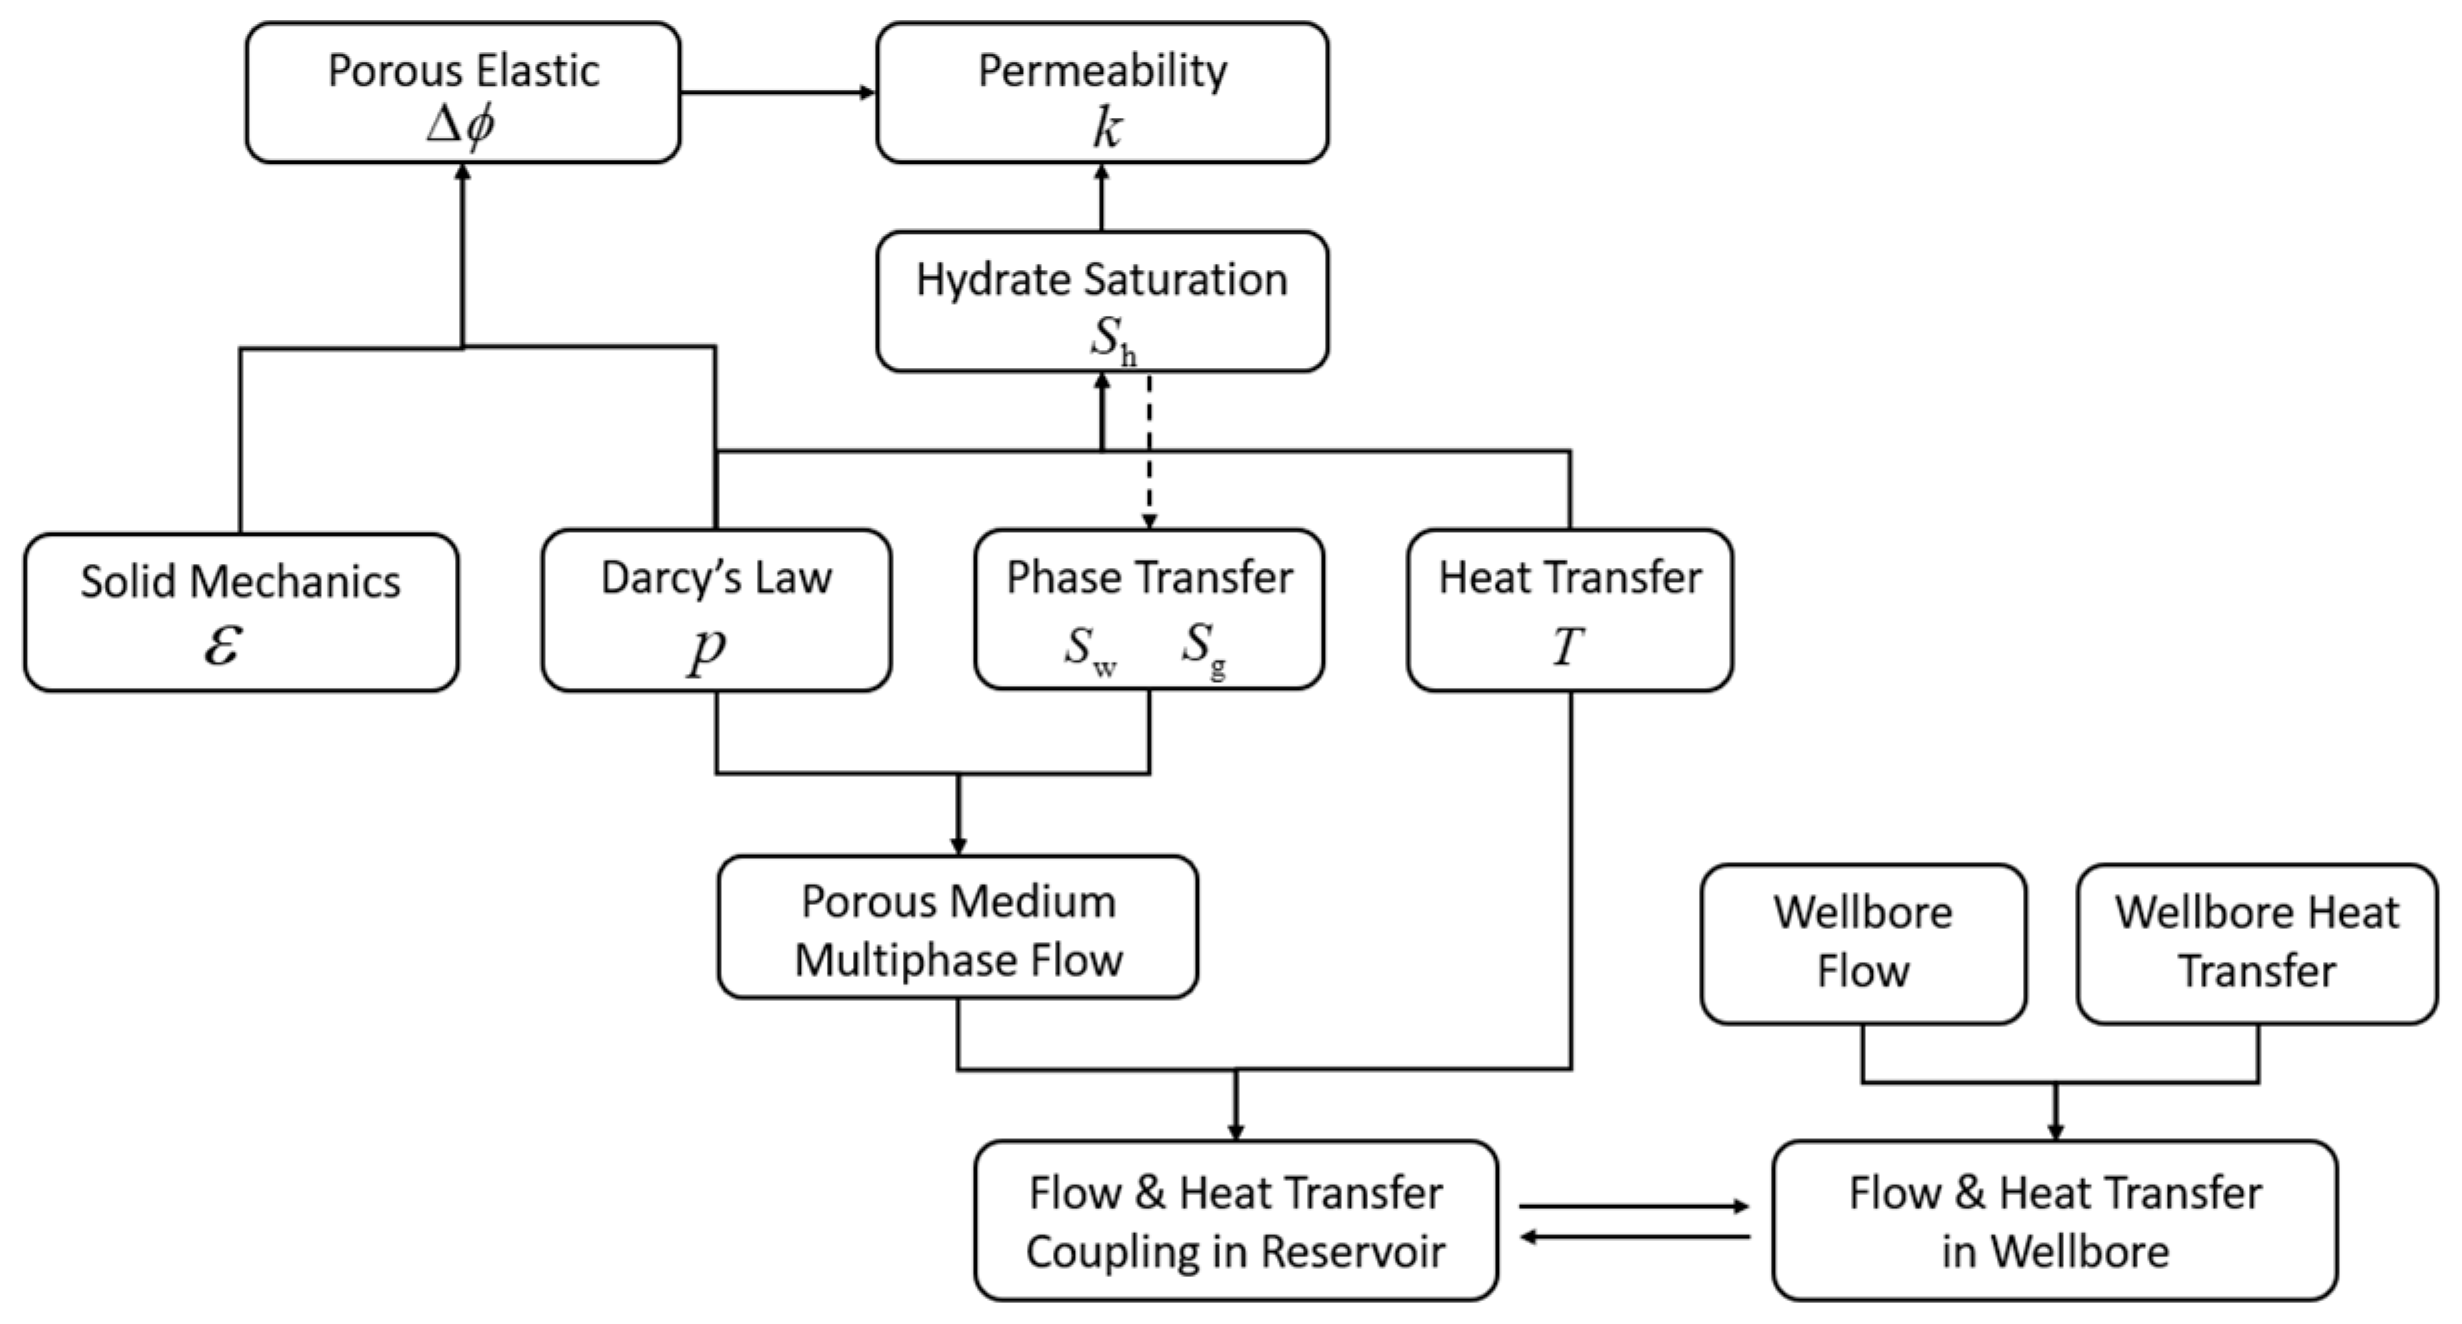
2. Wellbore Stability Model in Gas Hydrate Reservoir Drilling

During deep-water drilling, the wellbore pressure gradually increases with the depth of the well, but the wellbore temperature remains at a low level owing to the heat exchange between the seawater and shallow water sections. Additionally, the reservoir strength, geostress, pore pressure, and other parameters are directly related to the depth of the well. Changes in these parameters are critical for wellbore stability during drilling. Based on this, this study established a multifield coupling model for the drilling process of a hydrate reservoir. In this model, we made the following assumptions: (1) the reservoir is homogeneous in the horizontal direction; (2) the effect of the sidewall filter cake on the invasion rate of the drilling fluid is ignored [23,25].

2.1. Mechanical Model of Wellbore Stability

In the equilibrium state, the skeleton balance equation of the deep water shallow stratum can be described by the virtual displacement equation as follows [29,30]:
V σ : δ ε d V = S a t s δ v d S + V f δ v d V
where V is the volume of the unit, Sa is the surface area of the unit, σ is the stress matrix, δε is the virtual displacement matrix, ts is the surface force vector, f is the volume force vector, and δv is the virtual displacement velocity.
According to the Terzaghi effective stress principle, the effective stress formula of the stratum skeleton is [31]:
σ = σ α B p w
where σ′ is the effective stress (MPa), αB is the effective stress coefficient (dimensionless), and pw is the pore pressure (MPa).
According to the definition of elastic–plastic strain,
d ε = d ε e + d ε p = 1 + v E d σ + d Λ g σ
where dεe is the elastic strain, dεp is the plastic strain, g is the plastic potential function, and Λ is a proportional function of the flow rule.
Yoneda et al. determined that the elastic modulus increases with the logarithm of the hydrate saturation, according to the core data of the Nankai Trough in Japan [32]. Liao et al. expressed the relationship between the elastic modulus and saturation of the hydrate reservoir using the regression fitting method [33]:
log E S h = log E S h = 0 + 1.1983 S h
where E is the elastic modulus of the hydrate reservoir, which is obtained using Equation (4); Sh is gas hydrate saturation.
The empirical model expression of the cohesion of the formation skeleton versus hydrate saturation is expressed as follows [25]:
C S h = C S h = 0 + α S h β
where the values of α and β are 0.063 and 0.625, respectively.
To reflect the influence of the average principal stress on the shear strength of the hydrate reservoir, the form of the yield surface of the Drucker–Prager criterion is adopted in this paper,
g = J 2 α m I 1 k m = 0
where I1 is the first stress invariant; J2 is the second deviator stress invariant and km and αm are material constants. During drilling, the critical maximum principal stress in the wellbore area is expressed as,
σ 1 f = 3 k m + 3 1 2 3 α m σ 3 1 3 α m
where σ1f is the critical maximum principal stress; if σ1> σ1f, plastic deformation will occur, and plastic strain will accumulate in the shaft lining. The triaxial test study of hydrate–bearing sediments by Hyodo et al. showed that when the plastic strain accumulates to a certain extent, the sediments containing natural gas hydrates soften and shear swell [34]. According to Hyodo’s test results, a plastic strain of 0.03 was used as the criterion for wellbore instability in this study.

2.2. Multiphase Flow Model in Hydrate Reservoir

According to the effective stress formula of the formula in (2), the total stress of the hydrate reservoir is partially borne by the rock skeleton and partially by the fluid pore pressure, and the effective stress of the argillaceous siltstone skeleton is obtained. The pore fluid of the hydrate reservoir contains water and methane gas and generates a gas–liquid two-phase flow under the effect of wellbore pressure [35]. According to the continuity equation and Darcy’s law, the continuity equations of gas, water, and gas hydrates in a reservoir can be given by [36],
φ ρ g S g t K rg ρ g μ g K P g + ρ g g + φ ρ g S g v s = m g + q g
φ ρ w S w t K rw ρ w μ w K P w + ρ w g + φ ρ w S w v s = m w + q w
φ ρ h S h t = m h
where φ is the absolute porosity of gas hydrate formation (dimensionless); ρw and ρg are the densities of water and gas, respectively, (kg·m−3); Sw and Sg are the water and gas saturation, respectively; vw and vg are the seepage velocities of water and gas, respectively (m·s−1); t is the drilling time (s); mh is the decomposition rate of natural gas hydrate (kg·s−1); mw and mg are the generation rates of water and natural gas, (kg·s−1); qw and qg are the source–sink phases of the water and gas phases, respectively, (kg·(m−3·s−1)). The decomposition kinetics model of the hydrate in the reservoir is shown in Appendix A.
Currently, researchers in the field of hydrate exploitation mostly use Parker et al.’s permeability model to describe the gas water two-phase relative permeability in hydrate reservoirs [37]. When ignoring the gas slippage and capillary pressure during the seepage process in the hydrate reservoir, the relative permeability model can be expressed as:
K rw = S w ¯ 1 1 S ¯ w 1 / m m 2
K rg = 1 S w * 2 1 S w * 2
S ¯ w = S w S wr 1 S wr , S w * = S w S wr 1 S wr S gr , S ¯ g = S g 1 S wr , S ¯ t = S w + S h S wr 1 S wr
where Swr is the irreducible water saturation, Sgr is the irreducible gas saturation, and m is the fitting constant, which is 0.4 in this paper.
When the framework is not deformed, the relationship between the effective permeability and hydrate saturation of the gas hydrate reservoir conforms to the model proposed by Masuda [36].
K = K 0 1 S h N
where K0 is the permeability of the reservoir framework when the hydrate saturation is 0, that is, the absolute permeability, and N is the permeability attenuation index, which is related to the formation of hydrates in pores, and the value range is 2–15.
For porous media, such as hydrate reservoirs, the deformation of its skeleton causes a change in porosity. Assuming that the solid rock particles are incompressible, the volume strain and porosity can be calculated as follows:
K = K 0 1 S h N 1 φ 0 1 + ε v 3 1 n 0 φ 0 1 + ε v 1 3 3
where εv is the volumetric strain, φ0 is the initial rock porosity, d is the diameter of the solid particles, and μ is the dynamic viscosity of the liquid.
The decomposition of hydrates in a reservoir is accompanied by heat transfer. Assuming that the specific heat and thermal conductivities of water, methane gas, and natural gas hydrate are constant, the contact thermal resistance of the heat flow between the fluid and rock can be ignored. The fluid energy equations of fluid flow, heat convection, heat conduction, convective heat transfer with the solid phase, and hydrate decomposition in porous media are expressed as follows:
φ S w ρ w C w + S g ρ g C g T t = φ k f T f S g C g ρ g v g + S w C w ρ w v w T f m h Δ H D + h sf A sf T f T e
where ΔHD is the enthalpy change of the gas hydrate decomposition reaction; Cw and Cg are the specific heat capacities of the water and gas phases at constant pressure, respectively (J·kg−1·K−1).
The substances involved in the hydrate decomposition reaction in the reservoir must satisfy the energy conservation law. According to Hardwick’s calculation model, it can be expressed as [36]:
m w H w + m g H g m h H h = m h Δ H D
Δ H D = m h c 1 + d 1 T M h
where Hs, Hh, Hw and Hg are the enthalpies of rocks, hydrates, water, and methane gas, respectively (J); c1 and d1 are the experimental regression coefficients. For methane hydrate, c1 and d1 are 56,599 J·mol−1 and −16.744 J·(mol·K)−1, respectively.

2.3. Multiphase Flow Model in the Wellbore

During the drilling of a deep-water gas hydrate reservoir, a mass transfer occurs between the near–wellbore formation and the wellbore. When the wellbore pressure decreases, it may result in the invasion of shallow free gas and formation fluid; when the wellbore pressure is excessively high, the drilling fluid invades the formation and causes leakage; as well as the decomposition of hydrates near the well. According to the principle of mass conservation, the mass conservation equations of the liquid, solid, gas and hydrate phases can be expressed as
t ρ w A a E w = z ρ w v w A a E w + m w + q w
t ρ c A a E c = z ρ c v c A a E c
t ρ g A a E g = z ρ g v g A a E g + m g + q g
t ρ h A a E h = z ρ h v h A a E h + m h
where Ew, Ec, Eg and Eh are the volume fractions of each phase of the microelement.
The seawater temperature data published by Levitus et al. were used to fit the attenuation function of seawater temperature with depth [38]:
T s = 15.647 × exp h 313.96 + 4.165 × exp h 1623.21 + T 0 19.036
where h is the depth (m), Ts is the seawater temperature (K), and T0 is the seawater surface temperature (K).

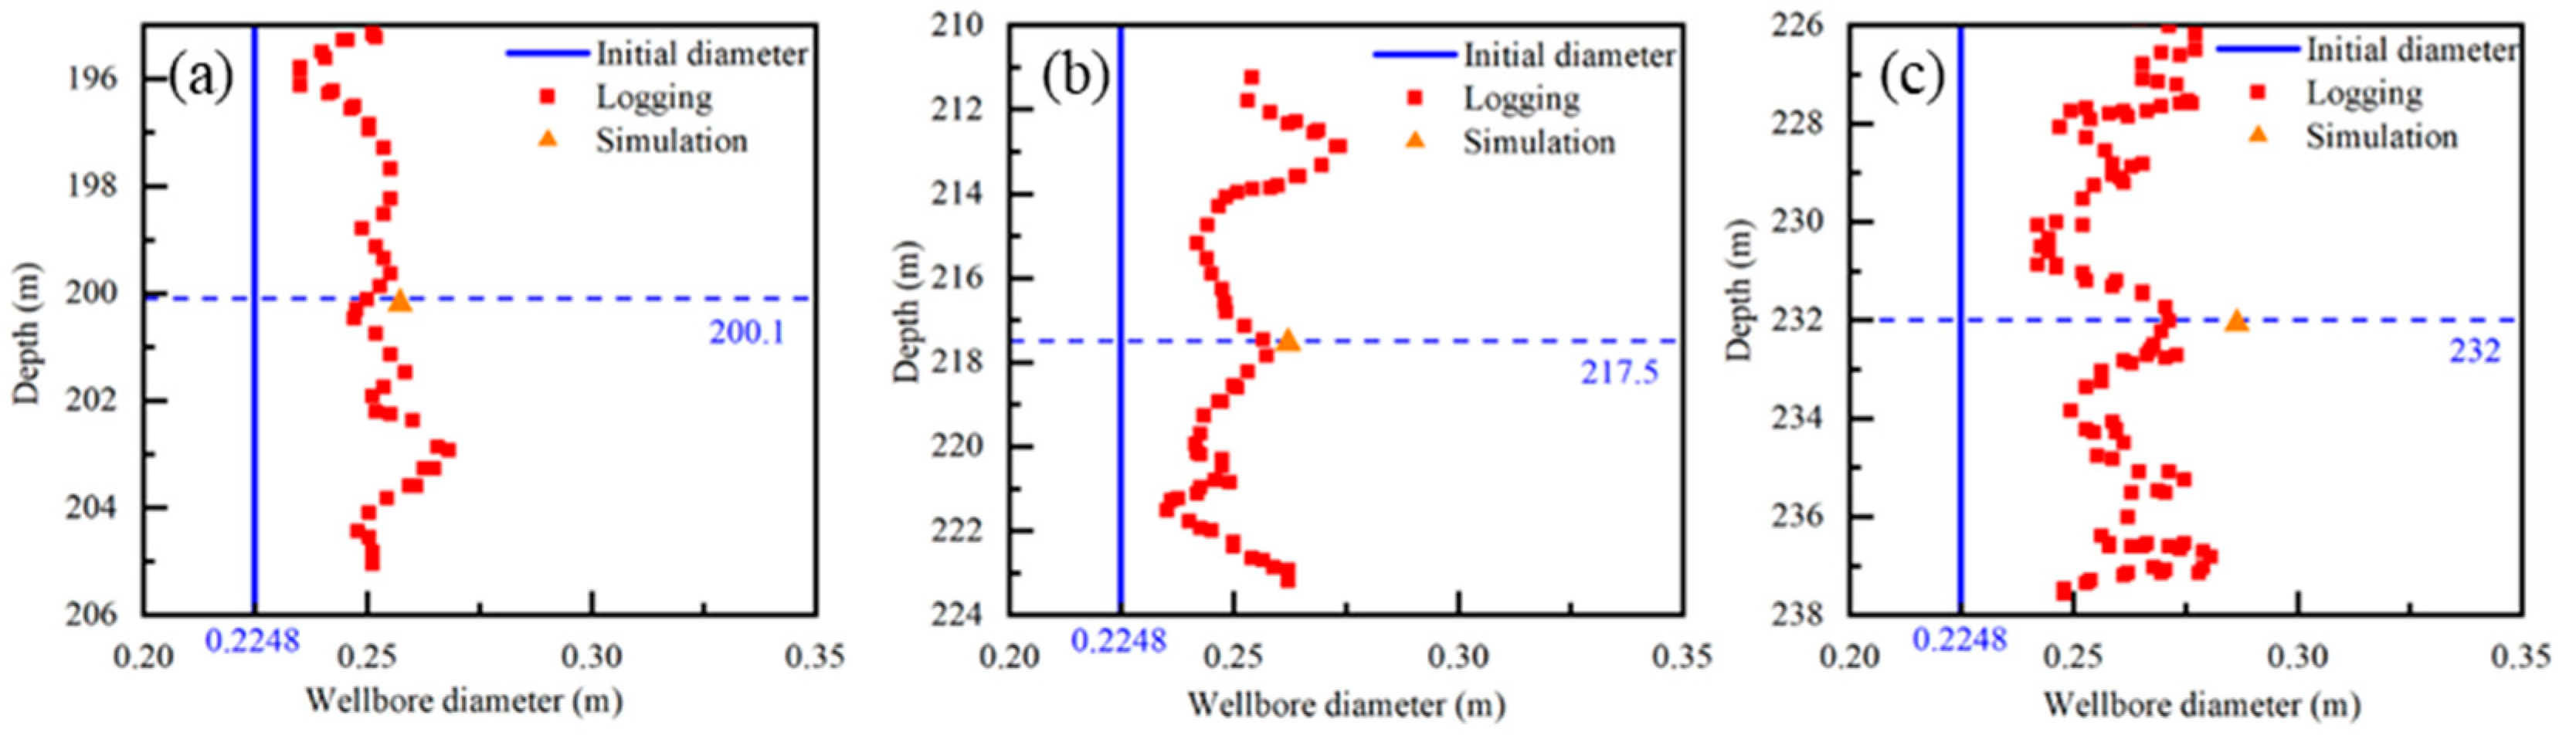
3. Solution and Verification of the Wellbore Stability Model

The wellbore stability analysis of an offshore gas hydrate reservoir during drilling is a multiphase field coupling process, including the mass and heat transfer between the wellbore and reservoir, as well as the coupling between hydrate decomposition, gas–liquid two-phase flow, and porosity evolution near the wellbore. In this study, the model was solved using the software COMSOL Multiphysics v6.0 [39]. The solution process is shown in Figure 1.
Studies on the wellbore stability of hydrate reservoirs are limited by scale factors, and verifying the model under laboratory conditions is difficult. In this study, the accuracy of the model was verified using SH2 well-logging data published by Sun et al. [25]. The initial conditions of the simulation were consistent with the data in the literature and open–hole sections with depths of 200.1, 217.5 and 232 m were obtained for analysis. The stress field near the well was disturbed by the drilling operation, and the high–temperature drilling fluid invaded the reservoir around the well, causing hydrate decomposition in the reservoir around the well. After the hydrate in the reservoir near the well decomposed, the elastic modulus decreased. Under the influence of the drilling fluid pressure in the wellbore, the strain increased. Figure 2 shows the volumetric strain results for the reservoir around the wellbore.
Compared with the logging data in the literature, the borehole radius at a 200.1 m depth was 0.13 m, and the relative error with the logging results was 4%. The borehole radius at a 217.5 m depth was 0.132 m, and the relative error with logging results was 2.91%. The borehole radius at a 232 m depth was 0.142 m, and the relative error with logging results was 4.65%. A data comparison indicated that the calculation model has high accuracy for hydrate–bearing reservoirs.

4. Results and Discussion

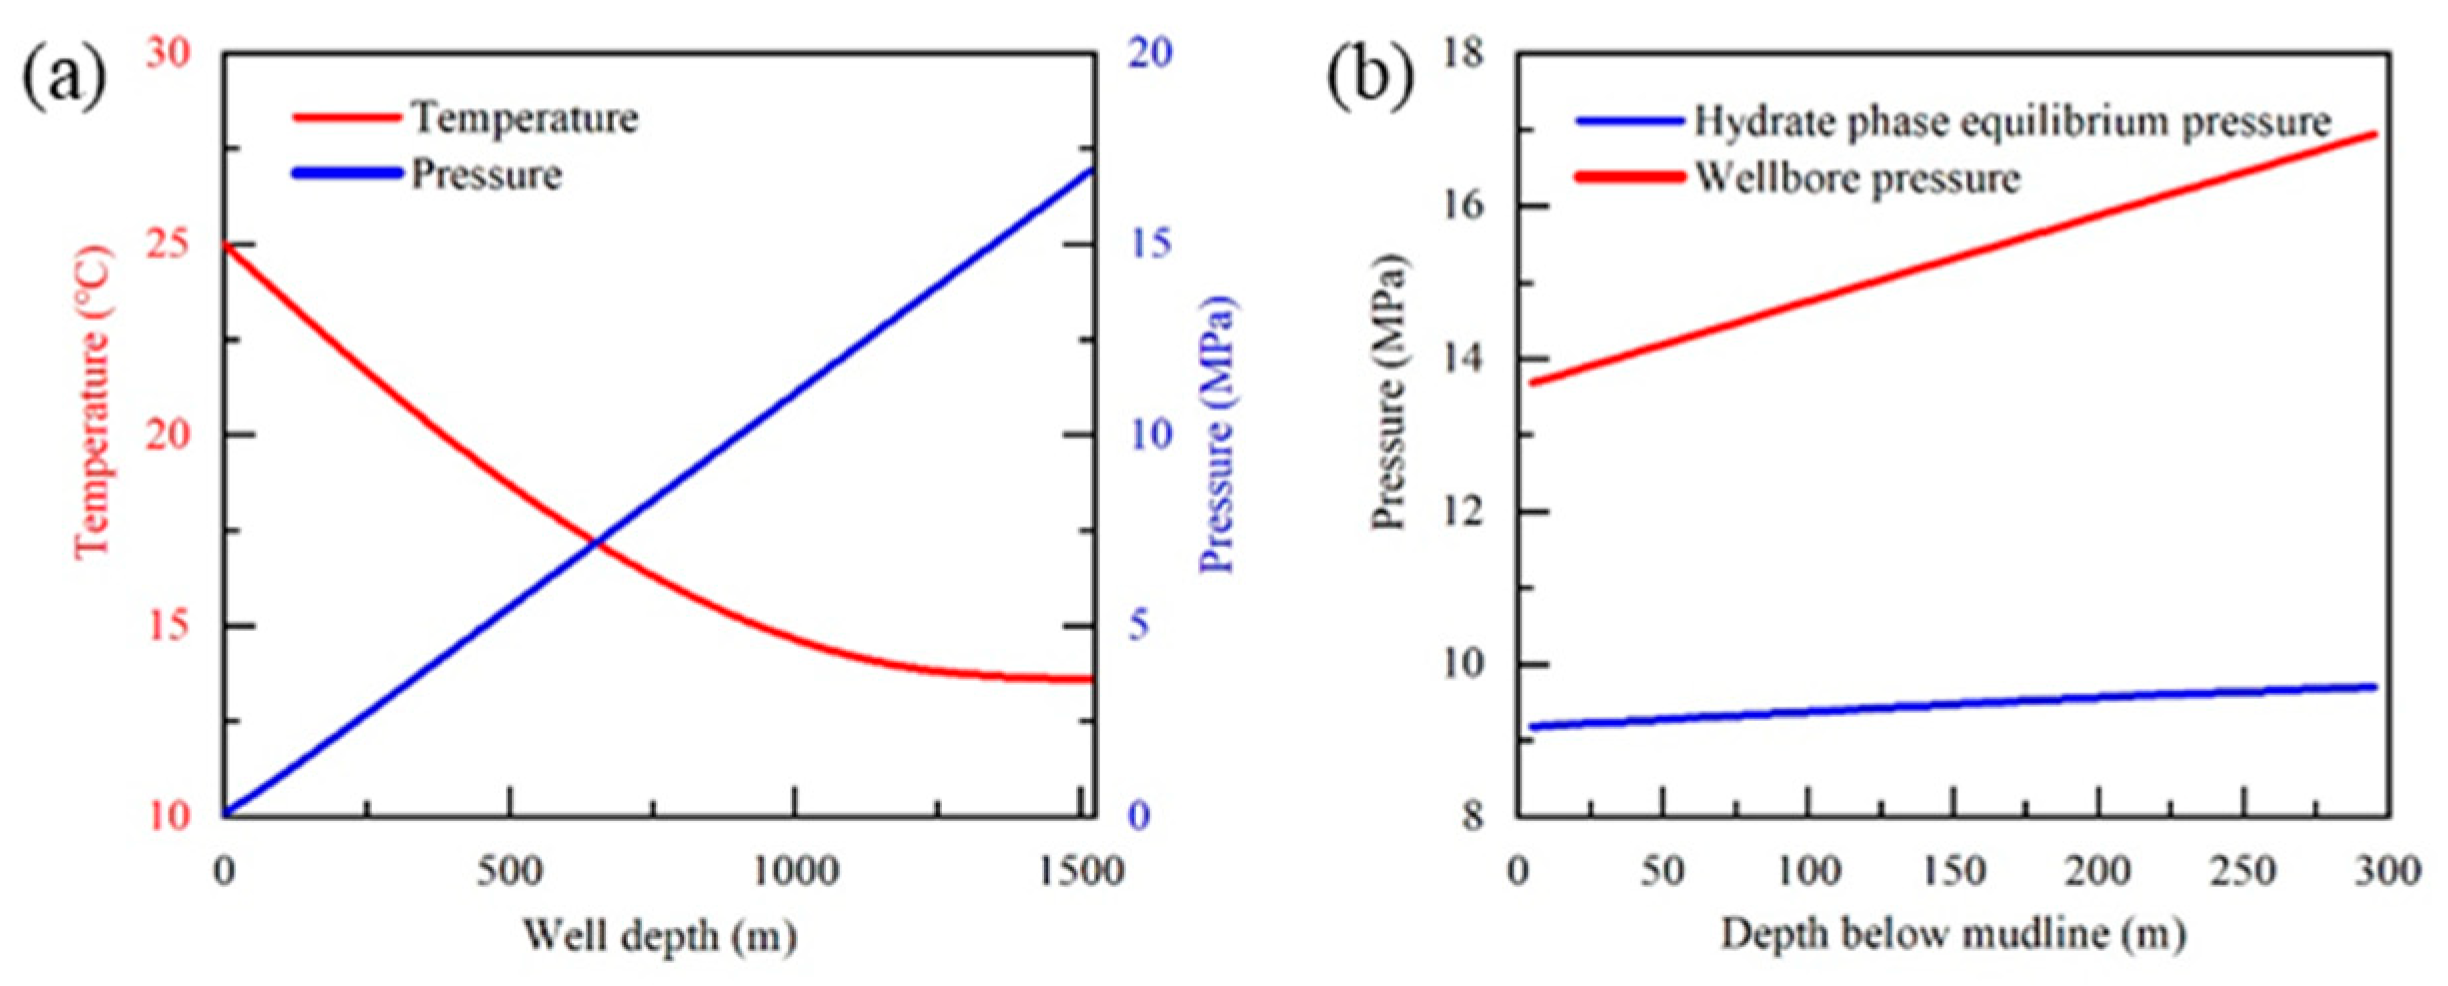
4.1. Distribution of the Wellbore Temperature and Pressure Field

The wellbore temperature and pressure fields during drilling were calculated according to the wellbore structure and formation parameters of the second trial production in the South China Sea. The specific drilling parameters are listed in Table 1.
Figure 3a shows the temperature and pressure distributions of the wellbore during drilling. Because the temperature of the seawater section and deep–water shallow layer was low, the temperature of the drilling fluid in the wellbore was low after it reached the bottom of the well after full heat exchange. The wellbore pressure distribution along the depth was approximately linear when the density and displacement of the drilling fluid were fixed. Figure 3b shows a comparison of the hydrate phase equilibrium and wellbore pressure curves under the corresponding wellbore temperature conditions. Under simulated drilling conditions, the bottom hole pressure of the drilling fluid was higher than the phase equilibrium pressure of the hydrate, which did not directly result in hydrate decomposition.
The temperature and pressure changes of the well bottom are shown in Figure 4. As the density of drilling fluid increases, it directly results in an increase in the bottomhole pressure. Within the density range of 1030 to 1190 kg/m3, the corresponding bottomhole pressure increased from 14.57 to 16.97 MPa, and the bottomhole temperature increased slightly. The heat capacity increased with the drilling fluid density. After losing heat in the low-temperature seawater section, it can still maintain a higher temperature, but this has little effect on the bottomhole temperature. However, when the inlet temperature is higher, more heat is carried, and more residual heat remains at the bottom of the well. When the inlet temperature rises from 15 to 40 °C, the bottomhole temperature increased from 9.76 to 16.95 °C. The wellbore pressure has a slight decrease due to thermal expansion, from 15.8 MPa to 15.7 MPa. Within the range of drilling fluid flow rate increasing from 1.8 to 3.6 m3/min, the bottomhole temperature increased from 11.48 to 13.11 °C.
To further analyze the influence of wellbore temperature and pressure on the stability of the near wellbore area, the hydrate reservoir at a depth of 255 m below the mudline was used for the simulation analysis. The boundary conditions are listed in Table 2.

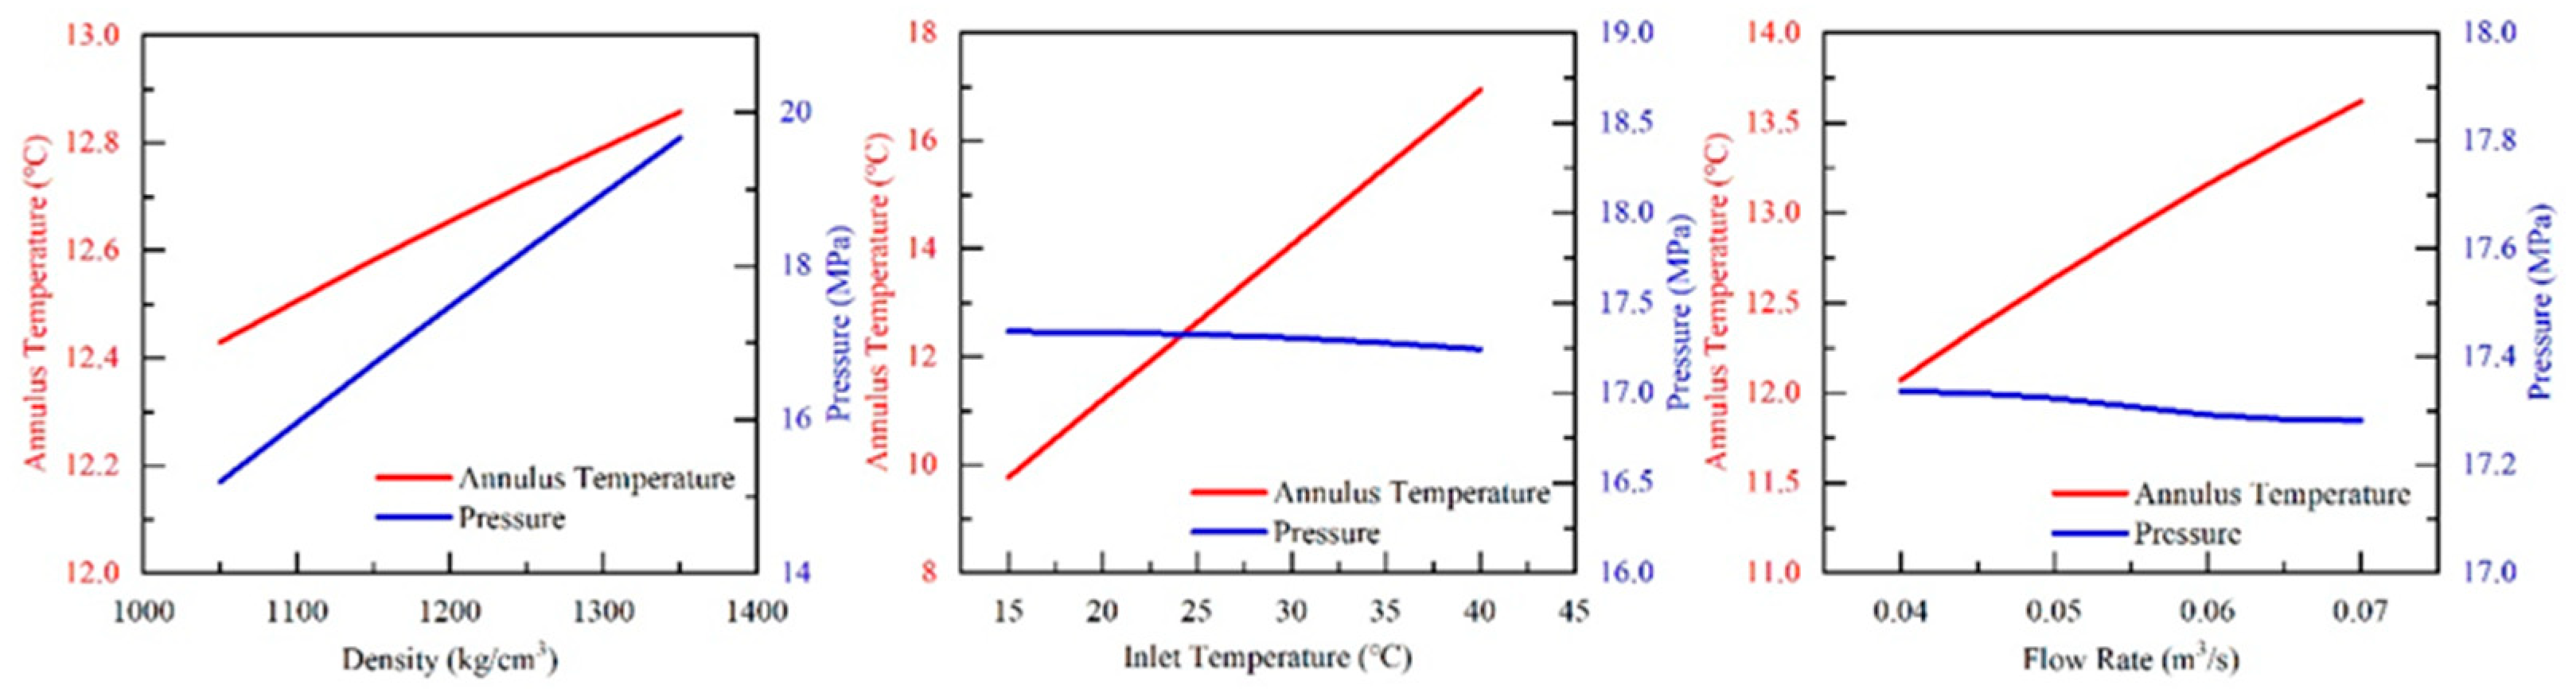
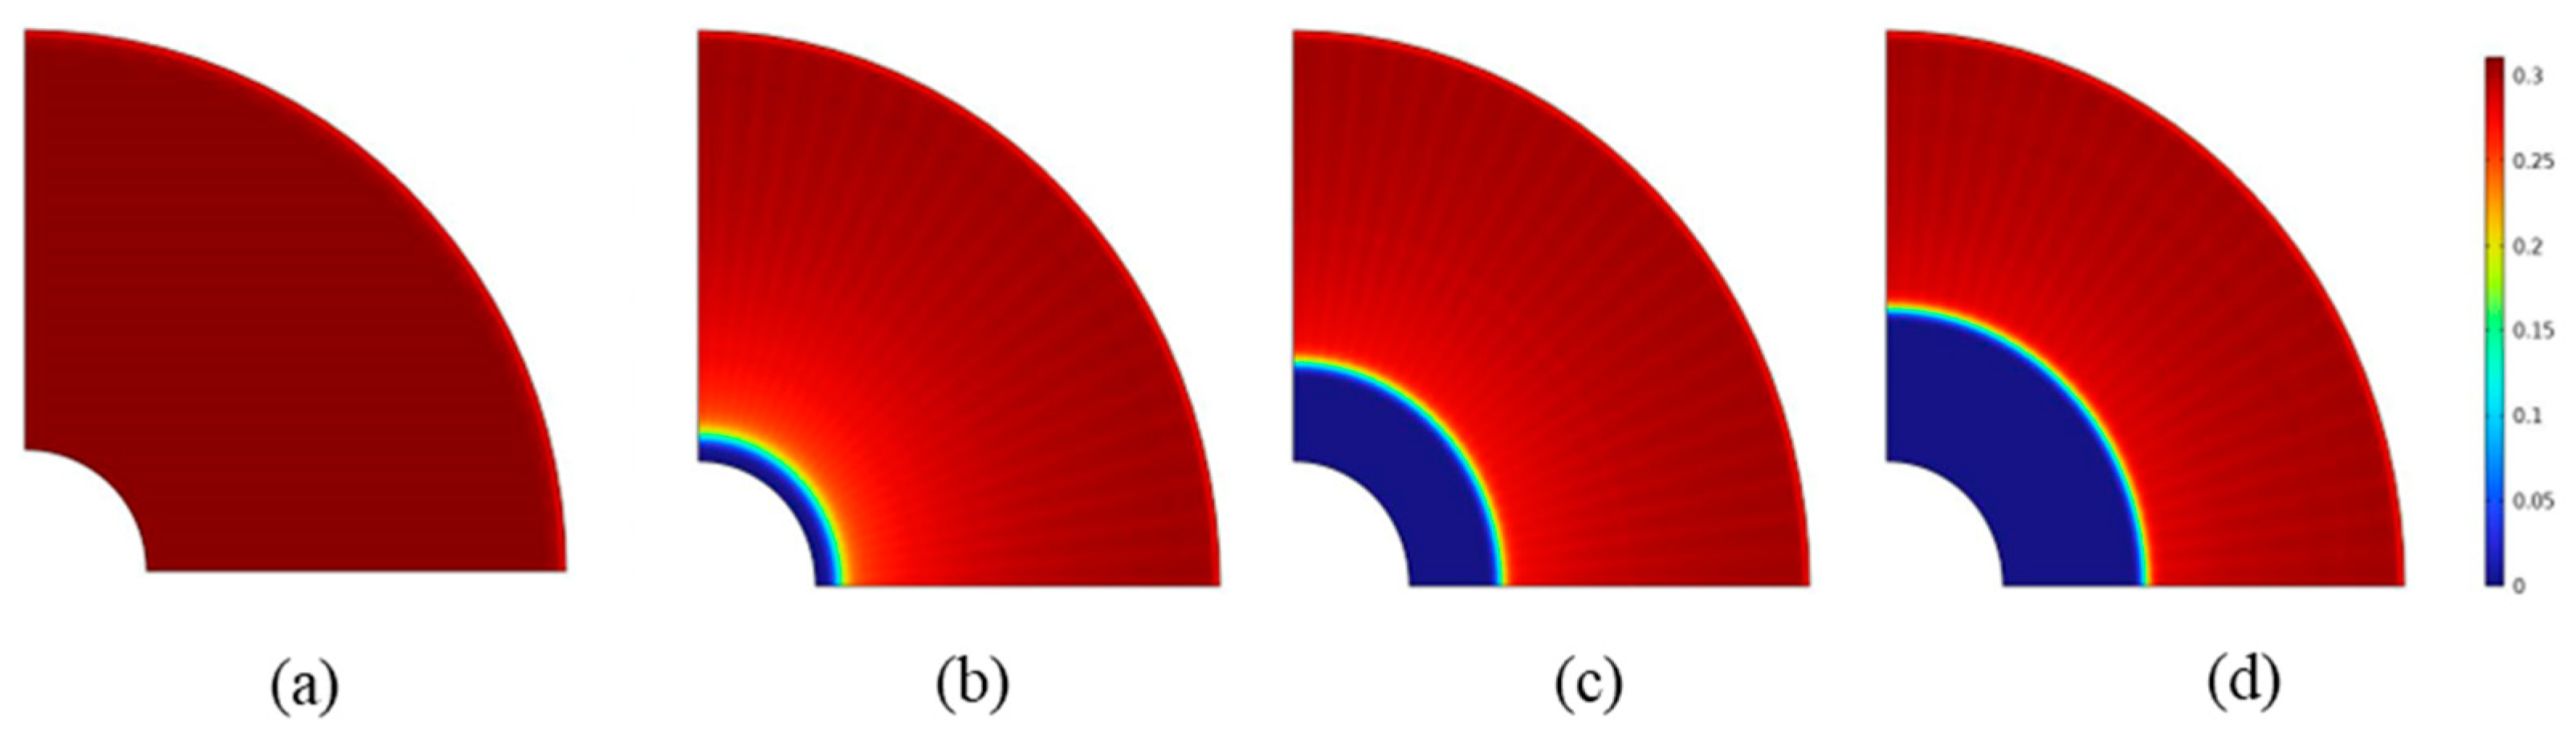
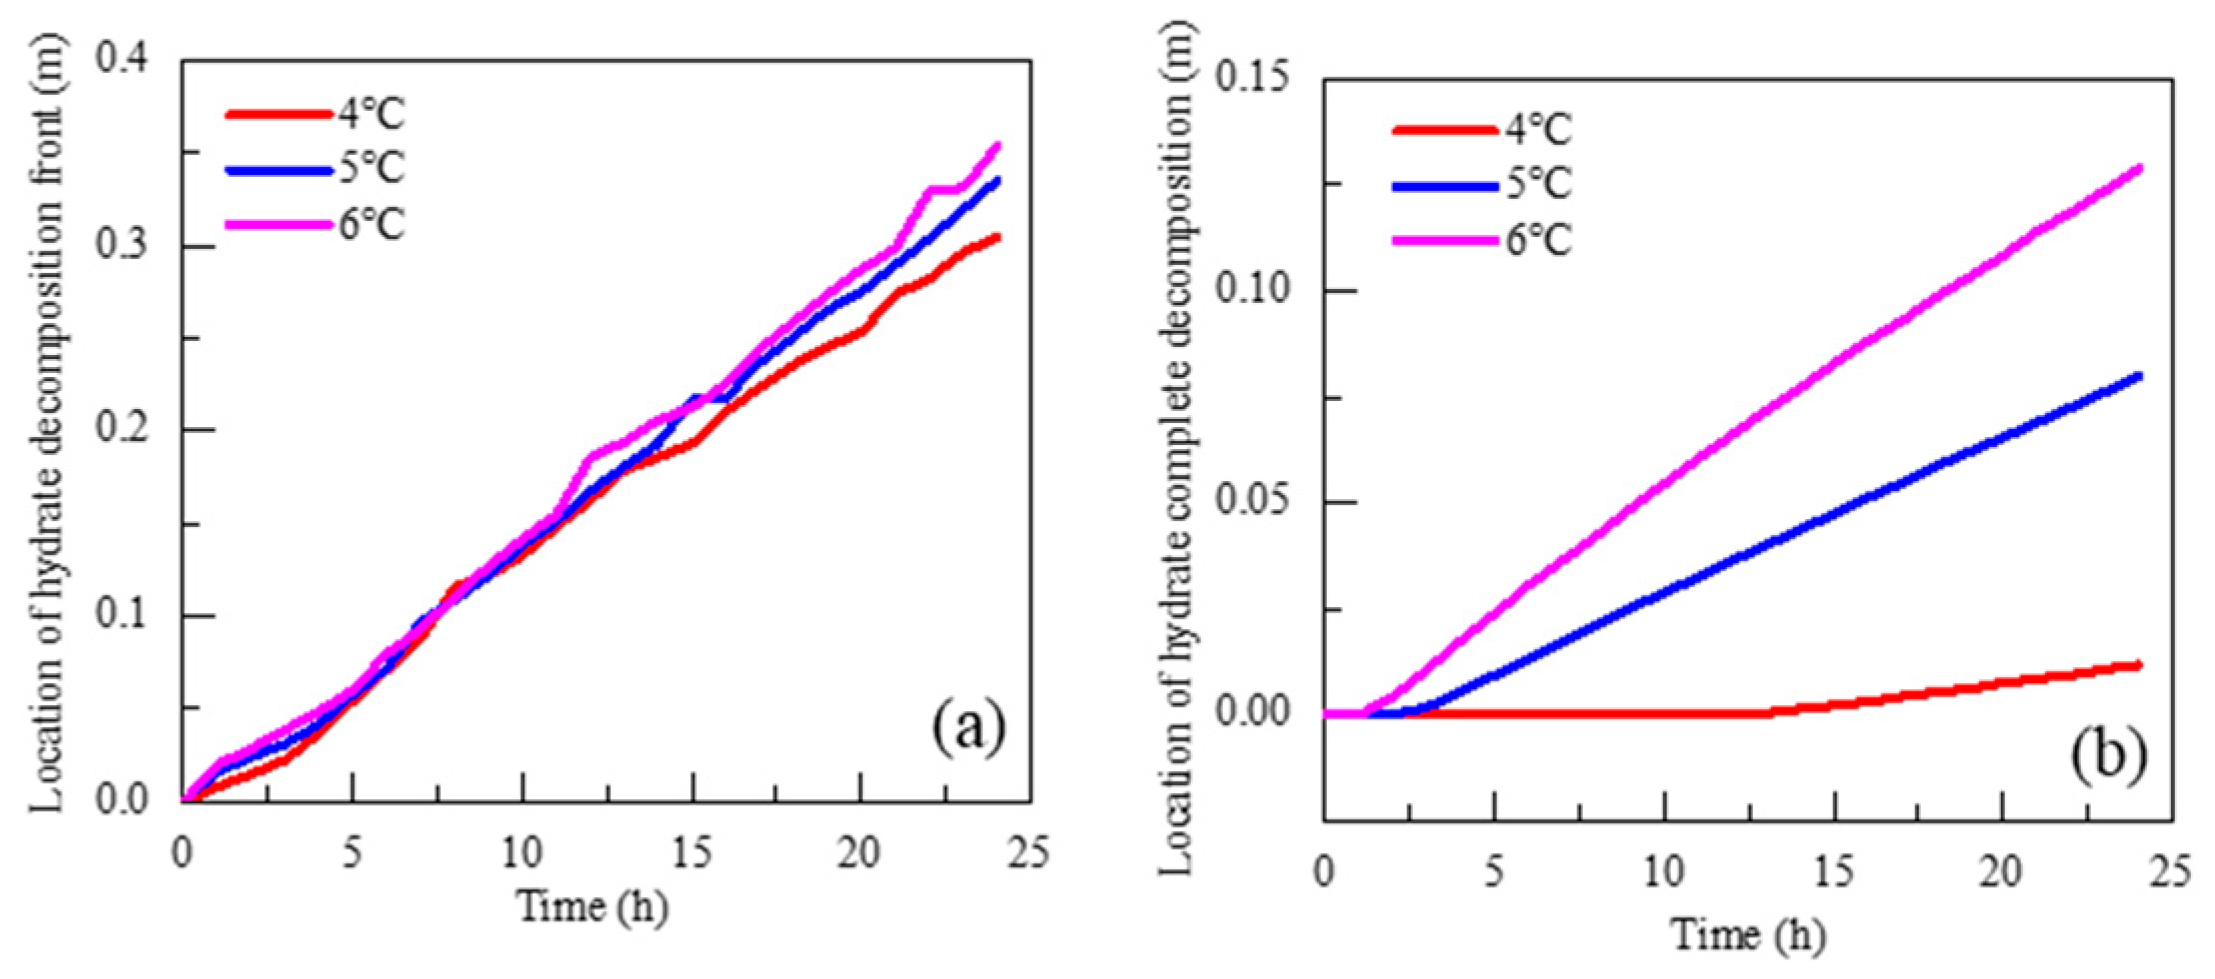
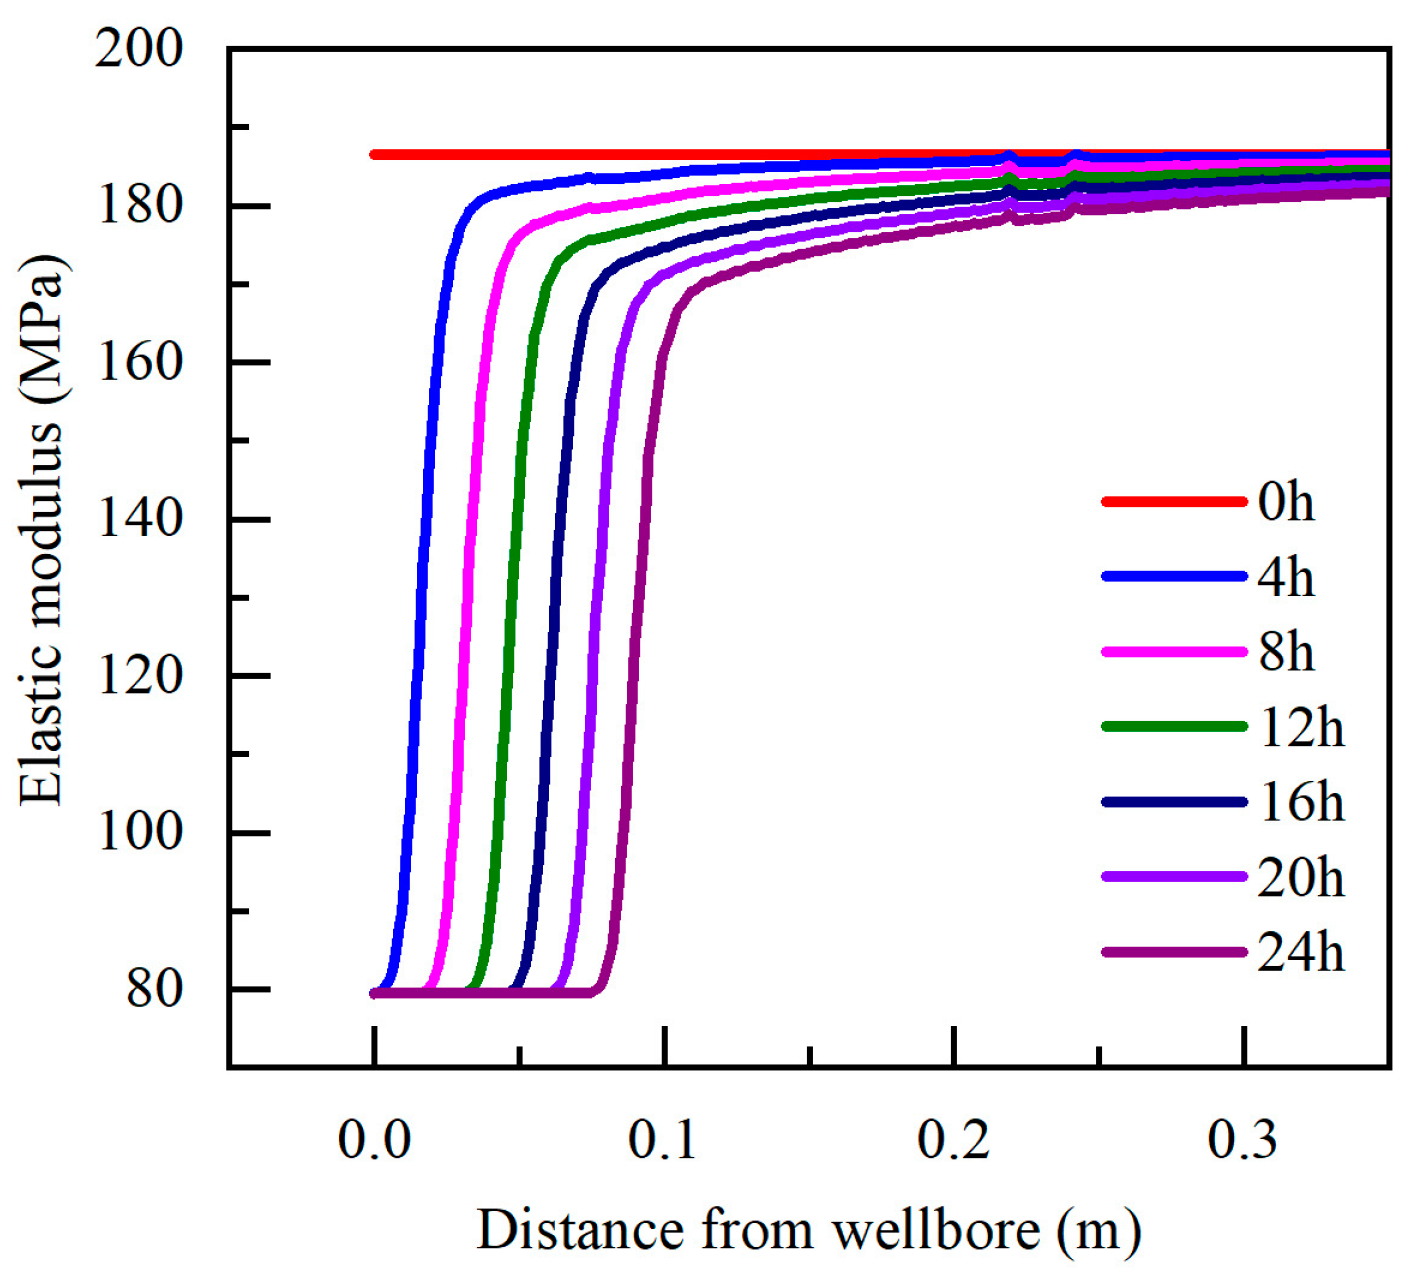
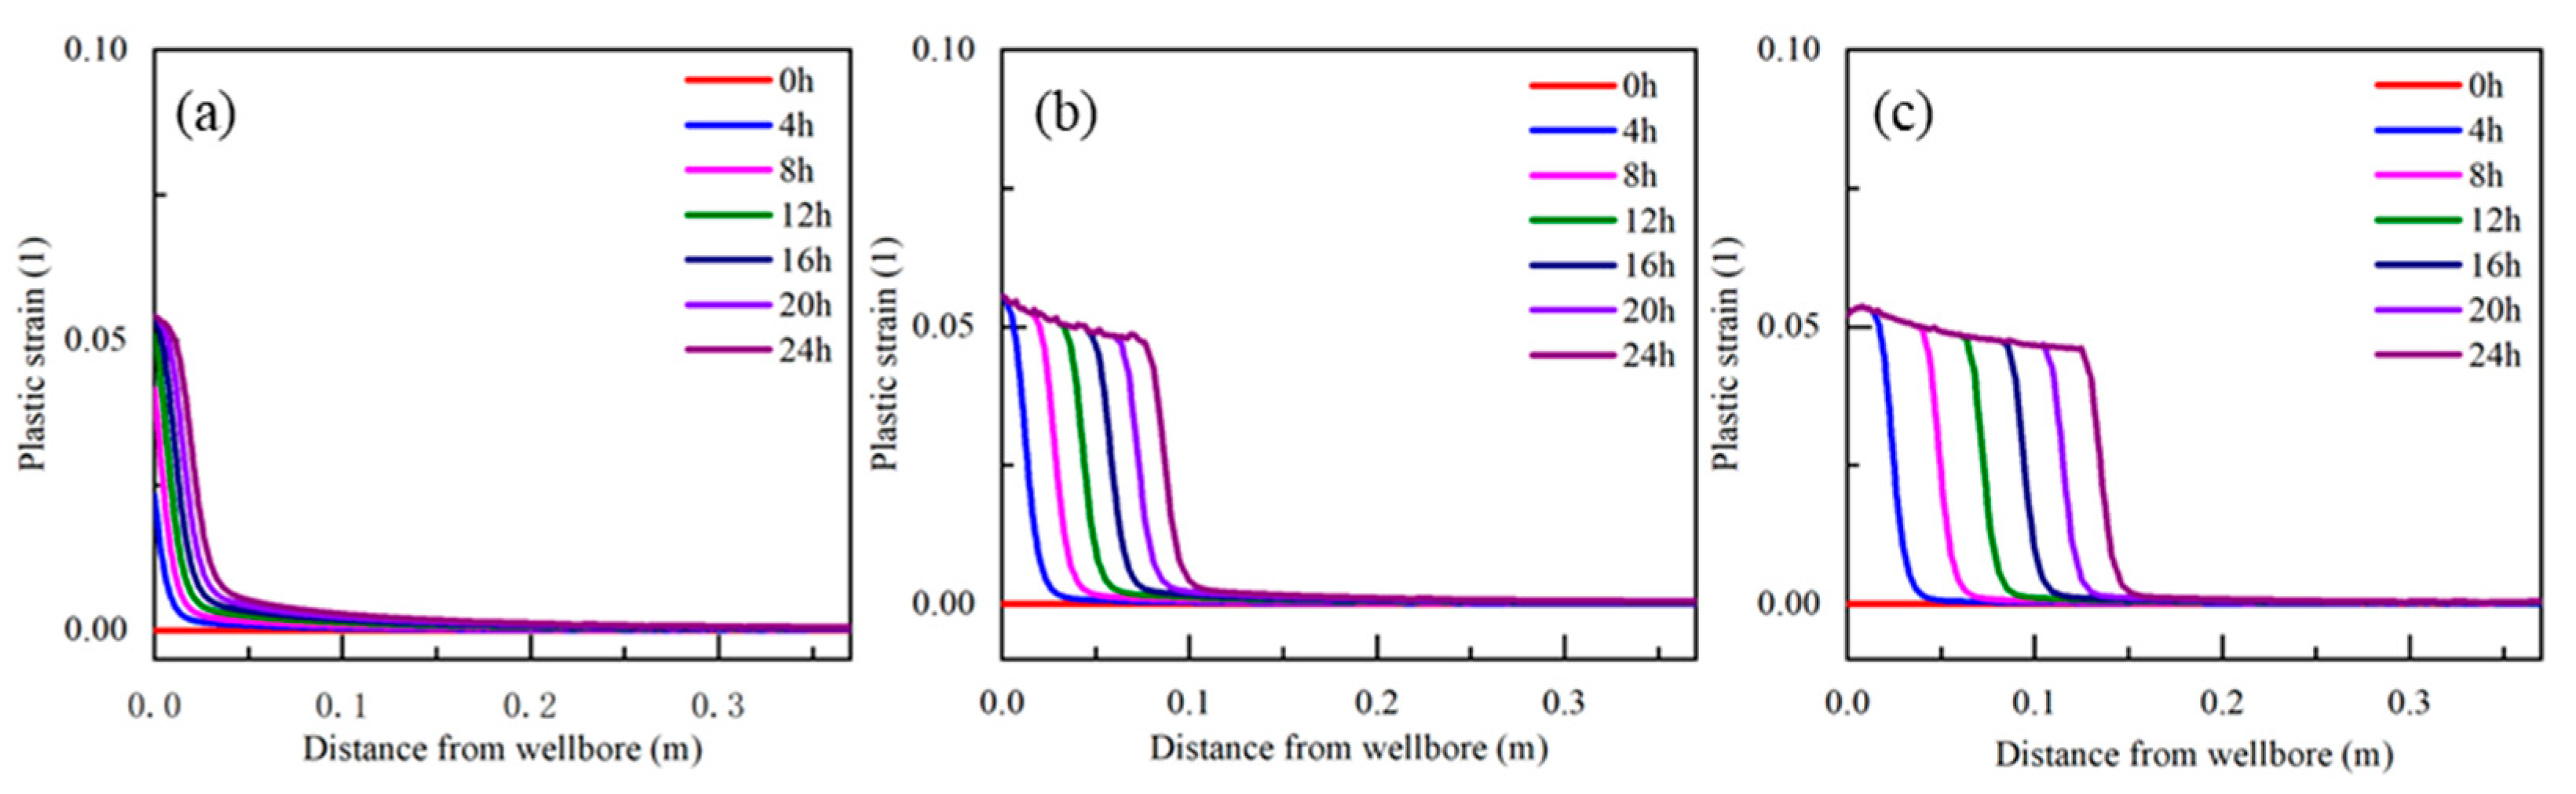
4.2. Influence of Temperature Disturbance on Wellbore Stability

During the drilling of the hydrate reservoir, when the drilling fluid temperature is higher than the phase equilibrium temperature of the hydrate in the reservoir, the hydrate around the wellbore decomposes, and the greater the temperature difference, the faster the decomposition speed. If the design of drilling parameters is reasonable, the temperature of the drilling fluid when it reaches the hydrate layer will not cause hydrate decomposition in the reservoir because of the low ground temperature in the seawater section and deep-water shallow area. The decomposition area of the hydrate around the wellbore when the temperature of the drilling fluid in the wellbore increases is shown in Figure 5. Figure 5 shows the decomposition of hydrate around the well after circulation for 24 h after the drilling fluid temperature increased. Figure 5 shows the distribution of hydrate saturation around the wellbore when the temperature of the drilling fluid in the wellbore increased by 3, 4, 5 and 6 °C. When the temperature of the drilling fluid in the wellbore increased by 3 °C, the hydrate around the wellbore did not decompose. When the temperature of the drilling fluid in the wellbore increased by 4, 5 and 6 °C, the hydrate decomposition area around the wellbore gradually expanded.
Taking the increase in wellbore temperature by 4 °C, 5 °C and 6 °C as an example, the evolution law of hydrate saturation around the wellbore with time is shown in Figure 6. With an increase in time, the interface between water and decomposition gradually moved from the borehole wall to the far field. In the area near the wellbore, the temperature gradient was large, the hydrate decomposition speed was high, and the hydrate saturation gradient was large. In the area far from the well wall, as shown in the figure, at 0.3 m from the well wall, the temperature gradient was small, the hydrate decomposition was slow, and the hydrate saturation decreased slightly. With an increase in the drilling fluid temperature in the wellbore, the hydrate decomposition rate near the wellbore accelerated, and the hydrate decomposition interface further accelerated from the wellbore to the far field. However, the hydrate decomposition rate did not increase significantly at a certain distance from the borehole wall.
In the analysis model used in this study, the initial saturation of the hydrate in the reservoir was 0.31. The position of 0.3 hydrate saturation in Figure 6 was set as the decomposition front, and the position of 0.01 hydrate saturation in Figure 6 was set as the interface of complete hydrate decomposition for further analysis. As shown in Figure 7a, the velocity of the hydrate decomposition front moving towards the far field under the influence of temperature was almost linear. The decomposition front of the hydrate gradually moved towards the far field with time, but the amplitude of the wellbore temperature increase had a slight influence on the velocity of the decomposition front. As shown in Figure 7b, the interface of the complete hydrate decomposition in the near–wellbore zone was significantly affected by the amplitude of the temperature increase.
After the hydrate around the wellbore decomposes owing to temperature disturbance, the cementation between the reservoir skeleton particles is weakened, and the mechanical strength at the wellbore decreases with the decomposition of the hydrate. Figure 8 shows the evolution law of the elastic modulus of the near–wellbore area with time after the wellbore temperature increased by 5 °C. The elastic modulus of the reservoir around the wellbore decreased with hydrate decomposition. Immediately after the reservoir was drilled, the elastic modulus at the borehole wall was 186.54 MPa. After the drilling fluid contacted the well wall for 4 h, the hydrate at the well wall was completely decomposed, and the elastic modulus was only 79.49 MPa.
When the elastic modulus of the reservoir around the wellbore decreased, its strain increased, and under the effect of drilling fluid pressure in the wellbore, plastic strain gradually occurred in the area near the wellbore. Figure 9 shows the plastic strain evolution rule in the near–wellbore area within 24 h after the wellbore temperature increased by 4, 5 and 6 °C. With hydrate decomposition, the area around the wellbore where plastic strain occurred gradually expanded.
Existing triaxial tests of hydrate deposits have shown that when the plastic strain of the sample is greater than 0.03, the sample will be damaged and softened, and the volume strain increases causing material damage. To analyze the influence of temperature disturbance on wellbore stability, this study considered an equivalent plastic strain greater than 0.03 as the instability point of the near wellbore interface and further analyzed the evolution law of the mechanical property weakening of the near wellbore interface over time. As shown by the solid line in Figure 10, the temperature difference between the drilling fluid and reservoir in the wellbore had a significant impact on the moving speed of the unstable interface. The distance moved from the unstable interface to the far field increased linearly with time. Note, that when the temperature difference was 4 °C, the near–well interface did not lose stability within 3 h. This was because when the temperature difference was 4 °C, the decomposition rate of the hydrate was relatively slow, and the cementation of the hydrate on the reservoir maintained the stability of the well wall within the initial 3 h. With an increase in time, the hydrate content at the near–well interface decreased, and the cementation of the remaining hydrate content at the near–well interface was insufficient to maintain wellbore stability. The dashed line in Figure 10 shows the position of the interface where the hydrate saturation was lower than 0.15, and the distance between the unstable front and wellbore was slightly less than the interface in which the hydrate saturation was lower than 0.15, and their evolution laws were nearly linear. Therefore, when the wellbore temperature increases, the position of the unstable front can be predicted by the hydrate decomposition interface.

4.3. Influence of Pressure Disturbance on Wellbore Stability

During the drilling of offshore hydrate reservoirs, the hydrate particles in drilling cuttings decompose during upward migration, resulting in an increase in wellbore gas content and a decrease in wellbore pressure. If the pressure in the wellbore is lower than the phase equilibrium pressure of the hydrate in the reservoir, the hydrate around the wellbore will be decomposed. The greater the pressure difference is, the faster the decomposition speed. Under normal drilling conditions, the wellbore is filled with drilling fluid, and the pressure at the bottom of the wellbore is relatively stable. However, during the drilling of a hydrate reservoir, the hydrate in the drilling cuttings decomposes and produces gas during the upflow process, resulting in an increase in the gas content in the wellbore and a decrease in the pressure at the bottom of the wellbore, thus affecting the stability of the bottom of the wellbore.
The decomposition trend of the hydrate around the wellbore when the wellbore bottom pressure decreases is shown in Figure 11. Figure 11 shows the decomposition of the hydrate around the well after 24 h under the condition that the pressure at the bottom of the wellbore decreases. When the pressure at the bottom of the wellbore decreased by 3 MPa, the hydrate around the wellbore began to decompose, and when the pressure in the wellbore decreased by 4, 5 and 6 MPa, the hydrate decomposition area around the wellbore gradually expanded.
The evolution law of hydrate saturation around the wellbore with time when the pressure in the wellbore decreased by 4, 5, and 6 MPa is shown in Figure 12. With an increase in time, the interface of gas hydrate decomposition gradually moved from the borehole wall to the far field. In the area near the wellbore, the pressure gradient was large, the hydrate decomposition speed was high, and the hydrate saturation gradient was large. In the area far from the well wall, as shown in the figure, the pressure gradient was small at 0.15 m from the well wall, the hydrate decomposition was slow, and the hydrate saturation decreased slightly. Compared with the temperature, the influence of pressure disturbance on hydrate decomposition around the wellbore was relatively small. As the pressure can be transferred rapidly through the pore fluid to form a stable pressure field, in the initial few hours, the hydrate far from the well wall partially decomposed, and then the decomposition area of the hydrate was concentrated near the well wall, whereas the hydrate far from the well wall had not been continuously decomposed. This was because the initial temperature of the wellbore was lower than the temperature of the reservoir at the same depth. After full heat exchange between the wellbore and reservoir, the temperature of the hydrate reservoir far from the wellbore gradually became lower than the phase equilibrium temperature and did not continue to decompose. In the analysis model in this study, the initial saturation of hydrate in the reservoir was 0.31, and the position of hydrate saturation of 0.3 in Figure 12 was selected as the decomposition front for further analysis.
As shown in Figure 13, the greater the decrease in wellbore pressure, the farther the decomposition front of the gas hydrate from the wellbore. The decomposition front of the natural gas hydrate only moved outwards within a few hours of the beginning of the decomposition. Using the curve of wellbore pressure decreasing by 6 MPa as an example, within 9 h of the beginning of decomposition, the decomposition front moved outwards, but the decomposition speed gradually slowed. Subsequently, the natural gas hydrate in the area far from the wellbore no longer decomposed, and only the natural gas hydrate in the area near the wellbore continued to decompose. Limited by the temperature around the wellbore, the hydrate in the reservoir did not continue to decompose. Figure 14 shows a comparison of the pressure distribution of the reservoir around the wellbore and the equilibrium pressure of the hydrate phase. When the wellbore pressure decreased by 4 MPa, the decomposition area of the hydrate was a 0.054 m reservoir around the wellbore; when the wellbore pressure decreased by 5 MPa, the hydrate decomposition area was 0.079 m around the wellbore, and when the wellbore pressure decreased by 6 MPa, the hydrate decomposition area was 0.094 m around the wellbore.
Figure 15 shows the distribution of the equivalent plastic strain near the wellbore interface when the wellbore bottom pressure decreased by 5 MPa. When the well was drilled, although the hydrate saturation near the wellbore interface was high, the plastic strain at the wellbore reached the point of instability. With time, the hydrate near the well interface gradually decomposed, and the unstable area gradually expanded outwards. When the temperature condition was unchanged and the pressure was reduced, the amount of hydrate decomposition in the near–wellbore area was very limited, and the instability evolution speed caused by hydrate decomposition was very slow; however, the area near the wellbore lost stability owing to the direct effect of pressure. Because the wellbore pressure was excessively low, the reservoir within 0.2 m around the wellbore generated plastic strain. Although it did not reach the critical point of instability, it was still in an unsafe state, with the risk of falling off.
When a higher–density drilling fluid was used, the pressure at the bottom of the wellbore was higher than the pressure under the simulated conditions, which could effectively prevent the risk of wellbore collapse. The increase in pressure within a certain range caused the elastic expansion of the well wall; however, the expansion amplitude was only in mm, as shown in Figure 16. When the wellbore was drilled, the displacement at the wellbore was the largest because of the drilling fluid pressure in the wellbore. The displacement gradually decreased with increasing distance from the wellbore. With time, the pore pressure in the near–wellbore interface increased, the corresponding effective stress decreased, and the volume expanded, resulting in the maximum displacement at a position 0.1 m away from the wellbore. Although long-term immersion affects the displacement of the wellbore, the displacement is minimal and the near–wellbore area is relatively safe. Therefore, when the wellbore temperature is lower than the reservoir temperature, properly increasing the wellbore pressure can ensure safe drilling in the hydrate reservoir.

5. Conclusions

Based on the evolution law of the wellbore temperature and pressure field in deep-water drilling, and considering the evolution law of near–wellbore interface stability during the drilling process of a hydrate reservoir, this study analyzed the impact of temperature and pressure changes of the drilling fluid in the wellbore on the stability of the near–wellbore interface. The study also yielded useful results that may assist in providing some recommendations to take into account when drilling through hydrate reservoirs and to select drilling parameters.
(1)
Under the condition of deep-water drilling, owing to the low temperature of the seawater section and shallow formation, if the drilling speed, circulating flow rate, sea surface mud pit temperature and other parameters are properly controlled, the temperature of the drilling fluid in the shallow layer of the wellbore can be maintained at a level lower than the formation temperature.
(2)
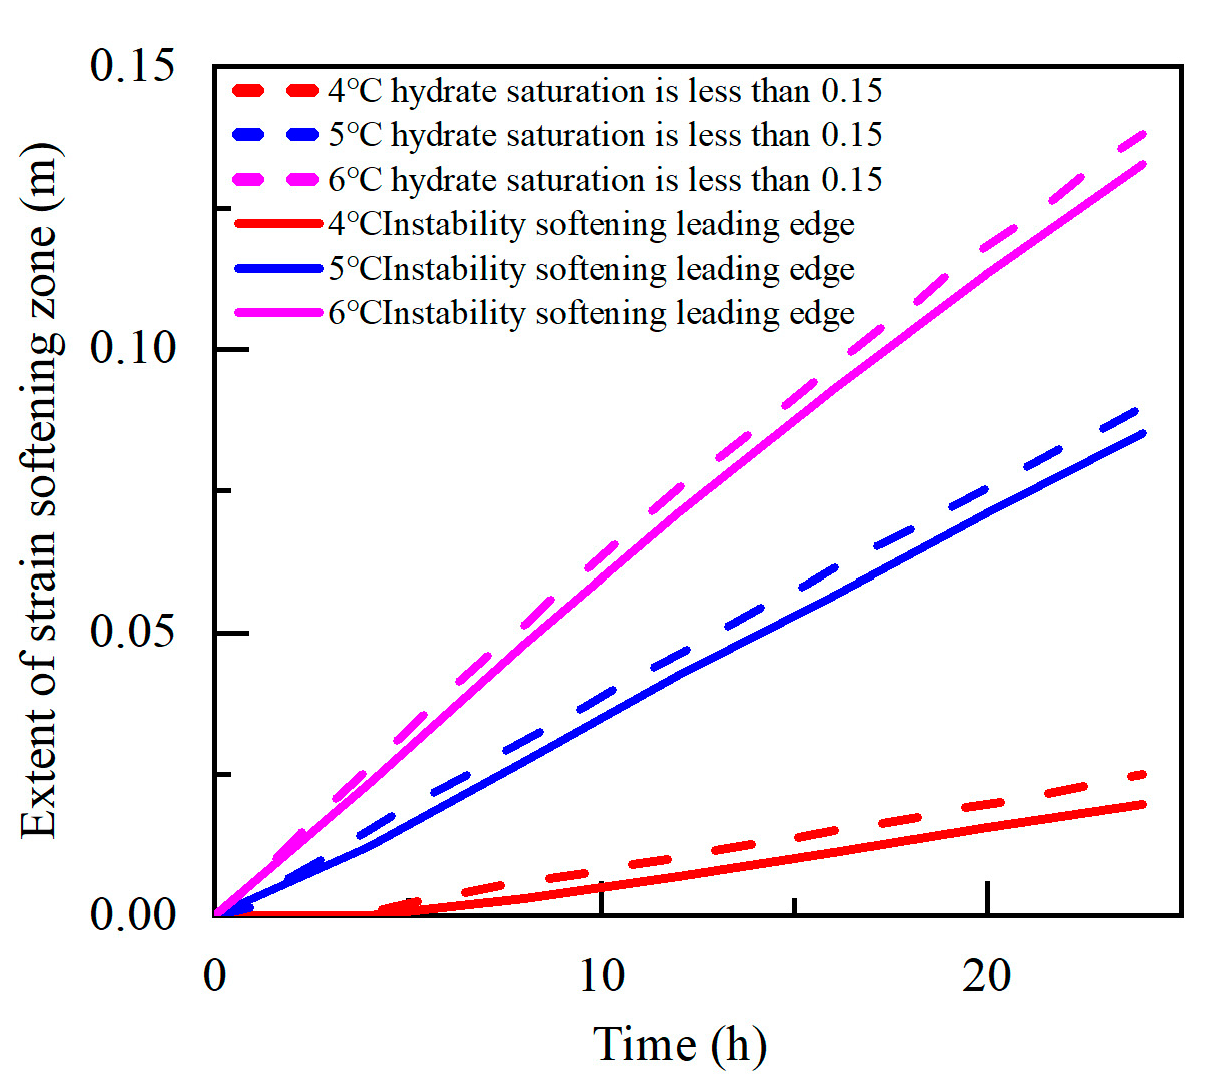
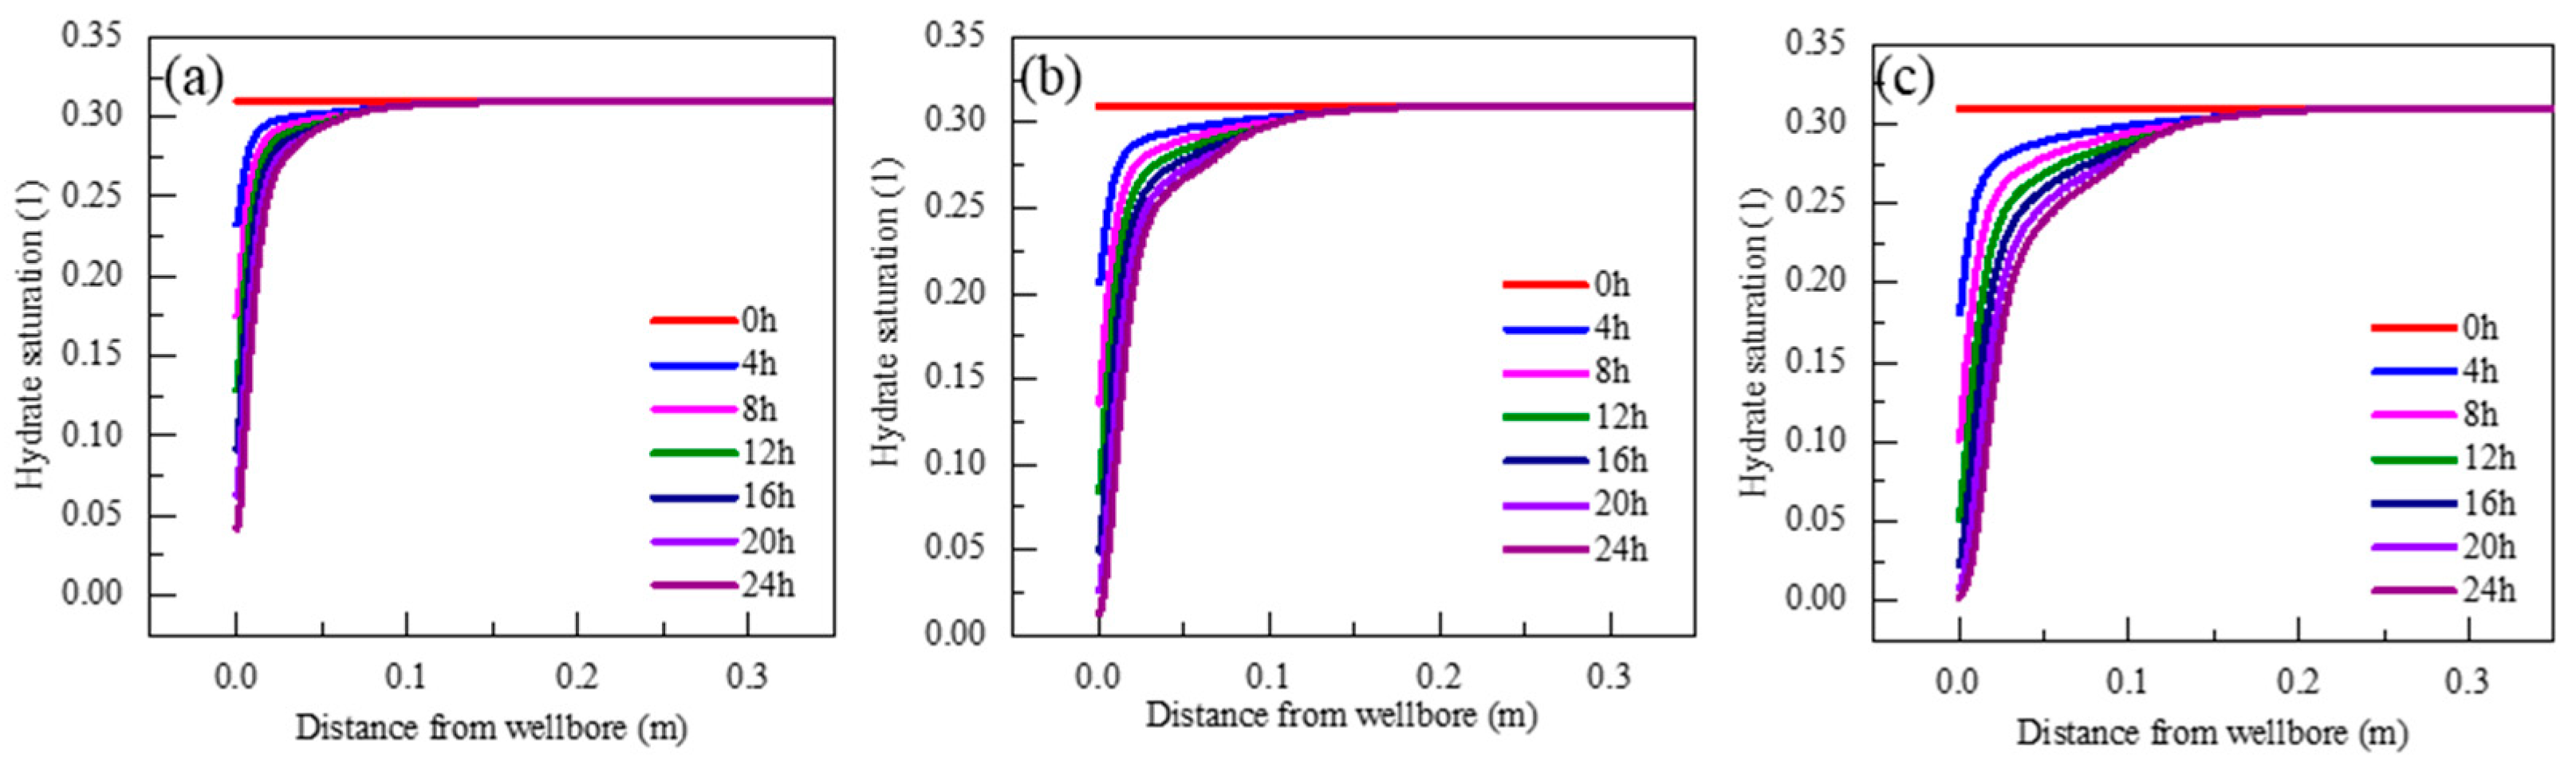
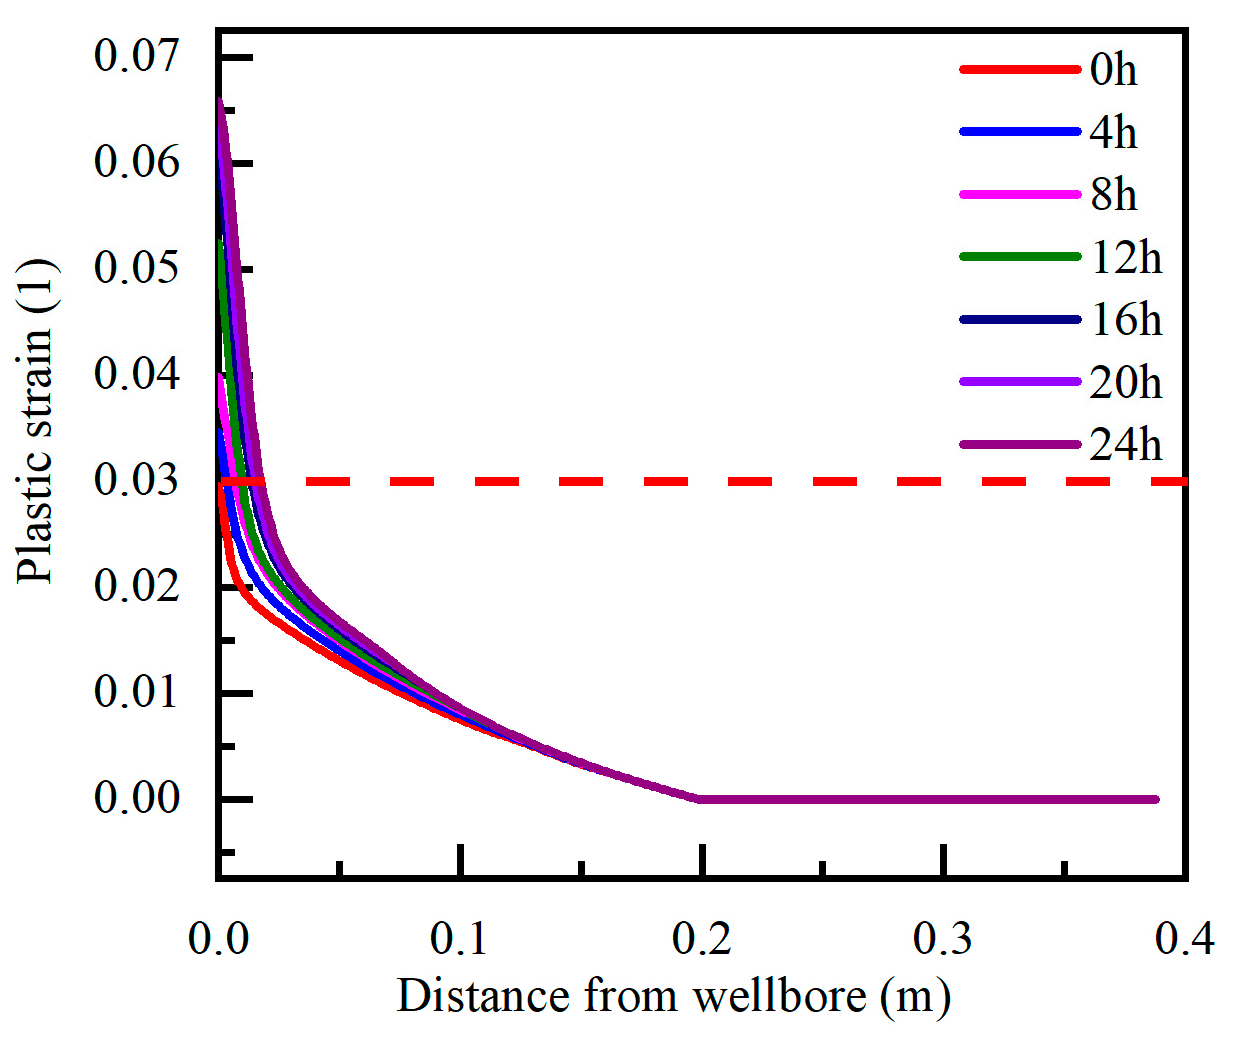
The increase in wellbore temperature results in the rapid decomposition of hydrates near the wellbore interface, thus causing wellbore instability. In the process of hydrate decomposition disturbed by temperature, the extension speed of the hydrate decomposition front is approximately linear, which is less affected by the temperature difference, and the decomposition speed is slow. The decomposition rate of the hydrate near the borehole wall is high, and its interfacial migration speed significantly accelerates with an increase in temperature difference.
(3)
Under the conditions of drilling parameters simulated in this study, the interface with hydrate saturation greater than 0.15 has good consistency with the unstable interface, which can be used to predict the stability of wellbores. If the saturation of the hydrate reservoir is low, the drilling process risks wellbore instability.
(4)
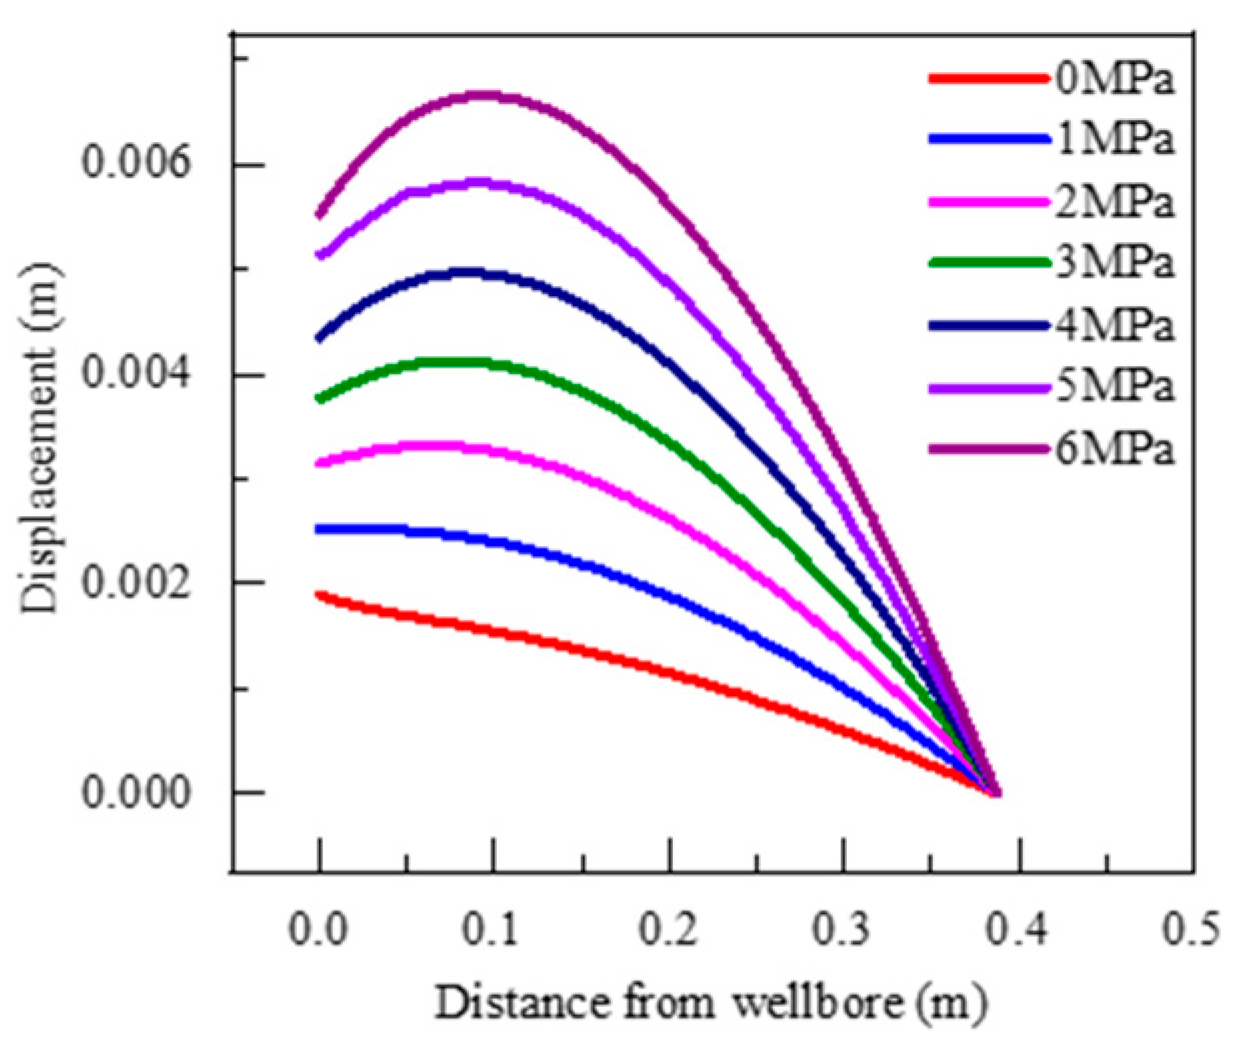
A decrease in wellbore pressure directly results in wellbore instability. Under a decrease in pressure, hydrate decomposition is slow, and the instability area gradually expands over time. The pressure increase is more conducive to maintaining the stability of the near–wellbore interface. During the drilling process, properly increasing the bottom hole pressure is conducive to maintaining the stability of the well wall during the drilling process of the hydrate reservoir.

Author Contributions

Conceptualization, B.S. and B.M.; methodology, H.L. (Hao Li); software and writing—original draft preparation, X.L. (Xuefeng Li); formal analysis, H.L. (Huaqing Liu); investigation, D.C.; resources, X.W.; data curation, X.L. (Xiangpeng Li). All authors have read and agreed to the published version of the manuscript.

Funding

This research was funded by National Natural Science Foundation of China, grant number 51890914; China National Petroleum Corporation Technology Development Project, grant number 2021DJ4903.

Data Availability Statement

Data are contained within the article.

Conflicts of Interest

The authors declare that this study received funding from National Nature Science Foundation of China (51890914) and the Technology Development Project of CNPC (2021DJ4903). The funder was not involved in the study design, collection, analysis, interpretation of data, the writing of this article or the decision to submit it for publication.

Appendix A

According to the intrinsic model of decomposition kinetics obtained from the Kim–Bishnoi hydrate decomposition experiment, the decomposition rate of hydrates is proportional to the particle surface area and the difference in the fugacity of methane [40,41]. The decomposition rate of hydrate in a unit volume reservoir can be expressed as:
m h = k d M h A s f e f
k d = k d 0 exp Δ E a R T
A s = φ S h A e g o
A e g o = 6 8 × 10 6 = 7.5 × 10 5
where mh is the decomposition rate of natural gas hydrate in a unit volume porous medium reservoir (kg·s−1); kd is the kinetic reaction rate (mol·(m2·Pa·s)−1); Mh is the molar mass of methane gas (kg·mol−1); As is the hydrate decomposition surface area of unit volume formation (m−1); f is the fugacity of methane under the current pressure (MPa); feq is the fugacity of methane under three-phase equilibrium pressure at temperature (MPa); kd0 is the reaction kinetic constant (mol·(m3·Pa·s)−1); ΔEa is the reaction activation energy (J·mol−1); R is the gas constant (J·(mol·K)−1); T is the temperature (K); Sh is the gas hydrate saturation (dimensionless); Aego is the surface area and volume ratio of hydrate particles (dimensionless).
The model established by Dickens is used for the phase transition equilibrium conditions of natural gas hydrates dominated by methane [42]. The phase equilibrium equation is described as follows:
p eq = exp e 1 e 2 T
where e1 and e2 are two regression parameters, generally e1 = 39.08 and e2 = 8533.

References

  1. Kvenvolden, K.A. A Review of the Geochemistry of Methane in Natural Gas Hydrate; Elsevier Ltd: Oxford, UK, 1995; Volume 23, pp. 997–1008. [Google Scholar]
  2. Makogon, Y.F. Natural gas hydrates—A promising source of energy. J. Nat. Gas Sci. Eng. 2010, 2, 49–59. [Google Scholar] [CrossRef]
  3. Yin, Z.; Linga, P. Methane hydrates: A future clean energy resource. Chin. J. Chem. Eng. 2019, 27, 2026–2036. [Google Scholar] [CrossRef]
  4. Chong, Z.R.; Yang, S.H.B.; Babu, P.; Linga, P.; Li, X. Review of natural gas hydrates as an energy resource: Prospects and challenges. Appl. Energy 2016, 162, 1633–1652. [Google Scholar] [CrossRef]
  5. Li, X.; Xu, C.; Zhang, Y.; Ruan, X.; Li, G.; Wang, Y. Investigation into gas production from natural gas hydrate: A review. Appl. Energy 2016, 172, 286–322. [Google Scholar] [CrossRef]
  6. Makogon, Y.F.; Holditch, S.A.; Makogon, T.Y. Natural gas-hydrates—A potential energy source for the 21st Century. J. Pet. Sci. Eng. 2007, 56, 14–31. [Google Scholar] [CrossRef]
  7. Rutqvist, J.; Moridis, G.J.; Grover, T.; Silpngarmlert, S.; Collett, T.S.; Holdich, S.A. Coupled multiphase fluid flow and wellbore stability analysis associated with gas production from oceanic hydrate-bearing sediments. J. Pet. Sci. Eng. 2012, 92, 65–81. [Google Scholar] [CrossRef]
  8. Johnson, J.E.; MacLeod, D.R.; Phillips, S.C.; Phillips, M.P.; Divins, D.L. Primary deposition and early diagenetic effects on the high saturation accumulation of gas hydrate in a silt dominated reservoir in the Gulf of Mexico. Mar. Geol. 2022, 444, 106718. [Google Scholar] [CrossRef]
  9. Moridis, G.J.; Kim, J.; Reagan, M.T.; Kim, S.-J. System response during short- and long-term gas production from a gas hydrate deposit at the site of a planned field test in the Ulleung basin of the Korean East Sea. In Proceedings of the Offshore Technology Conference, Houston, TX, USA, 5–8 May 2014. [Google Scholar]
  10. Moridis, G.J.; Reagan, M.T.; Queiruga, A.F.; Boswell, R. Evaluation of the performance of the oceanic hydrate accumulation at site NGHP-02-09 in the Krishna-Godavari Basin during a production test and during single and multi-well production scenarios. Mar. Pet. Geol. 2019, 108, 660–696. [Google Scholar] [CrossRef]
  11. Qiu, K.; Yamamoto, K.; Birchwood, R.; Chen, Y. Well-integrity evaluation for methane-hydrate production in the deepwater Nankai Trough. SPE Drill. Complet. 2015, 30, 52–67. [Google Scholar] [CrossRef]
  12. Bazaluk, O.; Sai, K.; Lozynskyi, V.; Petlovanyi, M.; Saik, P. Research into Dissociation Zones of Gas Hydrate Deposits with a Heterogeneous Structure in the Black Sea. Energies 2021, 14, 1345. [Google Scholar] [CrossRef]
  13. Liao, Y.Q.; Sun, X.H.; Sun, B.J.; Wang, Z.Y.; Zhang, J.B.; Lou, W.Q. Wellhead backpressure control strategies and outflow response characteristics for gas kick during managed pressure drilling. J. Nat. Gas Sci. Eng. 2020, 75, 103164. [Google Scholar] [CrossRef]
  14. Wang, Z.; Zhao, Y.; Sun, B.; Chen, L.; Zhang, J.; Wang, X. Modeling of Hydrate Blockage in Gas-Dominated Systems. Energy Fuels 2016, 30, 4653–4666. [Google Scholar] [CrossRef]
  15. Wang, Z.; Zhang, J.; Sun, B.; Chen, L.; Zhao, Y.; Fu, W. A new hydrate deposition prediction model for gas-dominated systems with free water. Chem. Eng. Sci. 2017, 163, 145–154. [Google Scholar] [CrossRef]
  16. Boswell, R.; Collett, T.; Frye, M.; Shedd, W.; McConnell, D.; Shelander, D. Subsurface gas hydrates in the northern Gulf of Mexico. Mar. Pet. Geol. 2012, 34, 4–30. [Google Scholar] [CrossRef]
  17. McConnell, D.R.; Zhang, Z.; Boswell, R. Review of progress in evaluating gas hydrate drilling hazards. Mar. Pet. Geol. 2012, 34, 209–223. [Google Scholar] [CrossRef]
  18. Kim, J.; Moridis, G.J.; Rutqvist, J. Coupled flow and geomechanical analysis for gas production in the Prudhoe Bay Unit L-106 well Unit C gas hydrate deposit in Alaska. J. Pet. Sci. Eng. 2012, 92, 143–157. [Google Scholar] [CrossRef]
  19. Hoseinpour, M.; Riahi, M.A. Determination of the mud weight window, optimum drilling trajectory, and wellbore stability using geomechanical parameters in one of the Iranian hydrocarbon reservoirs. J. Pet. Explor. Prod. Technol. 2022, 12, 63–82. [Google Scholar] [CrossRef]
  20. Liu, C.; Han, Y.; Phan, D.T.; Abousleiman, Y.N. Stress solutions for short- and long-term wellbore stability analysis. J. Nat. Gas Sci. Eng. 2022, 105, 104693. [Google Scholar] [CrossRef]
  21. Petlovanyi, M.; Lozynskyi, V.; Saik, P.; Sai, K. Predicting the Producing Well Stability in the Place of its Curving at the Underground Coal Seams Gasification; EDP Sciences: Berdiansk, Ukraine, 2019. [Google Scholar]
  22. Freij-Ayoub, R.; Tan, C.; Clennell, B.; Tohidi, B.; Yang, J. A wellbore stability model for hydrate bearing sediments. J. Pet. Sci. Eng. 2007, 57, 209–220. [Google Scholar] [CrossRef]
  23. Cheng, Y.; Li, L.; Mahmood, S.; Cui, Q. Fluid-solid coupling model for studying wellbore instability in drilling of gas hydrate bearing sediments. Appl. Math. Mech. 2013, 34, 1421–1432. [Google Scholar] [CrossRef]
  24. Wang, X.; Sun, B.; Gao, Y.; Wang, Z.; Li, H.; Chen, Y. Numerical simulation of the stability of hydrate layer during well cementing in deep-water region. J. Pet. Sci. Eng. 2019, 176, 893–905. [Google Scholar] [CrossRef]
  25. Sun, J.; Ning, F.; Lei, H.; Gai, X.; Sánchez, M.; Lu, J.; Li, Y.; Liu, L.; Liu, C.; Wu, N.; et al. Wellbore stability analysis during drilling through marine gas hydrate-bearing sediments in Shenhu area: A case study. J. Pet. Sci. Eng. 2018, 170, 345–367. [Google Scholar] [CrossRef]
  26. Li, Y.; Cheng, Y.; Yan, C.; Song, L.; Liu, H.; Tian, W.; Ren, X. Mechanical study on the wellbore stability of horizontal wells in natural gas hydrate reservoirs. J. Nat. Gas Sci. Eng. 2020, 79, 103359. [Google Scholar] [CrossRef]
  27. Liao, Y.Q.; Wang, Z.Y.; Chao, M.Z.; Sun, X.H.; Wang, J.T.; Zhou, B.Y.; Sun, B.J. Coupled wellbore-reservoir heat and mass transfer model for horizontal drilling through hydrate reservoir and application in wellbore stability analysis. J. Nat. Gas Sci. Eng. 2021, 95, 104216. [Google Scholar] [CrossRef]
  28. Cheng, W.; Ning, F.; Sun, J.; Liu, Z.; Jiang, G.; Li, X. A porothermoelastic wellbore stability model for riserless drilling through gas hydrate-bearing sediments in the Shenhu area of the South China Sea. J. Nat. Gas Sci. Eng. 2019, 72, 103036. [Google Scholar] [CrossRef]
  29. Gurtin, M.E. On a framework for small-deformation viscoplasticity: Free energy, microforces, strain gradients. Int. J. Plasticity 2003, 19, 47–90. [Google Scholar] [CrossRef]
  30. Zhang, H.W.; Xie, Z.Q.; Chen, B.S.; Xing, H.L. A finite element model for 2D elastic–plastic contact analysis of multiple Cosserat materials. Eur. J. Mech.-A/Solids 2012, 31, 139–151. [Google Scholar] [CrossRef]
  31. Bishop, A.W.; Blight, G.E. Some aspects of effective stress in saturated and partly saturated soils. Géotechnique 1963, 13, 177–197. [Google Scholar] [CrossRef]
  32. Yoneda, J.; Masui, A.; Konno, Y.; Jin, Y.; Egawa, K.; Kida, M.; Ito, T.; Nagao, J.; Tenma, N. Mechanical properties of hydrate-bearing turbidite reservoir in the first gas production test site of the Eastern Nankai Trough. Mar. Pet. Geol. 2015, 66, 471–486. [Google Scholar] [CrossRef]
  33. Wu, Y.; Liao, J.; Zhang, W.; Cui, J. Characterization of stress–dilatancy behavior for methane hydrate-bearing sediments. J. Nat. Gas Sci. Eng. 2021, 92, 104000. [Google Scholar] [CrossRef]
  34. Hyodo, M.; Yoneda, J.; Yoshimoto, N.; Nakata, Y. Mechanical and dissociation properties of methane hydrate-bearing sand in deep seabed. Soils Found. 2013, 53, 299–314. [Google Scholar] [CrossRef]
  35. Li, Z.D.; Tian, X.; Li, Z.; Xu, J.Z.; Zhang, H.X.; Wang, D.J. Experimental study on growth characteristics of pore-scale methane hydrate. Energy Rep. 2020, 6, 933–943. [Google Scholar] [CrossRef]
  36. Hardwick, J.S.; Mathias, S.A. Masuda’s sandstone core hydrate dissociation experiment revisited. Chem. Eng. Sci. 2018, 175, 98–109. [Google Scholar] [CrossRef]
  37. Parker, J.C.; Lenhard, R.J.; Kuppusamy, T. A parametric model for constitutive properties governing multiphase flow in porous media. Water Resour. Res. 1987, 23, 618–624. [Google Scholar] [CrossRef]
  38. Levitus, S.; Boyer, T.P. World Ocean Atlas 1994. Volume 4. Temperature. In United States. 1994; Web. Available online: https://www.osti.gov/biblio/137203 (accessed on 8 November 2023).
  39. COMSOL Multiphysics®, v. 6.0. cn.comsol.com; COMSOL AB: Stockholm, Sweden, 2021. [Google Scholar]
  40. Kim, H.C.; Bishnoi, P.R.; Heidemann, R.A.; Rizvi, S.S.H. Kinetics of methane hydrate decomposition. Chem. Eng. Sci. 1987, 42, 1645–1653. [Google Scholar] [CrossRef]
  41. Liao, B.; Wang, J.; Sun, J.; Lv, K.; Liu, L.; Wang, Q.; Wang, R.; Lv, X.; Wang, Y.; Chen, Z. Microscopic insights into synergism effect of different hydrate inhibitors on methane hydrate formation: Experiments and molecular dynamics simulations. Fuel 2023, 340, 127488. [Google Scholar] [CrossRef]
  42. Dickens, G.; Hunt, M.Q. Methane hydrate stability in seawate. Geophys. Res. Lett. 1994, 19, 2115–2118. [Google Scholar] [CrossRef]
Figure 1. Solving process of the wellbore stability coupling model.
Energies 16 07585 g001
Figure 2. Prediction of wellbore collapse area ((a) calculation results at 200.1 m; (b) calculation results at 217.5 m; (c) calculation results at 232 m).
Energies 16 07585 g002
Figure 3. Distribution of temperature and pressure fields in the wellbore ((a) temperature and pressure curves in the wellbore change along the depth, (b) comparison of wellbore pressure and hydrate phase equilibrium pressure).
Energies 16 07585 g003
Figure 4. Evolution of Bottom Hole Temperature and Pressure with Drilling Fluid Parameters.
Energies 16 07585 g004
Figure 5. Evolution of hydrate saturation around the well under different wellbore temperatures ((a) wellbore temperature increased by 3 °C; (b) wellbore temperature increased by 4 °C; (c) wellbore temperature increased by 5 °C; (d) wellbore temperature increased by 6 °C).
Energies 16 07585 g005
Figure 6. Change rule of hydrate saturation near the wellbore interface with time under a temperature increase ((a) wellbore temperature increased by 4 °C; (b) wellbore temperature increased by 5 °C; (c) wellbore temperature increased by 6 °C).
Energies 16 07585 g006
Figure 7. Evolution of the hydrate decomposition front and complete decomposition interface with time under a temperature increase.
Energies 16 07585 g007
Figure 8. Variation in the elastic modulus of near wellbore interface with time under a temperature increase.
Energies 16 07585 g008
Figure 9. Change rule of plastic strain of near wellbore interface with time under the condition of temperature rise ((a) wellbore temperature increased by 4 °C; (b) wellbore temperature increased by 5 °C; (c) wellbore temperature increased by 6 °C).
Energies 16 07585 g009
Figure 10. Evolution rule of the unstable front of the reservoir with time under a temperature increase.
Energies 16 07585 g010
Figure 11. Evolution of gas hydrate saturation around the well under different wellbore bottom pressure conditions ((a) bottom hole pressure decreased by 3 MPa; (b) bottom hole pressure decreased by 4 MPa; (c) bottom hole pressure decreased by 5 MPa; (d) bottom hole pressure decreased by 6 MPa).
Energies 16 07585 g011
Figure 12. Variation rule of hydrate saturation near the wellbore interface with time under a decrease in pressure ((a) bottom hole pressure decreased by 4 MPa; (b) bottom hole pressure decreased by 5 MPa; (c) bottom hole pressure decreased by 6 MPa.).
Energies 16 07585 g012
Figure 13. Evolution of the front end of hydrate decomposition with time under a decrease in pressure.
Energies 16 07585 g013
Figure 14. Comparison of reservoir pressure distribution around wellbore and hydrate phase equilibrium pressure under a decrease pressure.
Energies 16 07585 g014
Figure 15. Time dependence of equivalent plastic strain at near wellbore interface under pressure drop.
Energies 16 07585 g015
Figure 16. Evolution law of wellbore displacement under an increase in pressure.
Energies 16 07585 g016
Table 1. Calculation parameters of wellbore temperature and pressure field.
ParameterValueParameterValue
Sea water depth1225.23 mWellbore diameter311.15 mm
Hydrate reservoir depth1433.03–1478.63 mDrilling fluid density1190 kg/m3
Porosity0.45Drilling rate40 m/h
Average permeability 10 mDOutput volume50 L/s
Mudline temperature4 °CWellhead temperature25 °C
Inside diameter of riser339.7 mmGeothermal gradient0.0469 °C/m
Table 2. Drilling parameters of gas hydrate reservoir.
ParameterValue
Depth below mudline255 m
Pore pressure of the hydrate layer15.25 MPa
Initial temperature of hydrate layer17.37 °C
Hydrate layer saturation0.31
Drilling fluid pressure in the well16.49 MPa
Drilling fluid temperature in the well15.35 °C
Vertical initial geostress19.65 MPa
Horizontal initial geostress17.74 MPa
Disclaimer/Publisher’s Note: The statements, opinions and data contained in all publications are solely those of the individual author(s) and contributor(s) and not of MDPI and/or the editor(s). MDPI and/or the editor(s) disclaim responsibility for any injury to people or property resulting from any ideas, methods, instructions or products referred to in the content.

