Article

Fuel Performance Analysis of Fast Flux Test Facility MFF-3 and -5 Fuel Pins Using BISON with Post Irradiation Examination Data

Idaho National Laboratory, 2525 Fremont Ave., Idaho Falls, ID 83415, USA
*
Author to whom correspondence should be addressed.
Energies 2023, 16(22), 7600; https://doi.org/10.3390/en16227600
Submission received: 28 August 2023 / Revised: 19 October 2023 / Accepted: 10 November 2023 / Published: 16 November 2023

Abstract

:
Using the BISON fuel-performance code, simulations were conducted of an automated process to read initial and operating conditions from the Pacific Northwest National Laboratory (PNNL) database and reports, which contain metallic-fuel data from the Fast Flux Test Facility (FFTF) MFF Experiments. This work builds on previous modeling efforts involving 1977 EBR-II metallic fuel pins from experiments. Coupling the FFTF PNNL reports to BISON allowed for all 338 pins from MFF-3 and MFF-5 campaigns to be simulated. Each BISON simulation contains unique power and flux histories, axial power and flux profiles, and coolant-channel flow rates. Fission-gas release (FGR), fuel axial swelling, cladding profilometry, and burnup were all simulated in BISON and compared to available post-irradiation examination (PIE) data. Cladding profilometry, FGR, and fuel axial swelling simulation results for full-length MFF metallic pins were found to be in agreement with PIE measurements using FFTF physics and models used previously for EBR-II simulations. The main two peaks observed within the cladding profilometry were able to be simulated, with fuel-cladding mechanical interaction (FCMI), fuel-cladding chemical interaction (FCCI), and thermal and irradiation-induced creep being the cause. A U-Pu-Zr hot-pressing model was included in this work to allow pore collapse within the fuel matrix. This allowed better agreement between BISON-simulated cladding profilometry and PIE measurements for the peak caused by FCMI. This work shows that metallic fuel models used to accurately represent fuel performance for smaller EBR-II pins may be used for full-length metallic fuel, such as FFTF MFF assemblies and the Versatile Test Reactor (VTR). As new material models and PIE measurements become available, FFTF MFF assessment cases will be reassessed to further BISON model development.

1. Introduction

The Department of Energy (DOE) and the private energy sector have increased interest in developing metallic fuel to support advanced reactor designs. A part of this means eventual qualification of a final fuel design. The Fuels Irradiation and Physics Database (FIPD) is under development by Argonne National Laboratory to be used for validating fuel performance models, and has been linked to a BISON-based model for such purposes [1,2]. The measurements are most applicable to typical sodium-cooled fast reactors, and several demonstrations have been performed to illustrate use of such a model with the database [1,2,3].
Unlike UO2 fuel, with its significant operational and experimental experience, experimental data for metallic fuels with documented operating conditions has less, with the majority of the data stemming from Experimental Breeder Reactor-II (EBR-II) testing. EBR-II used varied fuel compositions, many proposed in new sodium-cooled fast reactor (SFR) designs, but had a core length of about 34 cm. This is not ideal because startup cores for proposed designs of larger reactors are nearly three times this length. For example, the Versatile Fast Reactor (VTR) is proposed to use a core length of 80 cm, with greater axial-peaking factors [4]. Until relatively recently, the Fast Flux Test Facility (FFTF) Series III.b fuel-experimental data were not available [5]. This fuel contained metallic fuel pins with the fuel column being 91.4 cm long. In addition to experimental data, operating conditions and neutronic calculations have been generated [6]. Fuel performance modeling and benchmarking of longer-length metallic fuels would allow for better predictions of margins to fuel failure for advanced reactor designs as longer rods are more geometrically similar to current reactor designs than EBR-fuel slugs.
The FFTF is the most recent SFR to be designed, constructed, and operated by the U.S. DOE, and contains a variety of different fuel types [7]. The FFTF operated from 1982 to 1992 to aid in testing advanced fuels and materials for U.S. SFR research [7,8]. Fuels used within the FFTF included UO2 and mixed-oxide fuels with burnup as high as 16 at.% and linear heat generation rates (LHGRs) exceeding 60 kW∙m−1 [5]. A plan was studied to make a new, metallic U-10Zr fuel to be used as driver fuel, called Series III.b. The MFF test assemblies for Series III.b qualification all had the same cladding inner diameter (i.e., 0.574 cm), outer diameter (0.686 cm), and fuel meat length (91.4 cm) [5,6]. The MFF-3 and MFF-5 assemblies examined in this study each contained 169 binary U-10Zr fuel pins and used HT9 cladding. Similar to the design of EBR-II fuel pins, MFF assemblies used a sodium bond between the fuel and the cladding for increased heat transfer, allowing for higher LHGRs. Fast neutron fluence values observed within the MFFs were similar to EBR-II high-burnup experiments, with values reaching 2 × 10²³ n∙cm−2. These high (E > 0.1 MeV) fast neutron fluence values allow for irradiation effects to occur, such as FCCI.
A small but important post-irradiation examination (PIE) database has been collected that includes cladding profilometry, metallography, fission gas release (FGR), and axial fuel swelling heights for a number of pins from MFF-2, MFF-3, MFF-5, and MFF-6 [6,7]. Similar to how the Fuels Irradiation and Physics Database (FIPD) and Integral Fast Reactor Materials Information System (IMIS) database stored EBR-II PIE data, FFTF MFF PIE data and operation conditions are stored in a collection of CSV files that can easily be easily accessed to compare results with a modeling program, such as BISON [1,3,9]. In addition to PIE data, irradiation data are supplied, including fuel isotopic compositions and weights, material dimensions, core positions, peak and average burnup values for fuel pins, assembly averaged flux and power values, assembly flow rates, coolant temperatures, run histories, and assembly designs. Axial profiles are provided for power and fluence for each operating cycle as well. When axial profiles are coupled with power and flux distributions within each assembly, a unique irradiation history can be generated for each pin. The power and flux distributions within each assembly, together with the axial power and flux profiles found within the PNNL reports, were computed using burnup and core-power distribution codes [3,4].
BISON is a finite element code and is based off the Multiphysics Object-Orientated Simulation Environment (MOOSE). This lets users to construct C++ objects to perform coupled simulations, such as void swelling models [10]. BISON is capable of predicting fuel performance for a variety of fuel forms including metallic fuel and ceramics [11,12]. BISON solves the fully coupled thermomechanical equations for varying geometry. Fuel models within BISON include temperature, porosity, and burnup-dependent thermal properties, and models describing fuel behavior [13]. Thermal and mechanical contact were modeled to achieve for thermomechanical coupling and cladding profilometry with PIE data comparisons. The benefit of using BISON over other fuel performance codes is that BISON users can construct and contribute their own C++ objects to the code and develop models, such as void swelling correlations, FCCI correlations, and zirconium redistribution presented in prior works [7,8,14,15].
Prior modeling and simulation for SFR metallic fuel focused on furthering the development of U-Pu-Zr, HT9, D9, and SS316 material models within the BISON code, as well as FCCI coupling. These simulations used EBR-II conditions and PIE data for validation and optimization. Early modeling efforts used operating conditions and fuel-pin geometries from EBR-II experiments X419 and X447 before being coupled with IMIS and FIPD [10,11,12,13]. Prior works used 2D-RZ simulations, with a coolant-channel convective boundary condition and a volumetric heat source derived from the fission rate in the fuel. Assessment cases for 1977 EBR-II experimental pins were later generated by linking BISON to the IMIS and FIPD databases for model validation [2,10,12]. These simulations encompassed a power and flux history from the germanium-lithium argon scanning system (GLASS) (The GLASS was a device to monitor the EBR-II argon cover gas for fission gas to detect fuel-pin leaks. It also compiled a coordinated history of reactor power) data contained within FIPD, coolant flowrates throughout each pin power cycle, and fabricated dimensions. The assessment cases were compared to digitized PIE data for burnup, FGR, fuel axial swelling, and cladding profilometry to assess model performance. Although the assessment cases for EBR-II were able to match PIE cladding profilometry and axial fuel swelling results well, axial fuel swelling was underpredicted at low burnups and overpredicted at high burnups [10]. This was theorized to occur due to BISON not containing a model describing metallic fuel pore collapse, such as that within the ALFUS code [14].
Here, it will be demonstrated how the irradiation data for FFTF MFF-3 and MFF-5 were coupled into BISON to simulate and validate modeling work in addition to the EBR-II assessment cases. In addition to analyzing fuel performance for FFTF MFF pins, a U-Pu-Zr hot-pressing model is implemented to address overswelling issues observed in previous work [2,10,14]. BISON simulations were created that encompassed power, flux, flowrate histories, and fabricated dimensions from the PNNL reports, such as those used for a previous investigation [15]. Axial power and flux profiles for each power cycle were included in the simulations as well, where previous modeling left the axial profiles fixed throughout the irradiation histories. The BISON FFTF MFF simulations were compared to digitized PIE data for burnup, fuel axial swelling, and cladding profilometry [1,2]. In addition, fission gas measurements were predicted for FFTF MFF-3 and MFF-5 pins. Out of the 338 fuel pin simulations generated, cladding profilometry and axial fuel swelling data is available for eight pins, which will all be compared against BISON modeling output in this manuscript.

2. Methods

All BISON modeling efforts presented in this work utilize a base FFTF MFF input file that contains irradiation data from PNNL reports. The base FFTF MFF input file construct was based on a generic EBR-II input file used in previous work, into which changes to geometry and additional material models were added [10,12]. In total, the following process produced 338 unique BISON simulations for MFF-3 and MFF-5. A generic script was developed within Python to create the BISON simulations because of future plans to add MFF-2 and MFF-6 irradiation data to the IMIS database.

2.1. FFTF MFF-3 and MFF-5 Irradiation Data for BISON Input Parameters

Within the PNNL reports, MFF-3 and MFF-5 assembly power, flux, and flowrates are given at the beginning (BOC) and end (EOC) of each power cycle, with the exception of Cycles 10C-2, 11A-1, and 11A-2. These three cycles did not contain any EOC data due to their short duration [6]. In addition, assembly axial power and flux profiles are supplied at the BOC and EOC with the same exceptions. FFTF MFF-3 and MFF-5 power, flux, and flowrate values for each power cycle are listed in Table 1 and Table 2. The MFF-3 and MFF-5 average assembly powers were divided by the number of pins in each assembly (169) and the fuel pin length to generate an LHGR for each fuel pin at each power cycle to create a unique irradiation history for each MFF pin. The LHGR and flux values were then multiplied by their respective assembly distribution and axial profile for each power cycle. An example fission power distribution for MFF-3 is seen in Figure 1. Since power and flux are functions of axial height (location) and time, bilinear functions are used within BISON to describe pin conditions [16].
The coolant channel average inlet temperature used for both MFF-3 and MFF-5 was a constant 633.15 K with an inlet pressure of 150 kPa. These parameters were directly used within the BISON CoolantChannel action. The flowrates supplied for each operating cycle were converted to mass flux using the average flow area within the MFF-3 and MFF-5 assemblies. The flow area was calculated by taking the cross-sectional area of the hexagonal can containing a 169-pin bundle and subtracting the cross-sectional area of the 169 pins (Figure 2). The conversion factor from lb∙h−1 to kg∙m−2∙s−1 is 0.0297 for MFF-3 and MFF-5 geometry [6]. This inlet temperature in conjunction with the flowrates for MFF-3 and MFF-5 allowed for cladding temperatures to exceed 960 K and peak fuel centerline temperatures to exceed 1100 K. In the beginning of MFF-3 and MFF-5 cycles, cladding and fuel temperatures are relatively the same, as seen in Figure 1. However, as irradiation continues, irradiation calculations suggest MFF-5 pins see increased cladding and fuel temperatures in comparison to MFF-3 pins due to decreased flowrates and increased fission power, leading to more FCCI being predicted (Figure 1).
Eight FFTF MFF pins will be examined and compared to all possible PIE measurements, including 193045 and 195011. The remaining pins were modeled for later comparisons if more PIE measurements become available. The eight pins with different types of PIE data are listed in Table 3 [6,7]. The PIE data available for the eight pins include burnup calculations, axial fuel swelling, spiral and linear cladding profilometry, metallography, neutron radiography, gamma scanning, and fission-gas chemical analysis and pressure measurements.

2.2. General Solution Approach

Metallic fuel performance is simulated using the BISON fuel-performance code. BISON input files are generated using an automated system by modifying a base FFTF MFF pin, similar to an EBR-II input file used in previous work [2,10,12]. The fuel performance calculations for the MFF assemblies include thermal and mechanical contact between the outer fuel surfaces and the inner cladding wall to simulate FCMI and provide heat transfer to the sodium coolant. Geometric dimensions, initial conditions, boundary conditions, and power and flux histories from each pin from MFF-3 and MFF-5 were supplied from the PNNL reports to be used in conjunction with material models and contact actions within BISON [2,12]. Information within BISON allows for different phenomena—e.g., burnup, porosity, FGR, void swelling, FCCI, and recently U-Pu-Zr hot-pressing—within the simulations to be incorporated into material properties [14,17,18]. This work builds on fully coupled EBR-II simulations previously carried out to incorporate full-length MFF pins similar to the proposed VTR design. A new U-Pu-Zr hot-pressing model was added to counteract the overswelling issue of U-Pu-Zr fuel at higher burnups. In the case FFTF MFF fuel, the material is U-10Zr (U-Pu-Zr fuel with no plutonium), which can utilize the U-Pu-Zr hot pressing model by setting the initial plutonium content to zero. The coupling of material models used to describe material properties for the fuel and the cladding are listed in Table 4, together with the corresponding BISON object. The interconnection of the models is shown in Figure 3.
Each material model and species diffusion kernel within BISON were developed off of experimental measurements from experiments explicitly designed to describe material properties or phenomena within nuclear fuel and cladding. Mostly, these material models are empirical fits that describe fuel behavior within the bounds of the geometry, composition, and the dependent phenomena on the engineering scale. Such material model examples of this include thermal expansion, thermal creep, elasticity tensors, and fission gas release which are verified using tensile loading, coefficients of thermal expansion, and wet chemistry. More complex phenomena require material properties to be well defined to understand more complex mechanisms, such as fission gas swelling, void collapse, and fuel-cladding chemical interaction. These complex mechanistic models involve multiple fuel performance irradiations and PIE measurements in order to validate parameters of these models and verify their correctness, slowly eliminating undefined parameters. This process between modeling and PIE comparisons becomes iterative until the mechanistic models become applicable for all geometry types. When a new material model is added to an existing simulation, the addition as assessed by PIE comparisons to see if an improvement is made for the dataset as a whole. Typically, small quantitative differences between modeling and PIE measurements suggest model refinement, such as changes to proportionality constants, where visual qualitative differences between modeling and PIE measurements suggest that phenomena are not accounted for, and further model refinement is needed.

2.3. U-Pu-Zr Hot-Pressing Model

Metallic fuel swells from fission gas production and the pressurization of pores by hot fission gas. Porosity increases as thermal expansion causes grain boundary tearing and forms intergranular voids and fission damage produces intragranular voids. Fission gas is produced and begins diffusing into voids to form bubbles. These features grow by fracture or, in the case of bubbles, by creep of the fuel as the pressure in them increases from increased gas content and increased temperatures. In this analysis, it is assumed that fuel swelling occurs by bubble growth and resulting creep from the fuel. The creation of fission gas is calculated directly from the fission rate density and the eventual release of fission gas from the fuel by interconnection of the fission gas bubbles [27]. The number of fission gas atoms produced and released has been consistent with previous work within EBR-II modeling [2]. The fission gas bubble radius used for the fuel eigenstrain is based on the total number of fissions and the number density of bubbles, as seen in Equation (1).
Bubble   radius R = 3 k b T Y g a s F ˙ t 8 π γ N
In Equation (1), kb is the Boltzman constant, T is temperature in Kelvin, γ is the surface tension of the fuel, F ˙ is the fission rate, N is the bubble number density, and Ygas is the gaseous fission product yield [30]. The eigenstrain that accounts for fuel swelling from fission gas production assumes gas bubbles to be spherical, which is shown in Equation (2).
Gaseous   Eigenstrain ϵ g a s = V V 0 g a s = 4 π 3 R 3 N
As the fuel matrix swells due to fission gas production, FCMI causes increased interaction stresses between the fuel and the cladding. The increased hydrostatic stress in the fuel allows for pores created from fission gas to compress and reduce in volume. Open pores that were created can also collapse at increased rates. The decrease in volume is applied to the fuel matrix via an eigenstrain based on the effective stress, creep rate, and gaseous porosity in Equations (3) and (4), with ε c ˙ being the creep rate, and α being an interconnection factor based off the gaseous eigenstrain ( ϵ g a s ) of the fuel [14,22]. The maximum amount the fuel matrix is allowed to swell due to fission gas production and hot-pressing is capped once terminating porosity is reached, seen in Equation (5) [27]. The total porosity of the fuel is determined by the fuel volumetric strain in Equation (6) [27].
Hot - press   Eigenstrain V V 0 p o r e = 0 t 3 3 α ε c ˙ ( σ , T ) d t
α = 0                                             ϵ g a s = 0 1 6 ϵ g a s 0.1 1.5               0.1     ϵ g a s > 0 1 6                                   ϵ g a s > 0.1
Maximum   Eigenstrain V V 0 m a x = p t e r m p i n i t i a l 1 ( p t e r m p i n i t i a l ) V V 0 p o r e + V V 0 g a s
Porosity p = p g a s + p i n i t i a l = V V 0 1 + V V 0 + p i n i t i a l
The additional hot-pressing eigenstrain for U-Pu-Zr fuel was implemented into the FFTF modeling to counteract underprediction of fuel swelling at low burnups and overprediction of fuel swelling at high burnups. Implementation of the hot-pressing eigenstrain also allowed for better agreement with the MFF-3 and MFF-5 profilometry and a better representation of physics occurring within the fuel pores.

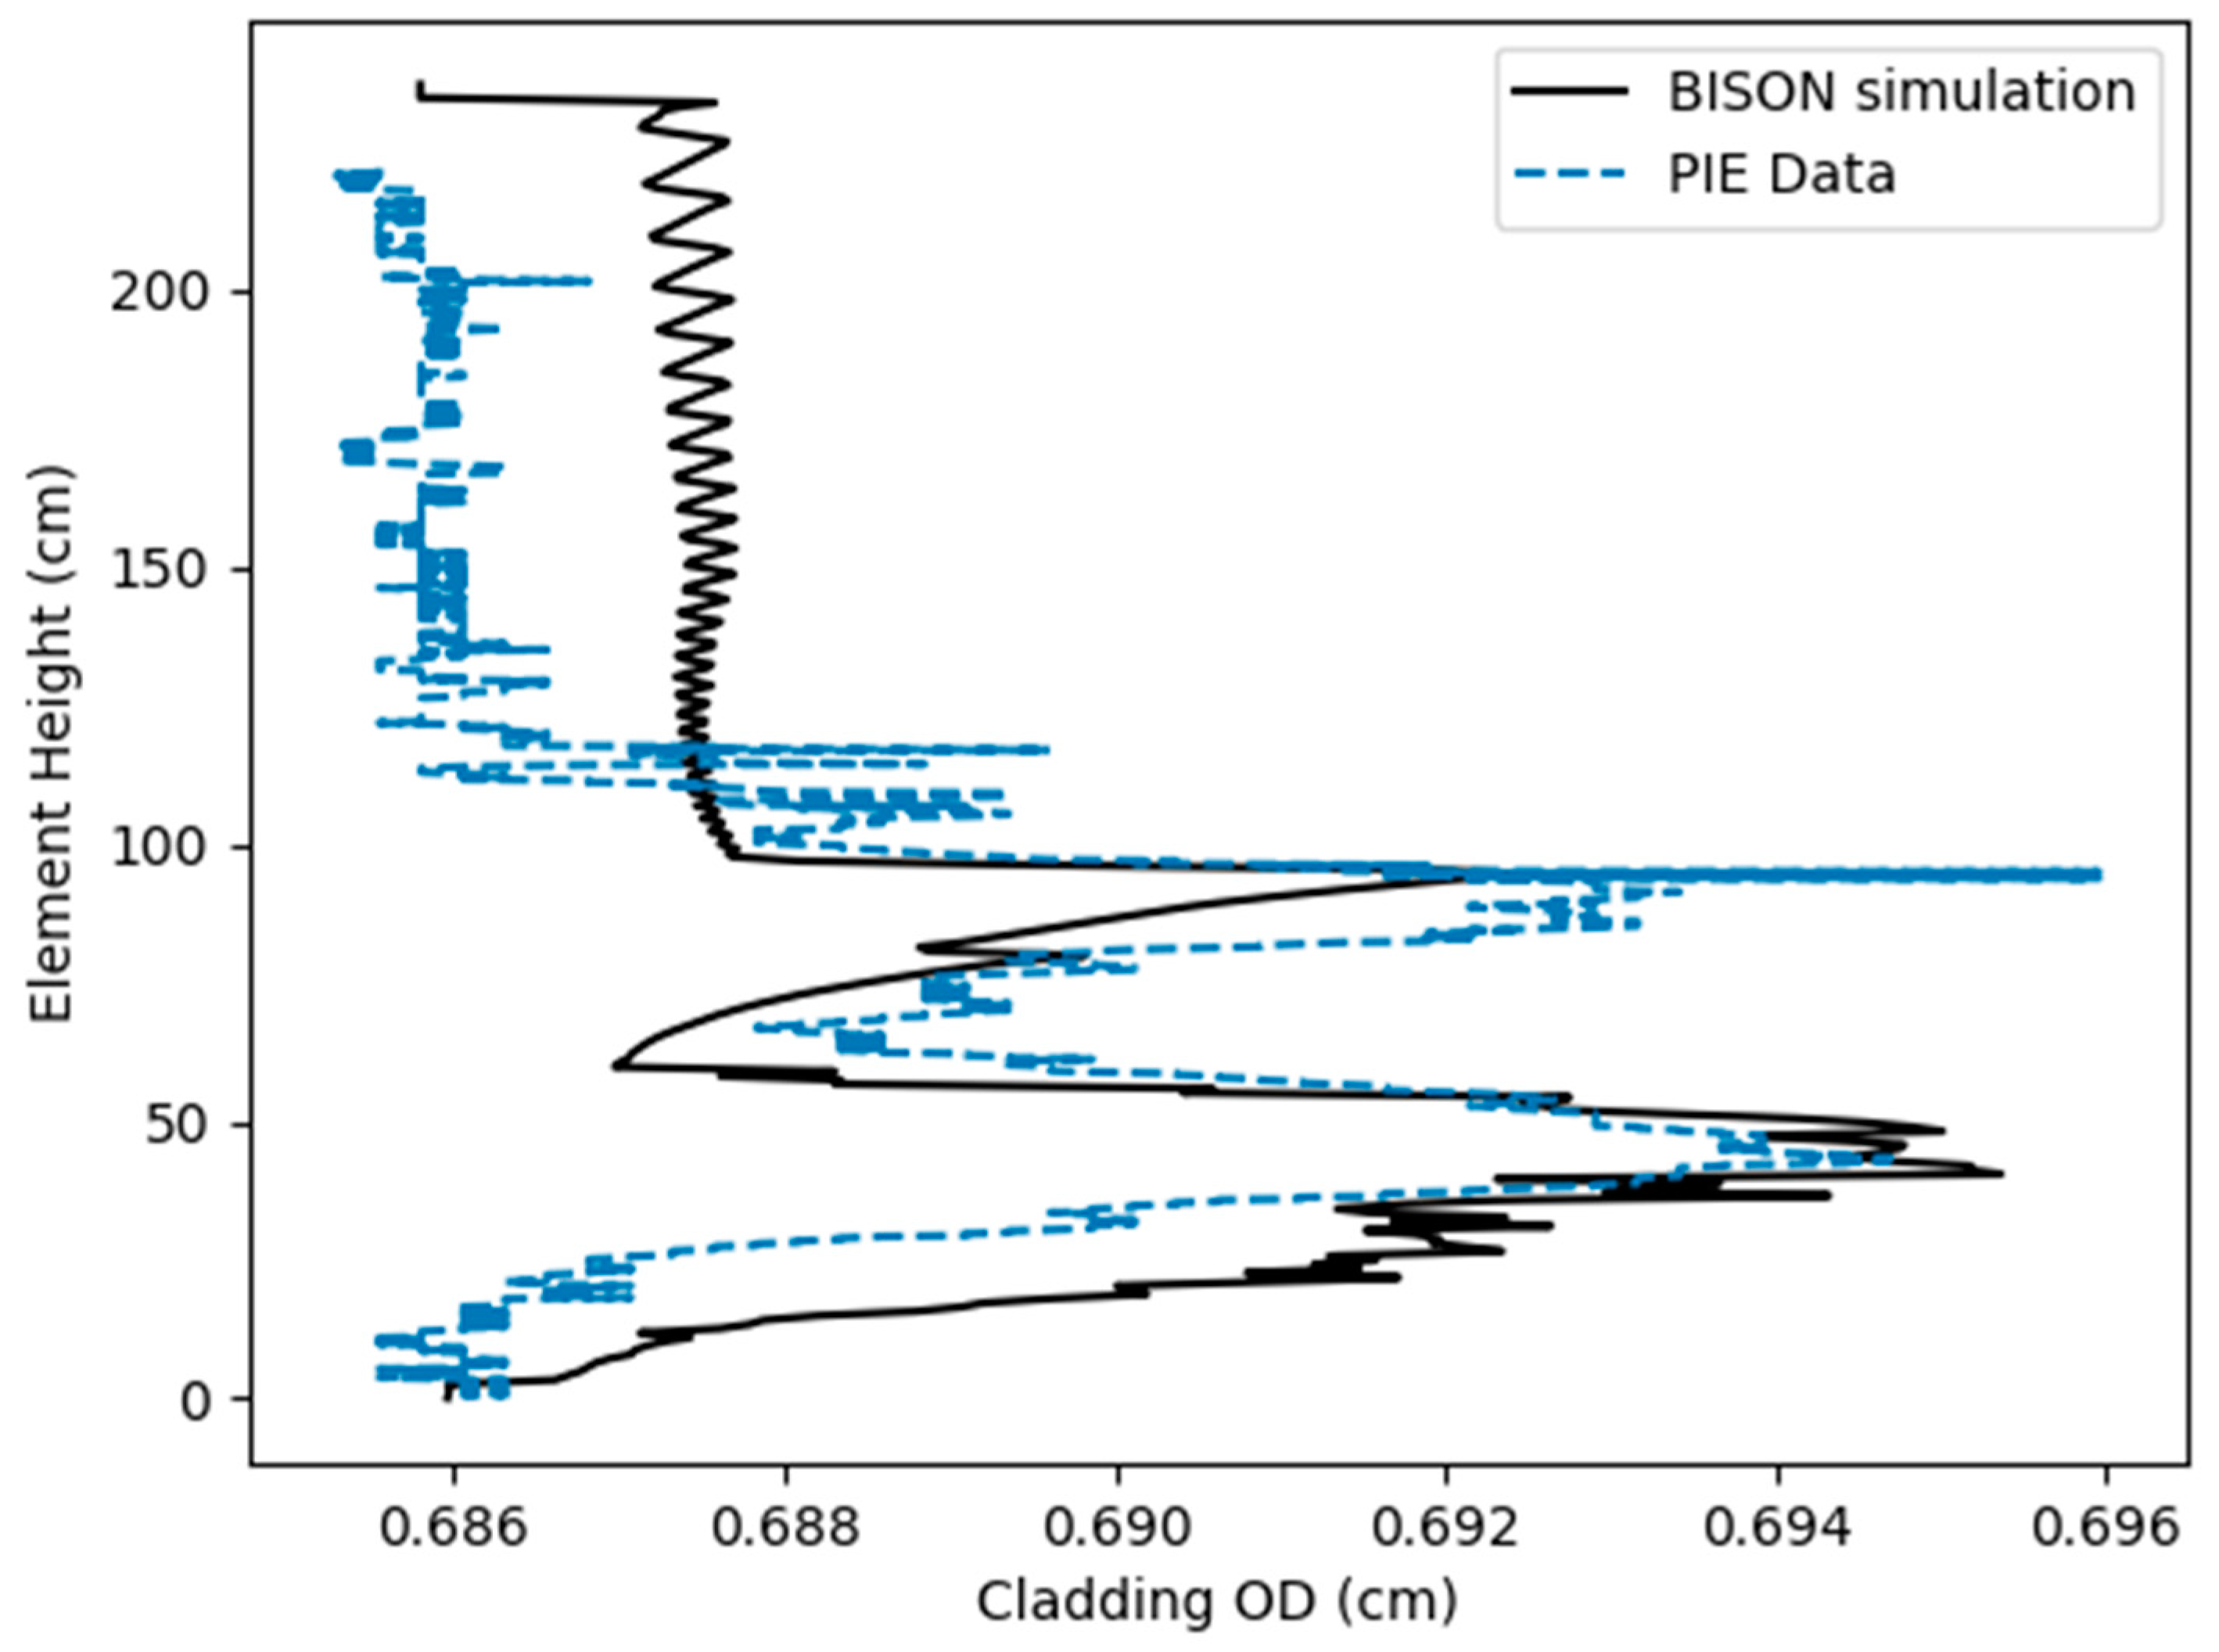
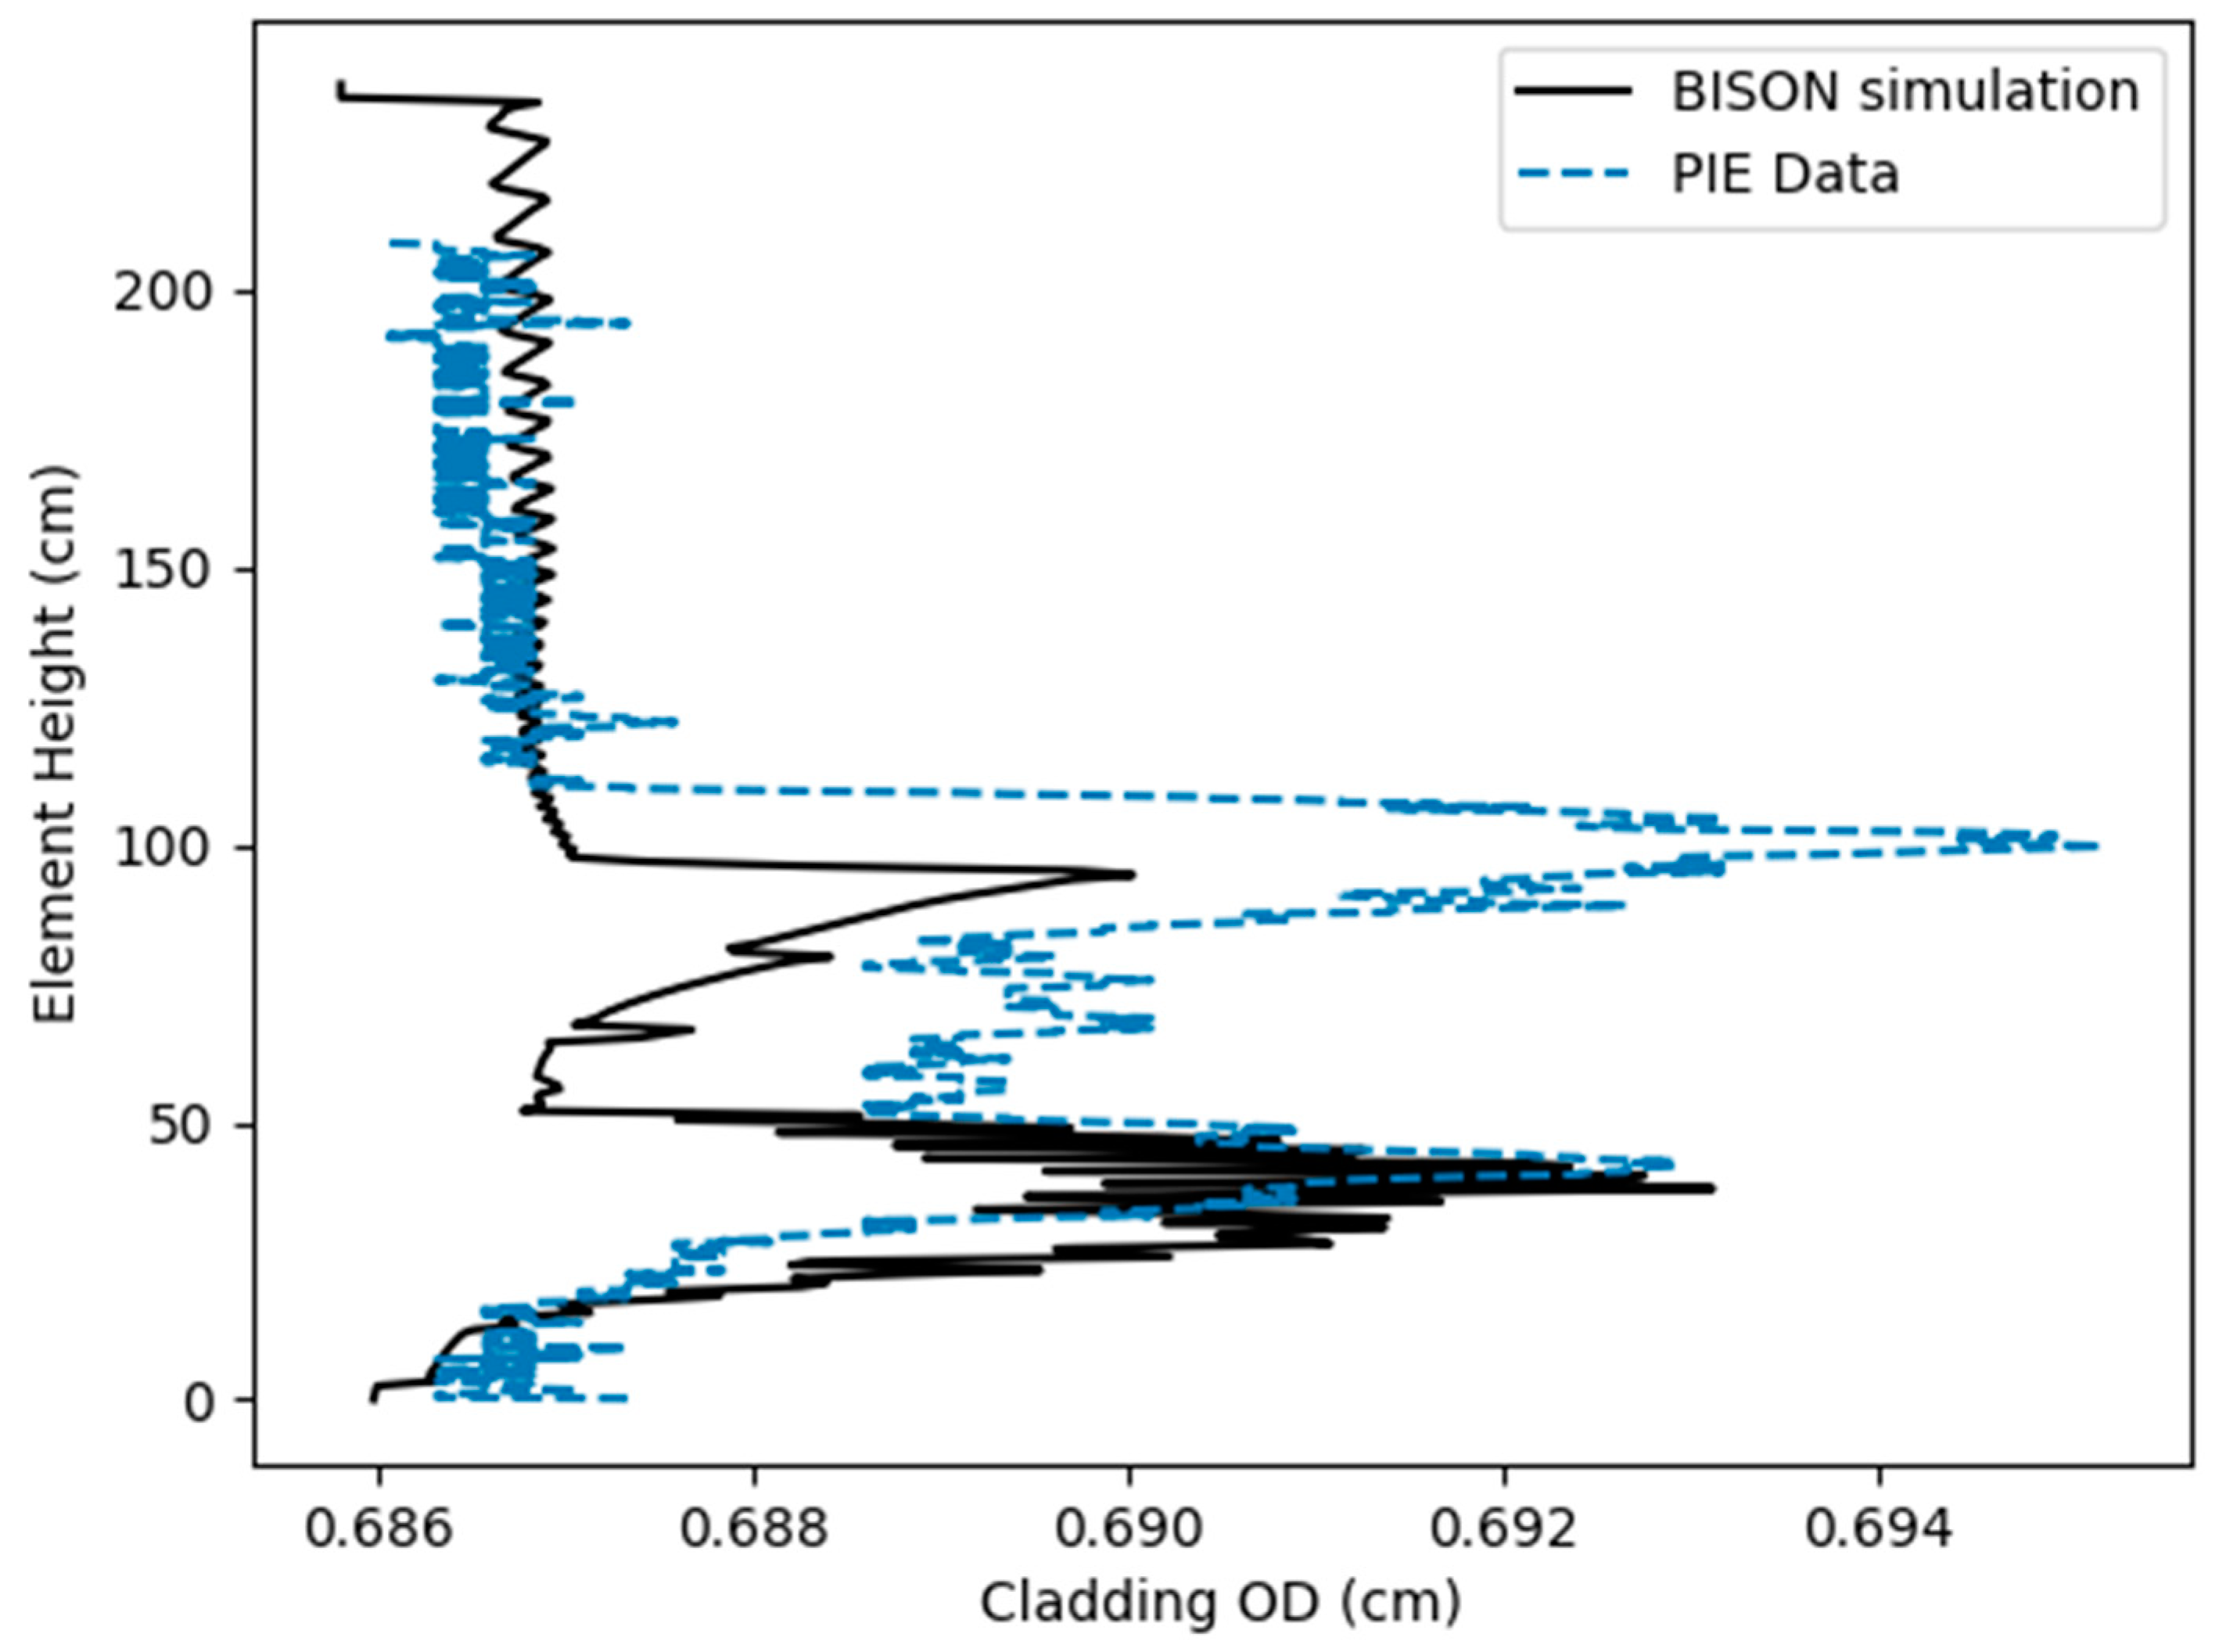
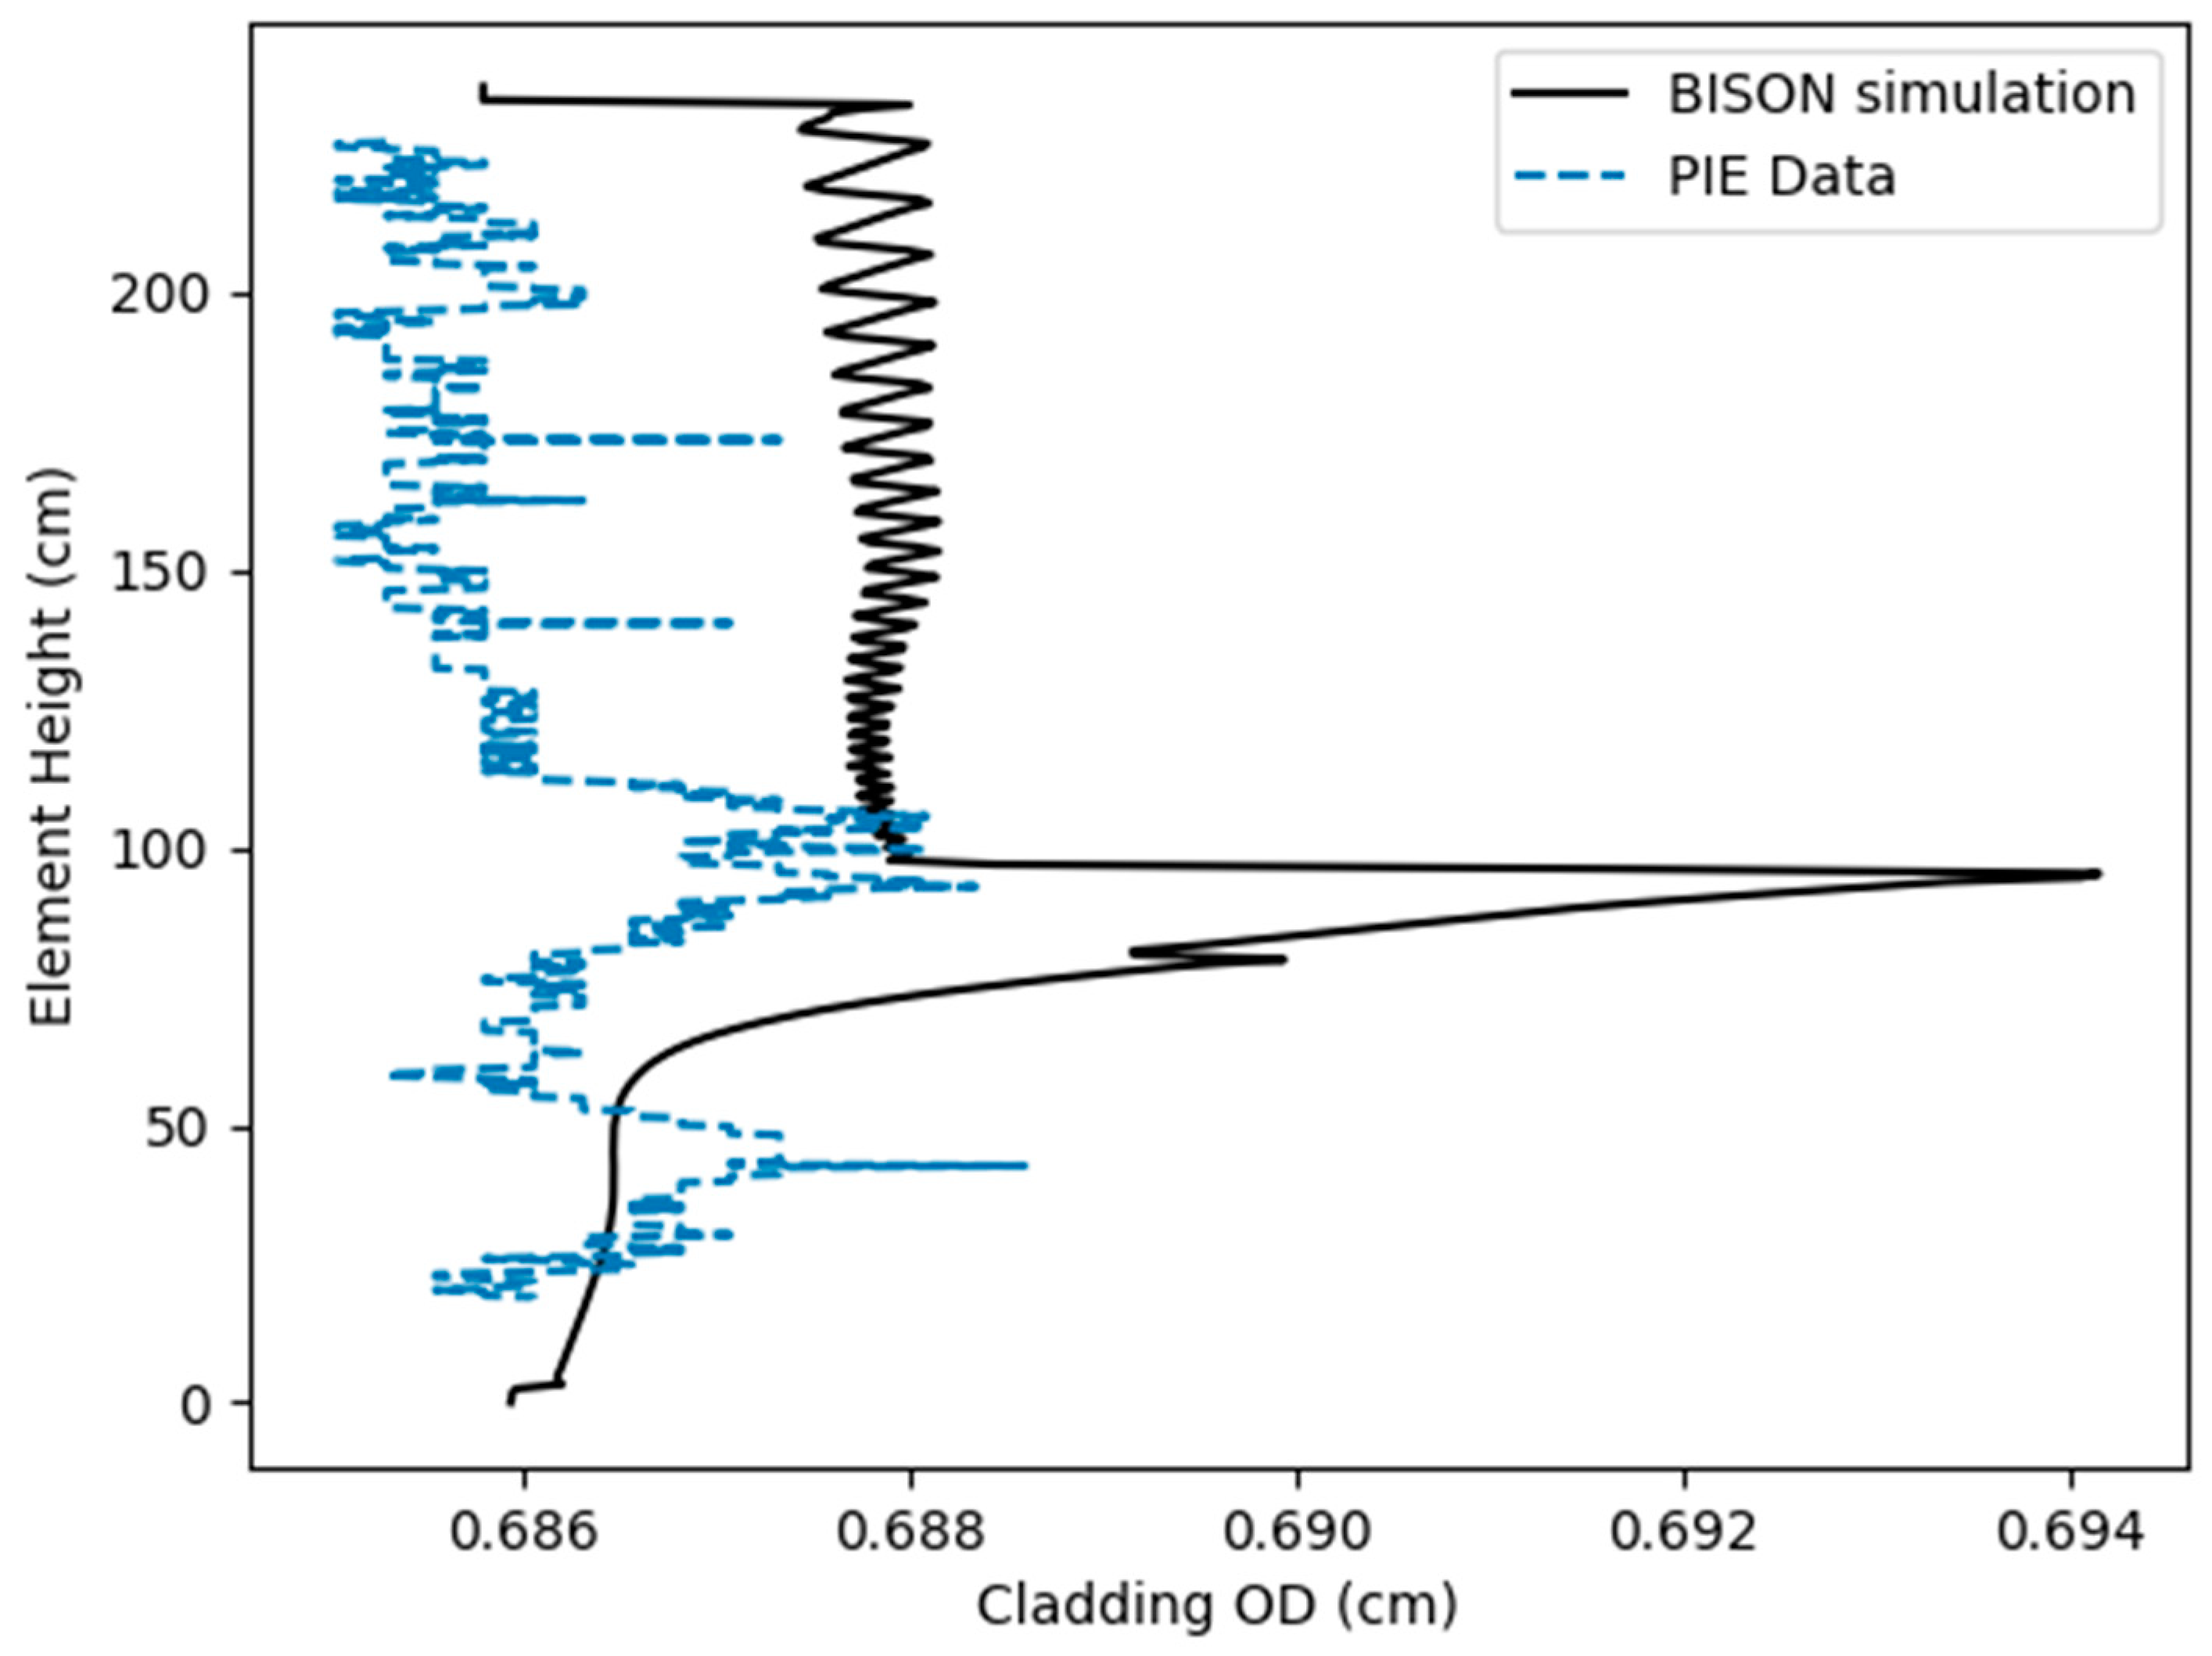
2.4. Cladding Profilometry Assessment

To evaluate the cladding profilometry fit between BISON and PIE data, the standard error of the estimate (SEE) was used in this and prior works, as [10,12]. This method is illustrated in Figure 4 and Equation (7). SEE was chosen to evaluate the BISON cladding profilometry as it takes into account the axial shift of the profiles by accounting for the differences between the two sets of data, as shown in Equation (7), where y is the BISON clad displacement, y ^ is the PIE clad displacement, and n is the number of profilometry datapoints in a pin [34,35]. This is important because two main peaks often occur within the MFF pin profilometry for hotter operating pins. The upper peak in the cladding strain data for all FFTF MFF pins occurs near the top of the fuel column and is caused by FCMI and fission gas pressure, which is then magnified by thermal creep and FCCI. The lower of the two peaks is caused by FCMI and is dependent on burnup and smeared density. SEE allows for the axial location and magnitude of these two peaks to be quantified, which is essential when evaluating numerous cladding strain profiles.
S E E = ( y y ^ ) 2 n 2
In addition to each pin containing an SEE value, the collective SEE value for all FFTF MFF pins was generated to evaluate the cladding strain predictions of all eight pins, along with the standard deviation of the SEE values between pins in the table in Section 4.

3. Results

Simulated burnup and FGR values are presented, along with comparisons of simulated cladding profilometry and axial fuel swelling with PIE measurements. FGR from BISON simulations of 70% were predicted, and PIE FGR measurements did not exceed 73% on average. Axial fuel elongation predictions from BISON had an error of 3% when compared to PIE measurements, with lower burnup FFTF MFF pins having greater axial swelling. Mechanisms to describe this behavior are discussed. Cladding profilometry between BISON simulations and PIE measurements for MFF-3 pins were found to be in better agreement than previous work, with an average SEE value of 23 µm [10].

Burnup and Fission Gas Release

The average and peak burnup values obtained from BISON simulations are displayed in Table 5. Due to the method used to write FFTF MFF reactor conditions into BISON, no power cycling was performed in the simulations—startup and shutdown data were not available. Not including the startup and shutdown operation data for each operating cycle would lead to elevated burnups in addition to the effective full-power days (EFPD) modeled. Previous average burnups calculated for FFTF MFF-3 and 5 were 11.82 and 8.58 at.%, respectively, which is within BISON simulation predictions [6]. Only modeling EFPDs for each pin led to consistent burnup rates because downtime between operating cycles was omitted from the irradiation histories. This was conducted due to reactor power histories not being available. In previous modeling efforts, BISON has been shown to slightly underpredict the average and peak burnup of EBR-II fuel pins using the current metallic fuel-burnup material model [2,12].
FGR predictions from the BISON simulations were plotted and compared to PIE measurement predictions using an EBR-II correlation within the IMIS database. In addition to this, fission gas collected (FGC) measurements, along with fission gas produced (FGP) and fission gas released (FGR) calculations from FFTF MFF pins, are also provided. Each of the fuel pins simulated in BISON predicted less FGP than calculated within FFTF MFF documentation [6]. Discrepancies between the BISON simulation FGP, FGC, and FGR are due to the selection of different fission-rate densities within the calculations in conjunction with two measurements. However, the IMIS database correlation is based upon 81 EBR-II pins, which had PIE measurements for FGP, FGC, and FGR. The predicted values from the IMIS correlation are in better agreement with BISON results than FFTF hand calculations. Comparison of these parameters are shown in Table 6, Table 7 and Table 8.
When comparing the values of FGR fraction, FGP, and FGC, between BISON and IMIS correlations, all three values are in agreement. BISON calculates FGP, FGC, and FGR by coupling porosity and the average fission rate at each node in the UPuZrFissionGasRelease material model, where IMIS and FFTF calculations multiply the burnup by the number of moles of fissile material in each fuel pin and the fission-gas yield fraction to determine the amount of moles from FGP. BISON does not allow for FGR to occur until a user specified initiating is reached. FGP and FGC from BISON results for MFF-3 pins were greater than MFF-5 pin values due to extended burnup in the fuel. The FGR fraction that BISON predictions may reach is calculated using data from IMIS, which includes considerable scatter, similar to the variance between BISON predicted values and FFTF measurements [2].

4. Axial Fuel Swelling and Cladding Profilometry

While material models in BISON are not currently staged for accurate prediction of all fuel performance phenomena, predictions using the current material models are shown as a demonstration of comparisons that are being made between simulations and the databases for any pin or large group of pins, particularly for verification and validation efforts. Cladding profilometry and fuel axial swelling predictions in BISON are indirectly dependent on FCMI and FCCI used in the simulations. Frictional contact between fuel and cladding, with a friction coefficient of 0.2, was used with a plutonium-dependent anisotropic swelling factor. With MFF-3 and MFF-5 assemblies containing no plutonium-bearing fuel, the anisotropic swelling factor (a proportionality constant) was set to 0.24, based on the previous literature [14,32]. Frictional contact was chosen to represent the U-Pu-Zr fuel sticking to the inner cladding wall, yielding an accurate value for axial fuel swelling compared to previous overprediction [36,37]. The better prediction of axial fuel swelling is contributed to the implementation of a U-Pu-Zr fuel hot-pressing model in addition to implementing friction between the fuel and cladding. The lower peak at fuel centerline for all pins is caused by fission gas pressure and FCMI, tempered by the hot-pressing of the fuel matrix. The hot-pressing model for the fuel matrix allows for compression of the fuel, reducing porosity due to pore collapse, and limiting cladding strain. The upper peak is caused by gas pressure and FCMI and is enhanced by the coupling of FCCI back into the BISON model through ComputeMultipleInelasticStress using a damage model and HT9 thermal creep. This is due to the elevated cladding temperatures near the top of the fuel pin, where FCCI and thermal creep are more likely to occur. Although the flux profile in FFTF MFF pins peaks more than EBR-II pins, burnup and fluence values were still sufficient to induce FCCI, which are two parameters that the FCCI model is based on in addition to temperature. The oscillations that occur above the top of the MFF fuel and around the lower peak at approximately 50 cm in Figure 5 are artifacts due to the mesh size chosen for modeling efforts. This is seen in the outer cladding wall temperature profile as well. The oscillations that occur around the lower peak are due to FCMI increasing hydrostatic stress within the fuel and cladding, allowing for more compression of U-Zr fuel at those nodes due to the hot-pressing model. This bulge occurs when the metallic fuel swells and expands after FCMI occurs. The magnitude and width of this bulge from FCMI are dependent on the cladding material, temperature, thermal and irradiation creep, and fission gas swelling force the fuel is imposing on the cladding. This is important, as using the same base material models and actions within BISON for EBR-II pins were able adequately predict cladding strain for longer FFTF MMF fuel pins.
Comparing MFF-3 pins modeled in BISON to their cladding profilometry measurements yielded good agreement between the two, with the location and the magnitude of the two peaks to yield low SEE values. This is seen in both peaks within Figure 5 and the lower peak within Figure 6. MFF-3 Pins 193045 and 193025 had SEE values of 15.9 and 18.4 µm, respectively. However, the BISON-simulated magnitude of the upper peak caused from FCCI and HT9 thermal creep underpredicted PIE measurements for Pins 193025 and 193020, and overpredicted the magnitude for Pin 193062. Previous work using the HT9 thermal creep model showed that a cladding temperature difference of 5 K, at temperatures above 880 K can significantly affect the cladding strain caused by thermal creep due to how the empirical models are constructed [10,12]. This small temperature change and fluctuation in cladding profilometry may be due to uncertainty within the calculated assembly power, individual pin power fractions, and assembly-averaged flowrates. Using the assembly-averaged flowrates for individual MFF-3 and MFF-5 pins may cause over- or underpredicting cladding surface temperature in BISON, depending on assembly position. SEE values and other statistical data for MFF-3 and MFF-5 pins are available in Table 9. The MFF-3 pins had lower SEE values than MFF-5 pins, suggesting better fitment between BISON simulations and PIE measurements seen later within this section. The same may be concluded using the maximum and average cladding strain difference between BISON simulation predictions and PIE measurements for MFF-3 and MFF-5 pins. The standard deviations for maximum and average cladding strain differences include both MFF-3 and MFF-5 pins. With these standard deviations being larger than all MFF-3 values, this suggests there is discrepancies within the empirical models used within BISON and uncertainty within reactor conditions leading to overprediction of cladding strain in MFF-5 pins.
With the MFF-5 experiment containing lower burnup pins than MFF-3, lower cladding strain due to FCMI is expected, which is seen within the BISON and PIE measurements in Figure 7. However, calculated reactor conditions for MFF-5 contain lower mass flowrates and higher assembly powers, leading to higher simulated cladding temperatures than were seen in MFF-3. These higher cladding temperatures would be expected to cause more thermal creep and FCCI at similar burnups and is seen in the BISON simulations in Figure 7. However, PIE cladding profilometry measurements suggest that MFF-5 pins may have operated with lower cladding temperatures because the magnitude of the upper peak is significantly reduced compared to MFF-3 pins. Another source of error contributing to BISON overprediction of the upper peak in the cladding profilometry is the uncertainty within the FCCI empirical model: the correlation is based on EBR-II X447A pins, which had a cladding temperature and fluence similar to MFF-3 pins. The wastage thickness resulting from FCCI for MFF-5 pins should be added to the empirical correlation to obtain better agreement with other pins outside of EBR-II.
The average cladding profilometry predictions for MFF-3 suggest that BISON profilometry predictions are in statistical agreement with PIE measurements, with the average strain differences between the BISON simulations and PIE measurements being less than 10 µm for MFF-3 pins. However, the maximum difference between the analyses of fuel pins within MFF-3 and MFF-5 show under- and overprediction of the maximum cladding profilometry measurement, with the upper peak being magnified by thermal creep and FCCI. The lower peaks observed within BISON simulations of MFF-3 and MFF-5 pins were dependent on the amount of force exerted from fission gas swelling, solid swelling, and irradiation creep in the cladding. This is directly dependent by the axial power and flux profiles used in BISON simulations and the magnitude of the fast neutron flux, all obtained from prior calculations [6]. Flux and power axial profiles used were unique to individual pins within MFF-3 and MFF-5, with the axial profiles changing each operating cycle, allowing for a better representation of the irradiation creep and fission gas released into the plenum. The strain seen over the entire cladding wall is also due to plenum pressure created from FGR and irradiation-induced creep. The prediction of FCMI magnitudes has always been a difficult problem, with the implementation of a hot-pressing model to address overprediction.
The friction coefficient, anisotropic factor, and hot-pressing U-Pu-Zr fuel model coupled within the simulations affects the fuel axial swelling, with FCMI preventing the fuel from swelling axially. Previous work has determined that a friction coefficient above 0.2 yields the same results as glued contact in less computational time [10]. Axial fuel heights from the MFF fuel slugs predicted in BISON were compared to PIE measurements in Table 10. In all cases, BISON overestimates axial fuel length for MFF-3 pins, and underpredicts the axial fuel length of MFF-5 pins. Note that MFF-3 pins were irradiated to a higher burnup but have less axial fuel swelling than MFF-5 pins. This phenomena was observed in EBR-II pins, where subsequent irradiations decreased the axial fuel height of fuel pins, but increased total fuel volume swelling [2,10]. The believed mechanisms that would cause this phenomenon is a combination of zirconium redistribution and hot pressing within the fuel matrix. In other ongoing work, it has been shown that redistribution of zirconium within the fuel matrix lowers the fuel’s Young’s modulus and Poisson’s ratio, such that thermal stress and plenum pressure allow for the fuel to deform and compress more easily due to FCMI and FGR [22]. Efforts are now underway to change the gaseous swelling material model used in the BISON code to bind swelling using viscoplasticity stress, which is phase- and temperature-dependent [38].

5. Discussion

BISON analysis shows the capability of FFTF MFF pin information to be supplied in a BISON input file and for simulation results to be compared to PIE measurements performed at INL and discrepancies between the datasets where improvement is needed. This was carried out to validate metallic fuel and benchmark material model development. The irradiation data contain pin dimensions, power history, flux history, axial profiles for power and neutron flux, and coolant channel boundary conditions, with most reactor operating conditions being specific to individual pins, with the exception of the flowrates, which are assembly averaged.
Comparing FFTF MFF and EBR-II irradiation conditions used in BISON simulations showed that MFF simulations contained axial flux and power profiles for individual pins for each operating cycle, where EBR-II pins only contain axial flux and power profiles at the beginning of irradiation. This led to FFTF MFF pins having a more accurate axial irradiation history than previously modeled EBR-II pins. This was important within this work due to the two distinct peaks within the cladding profilometry data being partially irradiation dependent. The power and flux histories for MFF pins were constructed using assembly-averaged flux and power, with power and flux fractions applied to individual pins at the beginning and end of each operating cycle listed in EFPD. EBR-II pins supply an LHGR and fluence for each pin at the beginning of the operating cycle but contain an EBR-II power history; the combination of these two allows for a complete power and flux history to be written for individual pins, including reactor startups and shutdowns between experiments and operating cycles [1,2,3]. This was not possible for MFF pins because reactor power history was not available. Neglecting reactor startups and shutdowns within the MFF pin simulations slightly underpredicts burnup, but more importantly, temperature-dependent fuel-performance phenomena such as fuel porosity, FCMI, and cladding strain are not accurately represented. This is due to differences in temperatures and stresses caused by thermal gradients.
Similar to measurements contained within the IMIS and FIPD databases, uncertainty analyses of FFTF MFF irradiation data and reactor operating conditions are not available. This prevents uncertainty analysis from being conducted. For MFF pins modeled in this work, all pins were in or near the center of the assembly but used an assembly average flowrate for each operating cycle. Depending on the pin location in each assembly, this assumption may be adequate, although flowrates peaking in the center of each assembly is likely. When comparing BISON results to PIE measurements, the uncertainty within the comparison is further compounded due to BISON being a finite element method code, with most material models being empirical fits to collected data. In the case for FCCI material models being applied to MFF pins, the empirical fit is based on a limited number of EBR-II experiments, with optional scalars to adjust FCCI, as needed, for fitting to other experiments. The error within the empirical BISON material models in combination with uncertainly in reactor operating conditions results in the discrepancies seen between the BISON simulations and PIE measurements.
While this publication is designed to compare and benchmark high-fidelity fuel performance modeling simulations using BISON against known PIE measurements, hot-pressing of U-Pu-Zr fuel presented in this study showed coupled interplay of the different phenomena described in the literature [14]. Implementation of hot-pressing within the fuel matrix allowed for a better representation of the physics for fission gas swelling and pore collapse, and better agreement with axial fuel swelling without overpredicting profilometry due to FCMI. The U-Pu-Zr hot-pressing model demonstrates effectiveness in reducing the amount of over-swelling predicted in BISON by allowing for pores within the fuel matrix to compress when under hydrostatic stress from FCMI and continual swelling from solid fission product buildup. As solid fission product buildup increases over irradiation, porosity from fission gas swelling is allowed to decrease, mitigating the overprediction of cladding strain. The addition of this model allows for BISON to more accurately predict fission gas swelling, and as a result, a better prediction of cladding strain.
The overprediction of cladding strain observed in the upper cladding profilometry peak in MFF-5 pins is likely due to uncertainty within the BISON empirical models, such as FCCI and thermal creep which accelerate cladding strain, and FFTF MFF irradiation conditions. The FCCI empirical model to thin the cladding by using damage mechanics is derived from experimental data from EBR-II experiment X447/X447A. The pins within these experiments were irradiated to an average burnup of ~8.5 at. % burnup, similar to MFF-5 burnup values. However, peak cladding temperatures simulated within MFF-5 cladding were similar to peak cladding temperatures measured in EBR-II X447/447A. Peak cladding strains within EBR-II X447A pins were 1.88%, with MFF-5 pins having a maximum cladding strain of 0.44% [10]. Examining the cladding profilometry of MFF-5 pins, the experimental data suggest that MFF-5 pins operated at lower cladding temperatures to produce the lower amounts of strain seen within Figure 7. This conclusion was drawn due to EBR-II X447/X447A having similar burnup values to MFF-5 pins, and MFF-5 pins containing less cladding strain compared to the EBR-II counterparts.

6. Conclusions

Eight FFTF MFF pins were modeled with the BISON fuel performance code to assess PIE axial swelling height, cladding profilometry, burnup, and fission gas measurements. MFF experiments were designed to provide qualification data for the FFTF Series 3.b metal fuel type for potential use as driver fuel in FFTF. The two MFF experiments analyzed, MFF-3 and MFF-5, operated at high peak cladding temperatures to simulate 2-sigma operating temperatures. FFTF fuel pins were typically three times longer than EBR-II’s. The higher fuel and cladding temperatures required incorporation of FCCI effects in the performance model. In addition to FCCI, hot-pressing of the U-Pu-Zr fuel matrix was implemented to reduce the amount of overpredicted cladding strain and axial fuel growth in BISON. Each of these material models were found to significantly improve BISON predictions with PIE measurements, limiting the axial growth of the fuel and cladding strain. Uncertainty within the BISON material models and FFTF MFF irradiation data led to discrepancies between the BISON simulations and PIE measurements, with future uncertainty analysis planned. Fuel axial swelling was overpredicted within the BISON simulations for MFF-3, and underpredicted axial fuel swelling for MFF-5 pins. The explanation as to why the axial fuel height decreases over burnup is hypothesized to be related to zirconium redistribution within the fuel matrix, causing the fuel Young’s modulus and Poisson’s ratio to decrease and the fuel to become more malleable. FGR, FGP, and FGC for the BISON simulations were in agreement with IMIS predictions; the few fission gas measurements provided for MFF pins were significantly over- and underpredicted. The SEE values for MFF-3 pins were comparable with previous works, while SEE values were higher for MFF-5 pins, as BISON overpredicted cladding thermal creep and FCCI. Using FFTF MFF irradiation conditions allows for full-length U-Pu-Zr rods to be modeled within BISON, to be validated by comparing simulation results to PIE measurements. As more PIE measurements become available of FFTF MFF pins, more benchmarking cases may be performed to evaluate BISON material models used to evaluate EBR-II fuel pins.

Author Contributions

Conceptualization, K.M.P.; Methodology, K.M.P.; Software, K.M.P.; Validation, K.M.P.; Formal analysis, K.M.P.; Investigation, K.M.P.; Resources, K.M.P.; Data curation, K.M.P., M.G., D.W. and D.P.; Writing—original draft, K.M.P.; Writing—review & editing, K.M.P., M.G., P.M. and D.P.; Visualization, K.M.P.; Supervision, K.M.P., P.M. and D.P.; Project administration, P.M. and D.P.; Funding acquisition, P.M. and D.P. All authors have read and agreed to the published version of the manuscript.

Funding

This work was funded by the Office of Nuclear Energy under DOE Idaho Operations Office Contract DE-AC07-051D14517 as part of a Nuclear Science User Facilities experiment.

Data Availability Statement

The raw/processed data required to reproduce these findings cannot be shared at this time due to export control.

Acknowledgments

I would like to acknowledge Adam X. Zabriskie, Stephen R. Novascone, Nancy J. Lybeck, Aaron Oaks, Kun Mo, and Abdellatif Yacout for providing review input, knowledge, and experimental data.

Conflicts of Interest

The authors declare no conflict of interest.

Disclosure Statement

This manuscript has been authored by Battelle Energy Alliance, LLC under Contract No. DE-AC07-05ID14517 with the U.S. Department of Energy. The United States Government retains and the publisher, by accepting the article for publication, acknowledges that the United States Government retains a nonexclusive, royalty-free, paid-up, irrevocable, world-wide license to publish or reproduce the published form of this manuscript, or allow others to do so, for United States Government purposes.

Abbreviations

ANL Argonne National Laboratory
BOC Beginning of Cycle
EBR-II Experimental Breeder Reactor-II
EFPD Effective Fuel Power Day
EOC End of Cycle
FCCI Fuel-cladding Chemical Interaction
FCMI Fuel-cladding Mechanical Interaction
FFTF Fast-Flux Test Facility
FGC Fission Gas Collected
FGP Fission Gas Produced
FGR Fission Gas Release
FIPD Fuels Irradiation and Physics Database
GLASS Germanium-Lithium Argon Scanning System
IMIS Integral fast Reactor (IFR) Materials Information System
INL Idaho National Laboratory
LHGR Linear Heat Generation Rate
PIE Post-Irradiation Examination
PNNL Pacific Northwest National Laboratory
SEE Standard Error of the Estimate
SFR Sodium-cooled Fast Reactor
VTR Versatile Test Reactor

References

  1. Oaks, A.; Mo, K.; Mohamed, W.; Yacout, A. Development of FIPD: The EBR-II Fuels Irradiation & Physics Database. In Proceedings of the Top Fuel 2019: Light Water Reactor Fuel Performance Conference, Seattle, WA, USA, 22–27 September 2019. [Google Scholar]
  2. Paaren, K.M.; Gale, M.; Kerr, M.J.; Medvedev, P.G.; Porter, D.L. Initial demonstration of Automated fuel performance modeling with 1977 EBR-II metallic fuel pins using BISON code with FIPD and IMIS databases. Nucl. Eng. Des. 2021, 382, 111393. [Google Scholar] [CrossRef]
  3. Yacout, A.M.; Oaks, A.; Mohamed, W.; Mo, K. FIPD: EBR-II Fuels Irradiation & Physics Database; Argonne National Lab. (ANL): Argonne, IL, USA, 2017.
  4. Crawford, D.C.; Steven, L.; Powers, J.J. A Proposed Startup Fuel for the Versatile Test Reactor. Trans. Am. Nucl. Soc. 2018, 118, 1565–1566. [Google Scholar]
  5. Pitner, A.L.; Baker, R.B. Metal fuel test program in the FFTF. J. Nucl. Mater. 1993, 204, 124–130. [Google Scholar] [CrossRef]
  6. Wootan, D.W.; Nelson, J.V. Irradiation Data for the MFF-3 and MFF-5 Tests in the FFTF; Pacific Northwest National Laboratory: Richland, WA, USA, 2011.
  7. Laboratory, P.N.N. Fast Flux Test Facility. 2020. Available online: https://beta11.pnnl.gov/projects/fftf (accessed on 30 September 2021).
  8. Crawford, D.C.; Porter, D.L.; Hayes, S.L. Fuels for sodium-cooled fast reactors: US perspective. J. Nucl. Mater. 2007, 371, 202–231. [Google Scholar] [CrossRef]
  9. Porter, D.; Mariani, R.D. Archiving EBR-II Metallic Fuel Test Data Using NDMAS to Accelerate Fast Reactor Fuel Qualification; Idaho National Laboratory (INL): Idaho Falls, ID, USA, 2019.
  10. Paaren, K.M.; Black, A.; Lybeck, N.; Mo, K.; Spencer, B.W.; Medvedev, P.; Porter, D. BISON Fuel Performance Modeling Optimization for Experiment X447 and X447A Using Axial Swelling and Cladding Strain Measurements. Nucl. Eng. Des. 2021, 394, 111812. [Google Scholar] [CrossRef]
  11. Galloway, J.D.; Matthews, C. Enhancements to BISON U-Zr Metallic Fuel X447 Example Problem; Los Alamos National Lab. (LANL): Los Alamos, NM, USA, 2016.
  12. Paaren, K.M.; Lybeck, N.; Mo, K.; Medvedev, P.G.; Porter, D.L. Cladding Profilometry Analysis of EBR-II metallic fuel pins with HT9, D9, and SS316 cladding. Energies 2021, 14, 515. [Google Scholar] [CrossRef]
  13. Casagranda, A.; Novascone, S.R.; Zabriskie, A.X. Metallic Fuel Validation Plan. In Summary of Bison Milestones and Activities—NEAMS FY19 Report; Idaho National Laboratory (INL): Idaho Falls, ID, USA, 2019. [Google Scholar]
  14. Ogata, T.; Takeshi, Y. Development and Validation of ALFUS: An Irradiation Behavior Analysis code for Metallic Fast Reactor Fuels. Nucl. Technol. 1999, 128, 113–124. [Google Scholar] [CrossRef]
  15. Harp, J.M.; Porter, D.L.; Miller, B.D.; Trowbridge, T.L.; Carmack, W.J. Scanning electron microscopy examination of a Fast Flux Test Facility irradiated U-10Zr fuel cross section clad with HT-9. J. Nucl. Mater. 2017, 494, 227–239. [Google Scholar] [CrossRef]
  16. Hales, J.D.; Gamble, K.A.; Spencer, B.W.; Novascone, S.R.; Pastore, G.; Liu, W.; Stafford, D.S.; Williamson, R.L.; Perez, D.M.; Gardner, R.J. BISON Users Manual—BISON Release 1.2; Idaho National Laboratory: Idaho Falls, ID, USA, 2015.
  17. Williamson, R.L.; Hales, J.D.; Novascone, S.R.; Pastore, G.; Gamble, K.A.; Spencer, B.W.; Jiang, W.; Pitts, S.A.; Casagranda, A.; Schwen, D.; et al. BISON: A Flexible Code for Advanced Simulation of the Performance of Multiple Nuclear Fuel Forms. Nucl. Technol. 2021, 207, 954–980. [Google Scholar] [CrossRef]
  18. Novascone, S.R.; Casagranda, A.; Medvedev, P.G.; Matthews, C.; Zabriskie, A.X. Summary and Assessment of Metallic Fuel Capabilities in Bison Milestone Report; INL/EXT-18-51399; Idaho National Laboratory: Idaho Falls, ID, USA, 2018.
  19. Kim, A.M.; Soo, Y.; Hayes, S.L.; Hofman, G.L.; Yacout, A. Modeling of constituent redistribution in U-Pu-Zr metallic fuel. J. Nucl. Mater. 2006, 359, 17–28. [Google Scholar] [CrossRef]
  20. Billone, M.C.; Liu, Y.Y.; Gruber, E.E.; Hughes, T.H.; Kramer, J.M. Status of Fuel Element Modeling Codes for Metallic Fuels. In Proceedings of the American Nuclear Society International Conference on Reliable Fuels for Liquid Metal Reactors, Tucson, AZ, USA, 7–11 September 1968. [Google Scholar]
  21. Savage, H. The heat content and specific heat of some metallic fast-reactor fuels containing plutonium. J. Nucl. Mater. 1968, 25, 249–259. [Google Scholar] [CrossRef]
  22. Hofman, G.L.; Billone, M.C.; Koenig, J.F.; Kramer, J.M. Metallic Fuels Handbook; Argonne National Lab. (ANL): Argonne, IL, USA, 2019.
  23. Yamanouchi, N.; Tamura, M.; Hayakawa, H.; Kondo, T. Accumulation of engineering data for practical use of reduced activation ferritic steel: 8%Cr-2%W-0.2%V-0.04%Ta-Fe. J. Nucl. Mater. 1992, 191–194, 822–826. [Google Scholar] [CrossRef]
  24. Banerjee, A.; Raju, S.; Divakar, R.; Mohandas, E. High Temperature Heat Capacity of Alloy D9 Using Drop Calorimetry Based Enthalpy Increment Measurements. Int. J. Thermophys. 2007, 28, 98–108. [Google Scholar] [CrossRef]
  25. Leibowitz, L.; Blomquist, R.A. Thermal conductivity and thermal expansion of stainless steels D9 and HT9. Int. J. Thermophys. 1988, 9, 873–883. [Google Scholar] [CrossRef]
  26. Mills, K.C. Recommended Values of Thermophysical Properties for Selected Commercial Alloys; Woodhead Publishing: Shaston, UK, 2002. [Google Scholar]
  27. Olander, D.R. Fundamental Aspects of Nuclear Reactor Fuel Elements; Technical Information Center, Energy Research and Development Administration: Washington, DC, USA, 1976.
  28. Los Alamos National Laboratory. AFCI Materials Handbook, Materials Data for Particle Accelerator Applications, Chapter 18—Design Properties of HT9 and Russian Ferritic/Martensitic Steels, Rev 6; Los Alamos National Laboratory: Los Alamos, NM, USA, 2014.
  29. GeelHood, K.J.; Porter, I.E. Modeling and Assessment of EBR-II Fuel with the US NRC’s Fast Fuel Performance Code. In Proceedings of the Top Fuel, Prague, Czech Republic, 30 September–4 October 2018; p. 12. [Google Scholar]
  30. Karahan, A. Modeling of Thermo-Mechanical and Irradiation Behavior of Mixed Oxide Fuel for Sodium Fast Reactors; Massachusetts Institute of Technology: Cambridge, MA, USA, 2010. [Google Scholar]
  31. Hofman, G.L.; Walters, L.C.; Bauer, T.H. Metallic Fast Reactor Fuels. Prog. Nucl. Energy 1997, 31, 83–110. [Google Scholar] [CrossRef]
  32. Karahan, A.; Buongiorno, J. A new code for predicting the thermo-mechanical and irradiation behavior of metallic fuels in sodium fast reactors. J. Nucl. Mater. 2010, 396, 283–293. [Google Scholar] [CrossRef]
  33. Briggs, L.L.; Chang, Y.I.; Hill, D.J. Safety Analysis and Technical Basis for Establing an Interim Burnup Limit for Mark-V and Mark-VA Fueled Subassemblies in EBR-II; Argonne National Lab. (ANL): Argonne, IL, USA, 1995.
  34. Everitt, B.S.; Skrondal, A. The Cambridge Dictionary of Statistics, 4th ed.; Cambridge University Press: New York, NY, USA, 2010. [Google Scholar]
  35. Cohen, J. Statistical Power Analysis for the Behavioral Sciences, 2nd ed.; Academic Press: Cambridge, MA, USA, 1988. [Google Scholar]
  36. Matthews, C.; Galloway, J.; Unal, C.; Novascone, S.; Williamson, R. BISON for Metallic Fuels Modelling. In Fast Reactors and Related Fuel Cycles: Next Generation Nuclear Systems for Sustainable Development FR17 2017; International Atomic Energy Agency: Vienna, Austria, 2018. [Google Scholar]
  37. Galloway, J.D. Fully-Coupled Metallic Fuel Performance Simulations Using BISON, LA-UR-15-26773; Los Alamos National Lab. (LANL): Los Alamos, NM, USA, 2015.
  38. Matthews, C.; Unal, C. Initial Implementation of a Bubble-Surface Force-Balance Fission Gas Behavior Algorithm for Metallic Nuclear Fuel into BISON, LA-UR-19-31814; Los Alamos National Lab. (LANL): Los Alamos, NM, USA, 2019.
Figure 1. Beginning of Life Temperature profiles for MFF-3 and MFF-5 pins for fuel (left) and cladding (right), with radial axes scaled ×50. These simulations show the temperature similarities between MFF-3 and MFF-5 before FCMI occurs. Although MFF-5 had a less overall burnup, operation temperatures later in life were higher than MFF-3, leading to increased creep strain.
Energies 16 07600 g001
Figure 2. Fission power distribution by pin for MFF-3 BOC 10C-3 [6]. The values within Figure 2 should be used in conjunction with each pin location and multiplied by the average assembly power for each cycle in order to produce a unique irradiation history for each pin within the MFF series.
Energies 16 07600 g002
Figure 3. Coupling of BISON variables and material properties.
Energies 16 07600 g003
Figure 4. Typical profilometry profile statistical assessment with SEE [12].
Energies 16 07600 g004
Figure 5. FFTF MFF-3 193045 cladding profilometry.
Energies 16 07600 g005
Figure 6. FFTF MFF-3 193025 cladding profilometry.
Energies 16 07600 g006
Figure 7. FFTF MFF-5 195011 cladding profilometry.
Energies 16 07600 g007
Table 1. FFTF MFF-3 power, flux, and flowrates [6,7]. These values were taken directly from the PNNL reports. Power cycles are the operating cycle of the FFTF reactor, each varying in operation length. Fission power is the total assembly power generated by 169 pins. The fast neutron flux is the average neutron flux within an assembly with energy greater than 0.1 MeV. Flowrate is the mass inlet flowrate of each assembly.
Power CycleFission Power (MW)Fast Flux (n∙cm−2∙s−1)Flowrate (lb∙h1)
B10C-17.942.50 × 1015203,000
E10C-17.722.48 × 1015203,000
B/E10C-27.732.48 × 1015203,000
B10C-37.702.47 × 1015203,000
E10C-37.532.46 × 1015203,000
B/E11A-17.392.48 × 1015202,240
B/E11A-27.412.48 × 1015202,240
B11A-37.272.44 × 1015202,240
E11A-37.002.43 × 1015202,240
B11B-17.012.47 × 1015204,240
E11B-16.772.45 × 1015204,240
B11B-26.642.42 × 1015197,960
E11B-26.312.39 × 1015197,960
B11C6.272.25 × 1015197,790
E11C6.132.41 × 1015197,790
B12A-15.892.31 × 1015193,950
E12A-15.802.31 × 1015193,950
B12A-25.762.30 × 1015193,800
E12A-25.682.30 × 1015193,800
B12B-15.912.43 × 1015195,840
E12B-15.812.42 × 1015195,840
B12B-25.712.39 × 1015195,840
E12B-25.622.39 × 1015195,840
Table 2. FFTF MFF-5 power, flux, and flowrates. These values were taken directly from the PNNL reports. Power cycles are the operating cycle of the FFTF reactor, each varying in operation length. Fission power is the total assembly power generated by 169 pins. The fast neutron flux is the average neutron flux within an assembly with energy greater than 0.1 MeV. Flowrate is the mass inlet flowrate of each assembly.
Power CycleFission Power (MW)Flux (n∙cm−2∙s−1)Flowrate (lb∙h−1)
B11B-17.552.40 × 1015200,400
E11B-17.292.39 × 1015200,400
B11B-27.472.60 × 1015194,240
E11B-27.022.56 × 1015194,240
B11C6.982.62 × 1015194,070
E11C6.792.57 × 1015194,070
B12A-17.132.78 × 1015190,310
E12A-16.932.75 × 1015190,310
B12A-26.982.78 × 1015190,160
E12A-26.792.75 × 1015190,160
B12B-16.872.80 × 1015192,170
E12B-16.682.77 × 1015192,170
B12B-26.702.79 × 1015192,170
E12B-26.522.76 × 1015192,170
Table 3. PIE data for FFTF MFF-3 and MFF-5 pins. Pins denoted with ‘X’ contain the corresponding PIE.
PinBurnupAxial Fuel SwellingCladding ProfilometryMetallographyNeutron RadiographyGamma ScanFission Gas Measurements
193020 XX XX
193025 XX XX
193045XXXXXXX
193062 XX XX
195011XXXXXXX
195012 XX XX
195051 XX XX
195052 XX XX
Table 4. BISON objects used in BISON simulations.
PhenomenonFuel ModelCladding Model
Fuel PhasePhaseUPuZr [19]N/A
Thermal ConductivityThermalUPuZr [20,21]ThermalHT9 [22,23]
ThermalD9 [22,24,25]
Thermal316 [26]
Density (g∙cm−3)15.87.8
BurnupUPuZrBurnup [27]N/A
Fission RateUPuZrFissionRate [16]N/A
Elasticity TensorUPuZrElasticityTensor [22]HT9ElasticityTensor [28]
D9ElasticityTensor [22]
CreepUPuZrCreepUpdate [22]HT9CreepUpdate [22]
D9CreepUpdate [22]
Thermal ExpansionUPuZrThermalExpansionEigenstrain [29]HT9ThermalExpansionEigenstrain [25]
D9ThermalExpansionEigenstrain [22,25]
Gaseous Swelling with Hot-pressing pore collapseUPuZrGaseousEigenstrainwithHotPressingPuswelling [14,27,30]N/A
Fission Gas ReleaseUPuZrFissionGasRelease [31]N/A
Solid SwellingBurnupDependentEigenstrain [14]N/A
Cladding Void SwellingN/AHT9VolumetricSwellingEigenstrain [22]
D9VolumetricSwellingEigenstrain [22]
FCCIN/AMetallicFuelWastage [16]
MetallicFuelWastageDamage [16]
CDFN/AFailureCladHT9 [32]
FailureCladD9 [33]
Table 5. BISON Burnup in atom fraction.
FFTF Fuel PinAverage BurnupPeak Burnup
1930200.1170.137
1930250.1130.132
1930450.1180.139
1930620.1210.142
1950110.0870.102
1950120.0850.100
1950510.0860.101
1950520.0850.100
Table 6. FGP comparison. Pins without fission gas measurements are marked as ‘N/A’ for Not Available.
FFTF Fuel PinBISON Simulation (mol)IMIS Correlation Prediction (mol)FFTF Irradiation Calculation (mol)
1930200.03180.0307N/A
1930250.03120.0300N/A
1930450.03220.03090.0367
1930620.03310.0318N/A
1950110.02370.02320.0354
1950120.02310.0225N/A
1950510.02350.0231N/A
1950520.02330.0229N/A
Table 7. FGC comparison. Pins without fission gas measurements are marked as ‘N/A’ for Not Available.
FFTF Fuel PinBISON Simulation (mol)IMIS Correlation Prediction (mol)FFTF Irradiation Measurement (mol)
1930200.02300.0226N/A
1930250.02250.0220N/A
1930450.02330.02280.0297
1930620.02390.0234N/A
1950110.01710.01710.0208
1950120.01660.0166N/A
1950510.01680.0170N/A
1950520.01670.0168N/A
Table 8. FGR fraction comparison. Pins without fission gas measurements are marked as ‘N/A’ for Not Available.
FFTF Fuel PinBISON SimulationIMIS Correlation PredictionFFTF Irradiation Calculation
1930200.7220.714N/A
1930250.7210.713N/A
1930450.7220.7140.778
1930620.7230.715N.A
1950110.7220.7050.588
1950120.7170.704N/A
1950510.7170.705N/A
1950520.7170.705N/A
Table 9. FFTF MFF-3 and MFF-5 cladding profilometry analysis.
PinPin Average Displacement (cm)STDSEE (cm)Max Strain Difference (cm)Ave Strain Difference (cm)
1930629.85 × 10−41.99 × 10−32.22 × 10−32.77 × 10−38.78 × 10−4
1930458.77 × 10−41.59 × 10−31.82 × 10−3−5.93 × 10−47.84 × 10−4
1930204.77 × 10−41.99 × 10−32.05 × 10−36.82 × 10−43.78 × 10−4
193025−6.84 × 10−41.84 × 10−31.96 × 10⁻³−2.08 × 10⁻³−7.87 × 10⁻⁴
1950121.77 × 10−31.32 × 10−32.21 × 10−35.56 × 10−31.61 × 10−3
1950522.05 × 10−31.54 × 10−32.57 × 10−36.45 × 10−31.93 × 10−3
1950511.85 × 10−31.85 × 10−32.62 × 10−37.38 × 10−31.78 × 10−3
1950112.28 × 10−31.81 × 10−32.91 × 10−38.12 × 10−32.26 × 10−3
Average
Total
1.21 × 10−31.98 × 10−32.32 × 10−33.54 × 10−31.10 × 10⁻³
Total STDN/AN/AN/A3.89 × 10−39.99 × 10⁻⁴
Table 10. Axial fuel swelling lengths.
FFTF Fuel PinBISON (cm)PIE (cm)
19306293.2392.86
19304593.4492.77
19302093.5393.05
19302592.8892.86
19501292.4794.14
19505292.5194.87
19505192.6094.96
19501192.7294.78
Disclaimer/Publisher’s Note: The statements, opinions and data contained in all publications are solely those of the individual author(s) and contributor(s) and not of MDPI and/or the editor(s). MDPI and/or the editor(s) disclaim responsibility for any injury to people or property resulting from any ideas, methods, instructions or products referred to in the content.

