Abstract
This article examines the potential for wind and solar energy generation in the state of Amapá, Brazil, using ERA5 data from between 1991 and 2020. Key metrics considered include wind power density, capacity factor, photovoltaic potential, and concentrated solar power output. Analyses revealed pronounced wind speeds offshore during summer and in continental regions during spring. Solar irradiance was notably higher in the spring. Differences in wind potential were observed between northern and southern offshore areas. Concentrated solar power efficiency and photovoltaic potential were influenced by location and cloud cover, respectively. Overall, summer presents the best offshore wind energy potential, while spring is optimal for onshore solar energy in Amapá. This study underscores the importance of understanding local climatic patterns when planning energy installations in the region.
1. Introduction
Wind and solar energy are two of the most important renewable energy sources in the world today [1]. They offer a clean and sustainable alternative to traditional fossil fuels, which are responsible for a significant amount of greenhouse gas emissions and environmental damage. The history of wind and solar energy dates back to ancient times, when people first used windmills and passive solar designs to harness the power of the wind and the Sun. However, it was only in the 20th century that these technologies began to be widely used for electricity generation. Today, with the urgent need to decarbonize the global energy sector, wind and solar energy play a pivotal role, as they are key technologies for a rapid transition to clean and sustainable energy systems, as highlighted by the recent Special Report of the IPCC on Global Warming of 1.5 °C [2]. The rapid expansion of renewable energies, mainly solar and wind, has been driven by technological improvements, cost reductions, and supportive policies, making them increasingly competitive compared to conventional energy sources [3].
The world is currently facing a complex energy crisis resulting from multiple factors, such as the rapid growth of energy demand, the depletion of fossil energy resources, and the inherent challenges in transitioning to renewable energy sources [4]. The growing global population and the expansion of emerging economies are driving an increase in energy demand, placing significant pressure on non-renewable energy resources such as oil, coal, and natural gas [5]. The consequences of the energy crisis can be seen in the rise in energy prices, electricity shortages, and increased geopolitical tensions over access to energy resources.
Brazil has been a subject of interest, with several significant research studies in this area [6,7,8,9,10,11,12,13]. As highlighted by Coriolano et al. [6], technological evolution has expanded wind energy from its onshore dominance to offshore regions, particularly in countries like Brazil. This interest is fueled by the country’s growing commitment to renewable energy sources and the evident wind energy potential in regions that are dynamically dominated by meteorological phenomena such as the South Atlantic Subtropical High. The expansion of wind energy in Brazil, however, has not been without challenges. As Dantas et al. [7] observed, the implementation of wind farms in the northeastern region of Brazil has led to resistance and opposition movements. The case of Galinhos-RN [7] illustrates the potential for socioeconomic and environmental discrepancies between the projected benefits of wind farms and the realities experienced by local communities. However, the push for renewable energy in Brazil is not limited to onshore efforts. As de Souza et al. [8] emphasized, the country’s extensive exclusive economic zone and diverse climate offer significant potential for offshore wind and solar energy. Their study on the complementarity of offshore wind and solar energy along the Brazilian coastline underscores the potential for these renewable sources to work in tandem, maximizing energy output.
The technical challenges associated with harnessing wind energy are also worth noting. As outlined by do Carmo et al. [9], assessing offshore wind profiles requires intricate methodologies to determine the best scenarios for wind potential. The geological and environmental aspects of potential sites, such as the presence of caverns in the state of Rio Grande do Norte, for example, can pose risks to wind turbine installations, as described by Freitas [11]. Additionally, the evolution of onshore wind turbine foundations in Brazil has been a subject of interest. As Nardelli and Futai [12] pointed out, while wind turbine foundations might be perceived as a well-understood topic globally, the Brazilian context presents unique challenges and solutions. Their research underscores the distinctiveness of Brazilian wind turbine foundations compared to those in other countries. While wind energy presents a promising solution to the global energy crisis, its implementation, particularly in countries like Brazil, requires a nuanced understanding of technical, environmental, and socioeconomic factors. As Nascimento [13] suggests, public policy has played a significant role in promoting wind energy in regions like Bahia, and continued research and policy support will be crucial in ensuring the sustainable growth of this energy source. Research on the performance and interaction of wind farms and the influence of wake behavior in onshore and offshore environments deserves mention. The ocean’s influence on offshore wind farms [14], atmospheric stability and topography [15], and challenges in large offshore wind farms [16] are recent topics that have drawn the attention of the scientific community to improve and advance wind farm technology.
An example of an energy crisis occurred in November 2020 in the state of Amapá, Brazil, where thousands of people were without power for several days [17]. The crisis was caused by a fire at a substation that damaged several transmission lines, causing a blackout that affected 13 out of 16 municipalities in the state [18]. The blackout lasted more than three weeks, with many residents relying on electric generators and suffering from shortages of food, water, and fuel. The population suffered various impacts; the lack of power affected the state’s hydraulic system, hindering the distribution of piped water, bottled water, and ice. Other services affected included internet and telephony services, most of which stopped working, and even with the partial return of electricity, communication remained precarious. Cash machines and card machines were disabled, preventing people from making purchases [19]. With feelings of abandonment and exclusion, the population complained of neglect by the authorities and a sense of exclusion from the rest of the country [20], initiating protest movements that led to episodes of violence, strong police repression, and destruction. This situation was experienced during the peak of the COVID-19 outbreak. The energy crisis highlighted the vulnerability of Brazilian energy infrastructure and the need for better planning and investment in the sector. This case served as a strong reminder of the importance of a resilient and sustainable energy system, both for the population of Brazil and for the global community as a whole. In response to the critical energy and climate situation, various studies have been carried out worldwide [6,7,8,9,10,11,12,13,21,22,23,24,25,26,27,28,29,30,31,32,33,34].
The renewable energy scenario, although rapidly expanding, still has gaps and areas for improvement. Previous studies have extensively covered the growth and potential of renewable energies, especially solar and wind [10,11,12,13,14,15,16,17,18,19,20,21,22,23,24,25,26,27,28,29,30,31]. However, fewer have delved deep into the specific challenges and potential solutions faced by regions like Amapá, Brazil, especially with the urgency of significant energy crises. Furthermore, while many studies have highlighted the general advantages of wind and solar energy, there is a lack of comprehensive studies to identify regions of the Amazon, such as Amapá, with the greatest potential for renewable energy production. This oversight in the existing literature poses a challenge for stakeholders aiming to invest in or improve the renewable energy infrastructure in the region.
Given this context, the primary objective of this study is to bridge this gap. Specifically, this research aims to evaluate the potential of wind and solar energy in the state of Amapá, Brazil, situated in the far north of the Amazon. By utilizing reanalyzed ERA5 data, we aspire to identify regions with optimal potential for wind and solar energy production. In doing so, we hope to provide valuable insights that can guide decisions on planning and investment in renewable energy projects. By focusing on areas with superior potential and conditions, this study advocates for sustainable energy generation, fortifying the state’s energy capacity and furthering the worldwide initiative to mitigate climate change.
2. Methodology
The NREL (National Renewable Energy Laboratory located in Golden, Colorado in United States) 5 MW Reference Wind Turbine (WT-NREL-5WM) was used as a reference for calculations that required a wind turbine power curve. The WT-NREL-5WM is a conceptual project aimed at providing a standard model for wind energy research [35]. Designed to operate in offshore wind conditions, it has a rotor diameter of 126 m, a tower height of 90 m, and a nominal wind speed of 11.4 m/s [35]. The NREL, one of the leading research and development centers for renewable energy technologies in the United States, created this project with the aim of sharing technical information and guidelines with developers, manufacturers, researchers, and academics interested in improving the efficiency, reliability, and competitiveness of wind turbines [36]. The reference turbine has been widely used as a basis for studies and innovations in the field of wind energy, contributing significantly to the advancement of the sector.
2.1. Overview of Study Area
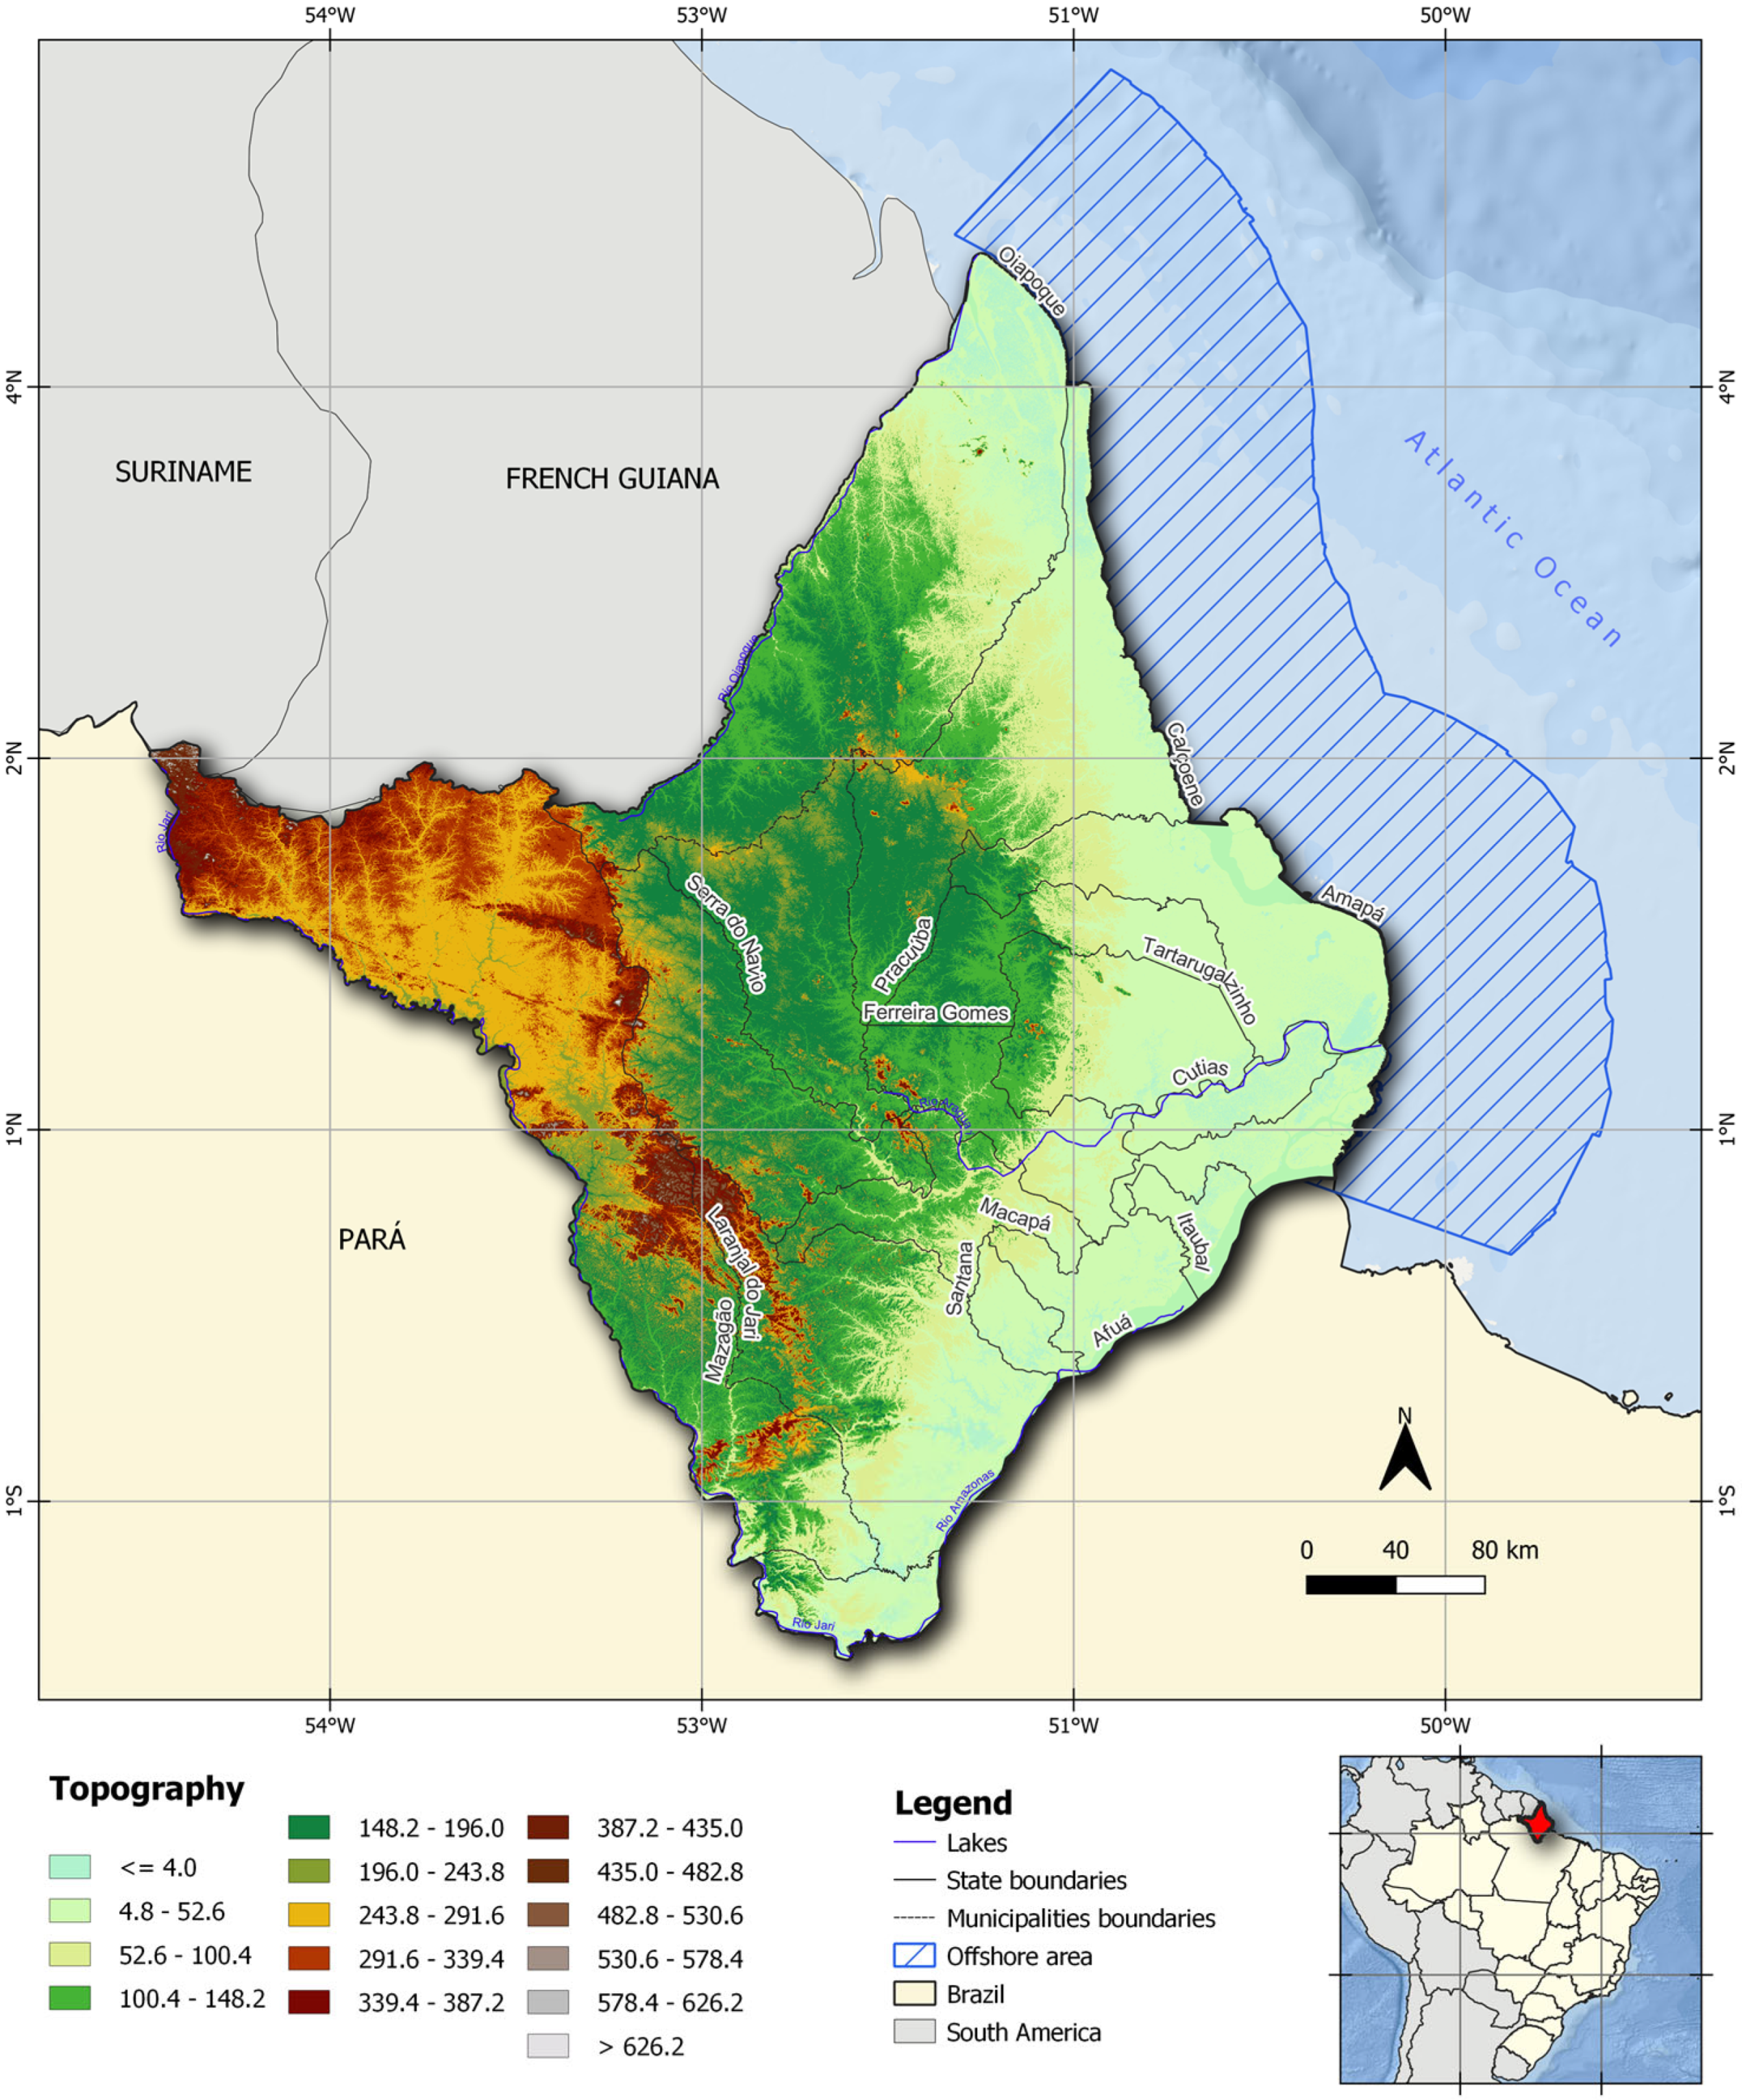
Amapá is a state located in the northernmost region of Brazil, bordered by French Guiana to the north, Suriname to the east, and the Brazilian state of Pará to the south and west. The state covers an area of 142,814 square kilometers and has a population of approximately 845,000 inhabitants, making it one of the smallest and least populous states in Brazil according to the IBGE [37] (Figure 1). Despite its small size, Amapá is known for its rich natural resources and diverse ecosystems, which include vast expanses of tropical forest, rivers, and mangroves. The state is home to several protected areas, including the Tumucumaque Mountains National Park, the largest tropical forest park in the world. The state has abundant natural resources; however, the wind and solar energy potential of the state of Amapá has not been widely discussed in comparison with other states in the country.
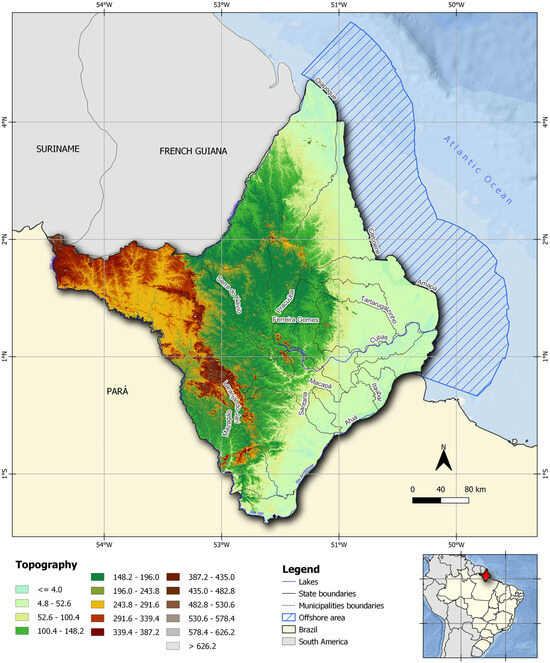
Figure 1.
Location of the state of Amapá, and its topography (meters).
2.2. The ERA5 Reanalysis Dataset
The ERA5 reanalysis dataset is the latest climate dataset from the European Centre for Medium-Range Weather Forecasts (ECMWF) (fifth generation) [38]. Compared to its predecessor, ERA-Interim [39], there are substantial improvements, such as a finer spatial grid (31 km), a higher temporal resolution (every 3 h), an increase in the number of levels (137 levels), and mainly changes in the calculation of atmospheric parameters due to the switch from the IFS Cycle31r2 assimilation system to IFS Cycle41r2. Since 2020, the ERA5 data cover the period from 1950 to the present, with daily updates 5 days behind in real time.
The ERA5 reanalysis dataset is a valuable tool for renewable energy studies, providing comprehensive and reliable meteorological data that can be used to assess the potential of renewable energy sources, and is widely utilized by the scientific community [6,40,41,42,43,44].
One of the main advantages of ERA5 data is their high spatial and temporal resolution, allowing for detailed analysis of renewable energy production potential in specific locations. In this work, we use the following variables:
- Zonal wind component at 100 m (, m/s);
- Meridional wind component at 100 m (, m/s);
- Zonal wind component at 10 m (, m/s);
- Meridional wind component at 10 m (, m/s);
- Downward surface solar radiation (ssrd, J/m2);
- Clear-sky downward surface solar radiation (ssrdc, J/m2)
- Temperature at 2 m (, K);
- Dew point temperature at 2 m (, K);
- Pressure at mean sea level (, Pa);
- Surface pressure (, Pa).
The temporal resolution is hourly for the period from 1991 to 2020, and the spatial resolution is 0.1° × 0.1°. Other variables that needed to be estimated include the wind speed at 100 m (), air density (), virtual temperature (), and vapor pressure (). Since the ERA5 reanalysis already includes the zonal and meridional wind components at 100 m, it was not necessary to extrapolate the wind at 10 m using the logarithmic law (as is usually performed in wind energy studies) [45]. The calculation of wind speed was performed according to the following equation [46]:
Air density is only provided by ERA5 over the oceans; therefore, it needed to be calculated. As exemplified by [44], the density of moist air is computed from the averages of the expression corresponding to dry air if the virtual temperature () is used instead of the actual temperature ( in the equation for the state of dry air. The density of moist air is given by the following equation [47]:
where is approximately 287.058 J K−1kg−1, corresponding to the constant of the mixture of gases that forms dry air. The virtual temperature (K) is calculated by the following formula [47]:
where is the air pressure in millibars, and is the vapor pressure. In this work, the vapor pressure value is also calculated through the following equation [47]:
2.3. Wind Power Density
One of the variables of interest in this study for quantifying the wind potential is wind power density (WPD). WPD is an indicator of available wind power at a given location and height. WPD is defined as the wind’s kinetic power per unit area (W/m2), using air density () and wind speed at 100 m , well established in the literature [48,49,50,51] by the following equation [48]:
2.4. Air Density Normalization
The normalization of wind speed by air density is a fundamental process to ensure an accurate and fair comparison of wind turbine performance under different environmental conditions [45]. Air density directly affects the amount of kinetic energy available in the wind, with power being proportional to the air density, rotor area, and the cube of wind speed [52]. At higher altitudes or warmer temperatures, the air density decreases, thereby reducing the power available in the wind. By normalizing wind speed against air density, engineers and researchers can assess wind turbine performance under different conditions, allowing for a better understanding of the efficiency of wind turbines in different locations and weather conditions [53]. This also helps optimize wind turbine design and choose suitable sites for installation, maximizing efficiency and energy production.
As shown by [42], instead of the usual assumption that emphasizes that the turbine’s energy production is the same at a given wind speed, the corrected assumption involves air density and WPD, assuming that the turbine’s energy production is the same for a constant WPD according to Equation (5). If the constant average air density at the location and the actual air density are 0 and , respectively, and and denote the actual and normalized wind speeds at 100 m, respectively, then the assumption establishes that energy production will be the same if the WPD remains unchanged as per the following equation [54]:
Thus, the normalized wind speed is derived from this expression, and its value was adopted and recommended by IEC 61400-12 [54] according to the following equation:
where is the density of dry air, equal to 1.255 kg/m3, and is the wind speed at 100 m, corrected for standard conditions. After considerable debate, the exponent 1/3 that appears in Equation (7) was adopted in the IEC standard, following the precedent of the IEA (International Energy Agency) [52].
2.5. Capacity Factor
In wind energy, the capacity factor indicates the amount of energy generated by a source relative to the maximum amount of energy that it could provide. Generally, this is determined over the course of a year and indicates the production performance of a wind turbine or wind farm. The closer it is to 1, the higher the generation performance within a given period. It is mathematically expressed by the following equation [46]:
where is the power generated by a turbine; thus, the numerator corresponds to the energy produced per year (in kWh), and the denominator corresponds to the multiplication of (nominal power of the turbine in kW) by the number of hours in one year (8760).
2.6. Photovoltaic Power Potential
The photovoltaic power potential () of a location can be calculated by multiplying two determining factors: the installed capacity, and the photovoltaic power potential, which is a dimensionless magnitude representing the performance of photovoltaic power cells, depending on environmental conditions. The can be estimated using the power rating method or the energy rating method [43]. The power rating method uses the integration of instantaneous photovoltaic energy generation over time, while the energy rating method estimates the photovoltaic potential by multiplying the total solar irradiance during a specific period of time by a performance rate. The addresses the amount of resource available but also the influence that other atmospheric variables may have on the efficiency of the cells, which decreases as the temperature increases [55]. Specifically, we use the expression quantified by [56]:
where Rs is the “Surface Solar Radiation Downwards” from ERA5 (ssrd in W/m2), refers to the standard test conditions (1000 W/m2) under which the nominal capacity of a photovoltaic device is determined, and is the performance ratio, which accounts for changes in the efficiency of photovoltaic cells due to temperature changes [55], according to the following equation [55]:
where is the ambient air temperature at Standard Test Conditions (STC), which is equal to 25 °C, and is equal to −0.005 °C−1, according to the typical response of monocrystalline silicon solar panels, which has been widely adopted in previous studies. is the temperature of the photovoltaic cell, which is affected by (in W/m2), the air temperature near the surface ( in °C), and the wind speed at 10 m ( in m/s) and can be defined as follows [57]:
where = 4.3 °C, = 0.943, = 0.028 °C m2 W−1, and = −1.528 °C s m−1, according to [58]. These parameters are universal and correspond to the average of the coefficients of 6 different technologies (amorphous Si, monocrystalline Si copper, copper indium diselenide, EFG-polycrystalline S, polycrystalline Si, and cadmium telluride), as shown by [57]. This equation has been adopted in various previous studies [40,43,59,60,61,62]. The 3-parameter equation for photovoltaic cell temperature was chosen over the 5-parameter equation, as errors in the measurement accuracy of the parameters (i.e., wind direction and relative humidity) may have a stronger influence on the coefficient values than the two parameters themselves [57].
2.7. Concentrated Solar Power Output
According to [63], concentrated solar power () is one of the most promising technologies that can contribute to the sustainable production of electricity. Essentially, a system is composed of a solar field (concentrator and solar receiver) and a power block (thermal engine and generator). A solar receiver is a device that converts concentrated solar radiation into heat, which drives a thermal engine [63]. Concentrated solar power technology can be divided into four different types based on the collector type, namely, the parabolic trough collector (PTC), solar power tower (SPT), linear Fresnel reflector, and power dish collector. As of December 2019, PTC systems accounted for the majority (76.63%) of installed capacity, justifying the widespread use of PTC technology. Concentrated solar power generation in this study is based on the PTC system, and the equations and coefficients presented apply only to PTCs, not to other types of collectors. Concentrated solar power production () is estimated by the thermal efficiency of concentrated solar power () multiplied by direct irradiance (), as proposed by [64]:
where is the “Surface Solar Radiation Downward, clear sky” from ERA5 (ssrdc in W/m2) and is expressed as a function of ambient temperature (TAS) and [64]:
where the specific collector coefficients are = 0.762, = 0.2125 W∙m−2∙°C−1, and the fluid temperature (Ti) equal to 115 °C, was tested at Sandia National Laboratories for industrial PTC solar technology, as adopted by a series of previous studies [59,65].
3. Results and Discussion
3.1. Air Density Assessment and Power Curve Correction
For the calculations of and , it is necessary to investigate the variability of air density, calculated through Equation (2). The values of depend on air density and wind speed, while requires adjusting the power curve for the region through the values of . Therefore, the analysis of the spatiotemporal variability in air density is summarily necessary.
Figure 2 shows the standard deviation of the air density for the entire hourly time series over 30 years (1991–2020) and highlights the low standard deviation values, with maximum values of 0.005 kg/m3 in the central–west region of the state of Amapá. In the offshore region, even lower values of 0.0028 kg/m3 to 0.003 kg/m3 were observed. The same analysis was carried out considering the different seasons of the year (Figure 3) to ascertain whether different seasonal conditions influence air density. In the context of this study, the reference to seasons pertains specifically to the austral seasons, which correspond to the Southern Hemisphere. Under this classification, summer includes the months of December, January, and February; autumn comprises March, April, and May; winter encompasses June, July, and August; and spring is delineated by the months of September, October, and November. Among the seasons, summer (Figure 3a) is the one that shows the highest standard deviation values in much of the southwestern region of Amapá (above 0.006 kg/m3), and in the far west of Amapá in spring, values around 0.006 kg/m3 are also observed. The results make it clear that there is low variability in air density, as can be confirmed by the annual variability over 30 years (Figure S1, Supplementary Materials), where the values ranged between 1.174 kg/m3 and 1.182 kg/m3. Therefore, it was appropriate to consider a single reference value for the study region, and the average air density of the state of Amapá for the 30 years was equal to 1.17811 kg/m3.
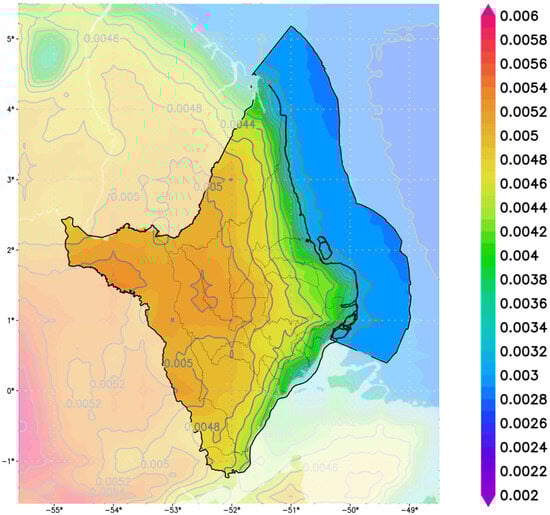
Figure 2.
Spatial distribution of the annual mean standard deviation of air density (kg/m3) over 30 years (1991–2020).

Figure 3.
Spatial distribution of the seasonal mean standard deviation of air density (kg/m3) over 30 years (1991–2020) in (a) summer, (b) autumn, (c) winter, and (d) spring.
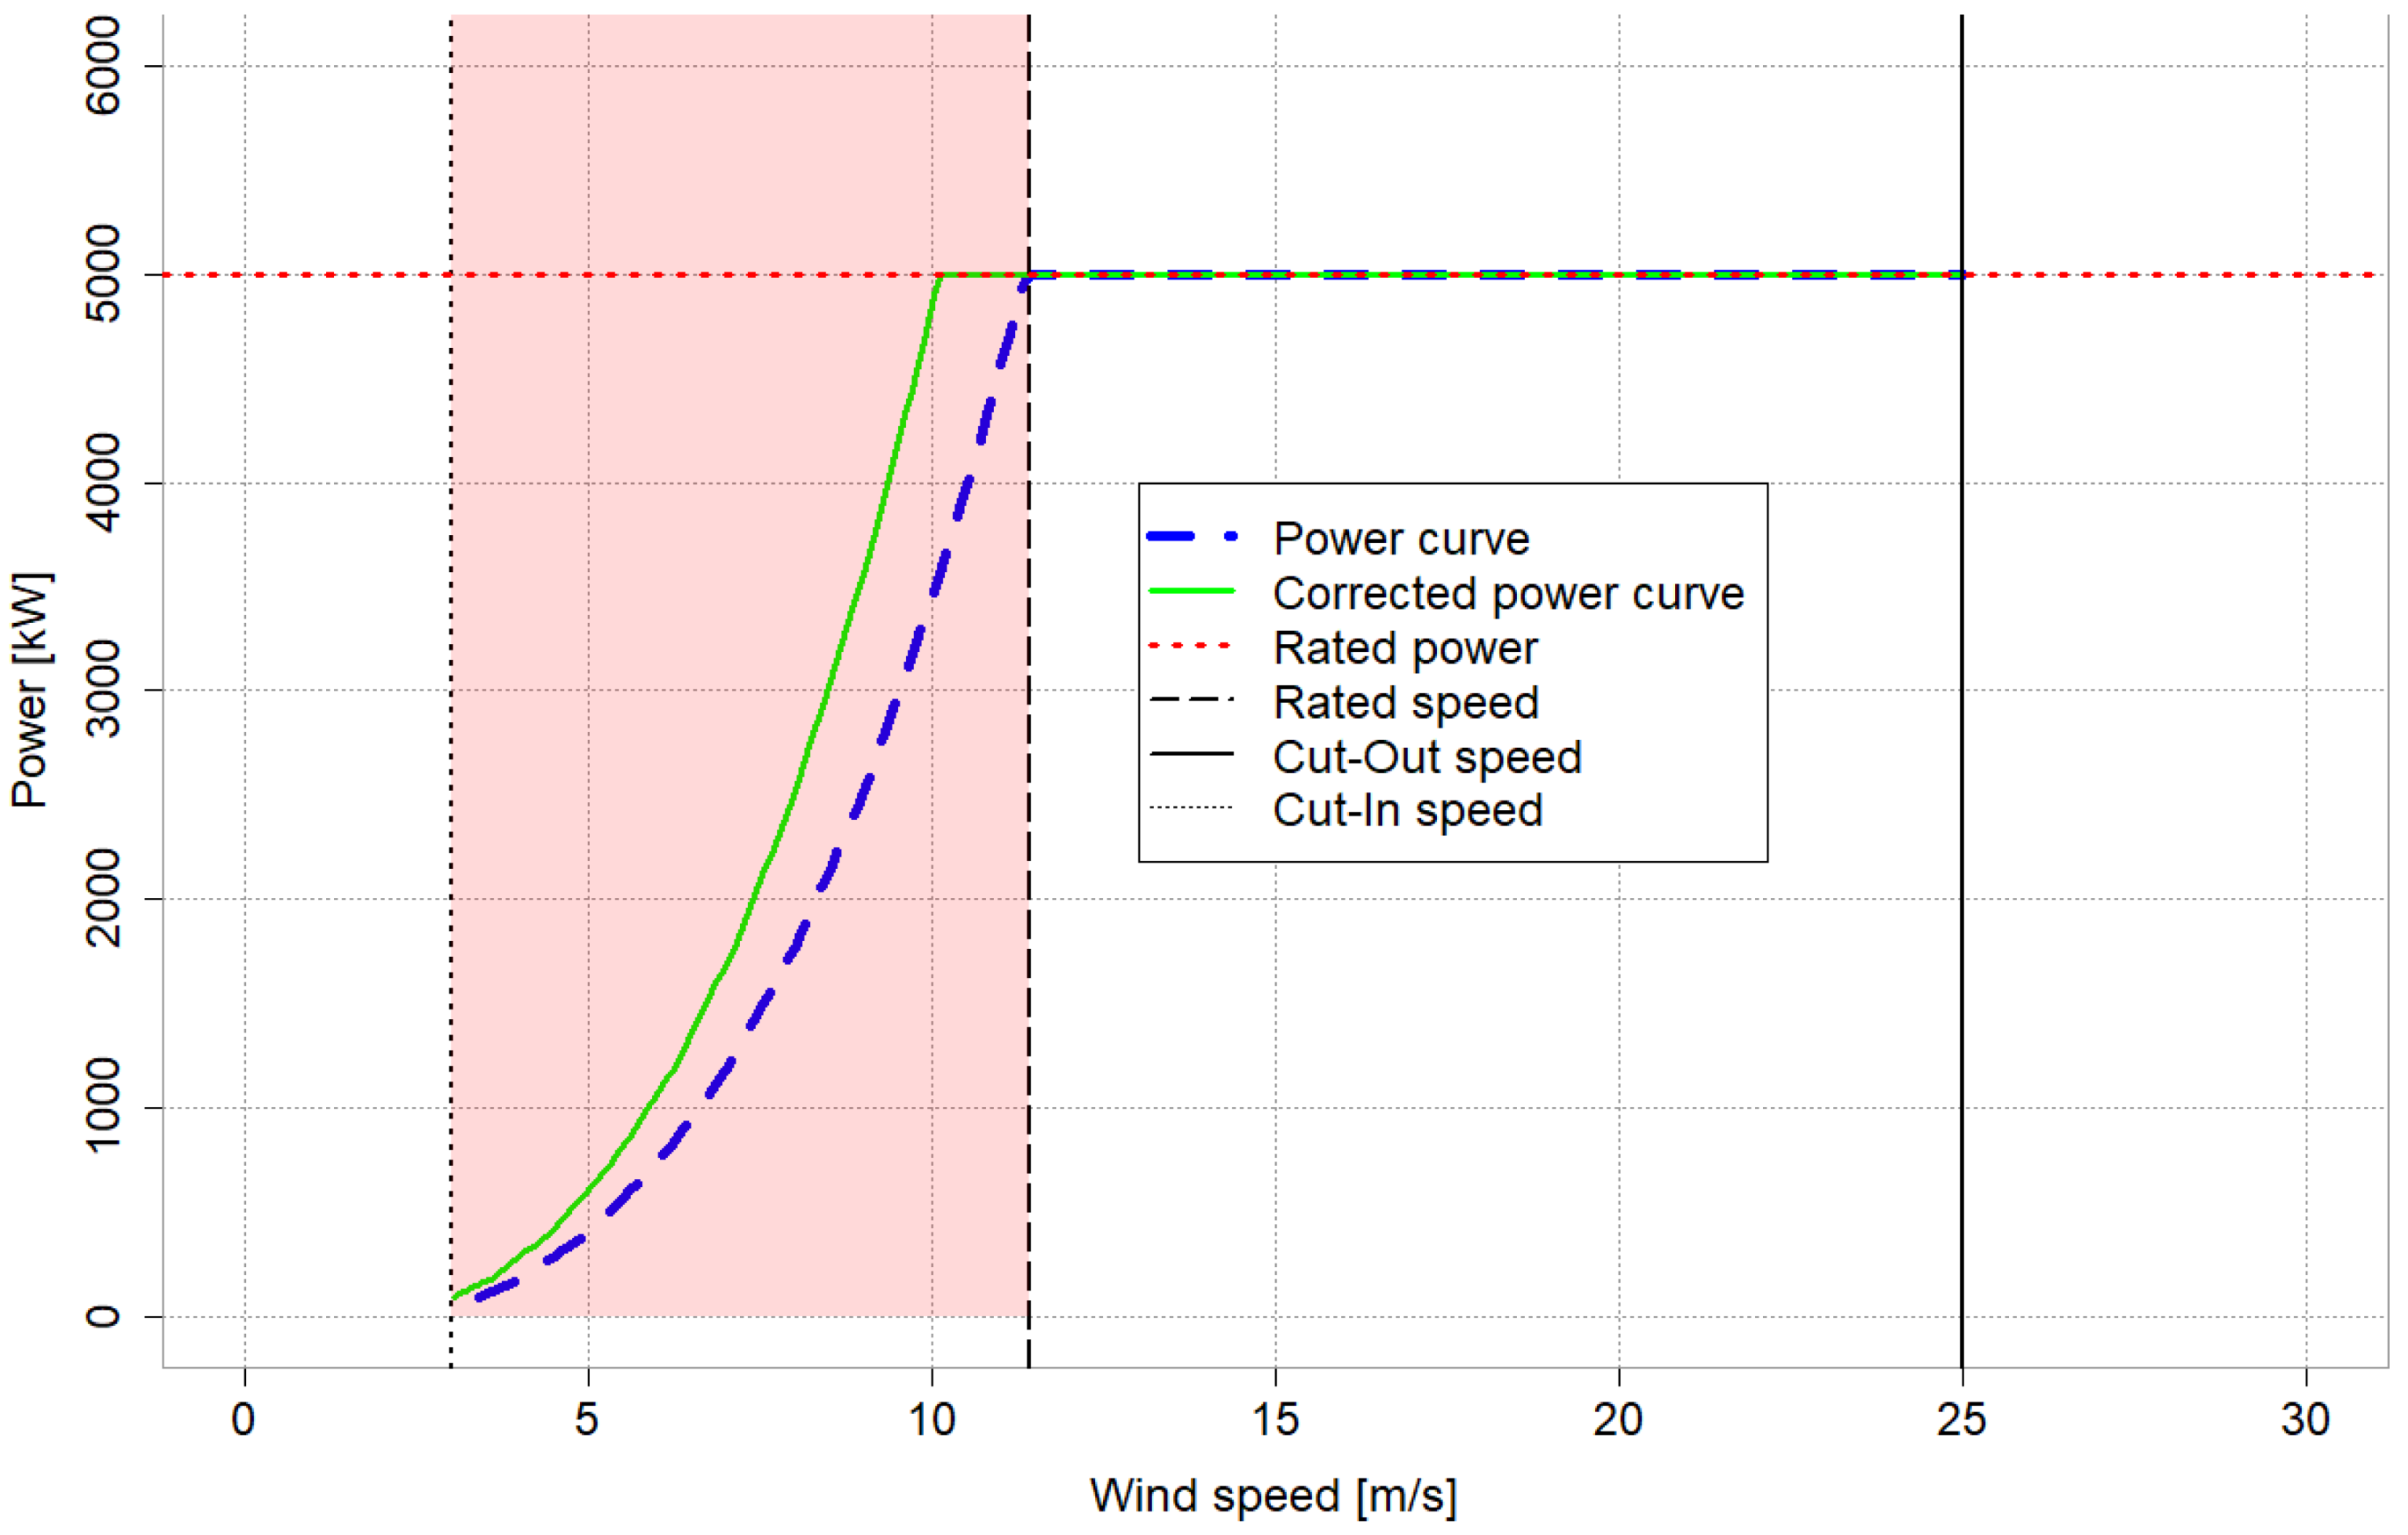
Thus, the power curve was corrected by replacing the usual speeds with the speeds normalized against the calculated air density value for the region (1.17811 kg/m3). In Figure 4, one can observe the power curve (blue line) and the corrected power curve (green line), along with the cut-in speed, cut-out speed, and rated speed (dotted, solid, and dashed black lines, respectively).

Figure 4.
Power curve (blue line) and corrected power curve (green line) of the NREL 5-MW wind turbine. The red area indicates where there has been a change due to the air density correction.
3.2. Variability of Wind Speed and Global Horizontal Irradiance
To analyze the key factors affecting solar and wind energy production, a comprehensive evaluation was conducted on the annual, seasonal, and diurnal variability of two principal variables: global horizontal irradiance, and wind characteristics. Specifically, the study focused on assessing the fluctuations in global horizontal irradiance and the variations in wind speed and direction, both of which play a crucial role in characterizing renewable energy sources.
Figure 5 shows the seasonal spatial mean distribution of wind speed (m/s) at 100 m, and it can be noted that, in the offshore region, the highest wind speeds occurred in the summer (Figure 5a), while the lowest were recorded in the winter (Figure 5c). Over the continent, the highest wind speeds were observed in the spring and the lowest in the winter. This pattern of wind speed and direction in the summer is consistent with the known local atmospheric dynamics. The coast of Amapá represents an inlet for the trade winds, which are drawn into the Amazon due to intense evaporation and condensation. These winds penetrate the interior of the continent, carrying moisture and generating the so-called “flying rivers” responsible for bringing humidity and precipitation to a large part of the South American continent [66,67].
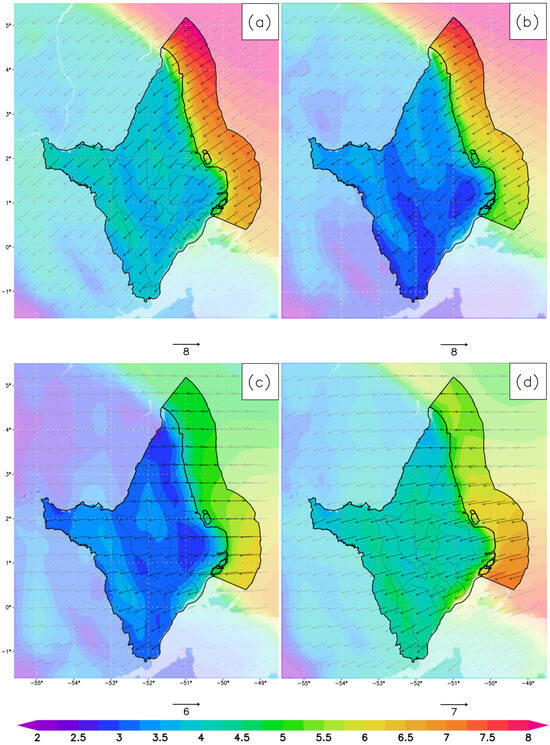
Figure 5.
Spatial distribution of the seasonal mean wind speed (m/s) and direction (arrows) at 100 m over 30 years (1991–2020) in (a) summer, (b) autumn, (c) winter, and (d) spring.
The reason that the spring presents higher wind speeds over the continent is due to the fact that this period has the highest temperatures, due to the absence of cloud cover caused by the Intertropical Convergence Zone (ITCZ) and the increase in the difference in atmospheric pressure between the Atlantic Ocean and the coast of Amapá. These factors intensify the coastal breezes that enter the continent.
Understanding the seasonal variability of winds in the Amapá region has significant implications for wind energy generation, as the efficiency of wind energy systems depends on the availability and consistency of winds. In [68], the authors examined wind speed globally for wind energy applications and showed that, in the Amapá region, the average wind speed values were 4.2 m/s. According to the Global Wind Atlas [69], the average wind speed values in the offshore and onshore regions are 5.5 and 3.7 m/s, respectively.
Figure 6 shows the seasonal variability in the global horizontal irradiance (GHI) (kWh/m2) in the state of Amapá, Brazil. It is notable that spring exhibits the highest values of GHI, approximately between 7 and 8 kWh/m2, and distributed similarly over both the continent and the ocean. On the other hand, the lowest values of GHI on the continent are observed in the autumn.
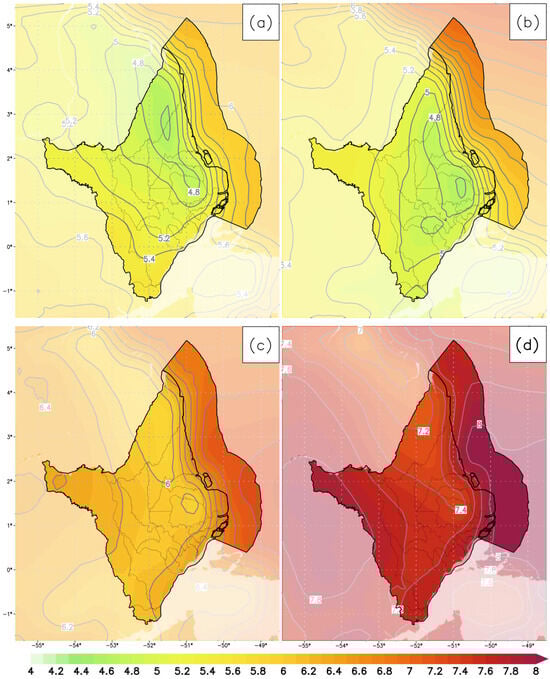
Figure 6.
Spatial distribution of thr seasonal mean global horizontal irradiation (kWh/m2) over 30 years (1991–2020) in (a) summer, (b) autumn, (c) winter, and (d) spring.
In tropical regions, solar radiation is generally higher compared to other areas of the planet. The state of Amapá is crossed by the Equator, meaning that the highest values of incident solar radiation are expected in the equinox months (i.e., March and September), when the Sun passes vertically over the Equator [70]. The marked difference between the seasons in which these two months occur can be explained by the presence of the ITCZ during the autumn. Due to the high concentration of clouds and rain in the ITCZ, the amount of solar radiation reaching the surface is reduced, as clouds reflect and absorb part of the solar radiation, preventing it from reaching the ground. Therefore, the presence of the ITCZ in autumn contributes to the observation of lower GHI values in this season. Compared with the results of the Brazilian Solar Atlas [71], the average values for summer, autumn, winter, and spring are 4.48, 4.38, 4.78, and 5.0 kWh/m2, respectively. It should be noted that the Brazilian Solar Atlas considers the entire North Region of Brazil and not only the state of Amapá.
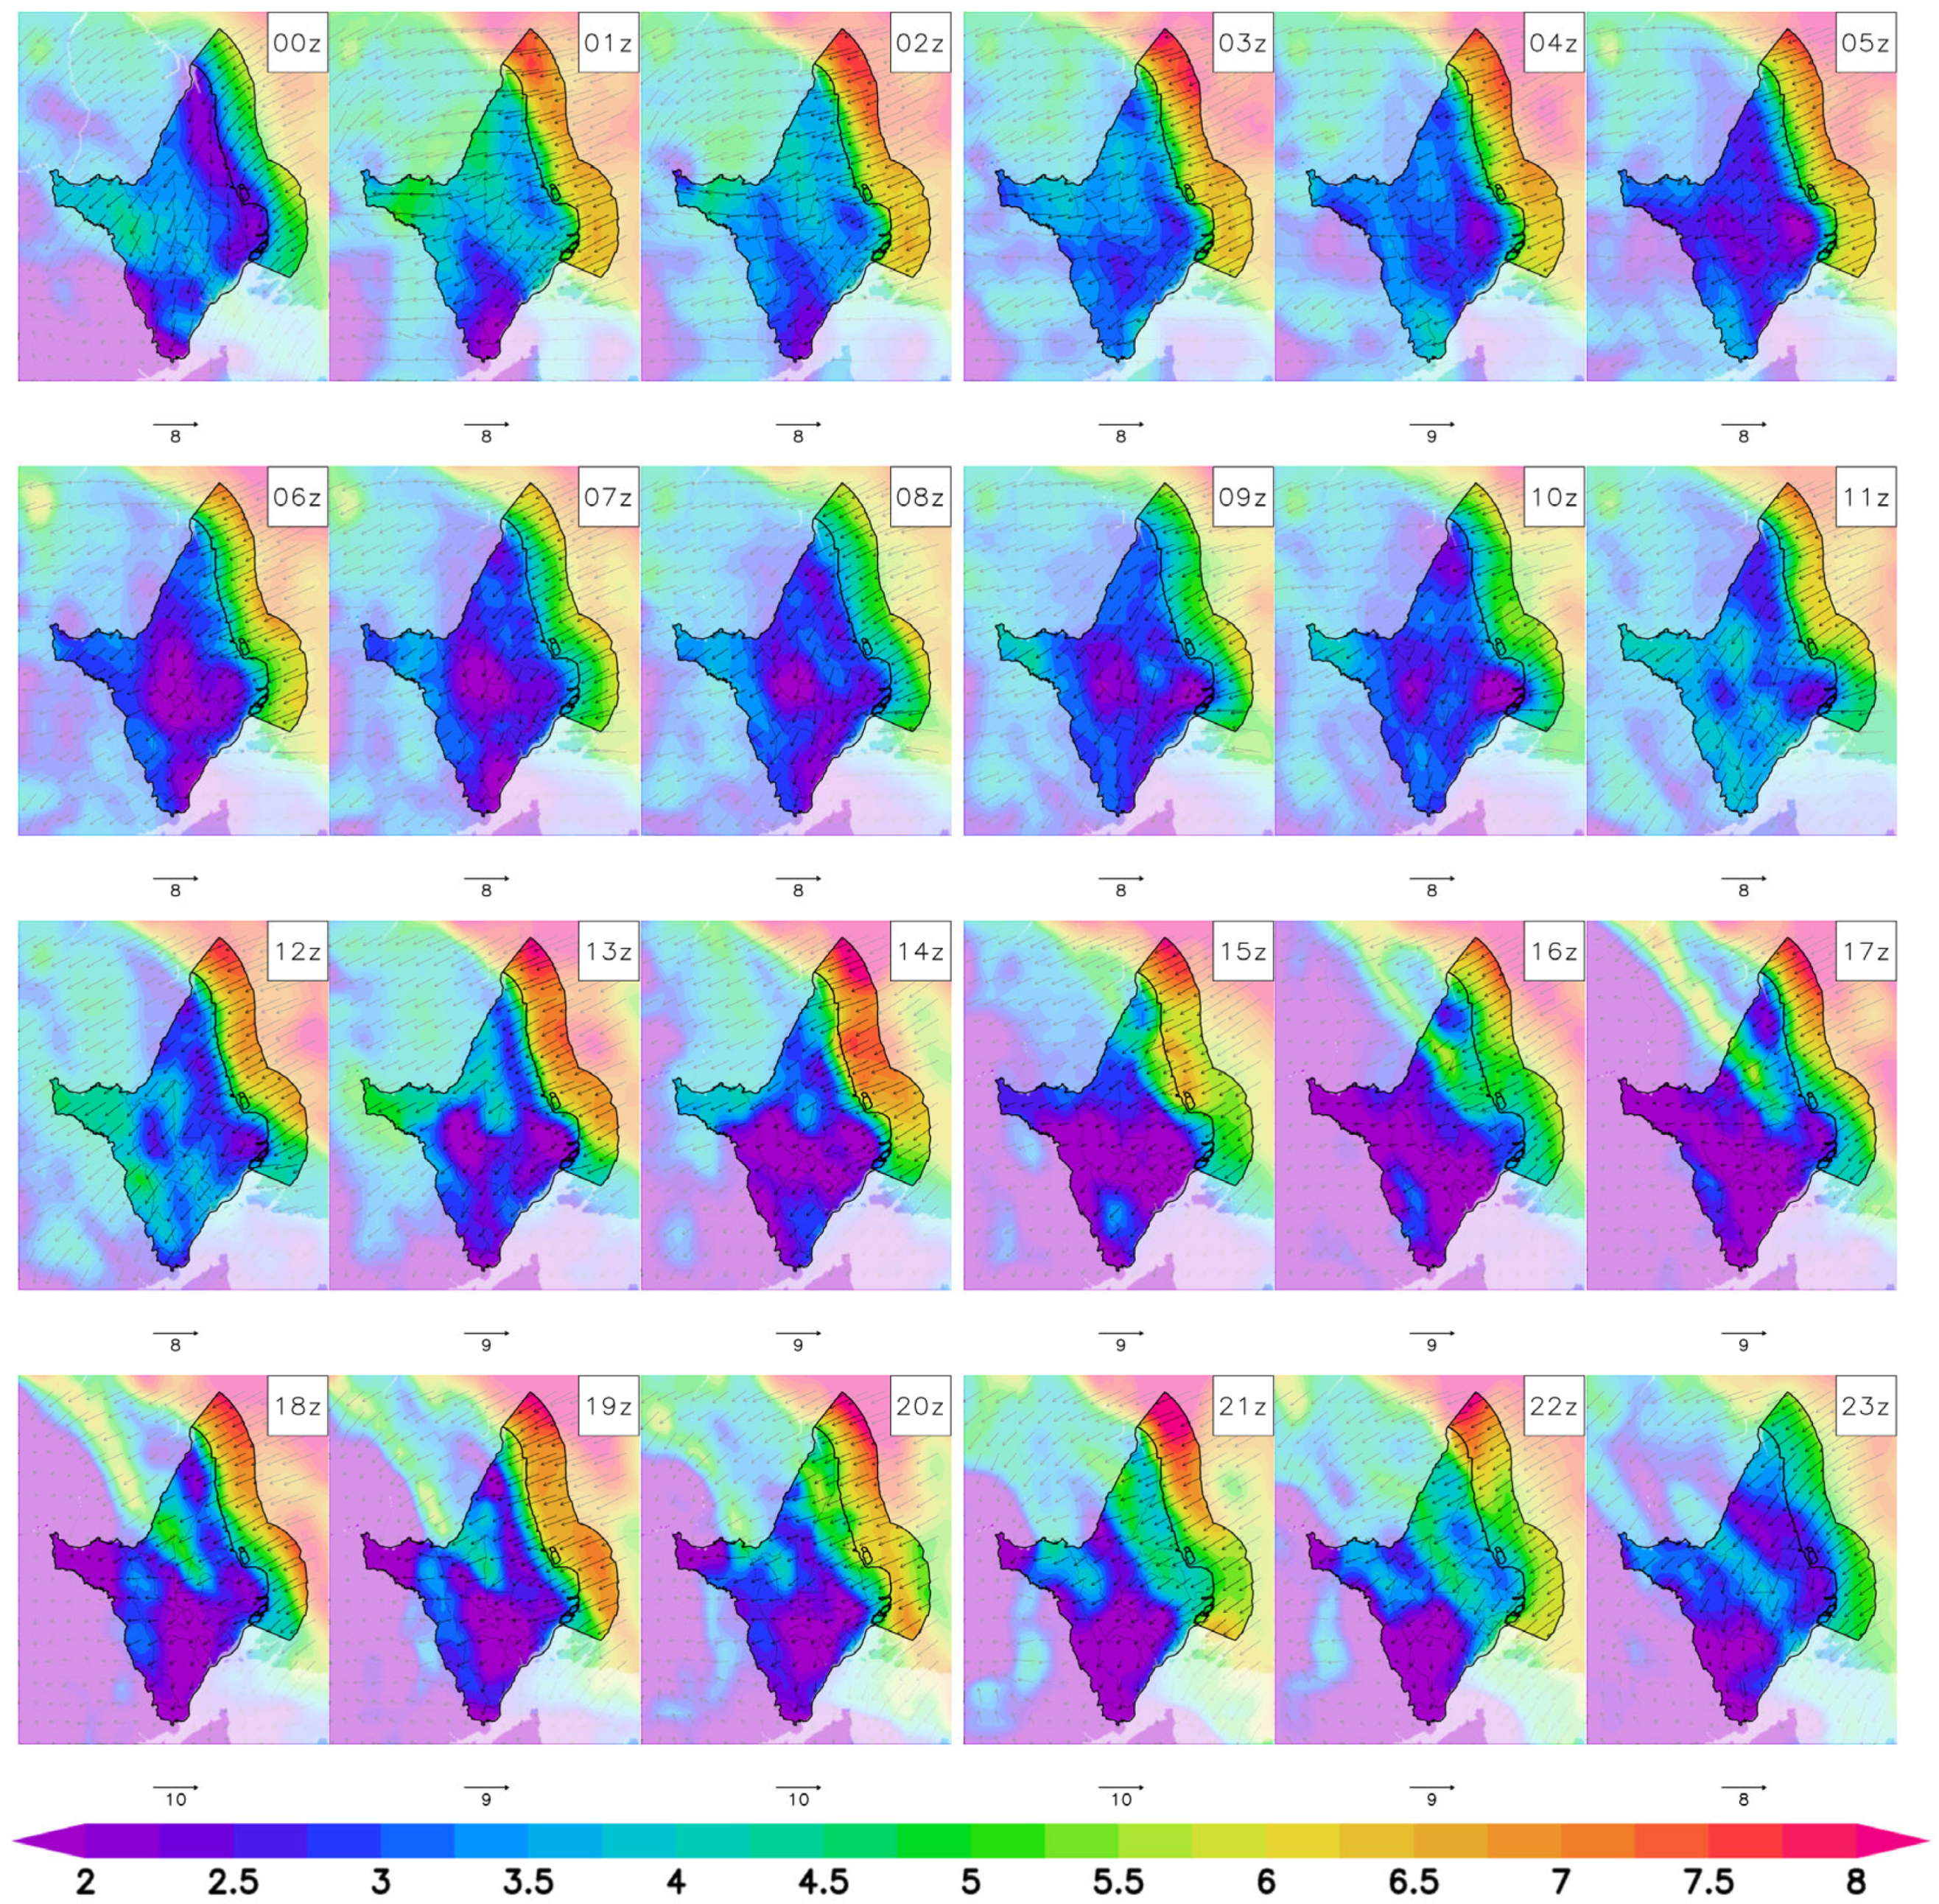
Figure 7 shows the daily average wind speed at 100 m, based on data collected over 30 years. In the northern portion of the offshore region, it can be observed that the highest wind speeds occur in three distinct periods: between 1 h and 3 h UTC (10 p.m. and 12 a.m. LT), from 12 h to 15 h UTC (9 a.m. to 12 p.m. LT), and from 17 h to 22 h UTC (2 p.m. to 7 p.m. LT). Variations in heat transfer between the ocean surface and the atmosphere may be responsible for these peaks in wind speed.
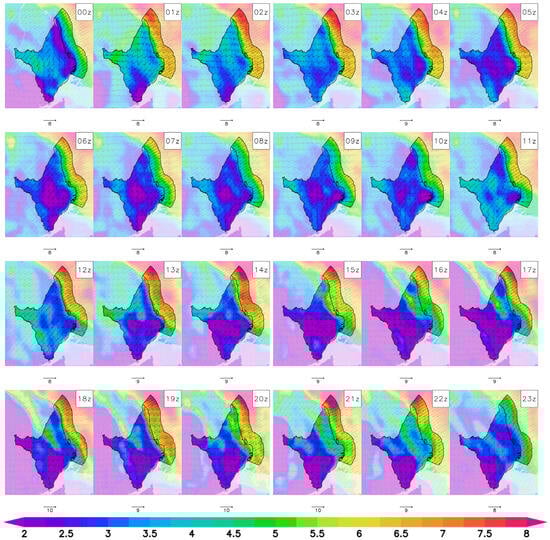
Figure 7.
Spatial distribution of the diurnal mean wind speed (m/s2) and direction (arrows) over 30 years from 00 to 23 UTC.
At night, between 1 h and 3 h UTC (10 p.m. and 12 a.m. LT), the atmosphere tends to cool down, generating a temperature contrast between the ocean surface and the air above it, which drives wind circulation. During the day, particularly between 12 h and 15 h UTC (9 a.m. to 12 p.m. LT) and from 17 h to 22 h UTC (2 p.m. to 7 p.m. LT), solar radiation heats the ocean surface, intensifying heat transfer and the formation of breeze currents, which also contribute to the increase in wind speed.
On the continent, there are noticeable variations in wind speed, especially in the far west of the state, where the pronounced topography influences air circulation. On the Amapá coast, the land breeze begins to have an influence starting at 19 h UTC (4 p.m. LT), when the land cools more quickly than the ocean, reversing the temperature gradient. Previous studies [72] and recent ones [73] show the influence of breezes at great heights, such as 100 m. At all hours, the wind direction remains predominantly from the northeast, due to the strong influence of the trade winds.
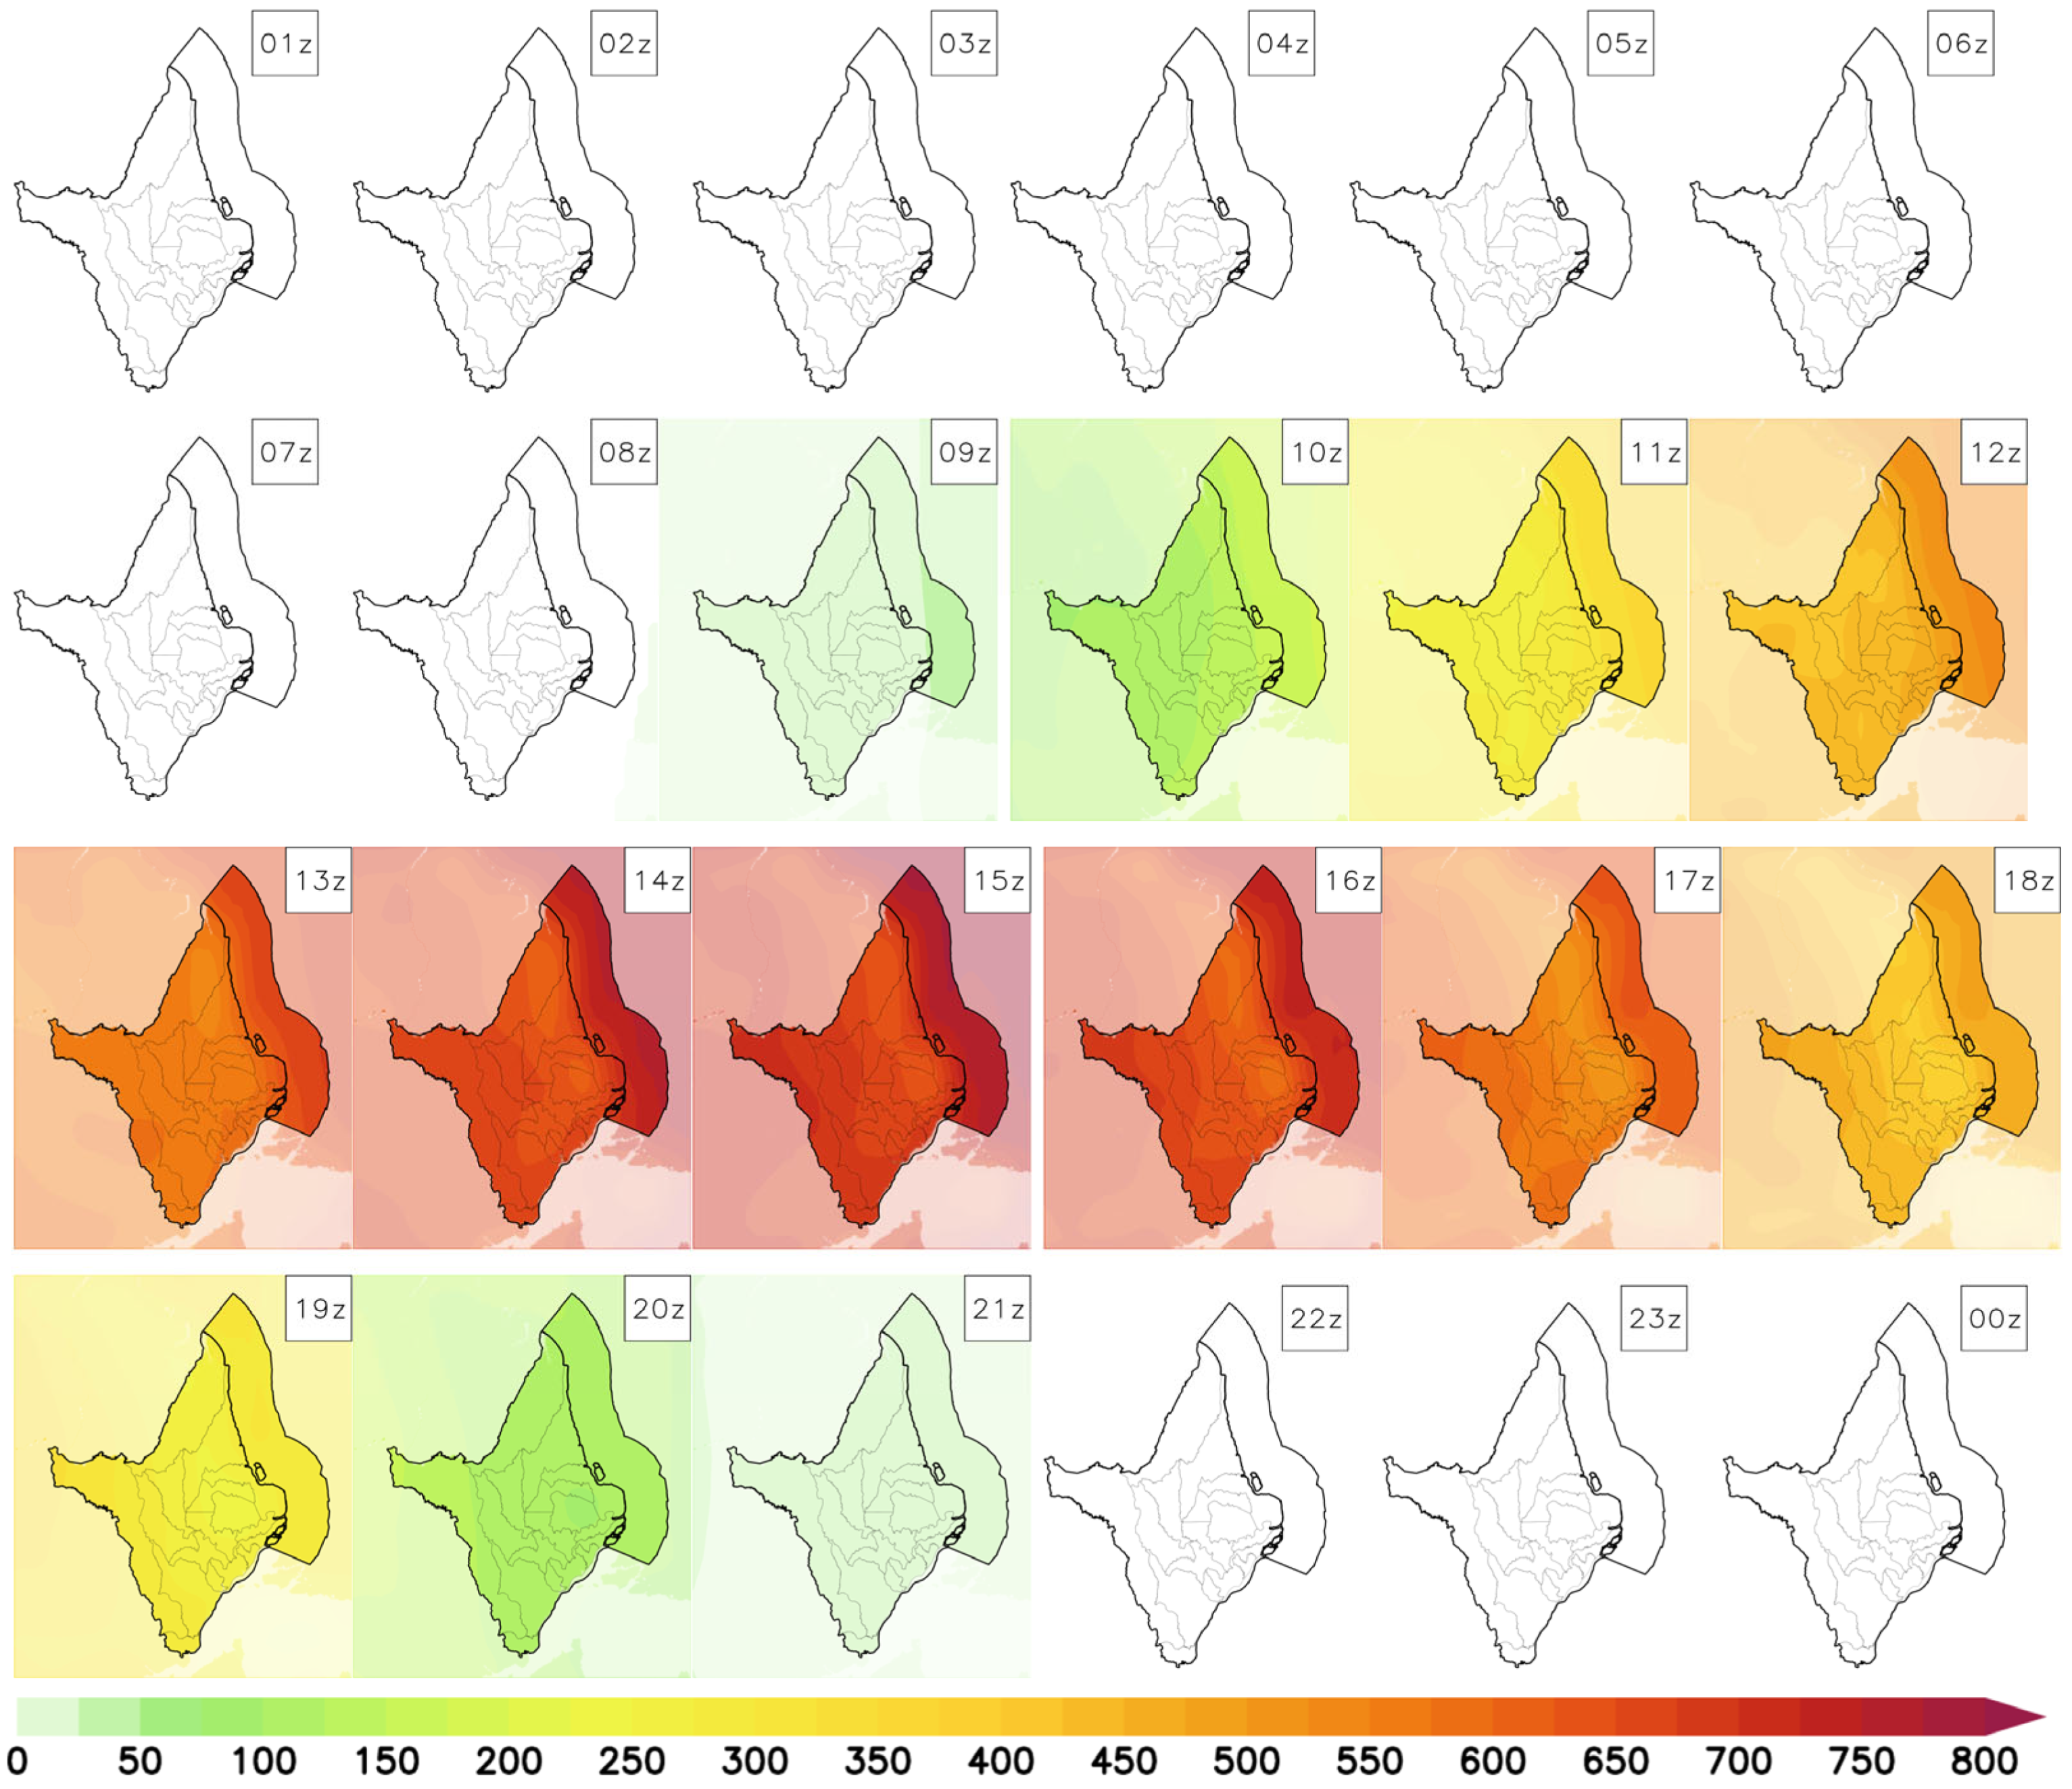
Figure 8 illustrates the hourly average of GHI in W/m2, where the period between 15 h and 18 h UTC (12 p.m. and 3 p.m., LT) stands out with the highest peaks of solar radiation, ranging between 700 and 800 W/m2. During this interval, the Sun reaches its highest position in the sky, leading to a smaller angle of incidence and a greater amount of solar energy absorbed by the surface.
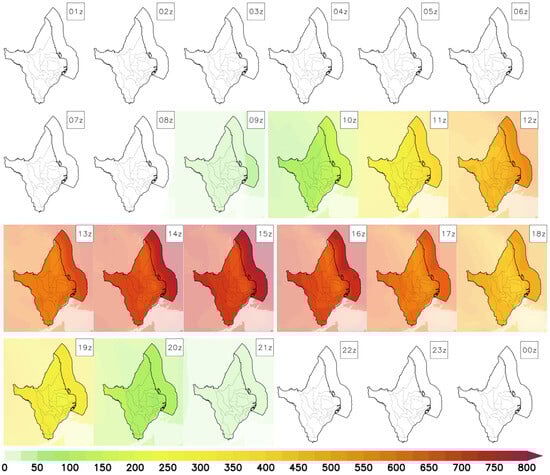
Figure 8.
Spatial distribution of the diurnal mean global horizontal irradiation (Wh/m2) over 30 years from 00 to 23 UTC.
Between 0 h and 10 h UTC (21 h and 7 h, LT), there is no direct sunlight, resulting in an absence of available radiant energy. The positive GHI values recorded at 21 h UTC (18 h, LT) are due to the presence of diffuse and reflected light in the atmosphere and on the Earth’s surface. Although direct sunlight is virtually nonexistent at these times, there is still some amount of diffuse and reflected light during sunset. This light is especially notable at higher latitudes during the summer months and at locations close to the Equator, such as in Amapá, where the days are longer.
3.3. Wind Energy Assessment
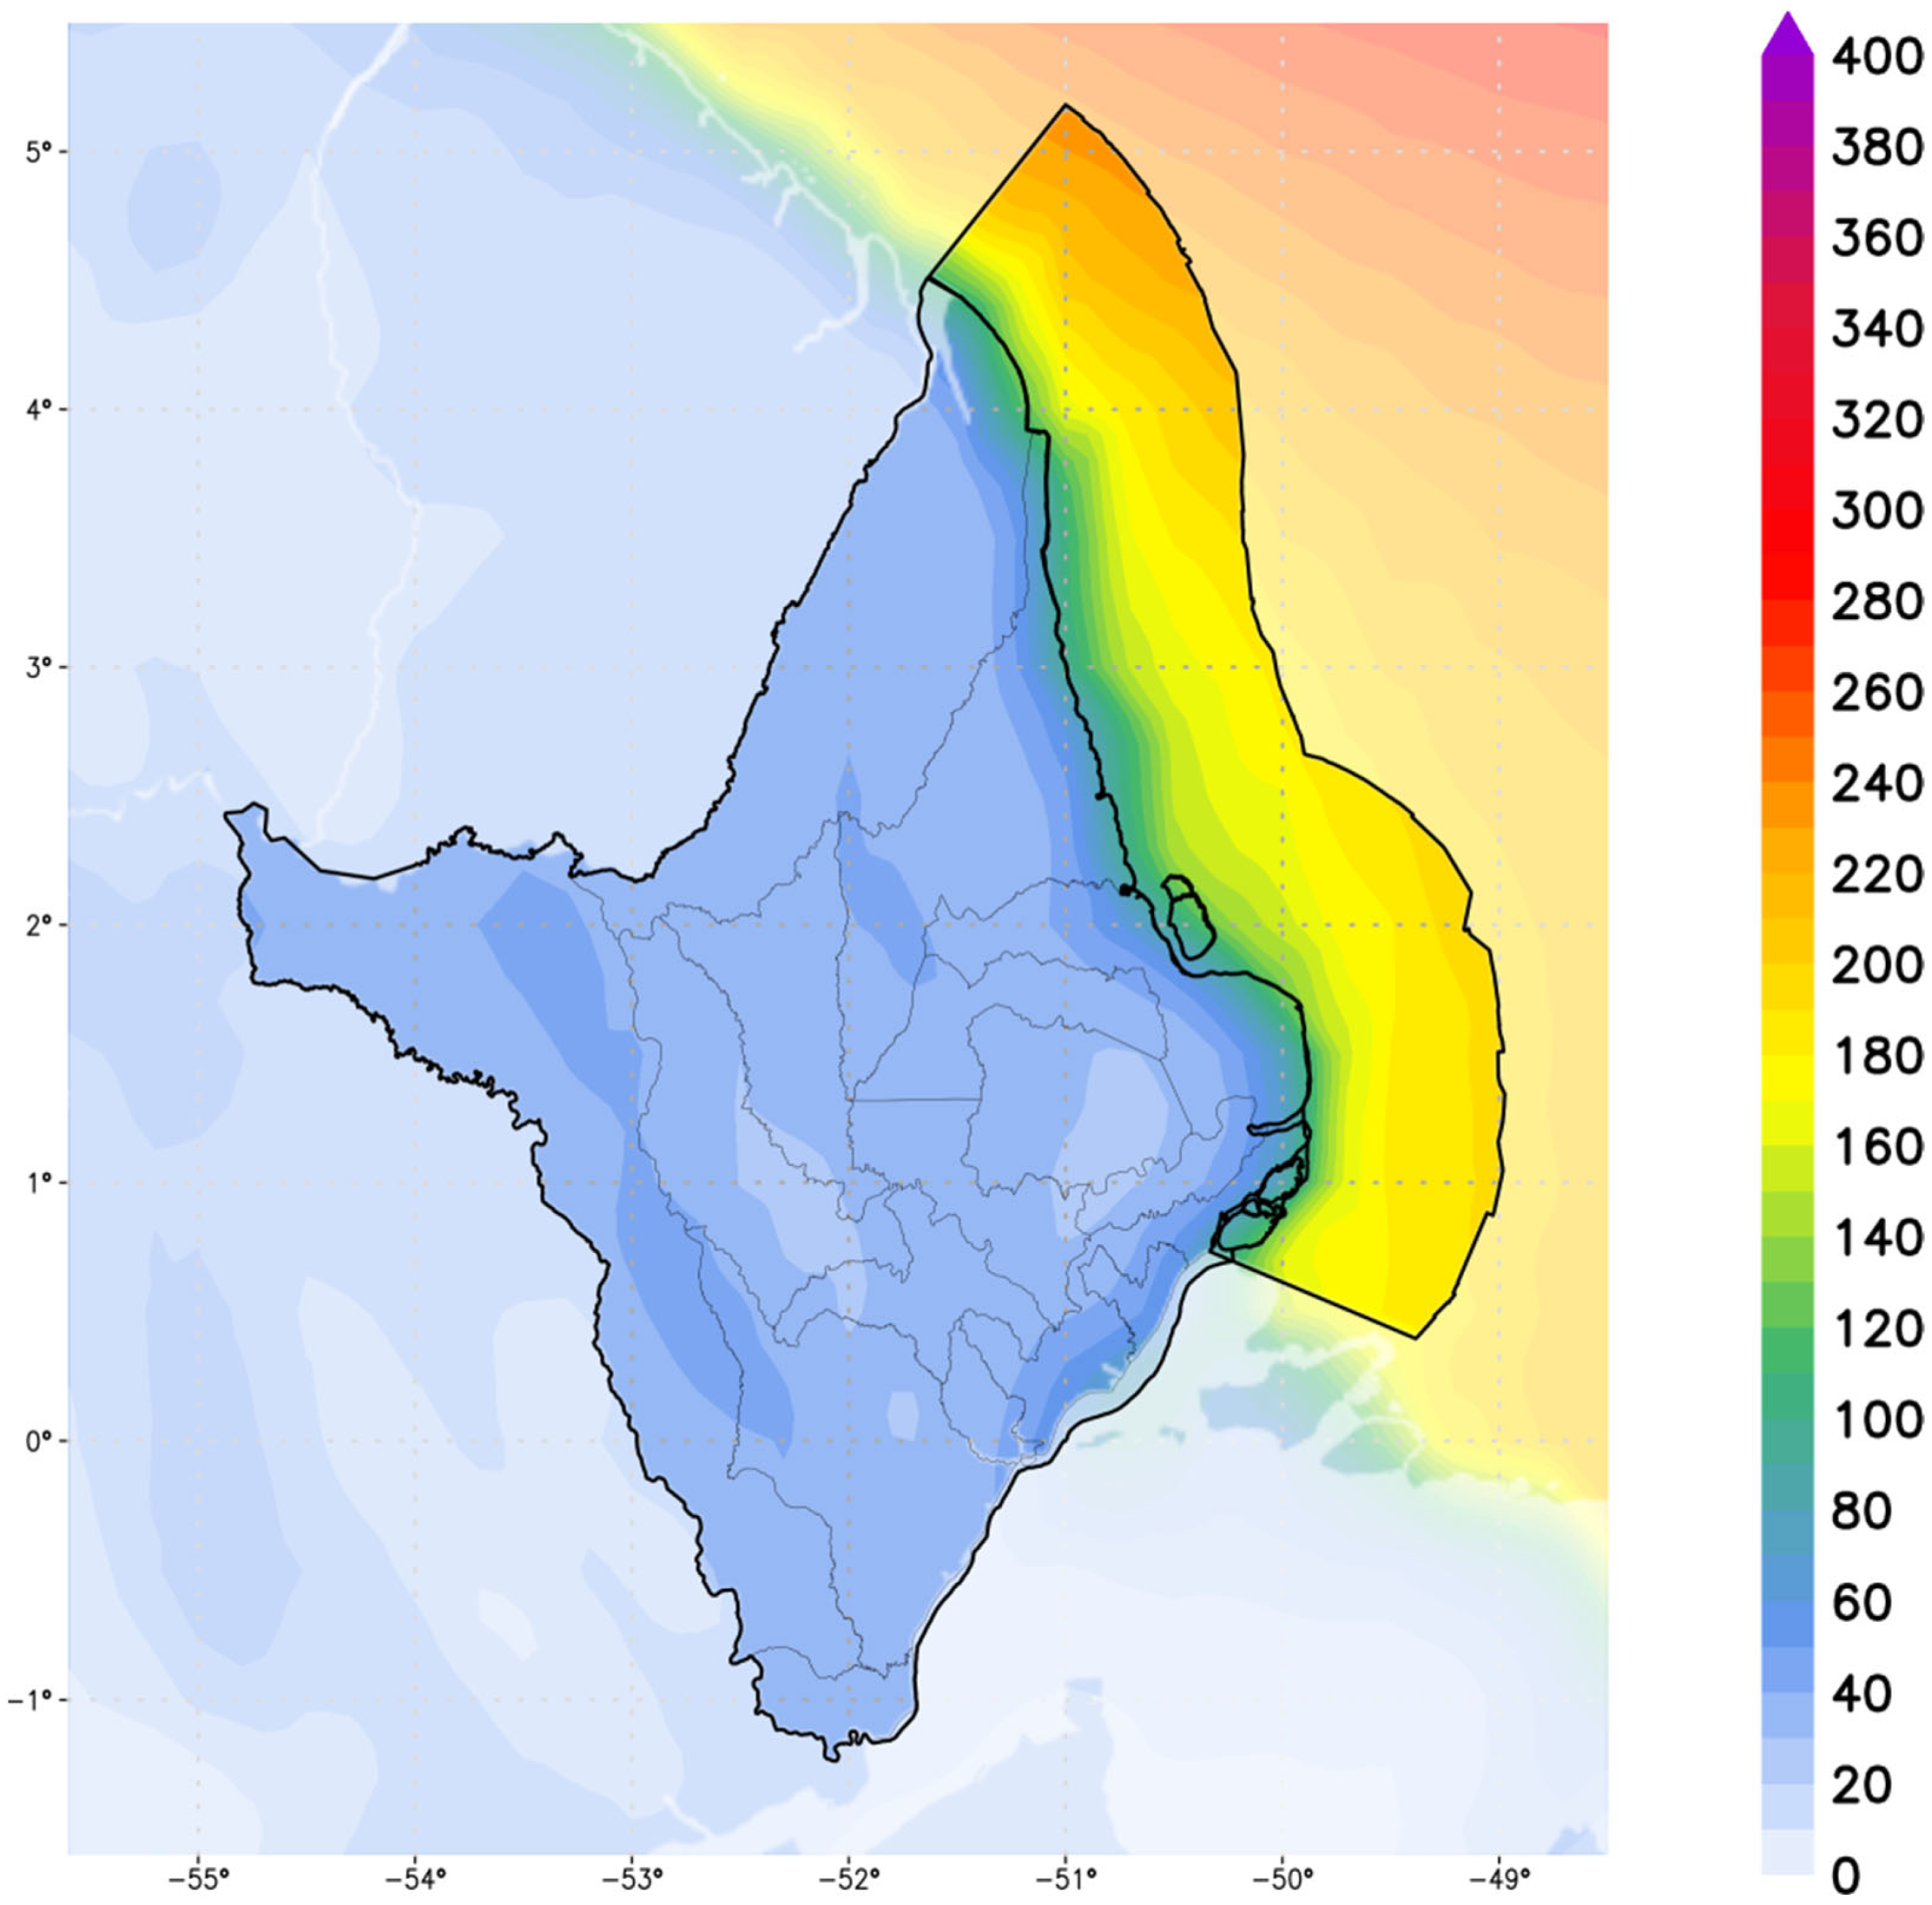
Figure 9 shows the average spatial distribution of WPD over 30 years (1991–2020). The highest values, around 250 W/m2, are found in the extreme north of the offshore region of the state of Amapá, while the lowest values, at less than 60 W/m2, occur across the continent. Along the coast of Amapá, the WPD ranges between 100 and 150 W/m2 and increases to approximately 200 W/m2 as it moves away towards the ocean. Comparatively, the annual average WPD value on the coast of Lebanon ranges from 100 to 225 W/m2 [44], in the Mediterranean Sea the values are around 600 to 800 W/m2 [41], and in China the annual average WPD value is 161.1 W/m2 [74].

Figure 9.
Spatial distribution of the annual mean wind power density (W/m2) over 30 years (1991–2020) in Amapá.
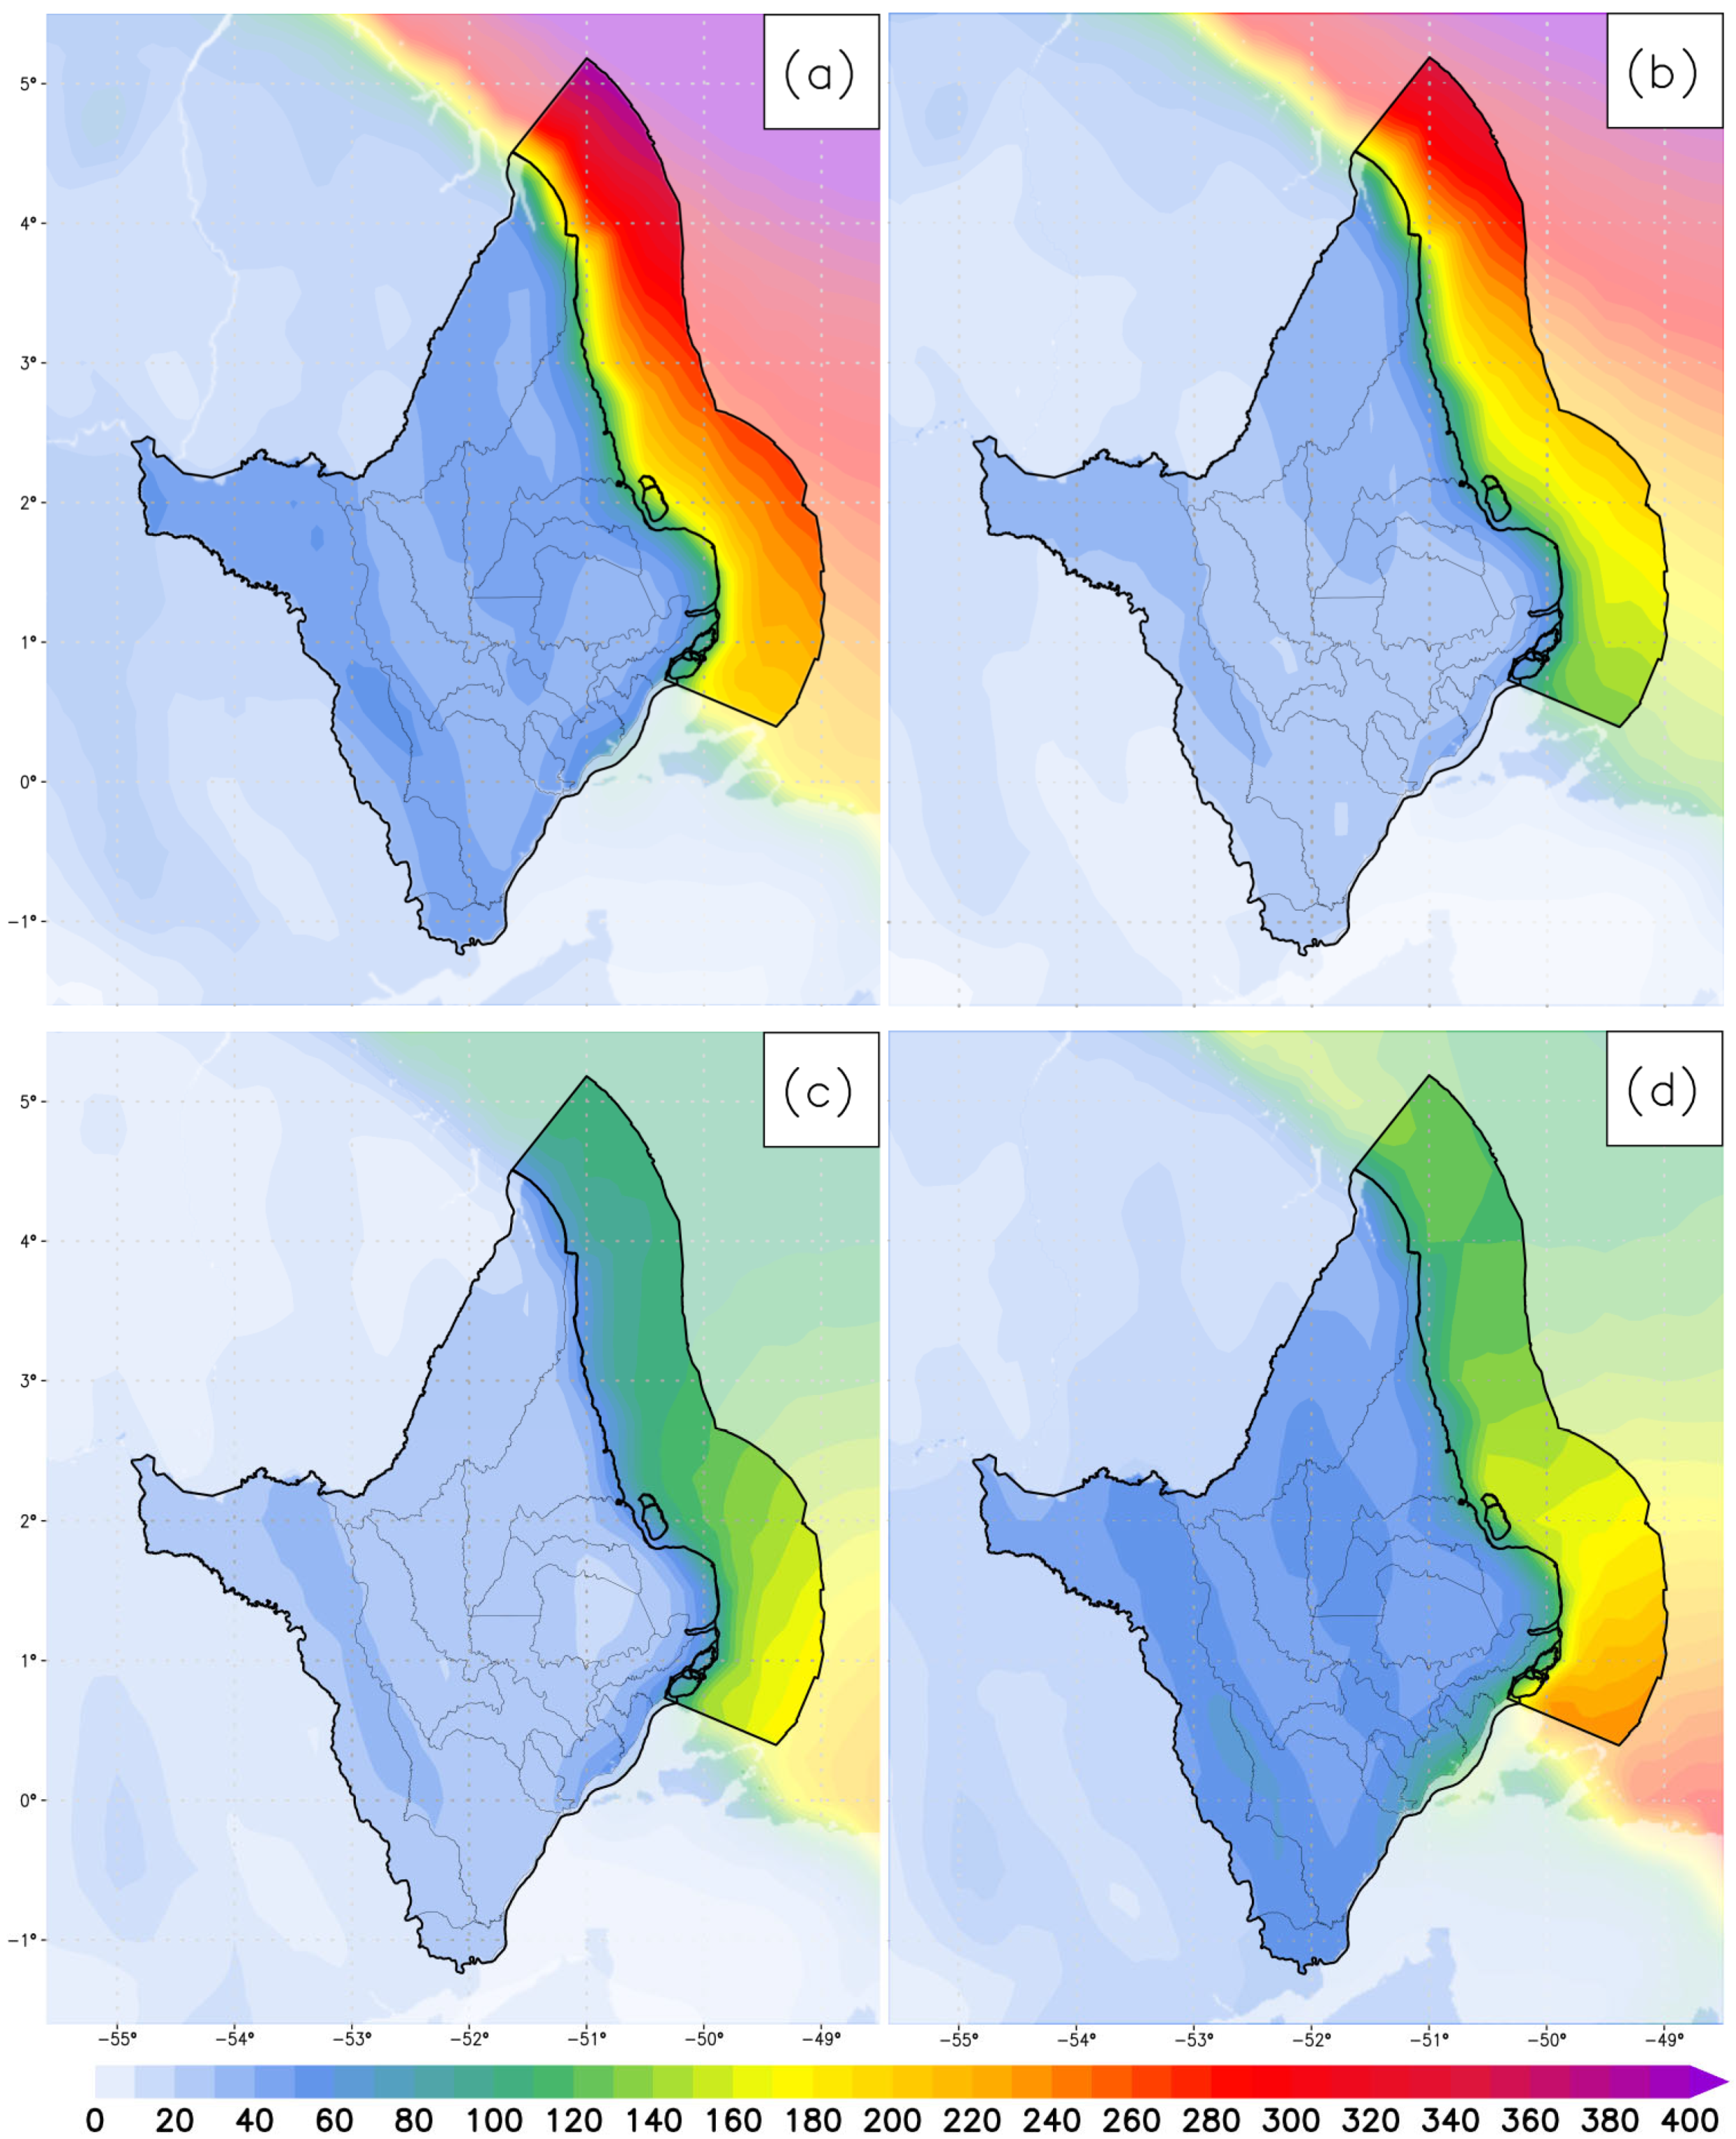
The average spatial distribution is strongly influenced by seasonal variation, as illustrated in Figure 10. During the summer (Figure 10a), the northern part of the offshore region shows values higher than 400 W/m2, with an average of 300 W/m2 over much of the offshore area of Amapá. This average is especially impacted by the values of February (Figure S2, Supplementary Materials). In the fall (Figure 10b), a similar pattern is observed, but with smaller values.
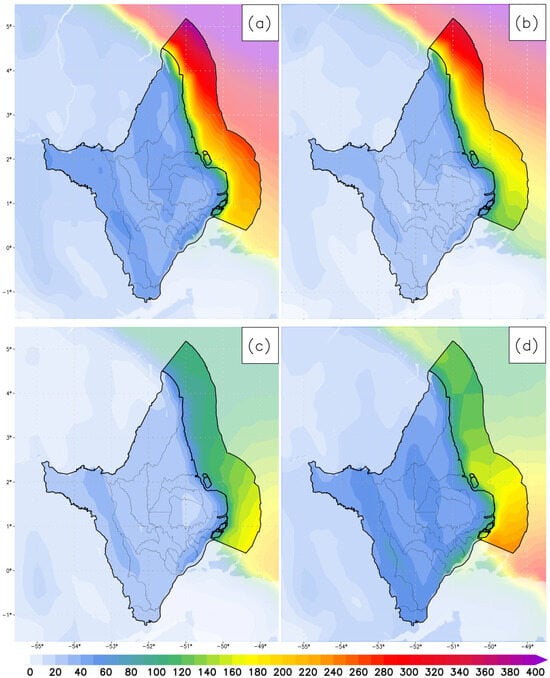
Figure 10.
Spatial distribution of the seasonal mean wind power density (W/m2) over 30 years (1991–2020) in (a) summer, (b) autumn, (c) winter, and (d) spring.
The spatial distribution of wind speed, as shown in Figure 5 and discussed in Section 3.2, corroborates these patterns. Analyzing the seasonal average spatial distribution is crucial, as the full period average may mask the strong variability in the analyzed fields. According to the Global Wind Atlas (GWA) [69], the offshore region of Amapá has an average of 120 to 160 W/m2, while the onshore region shows values between 30 and 50 W/m2.
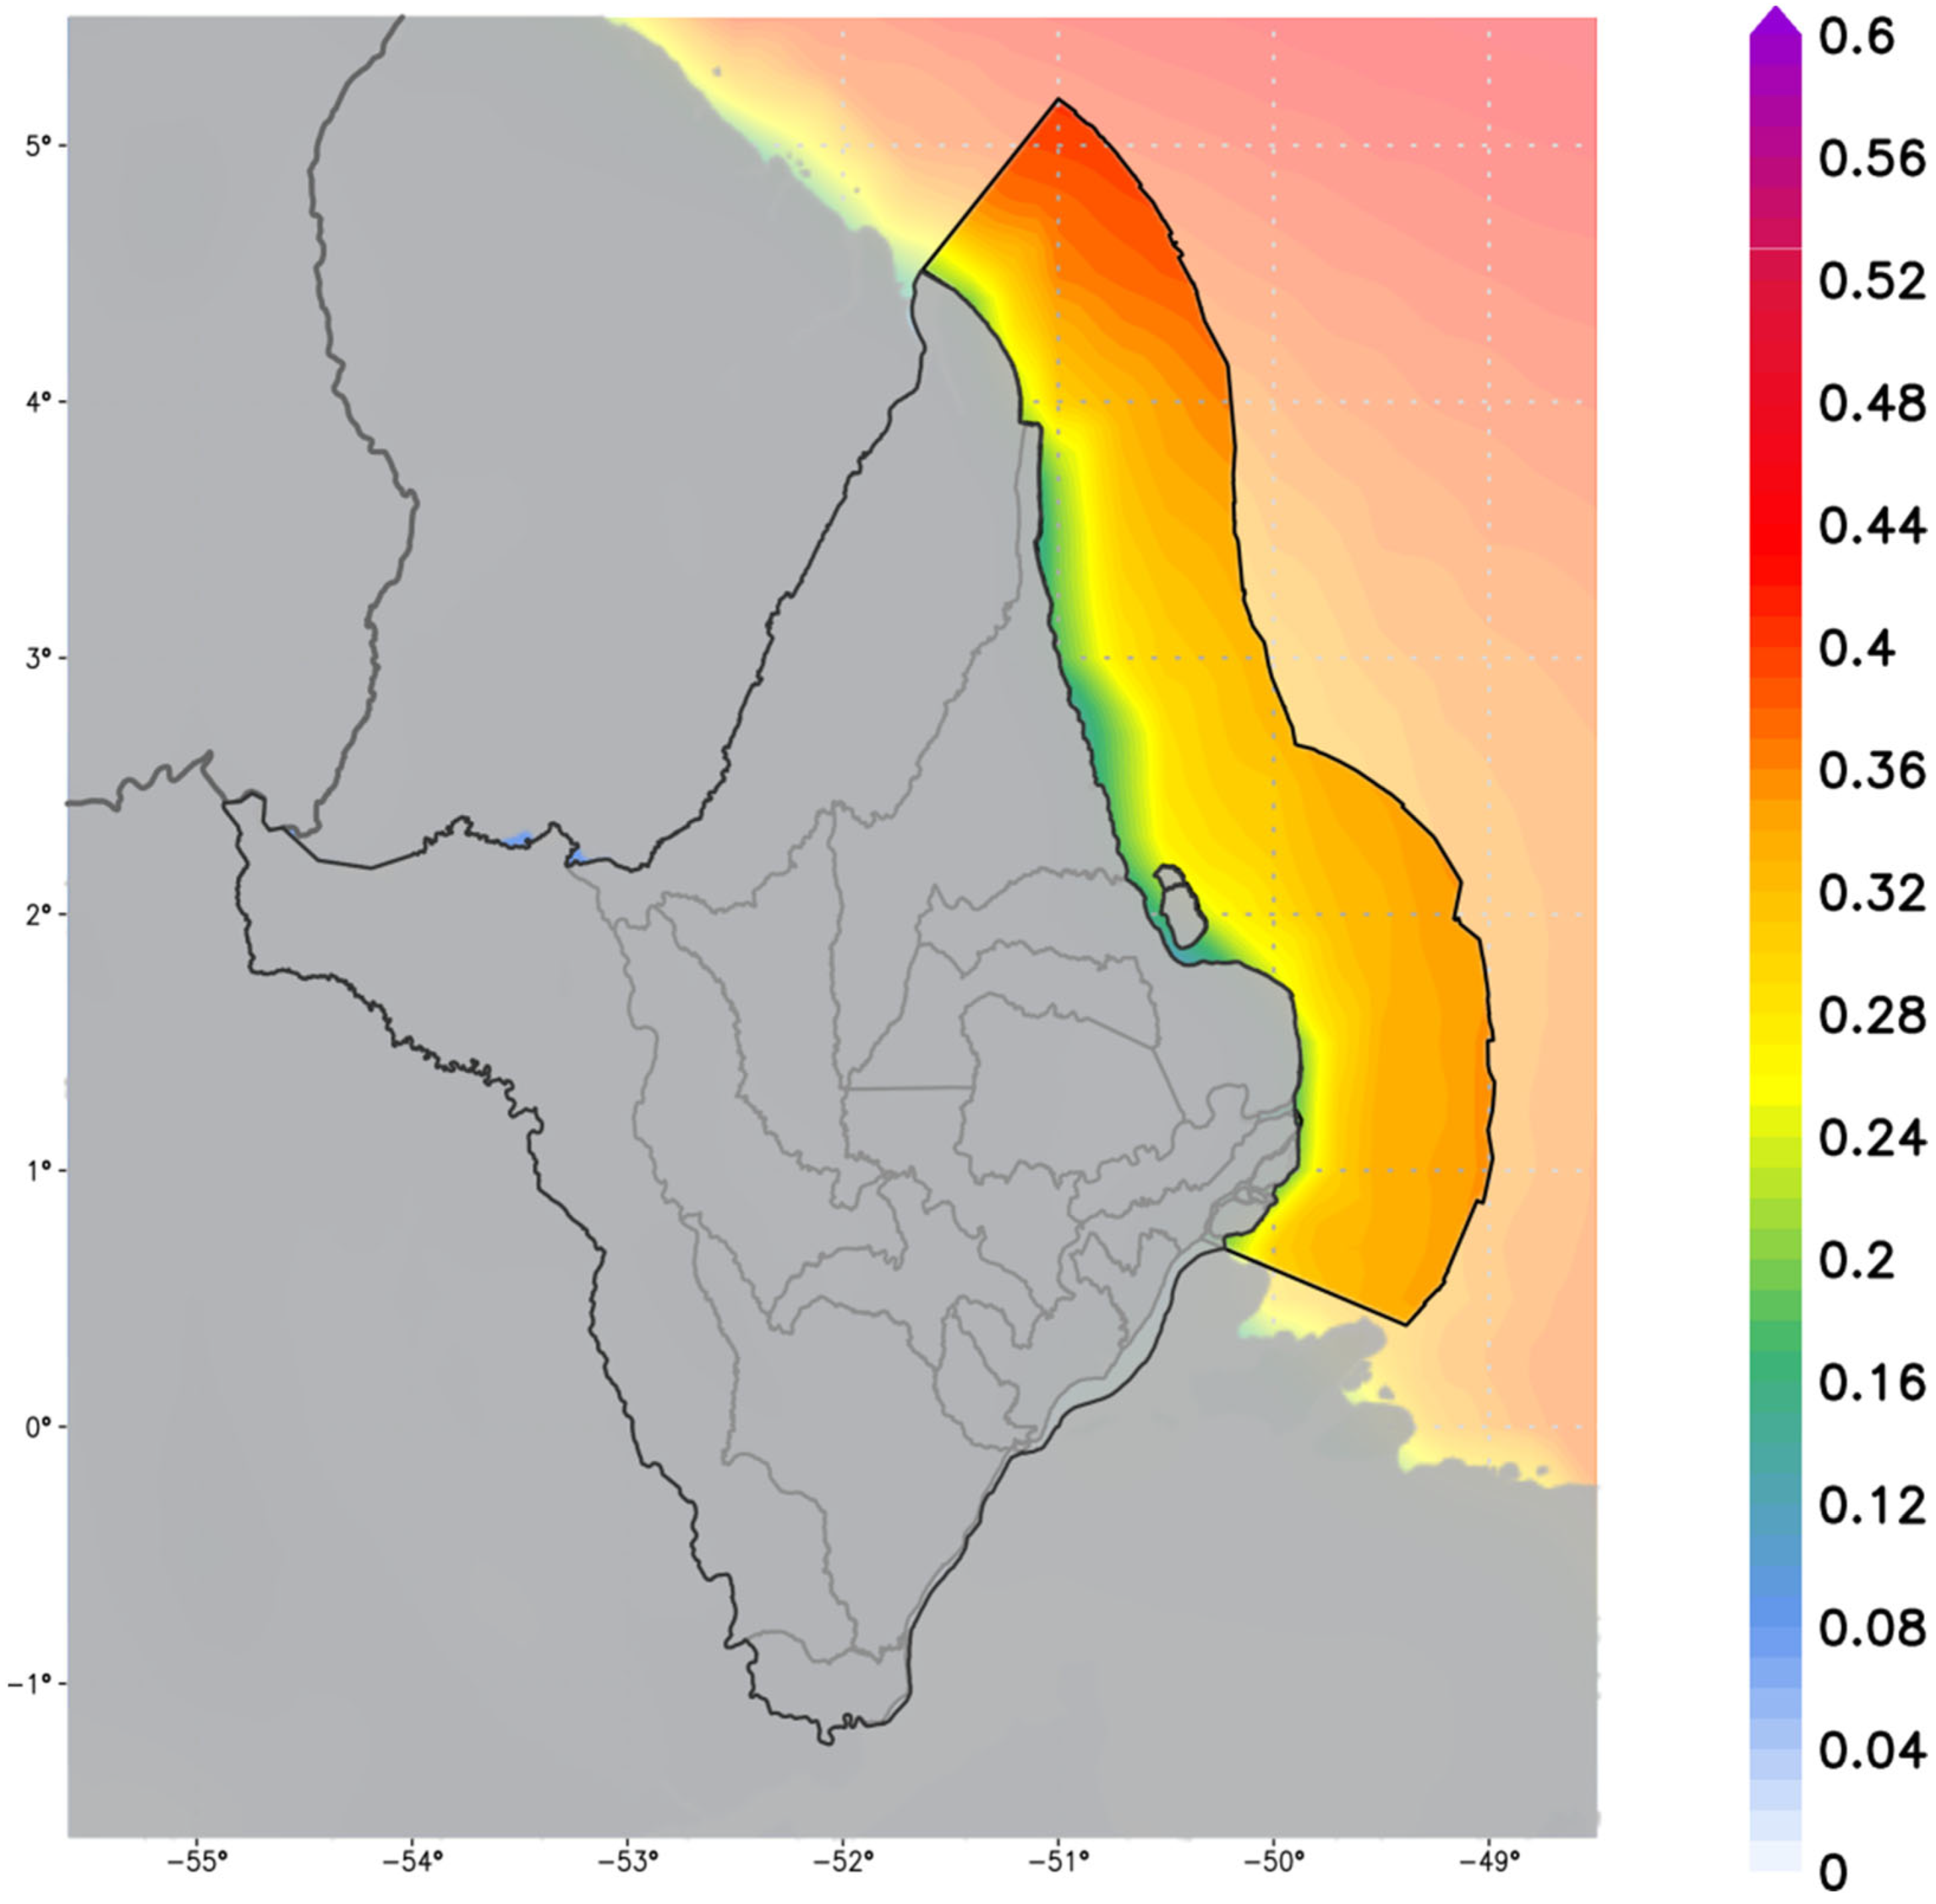
Figure 11 shows the CF over 30 years, and a gray mask over the onshore region of Amapá has been applied to the maps due to the specific design of the NREL 5 MW wind machine, which is specifically intended for offshore operations, making it less relevant for evaluations in onshore areas. The CF indicates the performance at which a wind power plant would be operating compared to its maximum theoretical capacity; this is a dimensionless measure and can be expressed as a fraction or percentage. The results reveal significant differences in wind resource performance between offshore areas, as evidenced by the CF values.
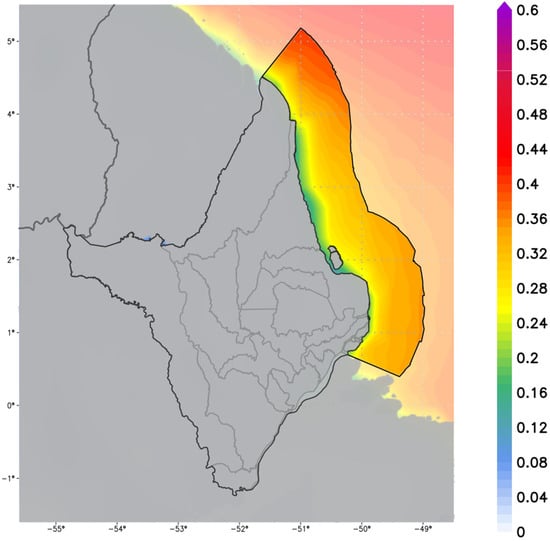
Figure 11.
Spatial distribution of the annual mean capacity factor (dimensionless) over 30 years (1991–2020) in Amapá. Amapá State was masked due to the NREL 5 MW machine being intended for offshore operations.
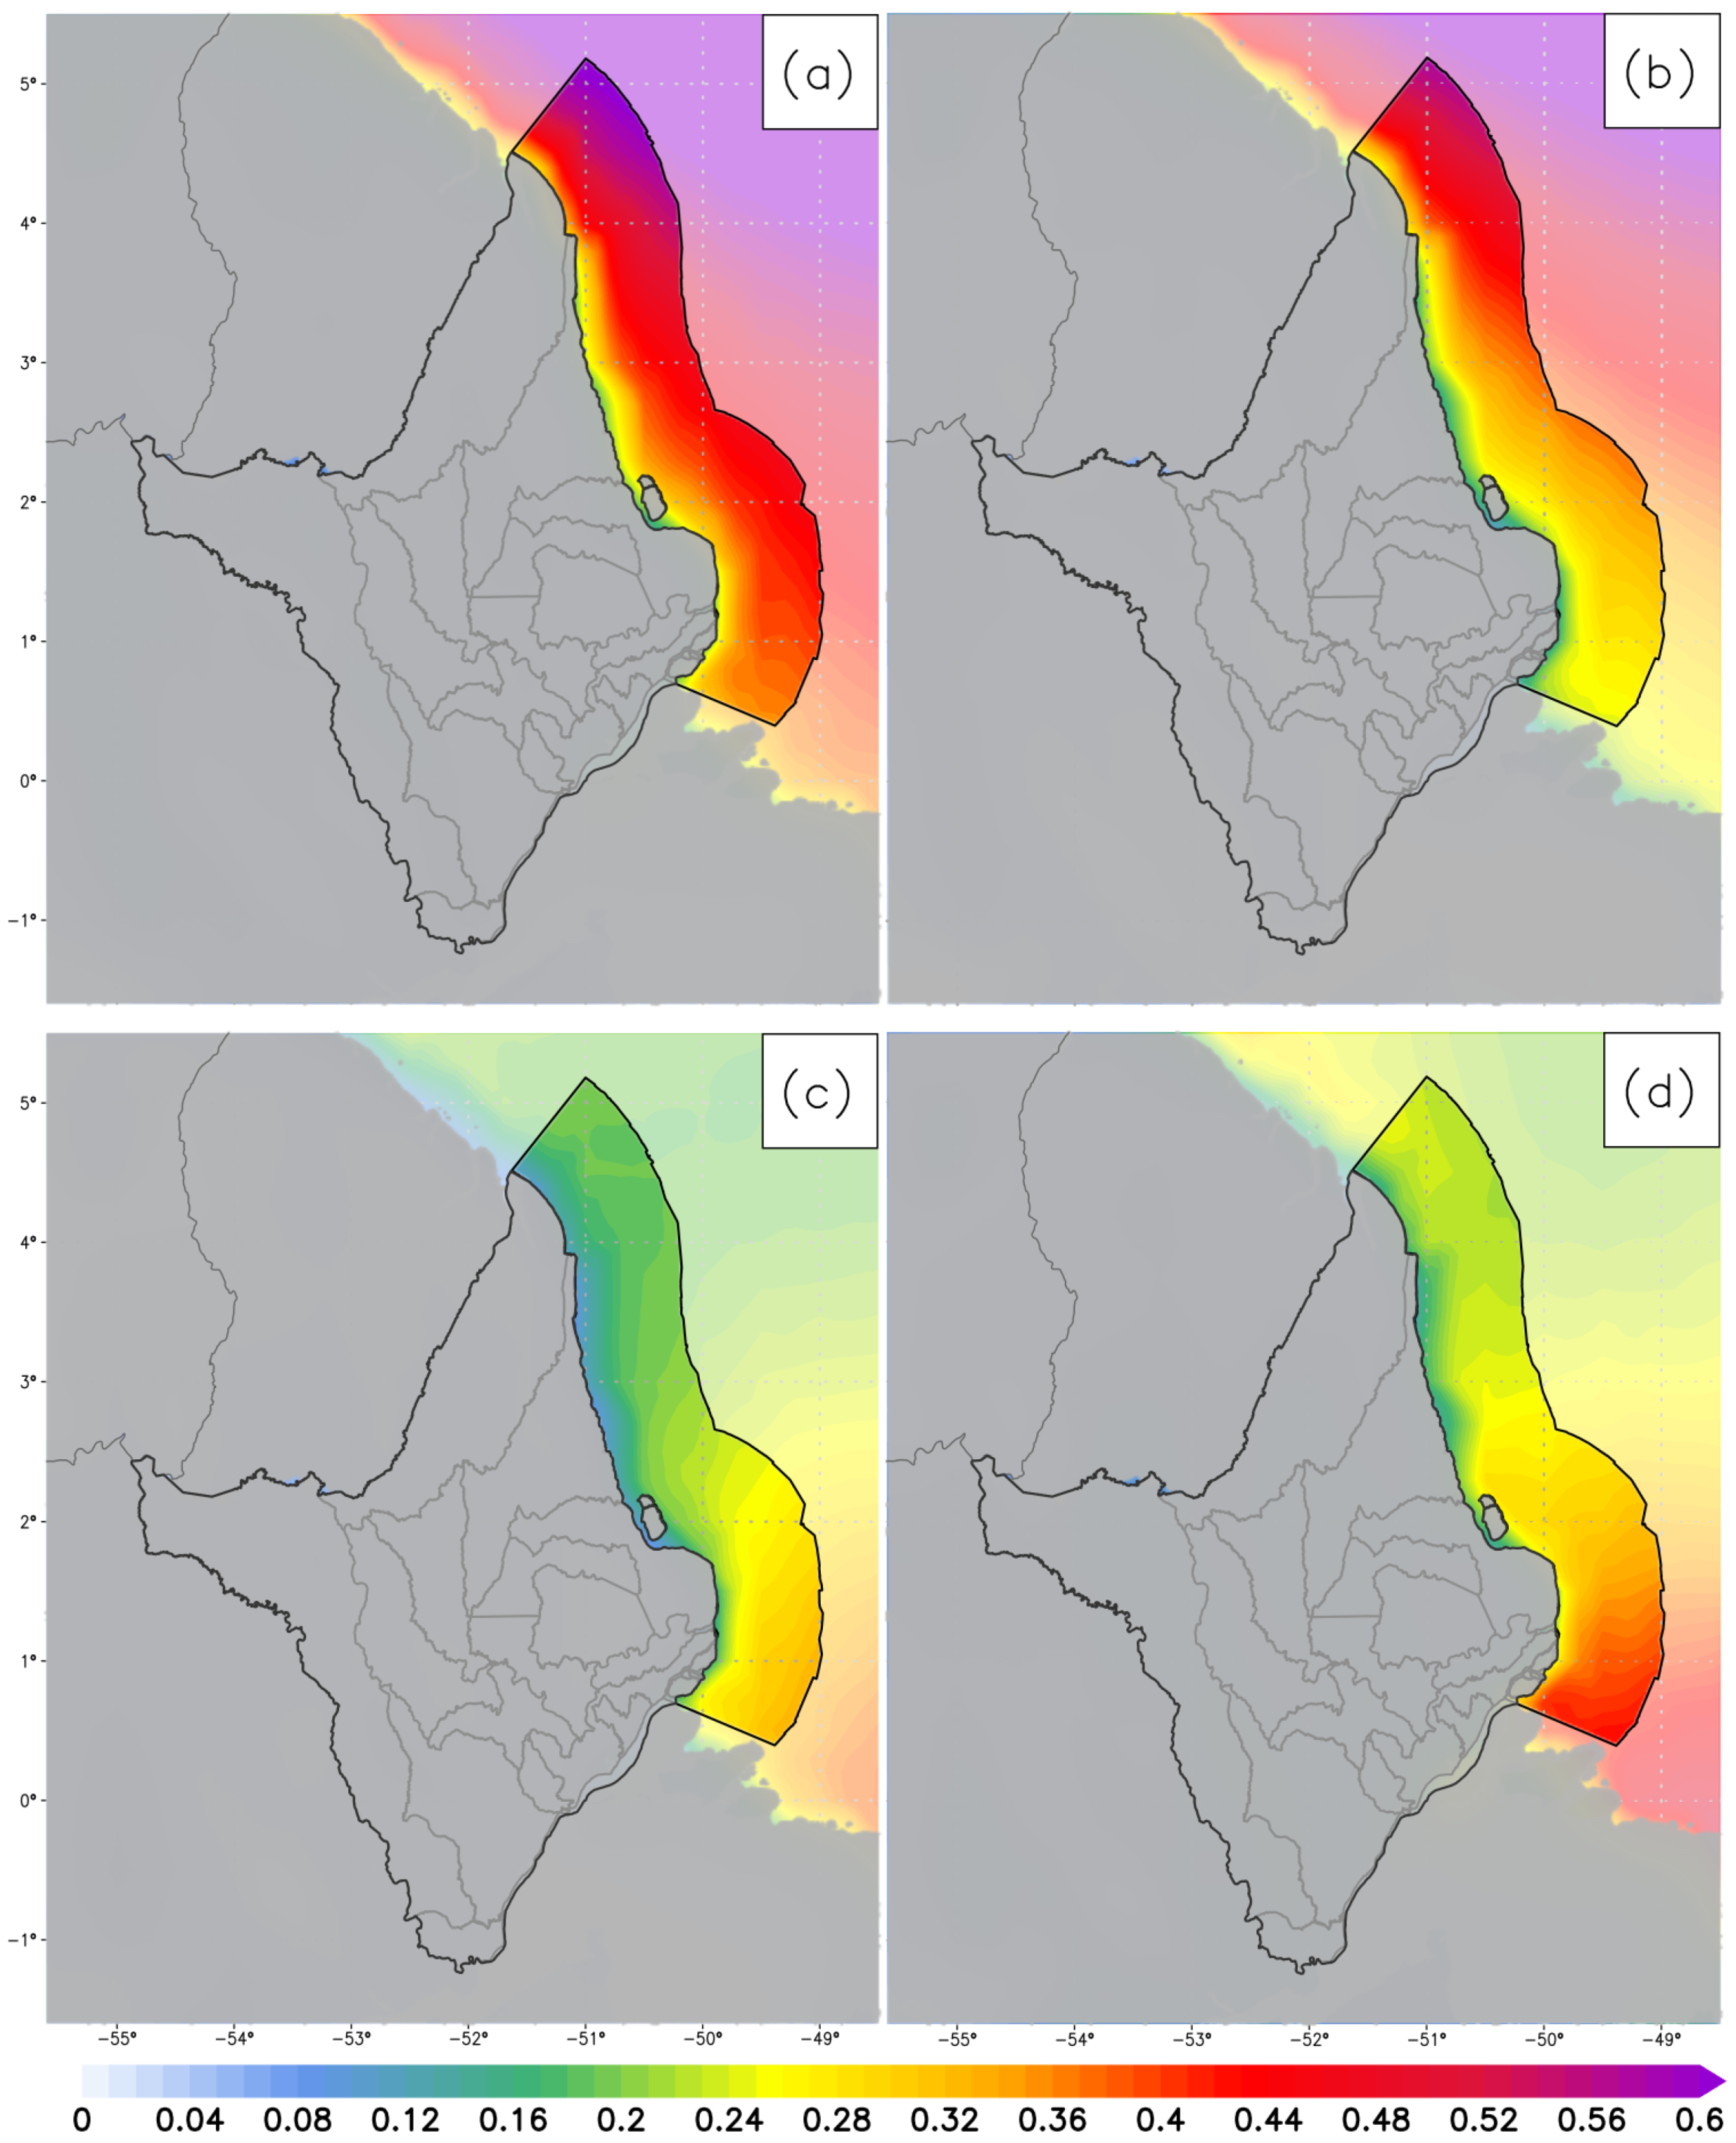
The offshore region exhibited CF values between 0.3 and 0.4. These numbers indicate more efficient utilization of the available wind resources and, consequently, higher electrical energy production. The seasonal behavior of the CF is shown in Figure 12. During the summer (Figure 12a), the offshore region of Amapá showed a CF ranging between 0.4 and 0.6, indicating more efficient utilization of the available wind resources and higher electrical energy production in this season. This can be attributed to favorable meteorological conditions, such as intensified trade winds, characterized as stronger and more consistent than usual.
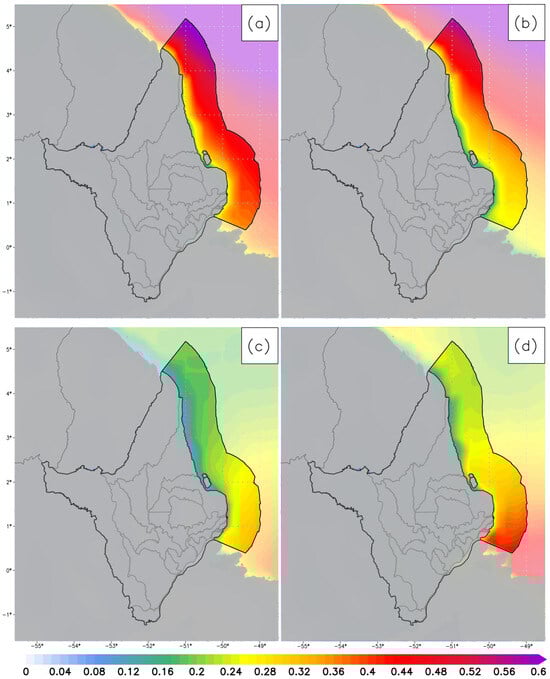
Figure 12.
Spatial distribution of the seasonal mean capacity factor (dimensionless) over 30 years (1991–2020) in (a) summer, (b) autumn, (c) winter, and (d) spring. Amapá State was masked due to the NREL 5 MW machine being intended for offshore operations.
During the autumn season, as shown in Figure 12b, the northern region of the offshore area recorded a CF ranging from 0.4 to 0.6. In contrast, the central region of the offshore area exhibited values between 0.3 and 0.4. This notable discrepancy implies that the northern offshore region is more favorable for wind energy generation in the autumn. Furthermore, this season continues to provide conducive conditions for wind energy harvesting, as it is characterized by the gradual weakening of the trade winds.
In the winter (Figure 12c), the CF in the northern offshore region varied between 0.16 and 0.22, while in the southern offshore region the values ranged between 0.24 and 0.32. These results indicate that the wind potential in winter is lower compared to other seasons, with the southern offshore region showing slightly better conditions.
Finally, in the spring (Figure 12d), the northern offshore region obtained CF values between 0.18 and 0.22, while the southern offshore region showed values between 0.42 and 0.46. These results point to a significant difference in wind performance between the northern and southern areas of the offshore region during the spring.
3.4. Solar Energy Assessment
The solar resource potential refers to the amount of solar energy available in a specific area to be converted into electricity or heat through solar technologies, such as photovoltaic panels or solar thermal collectors. Figure 13 illustrates the spatial distribution of the average solar resource potential in the state of Amapá. The results reveal that the spatial variability in solar resource potential within the onshore region of Amapá is, on average, negligible. This suggests a relatively uniform distribution of solar energy potential across the studied area. In the east–central and northeast parts of the state, the average annual solar irradiance values were 4.6 kWh/m2, indicating a moderate potential for solar energy generation in these areas. However, the southern and far western regions showed higher solar potential, with average annual solar irradiance values exceeding 4.8 kWh/m2. These values are consistent with those shown in the Brazilian Solar Energy Atlas [71], which estimates that the North Region has average values of 4.65 kWh/m2. The analysis of offshore areas revealed the highest solar resource potential, with average annual solar irradiance values exceeding 5.4 kWh/m2.
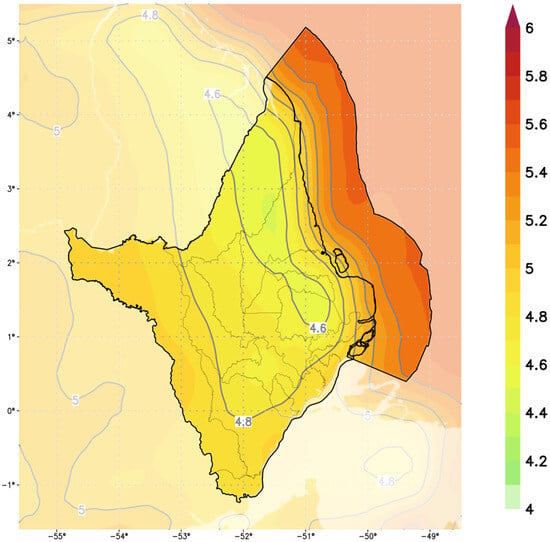
Figure 13.
Spatial distribution of the annual mean solar resource potential (kWh/m2) over 30 years (1991–2020) in Amapá.
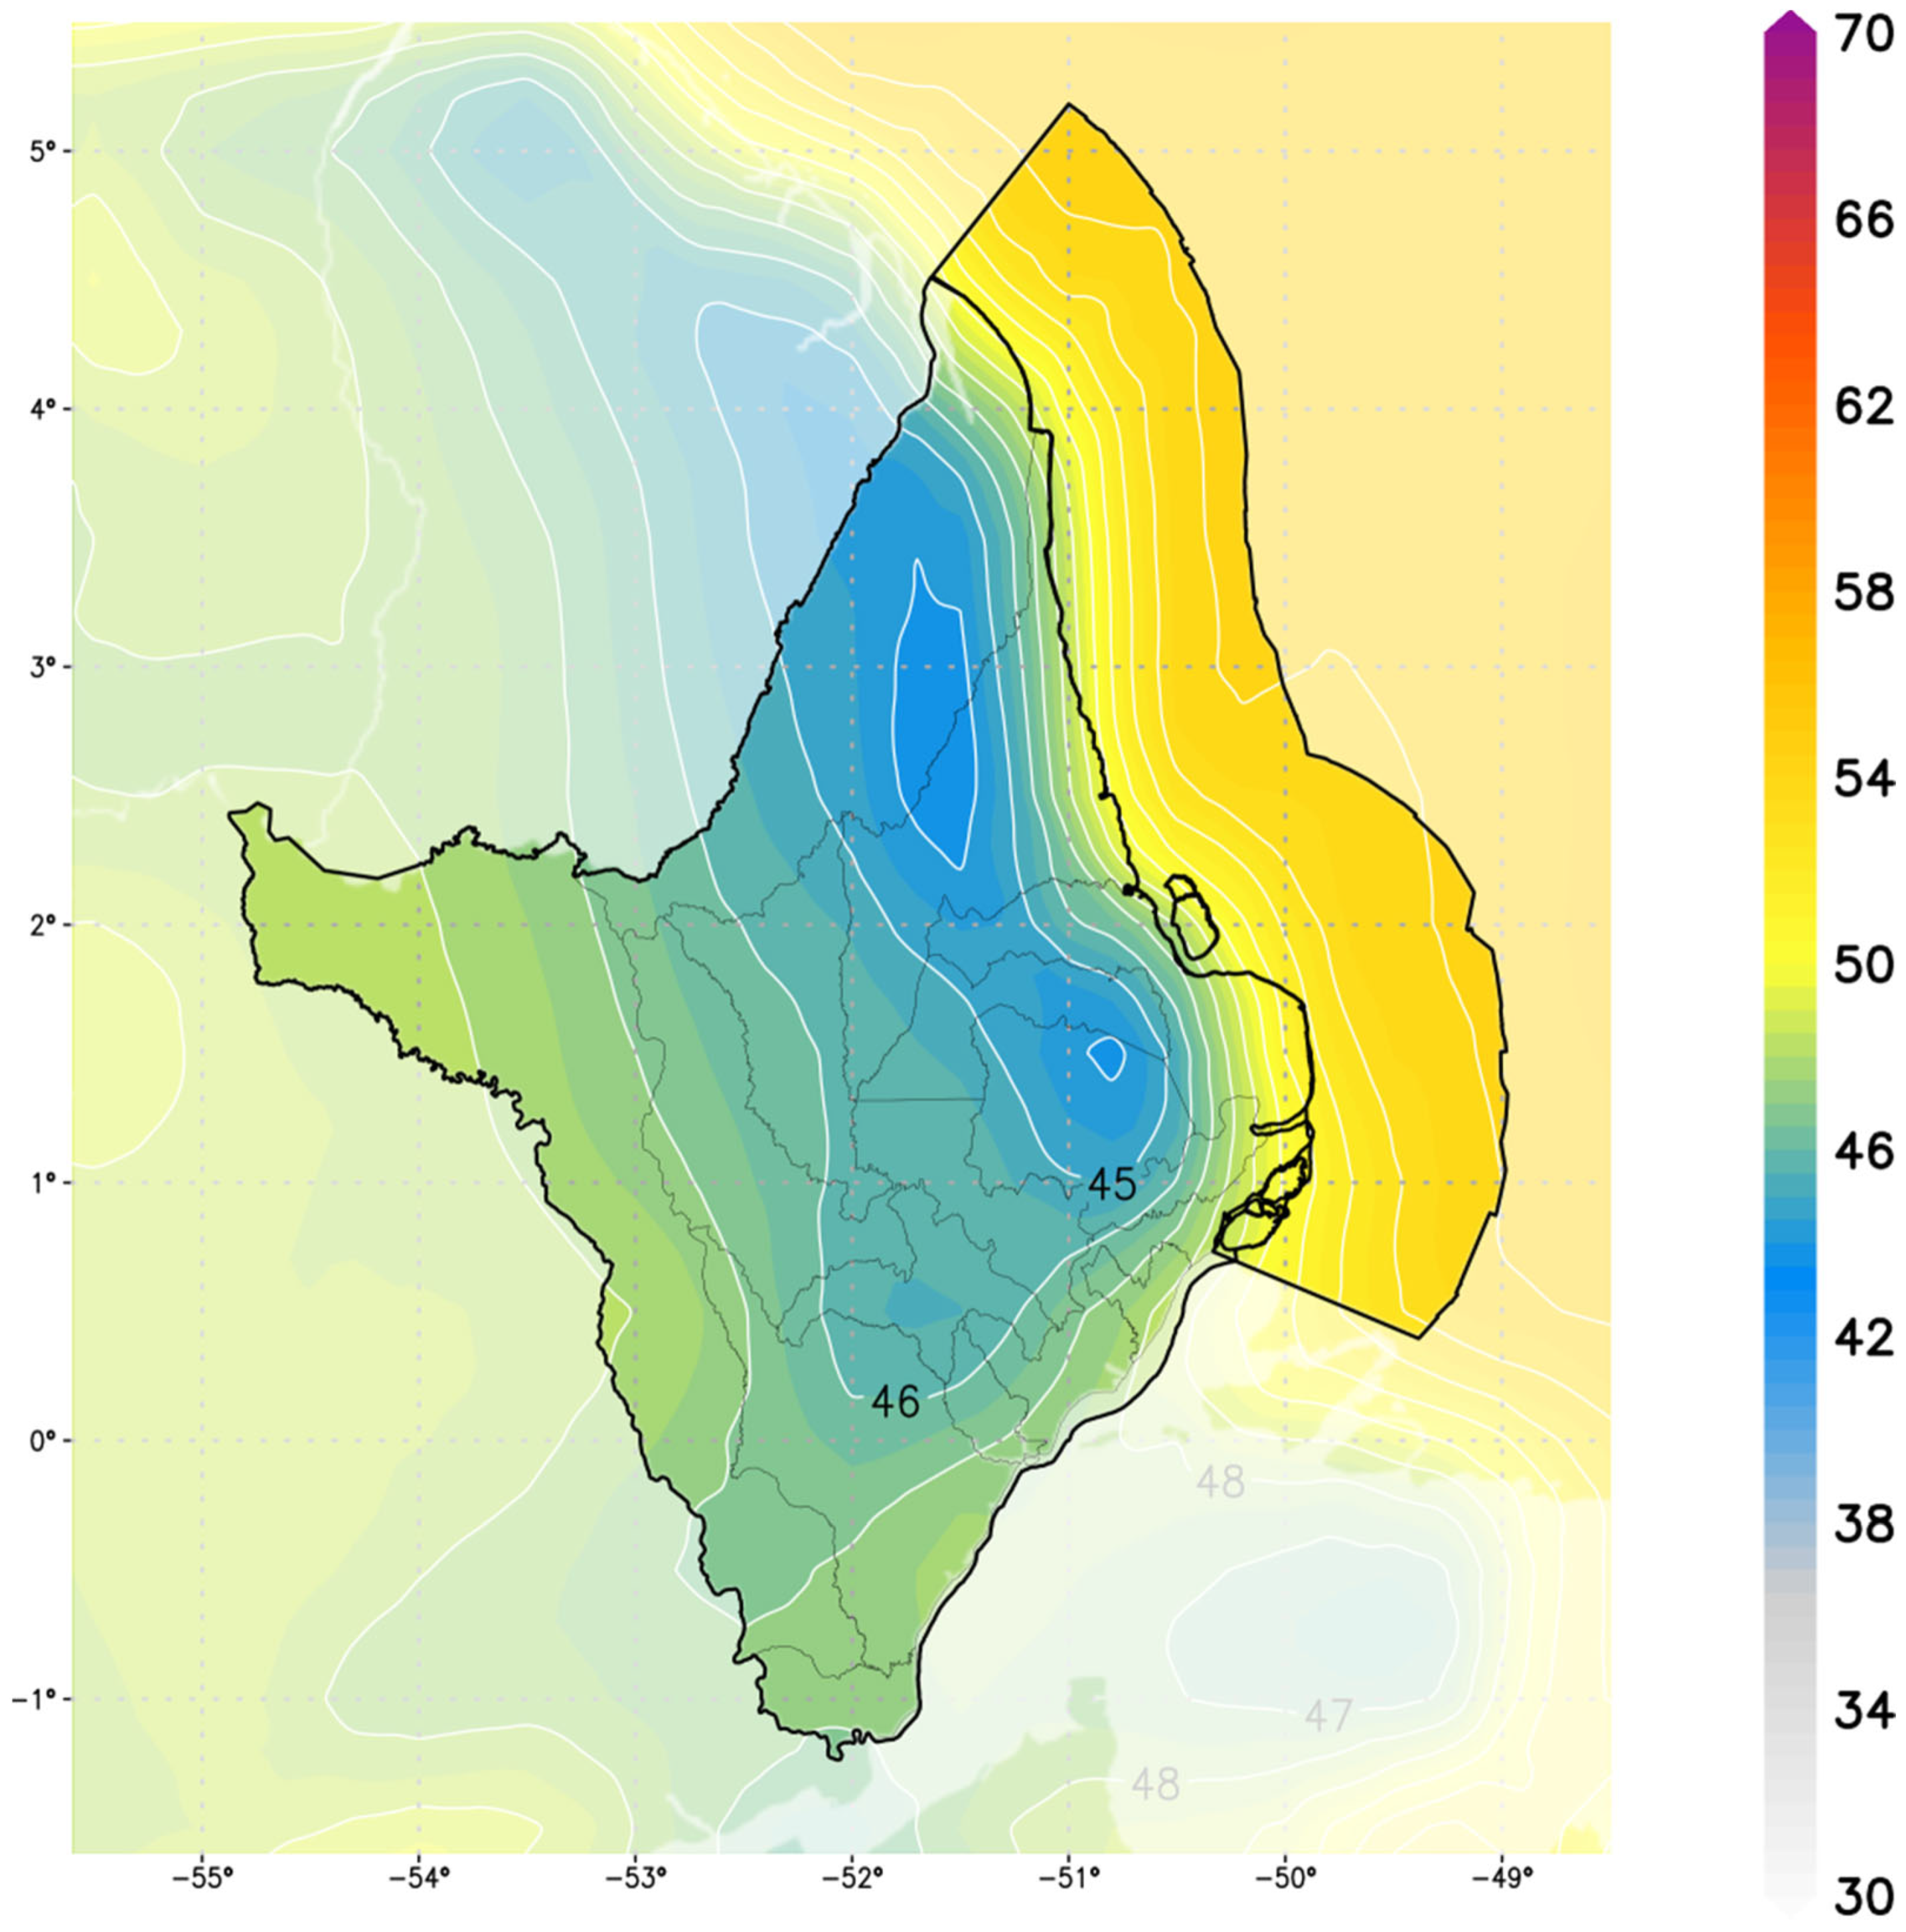
The spatial distribution of the annual average photovoltaic potential (%) is presented in Figure 14. The results show that the photovoltaic conversion efficiency in the onshore areas of Amapá varies between 45% and 47%. This variation can be attributed to factors such as cloud cover, the amount of incident solar radiation, and other local weather conditions. However, the analysis of offshore areas revealed higher photovoltaic potential, with conversion efficiency between 50% and 55%. This difference in efficiency can be explained by the lower cloud cover and more favorable environmental conditions, such as milder temperatures and higher wind speeds, which may contribute to better heat dissipation in photovoltaic panels.

Figure 14.
Spatial distribution of the annual mean photovoltaic power potential (%) over 30 years (1991–2020) in Amapá.
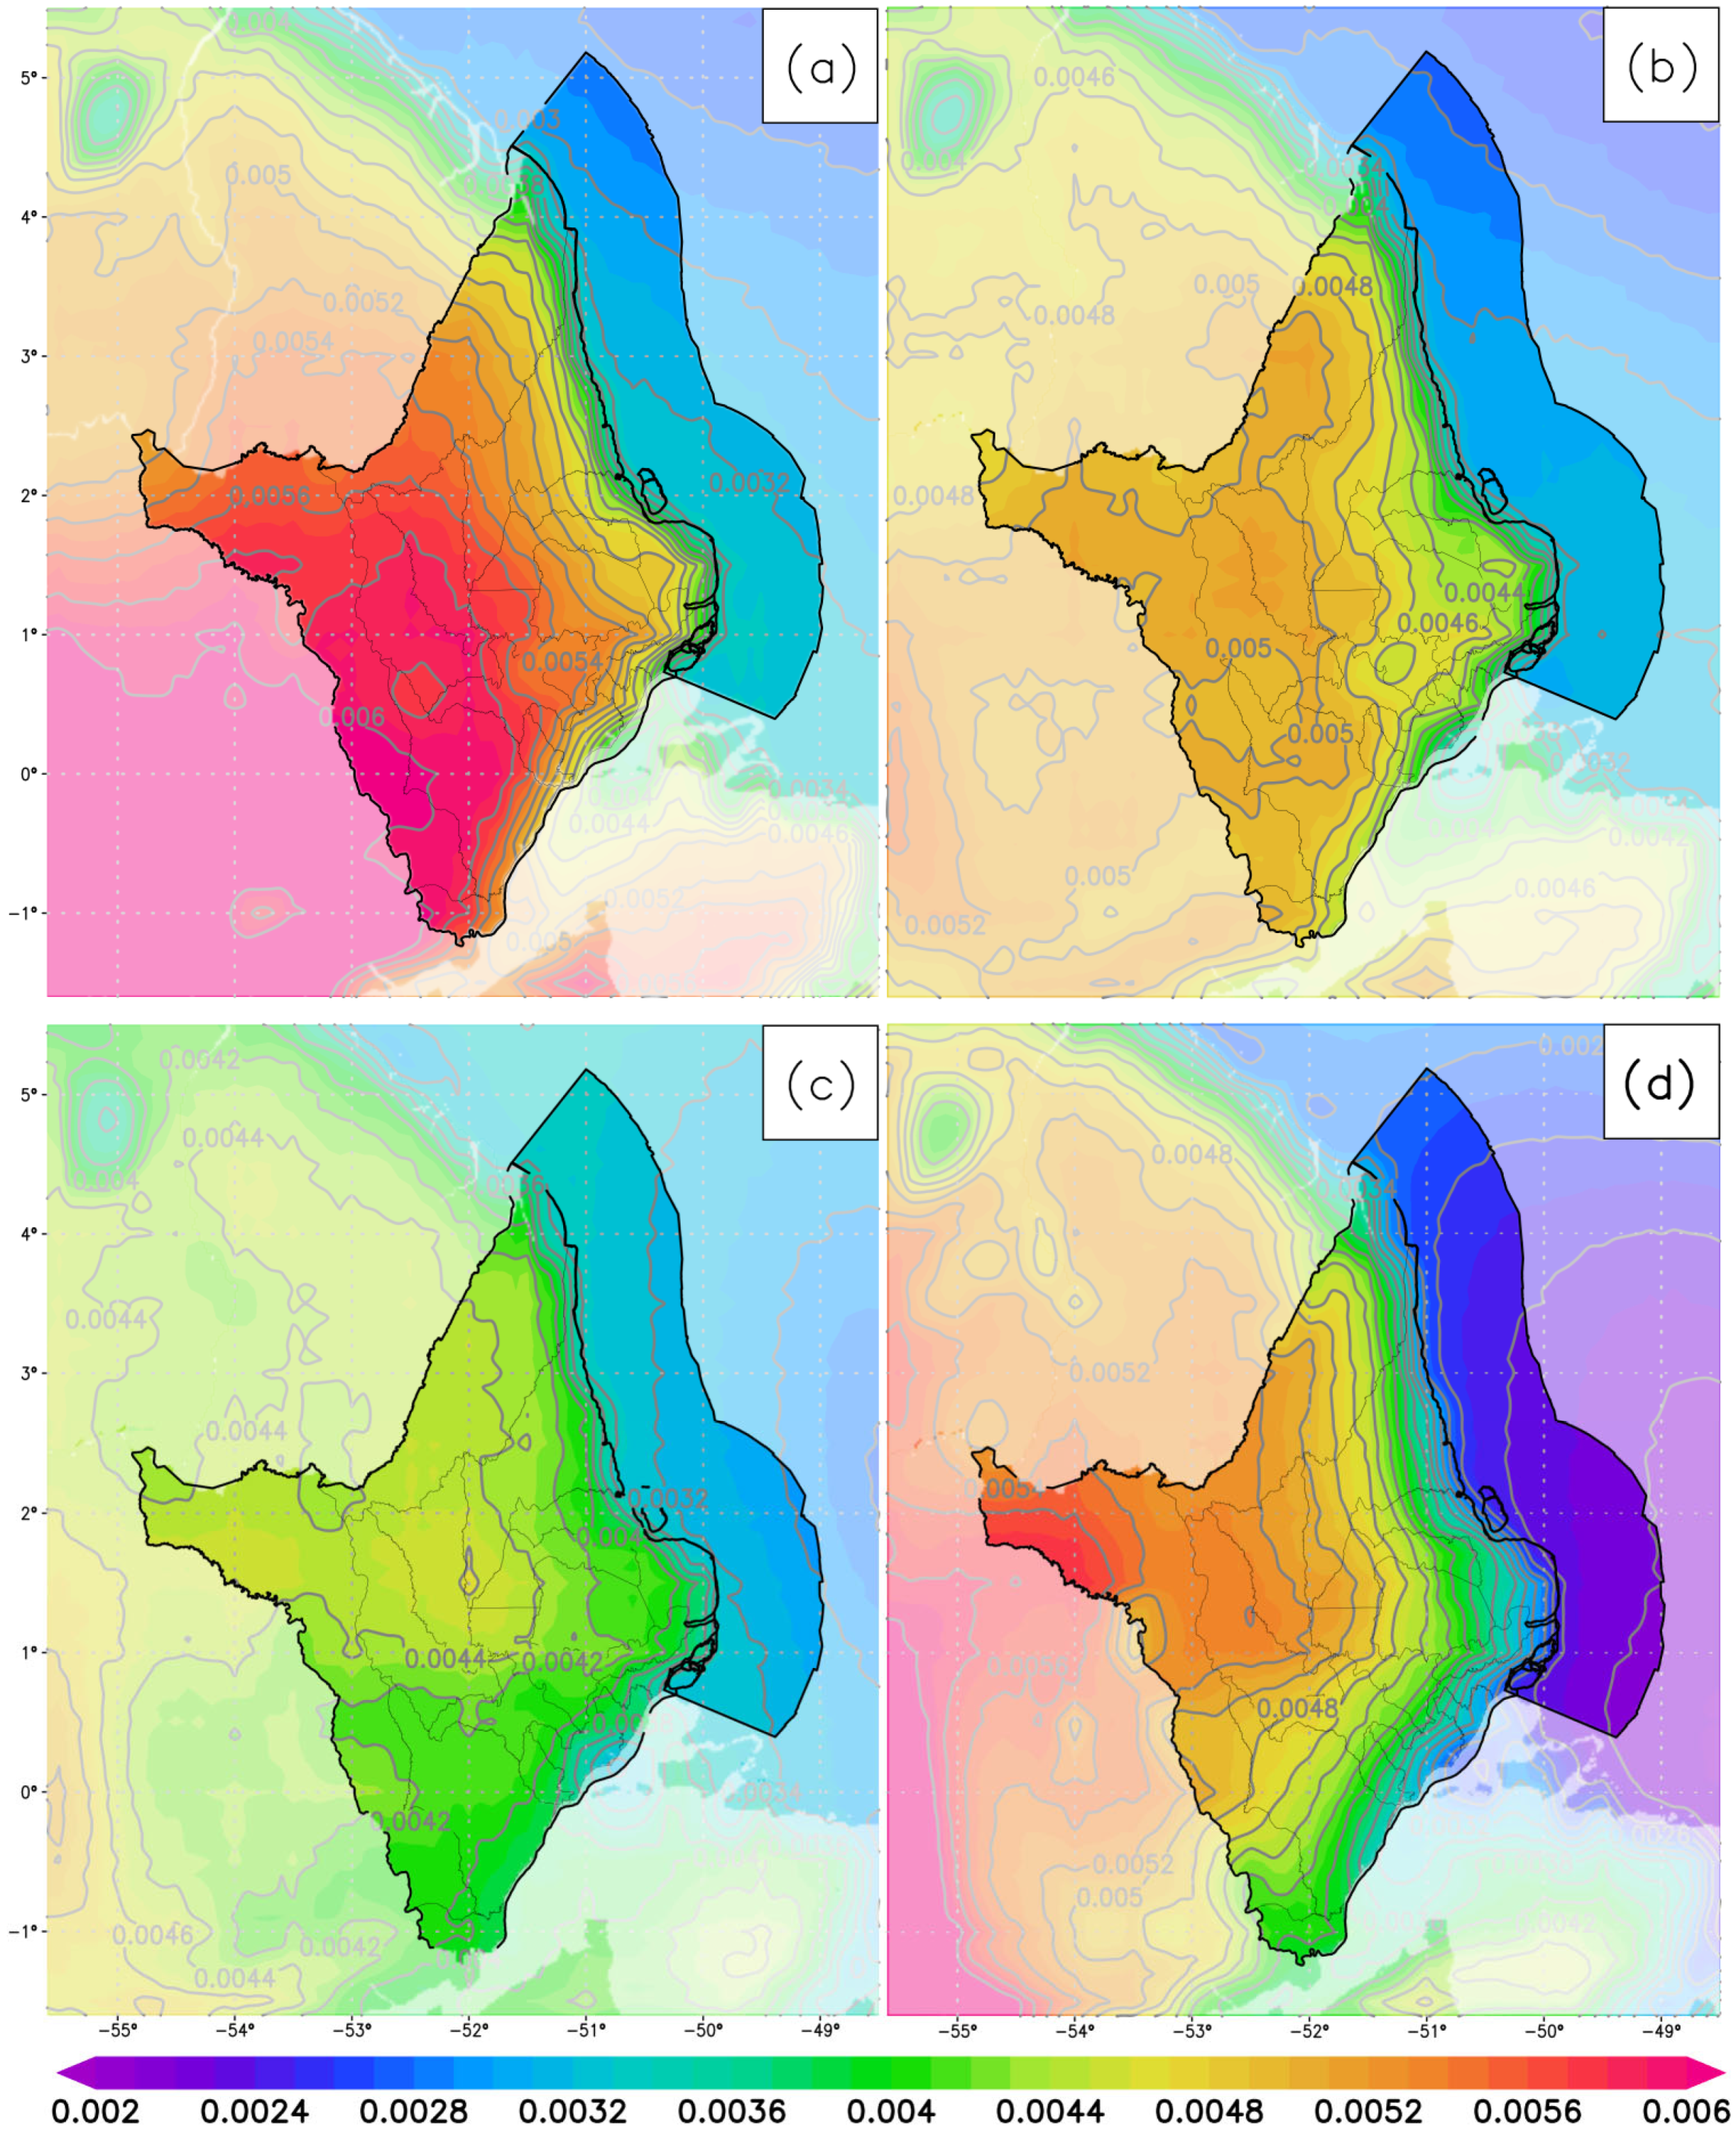
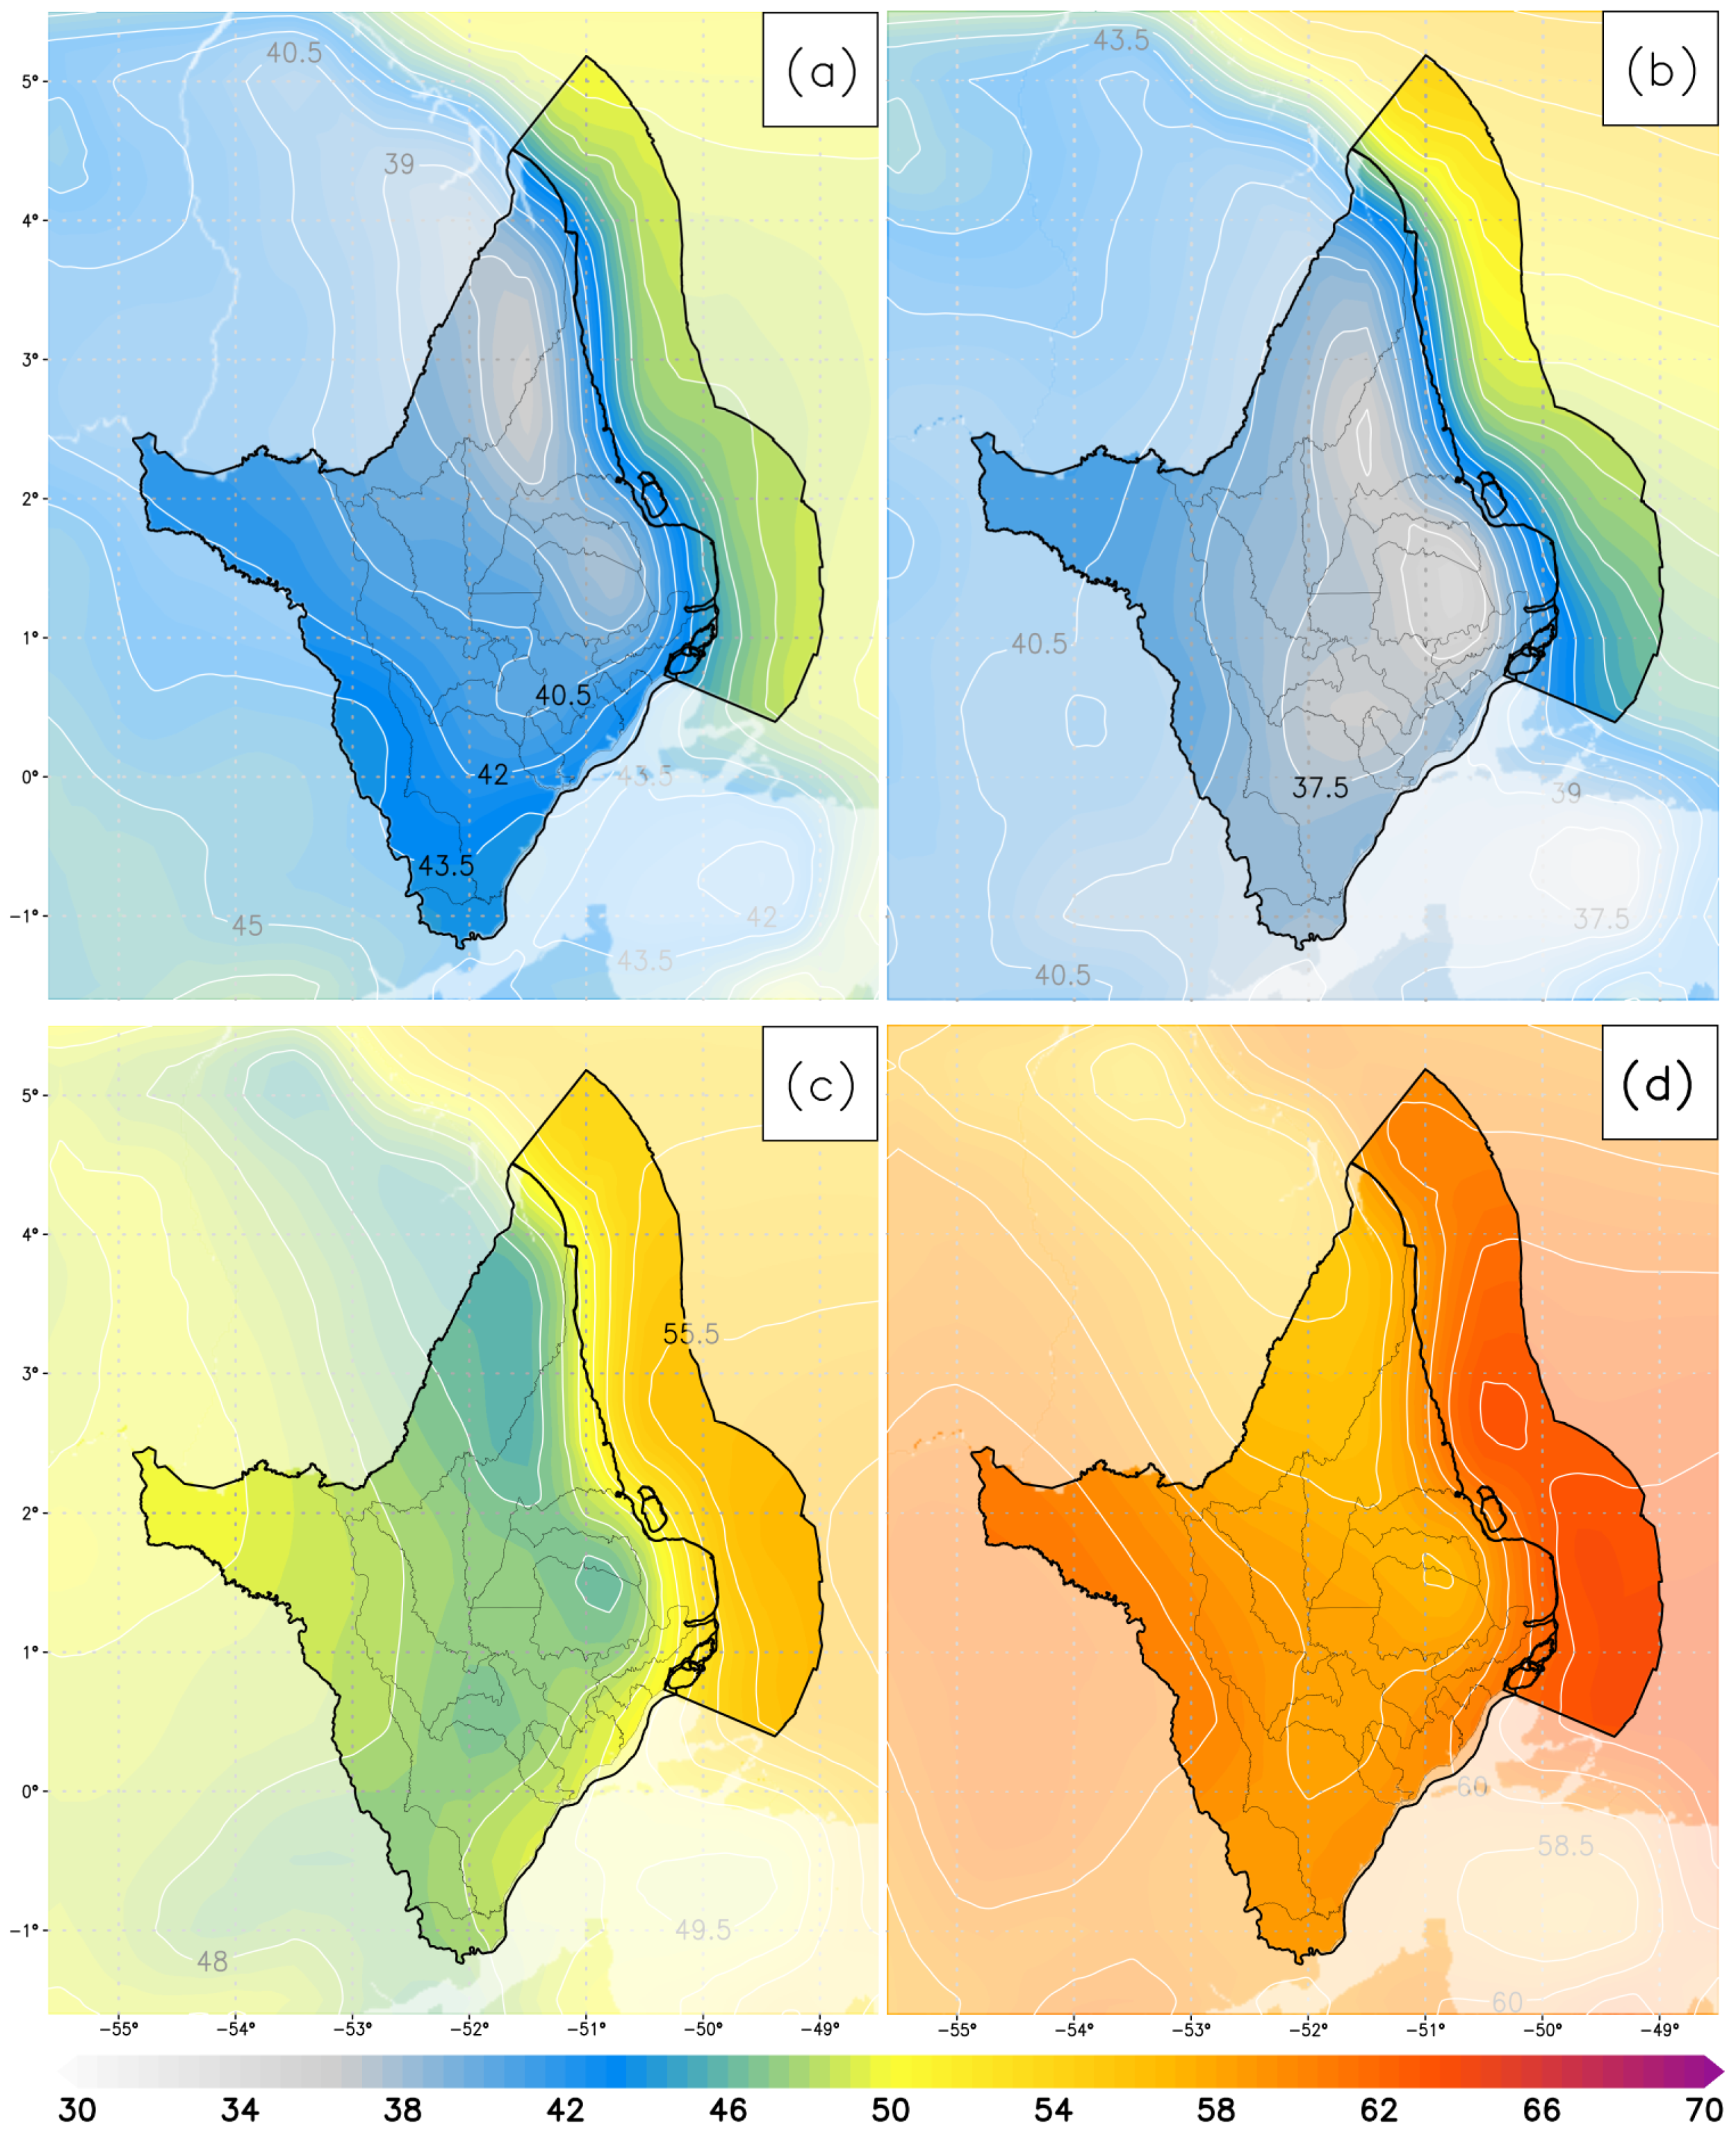
The seasonal variability of photovoltaic potential (%) observed in Figure 15 shows considerable variation in photovoltaic conversion efficiency among the different seasons over Amapá. The highest values are observed in the spring season (Figure 15a), a period characterized by low cloud cover in the atmosphere and more intense winds, while the lowest values occur in autumn, a period when the ITCZ is present over the region, increasing the cloud cover, which blocks the incoming solar radiation. The results indicate that the photovoltaic potential in the state of Amapá is strongly correlated with the cloud cover present, and that oceanic–atmospheric patterns that intensify meteorological systems in the region must be considered to ensure the viability and efficiency of installed photovoltaic systems.
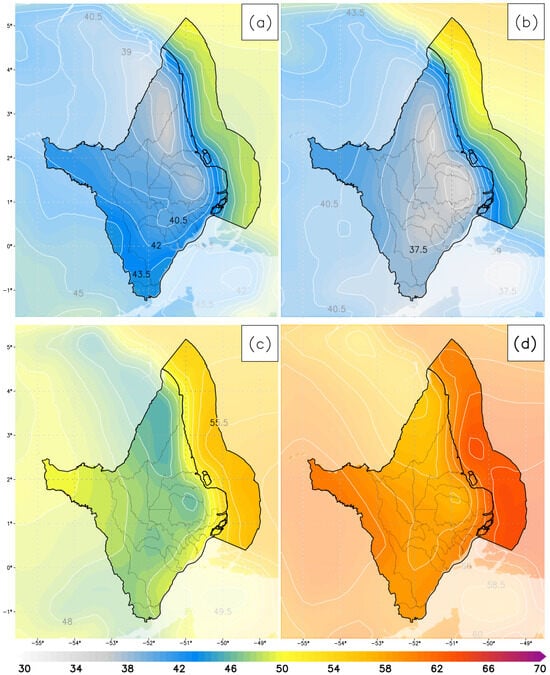
Figure 15.
Spatial distribution of the seasonal mean photovoltaic power potential (%) over 30 years (1991–2020) in (a) summer, (b) autumn, (c) winter, and (d) spring.
The average spatial distribution of in the state of Amapá (Figure 16) revealed a striking variability in the generated potential (W/m2) among different regions of the state. It was observed that in the far west of Amapá, the values of varied between 205 and 203 W/m2, while in the rest of the state, slightly lower values were presented, ranging between 201 and 202 W/m2. However, in the offshore region of the state, the values of were less than 200 W/m2. This variation in the performance of in Amapá can be attributed to the use of direct solar radiation, i.e., the solar radiation that reaches the Earth’s surface without any scattering (as shown in Section 2.7, Equation (13)). Therefore, there is much more direct solar radiation in the western portion of the state of Amapá, which is reflected in the values of . The thermal efficiency of a system, known as (Equation (13), refers to the efficiency with which the system converts solar energy into usable thermal energy, assuming that the temperature of the fluid exiting the absorber is kept constant through control of the fluid flow rate. The results for the state of Amapá indicate that the efficiency is always around 70%, regardless of the season (Figure S3, Supplementary Materials).
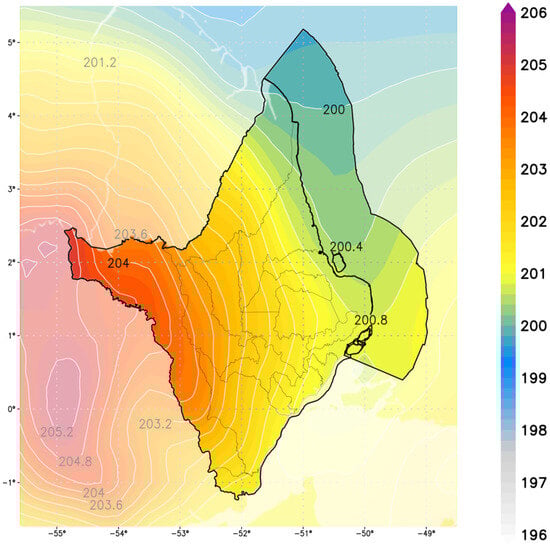
Figure 16.
Spatial distribution of the annual mean concentrated solar power output (W/m2) over 30 years (1991–2020) in Amapá.
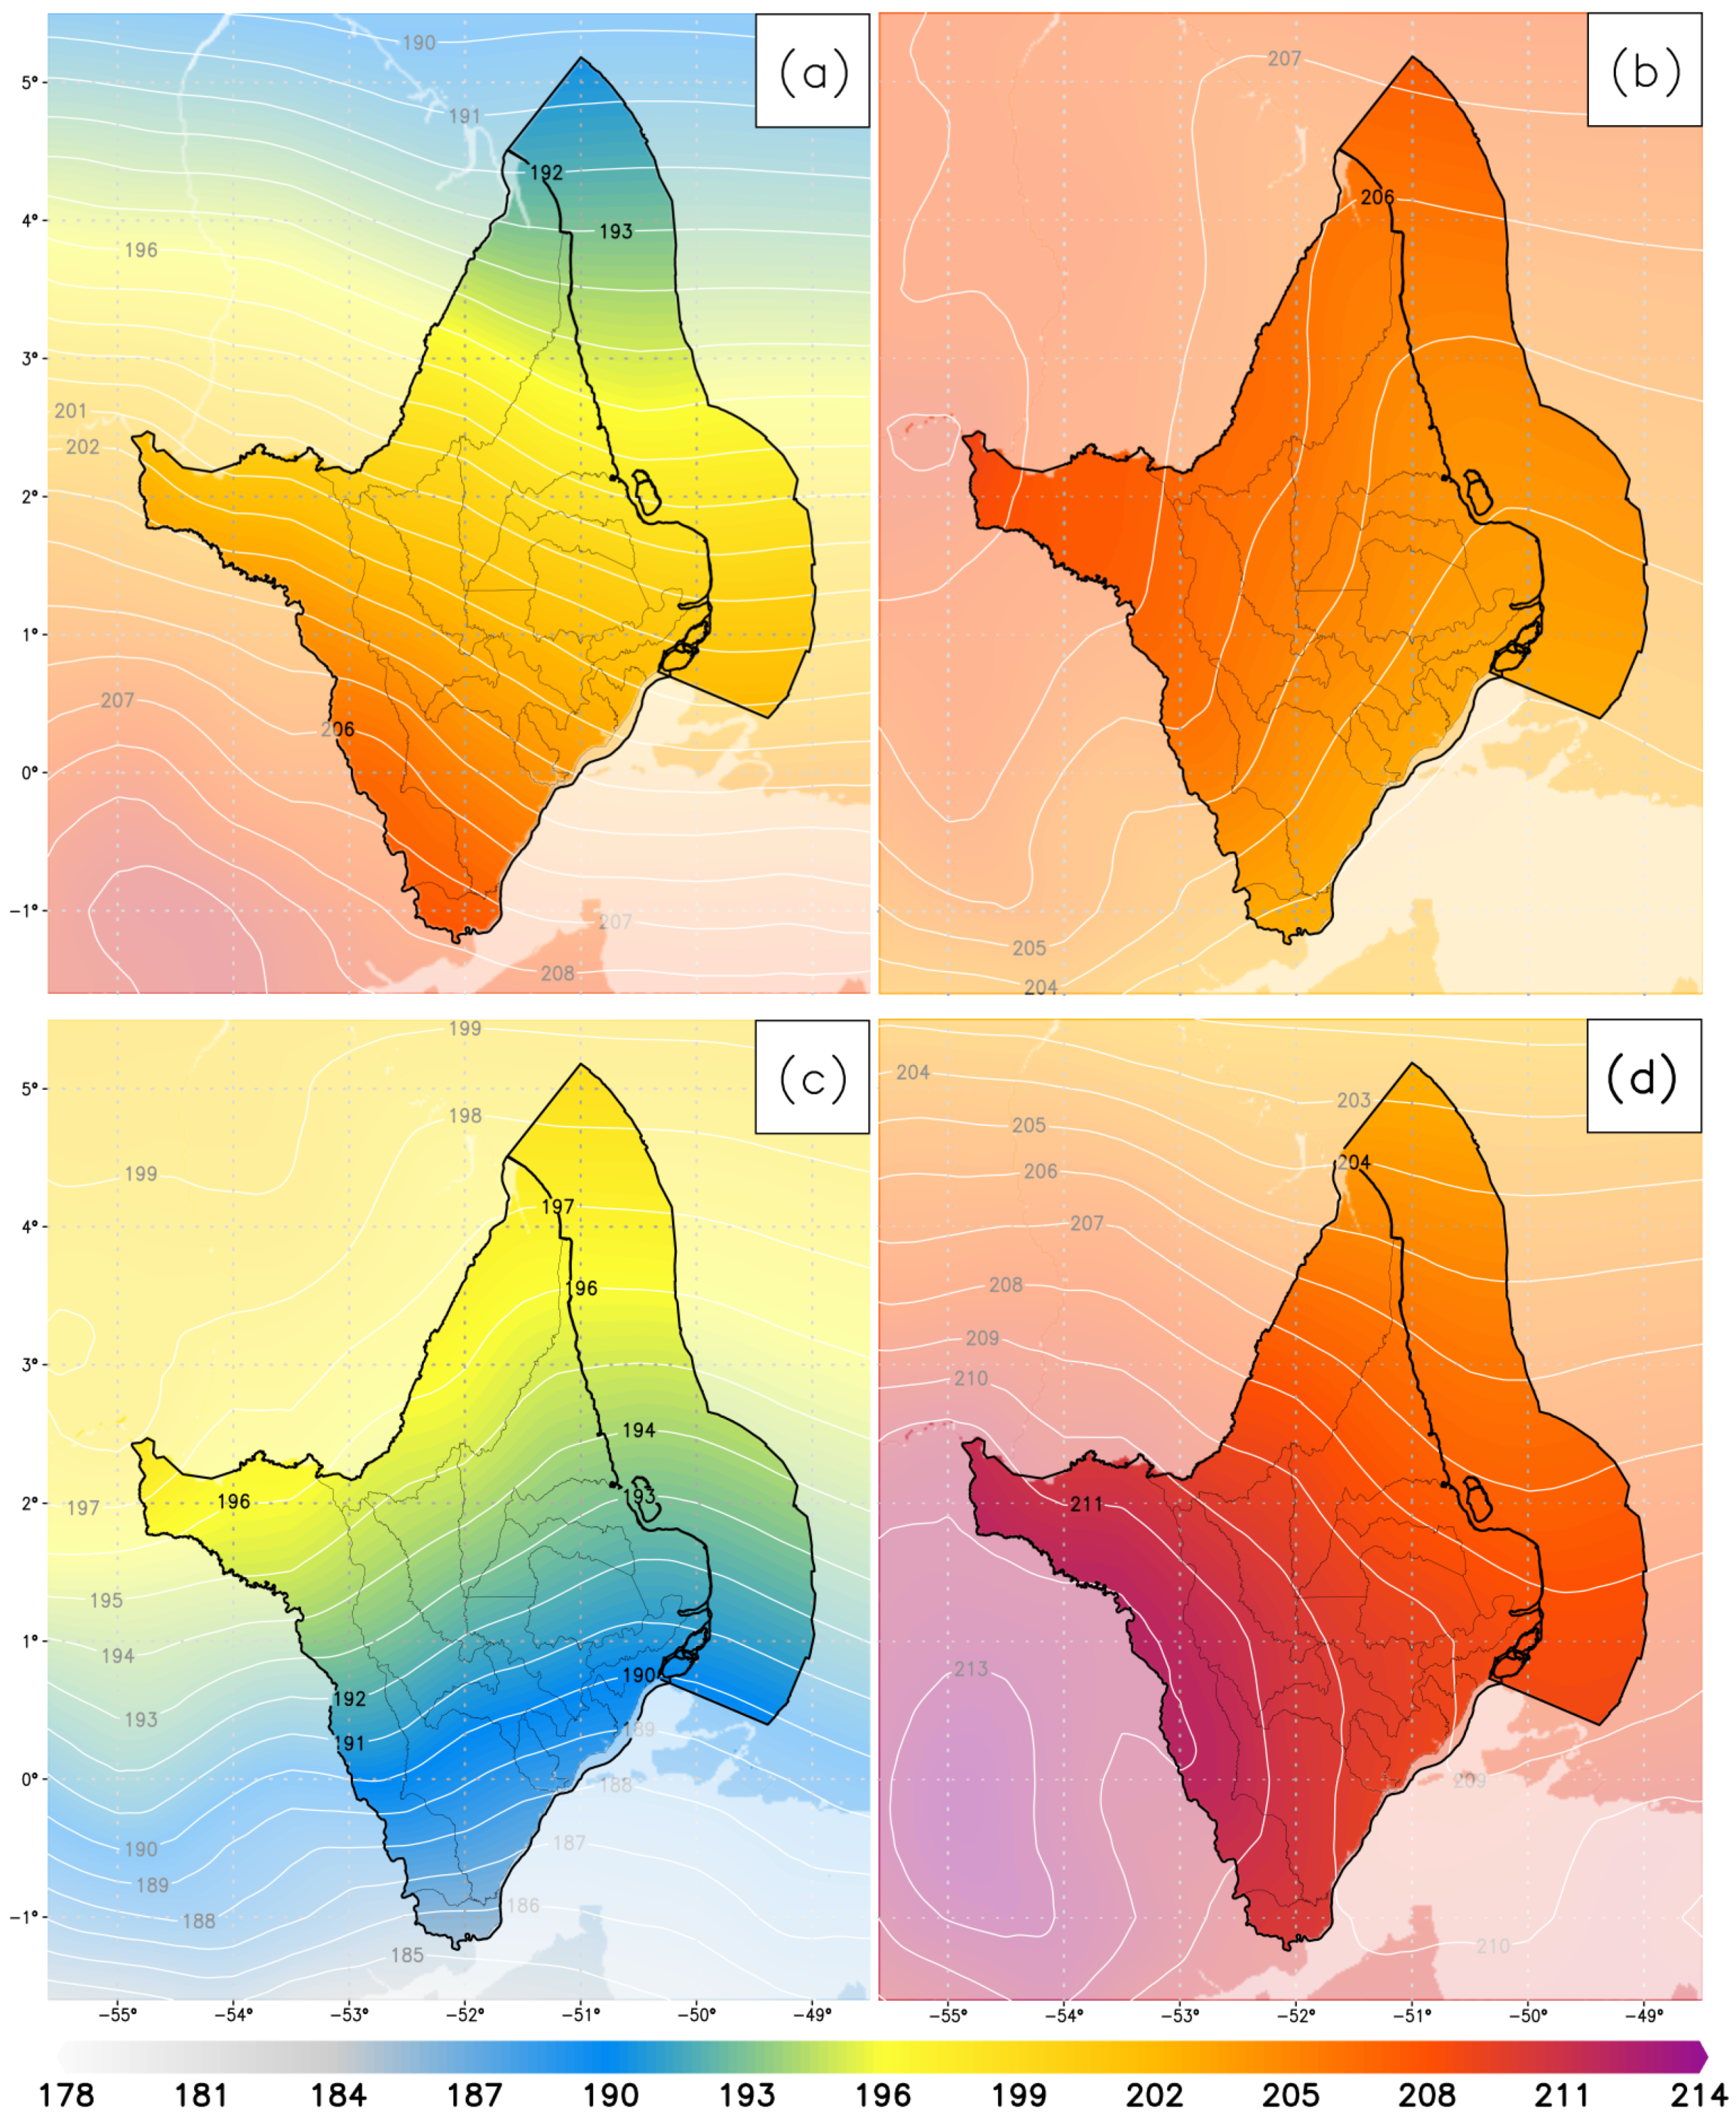
Figure 17 illustrates the average seasonal spatial distribution of the . The highest values were recorded during the autumn (203 to 207 W/m2) and spring (202 to 212 W/m2), while the lowest values were observed in the summer (190 to 208 W/m2) and winter (186 to 198 W/m2). The results reveal no pronounced variation in these values across different seasons. This lack of significant seasonal fluctuation can be attributed to the relatively uniform behavior of direct solar radiation in regions near the Equator, such as Amapá. In contrast to the higher latitudes, where seasonal changes in direct solar radiation are more noticeable, equatorial regions tend to exhibit a more consistent amount of direct solar radiation throughout the year.
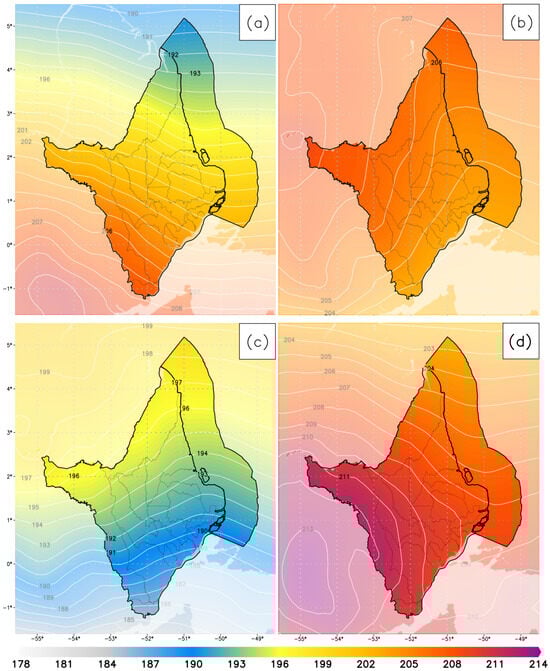
Figure 17.
Spatial distribution of the seasonal mean concentrated solar power output (W/m2) over 30 years (1991–2020) in (a) summer, (b) autumn, (c) winter, and (d) spring.
The slight variations in can be attributed to the behavior of direct solar radiation, a critical variable that influences the results, as can be seen in Equation (12). At the Equator, the Sun reaches its zenith during the autumn equinox (20 or 21 March) and the spring equinox (22 or 23 September). During these periods, direct solar radiation has its highest angle, and sunlight is more intense at the Equator. Regarding the smaller angle of direct solar radiation at the Equator, this occurs during the summer solstice (21 or 22 December) and winter solstice (20 or 21 June). Although the angle of direct solar radiation at the Equator is relatively high compared to other regions, the impact of this seasonal variation on (Figure 17) can be perceived.
4. Conclusions
This paper describes the characteristics of wind and solar energy generation potential in the state of Amapá, located in the extreme north of the Brazilian Amazon, utilizing hourly data from 1991 to 2020, sourced from the ERA5 reanalysis dataset. By harnessing various ERA5 metrics, we derived foundational parameters such as WPD, CF, PVP, and to evaluate both wind and solar energy generation.
One important characteristic that we analyzed was the variability in air density and its implications for the power curve for wind energy production, using the reference turbine NREL 5 MW. Our temporal and seasonal analyses corroborated the limited variability in air density, emphasizing the significance of adopting an average value of 1.17811 kg/m3 for WPD and CF calculations. Studies such as [75] have accentuated the risks of overlooking air density, which could induce inaccuracies in gauging wind energy potential—a concern shared by other researchers [76].
We examined the annual, seasonal, and diurnal fluxes of GHI, wind speed, and wind direction both onshore and offshore in Amapá. Predominantly, offshore regions registered peak wind speeds during the summer, while onshore regions peaked in the spring, attributable to heightened temperatures and the amplification of coastal breezes. Notably, the Amapá region exhibited an average wind speed of 4.2 m/s. The diurnal average wind speed at 100 m revealed higher speeds in three distinct periods, related to variations in heat transfer between the ocean surface and the atmosphere. Analyzing three decades of data, our results showed marked differences in wind resource efficacy within Amapá. While onshore regions showed a modest wind generation potential based only on WPD, offshore areas presented more promising WPD and CF values, suggesting optimal use of the wind resources.
With respect to the solar resources, the spring season revealed the zenith of GHI values, between 7.0 and 7.4 kW/m2, while autumn witnessed the nadir, between 4.6 and 5.2 kW/m2, greatly influenced by the ITCZ dynamics. Our evaluation of demonstrated a consistent efficiency nearing 70% across seasons, peaking during spring, and with a decrease in winter. Furthermore, the PVP metrics in Amapá exhibited a robust correlation with predominant cloud cover, requiring the recognition of influential oceanic–atmospheric patterns that intensify regional meteorological phenomena, ensuring the efficacy of photovoltaic systems. Offshore zones in Amapá stand out as solar energy hotspots, with an annual average solar irradiance of over 5.4 kWh/m2, which indicates an excellent location for expansive solar energy projects.
The results emphasize the importance of recognizing seasonal variations and their consequential impacts on energy generation potential. The profound influence of trade winds and oceanic–atmospheric patterns, such as El Niño–Southern Oscillation [77], on wind energy production cannot be understated. Similarly, for solar energy, the periodic changes in the ITCZ, which are essential for determining precipitation and cloud cover in the region, play a decisive role in modulating the amount of solar radiation that reaches the surface.
Thus, the results highlight the significant potential of Amapá’s coastal waters for offshore wind energy generation, given their consistent wind speeds and superior WPD and CF values. Similarly, certain offshore zones with notable solar irradiance stand out as candidates for expansive photovoltaic installations. This research emphasizes the need to design infrastructure that can weather the periodic and extreme changes brought about by influential oceanic–atmospheric patterns. Additionally, the seasonal variations in energy yield necessitate forward-thinking storage solutions to ensure uninterrupted energy supply. Therefore, our study not only unveils the depth of Amapá’s renewable energy prospects but also provides a strategic plan for its sustainable energy future, underscoring the key role of informed decision-making by all involved stakeholders.
Supplementary Materials
The following supporting information can be downloaded at: https://www.mdpi.com/1996-1073/16/22/7671/s1, Figure S1: Mean and standard deviation of air density over 30 years. Figure S2: Mean monthly variability in wind power density (W/m2) over 30 years in (a) January, (b) February, (c) March, (d) April, (e) May, (f) June, (g) July, (h) August, (i) September, (j) October, (k) November, and (l) December. Figure S3: Spatial distribution of the seasonal mean of the thermal efficiency of concentrated solar power over 30 years (1991–2020) in (a) summer, (b) autumn, (c) winter, and (d) spring.
Author Contributions
Conceptualization, J.S.d.R.; methodology, J.S.d.R., L.d.L.O., L.A.C.B. and R.R.M.d.L.; software, J.S.d.R. and N.d.A.B.; validation, J.S.d.R., V.d.A.D., N.d.A.B. and N.E.T.P.; investigation, J.S.d.R.; resources, A.M.d.M.; data curation, J.S.d.R., L.d.L.O. and S.d.A.E.; writing—original draft preparation, J.S.d.R.; writing—review and editing, N.d.A.B., A.C.B.A., V.d.A.D., L.A.C.B., L.d.L.O., S.d.A.E., M.d.F.A.d.M., N.E.T.P. and R.R.M.d.L.; project administration, A.M.d.M. and V.d.A.D. All authors have read and agreed to the published version of the manuscript.
Funding
This research was funded as part of the project Mapping the Wind Resource of the Brazilian Equatorial Margin, grant number 920008/2021, from the Ministry of Science, Technology, and Innovation of Brazil, in partnership with the SENAI Institute of Innovation—Renewable Energies. The APC was financed by the SENAI Institute of Innovation—Renewable Energies.
Data Availability Statement
The data used in this manuscript can be made available by writing to the corresponding authors.
Acknowledgments
We thank the SENAI Institute of Innovation team for administrative and technical support. Funding was provided by the Ministry of Science, Technology, and Innovation of Brazil (MCTIC) and the SENAI Institute of Innovation—Renewable Energies.
Conflicts of Interest
The authors declare no conflict of interest.
References
- REN21. Renewables 2022 Global Status; REN21: Paris, France, 2022; ISBN 9783948393045. [Google Scholar]
- Intergovernmental Panel on Climate Change (IPCC). Impacts of 1.5°C Global Warming on Natural and Human Systems. In Global Warming of 1.5°C: IPCC Special Report on Impacts of Global Warming of 1.5°C above Pre-Industrial Levels in Context of Strengthening Response to Climate Change, Sustainable Development, and Efforts to Eradicate Poverty; Cambridge University Press: Cambridge, UK, 2022; pp. 175–312. [Google Scholar] [CrossRef]
- IRENA. Renewable Power Generation Costs in 2019; IRENA: Abu Dhabi, United Arab Emirates, 2020. [Google Scholar]
- Cozzi, L.; Gould, T.; Bouckart, S.; Crow, D.; Kim, T.-Y.; McGlade, C.; Olejarnik, P.; Wanner, B.; Wetzel, D. World Energy Outlook 2020; International Energy Agency: Paris, France, 2020; Volume 2050. [Google Scholar]
- EIA. International Energy Outlook 2021; EIA: Singapore, 2021. [Google Scholar]
- Coriolano, T.R.; Signorelli, N.T.; Lugon Junior, J.; Moreira, M.A.C.; Silva, M.G.A.J.d. Study of the temporal variation of offshore wind energy potential in southeast Brazil. Ciência Nat. 2022, 44, e6. [Google Scholar] [CrossRef]
- Dantas, E.J.d.A.; Rosa, L.P.; Silva, N.F.d.; Pereira, M.G. Wind Power on the Brazilian Northeast Coast, from the Whiff of Hope to Turbulent Convergence: The Case of the Galinhos Wind Farms. Sustainability 2019, 11, 3802. [Google Scholar] [CrossRef]
- de Souza Nascimento, M.M.; Shadman, M.; Silva, C.; de Freitas Assad, L.P.; Estefen, S.F.; Landau, L. Offshore wind and solar complementarity in Brazil: A theoretical and technical potential assessment. Energy Convers. Manag. 2022, 270, 116194. [Google Scholar] [CrossRef]
- do Carmo, L.F.R.; de Almeida Palmeira, A.C.P.; de Jesus Lauriano Antonio, C.F.; de Jesus Palmeira, R.M. Comparison of wind profile estimation methods for calculating offshore wind potential for the Northeast region of Brazil. Int. J. Energy Environ. Eng. 2022, 13, 365–375. [Google Scholar] [CrossRef]
- Freitas, I.G.F.d.; Gomes, H.B.; Peña, M.; Mitsopoulos, P.; Nova, T.S.V.; da Silva, K.M.R.; Calheiros, A.J.P. Evaluation of Wind and Wave Estimates from CMEMS Reanalysis for Brazil’s Offshore Energy Resource Assessment. Wind 2022, 2, 586–598. [Google Scholar] [CrossRef]
- Freitas, M.M.d. Geological risk evaluation in the eolic energy planning on rio Grande do Norte, Brazil. Mercator 2016, 15, 117–129. [Google Scholar] [CrossRef]
- Nardelli, A.; Futai, M.M. Assessment of Brazilian onshore wind turbines foundations. Rev. IBRACON Estruturas Mater. 2022, 15, e15508. [Google Scholar] [CrossRef]
- Nascimento, L.N. Wind Energy and Policy in Brazil: An Assessment of the State of Bahia. In Renewable Energy; Springer International Publishing: Cham, Switzerland, 2019; pp. 131–155. [Google Scholar]
- Wu, C.; Wang, Q.; Luo, K.; Fan, J. Mesoscale impact of the sea surface on the performance of offshore wind farms. J. Clean. Prod. 2022, 372, 133741. [Google Scholar] [CrossRef]
- Wang, Q.; Luo, K.; Wu, C.; Zhu, Z.; Fan, J. Mesoscale simulations of a real onshore wind power base in complex terrain: Wind farm wake behavior and power production. Energy 2022, 241, 122873. [Google Scholar] [CrossRef]
- Wang, Q.; Luo, K.; Wu, C.; Tan, J.; He, R.; Ye, S.; Fan, J. Inter-farm cluster interaction of the operational and planned offshore wind power base. J. Clean. Prod. 2023, 396, 136529. [Google Scholar] [CrossRef]
- Viveros, F.; Ladha, A.; Galvao, R. The Crisis in Amapá is a Warning for the World; Al Jazeera: Doha, Qatar, 2020. [Google Scholar]
- Brasil, B.N. Apagão no Amapá: O que se Sabe Sobre o Blecaute que Afeta o Estado. BBC News Bras. 2020. Available online: https://www.bbc.com/portuguese/brasil-54843654 (accessed on 20 April 2023).
- G1 Apagão no Amapá: Entenda as Causas e Consequências da Falta de Energia no Estado. 2020. Available online: https://g1.globo.com/ap/amapa/noticia/2020/11/06/apagao-no-amapa-entenda-as-causas-e-consequencias-da-falta-de-energia-no-estado.ghtml (accessed on 20 April 2023).
- Machado, L.; Tavares, V. “Somos Excluídos do país”: Amapaenses veem “Descaso Nacional” por Apagão em Meio a Protestos e Violência. BBC News Bras. 2020. Available online: https://www.bbc.com/portuguese/brasil-54911520 (accessed on 21 April 2023).
- Dasari, H.P.; Desamsetti, S.; Langodan, S.; Attada, R.; Kunchala, R.K.; Viswanadhapalli, Y.; Knio, O.; Hoteit, I. High-resolution assessment of solar energy resources over the Arabian Peninsula. Appl. Energy 2019, 248, 354–371. [Google Scholar] [CrossRef]
- Drake, F.; Mulugetta, Y. Assessment of solar and wind energy resources in Ethiopia. I. Solar energy. Sol. Energy 1996, 57, 205–217. [Google Scholar] [CrossRef]
- Fathi Nassar, Y.; Yassin Alsadi, S. Assessment of solar energy potential in Gaza Strip-Palestine. Sustain. Energy Technol. Assess. 2019, 31, 318–328. [Google Scholar] [CrossRef]
- Gulaliyev, M.G.; Mustafayev, E.R.; Mehdiyeva, G.Y. Assessment of Solar Energy Potential and Its Ecological-Economic Efficiency: Azerbaijan Case. Sustainability 2020, 12, 1116. [Google Scholar] [CrossRef]
- Hassan, Q.; Abbas, M.K.; Abdulateef, A.M.; Abdulateef, J.; Mohamad, A. Assessment the potential solar energy with the models for optimum tilt angles of maximum solar irradiance for Iraq. Case Stud. Chem. Environ. Eng. 2021, 4, 100140. [Google Scholar] [CrossRef]
- Hossain, J.; Sinha, V.; Kishore, V.V.N. A GIS based assessment of potential for windfarms in India. Renew. Energy 2011, 36, 3257–3267. [Google Scholar] [CrossRef]
- Martins, F.R.; Pereira, E.B.; Silva, S.A.B.; Abreu, S.L.; Colle, S. Solar energy scenarios in Brazil, Part one: Resource assessment. Energy Policy 2008, 36, 2853–2864. [Google Scholar] [CrossRef]
- Migoya, E.; Crespo, A.; Jiménez, Á.; García, J.; Manuel, F. Wind energy resource assessment in Madrid region. Renew. Energy 2007, 32, 1467–1483. [Google Scholar] [CrossRef]
- Ortega, A.; Escobar, R.; Colle, S.; de Abreu, S.L. The state of solar energy resource assessment in Chile. Renew. Energy 2010, 35, 2514–2524. [Google Scholar] [CrossRef]
- Poje, D.; Cividini, B. Assessment of wind energy potential in croatia. Sol. Energy 1988, 41, 543–554. [Google Scholar] [CrossRef]
- Saeed, M.A.; Ahmed, Z.; Hussain, S.; Zhang, W. Wind resource assessment and economic analysis for wind energy development in Pakistan. Sustain. Energy Technol. Assess. 2021, 44, 101068. [Google Scholar] [CrossRef]
- Vinhoza, A.; Schaeffer, R. Brazil’s offshore wind energy potential assessment based on a Spatial Multi-Criteria Decision Analysis. Renew. Sustain. Energy Rev. 2021, 146, 111185. [Google Scholar] [CrossRef]
- Belhamadia, A.; Mansor, M.; Younis, M.A. Assessment of wind and solar energy potentials in Malaysia. In Proceedings of the 2013 IEEE Conference on Clean Energy and Technology (CEAT), Langkawi, Malaysia, 18–20 November 2013; pp. 152–157. [Google Scholar]
- Carrasco-Díaz, M.; Rivas, D.; Orozco-Contreras, M.; Sánchez-Montante, O. An assessment of wind power potential along the coast of Tamaulipas, northeastern Mexico. Renew. Energy 2015, 78, 295–305. [Google Scholar] [CrossRef]
- Jonkman, J.; Butterfield, S.; Musial, W.; Scott, G. Definition of a 5-MW Reference Wind Turbine for Offshore System Development; National Renewable Energy Lab. (NREL): Golden, CO, USA, 2009. [Google Scholar]
- National Renewable Energy Laboratory about NREL. Available online: https://www.nrel.gov/about/ (accessed on 25 April 2023).
- IBGE-Instituto Brasileiro de Geografia e Estatística Sinopse Do Censo Demográfico. Available online: http://www.censo2010.ibge.gov.br (accessed on 5 September 2020).
- Hersbach, H.; Dee, D. ERA5 Reanalysis is in Production. ECMWF Newsl. 2016. Available online: https://www.ecmwf.int/en/newsletter/147/news/era5-reanalysis-production (accessed on 5 April 2023).
- Dee, D.P.; Uppala, S.M.; Simmons, A.J.; Berrisford, P.; Poli, P.; Kobayashi, S.; Andrae, U.; Balmaseda, M.A.; Balsamo, G.; Bauer, P.; et al. The ERA-Interim reanalysis: Configuration and performance of the data assimilation system. Q. J. R. Meteorol. Soc. 2011, 137, 553–597. [Google Scholar] [CrossRef]
- Ndiaye, A.; Moussa, M.S.; Dione, C.; Sawadogo, W.; Bliefernicht, J.; Dungall, L.; Kunstmann, H. Projected Changes in Solar PV and Wind Energy Potential over West Africa: An Analysis of CORDEX-CORE Simulations. Energies 2022, 15, 9602. [Google Scholar] [CrossRef]
- Carreno-Madinabeitia, S.; Ibarra-Berastegi, G.; Sáenz, J.; Ulazia, A. Long-term changes in offshore wind power density and wind turbine capacity factor in the Iberian Peninsula (1900–2010). Energy 2021, 226, 120364. [Google Scholar] [CrossRef]
- Ulazia, A.; Nafarrate, A.; Ibarra-Berastegi, G.; Sáenz, J.; Carreno-Madinabeitia, S. The consequences of air density variations over northeastern Scotland for offshore wind energy potential. Energies 2019, 12, 2635. [Google Scholar] [CrossRef]
- Sawadogo, W.; Reboita, M.S.; Faye, A.; da Rocha, R.P.; Odoulami, R.C.; Olusegun, C.F.; Adeniyi, M.O.; Abiodun, B.J.; Sylla, M.B.; Diallo, I.; et al. Current and future potential of solar and wind energy over Africa using the RegCM4 CORDEX-CORE ensemble. Clim. Dyn. 2021, 57, 1647–1672. [Google Scholar] [CrossRef]
- Ibarra-Berastegi, G.; Ulazia, A.; Saénz, J.; González-Rojí, S.J. Evaluation of lebanon’s offshore-wind-energy potential. J. Mar. Sci. Eng. 2019, 7, 361. [Google Scholar] [CrossRef]
- Manwell, J.F.; McGowan, J.G.; Rogers, A.L. Wind Energy Explained: Theory, Design and Application, 2nd ed.; John Wiley & Sons, Ltd: Amherst, MA, USA, 2009; ISBN 0470846127. [Google Scholar]
- Manwell, J.F.; McGowan, J.G.; Rogers, A.L. Wind Energy Explained; Wiley: New York, NY, USA, 2009; ISBN 9780470015001. [Google Scholar]
- Wallace, J.M.; Hobbs, P.V. Atmospheric Science: An Introductory Survey, 2nd ed.; Academic Press: Cambridge, MA, USA, 2006; ISBN 012732951X. [Google Scholar]
- Pallabazzer, R. Evaluation of wind-generator potentiality. Sol. Energy 1995, 55, 49–59. [Google Scholar] [CrossRef]
- Pallabazzer, R. Previsional estimation of the energy output of windgenerators. Renew. Energy 2004, 29, 413–420. [Google Scholar] [CrossRef]
- Villanueva, D.; Feijóo, A. Wind power distributions: A review of their applications. Renew. Sustain. Energy Rev. 2010, 14, 1490–1495. [Google Scholar] [CrossRef]
- Mabel, M.C.; Fernandez, E. Estimation of Energy Yield From Wind Farms Using Artificial Neural Networks. IEEE Trans. Energy Convers. 2009, 24, 459–464. [Google Scholar] [CrossRef]
- Burton, T.; Jenkins, N.; Sharpe, D.; Bossanyi, E. Wind Energy Handbook, 2nd ed.; John Wiley & Sons, Ltd: West Sussex, UK, 2011; ISBN 0471489972. [Google Scholar]
- European Wind Energy Association. Wind Energy-The Facts; Earthscan: London, UK, 2012; ISBN 9781844077106. [Google Scholar]
- IEC 61400-12-1:2022; Wind Turbines-Part 12-1: Power Performance Measurements of Electricity Producing Wind Turbines. International Electrical Commission: Geneva, Switzerland, 2005.
- Jerez, S.; Tobin, I.; Vautard, R.; Montávez, J.P.; López-Romero, J.M.; Thais, F.; Bartok, B.; Christensen, O.B.; Colette, A.; Déqué, M.; et al. The impact of climate change on photovoltaic power generation in Europe. Nat. Commun. 2015, 6, 10014. [Google Scholar] [CrossRef] [PubMed]
- Mavromatakis, F.; Makrides, G.; Georghiou, G.; Pothrakis, A.; Franghiadakis, Y.; Drakakis, E.; Koudoumas, E. Modeling the photovoltaic potential of a site. Renew. Energy 2010, 35, 1387–1390. [Google Scholar] [CrossRef]
- Tamizhmani, G.; Ji, L.; Tang, Y.; Petacci, L.; Osterwald, C. Photovoltaic Module Thermal/Wind Performance: Long-Term Monitoring and Model Development For Energy Rating. In Proceedings of the NCPV and Solar Program Review Meeting Proceedings, Denver, CO, USA, 24–26 March 2003; pp. 936–939. [Google Scholar]
- Chenni, R.; Makhlouf, M.; Kerbache, T.; Bouzid, A. A detailed modeling method for photovoltaic cells. Energy 2007, 32, 1724–1730. [Google Scholar] [CrossRef]
- Wild, M.; Folini, D.; Henschel, F.; Fischer, N.; Müller, B. Projections of long-term changes in solar radiation based on CMIP5 climate models and their influence on energy yields of photovoltaic systems. Sol. Energy 2015, 116, 12–24. [Google Scholar] [CrossRef]
- Zou, L.; Wang, L.; Li, J.; Lu, Y.; Gong, W.; Niu, Y. Global surface solar radiation and photovoltaic power from Coupled Model Intercomparison Project Phase 5 climate models. J. Clean. Prod. 2019, 224, 304–324. [Google Scholar] [CrossRef]
- Yang, L.; Jiang, J.; Liu, T.; Li, Y.; Zhou, Y.; Gao, X. Projections of future changes in solar radiation in China based on CMIP5 climate models. Glob. Energy Interconnect. 2018, 1, 452–459. [Google Scholar] [CrossRef]
- Zuluaga, C.F.; Avila-Diaz, A.; Justino, F.B.; Martins, F.R.; Ceron, W.L. The climate change perspective of photovoltaic power potential in Brazil. Renew. Energy 2022, 193, 1019–1031. [Google Scholar] [CrossRef]
- Madhlopa, A. Solar Receivers for Thermal Power Generation; Elsevier: Amsterdam, The Netherlands, 2022; ISBN 9780323852715. [Google Scholar]
- Crook, J.A.; Jones, L.A.; Forster, P.M.; Crook, R. Climate change impacts on future photovoltaic and concentrated solar power energy output. Energy Environ. Sci. 2011, 4, 3101–3109. [Google Scholar] [CrossRef]
- Dudley, V.; Evans, L.; Matthews, C. Test Results, Industrial Solar Technology Parabolic trough Solar Collector; Sandia National Lab. (SNL-NM): Albuquerque, NM, USA; Livermore, CA, USA, 1995. [Google Scholar]
- Salati, E.; Vose, P.B. Amazon Basin: A system in equilibrium. Science 1984, 225, 129–138. [Google Scholar] [CrossRef] [PubMed]
- Marengo, J.A.; Nobre, C.A.; Tomasella, J.; Oyama, M.D.; de Oliveira, G.S.; de Oliveira, R.; Camargo, H.; Alves, L.M.; Brown, I.F. The drought of Amazonia in 2005. J. Clim. 2008, 21, 495–516. [Google Scholar] [CrossRef]
- Archer, C.L.; Jacobson, M.Z. Evaluation of global wind power. J. Geophys. Res. D Atmos. 2005, 110, 1–20. [Google Scholar] [CrossRef]
- Technical University of Denmark (DTU). Global Wind Atlas 3.0; Technical University of Denmark (DTU): Lyngby, Denmark, 2021. Available online: https://globalwindatlas.info/en/ (accessed on 13 April 2023).
- Tavares, J.P.N. Características Da Climatologia De Macapá-Ap. Caminhos Geogr. 2014, 15, 138–151. [Google Scholar] [CrossRef]
- Pereira, E.B.; Martins, F.R.; Gonçalves, A.; Costa, R.S.; Lima, F.J.L.d.; Rüther, R.; Abreu, S.L.d.; Tiepolo, G.M.; Pereira, S.V.; Souza, J.G.d. Brazilian Atlas of Solar Energy, 2nd ed.; Inpe: São José dos Campos, Brazil, 2017; 80p. [Google Scholar] [CrossRef]
- Wexler, R. Theory and Observations of Land and Sea Breezes. Bull. Am. Meteorol. Soc. 1946, 27, 272–287. [Google Scholar] [CrossRef]
- Xia, G.; Draxl, C.; Optis, M.; Redfern, S. Detecting and characterizing simulated sea breezes over the US northeastern coast with implications for offshore wind energy. Wind Energy Sci. 2022, 7, 815–829. [Google Scholar] [CrossRef]
- Liu, F.; Sun, F.; Liu, W.; Wang, T.; Wang, H.; Wang, X.; Lim, W.H. On wind speed pattern and energy potential in China. Appl. Energy 2019, 236, 867–876. [Google Scholar] [CrossRef]
- Ibarra-berastegi, G.; Gonzalez-roji, S.J.; Ulazia, A.; Carreno-medinabeitia, S.; Saenz, J. Calculation of Lebanon offshore wind energy potential using ERA5 reanalysis: Impact of seasonal air density changes. In Proceedings of the 2019 Fourth International Conference on Advances in Computational Tools for Engineering Applications (ACTEA), Beirut, Lebanon, 3–5 July 2019; pp. 1–6. [Google Scholar] [CrossRef]
- Ulazia, A.; Sáenz, J.; Ibarra-Berastegi, G.; González-Rojí, S.J.; Carreno-Madinabeitia, S. Global estimations of wind energy potential considering seasonal air density changes. Energy 2019, 187, 115938. [Google Scholar] [CrossRef]
- Trenberth, K.E. The Definition of El Niño. Bull. Am. Meteorol. Soc. 1997, 78, 2771–2777. [Google Scholar] [CrossRef]


Disclaimer/Publisher’s Note: The statements, opinions and data contained in all publications are solely those of the individual author(s) and contributor(s) and not of MDPI and/or the editor(s). MDPI and/or the editor(s) disclaim responsibility for any injury to people or property resulting from any ideas, methods, instructions or products referred to in the content. |
© 2023 by the authors. Licensee MDPI, Basel, Switzerland. This article is an open access article distributed under the terms and conditions of the Creative Commons Attribution (CC BY) license (https://creativecommons.org/licenses/by/4.0/).