
Effect of Ripple Control on Induction Motors


Abstract
:1. Introduction
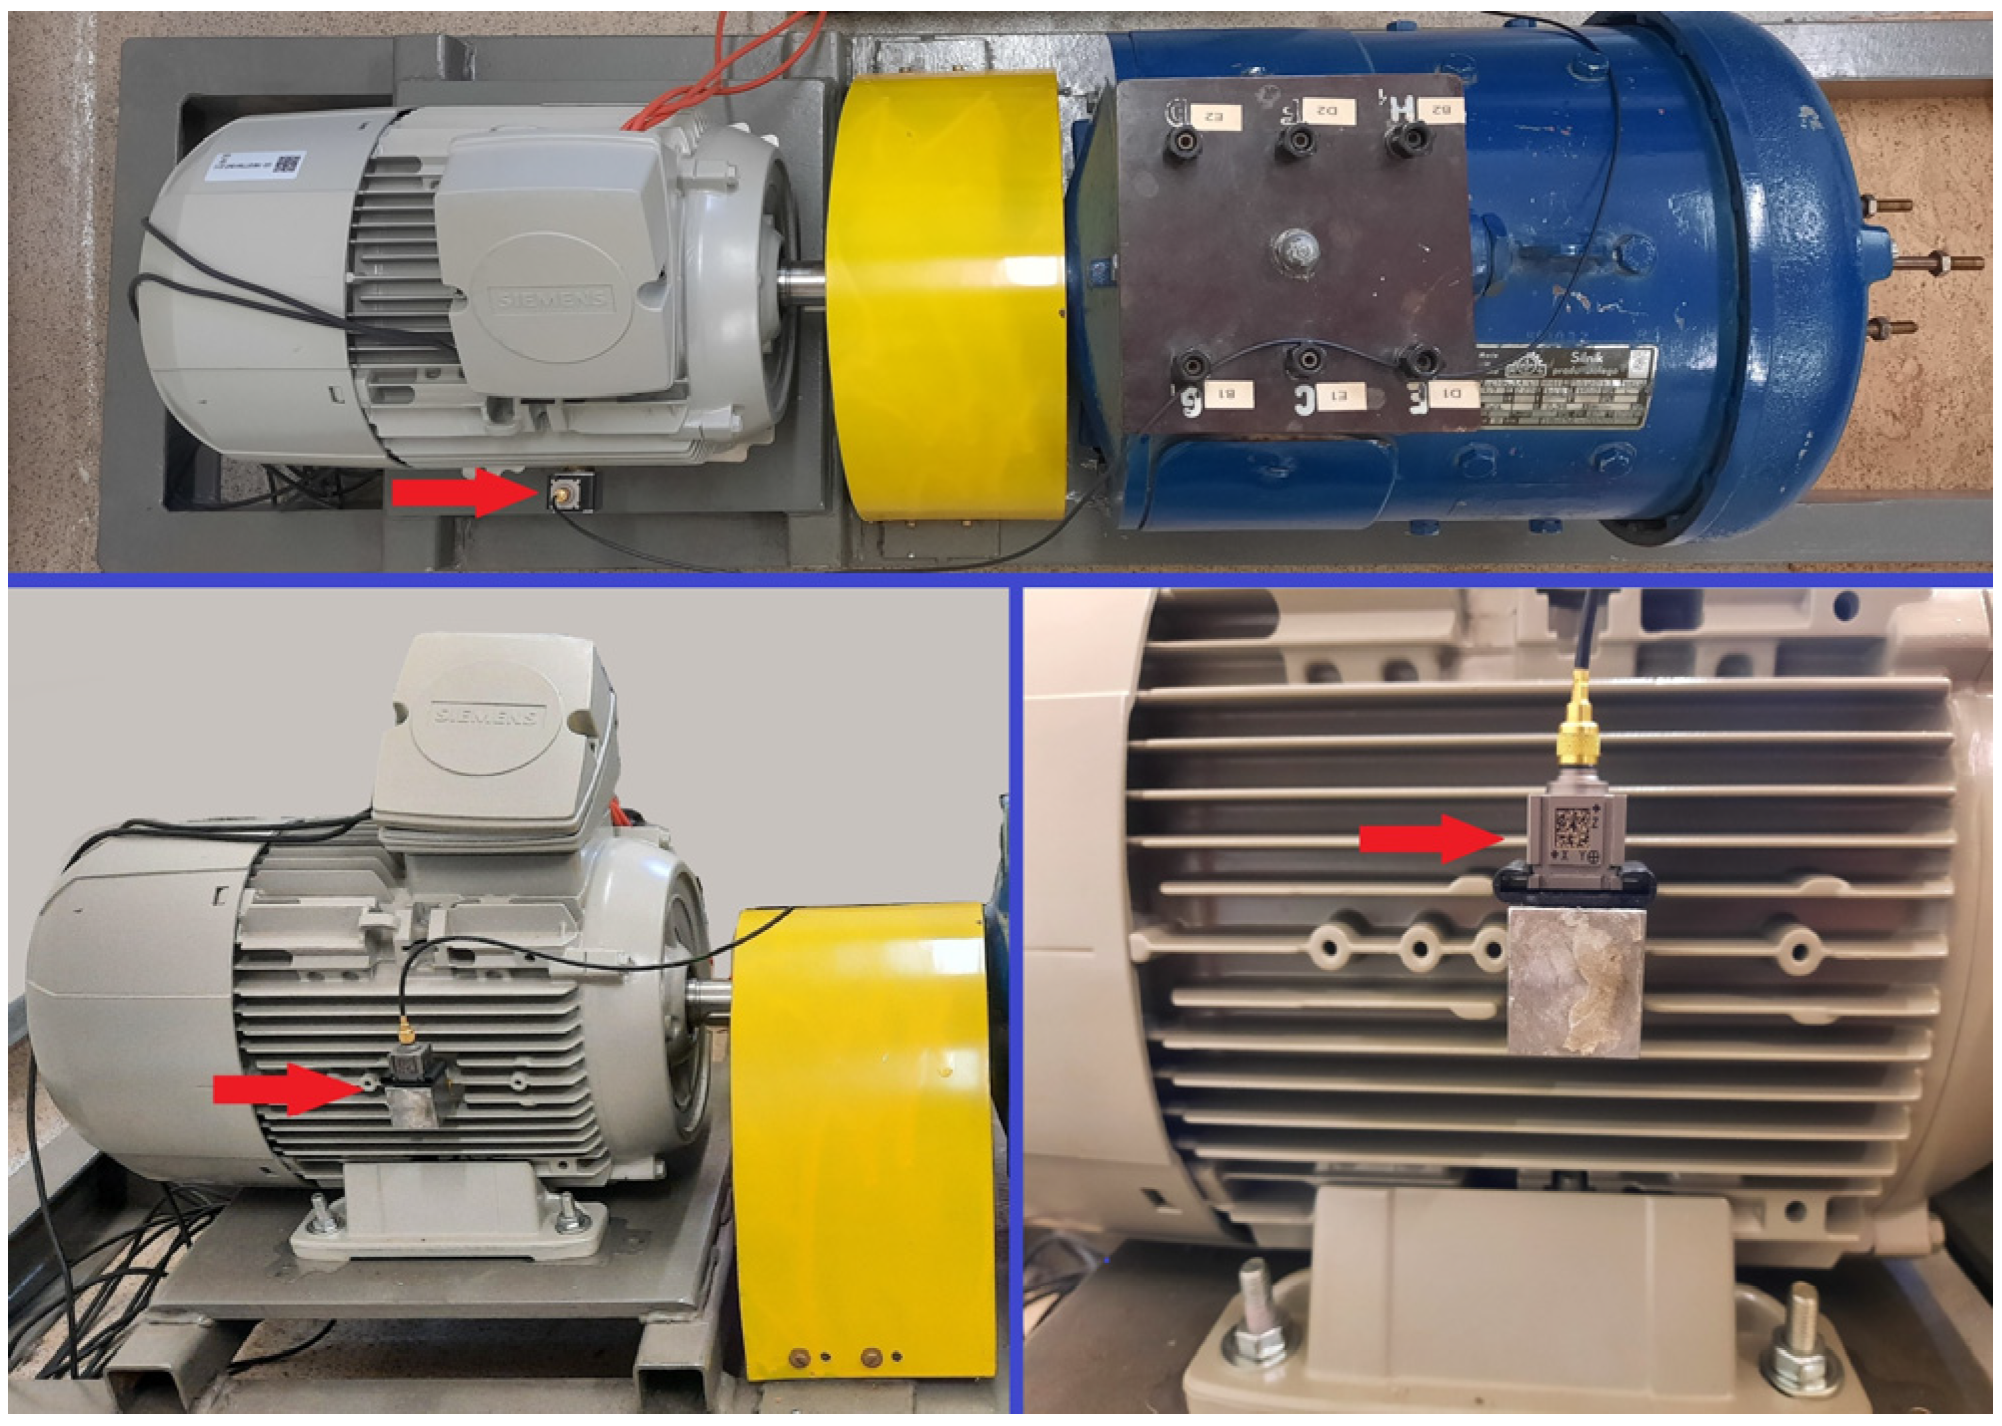
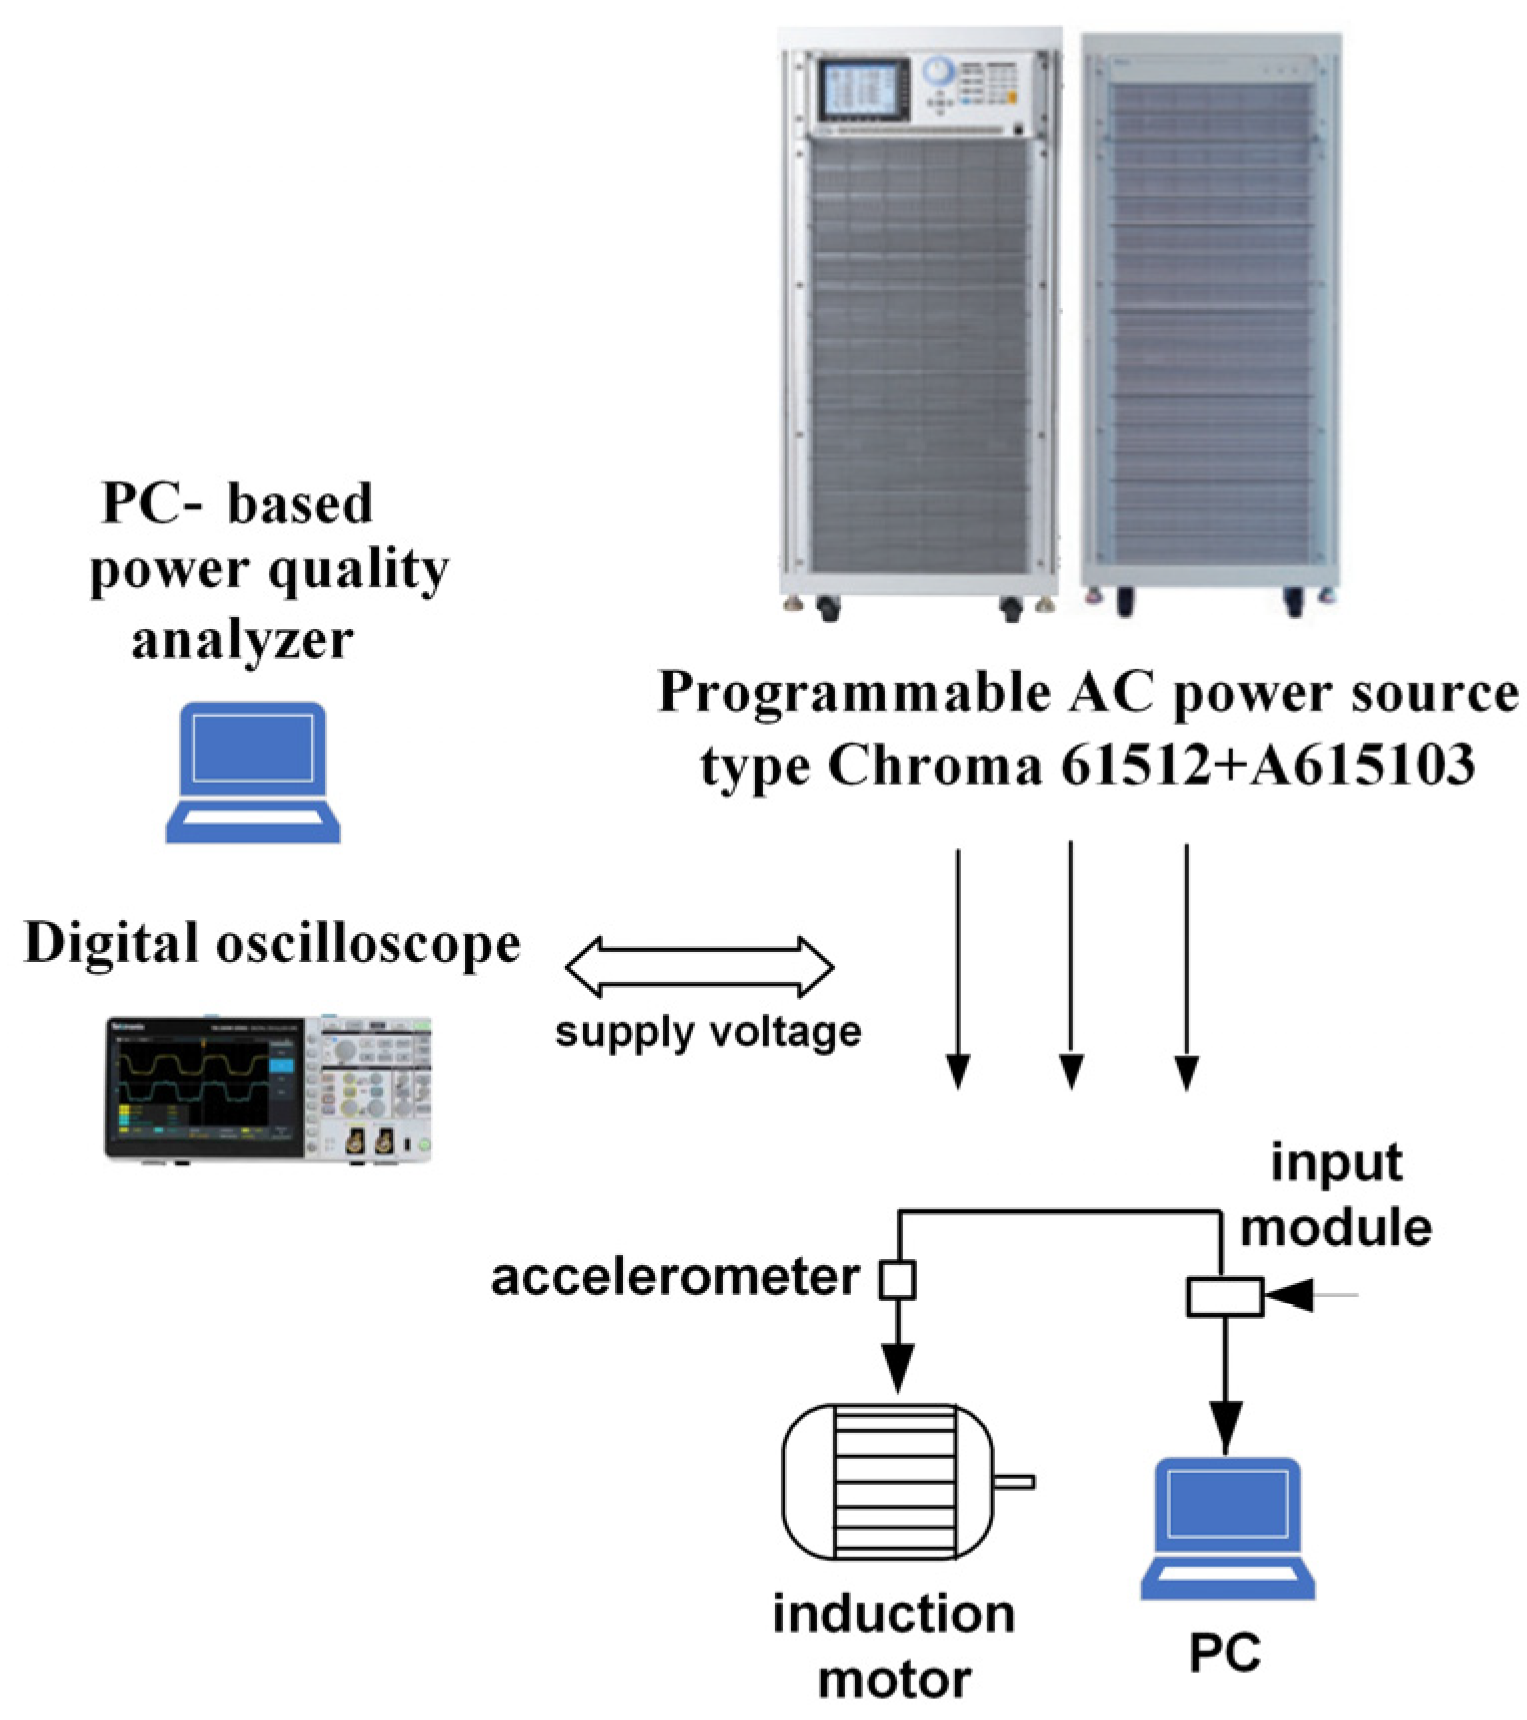
2. Methodology
3. Results
3.1. Preliminary Remarks
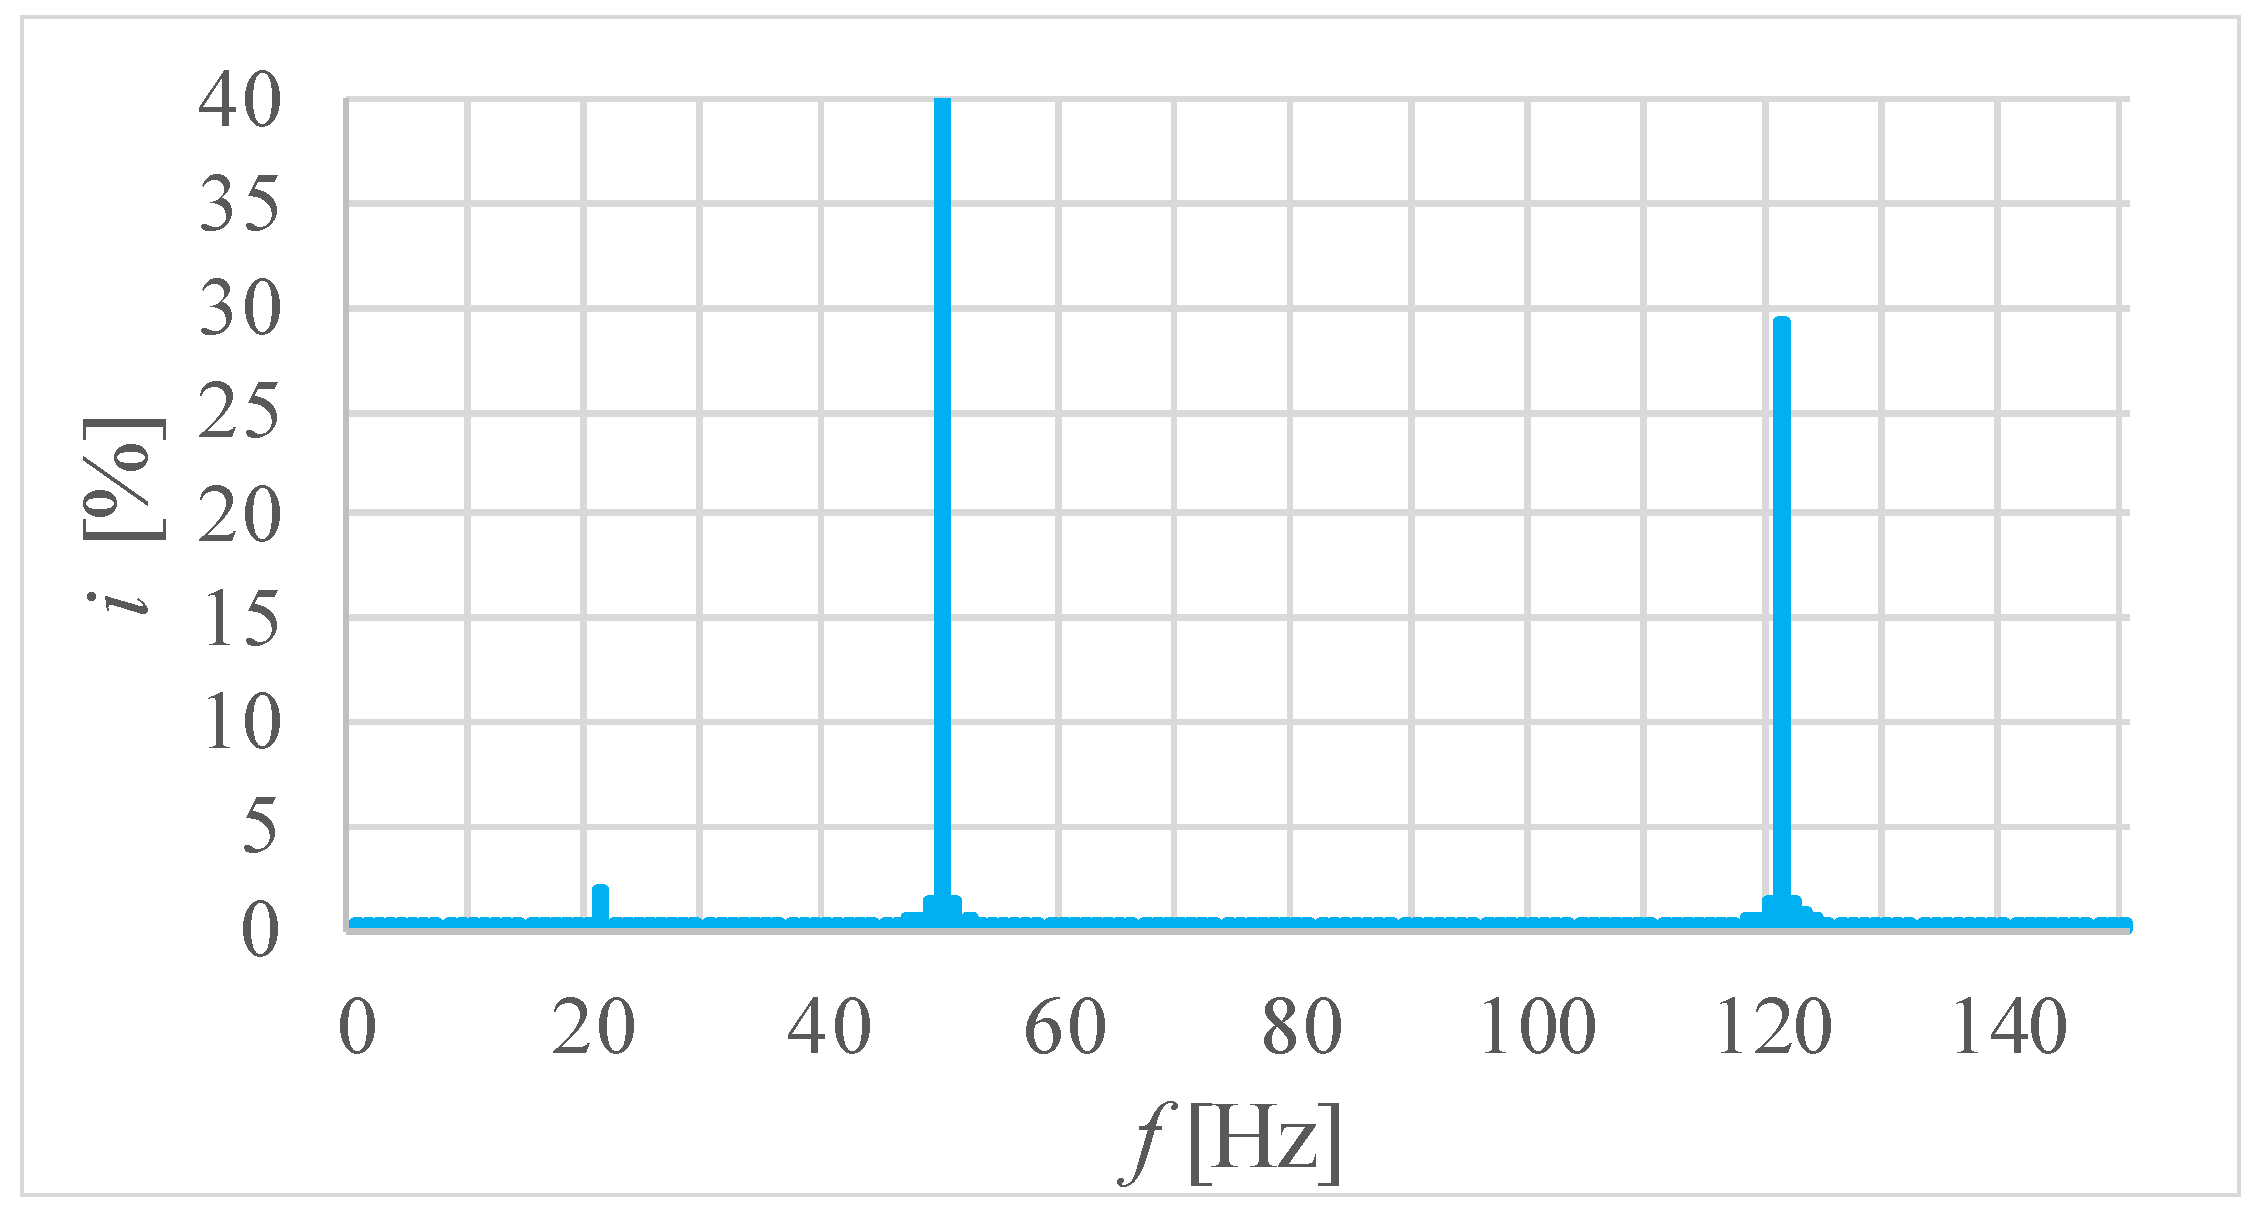
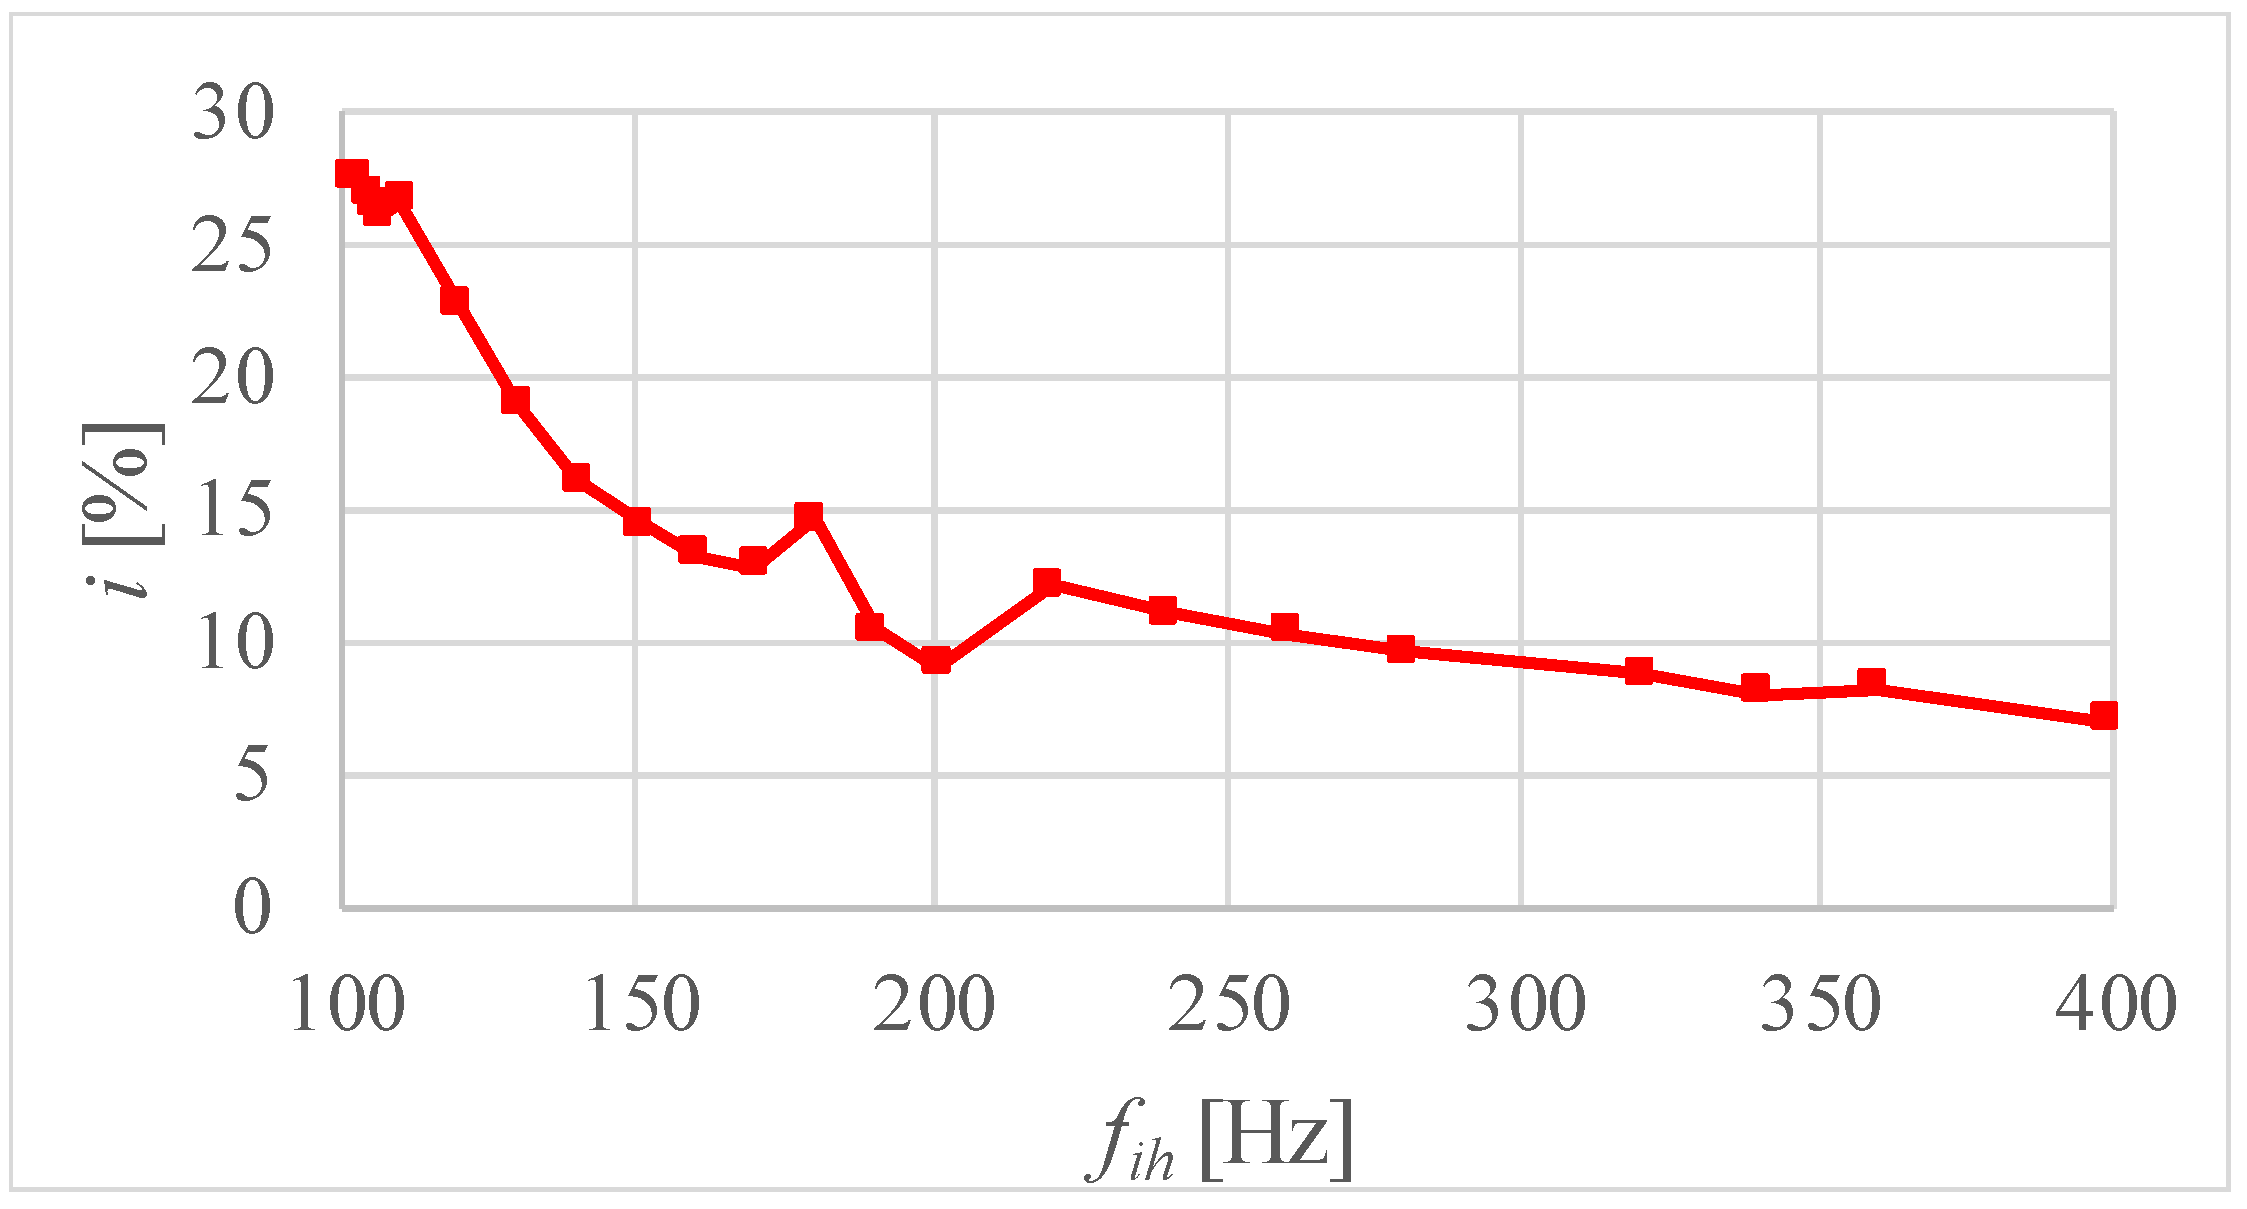
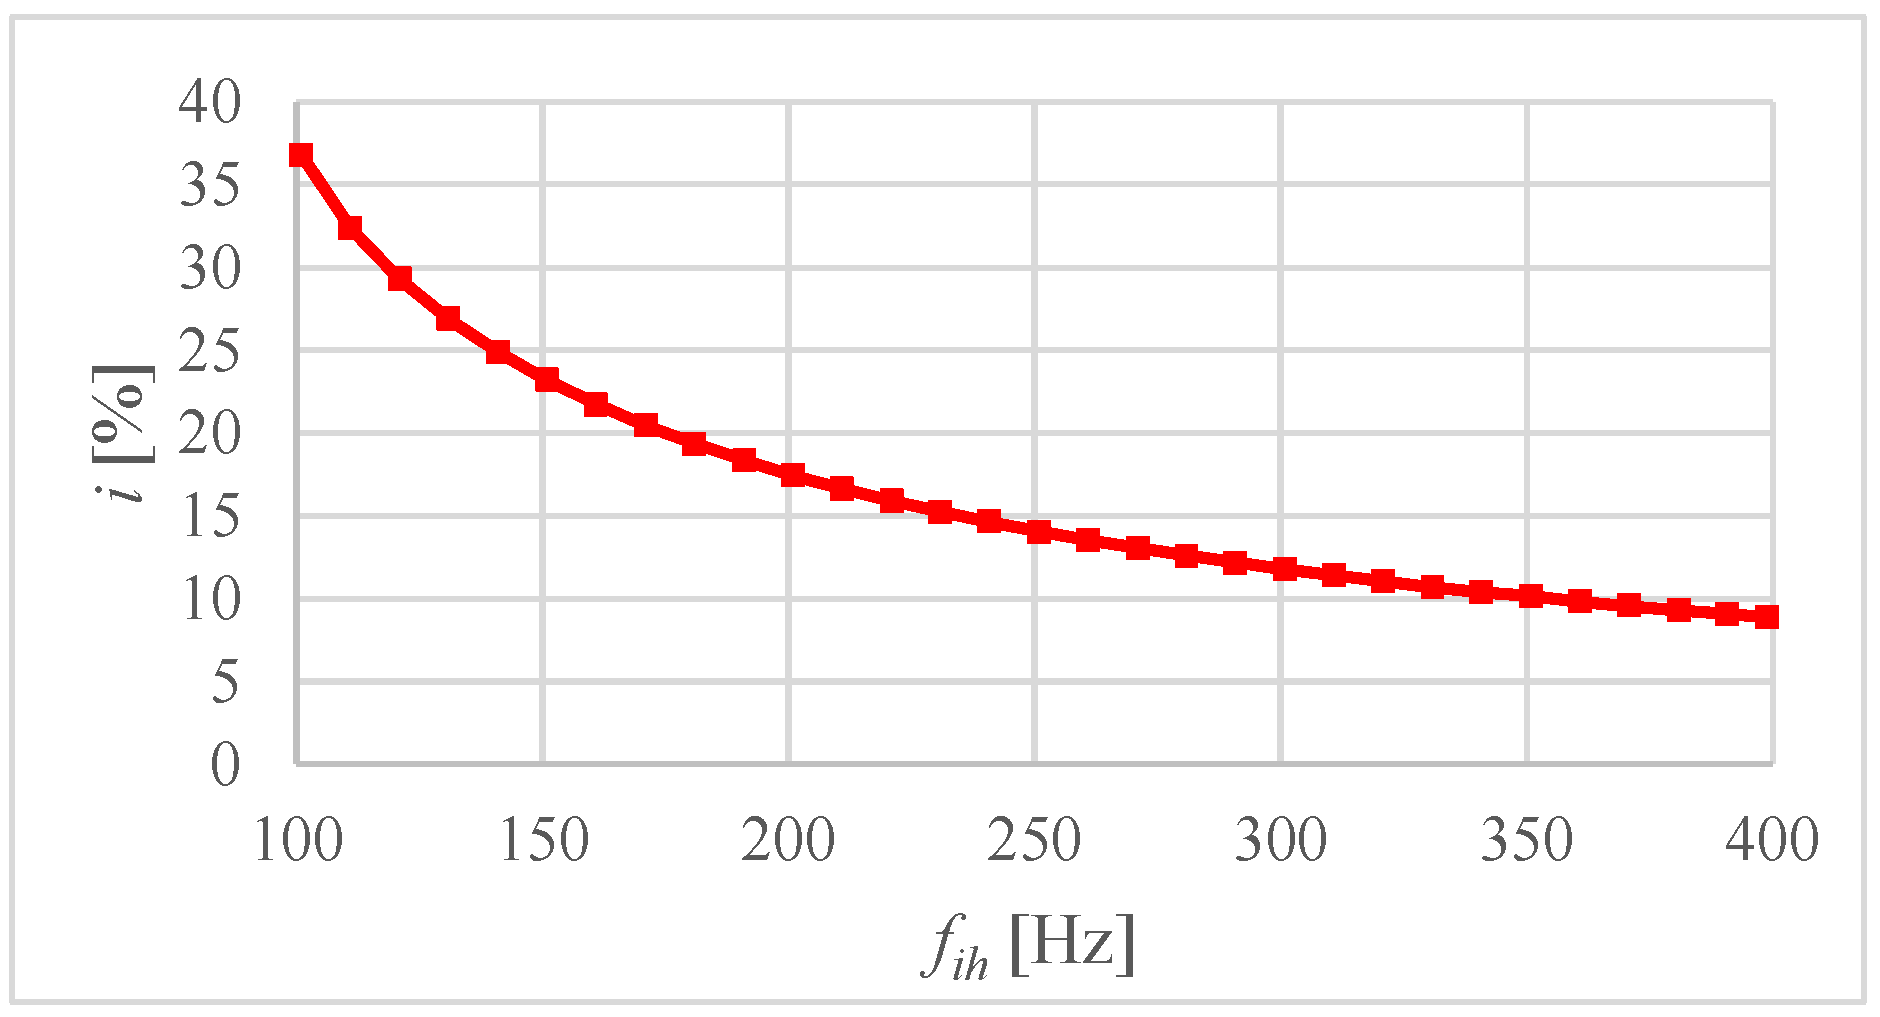
3.2. Currents
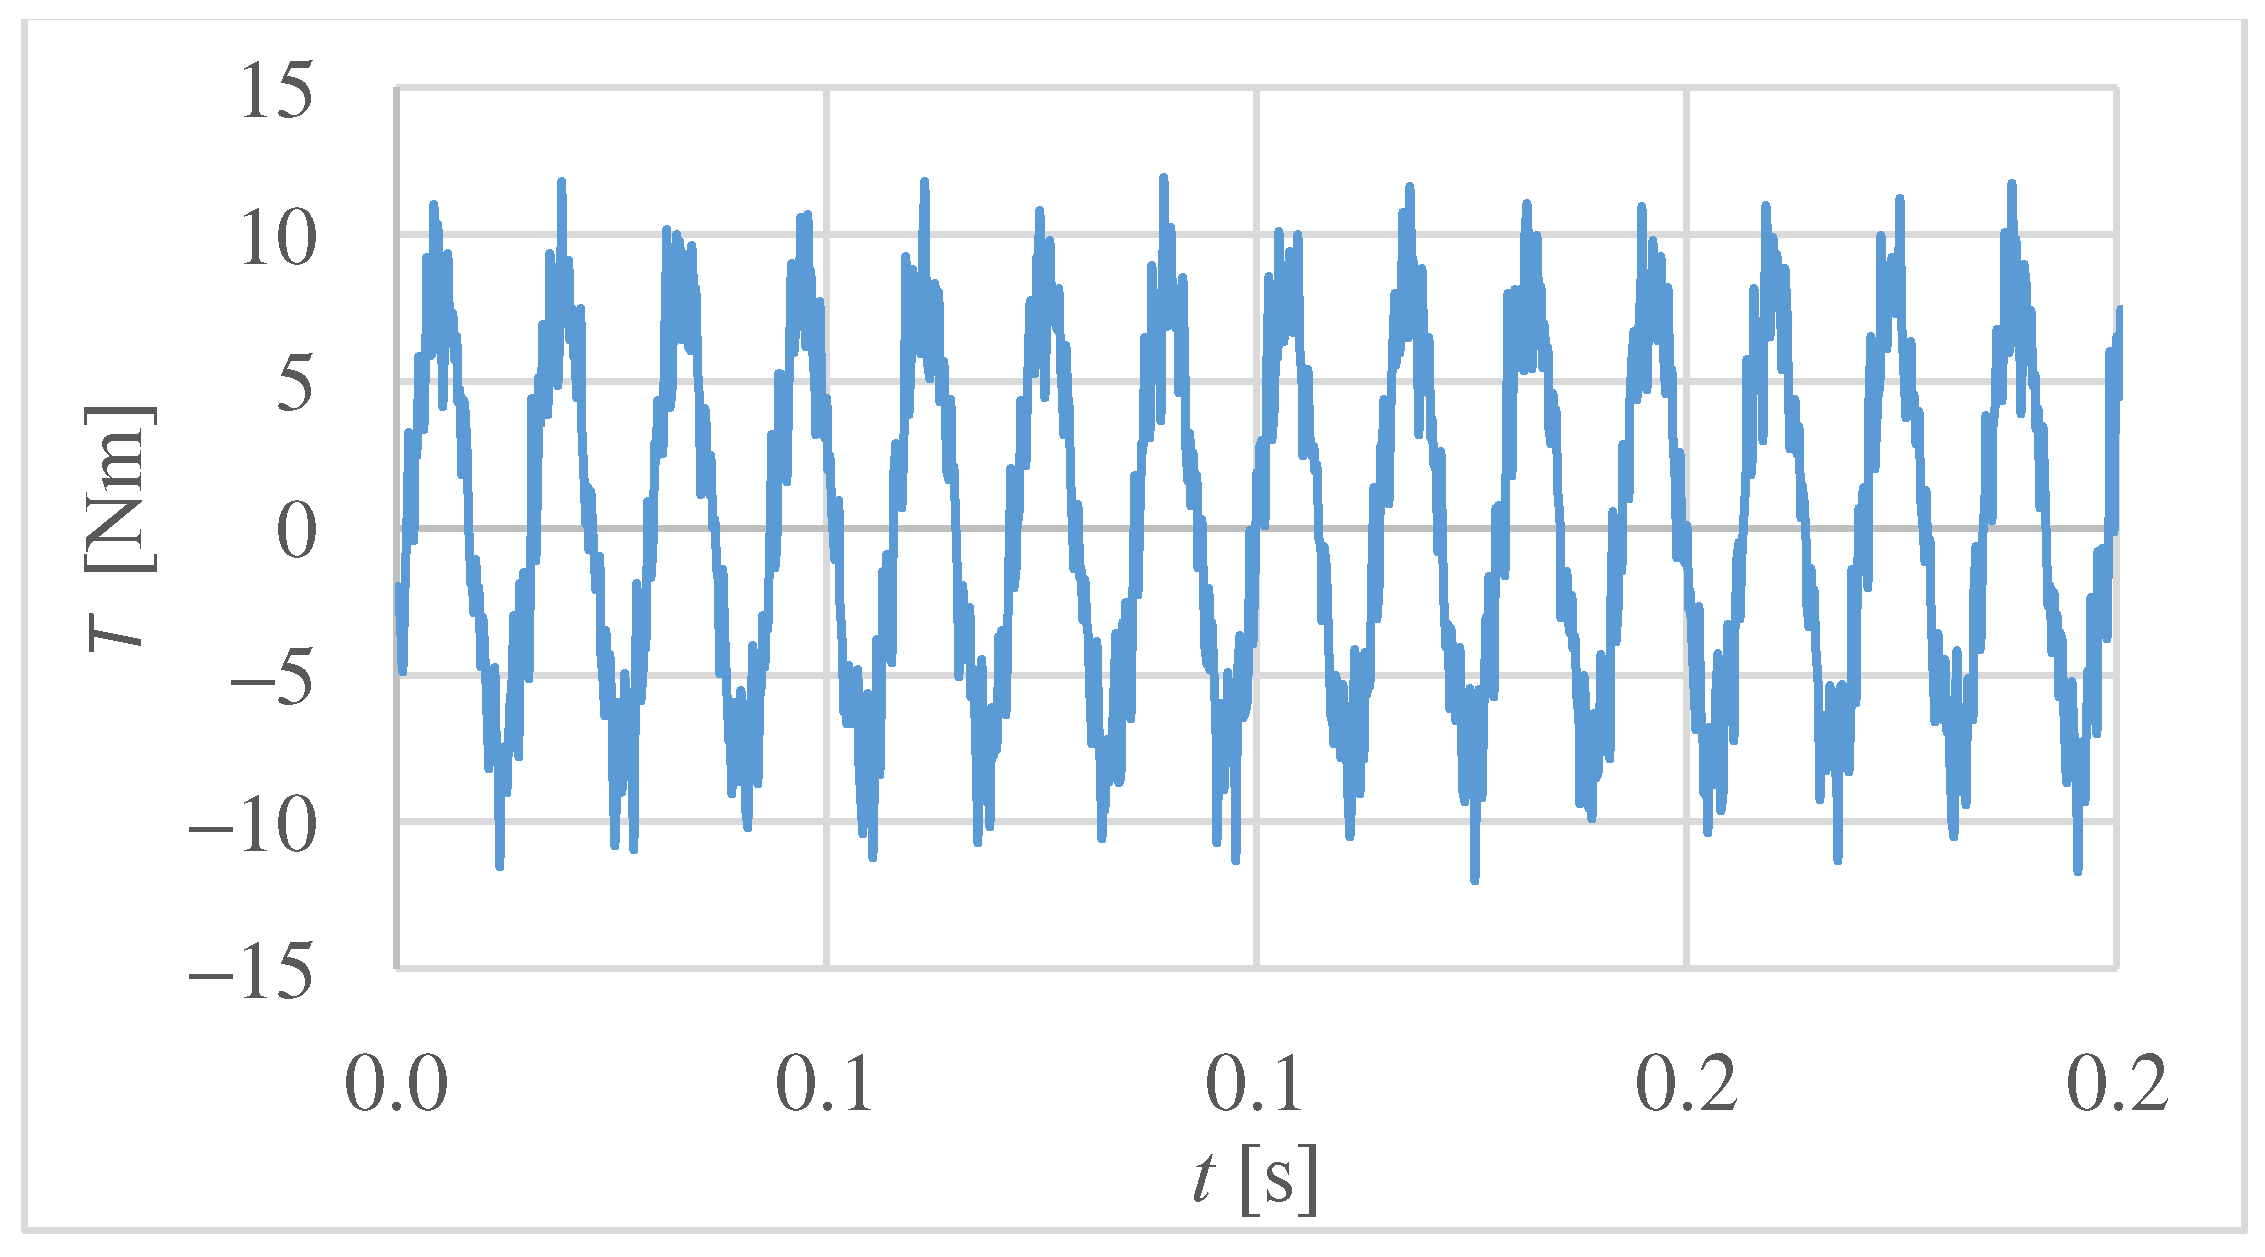
3.3. Electromagnetic Torque Pulsations
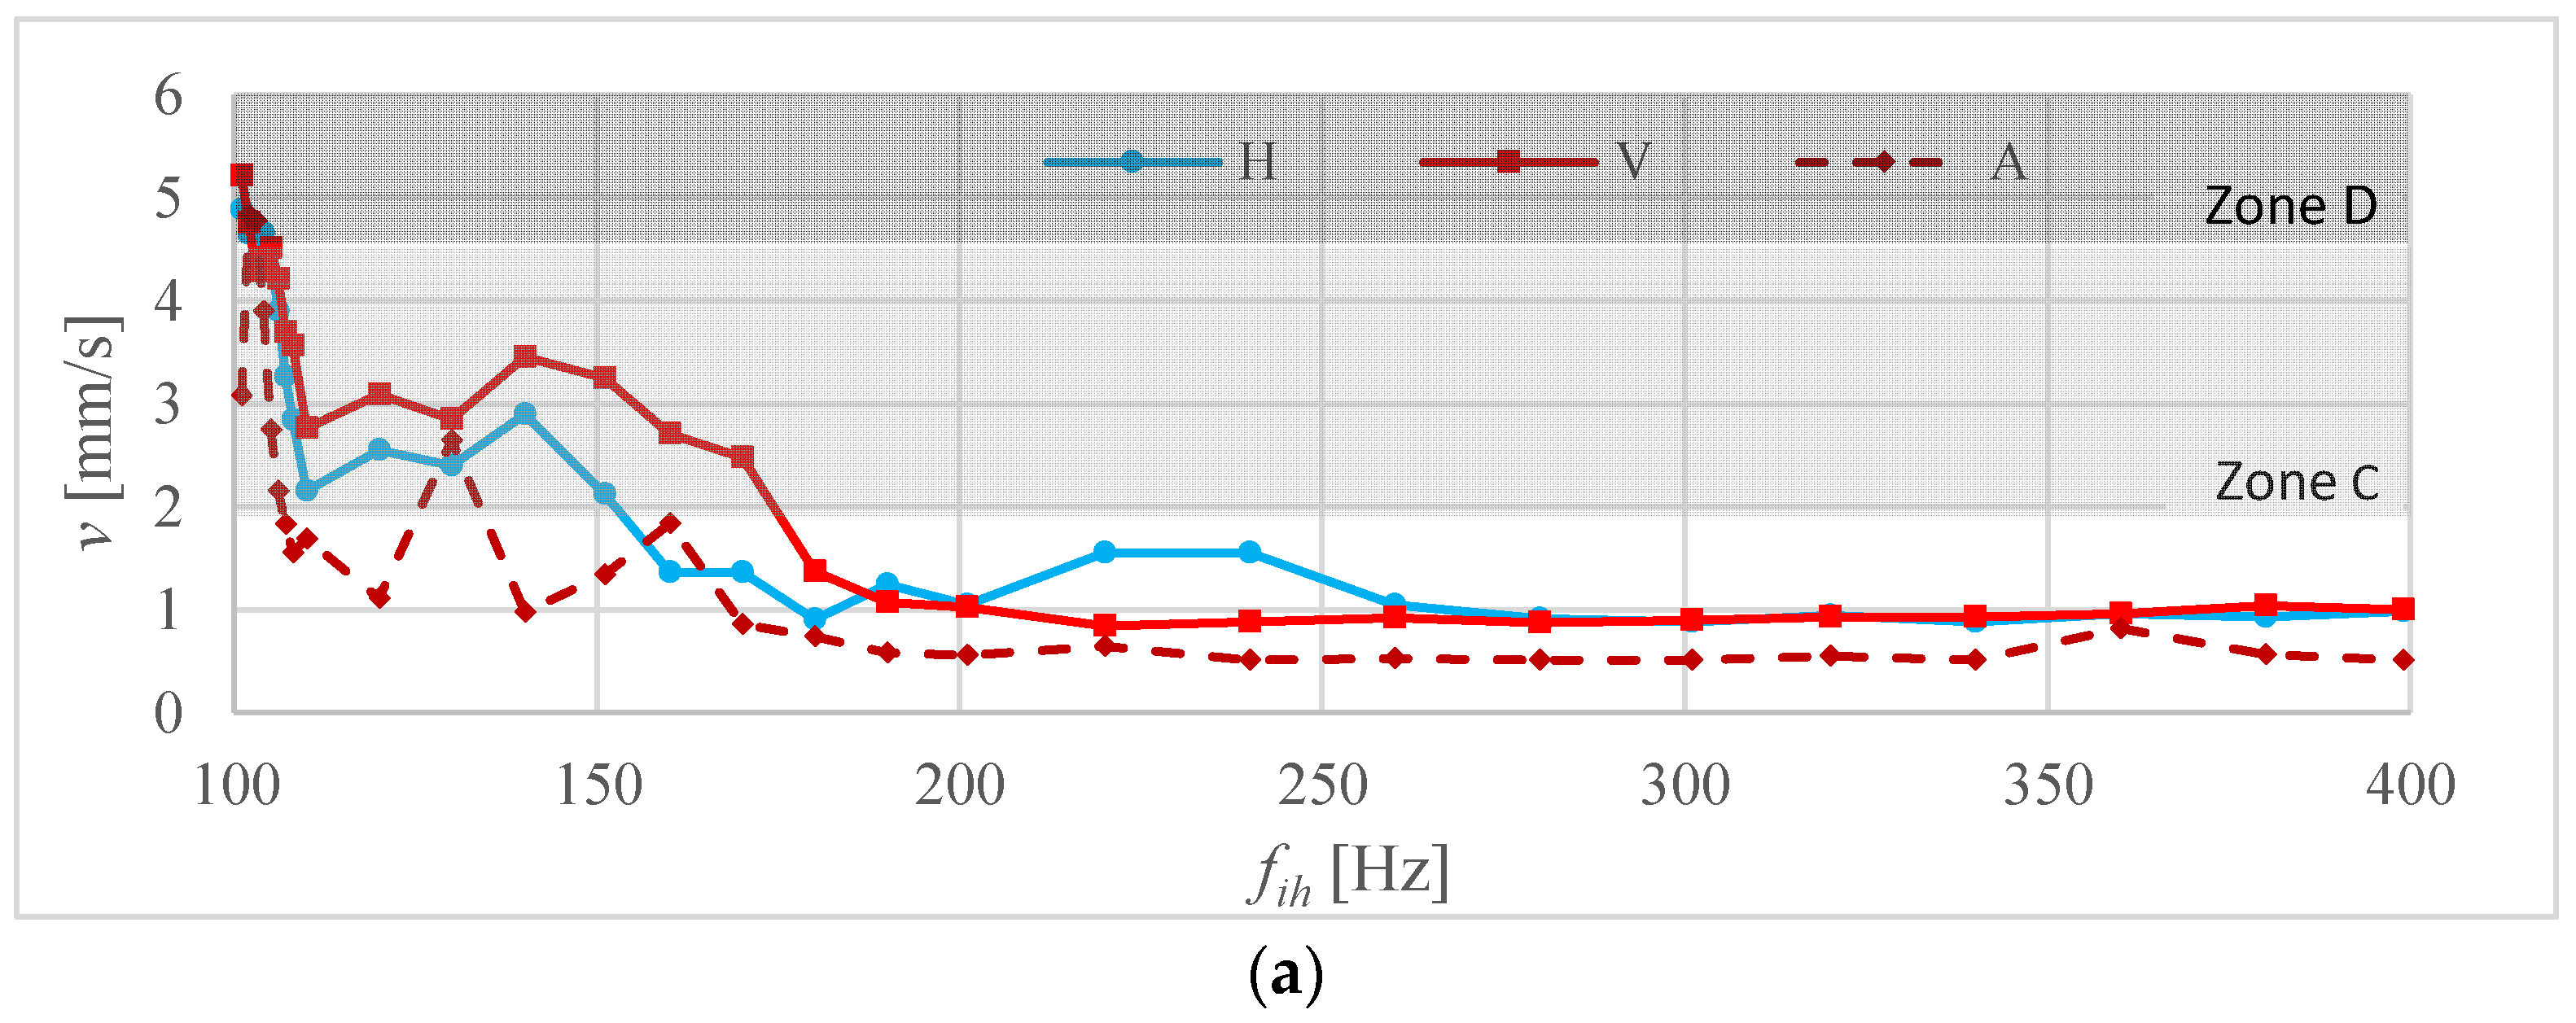
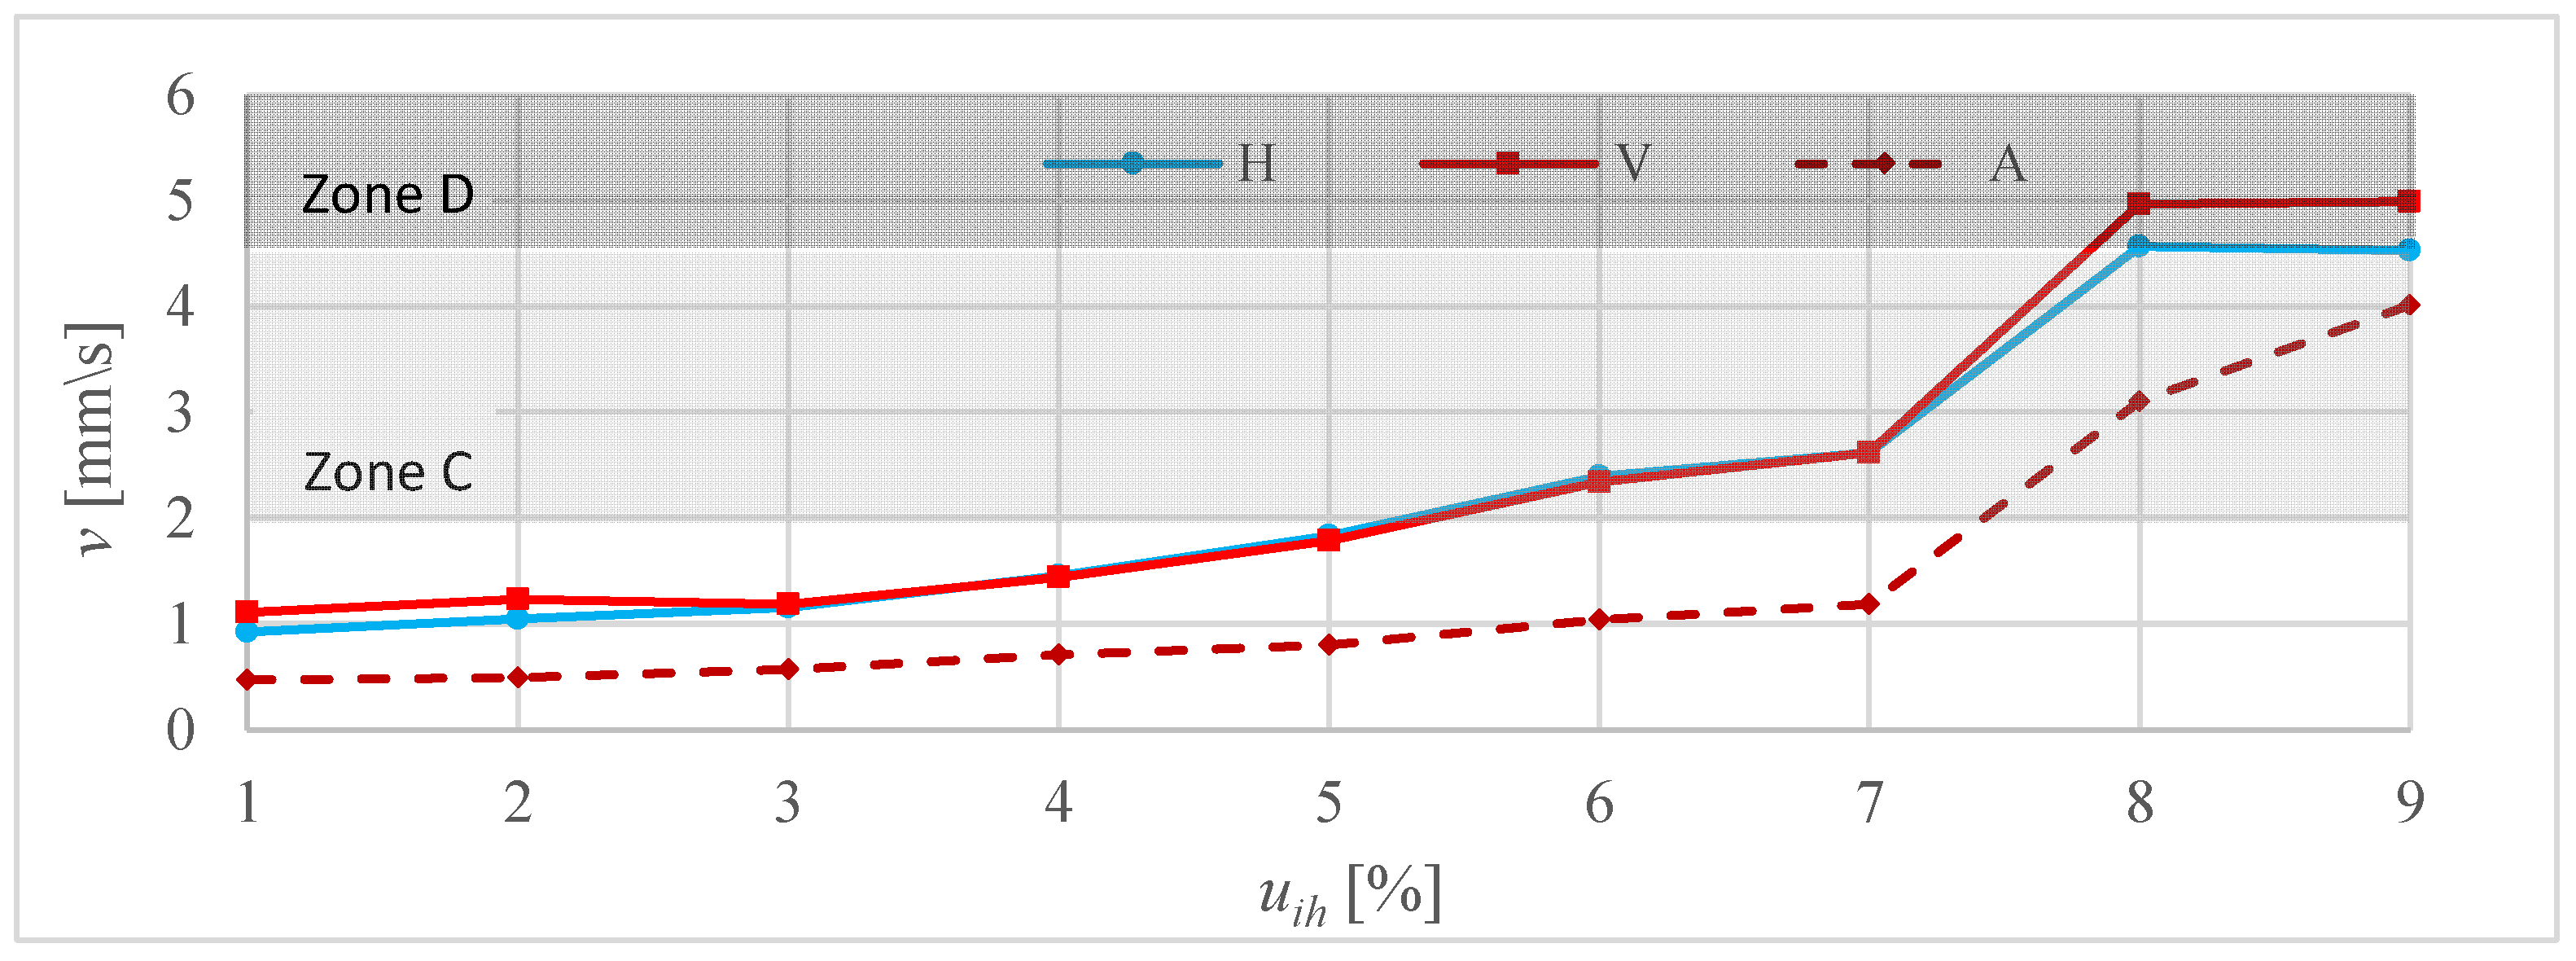
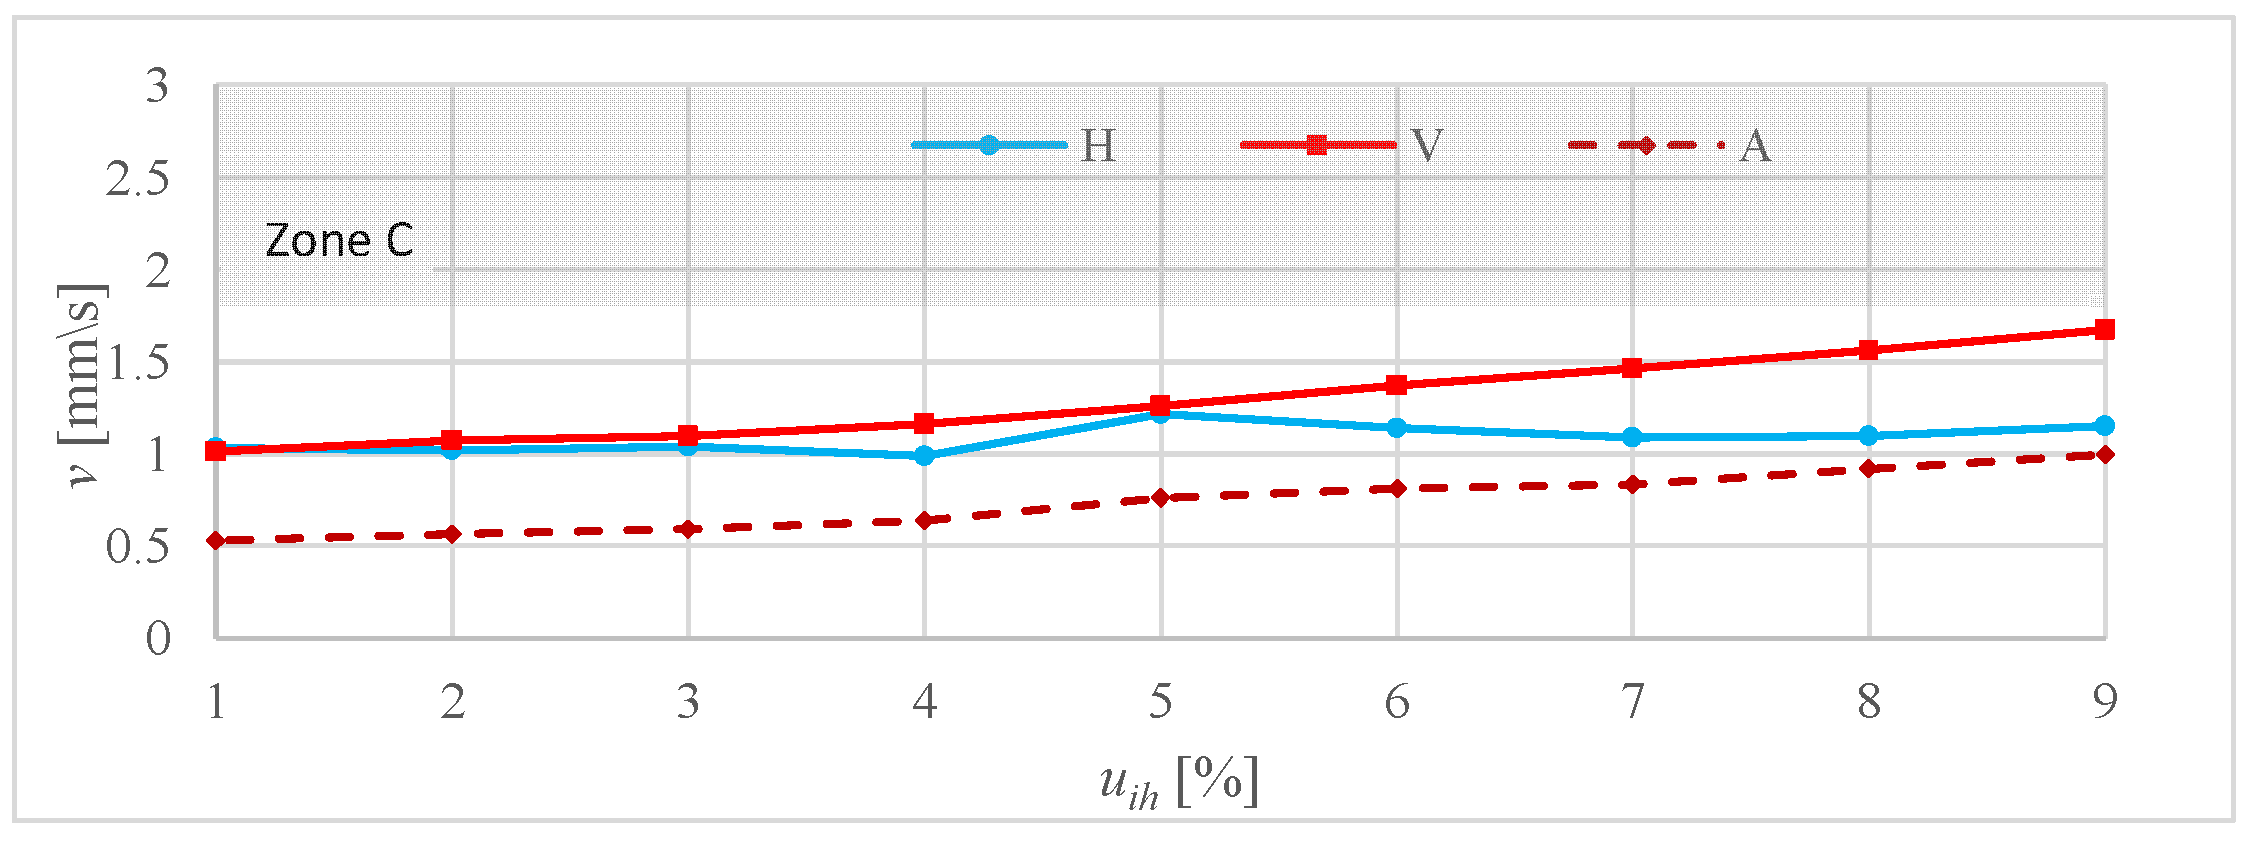
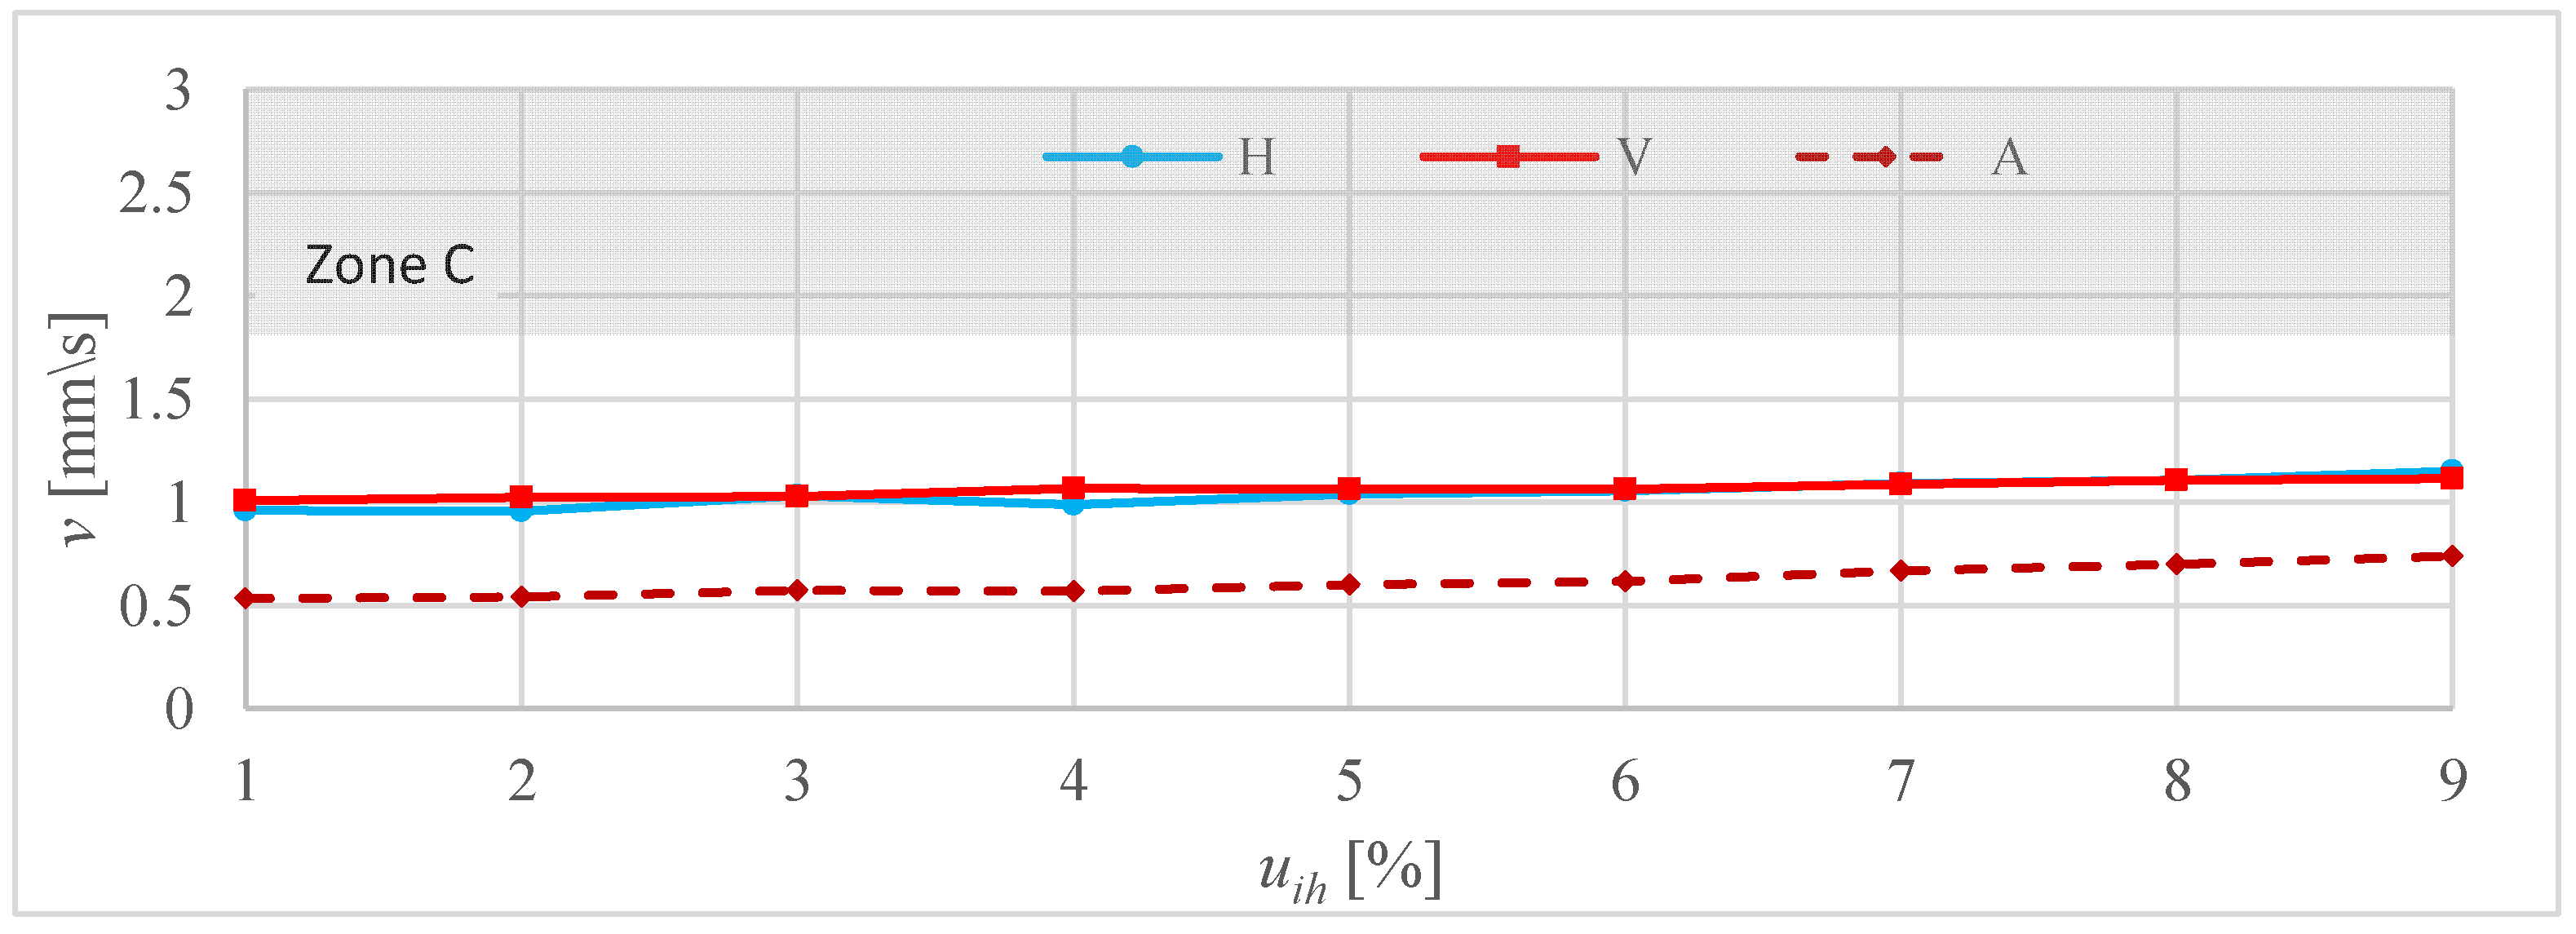
3.4. Vibration
4. Discussion
5. Conclusions
Author Contributions
Funding
Data Availability Statement
Conflicts of Interest
References
- Garma, T.; Šesnić, S. Measurement and modeling of the propagation of the ripple control signal through the distribution network. Int. J. Electr. Power Energy Syst. 2014, 63, 674–680. [Google Scholar] [CrossRef]
- Battacharyya, S.; Cobben, S.; Toonen, J. Impacts of ripple control signals at low voltage customer’s installations. In Proceedings of the 22nd International Conference on Electricity Distribution, Stockholm, Sweden, 10–13 June 2013. [Google Scholar]
- Bollen, M.H.J.; Gu, I.Y.H. Origin of power quality variations. In Signal Processing of Power Quality Disturbances; Wiley: New York, NY, USA, 2006; pp. 41–162. [Google Scholar]
- Boutsiadis, E.; Tsiamitros, D.; Stimoniaris, D. Ripple signaling control for ancillary services in distribution networks. Turk J. Electr. Power Energy Syst. 2022, 2, 31–45. [Google Scholar] [CrossRef]
- Boutsiadis, E.; Tsiamitros, D.; Stimoniaris, D. Distributed generation control via ripple signaling for establishment of ancillary services in distribution networks. In Proceedings of the 2021 13th International Conference on Electrical and Electronics Engineering (ELECO), Bursa, Turkey, 25–27 November 2021; pp. 18–23. [Google Scholar]
- Dzung, D.; Berganza, I.; Sendin, A. Evolution of powerline communications for smart distribution: From ripple control to OFDM. In Proceedings of the 2011 IEEE International Symposium on Power Line Communications and Its Applications, Udine, Italy, 3–6 April 2011; pp. 474–478. [Google Scholar]
- Muttaqi, K.M.; Rahman, O.; Sutanto, D.; Lipu, M.H.; Abdolrasol, M.G.; Hannan, M.A. High-frequency ripple injection signals for the effective utilization of residential EV storage in future power grids with rooftop PV system. IEEE Trans. Ind. Appl. 2022, 58, 6655–6665. [Google Scholar] [CrossRef]
- Perera, B.S.P.; Nguyen, K.; Gosbell, V.J.; Browne, N.; Elphick, S.; Stones, J. Ripple signal amplification in distribution systems: A case study. In Proceedings of the 10th International Conference on Harmonics and Quality of Power, Rio de Janeiro, Brazil, 6–9 October 2002; Volume 1, pp. 93–98. [Google Scholar]
- Rahman, O.; Elphick, S.; Muttaqi, K.M.; David, J. Investigation of LED lighting performance in the presence of ripple injection load control signals. IEEE Trans. Ind. Appl. 2019, 55, 5436–5444. [Google Scholar] [CrossRef]
- Tsiakalos, A.; Tsiamitros, D.; Tsiakalos, A.; Stimoniaris, D.; Ozdemir, A.; Roumeliotis, M.; Asimopoulos, N. Development of an innovative grid ancillary service for PV installations: Methodology, communication issues and experimental results. Sustain. Energy Technol. Assess. 2021, 44, 101081. [Google Scholar] [CrossRef]
- Yang, Y.; Dennetière, S. Modeling of the behavior of power electronic equipment to grid ripple control signal. Electr. Power Syst. Res. 2009, 79, 443–448. [Google Scholar] [CrossRef]
- EN Standard 50160, 2010/A2:2019; Voltage Characteristics of Electricity Supplied by Public Distribution Network. CELENEC: Brussels, Belgium, 2019.
- Gallo, D.; Landi, C.; Langella, R.A.; Testa, A. Limits for low frequency interharmonic voltages: Can they be based on the flickermeter use. In Proceedings of the 2005 IEEE Russia Power Tech, St. Petersburg, Russia, 27–30 June 2005; pp. 1–7. [Google Scholar]
- Gnaciński, P.; Hallmann, D.; Klimczak, P.; Muc, A.; Pepliński, M. Effects of voltage interharmonics on cage induction motors. Energies 2021, 14, 1218. [Google Scholar] [CrossRef]
- Gnacinski, P.; Peplinski, M.; Murawski, L.; Szelezinski, A. Vibration of induction machine supplied with voltage containing subharmonics and interharmonics. IEEE Trans. Energy Convers. 2019, 34, 1928–1937. [Google Scholar] [CrossRef]
- Bongini, L.; Mastromauro, R.A. Subsynchronous torsional interactions and start-up issues in oil & gas plants: A real case study. In Proceedings of the AEIT International Annual Conference (AEIT), Firenze, Italy, 18–20 September 2019; pp. 1–6. [Google Scholar]
- Ghaseminezhad, M.; Doroudi, A.; Hosseinian, S.H.; Jalilian, A. Analysis of voltage fluctuation impact on induction motors by an innovative equivalent circuit considering the speed changes. IET Gener. Transm. Distrib. 2017, 11, 512–519. [Google Scholar] [CrossRef]
- Ghaseminezhad, M.; Doroudi, A.; Hosseinian, S.H.; Jalilian, A. An investigation of induction motor saturation under voltage fluctuation conditions. J. Magn. 2017, 22, 306–314. [Google Scholar] [CrossRef]
- Ghaseminezhad, M.; Doroudi, A.; Hosseinian, S.H.; Jalilian, A. Analytical field study on induction motors under fluctuated voltages. Iran. J. Electr. Electron. Eng. 2021, 17, 1620. [Google Scholar]
- Ghaseminezhad, M.; Doroudi, A.; Hosseinian, S.H.; Jalilian, A. Investigation of increased ohmic and core losses in induction motors under voltage fluctuation conditions. Iran. J. Sci. Technol. Trans. Electr. Eng. 2018, 43, 1–10. [Google Scholar] [CrossRef]
- Ghaseminezhad, M.; Doroudi, A.; Hosseinian, S.H.; Jalilian, A. High torque and excessive vibration on the induction motors under special voltage fluctuation conditions. COMPEL—Int. J. Comput. Math. Electr. Electron. Eng. 2021, 40, 822–836. [Google Scholar] [CrossRef]
- Gnaciński, P.; Hallmann, D.; Muc, A.; Klimczak, P.; Pepliński, M. Induction motor supplied with voltage containing symmetrical subharmonics and interharmonics. Energies 2022, 15, 7712. [Google Scholar] [CrossRef]
- Gnaciński, P.; Pepliński, M.; Hallmann, D. Currents and Power Losses of Induction Machine Under Voltage Interharmonics. In Proceedings of the 21st European Conference on Power Electronics and Applications (EPE ’19 ECCE Europe), Genova, Italy, 3–5 September 2019. [Google Scholar]
- Schramm, S.; Sihler, C.; Song-Manguelle, J.; Rotondo, P. Damping torsional interharmonic effects of large drives. IEEE Trans. Power Electron. 2010, 25, 1090–1098. [Google Scholar] [CrossRef]
- Tennakoon, S.; Perera, S.; Robinson, D. Flicker attenuation—Part I: Response of three-phase induction motors to regular voltage fluctuations. IEEE Trans. Power Deliv. 2008, 23, 1207–1214. [Google Scholar] [CrossRef]
- IEEE Standard 519-2022; IEEE Recommended Practice and Requirements for Harmonic Control in Electric Power Systems. IEEE: New York, NY, USA, 2022.
- Arkkio, A.; Cederström, S.; Awan, H.A.A.; Saarakkala, S.E.; Holopainen, T.P. Additional losses of electrical machines under torsional vibration. IEEE Trans. Energy Convers. 2018, 33, 245–251. [Google Scholar] [CrossRef]
- Avdeev, B.A.; Vyngra, A.V.; Chernyi, S.G.; Zhilenkov, A.A.; Sokolov, S.S. Evaluation and procedure for estimation of interharmonics on the example of non-sinusoidal current of an induction motor with variable periodic load. IEEE Access 2021, 9, 158412–158419. [Google Scholar] [CrossRef]
- Nassif, A.B. Assessing the impact of harmonics and interharmonics of top and mudpump variable frequency drives in drilling rigs. IEEE Trans. Ind. Appl. 2019, 55, 5574–5583. [Google Scholar] [CrossRef]
- Testa, A.; Akram, M.F.; Burch, R.; Carpinelli, G.; Chang, G.; Dinavahi, V.; Hatziadoniu, C.; Grady, W.M.; Gunther, E.; Halpin, M.; et al. Interharmonics: Theory and modeling. IEEE Trans. Power Deliv. 2007, 22, 2335–2348. [Google Scholar] [CrossRef]
- Tripp, H.; Kim, D.; Whitney, R. A Comprehensive Cause Analysis of a Coupling Failure Induced by Torsional Oscillations in a Variable Speed Motor; Texas A&M University, Turbomachinery Laboratories: College Station, TX, USA, 1993; pp. 17–24. [Google Scholar]
- Gnaciński, P.; Pepliński, M.; Hallmann, D.; Jankowski, P. Induction cage machine thermal transients under lowered voltage quality. IET Electr. Power Appl. 2019, 13, 479–486. [Google Scholar] [CrossRef]
- Gnaciński, P.; Pepliński, M.; Hallmann, D.; Jankowski, P. The effects of voltage subharmonics on cage induction machine. Int. J. Electr. Power Energy Syst. 2019, 111, 125–131. [Google Scholar] [CrossRef]
- Gnaciński, P.; Klimczak, P. High-Power induction motors supplied with voltage containing subharmonics. Energies 2020, 13, 5894. [Google Scholar] [CrossRef]
- ISO Standard 10816-1; Mechanical Vibration—Evaluation of Machine Vibration by Measurements on Non-Rotating Parts—Part 1: General guidelines. ISO: Genova, Switzerland, 1995.
- ISO Standard 20816-1; Mechanical Vibration—Measurement and Evaluation of Machine Vibration—Part 1: General Guidelines. ISO: Genova, Switzerland, 2016.
- Singh, R.R.; Raj, C.T.; Palka, R.; Indragandhi, V.; Wardach, M.; Paplicki, P. Energy optimal intelligent switching mechanism for induction motors with time varying load. In Proceedings of the IOP Conference Series: Materials Science and Engineering, Chennai, India, 9 June 2020; p. 906. [Google Scholar]
- Singh, R.R.; Chelliah, T.R. Enforcement of cost-effective energy conservation on single-fed asynchronous machine using a novel switching strategy. Energy 2017, 126, 179–191. [Google Scholar] [CrossRef]
- IEC Standard 60034-1; Rotating Electrical Machines. Part 1: Rating and Performance. IEC: Genova, Switzerland, 2004.
- Tsypkin, M. The origin of the electromagnetic vibration of induction motors operating in modern industry: Practical experience—Analysis and diagnostics. IEEE Trans. Ind. Appl. 2017, 53, 1669–1676. [Google Scholar] [CrossRef]
- Gonzalez-Abreu, A.D.; Osornio-Rios, R.A.; Jaen-Cuellar, A.Y.; Delgado-Prieto, M.; Antonino-Daviu, J.A.; Karlis, A. Advances in power quality analysis techniques for electrical machines and drives: A review. Energies 2022, 15, 1909. [Google Scholar] [CrossRef]
- Sieklucki, G.; Sobieraj, S.; Gromba, J.; Necula, R.E. Analysis and approximation of THD and torque ripple of induction motor for SVPWM control of VSI. Energies 2023, 16, 4628. [Google Scholar] [CrossRef]
- Feese, T.; Ryan, M. Torsional Vibration Problem with Motor/ID Fan System Due to PWM Variable Frequency Drive; Texas A&M University, Turbomachinery Laboratories: College Station, TX, USA, 2008. [Google Scholar]
- Perez, R.X. Design, Modeling and Reliability in Rotating Machinery; Wiley: Hoboken, NJ, USA, 2022. [Google Scholar]


| Motor | Type | Rated Power (kW) | Rated Speed (rpm) | Rated Voltage (V) | Rated Current (A) |
|---|---|---|---|---|---|
| motor1 | TSg100L-4B | 3 | 1420 | 380 | 6.9 |
| motor2 | 1LE1003-1BB22-2AA4 | 4 | 1460 | 400 | 7.9 |
Disclaimer/Publisher’s Note: The statements, opinions and data contained in all publications are solely those of the individual author(s) and contributor(s) and not of MDPI and/or the editor(s). MDPI and/or the editor(s) disclaim responsibility for any injury to people or property resulting from any ideas, methods, instructions or products referred to in the content. |
© 2023 by the authors. Licensee MDPI, Basel, Switzerland. This article is an open access article distributed under the terms and conditions of the Creative Commons Attribution (CC BY) license (https://creativecommons.org/licenses/by/4.0/).
Share and Cite
Gnaciński, P.; Pepliński, M.; Muc, A.; Hallmann, D.; Jankowski, P. Effect of Ripple Control on Induction Motors. Energies 2023, 16, 7831. https://doi.org/10.3390/en16237831
Gnaciński P, Pepliński M, Muc A, Hallmann D, Jankowski P. Effect of Ripple Control on Induction Motors. Energies. 2023; 16(23):7831. https://doi.org/10.3390/en16237831
Chicago/Turabian StyleGnaciński, Piotr, Marcin Pepliński, Adam Muc, Damian Hallmann, and Piotr Jankowski. 2023. "Effect of Ripple Control on Induction Motors" Energies 16, no. 23: 7831. https://doi.org/10.3390/en16237831
APA StyleGnaciński, P., Pepliński, M., Muc, A., Hallmann, D., & Jankowski, P. (2023). Effect of Ripple Control on Induction Motors. Energies, 16(23), 7831. https://doi.org/10.3390/en16237831