Article

Pool Boiling of Ethanol on Copper Surfaces with Rectangular Microchannels

by
Robert Kaniowski
1,
Robert Pastuszko
1,*,
Egidijus Dragašius
2 and
Saulius Baskutis
2
1
Faculty of Mechatronics and Mechanical Engineering, Kielce University of Technology, al. Tysiąclecia Państwa Polskiego 7, 25-314 Kielce, Poland
2
Department of Production Engineering, Faculty of Mechanical Engineering and Design, Kaunas University of Technology, Studentu St. 56, 51424 Kaunas, Lithuania
*
Author to whom correspondence should be addressed.
Energies 2023, 16(23), 7883; https://doi.org/10.3390/en16237883
Submission received: 3 November 2023 / Revised: 23 November 2023 / Accepted: 30 November 2023 / Published: 2 December 2023

Abstract

:
In this paper, pool boiling of ethanol at atmospheric pressure was analyzed. The enhanced surfaces were made of copper, on which grooves with a depth ranging from 0.2 to 0.5 mm were milled in parallel. The widths of the microchannels and the distances between them were 0.2 mm, 0.3 mm and 0.4 mm, respectively. The highest heat transfer coefficient, 90.3 kW/m2K, was obtained for the surface with a microchannel depth of 0.5 mm and a width of 0.2 mm. The maximum heat flux was 1035 kW/m2. For the analyzed surfaces, the maximum heat flux increase of two and a half times was obtained, while the heat transfer coefficient increased three-fold in relation to the smooth surface. In the given range of heat flux 21.2–1035 kW/m2, the impact of geometric parameters on the heat transfer process was presented. The diameters of the departing bubbles were determined experimentally with the use of a high-speed camera. A simplified model was proposed to determine the diameter of the departure bubble for the studied surfaces.

1. Introduction

The equipment used in the power industry is designed to operate within a programmed temperature range. For the purpose of maintaining the correct operating temperature, it is important to use special heat spreaders that use phase change to increase the intensity of heat removal.
Devices that generate significant heat fluxes, such as electronics, microprocessors, gas turbines, nuclear reactors, hybrid vehicles, power electronics, fuel cells, and spacecraft electronics, require thermostabilization [1,2]. The aim of designing heat exchangers and heat spreaders is to optimize them in terms of reducing the size and the amount of material. An effective method for increasing the heat transfer coefficient and heat flux is to use the boiling process, as large heat fluxes can be dissipated due to the latent heat of vaporization (ethanol 963 kJ/kg, water 2257 kJ/kg at boiling point, atmospheric pressure). The modification of the surface, which can consist in a change in geometry, the roughness of the heating surface [3], covering it with a porous [4] or capillary porous layer [5,6], texturing, the use of surface structures [7], metal foams [8,9], the formation of subsurface tunnels, small fins [10,11] or microchannels [12,13], contributes to a multiplication of the heat transfer coefficient (HTC), reduces the temperature difference between the surface and the fluid (superheat), and increases the critical heat flux (CHF) multiple times. These parameters are responsible for the efficient operation of heat spreaders and heat exchangers with phase change.
The rate of heat transfer during boiling is influenced by several factors, the most important of which are the surface roughness and the contact angle.
Particularly, rough surfaces trap vapor bubbles and, at the same time, inhibit heat transfer. A rough surface provides more nucleation sites, resulting in more vapor bubbles during boiling. As a result, the boiling heat transfer coefficient increases at the nucleation sites and promotes rapid bubble formation and separation. The degree to which the surface roughness affects the boiling heat transfer in essence depends on the nature of the boiling medium and the specific properties of the surface.
The contact angle has a huge influence on how well the liquid wets the surface. The contact angle influences the spread of the liquid on the surface and thus forms a sufficiently stable liquid film. A smaller liquid surface contact angle ensures better wetting. This property increases the heat transfer of boiling. This is explained by the fact that better wetting leads to better contact between the liquid and the hot surface, promoting the nucleation and growth of bubbles.
Other factors influencing the transfer of boiling heat are the properties of the circulating medium (viscosity, specific heat, thermal conductivity), the material of the heated surface (surfaces with higher thermal conductivity transfer heat more efficiently to the liquid), pressure (at lower pressure, the boiling point of the liquid decreases and, at the same time, the heat transfer characteristics change), and flow conditions (laminar flow conditions reduce heat transfer rates, while high flow rates enhance convective heat transfer during boiling).
Organic liquids, e.g., ethanol—C2H5OH, isobutane—C4H10, Novec-649—C2F5C(O)CF(CF3)2, etc., are alternatives to water as working fluids in two-phase heat transfer exchangers with high heat fluxes due to their lower saturation temperatures than water under normal conditions. In the paper by Shen et al. [14], the authors used surfaces with alternating arrangements of hydrophilic and hydrophobic structures during ethanol boiling in the experiment. They achieved an almost threefold increase in the heat transfer coefficient. In their work, Kalani and Kandlikar used enhanced surfaces with copper-fabricated open microchannels with a channel depth ranging from 0.25 to 0.47 mm and a width ranging from 0.19 to 0.41 mm [15]. Ethanol, as a working medium, was used to test the boiling process under vacuum. The HTC they obtained was approximately 70 kW/(m2K) for microchannels with a depth of 0.46 mm deep and a width of 0.2 mm. In the work of Deng et al. [16,17], the authors used ethanol and water for the boiling process on the developed surfaces. They conducted experimental tests at atmospheric pressure on copper specimens shaped like Ω. The tested surfaces dissipated significant heat fluxes at low superheat, allowing heat transfer coefficients of 30 kW/(m2K) to be achieved. Similar heat transfer coefficient values during ethanol boiling were obtained by Hao et al. [18] on samples with open, closed and combined channels.
The heat exchangers and radiators must be resistant to corrosion and contamination and meet the requirements for operating conditions. These devices should also be suitable for maintenance, i.e., cleaning various types of contaminants. Regular maintenance of the heat exchangers and ensuring that the required operating conditions are met significantly extend their service life and efficiency [19,20].
Heat exchangers are often integrated into piping systems, and temperature differences can cause these installations to expand and contract. Metal expansion joints are used to absorb thermal deformations of the installation and prevent damage to structures and devices [21,22]. Metal expansion joints play an important role in ensuring the stability and protection of the heat exchangers themselves and the piping connections, especially when temperature changes occur within the system. The boiling consideration was also analyzed in relation to the heat exchangers with forced flow through microchannels with different spatial orientations [23,24].
This paper is a summary of the experimental investigations of nucleate pool boiling heat transfer. The aim of the study was to find the most favorable microchannel geometry in terms of obtaining the highest heat transfer coefficient and the critical heat flux. In addition, taking into account the equilibrium of the four forces acting on the bubble, a computational model has been proposed to determine the departure bubble diameter.

2. Materials and Methods

Among existing boiling agents, ethanol is a widely available liquid and is relatively cheap. Its saturation temperature at normal pressure is 78 °C. It is often used as a working medium for nucleate boiling. The thermophysical properties are shown in Table 1.
Figure 1 shows the test setup, which enabled the measurement of the parameters necessary to analyze the heat transfer process, i.e., heat fluxes, superheat temperatures, the heat transfer coefficient, and from visualization studies, the diameter and frequency of the heat flux-dependent vapor bubble detachment. A water cooler installed on the test bench is used to condense boiling ethanol vapor. A closed glass vessel, sealed with high-temperature silicone, is attached to the heating segment from below. An autotransformer is used to regulate the heat flux set to the heating module. The time required for the temperature to stabilize across the heating roll was approximately 15 min. A measurement data acquisition system (FLUKE Hydra Series II 2635A, Fluke, Everett, WA, USA) was used to record the temperature. The total instrument accuracy in the range from −100 °C to 1372 °C was 0.45 K for thermocouples Type K. The diameter of the thermocouple was 0.5 mm. Since the measurement uncertainty is large, the thermocouples were calibrated in the range from 40 to 200 °C every 10 °C. Before measurements were performed, the thermocouples were checked using an Altek 422 calibrator. Readings from the Altek 422 calibrator (Altek, Liberty Lake, WA, USA) were compared using a calibration dry-well and the FLUKE Hydra Series II recorder (Fluke, Everett, WA, USA). The measurement uncertainty did not exceed 0.1 °C. The layout of the temperature sensors is shown in Figure 2. The sample with microchannels was fixed with pure tin on a copper heating cylinder. A 16 mm diameter, 100 mm long 1500 W heater was used to simulate a constant heat flux source. It was placed inside a copper cylinder.
The test samples were made of copper with a thermal conductivity coefficient of 380 W/(mK). Microchannels were made with a disc cutter 0.2, 0.3 and 0.4 mm wide at depths of 0.2, 0.3, 0.4, 0.5 mm, respectively, Table 2.
Using the Talysurf CCI Lite 3D Profiler non-contact measurement system for optical, non-contact analysis of geometric data, the profiles and surface roughness of the samples were determined. The measurement procedure for mean roughness was carried out according to the guidelines given in the paper. Measurements of mean roughness were carried out according to the procedure in the article [25]. As an example, a sample with code M#2.5 is shown in Figure 3a, and a 3D and 2D surface profile along with roughness measurements at the top and bottom of the microchannel is shown in Figure 3b–e, respectively. Table 2 summarizes the codes with the average roughness at the top and bottom of the microchannels. Relative displacements occurring in the tool–workpiece system are a harmful and undesirable phenomenon that always accompany the machining process. They constitute basic difficulties in increasing the efficiency of machining and significantly affect the geometric structure of the machined surface. Hence, the surfaces of each sample have a different roughness [26].
For the purpose of understanding the heat transfer mechanism, it is important to visualize the boiling process and to understand the dynamics of vapor bubble growth. In order to determine the diameter of the detaching vapor bubbles, image registration was used using a digital monochrome camera PHOT MV-D1024-160-CL (Photonfocus, Lachen, Switzerland) with a maximum resolution of 1024 × 758 pixels. The camera captured images at 428 frames per second at a resolution of 500 × 250 pixels. In addition, visualization was performed using an RX-10 camera (Sony, Tokyo, Japan).
The measurement procedure is as follows:
  • starting the cooling section to obtain condensate from the boiling ethanol vapor;
  • heating the liquid to saturation temperature (ethanol degassing);
  • setting the appropriate electric voltage on the autotransformer (simulating the set value of the heat flux);
  • waiting about 15 min until the system reaches thermal equilibrium (temperature indications will not change for the next 5 min);
  • recording measurement data (temperature in the heating cylinder, fluid temperature, taking photos of the boiling fluid).
The HTC for boiling ethanol and the surfaces with microchannels were calculated according to the following equation:
α = q T T 3 + T T 4 2 q δ bs λ Cu T T 1 + T T 2 2 1
where:
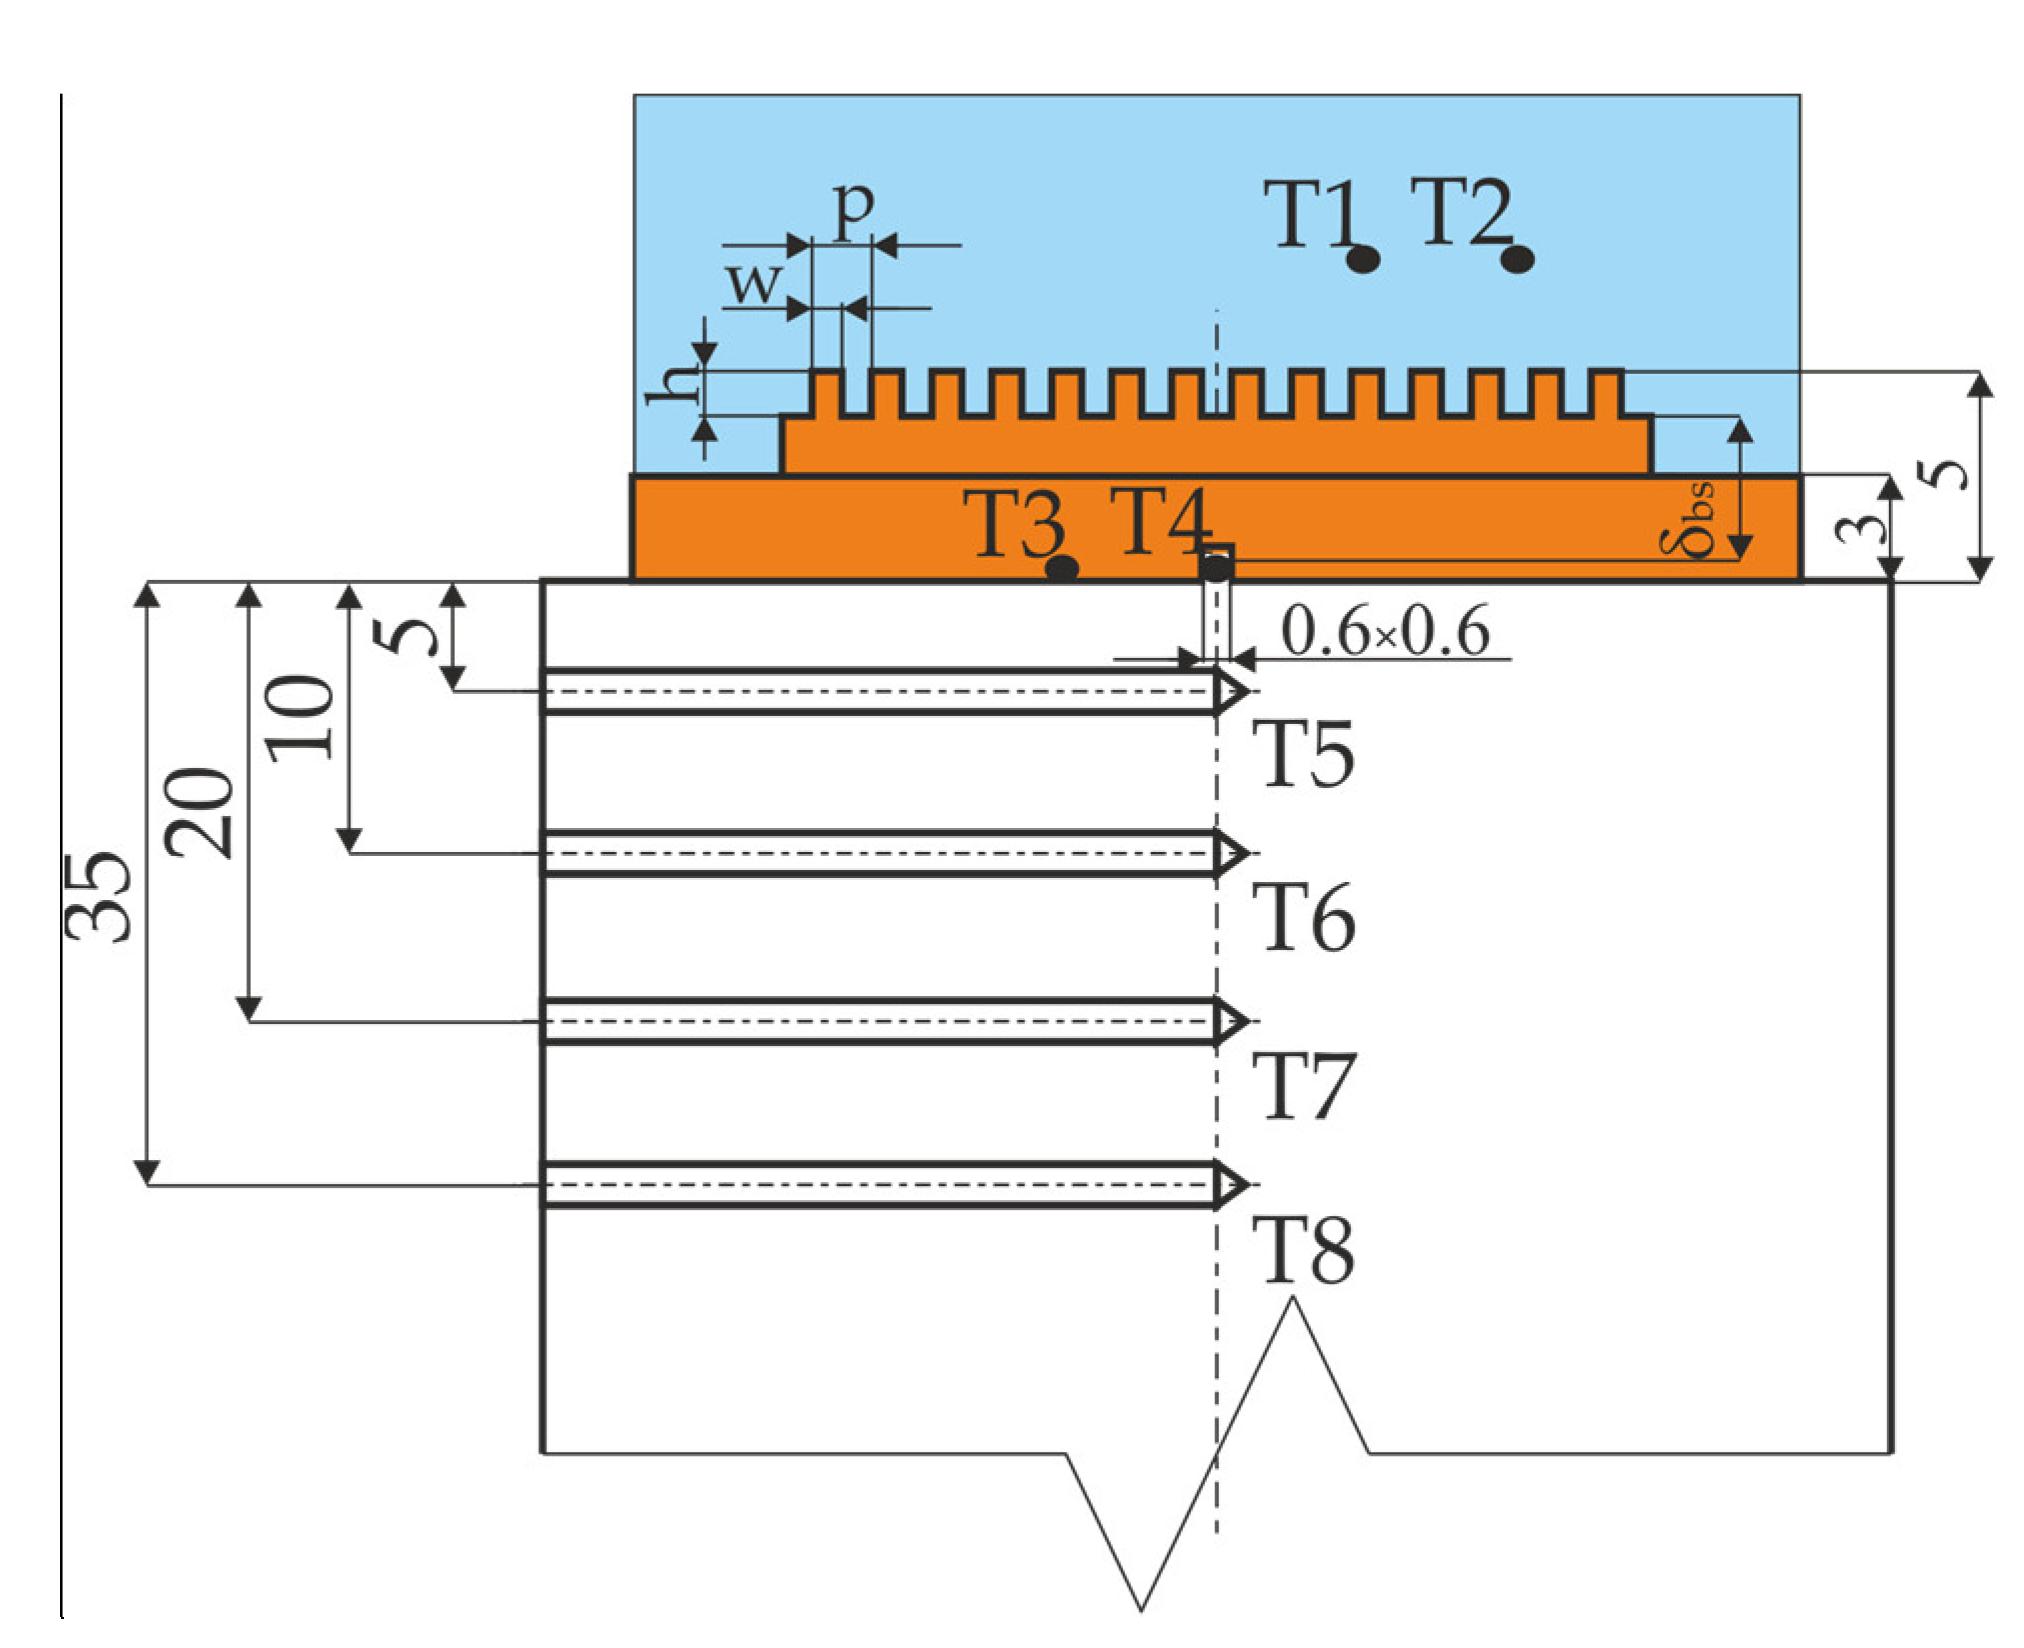
  • TT1 to TT4—temperatures measured in the set-up,
  • δbs—distance between the center of the thermocouple T4 and the bottom of the microchannel,
  • λCu—copper thermal conductivity.
The heating cylinder had thick insulation; hence, to calculate the heat flux, the one-dimensional Fourier equation was used:
q = λ Cu T T 8 T T 5 δ T 8 T 5 π d cyl 2 4 a 2
where:
  • δT8T5—distance between thermocouples,
  • dcyl—external diameter of the copper cylinder.
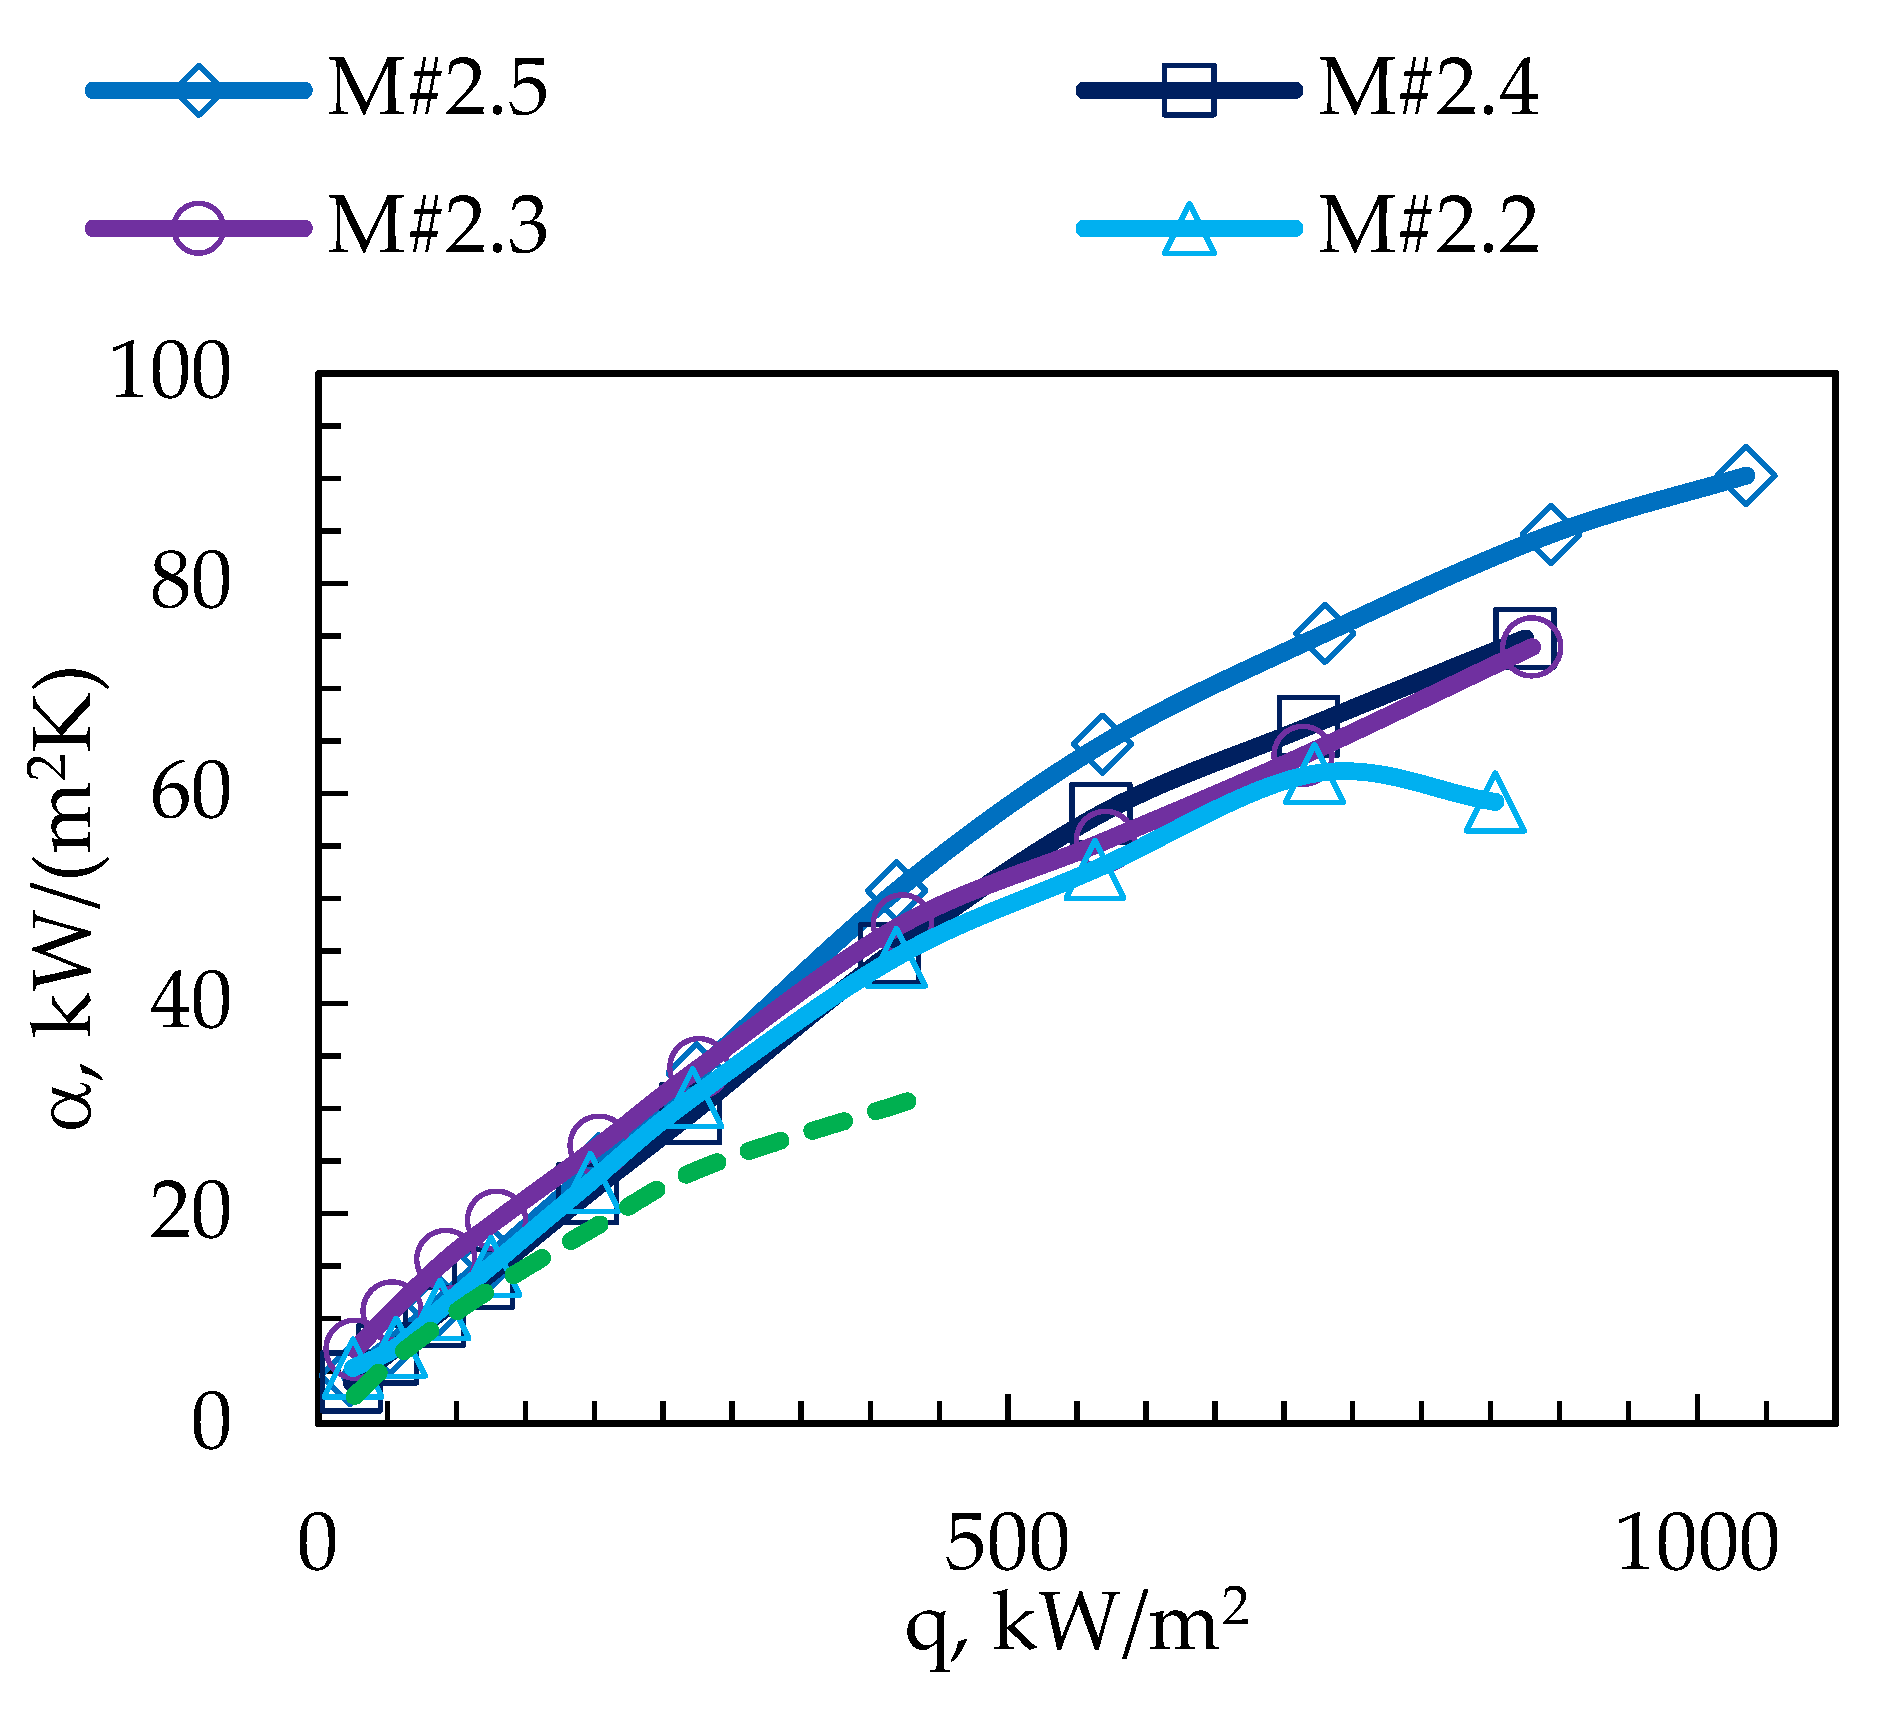
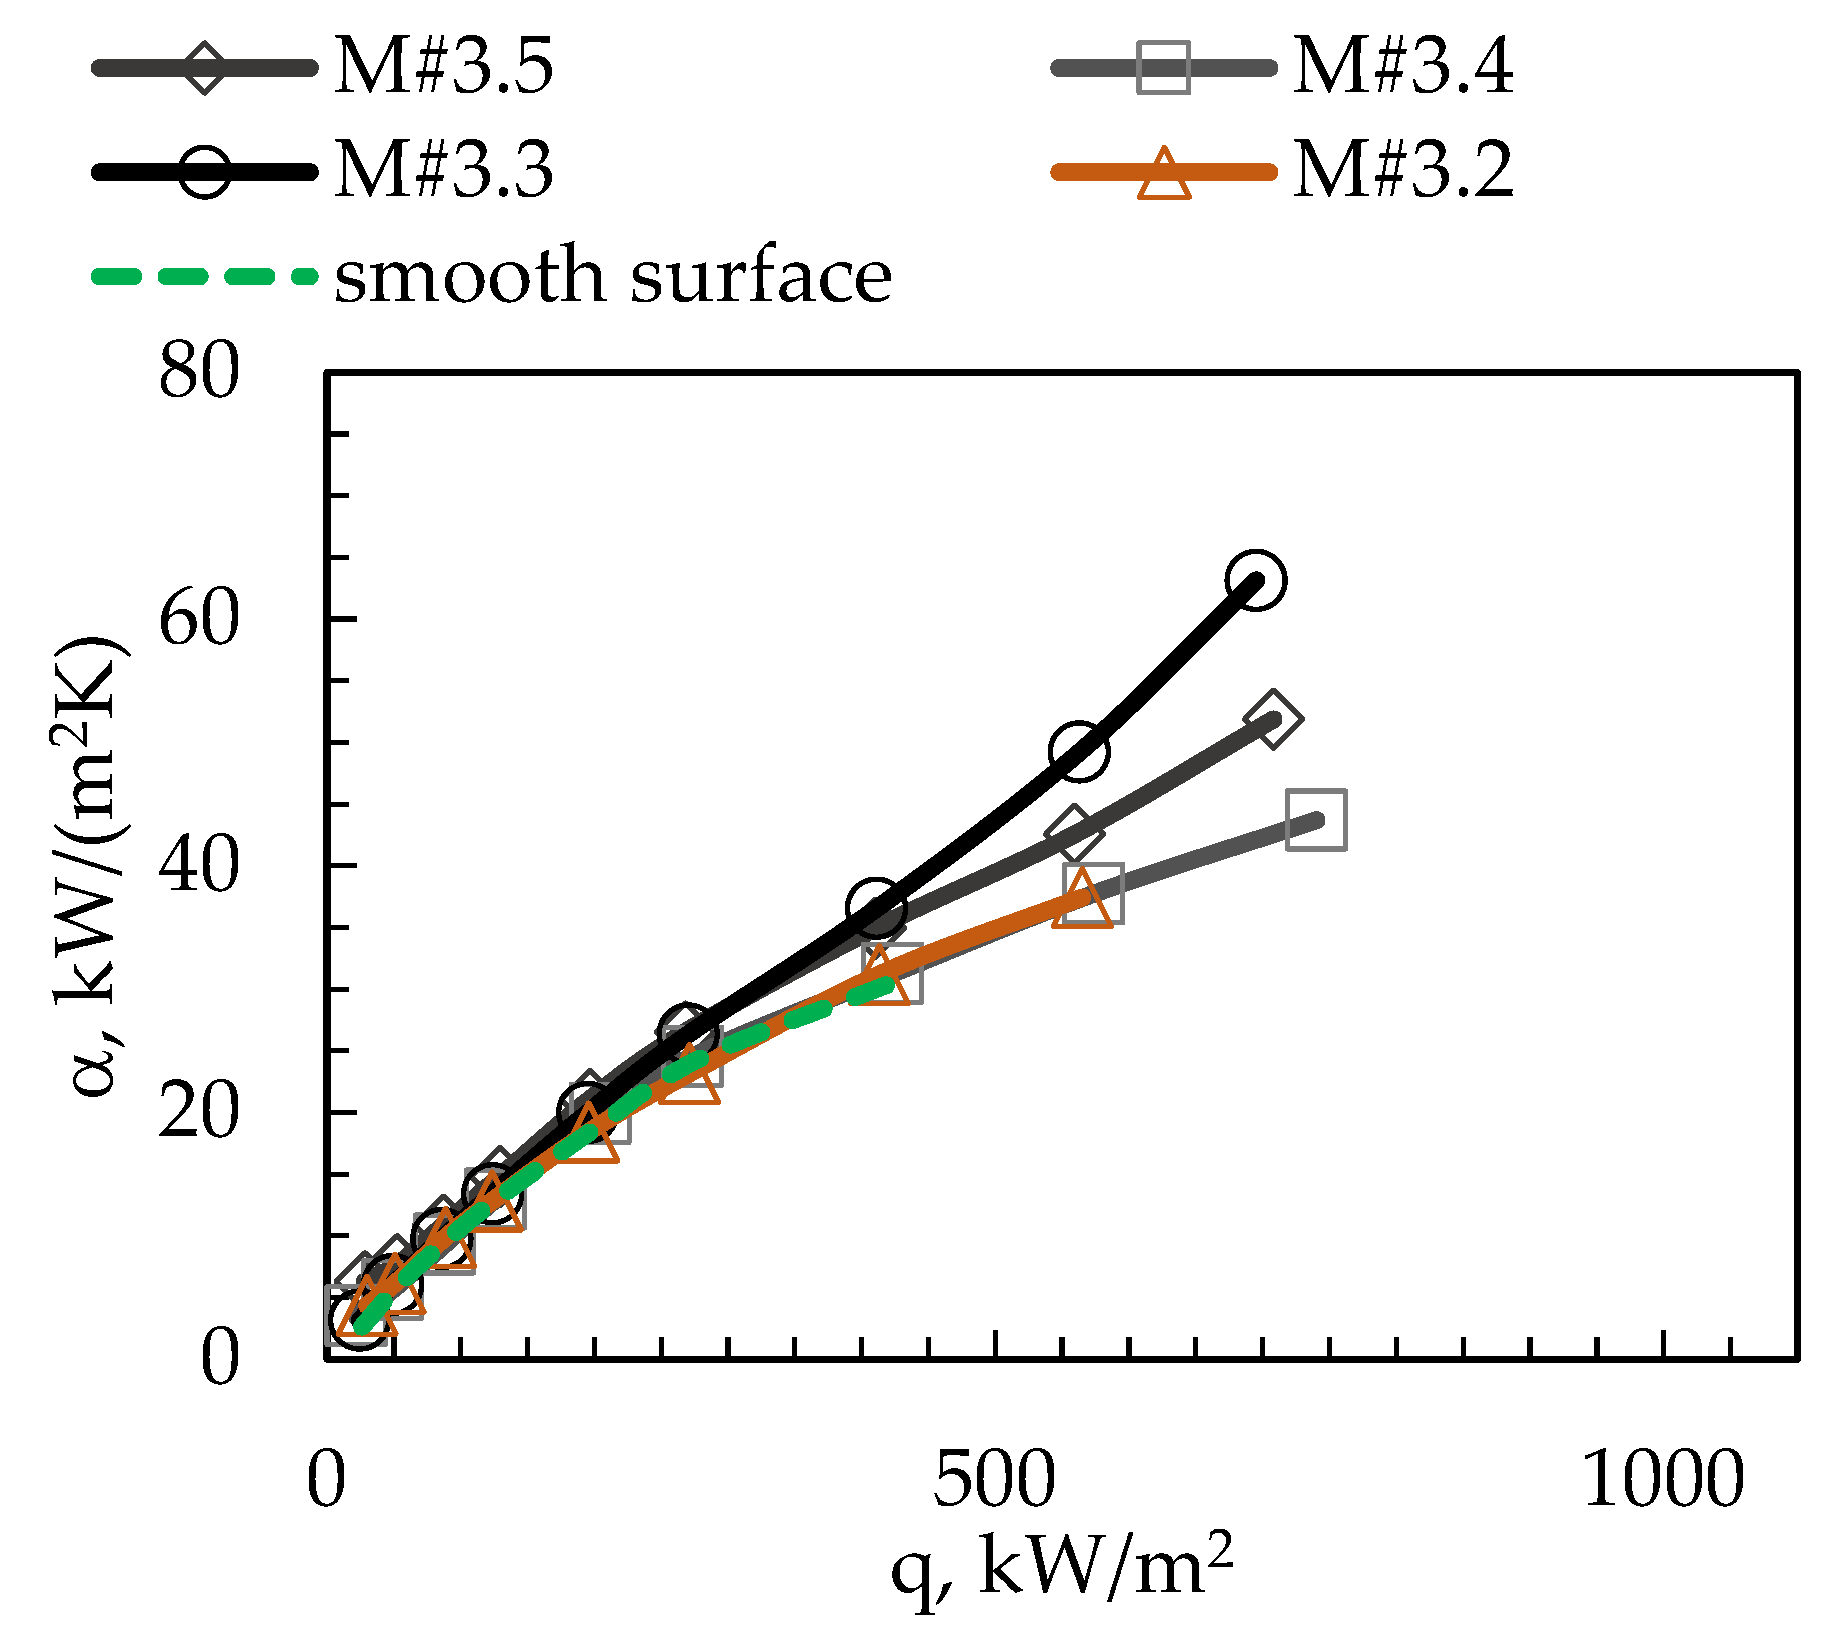
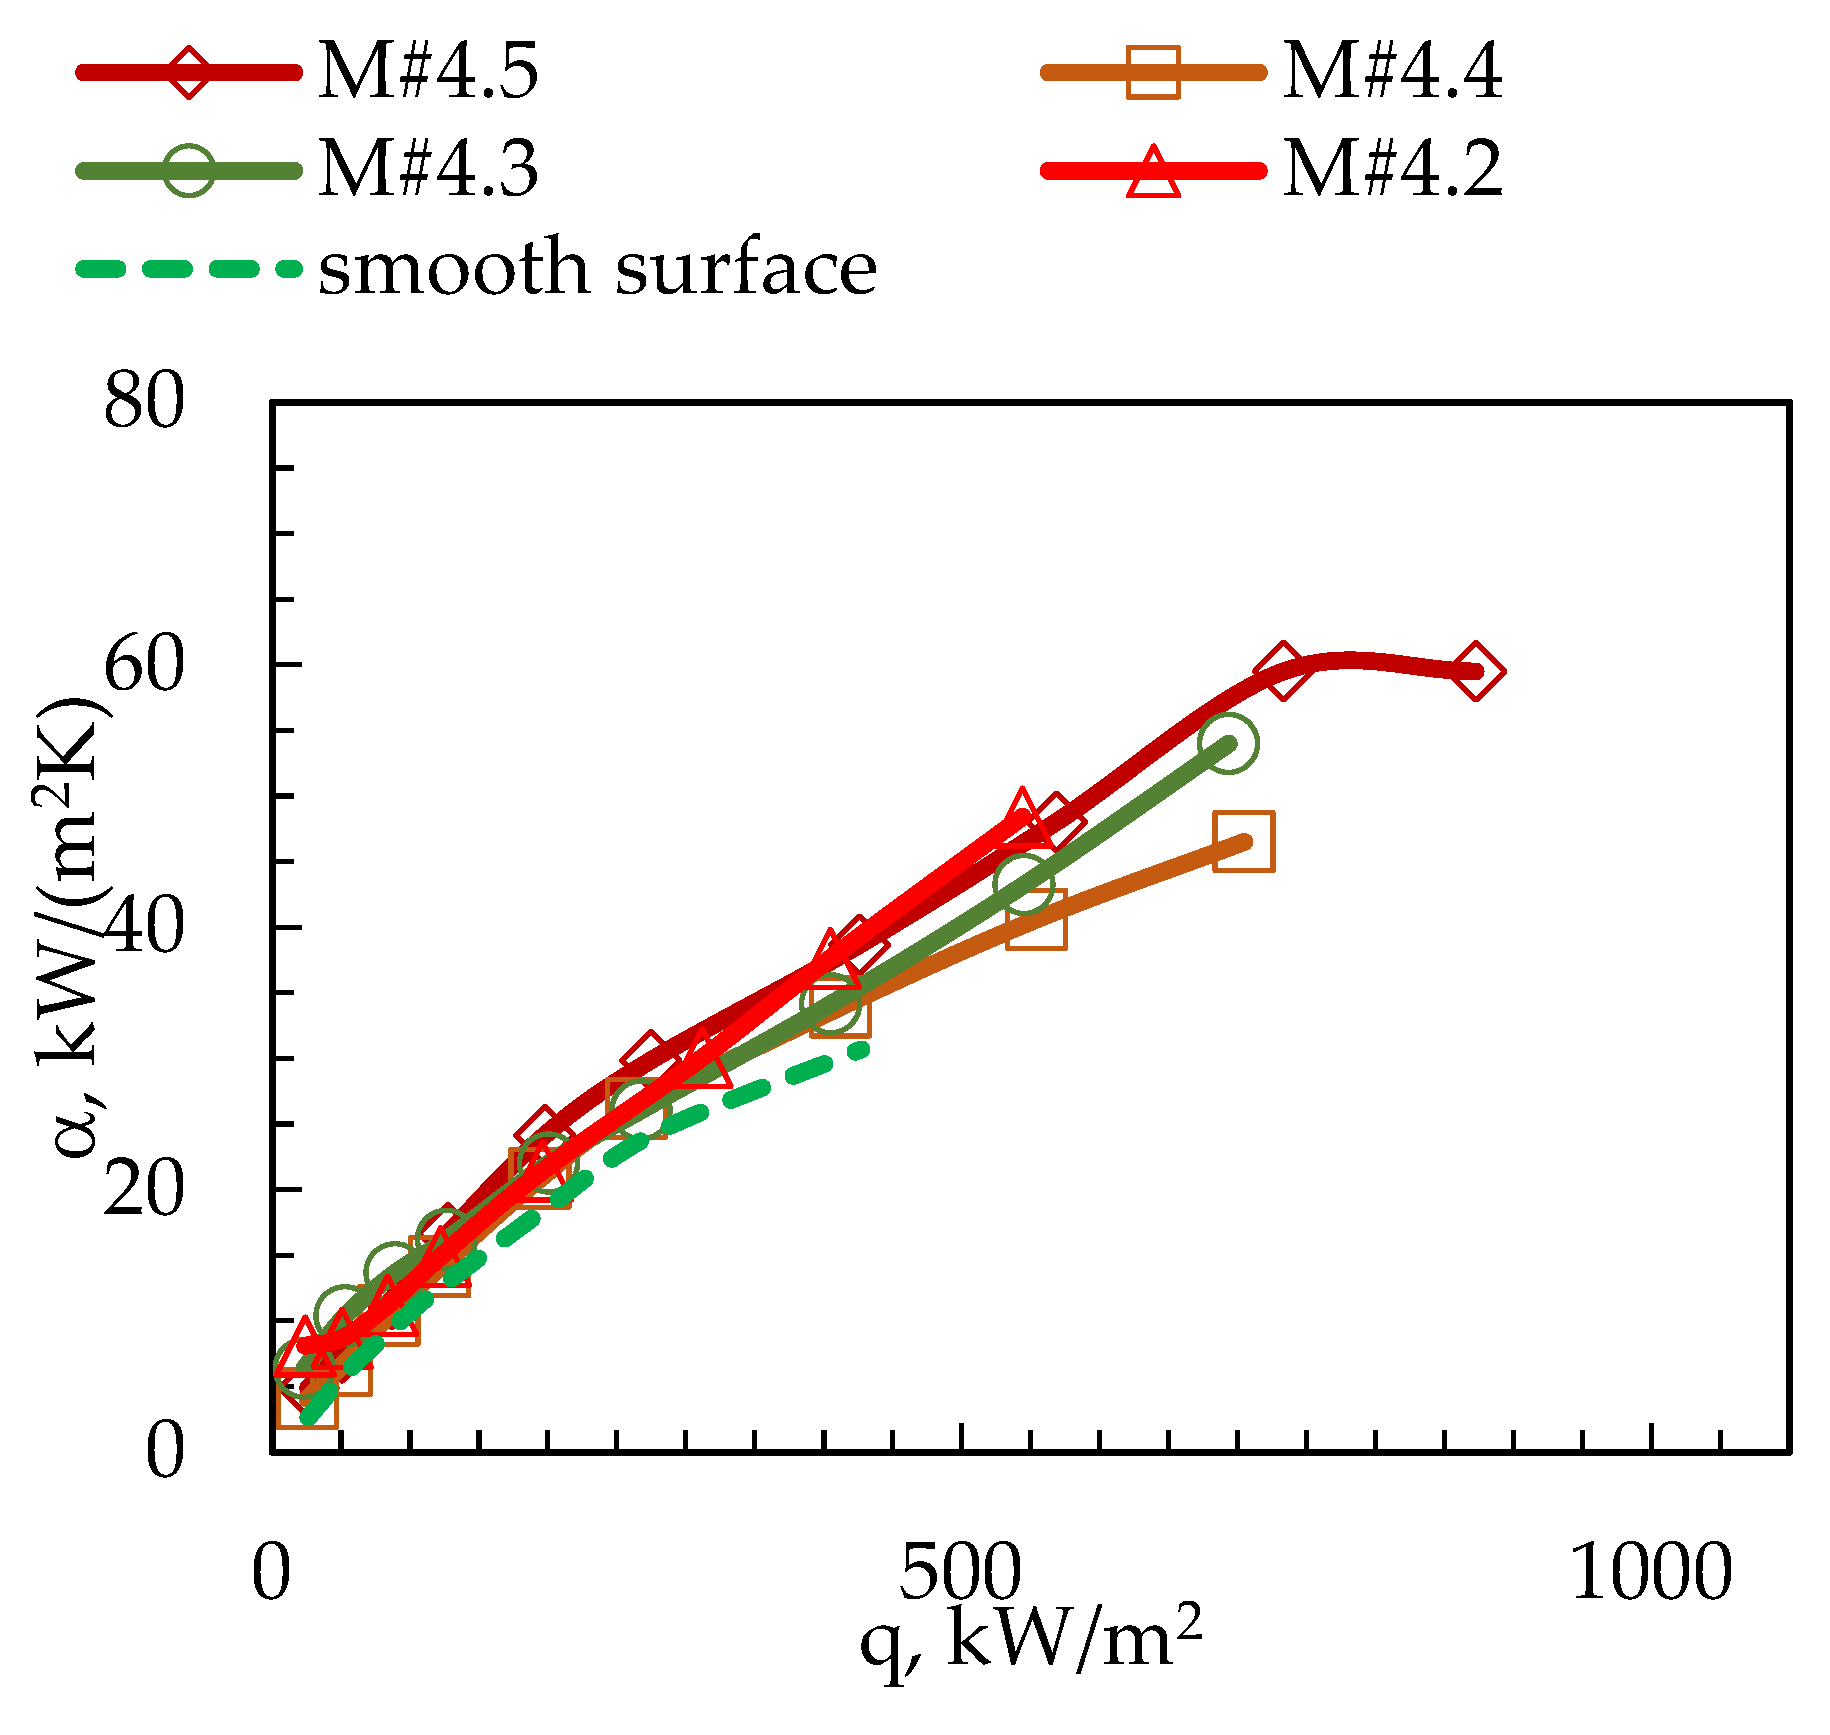
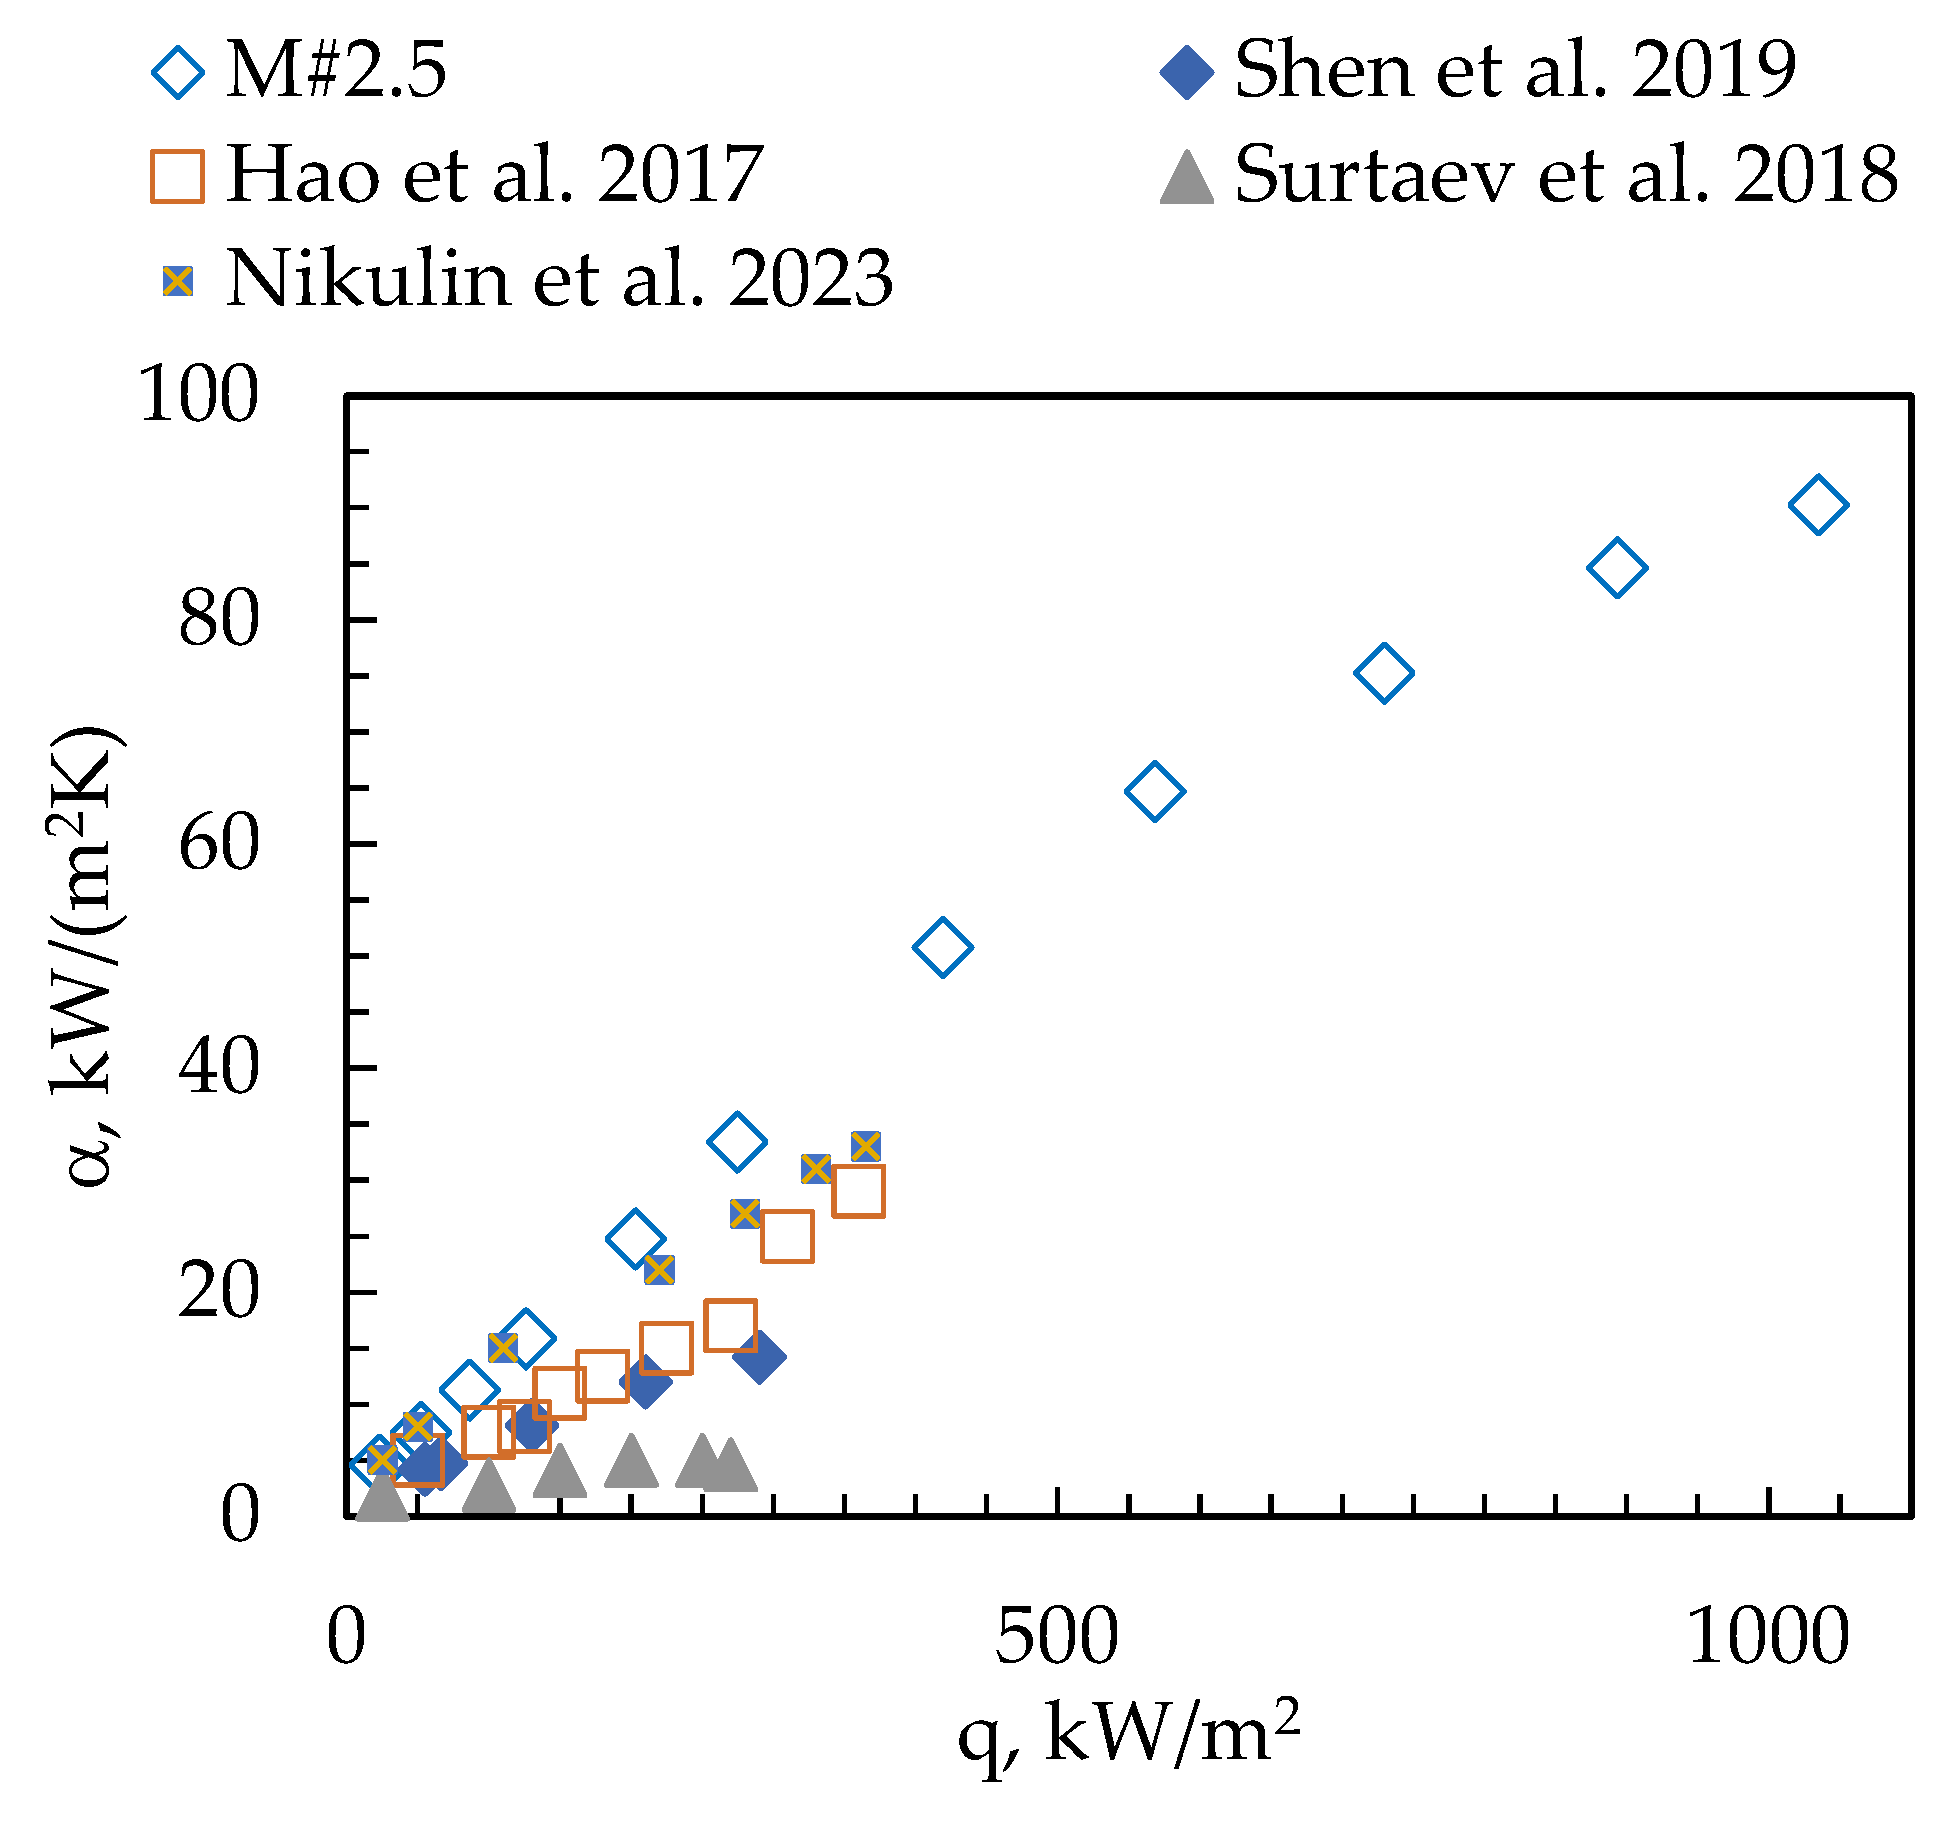
The diameters of the db bubbles were measured in the x and y directions. These were determined for at least 30 departing bubbles with 9–11 nucleation sites on average. The diameter of bubble detachment was determined at a constant heat flux value. The detaching bubble was treated as two rotating semi-ellipticals with a vertical and horizontal axis of rotation. The diameter of the bubble can be calculated from the relationship [27]:
d b = x 2 y 0.33
Uncertainty in diameter measurement is presented in the paper [13].
As is well known, the resistance to fluid flow is proportional to the quotient of the length and diameter of the conduit through which it flows. The dimensionless number representing the resistance to flow between the intercostal spaces is the Bond number. For microchannels, they can be defined as follows:
Bo = d h L cap
whereby the capillary length is the ratio of surface tension to buoyancy force and was determined from the relationship:
L cap = σ g ρ l ρ v
The hydraulic diameter is defined as the quotient of four times the area to the circumference of the microchannel, i.e., the height and space between the microchannels. After transformation, it can be written as follows:
d h = 2 wh w + h
Increasing the heat transfer surface area is a major factor in increasing the heat transfer efficiency. The surface extension is the ratio of the extended surface area to the area of the smooth surface:
φ = A ext A bs = 2 h + p p
In addition, porosity as the ratio of the volume of material with void spaces to the total volume of the material ϕ = Vvoid space/Vtotal can affect CHF and HTC, but for the surfaces considered, this parameter is constant at 0.5.

3. Results

Experimental studies (heat transfer and visualization) were performed from ONB to CHF for ethanol as a working fluid at atmospheric pressure, i.e., in the temperature range 77.4–148.2 °C. The surfaces tested were microchannels with the configuration shown in Table 1. The determined boiling curves and qualitative and quantitative images of the vapor bubbles were taken with increasing heat flux.
The analysis of measurement uncertainty was carried out similarly to the work of Hożejowska et al. by means of a complete differential error [28]. The uncertainty values for the measurement sensors utilized in this investigation are shown in Table 3. The absolute error of thermal conductivity was adopted Δλ = 1 W/mK. Measurement uncertainty is affected by the following parameters: the thermal conductivity of the copper, the measurement of the distance between the thermocouples, and the calibration of the thermocouples. The partial derivative method was used to calculate the measurement uncertainty of the heat flux and the heat transfer coefficient.
Using the total differential error determined heat flux measurement uncertainty:
Δ q = q λ Δ λ 2 + q Δ T T 5 T 8 Δ ( Δ T T 5 T 8 ) 2 + q δ T 5 T 8 Δ δ T 5 T 8 2 + q d cyl Δ d cyl 2 + q a Δ a 2
The absolute error of wall superheat:
Δ ( Δ T ) = Δ ( Δ T ) λ Δ λ 2 + Δ ( Δ T ) Δ T sat Δ Δ T sat 2 + Δ ( Δ T ) δ bs Δ δ bs 2 + Δ ( Δ T ) q Δ q 2
wherein
Δ T sat = T T 3 + T T 4 2 T T 1 + T T 2 2
The absolute error in HTC:
Δ α = α q Δ q 2 + α Δ T Δ ( Δ T ) 2
Changes in the measurement uncertainty with increasing heat flux and HTC are shown in Figure 4 and Figure 5, respectively. The relative error of the heat flux measurement ranging from 21.2 to 1035 kW/m2 reached values between 25% and 2.4%. The largest measurement uncertainties occur at q < 120 kW/m2. The relative error in the determination of HTC, which depends on the heat flux and superheat, ranging from 2.6 to 90.3/(m2K) was between 25.9% and 4.4%. The uncertainties in HTC measurements are high because the superheat value is low [29]. In the following boiling curve diagrams, the error bars are not given so as not to obscure the drawings.
The space between the micro-fins causes an increase in capillary pressure ensuring that the fluid is pumped to the bottom of the microchannel, which promotes fluid replenishment and prevents the heating surface from drying out. A higher surface extension factor φ means a narrower gap, resulting in a significant increase in capillary pressure. It should be borne in mind that the flow resistance then increases and the replenishment of the fluid in the microchannel is hampered, reducing the CHF [30] values. Figure 6 shows CHF as a function of (a) surface extension factor and (b) Bo0.5, where the trend of increasing heat flux with increasing extension factor is evident. With constant microchannel width and increasing depth, the flow resistance of the fed fluid in the microchannels increases, thus decreasing the CHF (Figure 6b). In addition, according to Jaikumar and Kandlikar [31], increasing channel width results in better fluid delivery to the channel which prevents drying. However, the opposite trend occurs in the following studies. This likely has to do with a significant increase in capillary pressure and an increase in flow resistance for the test substance. The differences in CHF magnitude occurring for similar values φ and Bo0.5 are not necessarily related to the number of active nucleation sites but are due to the much better fluid delivery to the channel bottom [32].
The best CHF and HTC results were obtained for surfaces with M#2.5, Figure 7 and Figure 8. There was a more than twofold increase in the CHF and a threefold increase in the heat transfer coefficient compared to the smooth sample. The heat flux was 1035 kW/m2, and the heat transfer coefficient reached 90.3 kW/(m2K) with superheat ΔT ≈ 11.5 K.
During the initial boiling phase from ONB to q < 80 kW/m2, the tested surfaces show significant MC/smooth differences of αMCsmooth ≈ 1.01 ÷ 2.89 depending on the surface geometry, Figure 9. For q-values between 80 and 400 kW/m2, αMCsmooth values are in the range of 1 to 1.65, indicating a low amplification of the heat transfer coefficient.
The effect of microchannel depth and width on the heat transfer process was analyzed, Figure 10, Figure 11 and Figure 12. With constant microchannel depth and increasing width, a decrease in CHF was noted, similar to the papers [13]. An increase in the heat transfer efficiency of surfaces with microchannels occurs when the heat transfer surface area is increased and also when the number of nucleation sites increases; this is particularly noticeable for porous surfaces. An additional factor affecting CHF and HTC is the sliding velocity of the vapor bubble inside the microchannel, and as discussed earlier, hydraulic resistance and capillary pressure [33]. Microsurfaces with channels 0.2 mm wide show a favourable increase in thermal performance because there is effective flooding of the microchannels by the liquid, and they have the largest heat transfer surface area of the samples tested. Experimental measurements of the 0.3 mm wide microsurfaces show that they work (performance) the worst. In the initial phase, when q < 430 kW/m2, the HTC values are similar to those for a smooth surface. The only advantage of these areas is that they obtain almost double the CHF.
Figure 13 shows the boiling curve with the most favorable values for the M#2.5 surface and is compared with the boiling curves proposed by other authors. The results of maximum heat fluxes and HTC obtained by other authors are significantly lower. This is due to the development of the surface or material from which they are made. These samples were characterized by a small extension factor.

4. Bubble Departure Diameter

The diameter of the departing bubble is an important parameter for modelling boiling on both smooth and developed surfaces. Determining this diameter involves solving the balancing equation of the positive forces aiming to detach the bubble and the negative forces keeping the bubble on the test surface.
Beer [36] analyzed the balance during boiling on a smooth surface. He assumed that the positive forces were differential pressure force (including excess capillary pressure and excess vapor pressure force) and buoyancy force, while the negative forces were surface tension force, viscous drag force and liquid inertia force. A similar balance of power was applied by Wang et al. [37], with negative forces supplemented with Marangoni force, yielding a 3.8% prediction error for FC-72 bubble departure diameter. Identical positive forces were considered by Kumar et al. [38], but they assumed only one negative force: the surface tension force. Zeng et al. [39] took into account three forces aiming to detach the bubble (contact pressure force, buoyancy force and lift force) and two forces holding the bubble (surface tension force, unsteady growth force), determining the bubble diameter with an error of 16% (reduced gravity for water and methanol). Bucci et al. [40] and Iyer et al. [41] analyzed a balance including two forces tending to detach the bubble, i.e., contact pressure force and buoyancy force, while the forces maintaining the bubble were surface tension force and growth force, with Iyer et al. additionally including a viscous drag force, which made it possible to determine the bubble diameter with an accuracy of 7.6% for boiling water and 8.4% for boiling methanol.
For the extended surface with microchannels between micro-pin-fins, the authors analyzed different configurations of forces acting on the bubble at the moment before detachment: two positive forces and one or four negative forces. Zhou et al. [42] and Kong et al. [43] considered differential pressure force and buoyancy force as positive forces, while negative forces included surface tension force, viscous drag force and liquid inertia force, supplemented with Marangoni force by Zhou et al., and by Kong et al. with additional virtual force–channel pressure. A simplified balance of forces was used by Zhao et al. [44]: capillary pressure force and buoyancy force versus surface tension force. On tunnel-pore structural surfaces, buoyancy force and lift force were used as forces that facilitate bubble departure from a surface, and surface tension force, unsteady growth force and liquid inertia force or bubble inertia force as forces that prevent bubble departure [45,46]. Chien and Webb [47] used a simple equilibrium of buoyancy and surface tension force, which enabled the determination of the bubble departure diameter with a good accuracy of 12% for R-123. When analyzing the boiling of Novec-649 on surfaces with microchannels 0.2–0.4 mm wide, Kaniowski and Pastuszko [13] used the same balance of forces but obtained a larger diameter determination error of 25%. Also, for microchannel surfaces with top width 0.25–0.5 mm and base width 0.5–0.8 mm, Walunj and Sathyabhama [48] used a balance like that of Murthy et al. [46], obtaining a bubble diameter prediction error of 5.6% for boiling water. Taking the balance of differential pressure force and buoyancy force versus surface tension force, drag force and bubble inertia force for boiling FC-72 and Novec-649 in deep mini-channels, Pastuszko et al. [49] obtained larger errors of determination of bubble departure diameter, i.e., 18–32%.
In this paper, the balance of two positive forces (the pressure difference force and buoyancy force) and two negative forces (drag force and surface tension force) were used to determine the diameter of the detachable bubble on a surface with microchannels (Figure 14).
F p + F b u = F d + F st

4.1. Pressure Difference Force

The pressure difference force is dependent on the vapor pressure and capillary pressure [36,37]:
F p = C d ρ l 8 d R d t 2 + 4 σ d b A c
A constant bubble growth rate dR/dt = db/2tg, similar to Walunj and Sathyabhama [48], while the value of the drag coefficient, Cd = 0.5, was assumed according to Pastuszko et al. [49]. The bubble growth period was calculated using the bubble growth equation proposed by Mikic et al. [50]:
d R d t 2 = π i l v ρ v Δ T 7 ρ l T sat T v T sat T w T sat
The authors used a modified form of Equation (14) proposed by Chien and Webb [47] with the width of the microchannels introduced instead of the pore diameter:
t g = 1 C g 7 4 π ρ l T sat i l v ρ v Δ T d b 2 w 2 1 / 2
The empirical parameter Cg = 0.0296 was proposed by Chien and Webb for boiling R-11, R-123, R-134a and R-22. In the case of ethanol boiling, numerical simulations showed the need to increase Cg to a value of 0.08.
The contact surface area (dry spot) between the bubble and the top of the microfins can be calculated using the following formula:
A c = π d bs 2 4
where the diameter of the base of the bubble corresponds to the sum of the width of the microchannels and the thickness of the two micro-ribs, giving dbs = 2p − w (Figure 14).

4.2. Buoyancy Force

The detaching bubble is shaped like an elongated truncated spheroid, but assuming, as a simplified example, a spherical shape of the bubble, the buoyancy force is calculated using
F b u = π d b 3 6 g ρ l ρ v

4.3. Drag Force

The drag force is the liquid resistance that occurs when the diameter of the bubble changes. The bubble growth rate, dR/dt, and the drag coefficient Cd were defined similarly to the pressure difference force. The reference surface is the cross-sectional area of the departing bubble:
F d = C d ρ l 2 d R d t 2 π d b 2 4

4.4. Surface Tension Force

The surface tension force can be determined depending on the relationship:
F st = σ L c sin Θ
The contact line Lc separates the three phases and consists of horizontal arcs with radii corresponding to half the diameter of the base of the bubble (dbs), located at the tops of adjacent microchannels, and four vertical sections with a height equivalent to the depth of the microchannels, minus half the width of the microchannel (Figure 14).
L c = π d bs + 4 h w 2
The diameter of the base of the bubble dbs was determined according to the explanation under Formula (16). In addition, it is assumed that contact angle Θ → π/2, hence sin Θ → 1.
Figure 15 shows a comparison of the bubble diameters determined experimentally and from the theoretical model presented, with reference to the individual surfaces. A small bubble diameter can be observed, which was 1.5–1.8 mm at the smallest heat flux (22–30 kW/m2). An increase in superheat corresponding to approximate heat fluxes of 50–125 kW/m2 results in the stabilization of bubble diameter in the range of 1.9–2.8 mm. The computational model shows the trend associated with the increase in diameter for the heat flux range considered. The best compatibility between the calculations and the experimental data was obtained for the average depths of the microchannels, i.e., 0.3 and 0.4 mm. The relative error in diameter determination does not exceed 19% for q > 49 kW/m2.

5. Conclusions

This paper presents the results of an experimental study of pool boiling on microchannel surfaces using ethanol as a working fluid. The experiments were carried out at atmospheric pressure in the range from the onset of boiling to its crisis.
When constructing and prototyping heat dissipators and exchangers, it is necessary to know the heat transfer coefficient and critical heat flux. When electronic systems, energy sources and digital systems are cooled, heat flux increases with the smallest possible temperature difference between the heating surface and the refrigerant. To achieve this, it is necessary to develop new surfaces and fluids.
For the tested surfaces with microchannels, an intensification of the heat transfer performance was found, with the heat transfer coefficient and the critical heat flux depending on the depth and width of the microchannel. A maximum of three times the heat transfer coefficient of the plain smooth surface was achieved, reaching a value of 90.3 kW/(m2K). The highest HTC and CHF were obtained with the largest surface extension, i.e., for microchannels with a width of 0.2 mm and a depth of 0.5 mm having φ = 3.5. The critical heat flux for this surface was more than double that for the plain smooth surface.
The article showed the method of isolated bubble departure calculation for possible modes of bubble formation in a cavity at the microfin base and growth in the space of the microchannel and at the top of the microfins. The developed theoretical model allowed the diameter of the detachable bubble to be determined for the boiling of ethanol on surfaces with microchannels with an average error of 17% in the superheat range of 3.0–9.7 K, corresponding to an approximate heat flux range of 20–130 kW/m2. Calculations assuming a balance of four forces and the bubble departure between two fins showed good compatibility with experimental data for mini-channels with a width 0.2–0.4 mm in the given heat flux range, taking into account a significant increase in diameter in the range from 20 to approximately 50 kW/m2.
Theoretical modeling of the diameter of departure bubbles leads to a better understanding of the heat transfer mechanism, which in the future will lead to the determination of semi-analytical models for CHF and HTC. Additionally, tests will be carried out on surfaces with inclined microchannels.

Author Contributions

Conceptualization, R.K. and R.P.; methodology, R.K., R.P., E.D. and S.B.; software, R.K. and R.P.; validation, R.K., R.P., E.D. and S.B.; formal analysis, R.K. and R.P.; investigation, R.K. and R.P.; resources, R.K. and R.P.; data curation, R.K. and R.P.; writing—original draft preparation, R.K. and R.P.; writing—review and editing, R.K., R.P., E.D. and S.B.; visualization, R.K. and R.P.; supervision, R.K. and R.P.; project administration, R.K. and R.P.; funding acquisition, R.K. and R.P. All authors have read and agreed to the published version of the manuscript.

Funding

The research reported in this article was partially supported by a grant from Poland’s Minister of Education and Science through the Polish Metrology Program [Polska Metrologia] (Grant Number: PM/SP/0031/2021/1) and by the Research Council of Lithuania and the Ministry of Education and Science of Ukraine under the Lithuanian–Ukrainian Cooperation Programme in the Fields of Research and Technologies (Grant No. S-LU-22-6).

Data Availability Statement

The data presented in this study are available on request from the corresponding author.

Acknowledgments

This research has been conducted as part of an ongoing project “Comprehensive system of functional-oriented planning of machining difficult-to-cut materials for the military-industrial complex (Komplekssys)”.

Conflicts of Interest

The authors declare no conflict of interest.

Nomenclature

Aarea, m2
awidth of specimen, m
BoBond number
Cconstant
cpspecific heat, J/(kgK)
CHFcritical heat flux, W/m2
ddiameter, m
Fforce, N
ffrequency, Hz
ggravitational acceleration, m/s2
HTCheat transfer coefficient, W/(m2K)
hmicrochannel depth, m
ienthaly, kJ/kg
Llength, m
qheat flux, W/m2
ppitch, m
Rradius, m
Raroughness, μm
T temperature, K
ttime, s
wwidth, m
x, ydistance, m
Greek letters
αheat transfer coefficient, W/(m2K)
Δerror, uncertainty
ΔTsuperheat referred to the microfin base, K
δthickness, m
Θcontact angle, rad
φsurface extension factor
λthermal conductivity, W/(mK)
ρdensity, kg/m3
μdynamic viscosity, Pas
σsurface tension, N/m
Subscripts
bdeparting bubble
bsbase
btbottom
bubuoyancy
Cucopper
ccontact line
capcapillary
cylcylinder
ddrag
extextended
hhydraulic
ggrowing
lliquid
MCmicrochannel
ppressure difference
Sntin
satsaturated
stsurface tension
ttop
T1,…,T8thermocouple number
vvapor
wwall

References

  1. Liang, G.; Mudawar, I. Pool Boiling Critical Heat Flux (CHF)—Part 1: Review of Mechanisms, Models, and Correlations. Int. J. Heat Mass Transf. 2018, 117, 1352–1367. [Google Scholar] [CrossRef]
  2. Liang, G.; Mudawar, I. Review of Nanoscale Boiling Enhancement Techniques and Proposed Systematic Testing Strategy to Ensure Cooling Reliability and Repeatability. Appl. Therm. Eng. 2021, 184, 115982. [Google Scholar] [CrossRef]
  3. Kim, J.; Jun, S.; Laksnarain, R.; You, S.M. Effect of Surface Roughness on Pool Boiling Heat Transfer at a Heated Surface Having Moderate Wettability. Int. J. Heat Mass Transf. 2016, 101, 992–1002. [Google Scholar] [CrossRef]
  4. Liu, H.; Zhang, C.; Wang, J.; Zhang, L. Critical Heat Flux Enhancement Using Composite Porous Structure Produced by Selective Laser Melting. Appl. Therm. Eng. 2021, 197, 117396. [Google Scholar] [CrossRef]
  5. Chatys, R.; Orman, Ł.J. Technology and Properties of Layered Composites as Coatings for Heat Transfer Enhancement. Mech. Compos. Mater. 2017, 53, 351–360. [Google Scholar] [CrossRef]
  6. Chatys, R. Aspects of Complexity of Metal-Fibrous Microstructure for the Construction of High-Performance Heat Exchangers: Estimation of Adhesive Strength. Aviation 2020, 24, 117–122. [Google Scholar] [CrossRef]
  7. Zupančič, M.; Fontanarosa, D.; Može, M.; Bucci, M.; Vodopivec, M.; Nagarajan, B.; Rosaria Vetrano, M.; Castagne, S.; Golobič, I. Enhanced Nucleate Boiling of Novec 649 on Thin Metal Foils via Laser-Induced Periodic Surface Structures. Appl. Therm. Eng. 2023, 236, 121803. [Google Scholar] [CrossRef]
  8. Manetti, L.L.; Moita, A.S.O.H.; Cardoso, E.M. A New Pool Boiling Heat Transfer Correlation for Wetting Dielectric Fluids on Metal Foams. Int. J. Heat Mass Transf. 2021, 171, 121070. [Google Scholar] [CrossRef]
  9. Shi, J.; Jia, X.; Feng, D.; Chen, Z.; Dang, C. Wettability Effect on Pool Boiling Heat Transfer Using a Multiscale Copper Foam Surface. Int. J. Heat Mass Transf. 2020, 146, 118726. [Google Scholar] [CrossRef]
  10. Tang, H.; Xia, L.; Tang, Y.; Weng, C.; Hu, Z.; Wu, X.; Sun, Y. Fabrication and Pool Boiling Performance Assessment of Microgroove Array Surfaces with Secondary Micro-Structures for High Power Applications. Renew. Energy 2022, 187, 790–800. [Google Scholar] [CrossRef]
  11. Pastuszko, R. Pool Boiling Heat Transfer on Micro-Fins with Wire Mesh—Experiments and Heat Flux Prediction. Int. J. Therm. Sci. 2018, 125, 197–209. [Google Scholar] [CrossRef]
  12. Chen, G.; Jia, M.; Zhang, S.; Tang, Y.; Wan, Z. Pool Boiling Enhancement of Novel Interconnected Microchannels with Reentrant Cavities for High-Power Electronics Cooling. Int. J. Heat Mass Transf. 2020, 156, 119836. [Google Scholar] [CrossRef]
  13. Kaniowski, R.; Pastuszko, R. Pool Boiling Experiment with Novec-649 in Microchannels for Heat Flux Prediction. Exp. Therm. Fluid Sci. 2023, 141, 110802. [Google Scholar] [CrossRef]
  14. Shen, B.; Hamazaki, T.; Ma, W.; Iwata, N.; Hidaka, S.; Takahara, A.; Takahashi, K.; Takata, Y. Enhanced Pool Boiling of Ethanol on Wettability-Patterned Surfaces. Appl. Therm. Eng. 2019, 149, 325–331. [Google Scholar] [CrossRef]
  15. Kalani, A.; Kandlikar, S.G. Enhanced Pool Boiling with Ethanol at Subatmospheric Pressures for Electronics Cooling. J. Heat Transf. 2013, 135, 111002. [Google Scholar] [CrossRef]
  16. Deng, D.; Feng, J.; Huang, Q.; Tang, Y.; Lian, Y. Pool Boiling Heat Transfer of Porous Structures with Reentrant Cavities. Int. J. Heat Mass Transf. 2016, 99, 556–568. [Google Scholar] [CrossRef]
  17. Deng, D.; Wan, W.; Feng, J.; Huang, Q.; Qin, Y.; Xie, Y. Comparative Experimental Study on Pool Boiling Performance of Porous Coating and Solid Structures with Reentrant Channels. Appl. Therm. Eng. 2016, 107, 420–430. [Google Scholar] [CrossRef]
  18. Hao, W.; Wang, T.; Jiang, Y.; Guo, C.; Guo, C. Pool Boiling Heat Transfer on Deformable Structures Made of Shape-Memory-Alloys. Int. J. Heat Mass Transf. 2017, 112, 236–247. [Google Scholar] [CrossRef]
  19. Vasauskas, V.; Baskutis, S. Failures and Fouling Analysis in Heat Exchangers. Mechanics 2006, 61, 24–31. [Google Scholar]
  20. Baskutis, S.; Vasauskas, V. Mechanics and Material Aspects in Serviceability Prediction of the Heat Exchangers. Mechanics 2011, 17, 239–245. [Google Scholar] [CrossRef]
  21. Kurp, P. Ideas and Assumptions of a New Kind Helical Metal Expansion Joints. In Proceedings of the Terotechnology XII, 12th International Conference on Terotechnology, Kielce, Poland, 20–21 October 2021; pp. 233–239. [Google Scholar]
  22. Kurp, P.; Danielewski, H.; Szwed, B.; Borkowski, K.; Zrak, A.; Gaponova, O.P. Discussion about Metal Expansion Joints Manufacturing Technology of Preventing Thermal Deformation Pipelines Intended for the Fluids Transport. Komunikácie 2023, 25, B110–B117. [Google Scholar] [CrossRef]
  23. Piasecka, M.; Strąk, K.; Maciejewska, B. Heat Transfer Characteristics during Flow along Horizontal and Vertical Minichannels. Int. J. Multiph. Flow 2021, 137, 103559. [Google Scholar] [CrossRef]
  24. Piasecka, M.; Strąk, K. Boiling Heat Transfer during Flow in Vertical Mini-Channels with a Modified Heated Surface. Energies 2022, 15, 7050. [Google Scholar] [CrossRef]
  25. Kowalczyk, J.; Madej, M.; Dzięgielewski, W.; Kulczycki, A.; Żółty, M.; Ozimina, D. Tribochemical Interactions between Graphene and ZDDP in Friction Tests for Uncoated and W-DLC-Coated HS6-5-2C Steel. Materials 2021, 14, 3529. [Google Scholar] [CrossRef] [PubMed]
  26. Skrzyniarz, M.; Nowakowski, L.; Miko, E.; Borkowski, K. Influence of Relative Displacement on Surface Roughness in Longitudinal Turning of X37CrMoV5-1 Steel. Materials 2021, 14, 1317. [Google Scholar] [CrossRef]
  27. Kim, J.; Oh, B.D.; Kim, M.H. Experimental Study of Pool Temperature Effects on Nucleate Pool Boiling. Int. J. Multiph. Flow 2006, 32, 208–231. [Google Scholar] [CrossRef]
  28. Hożejowska, S.; Kaniowski, R.; Pastuszko, R. Application of the Trefftz Method for Pool Boiling Heat Transfer on Open Microchannel Surfaces. Heat Transf. Eng. 2021, 43, 362–370. [Google Scholar] [CrossRef]
  29. Jaikumar, A.; Kandlikar, S.G. Enhanced Pool Boiling Heat Transfer Mechanisms for Selectively Sintered Open Microchannels. Int. J. Heat Mass Transf. 2015, 88, 652–661. [Google Scholar] [CrossRef]
  30. Zhang, Y.; Zhou, J.; Zhou, W.; Qi, B.; Wei, J. CHF Correlation of Boiling in FC-72 with Micro-Pin-Fins for Electronics Cooling. Appl. Therm. Eng. 2018, 138, 494–500. [Google Scholar] [CrossRef]
  31. Jaikumar, A.; Kandlikar, S.G. Ultra-High Pool Boiling Performance and Effect of Channel Width with Selectively Coated Open Microchannels. Int. J. Heat Mass Transf. 2016, 95, 795–805. [Google Scholar] [CrossRef]
  32. Kim, S.H.; Lee, G.C.; Kang, J.Y.; Moriyama, K.; Kim, M.H.; Park, H.S. Boiling Heat Transfer and Critical Heat Flux Evaluation of the Pool Boiling on Micro Structured Surface. Int. J. Heat Mass Transf. 2015, 91, 1140–1147. [Google Scholar] [CrossRef]
  33. Gheitaghy, A.M.; Samimi, A.; Saffari, H. Surface Structuring with Inclined Minichannels for Pool Boiling Improvement. Appl. Therm. Eng. 2017, 126, 892–902. [Google Scholar] [CrossRef]
  34. Surtaev, A.; Serdyukov, V.; Zhou, J.; Pavlenko, A.; Tumanov, V. An Experimental Study of Vapor Bubbles Dynamics at Water and Ethanol Pool Boiling at Low and High Heat Fluxes. Int. J. Heat Mass Transf. 2018, 126, 297–311. [Google Scholar] [CrossRef]
  35. Nikulin, A.; Grosu, Y.; Dauvergne, J.-L.; Ortuondo, A.; del Barrio, E.P. Physical Dealloying for Two-Phase Heat Transfer Applications: Pool Boiling Case. Int. Commun. Heat Mass Transf. 2023, 146, 106913. [Google Scholar] [CrossRef]
  36. Beer, H. Das dynamische Blasenwachstum beim Sieden von Flüssigkeiten an Heizflächen. Forschung. Im Ingenieurwesen 1971, 37, 85–90. [Google Scholar] [CrossRef]
  37. Wang, X.; Wu, Z.; Wei, J.; Sundén, B. Correlations for Prediction of the Bubble Departure Radius on Smooth Flat Surface during Nucleate Pool Boiling. Int. J. Heat Mass Transf. 2019, 132, 699–714. [Google Scholar] [CrossRef]
  38. Kumar, N.; Ghosh, P.; Shukla, P. Development of an Approximate Model for the Prediction of Bubble Departure Diameter in Pool Boiling of Water. Int. Commun. Heat Mass Transf. 2021, 127, 105531. [Google Scholar] [CrossRef]
  39. Zeng, L.Z.; Klausner, J.F.; Mei, R. A Unified Model for the Prediction of Bubble Detachment Diameters in Boiling Systems—I. Pool Boiling. Int. J. Heat Mass Transf. 1993, 36, 2261–2270. [Google Scholar] [CrossRef]
  40. Bucci, M.; Buongiorno, J.; Bucci, M. The Not-so-Subtle Flaws of the Force Balance Approach to Predict the Departure of Bubbles in Boiling Heat Transfer. Phys. Fluids 2021, 33, 017110. [Google Scholar] [CrossRef]
  41. Iyer, S.; Kumar, A.; Coventry, J.; Lipiński, W. Modelling of Bubble Growth and Detachment in Nucleate Pool Boiling. Int. J. Therm. Sci. 2023, 185, 108041. [Google Scholar] [CrossRef]
  42. Zhou, J.; Zhang, Y.; Wei, J. A Modified Bubble Dynamics Model for Predicting Bubble Departure Diameter on Micro-Pin-Finned Surfaces under Microgravity. Appl. Therm. Eng. 2018, 132, 450–462. [Google Scholar] [CrossRef]
  43. Kong, X.; Zhang, Y.; Wei, J. Experimental Study of Pool Boiling Heat Transfer on Novel Bistructured Surfaces Based on Micro-Pin-Finned Structure. Exp. Therm. Fluid Sci. 2018, 91, 9–19. [Google Scholar] [CrossRef]
  44. Zhao, Z.; Ma, X.; Li, S.; Yang, S.; Huang, L. Visualization-Based Nucleate Pool Boiling Heat Transfer Enhancement on Different Sizes of Square Micropillar Array Surfaces. Exp. Therm. Fluid Sci. 2020, 119, 110212. [Google Scholar] [CrossRef]
  45. Ramaswamy, C.; Joshi, Y.; Nakayama, W.; Johnson, W.B. Semi-Analytical Model for Boiling from Enhanced Structures. Int. J. Heat Mass Transf. 2003, 46, 4257–4269. [Google Scholar] [CrossRef]
  46. Murthy, S.; Joshi, Y.; Gurrum, S.; Nakayama, W. Enhanced Boiling Heat Transfer Simulation from Structured Surfaces: Semi-Analytical Model. Int. J. Heat Mass Transf. 2006, 49, 1885–1895. [Google Scholar] [CrossRef]
  47. Chien, L.-H.; Webb, R.L. A Nucleate Boiling Model for Structured Enhanced Surfaces. Int. J. Heat Mass Transf. 1998, 41, 2183–2195. [Google Scholar] [CrossRef]
  48. Walunj, A.; Sathyabhama, A. Comparative Study of Pool Boiling Heat Transfer from Various Microchannel Geometries. Appl. Therm. Eng. 2018, 128, 672–683. [Google Scholar] [CrossRef]
  49. Pastuszko, R.; Kaniowski, R.; Dadas, N.; Bedla-Pawlusek, M. Pool Boiling Enhancement and a Method of Bubble Diameter Determination on Surfaces with Deep Minichannels. Int. J. Heat Mass Transf. 2021, 179, 121713. [Google Scholar] [CrossRef]
  50. Mikic, B.B.; Rohsenow, W.M.; Griffith, P. On Bubble Growth Rates. Int. J. Heat Mass Transf. 1970, 13, 657–666. [Google Scholar] [CrossRef]
Figure 1. Experimental setup—(a) schematic diagram, (b) photo.
Energies 16 07883 g001
Figure 2. Arrangement of thermocouples, dimensions in mm. T1–T8 are the thermocouple numbers.
Energies 16 07883 g002
Figure 3. (a) View of the M#2.5 specimen, (b) surface profile, (c) channel outline, (d) channel top Rat, (e) channel bottom Rabt.
Energies 16 07883 g003
Figure 4. Relative uncertainties at different heat fluxes.
Energies 16 07883 g004
Figure 5. Relative uncertainties at various HTCs.
Energies 16 07883 g005
Figure 6. Variation in CHF with (a) surface extension factor, (b) Bo0.5 for microchannel.
Energies 16 07883 g006
Figure 7. Maximum heat flux for different specimens.
Energies 16 07883 g007
Figure 8. Maximum heat transfer coefficient for different specimens.
Energies 16 07883 g008
Figure 9. HTC in nondimensional form for microchannel surfaces.
Energies 16 07883 g009
Figure 10. Pool boiling curves for ethanol, variable depth, channel width 0.2 mm.
Energies 16 07883 g010
Figure 11. Pool boiling curves for ethanol, variable depth, channel width 0.3 mm.
Energies 16 07883 g011
Figure 12. Pool boiling curves for ethanol, variable depth, channel width 0.4 mm.
Energies 16 07883 g012
Figure 13. Comparison of pool boiling performance of ethanol between the present sample M#2.5 and samples in the literature Hao et al. (2017) [18], Surtataev et al. (2018) [34], Shen et al. (2019) [14], Nikulin et al. (2023) [35].
Energies 16 07883 g013
Figure 14. The method for determining the balance of forces, the contact line and contact area.
Energies 16 07883 g014
Figure 15. Comparison of the calculated and measured bubble departure diameters for microchannels 0.2–0.4 mm wide and with a depth of 0.2–0.5 mm.
Energies 16 07883 g015aEnergies 16 07883 g015b
Table 1. Ethanol—thermophysical properties.
Parameters at 1013.25 hPaEthanol
Tsat, °C78.3
ρl, kg/m3717
ρv, kg/m31.43
λl, W/(mK)0.17
ilv, kJ/kg963
σl, N/m0.0177
μl, Pas0.00044
cpl, J/(kgK)723
Table 2. Specimen codes and specifications. The sample area—27 × 27 mm2.
Surface Codep,
mm
w,
mm
h,
mm
φdh,
mm
BoBo0.5Rat,
µm
Rabt,
µm
M#2.20.40.20.22.000.2000.0160.1260.300.30
M#2.30.40.20.32.500.2400.0230.1510.300.40
M#2.40.40.20.43.000.2670.0280.1680.140.25
M#2.50.40.20.53.500.2860.0320.1800.240.30
M#3.20.60.30.21.670.2400.0230.1510.180.12
M#3.30.60.30.32.000.3000.0360.1890.200.12
M#3.40.60.30.42.330.3430.0470.2160.180.18
M#3.50.60.30.52.670.3750.0560.2360.140.25
M#4.20.80.40.21.500.2670.0280.1680.220.12
M#4.30.80.40.31.750.3430.0470.2160.250.15
M#4.40.80.40.42.000.4000.0630.2520.310.14
M#4.50.80.40.52.250.4440.0780.2800.250.12
Table 3. Uncertainty regarding the equipment.
ParameterToolsUncertainty
Temperature, KK-type thermocouple calibrated±0.1
The temperature difference in the Heating cylinder, KK-type thermocouple calibrated±0.2
Wall superheat, KK-type thermocouple calibrated±0.2
Geometric quantities, mCalipers for precision0.00025 m
Disclaimer/Publisher’s Note: The statements, opinions and data contained in all publications are solely those of the individual author(s) and contributor(s) and not of MDPI and/or the editor(s). MDPI and/or the editor(s) disclaim responsibility for any injury to people or property resulting from any ideas, methods, instructions or products referred to in the content.

