Article

An Improved Optimally Designed Fuzzy Logic-Based MPPT Method for Maximizing Energy Extraction of PEMFC in Green Buildings

1
Facultad de Ingeniería, Arquitectura y Diseño, Universidad San Sebastián, Bellavista 7, Santiago 8420524, Chile
2
Department of Electrical Engineering, College of Engineering, Prince Sattam bin Abdulaziz University, Al Kharj 16278, Saudi Arabia
3
Department of Electrical Engineering, Faculty of Engineering, Aswan University, Aswan 81542, Egypt
4
Department of Electrical Engineering, College of Engineering in Wadi Alddawasir, Prince Sattam bin Abdulaziz University, Wadi Alddawasir 11991, Saudi Arabia
5
Electrical Engineering Department, Faculty of Engineering, Minia University, Minia 61111, Egypt
6
Computers and Automatic Control Engineering Department, Faculty of Engineering, Tanta University, Tanta 31733, Egypt
7
Computers and Control Systems Engineering Department, Faculty of Engineering, Mansoura University, Mansoura 35516, Egypt
8
College of Computer Science and Engineering, Taibah University, Yanbu 46421, Saudi Arabia
*
Authors to whom correspondence should be addressed.
Energies 2023, 16(3), 1197; https://doi.org/10.3390/en16031197
Submission received: 24 November 2022 / Revised: 16 January 2023 / Accepted: 18 January 2023 / Published: 21 January 2023

Abstract

:
Recently, the concept of green building has become popular, and various renewable energy systems have been integrated into green buildings. In particular, the application range of fuel cells (FCs) has become widespread due to the various government plans regarding green hydrogen energy systems. In particular, proton exchange membrane fuel cells (PEMFCs) have proven superiority over other existing FCs. However, the uniqueness of the operating maximum power point (MPP) of PEMFCs represents a critical issue for the PEMFC control systems. The perturb and observe, incremental conductance/resistance, and fuzzy logic control (FLC) represent the most used MPP tracking (MPPT) algorithms for PEMFC systems, among which the FLC-based MPPT methods have shown improved performance compared to the other methods. Therefore, this paper presents a modified FLC-based MPPT method for PEMFC systems in green building applications. The proposed method employs the rate of change of the power with current ( d P / d I ) instead of the previously used rate of change of power with voltage ( d P / d V ) in the literature. The employment of d P / d I in the proposed method enables the fast-tracking of the operating MPP with low transient oscillations and mitigated steady-state fluctuations. Additionally, the design process of the proposed controller is optimized using the enhanced version of the success-history-based adaptive differential evolution (SHADE) algorithm with linear population size reduction, known as the LSHADE algorithm. The design optimization of the proposed method is advantageous for increasing the adaptiveness, robustness, and tracking of the MPP in all the operating scenarios. Moreover, the proposed MPPT controller can be generalized to other renewable energy and/or FCs applications. The proposed method is implemented using C-code with the PEMFC model and tested in various operating cases. The obtained results show the superiority and effectiveness of the proposed controller compared to the classical proportional-integral (PI) based d P / d I -based MPPT controller and the classical FLC-based MPPT controller. Moreover, the proposed controller achieves reduced output waveforms ripple, fast and accurate MPPT operation, and simple and low-cost implementation.

1. Introduction

The energy crisis and climate changes have pushed the urgent need for energy transition and installing alternative energy sources instead of conventional fossil fuel sources [1,2]. In this context, renewable energy sources (RESs) have been adopted globally in government ambitious plans to replace the wide extent of the environmental pollutant fossil fuel-based generation systems [3,4,5]. Moreover, for building scales, RESs have found extensive installation with increased motivations for citizens to contribute more energy transition plans [6]. This, in turn, has reshaped the power system structures and the energy supply for buildings, and hence green building concepts have been widely used. In green buildings, energy storage devices are essential for achieving continuous power supply, regardless of the intermittent properties of RESs. This is due to the fact that output power from RESs varies with the ambient conditions, such as solar irradiance, wind speed, temperature, etc. [7].
Several technologies of energy storage devices have been integrated with RESs in green buildings [8]. With the possibility of generating green hydrogen through utilizing RESs power, hydrogen fuel cells (FCs) are getting wider concerns, and applications [9,10]. FCs represent electrochemical devices that combine hydrogen and oxygen gases for electricity generation. Compared with other storage devices, FCs are advantageous at being highly-reliable, highly-efficient, noise-free, and capable of pollution elimination from the environment. The main technologies of fuel cells are alkaline FCs, molten carbonate FCs, proton exchange-membrane FCs (PEMFCs), direct methanol FCs, phosphoric acid FCs, and solid-oxide FCs [11,12,13].
The PEMFC systems represent lightweight FCs with low temperature, fast start-up, and high-power density solutions. This, in turn, makes PEMFCs more popular, with high performance for vehicular and residential applications [14,15]. However, output characteristics of PEMFCs are nonlinear and they depend on several factors, such as temperature, partial pressures of oxygen, hydrogen, and the membrane’s water content [16]. Their characteristics show that outputted power-current curves of PEMFCs possess a unique point for operation at maximum output power from the PEMFC. This point is referred to as the maximum power point (MPP) operation for each operating condition set. Continuous tracking of MPP is essential to maximize useful power from PEMFCs and hence better operating efficiency. The responsible controller for achieving this objective is the MPP tracking (MPPT) algorithm [17,18]. The MPPT control can guarantee the extraction of maximum power at each operating point, whereas the energy management controller of the whole power system is responsible for the maximum energy optimization of its connected elements.
In the literature, several control methods have been proposed for MPPT control of PEMFCs. The well-known perturb and observe (P&O) MPPT controller has found wide application with simple and low-cost implementation [19,20]. However, P&O-based MPPT compromises the tracking speed with steady-state oscillations. Other MPPT schemes have been introduced to get over the limitations of P&O MPPT scheme, such as incremental conductance MPPT (INC) and incremental resistance MPPT (INR) methods in [21,22,23]. They have achieved a faster tracking speed with reduced steady-state oscillations. A modified version based on non-integer INC has been proposed in [24] with a wider operating range and non-constant step size. An artificial neural network (ANN)-based INC MPPT scheme has been proposed for improving the output power performance of PEMFCs [25]. The JAYA-based optimized MPPT controller has been introduced for grid-tied hybrid microgrid systems [26]. The extremum seeking with PID cascaded controller has been proposed for MPPT in [27], whereas a particle swarm optimizer (PSO) has been employed for optimally-determining PID parameters. Another salp swarm optimizer algorithm (SSA) has been presented in [28] for PID parameters’ optimization. A grey-wolf optimization (GWO) algorithm has been proposed in [29] for MPPT control of PEMFC with considered variable conditions of operation. The reference tracking in this method is based on using the d P / d I slope for achieving faster response. Additional optimized PID two-loop MPPT control methods have been proposed in [30] using a sine-cosine optimizer algorithm (SCA) and in [31] using an ant-lion optimization (ALO) algorithm.
To achieve improved performance, fuzzy logic controllers (FLCs) have been introduced for MPPT control using variable step size and higher freedom in their design [32,33,34]. FLC MPPT methods employ a single loop without the need for PID controllers [35,36]. Moreover, FLC has shown improved performance in several photovoltaic (PV) applications [37,38,39]. A hybrid INC with an FLC has been proposed in [40] to combine both benefits. Comparisons between the performance of Sugeno-based and Mamdani-based FLC MPPT schemes have been presented in [41]. The asymmetrical design of input/output membership functions (MFs) FLC using firefly optimizer has shown better performance at MPPT control [42]. The Mamdani-based FLC MPPT scheme has been proposed in [43] and compared with PSO algorithm-based MPPT control. Moreover, several MPPT control schemes have been proposed based on an ANN [25] and adaptive neuro-fuzzy inference systems (ANFIS) [44]. An ANFIS MPPT controller has been introduced in EVs applications [45]. Moreover, a neural network MPPT control algorithm has been presented for PEMFC applications [46]. However, several challenges exist for existing MPPT control schemes in PEMFC applications, including the tracking speed, steady-state oscillations, implementation requirements, number and cost of sensors, and extracted power maximization.
The contribution of this paper is different from the above-mentioned FLC-based MPPT methods, such as in [36]. The proposed method in this paper employs the rate of change of the power with current ( d P / d I ) as input for the FLC method, whereas the method in [36] is based on using the rate of change of power with voltage ( d P / d V ), which is very sensitive to PEMFC voltage variations. Therefore, faster and more precise tracking can be obtained by using the d P / d I in the proposed method instead of using d P / d V in [36]. In addition, the proposed d P / d I based design achieves MPPT operation with lower oscillations during transients with high mitigation of steady-state fluctuations.
It is clear that FLC-based control methods add more freedom to the design of MPPT in PEMFC applications. The freedom in their design comes from the flexibility to select input/output MFs’ shapes, types, boundaries, and points locations. Therefore, this paper proposes the FLC MPPT control method for PEMFC applications by employing the rate of change of the power with current ( d P / d I ) instead of the previously used rate of change of the power with voltage ( d P / d V ) in classical LFC methods. The main contributions of this paper are as follows:
  • A new FLC MPPT control method for PEMFCs is proposed in this paper for maximizing energy extraction in green buildings. The proposed FLC MPPT method employs the rate-of-change of PEMFC power with current ( d P / d I ) instead of the widely-used rate of change of the power with voltage ( d P / d V ) in the classical FLC MPPT method. Employing d P / d I in the proposed method enables the fast-tracking of MPPT control with reduced steady-state power oscillations.
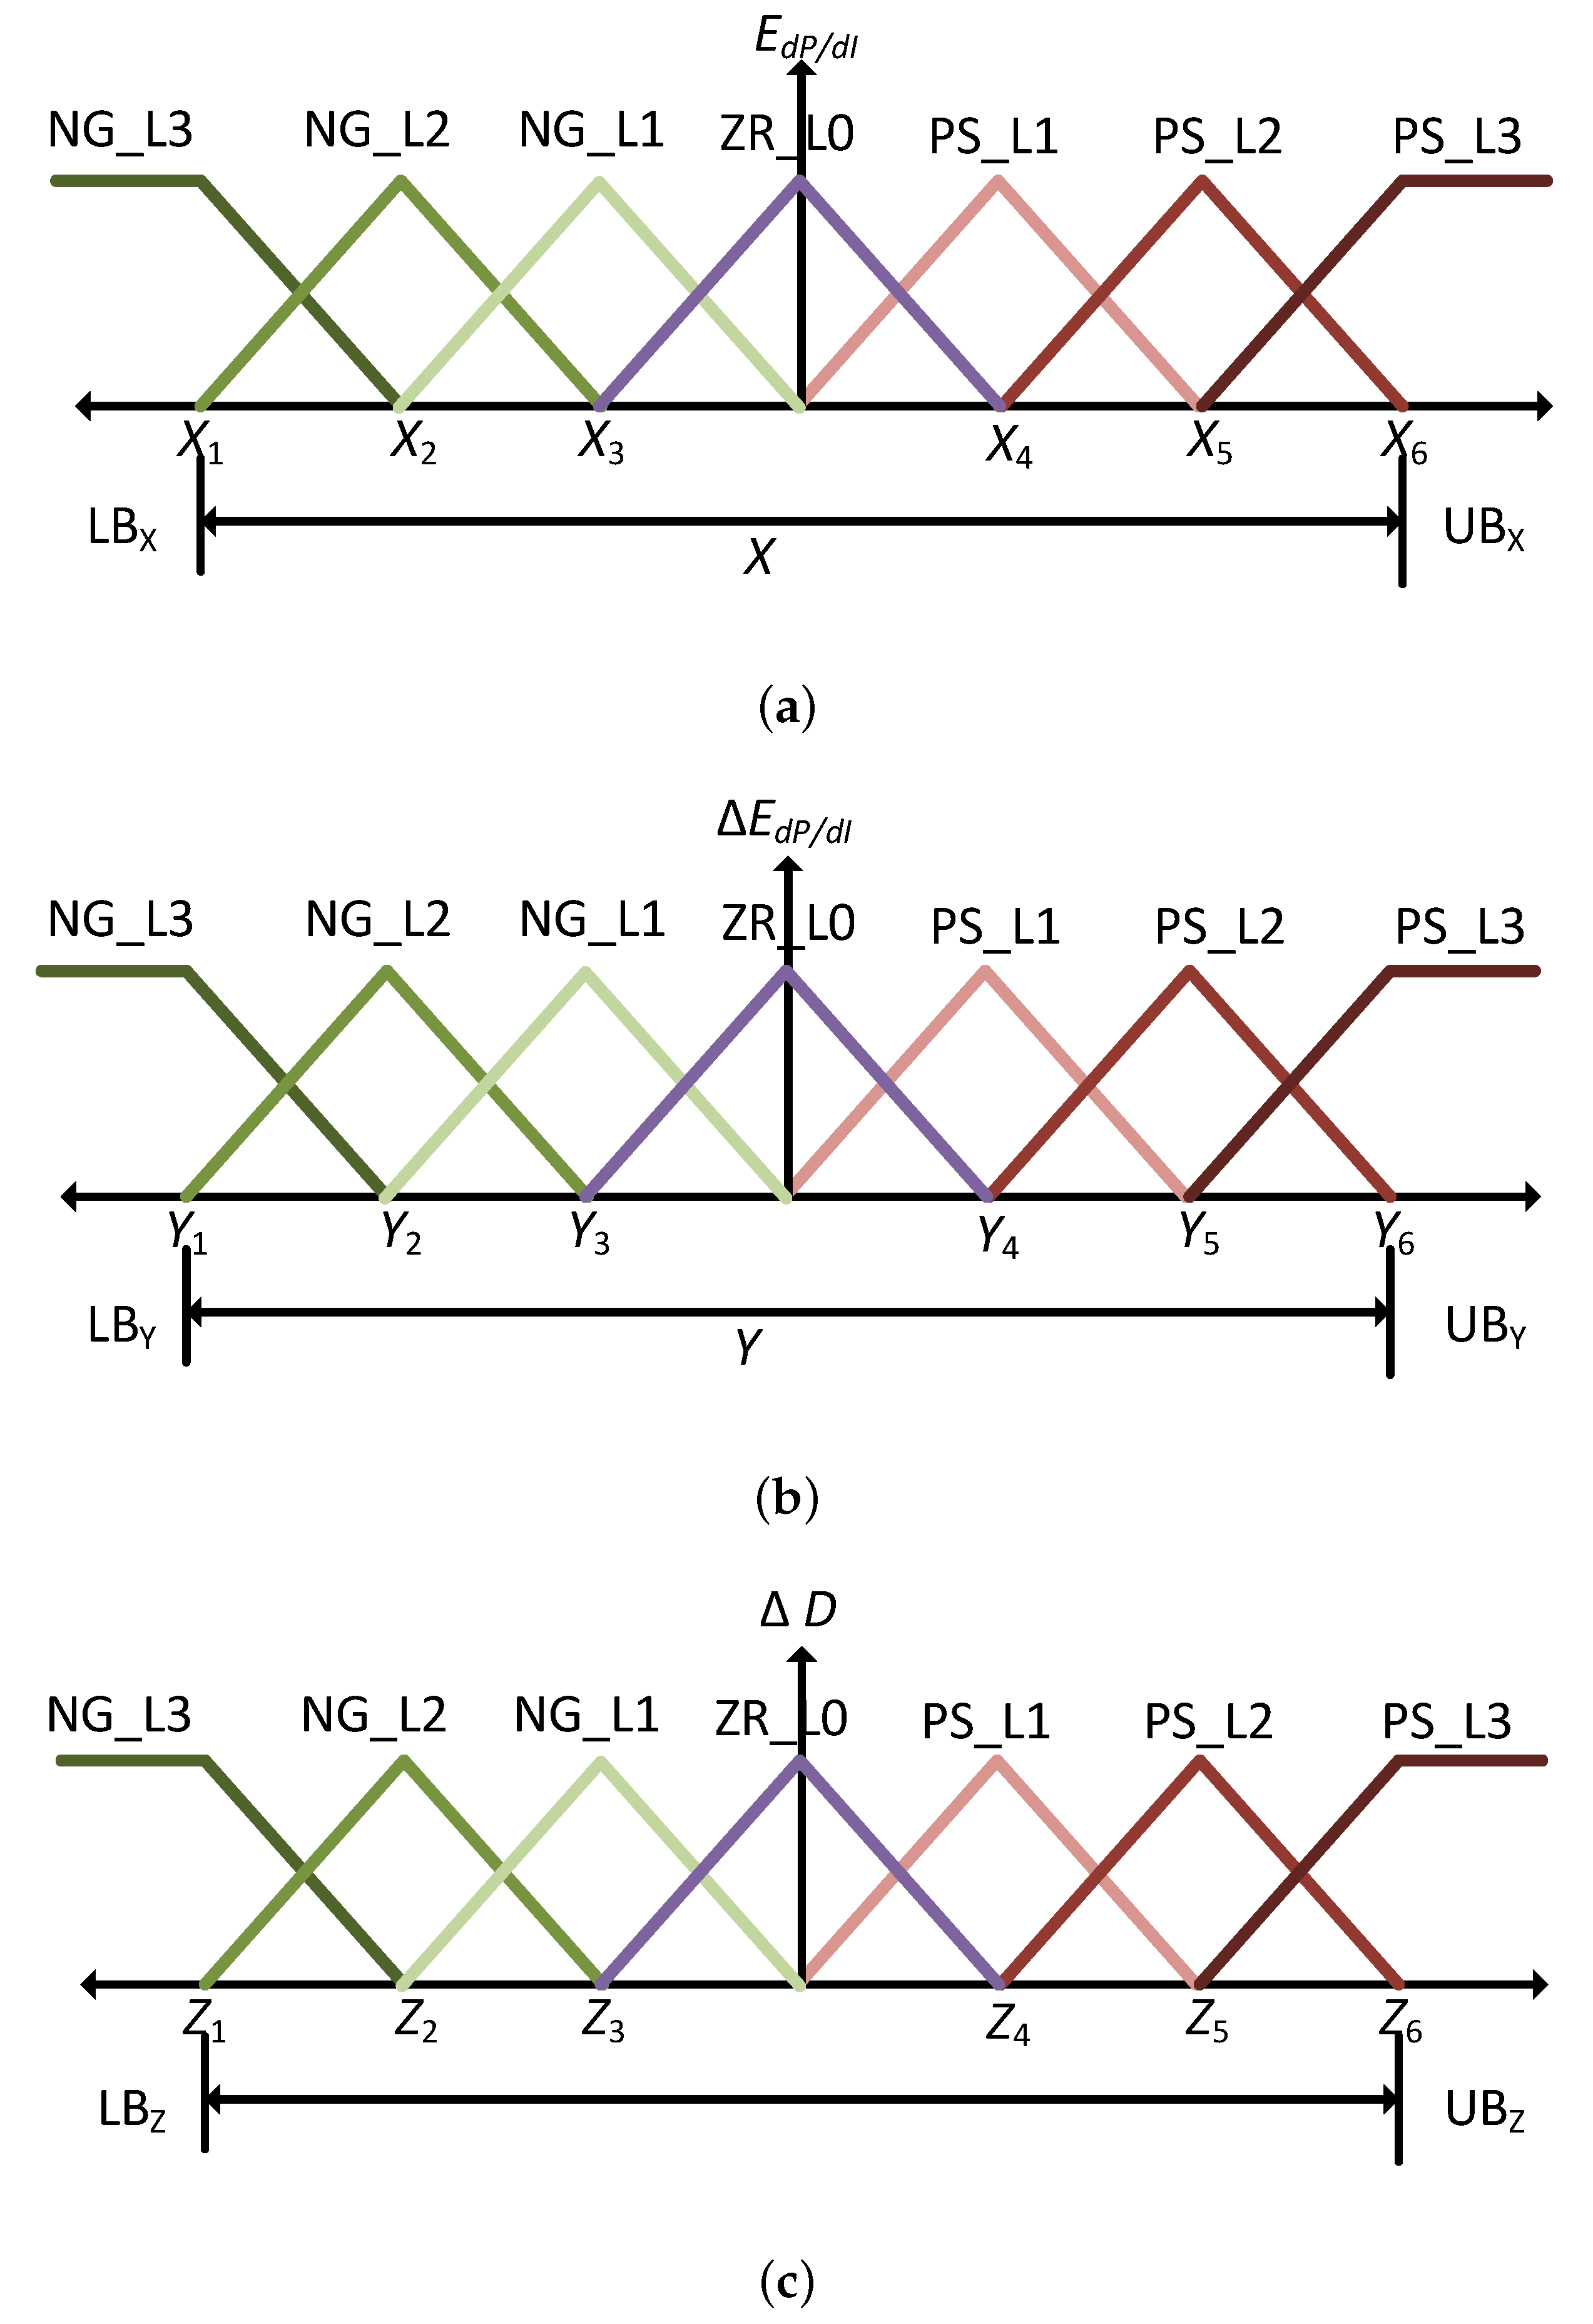
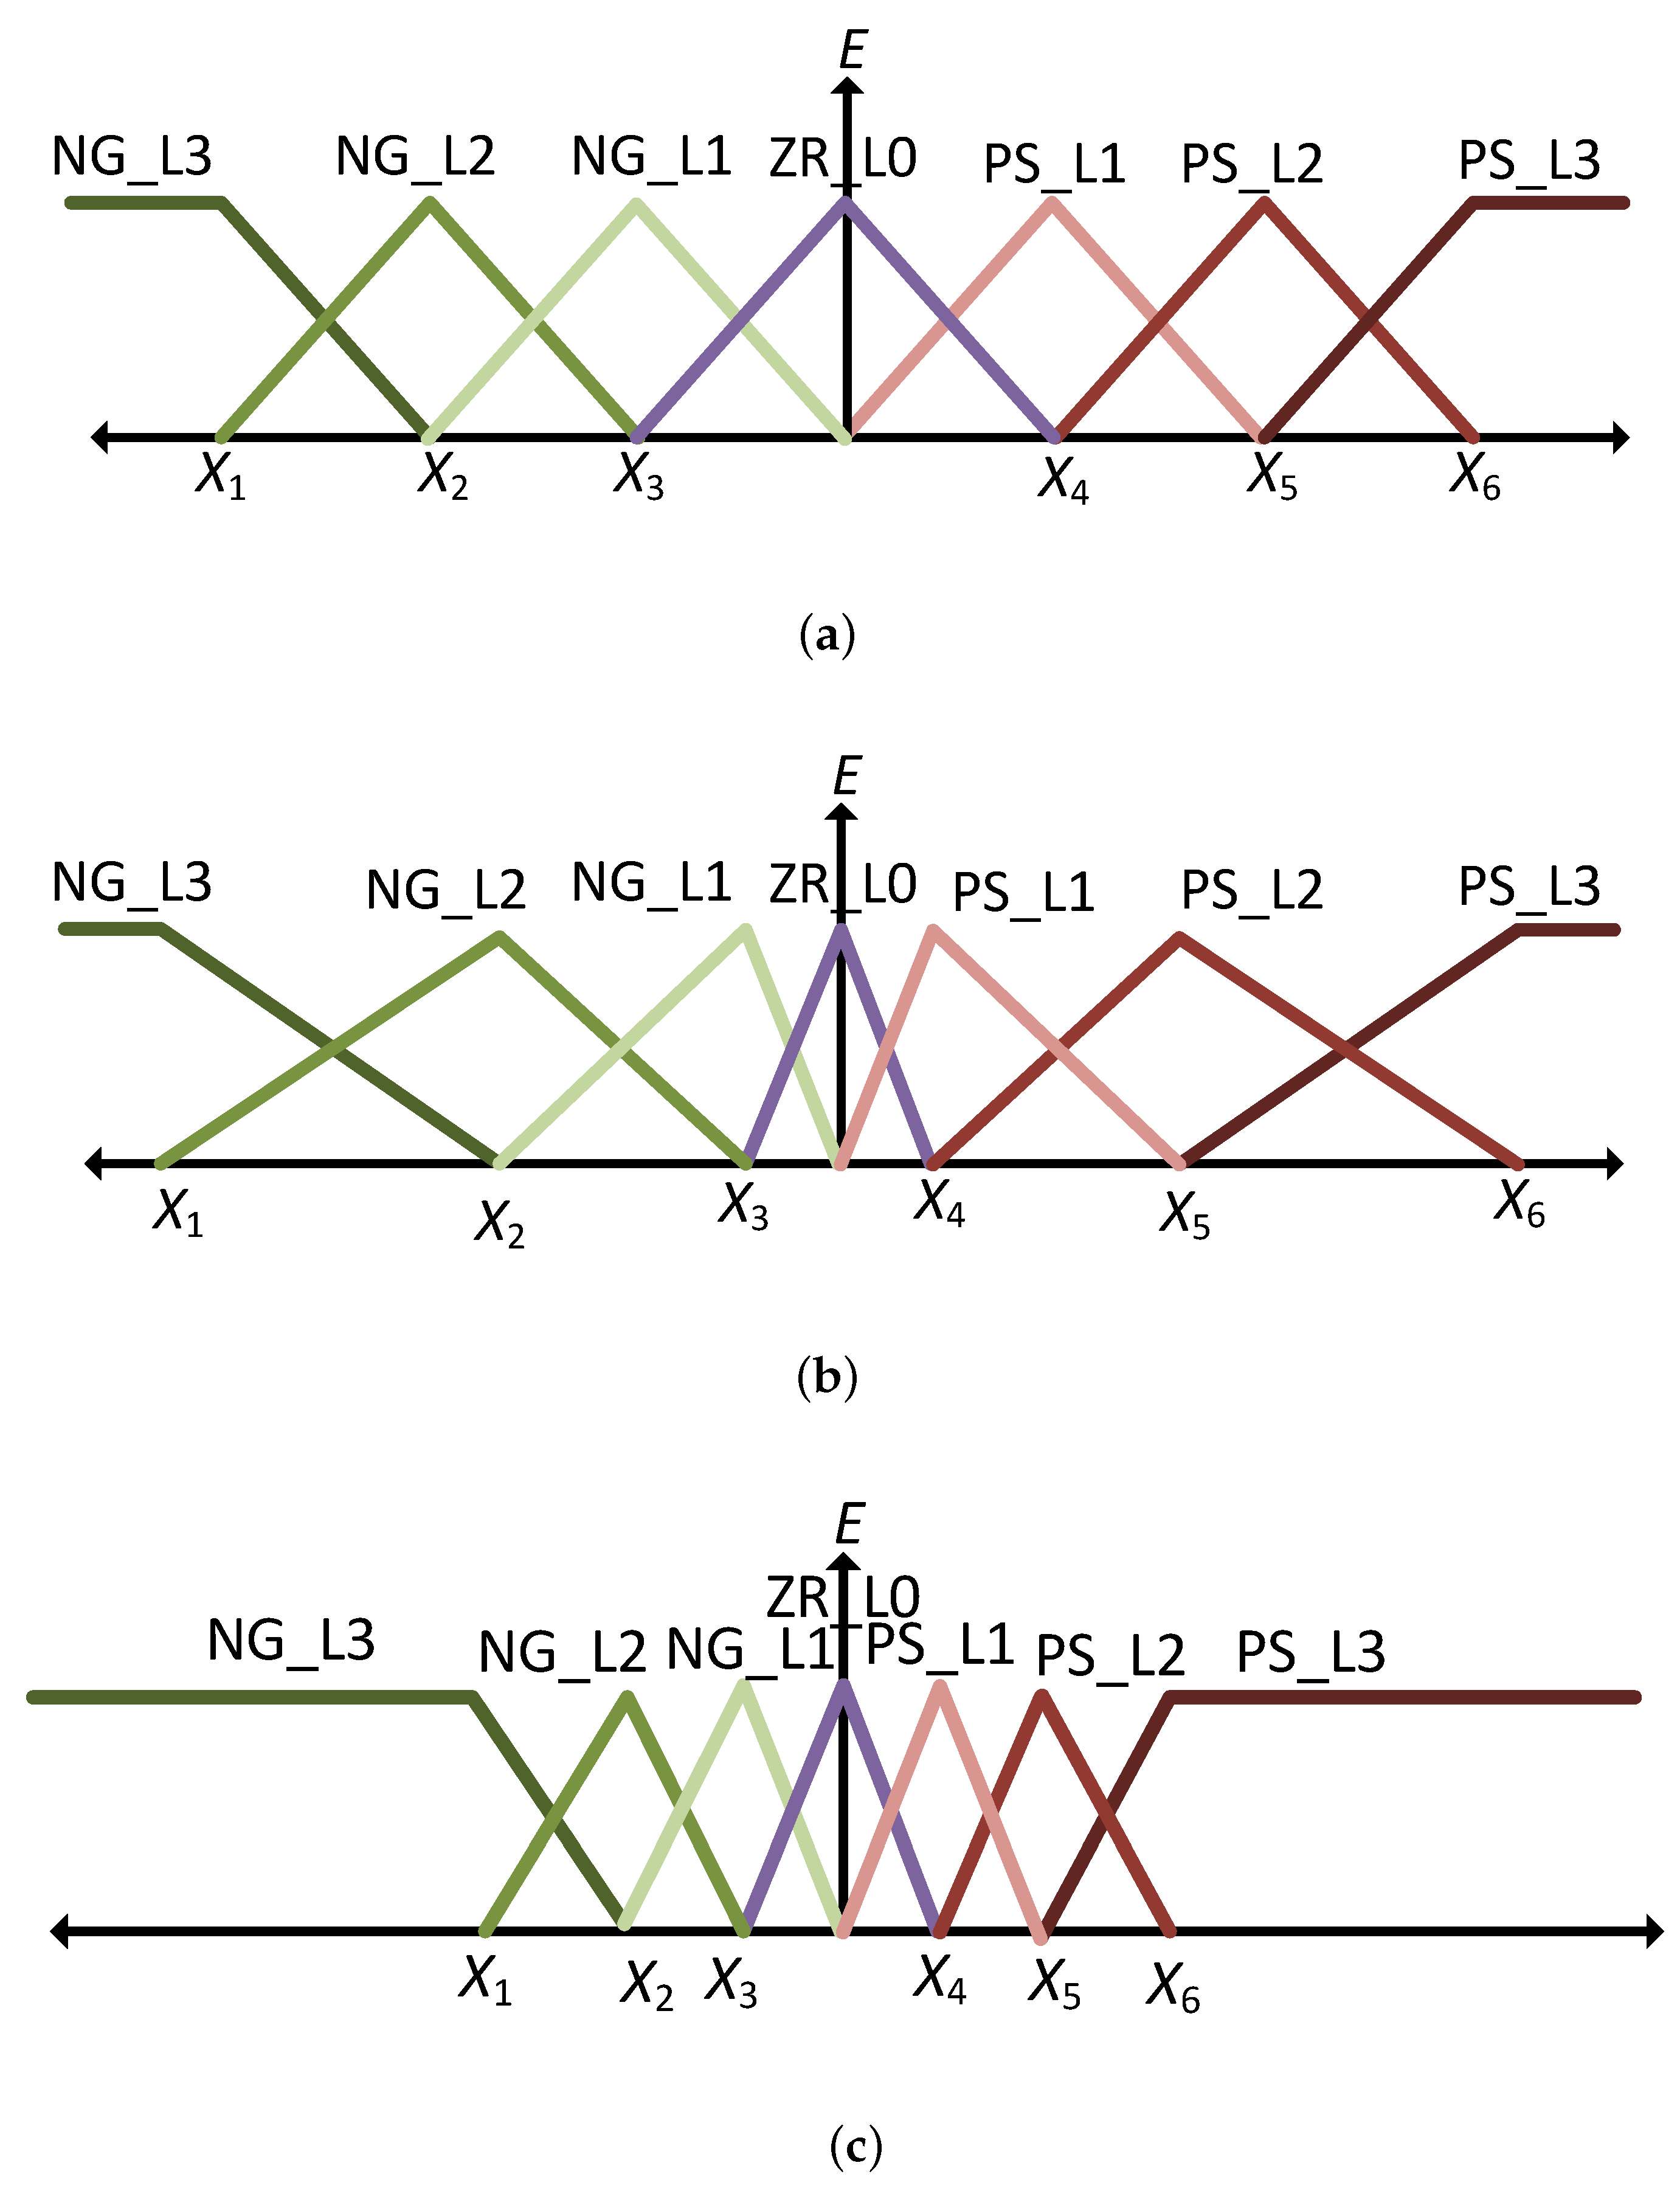
  • An improved design method for FLC MFs is presented in the proposed modified FLC MPPT method. The proposed FLC design adds more flexibility in designing input/output MFs through the proper selection of their shapes, type, boundaries, and locations of points.
  • A new application of an enhanced version of success-history-based adaptive differential evolution (SHADE) with linear population size reduction, known as LSHADE algorithm, for simultaneous determination of FLC design parameters in the proposed MPPT method. The proposed optimization process enables higher adaptiveness, robustness, and MPPT control for the whole range.
The paper is organized as follows: Section 2 overviews PEMFC in green buildings and power converter structure. Section 3 details PEMFC modeling and characteristics. The classical FLC MPPT method is presented in Section 4. Section 5 presents the newly proposed FLC method and LSHADE optimization method. The obtained results and comparisons are presented in Section 6. Finally, the paper’s conclusions are provided in Section 7.

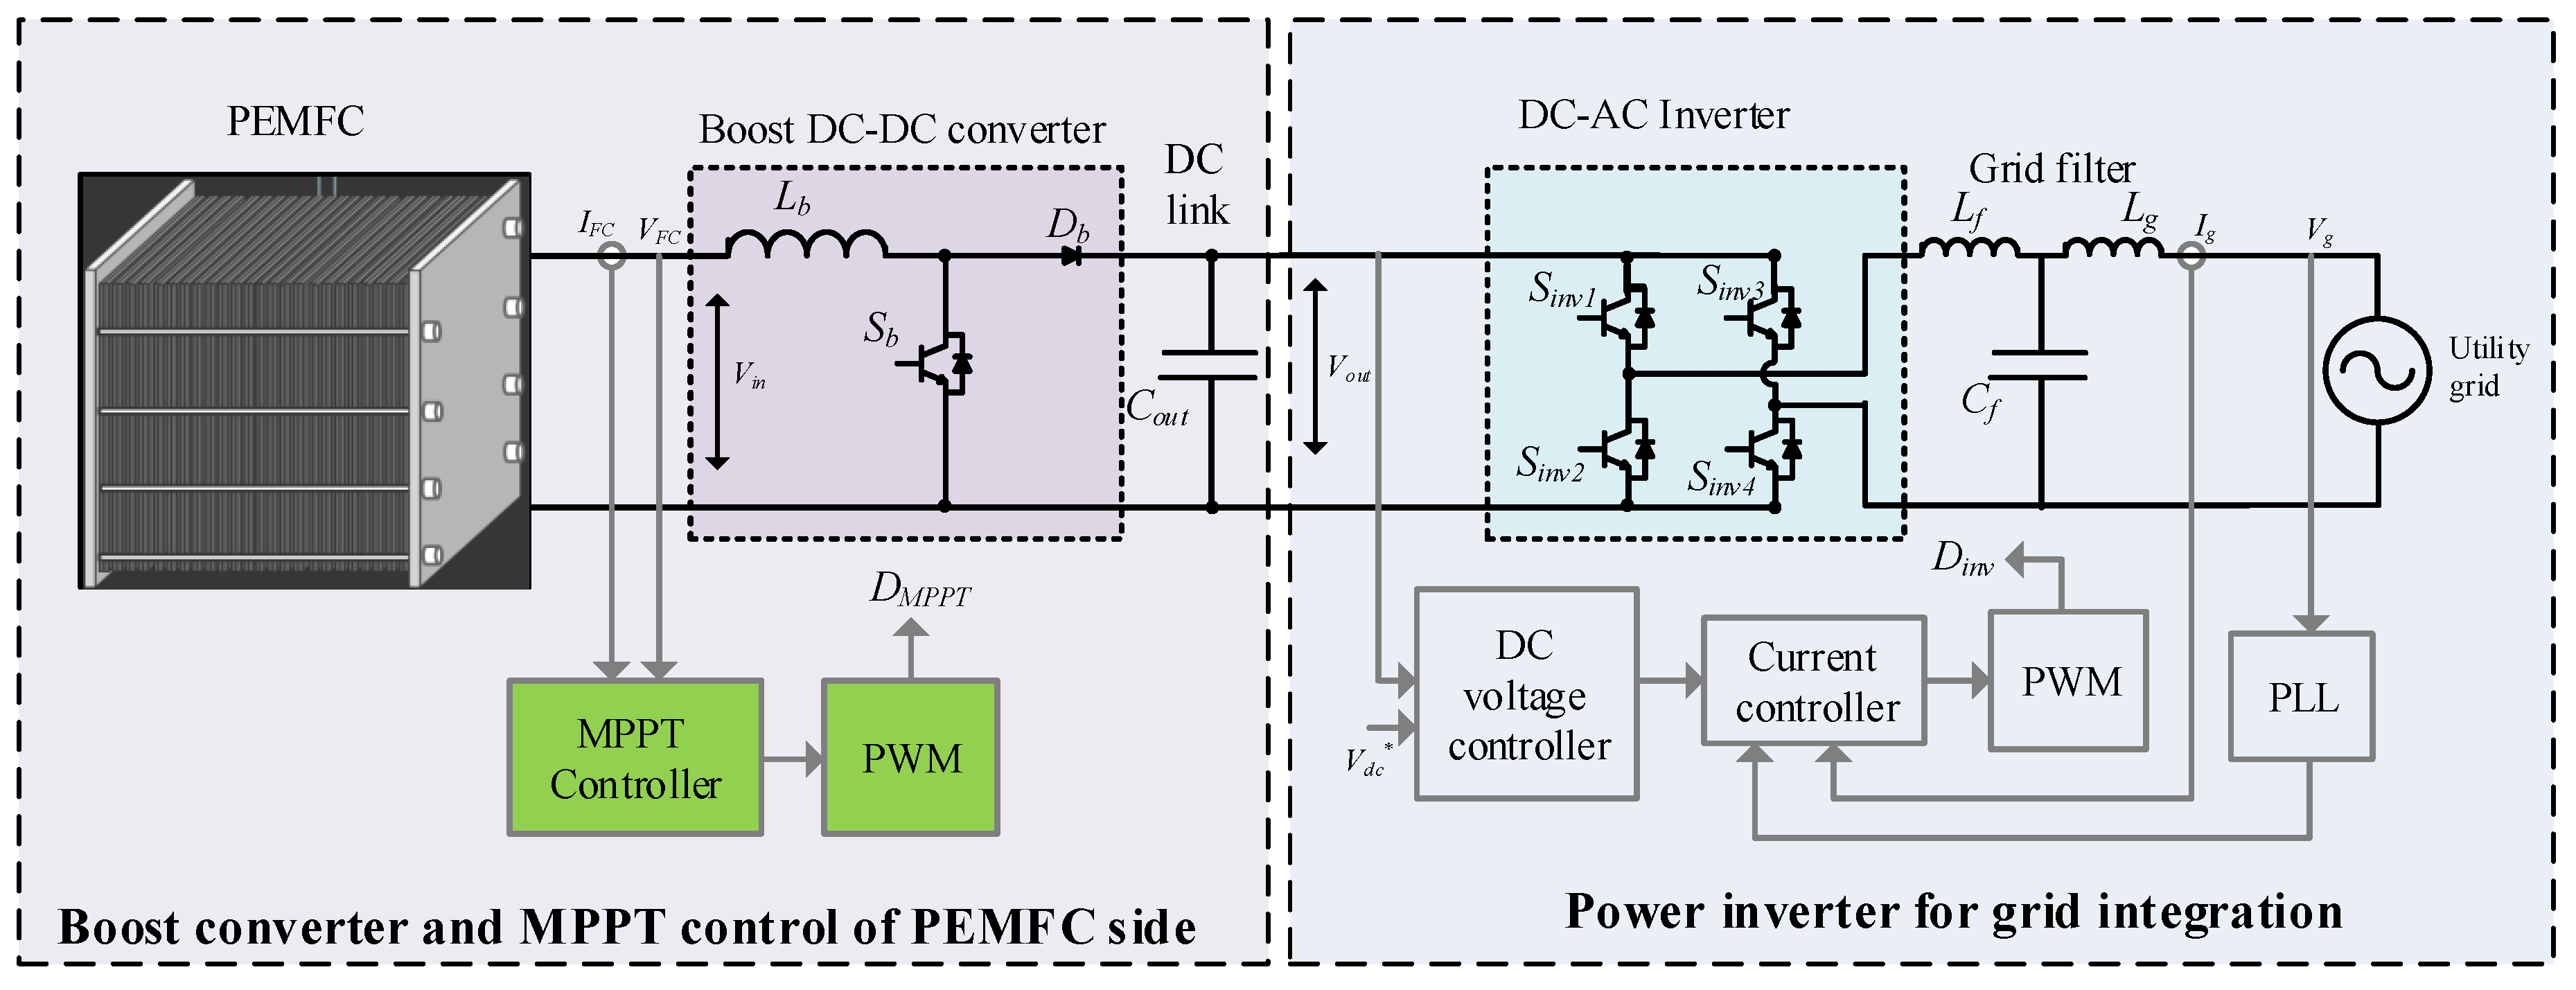
2. PEMFC in Green Building

2.1. Overview of General Structure

Recently, the concept of green building has become more popular with government plans to accelerate the energy transition to RESs. Figure 1 shows a general structure of green buildings with its main components. It includes green RESs to supply the connected loads based on their generated power and demanded loads. It also includes energy storage systems (ESSs). However, RESs suffer from their variable output power with ambient conditions. Therefore, energy storage devices and energy reserve supplies have become essential components for preserving continuous power supply for the demanded loads. Among the utilized components, PEMFCs represent an important part of the global concerns of green hydrogen production. The main benefits of PEMFC are their fast response, fast start-up, lightweight, low operating temperature, and high power density. Therefore, PEMFCs can be proper solutions for vehicular and residential applications.

2.2. PEMFC Power Conversion System

The MPP continuous tracking is essential for maximizing energy extraction of PEMFC at various expected operating points. There are two main factors behind the need for continuous MPPT with their variations, including the membrane’s water content and temperature. For actuating MPPT control, the use of a boost DC–DC power electronic converter is preferred in literature for performing both MPPT control and boosting the low PEMFC voltage. The circuit structure of the PEMFC power conversion system is shown in Figure 2 for green building integration. The phase-locked loop (PLL) is employed for the grid-side synchronization of the DC–AC inverter system. It uses the measured grid voltage to generate the reference current waveform for the grid-side current controller. Hence, the inverter synchronization with the grid can be guaranteed. The boost converter possesses continuous (CCM) and discontinuous (DCM) conduction operating modes based on the desired design. Due to the high output PEMFC power, the CCM is selected in this paper for the boost converter design. The CCM is advantageous at preserving continuous PEMFC output current and preserving high efficiency at high output current. Additionally, the boosting factor of PEMFC voltage depends on the applied duty cycle D of the boost converter [34]. The MPPT controller adjusts the value of D based on the operating point of the PEMFC system. The boost output voltage V o u t is related with the PEMFC input to the boost V F C as follows:
V o u t = V F C 1 1 D

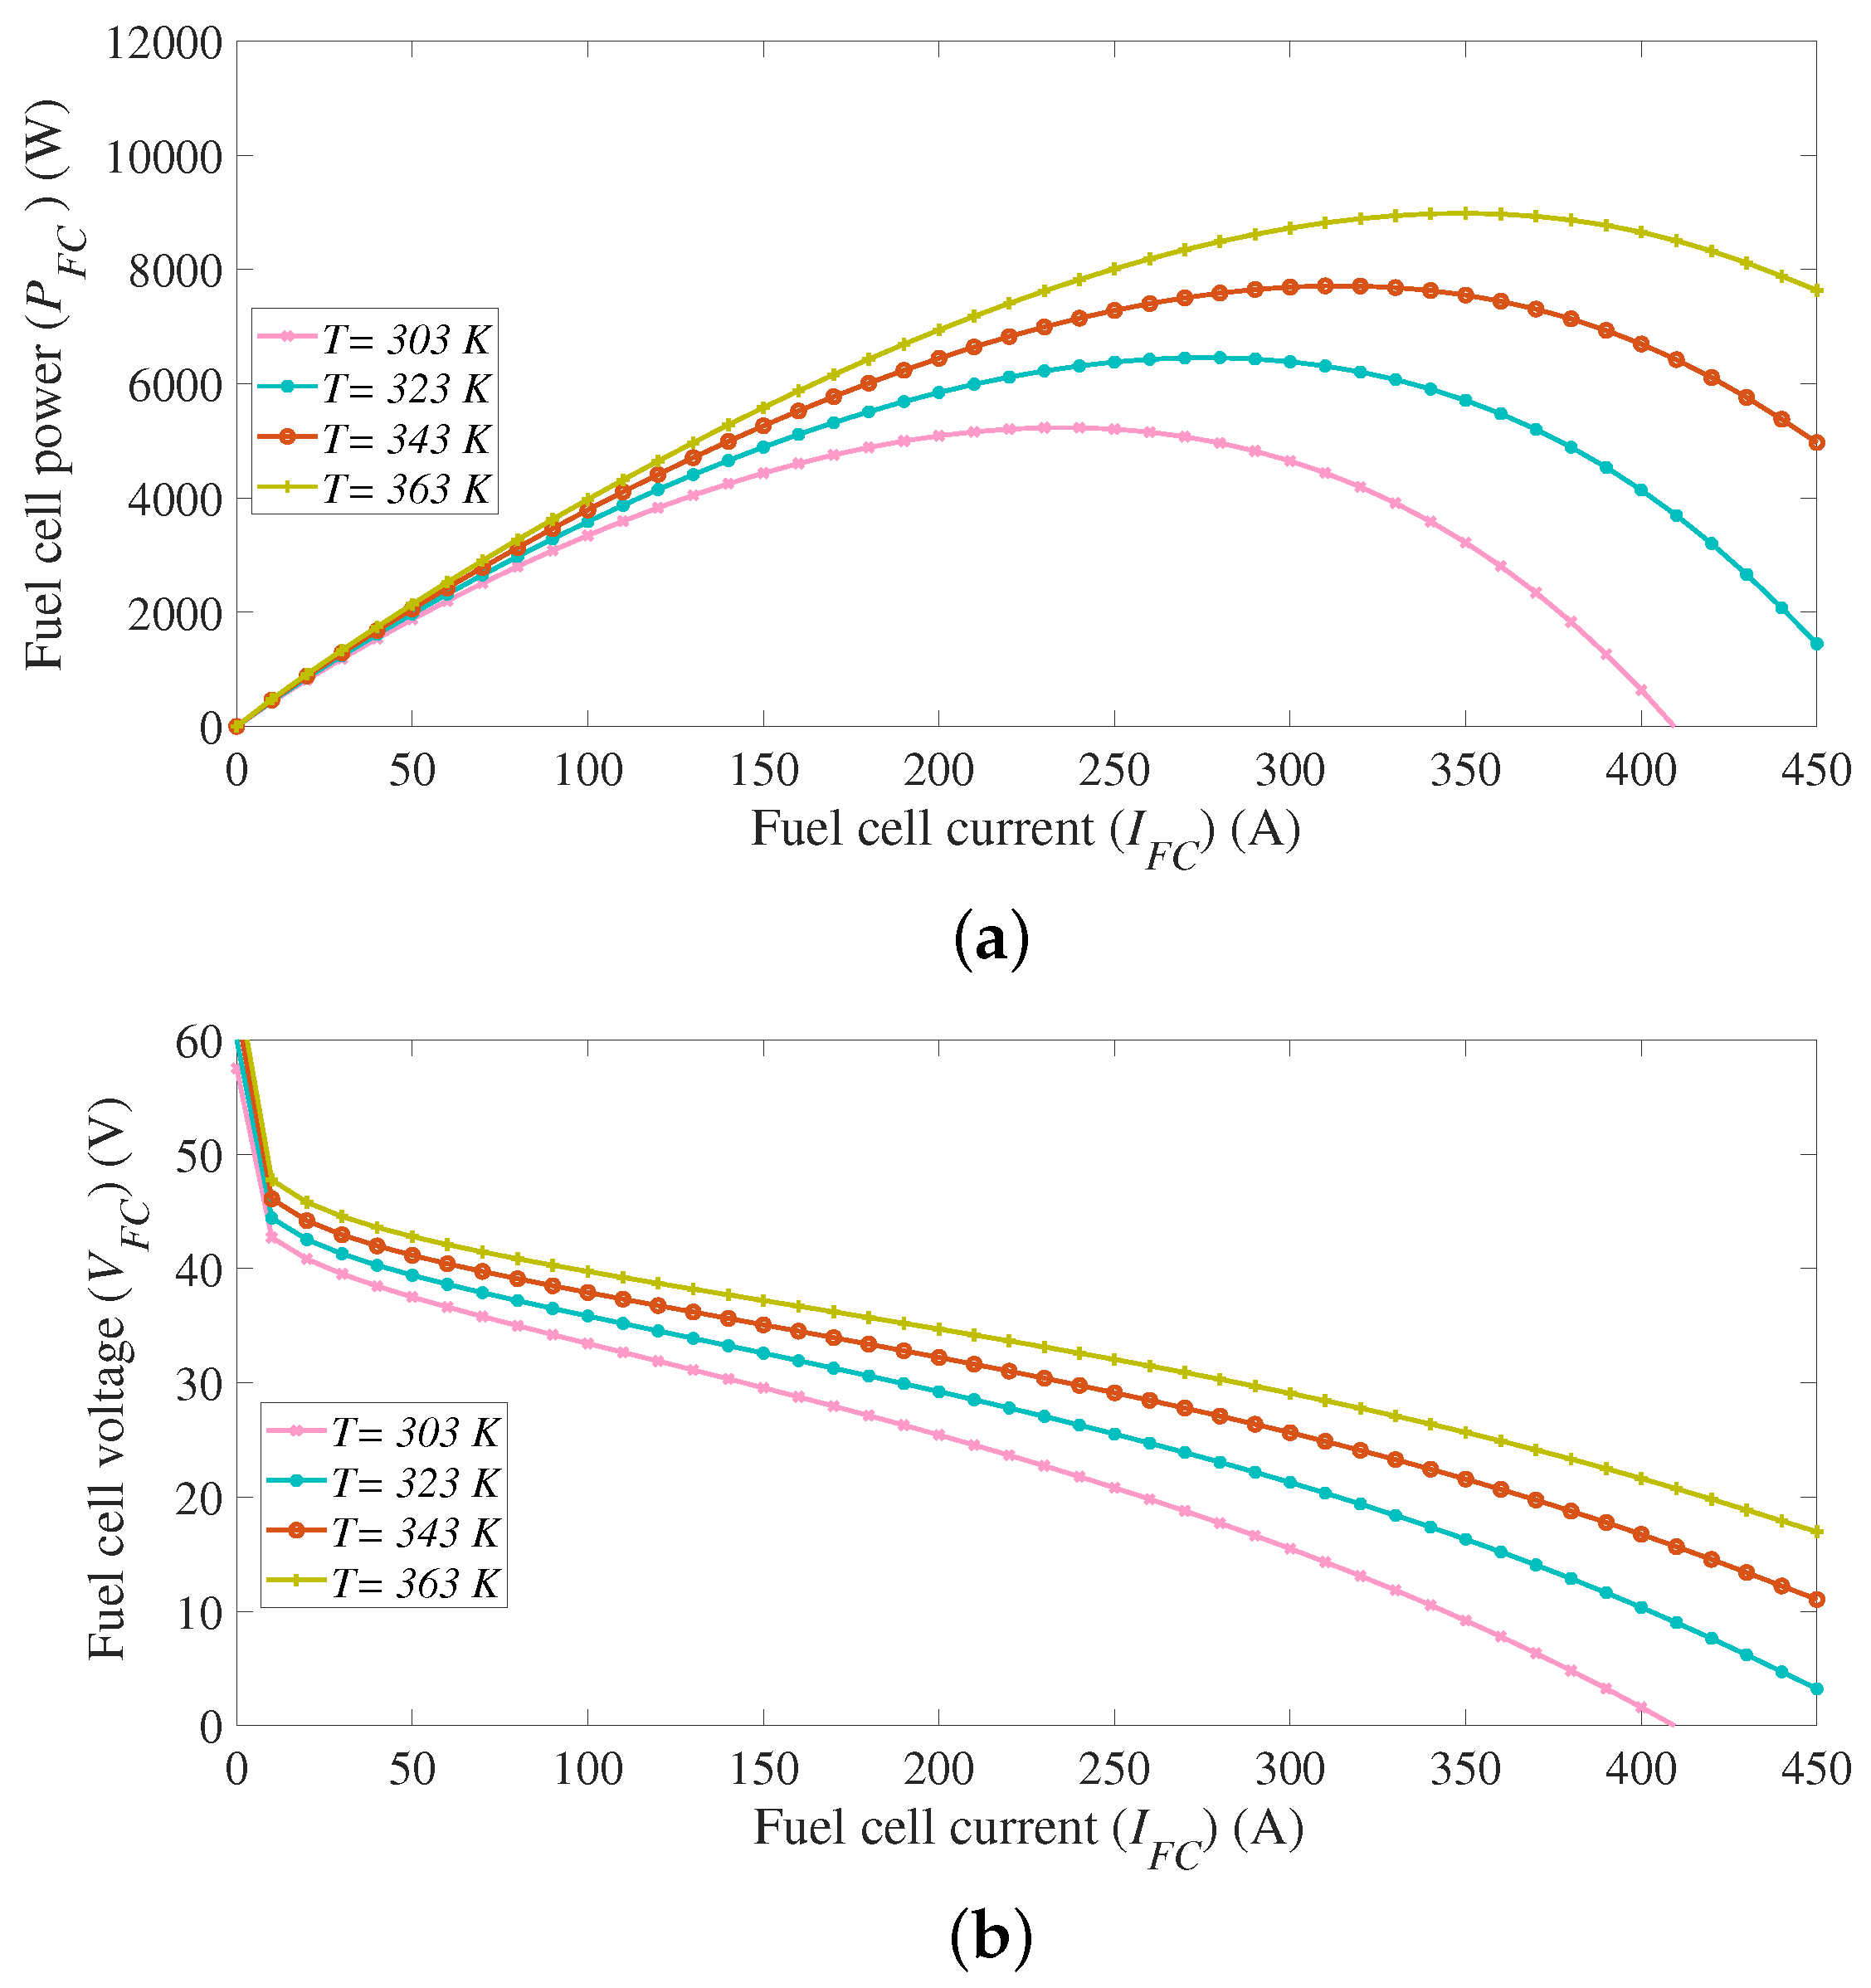
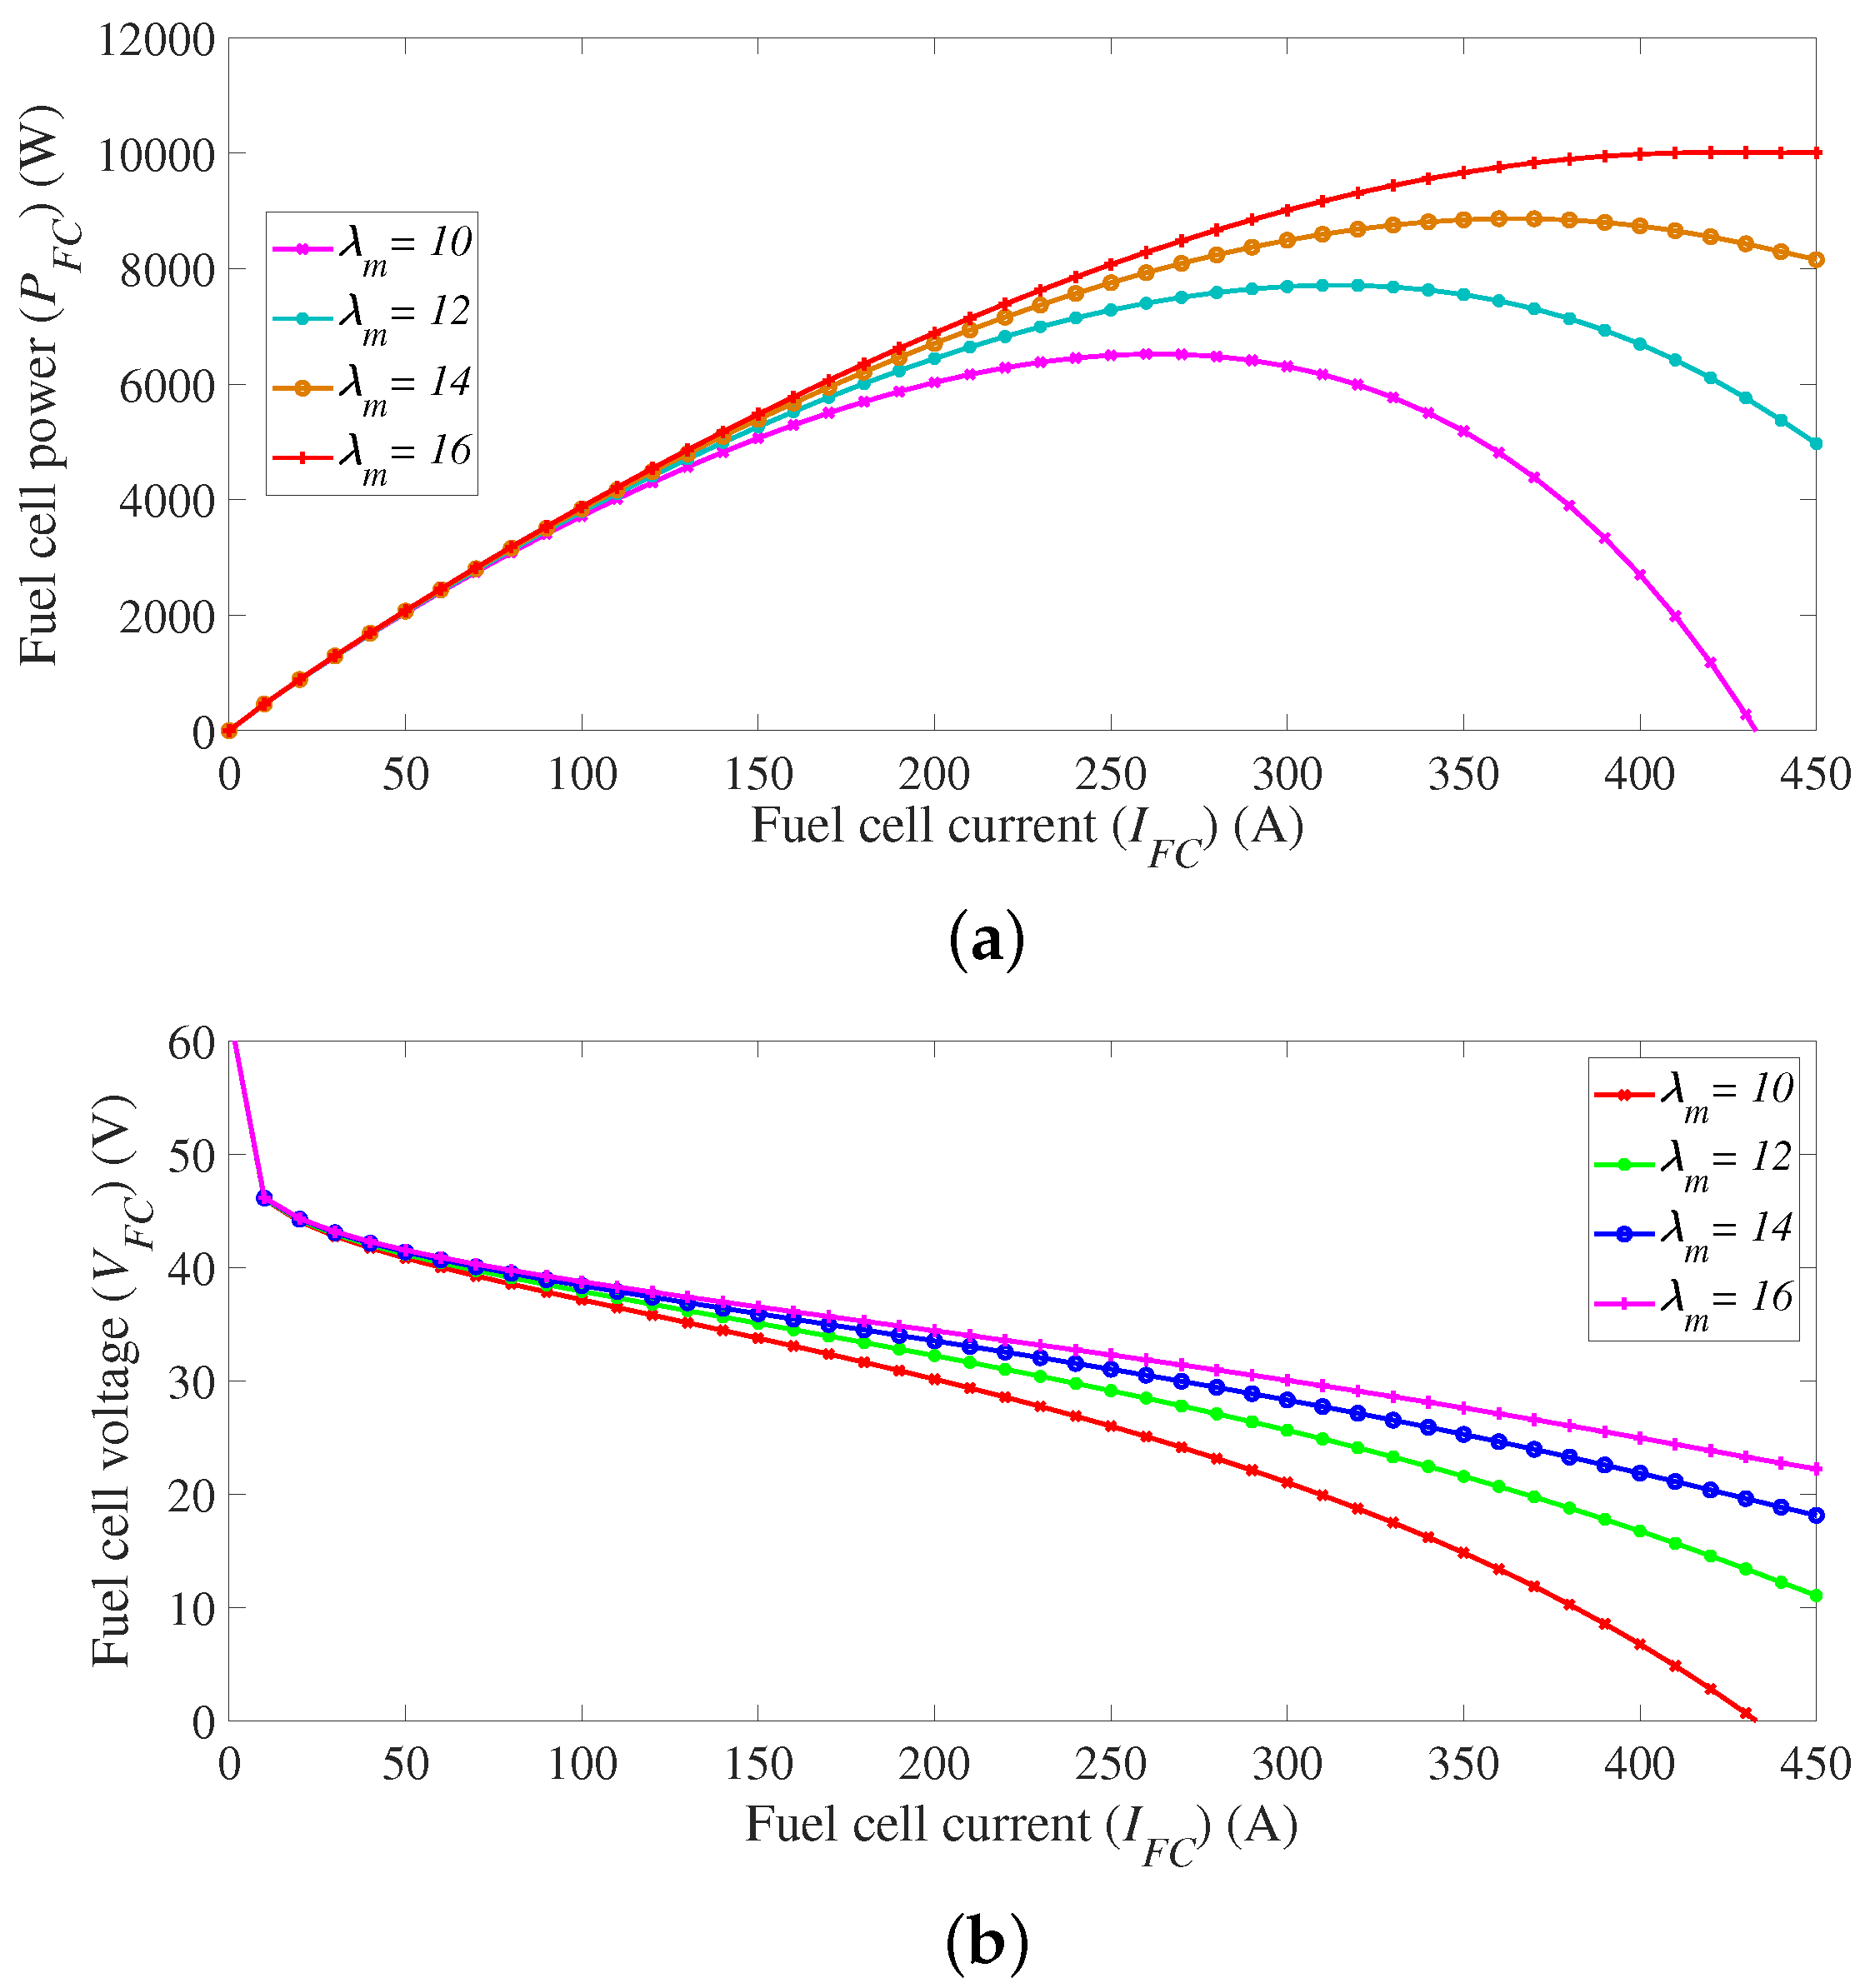
3. Mathematical Representations of PEMFC Model

The PEMFC is composed of an anode, a cathode, and proton exchange membranes (PEMs). Usually, PEMs are made of the Nafion, which possesses the ability to effectively transfer protons [9]. A PEMFC involves three parts: the anode, the cathode, and the proton exchange membrane (PEM). The anode is located on one side of the PEM, whereas the cathode is located on the other side. Figure 3 shows the main structure of PEMFCs. The diffusion-based layer and the catalyst-based layer of the electrode achieve triple phase boundaries of the electrochemical reactions, including reactions for oxidation of the hydrogen and the reduction of oxygen [9]. In particular, the overall representation of PEMFC operation mechanisms can be expressed at the anode, and cathode sides, respectively as [15]:
H 2 2 H + + 2 e , at the anode side
2 H + + 2 e + 1 2 O 2 H 2 O , at the cathode side
The total chemical reactions are expressed as:
H 2 + 1 2 O 2 H 2 O , at the cathode side
The employed PEMFC mathematical representations are programmed using Matlab Simulink 2021a considering the factors affecting PEMFC output, such as the Nernst voltage, activation term, concentration term, and ohmic losses term as follows:

3.1. Representation of Gas Transport Dynamics

The flow of gas through the PEMFC valve is dependent on partial pressures of hydrogen and oxygen as follows [22,27]:
q H 2 P H 2 = k a n M H 2 = K H 2
q O 2 P O 2 = k a n M O 2 = K O 2
where q H 2 , and q O 2 stand for hydrogen’s and oxygen’s molar flows, respectively, whereas, K H 2 , and K O 2 are their molar constant, respectively (in (kmol(atm s) 1 )). Additionally, P H 2 , and P O 2 stand for hydrogen’s and oxygen’s partial pressures (in atm), k a n is valve constant at the anode, and M O 2 and M H 2 denote to oxygen’s and hydrogen’s molar mass, respectively. The partial pressure’s derivative is calculated as [22]:
d P H 2 d t = R T V a n ( q H 2 i n q H 2 o u t q H 2 r )
where, R stands for universal gas’s constant, T stands for the temperature in degrees Kelvin, and V a n stands for anode’s volume. Further, q H 2 i n and q H 2 o u t are hydrogen’s flow rates at the input, and output, respectively, and q H 2 r stands for reacted hydrogen’s flow rate, which is calculated as:
q H 2 r = N F C I F C 2 F = 2 k r I F C
where, N F C stands for number of the series connected PEMFCs, I F C is PEMFC output current, F stands for Faraday constant, and k r stands for modelling constant. The instantaneous hydrogen and oxygen partial pressures are obtained through solving (5), and (6) for hydrogen as:
P H 2 ( t ) = 1 k H 2 ( 2 k r I F C e ( t / τ H 2 ) + q H 2 i n 2 k r I F C )
In which, H 2 is calculated as:
τ H 2 = V a n k H 2 R T
In the same way, oxygen’s partial pressure can be derived as:
P O 2 ( t ) = 1 k O 2 ( 2 k r I F C e ( t / τ O 2 ) + q O 2 i n k r I F C )
In which, O 2 is calculated as:
τ O 2 = V a n k O 2 R T
It is shown that the current I F C is related to hydrogen’s partial pressure as in (9), whereas I F C is related to oxygen’s partial pressure as in (11).

3.2. Polarization Curve Representation

The characteristics of PEMFCs possess three principal terms, including power loss term, activation term V a c t , ohmic term V o h m , and concentration term V c o n . The PEMFC stack terminal voltage V F C is as follows:
V F C = N F C × V c e l l = N F C × ( E N e r n e s t V a c t V o h m V c o n )
where E N e r n e s t stands for PEMFC Nernest voltage, which is expressed as:
E N e r n e s t = 1.229 8.5 × 10 4 ( T 298.15 ) + 4.385 × 10 5 T ( ln P H 2 + 0.5 ln P O 2 )
Further, the activation loss term is expressed using the model from [27] as:
V a c t = [ ξ 1 + ξ 2 T + ξ 3 T ln ( C O 2 ) + ξ 4 T ln ( I F C ) ]
where, ξ 1 , ξ 2 , ξ 3 , ξ 4 stand for parametric coefficients, and C O 2 stands for the concentration level of the dissolved oxygen in gas/liquid interfaces. It is represented as:
C O 2 = P O 2 ( 5.08 × 10 6 ) × exp ( 498 / T )
Moreover, ohmic loss term V o h m is produced due to the membrane’s resistance R m . And it is calculated as:
V o h m = I F C R m
In which the calculation of R m is made as:
R m = r m l A
where, r m stands for membrane’s resistivity to proton’s conductivity, l stands for membrane’s thickness, and A represents active area of PEMFC. The membrane’s resistivity r m is highly dependent on the membrane’s temperature and humidity. It is calculated as [22]:
r m = 181.8 [ 1 + 0.03 ( I F C A ) + 0.0062 ( T 303 ) ( I F C A ) 2.5 ) ] [ λ m 0.634 3 ( I F C A ) exp ( 4.18 T 303 T ) ]
where, λ m stands for membrane’s water content. Additionally, concentration loss term V c o n is produced through the concentration gradient consumption of reactants. It can be expressed as:
V c o n = R T n F ln ( 1 I F C I m a x A )
where, n stands for participated electrons number during reactions, and I m a x stands for maximum current value. The total outputted power generation from PEMFC FC stack P F C is as follows:
P F C = V F C I F C

3.3. PEMFC Model Characteristics

The implemented model of PEMFC using the Matlab program is tested to study various PEMFC characteristics with various expected operating points based on the model data in [27]. Figure 4 shows the P F C - I F C and V F C - I F C curves at different expected temperatures, and constant value of water content ( λ m = 12 ) . In addition, Figure 5 shows PEMFC curves variations with water content values at a constant temperature of T = 343 K. It is clear that each operating point possesses a unique point that is capable of outputting maximum power from the PEMFC. Thence, it is essential preserving PEMFC operation continuously at this point to maximize its energy output. This, in turn, creates an essential need for developing highly efficient MPPT control methods for PEMFCs, and that will be the main focus of this paper.

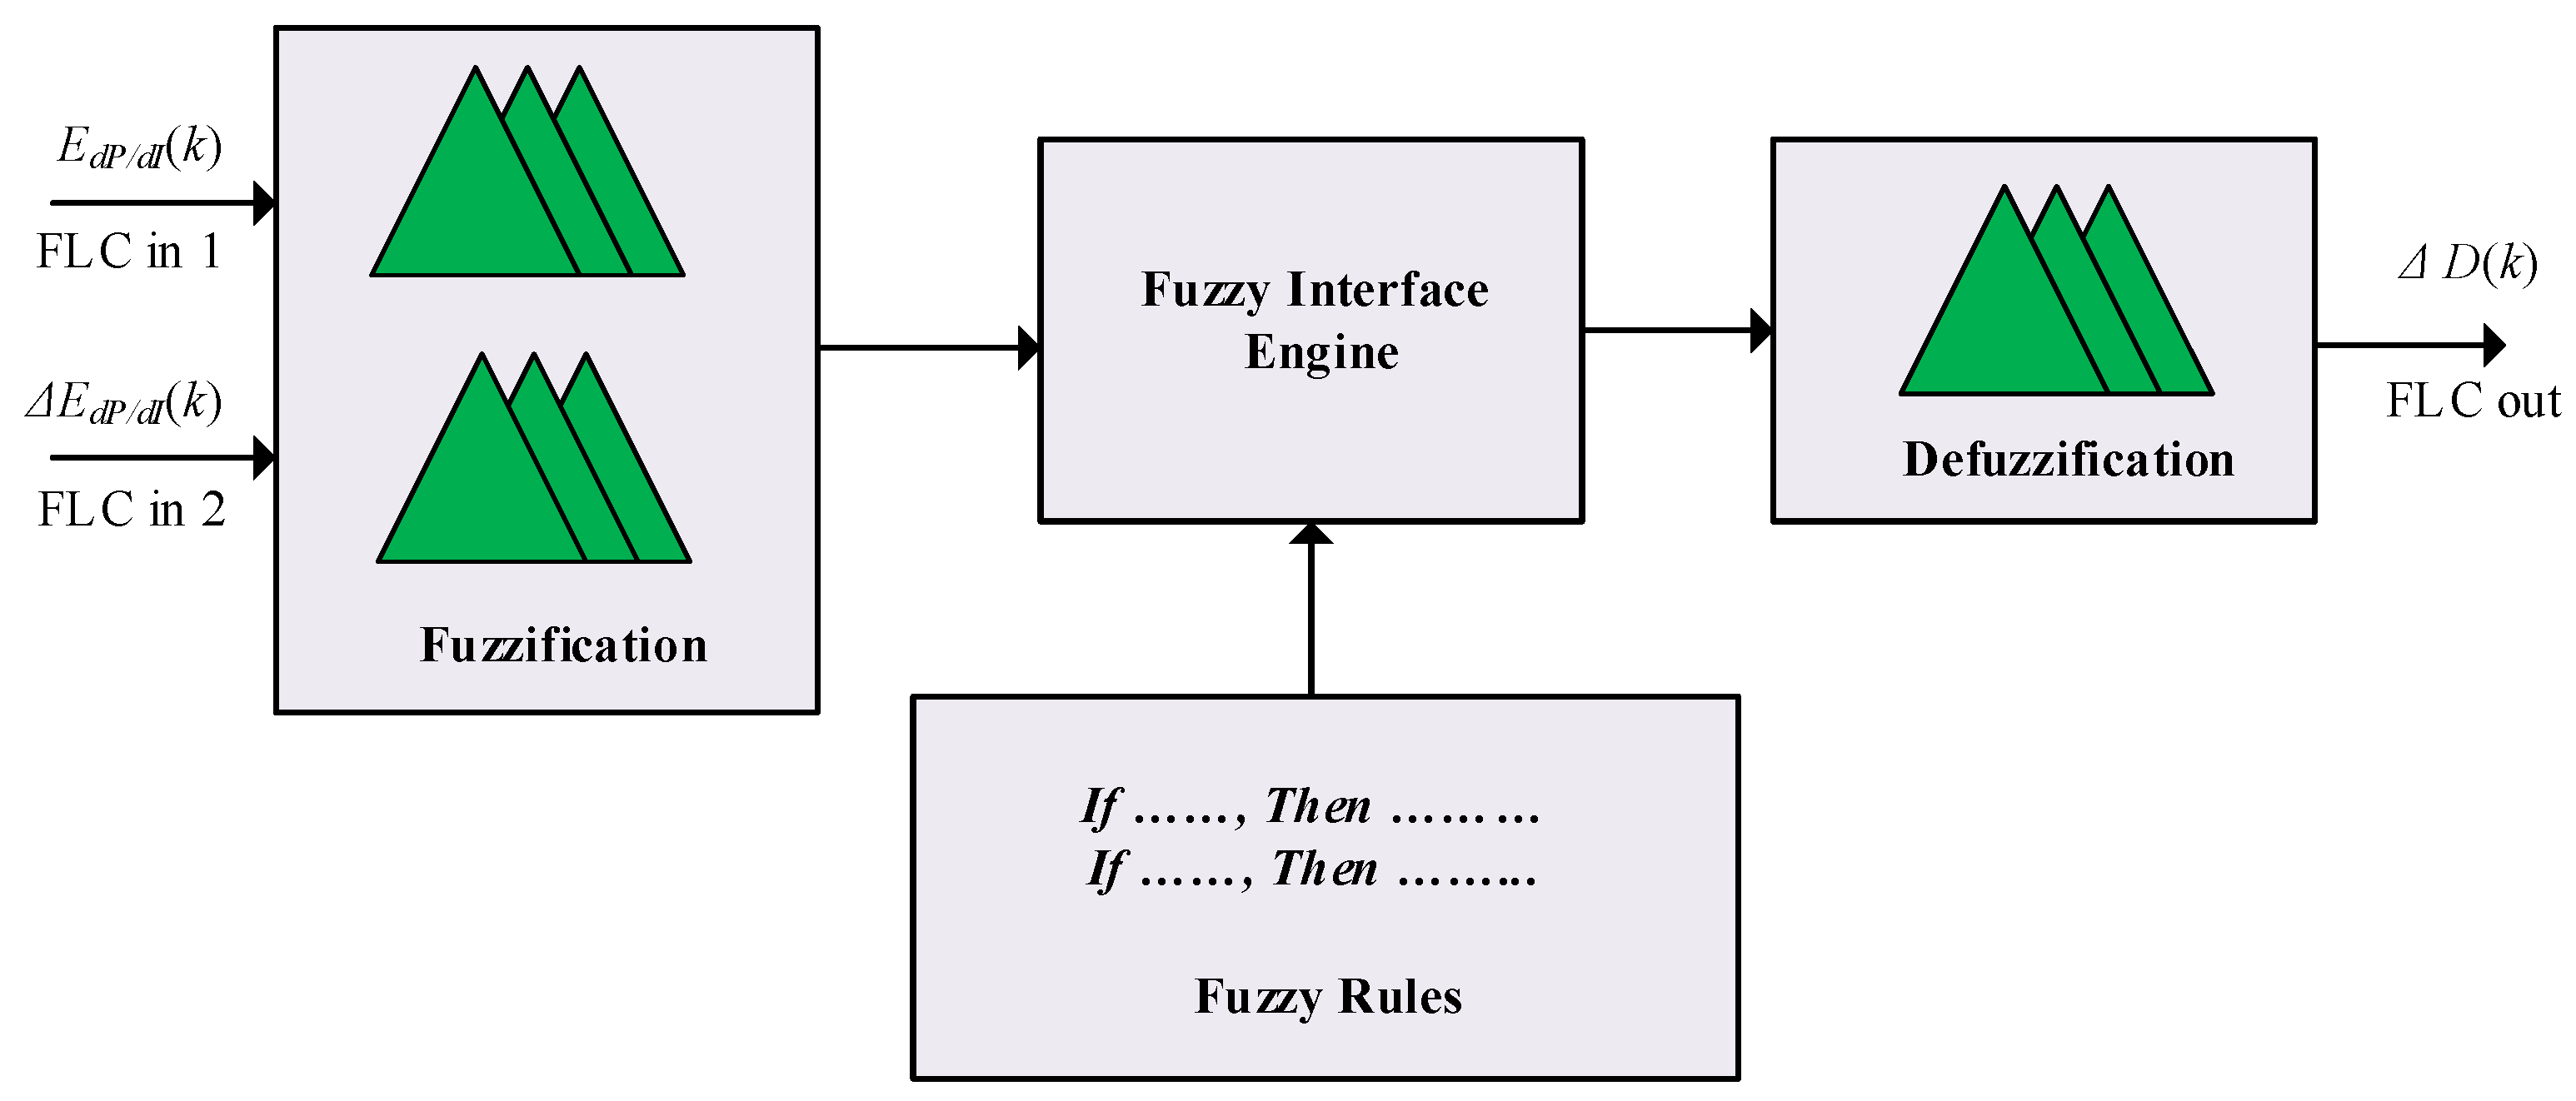
4. Conventional FLC MPPT

As surveyed in the introduction section, FLC-based MPPT controllers can enhance PEMFC performance, and output power quality [34]. There are three principal stages within FLC as follows:
1
Fuzzification stage: The crisp inputted variables are converted into linguistic labels based on the predefined membership functions (MFs) of input variables. The obtained linguistic labels are utilized in this first step to represent the fuzzy inputs for generating verbal decisions.
2
Fuzzy inference engine: The fuzzy-based interface engine uses fuzzy inputs through the if–then rule concept for generating fuzzy outputs.
3
Defuzzification: The conversion of obtained fuzzy outputs is made into crisp values [47]. In MPPT FLC applications, the two input variables are employed for generating one output variable to operate the boost power converter system at the desired MPPT operating point.
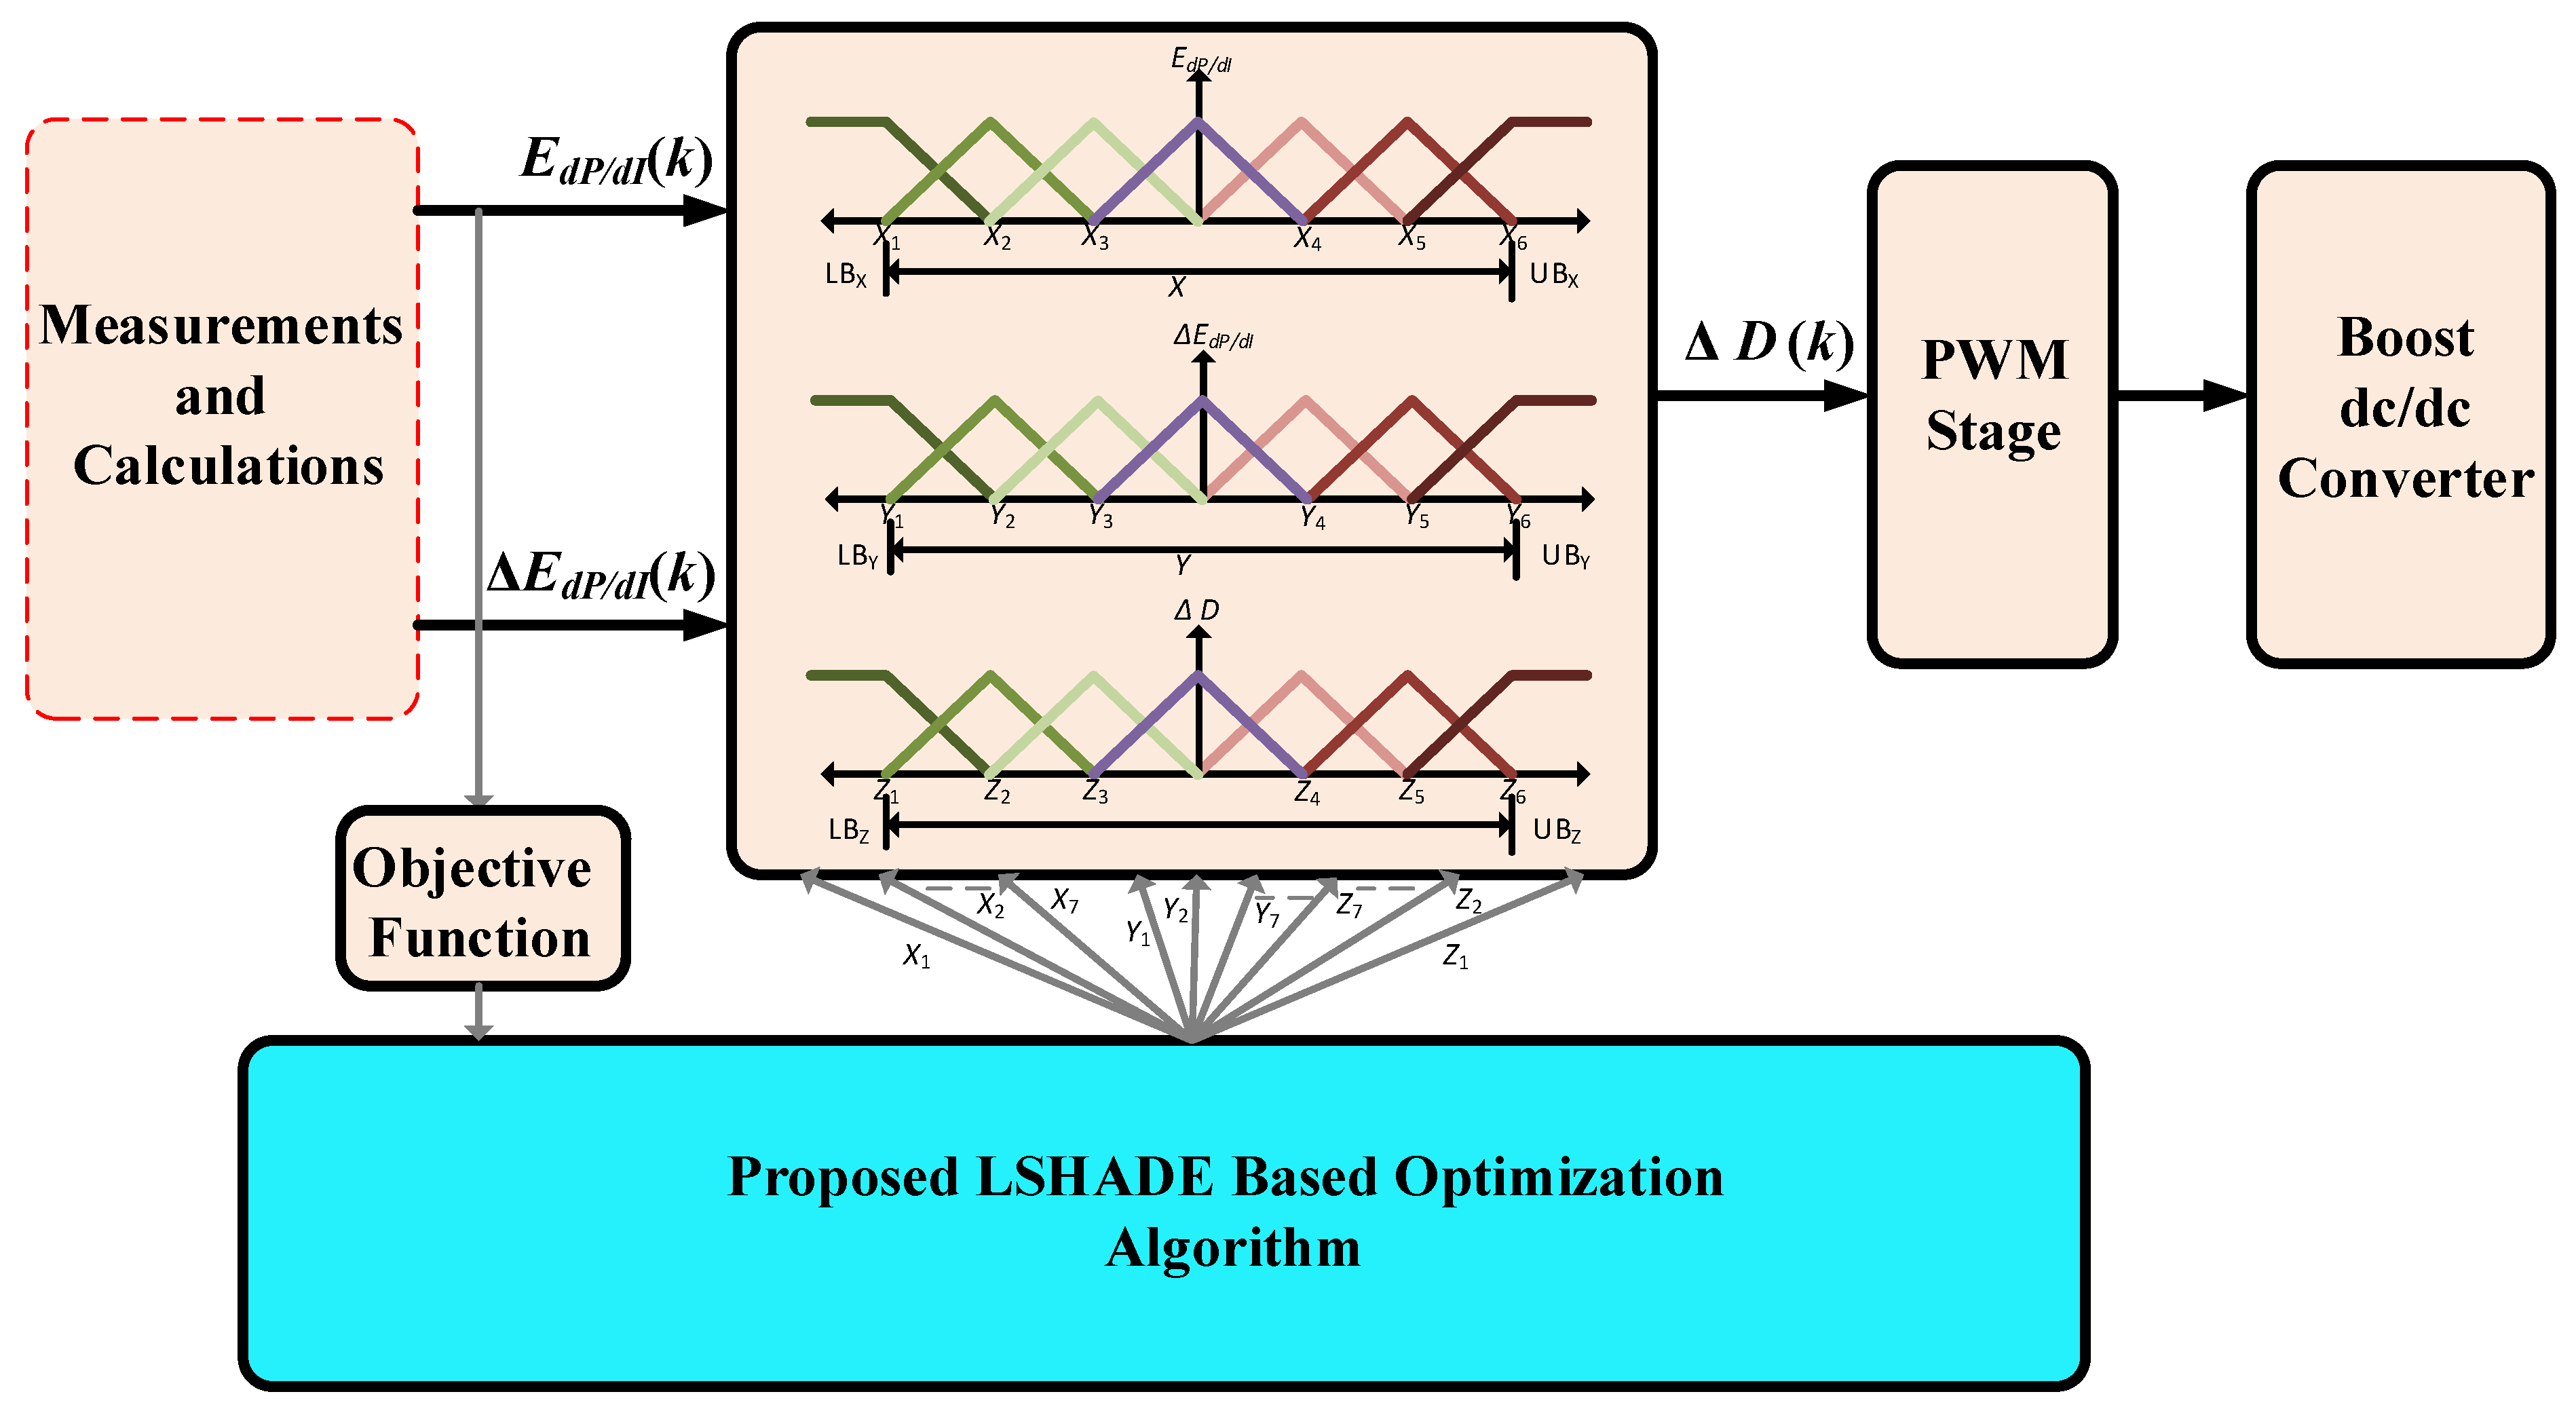
The FLC stages for classical MPPT applications are shown in Figure 6. The input side variables are defined as:
E ( k ) = d P F C d V F C = P F C ( k ) P F C ( k 1 ) V F C ( k ) V F C ( k 1 )
Δ E ( k ) = E ( k ) E ( k 1 )
where E ( k ) stands for the error signal represented by slope changes of P F C - V F C curves at the current sampling instant ( k ) , Δ E ( k ) stands for change in error between ( k ) th and ( k + 1 ) th samples, P F C ( k ) and V F C ( k ) stand for sampled PEMFC power and terminal voltage, respectively, and P F C ( k 1 ) and V F C ( k 1 ) are their ( k 1 ) sampled signals. Thus, the outputted signal of FLC is the value of increment/decrements in the boost converter’s duty cycle Δ D ( k ) . The duty cycle of each sample step is generated using the output of FLC Δ D ( k ) and the stored duty cycle from ( k 1 ) sampling instant. It can be represented as:
D ( k ) = Δ D ( k ) + D ( k 1 )
Detailed design and implementation theory about FLC-based MPPT control can be found in [35,41,48].

5. Proposed dP / dI Based FLC MPPT Method

5.1. Operating Principle

As observed in Figure 4 and Figure 5, each operating point of PEMFC possesses a unique point with achieving maximum power extraction of PEMFC. With the variations in the operating point, continuous tracking of the unique point of the current operating point through adjusting the duty cycle of the boost power converter is actuating the MPPT control strategy. Moreover, the figures of P F C - I F C show their nonlinear behavior with operating point variations. In classical FLC-based MPPT control, the slope of d P / d V is employed for representing the error input variable of FLC. However, the variations of d P / d V are sensitive to the small variations of the terminal voltage of PEMFC with different operating conditions.
The proposed modified FLC MPPT method is based on the fact that MPPT can be achieved when the slope of d P / d I equals zero instead of d P / d V in the classical FLC MPPT method. This, in turn, improves the tracking performance of MPPT due to the use of d I variations instead of d V variations. The d I variations are high and hence can provide a better determination of MPPT with operating points variations compared to very low variations of d V with operating points. Therefore, the oscillatory performance of classical methods around maximum power point is eliminated using the proposed modified FLC MPPT method for PEMFCs.
Thenceforth, feedback based on d P / d I is employed in the proposed MPPT method to implement the inputs of the FLC method. At the MPPT operating point, d P / d I = 0 , it is thence considered a uniform setting point independent from operating conditions. The proposed MPPT controller would generate duty cycle control of the boost DC–DC converter based on tracking the d P / d I = 0 with variations in membrane water content and temperature. Each deviation for a maximum power point is reflected on the value of the d P / d I value, which represents the main input for the proposed FLC method. It is responsible for generating proper control signals for the boost converter to guarantee stable MPPT control. The proposed FLC MPPT method continues the variation of the duty cycle until the best output power is reached, and hence the slope d P / d I = 0 .

5.2. Controller Structure

As stated above, the d P / d I = 0 is used as criteria for MPPT in the proposed modified FLC MPPT method for PEMFCs. The stages of the proposed FLC are the same as the classical FLC structure shown in Figure 6. The two inputs for the proposed FLC can be expressed as follows:
E d P / d I ( k ) = d P F C d I F C = P F C ( k ) P F C ( k 1 ) I F C ( k ) I F C ( k 1 )
Δ E d P / d I ( k ) = E d P / d I ( k ) E d P / d I ( k 1 )
Figure 7 shows the main components of the proposed FLC MPPT structure with input and output variables. The shapes of input and output variables of FLC-based MPPT of PEMFCs are shown in Figure 8 without an optimization process. Afterward, the design of fuzzy rules is made, which are responsible for proper operation management and adequate decisions by the proposed FLC MPPT method. Each input/output possesses seven different MFs, wherein three levels of them are positive ( P S L 3 , P S L 2 , and P S L 1 ), one level is zero ( Z R L 0 ), and three levels are negative ( N G L 3 , N G L 2 , and N G L 1 ). The designed rules of the proposed method are shown in Table 1.

5.3. FLC MPPT Design Optimization

The tracking performance of FLC MPPT schemes for a PEMFC is highly dependent on the designated and selected upper/lower boundaries of input/output MFs. Moreover, proper tuning for input/output boundaries and inherent points of each variable is also essential. Therefore, design optimization and parameter determination are proposed in this paper using the LSHADE optimizer algorithm. The proposed FLC design optimization approach provides optimized shape and scaling for each input/output MF in FLC.
The optimization procedure of FLC provides higher freedom in the MFdesign by optimally determining the shape and scaling factor for each input/output MFs. The freedom in design procedures in the proposed FLC method is shown in Figure 9a for E d P / d I ( k ) . Assuming a symmetrical design of FLC MFs, there will be a total of six tunable locations in each MF ( X 1 X 6 ). The optimum values of MF points provide more flexibility and power to optimize the designed fitness function with the employment of an LSHADE optimizer. Two different values of MF points are illustrated in Figure 9b,c. The figures show the different possible optimized designs of FLC MPPT methods. The points are optimally determined using the LSHADE optimizer in the proposed method.
The main structure of the proposed LSHADE-based FLC design optimization approach is shown in Figure 10. The fitness function of the proposed design optimization process is determined by the proper reaching of MPPT with high speed for the tracking process. Thence, the shape and scaling factors are optimally tuned for the input/output MFs to achieve the above-mentioned objectives. In the proposed method, the fitness function is calculated using the integral squared-error (ISE) criteria [49]. It is expressed as:
I S E = t = o T s i m ( Δ E d P / d I ( k ) ) 2
where T s i m stands for simulation stop time for the evaluation process of the fitness function. During the optimization process, the principal goal for the LSHADE optimizer is the simultaneous determination of optimum points combinations for the input/output MFs to minimize the fitness function (error signal using E d P / d I ) during the simulation time. For the proposed method, the widely used min-max FLC scheme is applied, whereas the defuzzification stage is implemented by using the centroid of the area-based method.

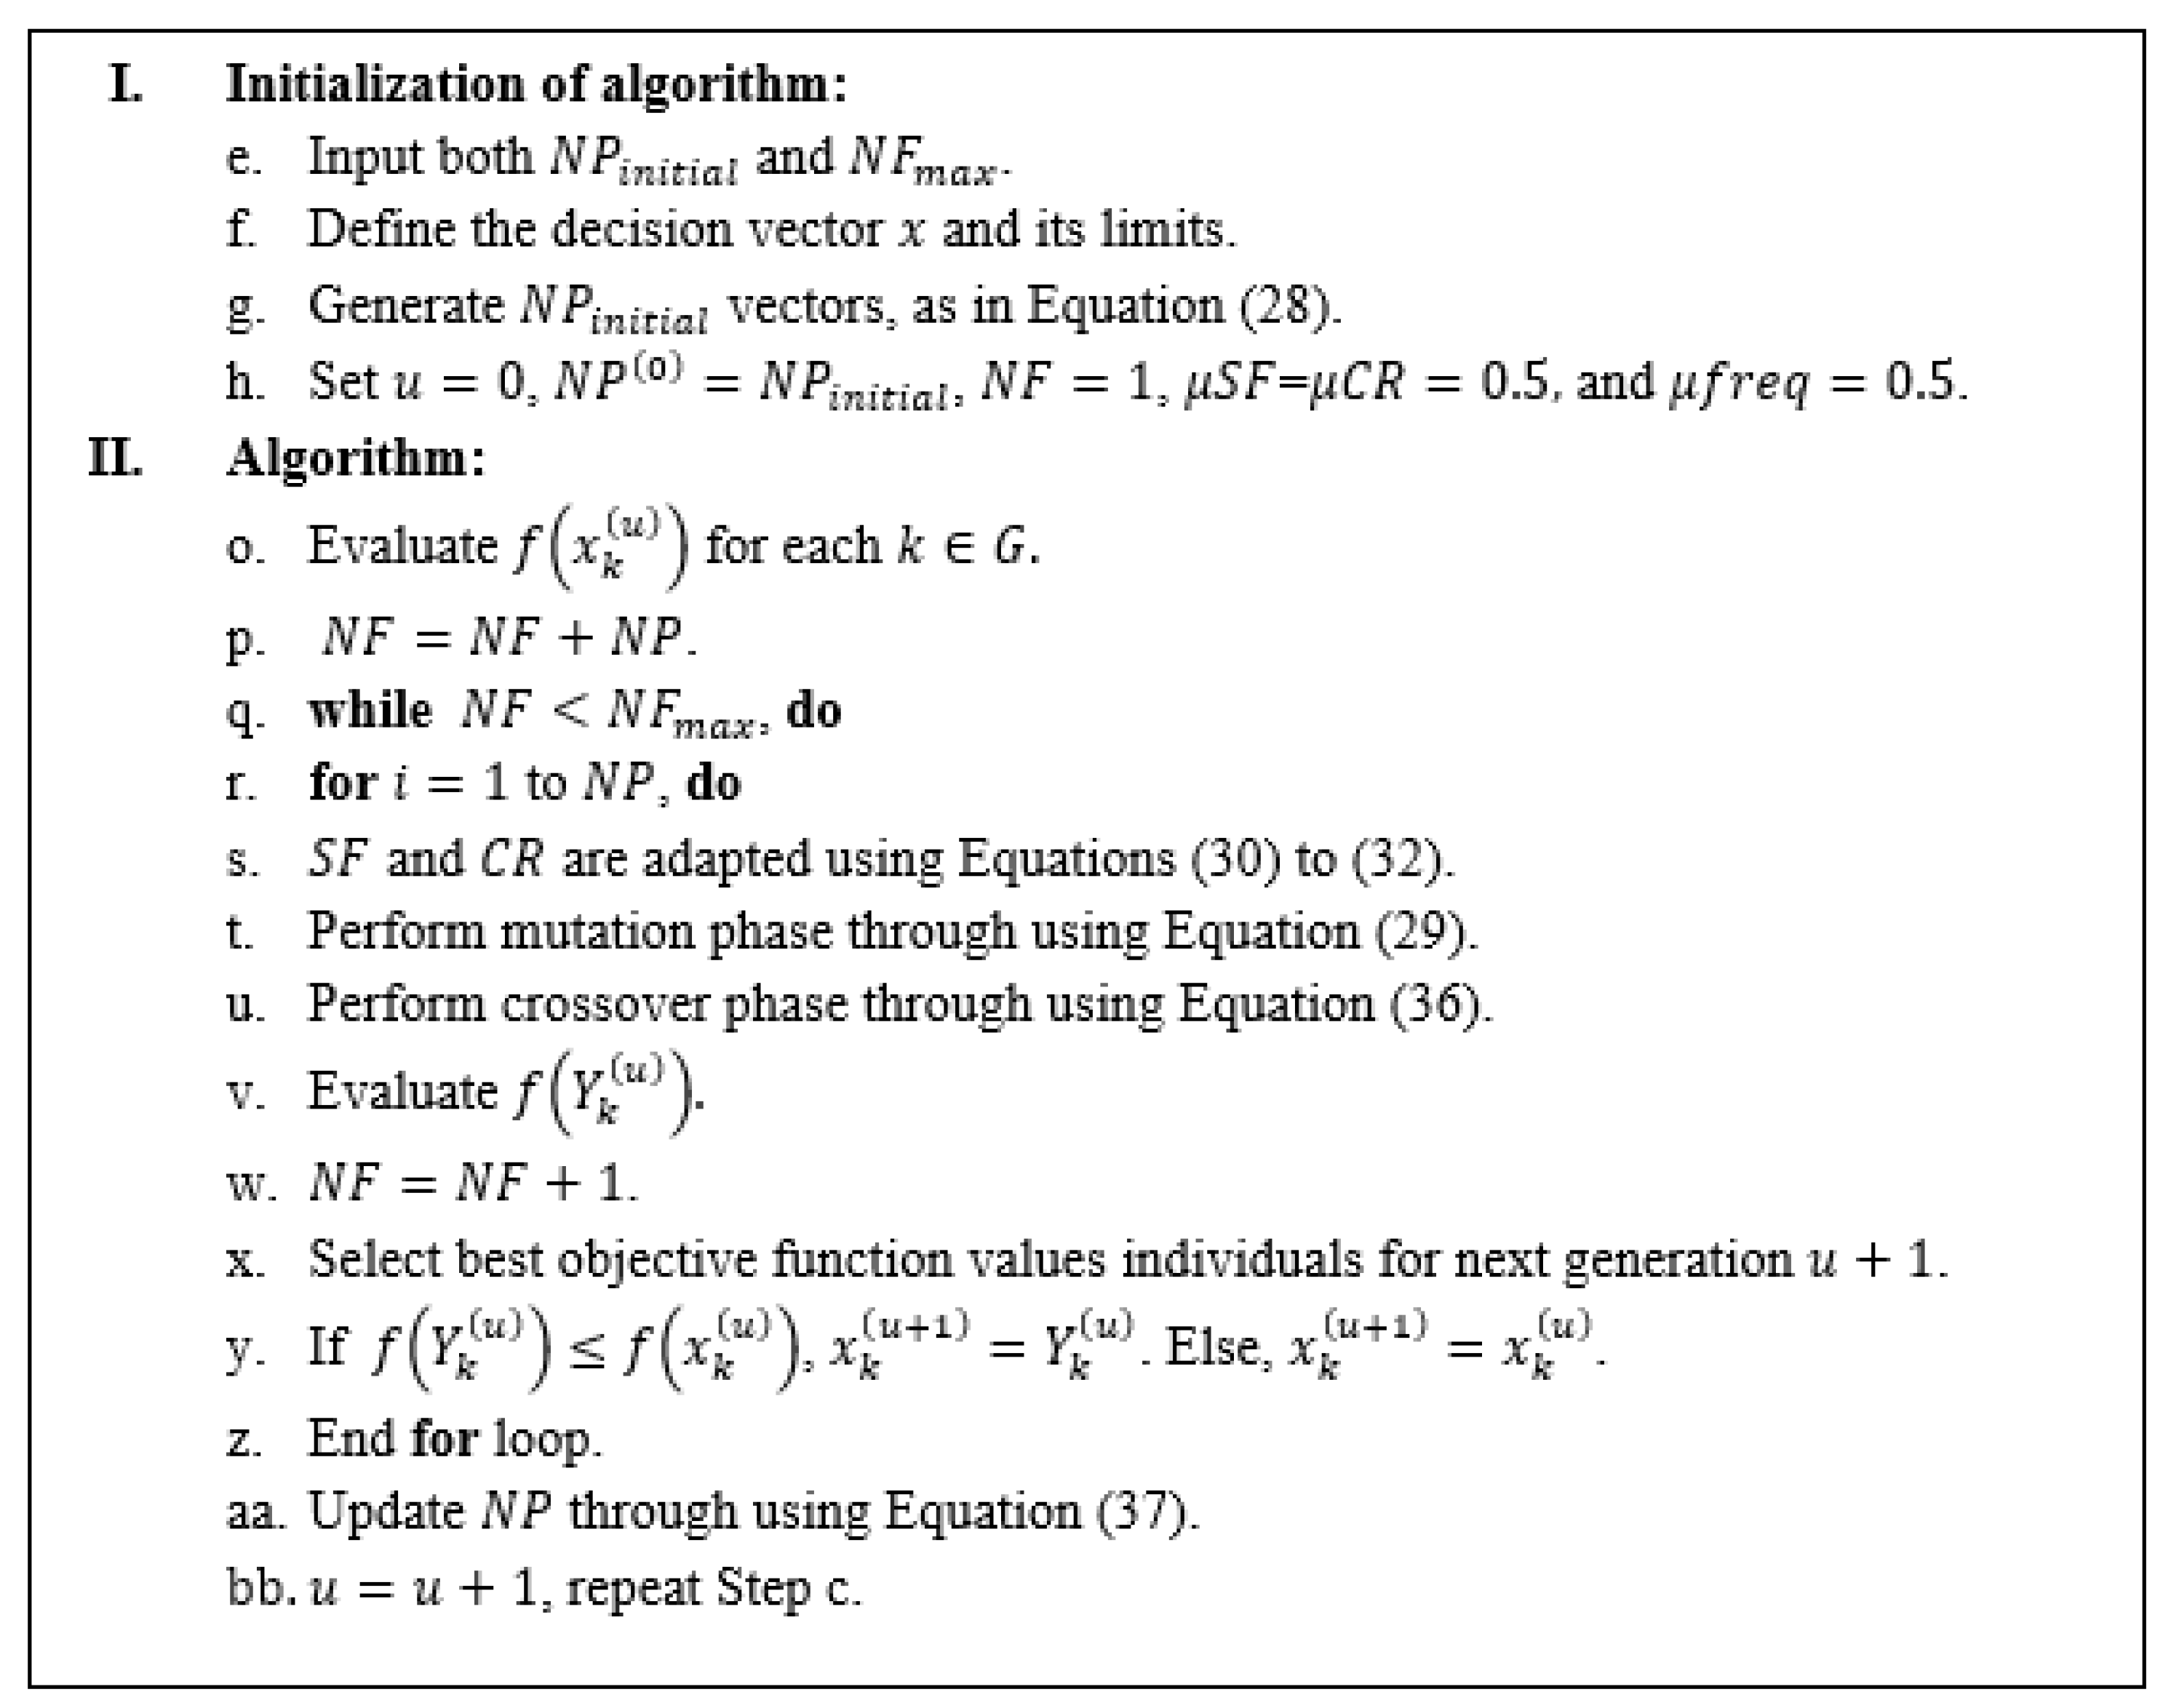
5.4. LSHADE-Based Design Optimization

Differential evaluation-based optimizers (DE) have been presented by Storn et al. [50] for the purpose of solving various optimization problems. They rely on main parameters, including scaling factors and crossover rates. The DE-based optimization algorithms are capable of adjusting their scaling factors and crossover rates based on the parameters’ chronological data [51]. Awad et al. have suggested an LSHADE–EpSin optimizer algorithm based on ensembling two sinusoidal-based adaptation techniques [52]. The best solution is obtained by achieving a high speed of convergence. The LSHADE–EpSin optimizer algorithm is outlined as [53]:
Initialization Stage:
Each element h is initiated for each variable k through the adjustment of its values within the upper x k U , and lower x k L boundaries arbitrarily as:
x k h ( 0 ) = x h L + r a n d k h [ 0 , 1 ] × ( x h U x h L )
where, k = { 1 , 2 , 3 , , N P } , h = { 1 , 2 , 3 , , N d } , and N d stands for number of variables.
Mutation Stage:
For each of generations u, mutation generates donor vector v k ( u ) , based on the known ‘current-to-pbest/1’ mutation method expressed as:
v k u = x ( u ) + S F k ( u ) × ( x p b e s t ( u ) x x ( u ) ) + S F k ( u ) × ( x t 1 k ( u ) x t 2 k ( u ) )
where, x p b e s t ( u ) stands for best individual within current generations u, and S F k ( u ) representing scaling factor.
Parameters Adaptation Stage:
This stage includes two different processes based on dividing the iterations ( u m a x ) into two parts. In the first part of ( u m a x ) , modification of S F is made by applying two ensembled sinusoidal methodologies, including adaptive and non-adaptive sinusoidal schemes. One of the two sinusoidal methodologies is arbitrarily selected when adjusting S F as:
S F k ( u ) = 0.5 × ( sin ( 2 π f r e q k ) × u + π ) × ( u u m a x ) + 1 ) , u u m a x 2
f r e q k = r a n d c ( μ f r e q r k , 0.1 )
where, f r e q has fixed value, whereas f r e q k has adaptive value. Their modifications are made through their corresponding previously-stored knowledge as:
S F k ( u ) = r a n d c ( μ S F r k , 0.1 ) , u > u m a x 2
C R k ( u ) = r a n d n ( μ C R r k , 0.1 ) , u > u m a x 2
where, μ S F r k and μ C R r k represent mean of successful values for S F and C R , respectively, and they are stored from previous generations in M.
As in the original LSHADE algorithm, if the generated values of S F and C R were successful at obtaining a vector that is better than x k ( u ) , the values could be stored within S S F and S C R , respectively, whereas q stands for the index controlling the position for the following best value. It is increased by one after better new values of S F , and C R are stored. Additionally, update of μ S F r k , and μ C R r k is made through the weighted-Lehmer mean ( m e a n L ) as:
μ S F r q ( u + 1 ) = m e a n L ( S S F )
μ C R r q ( u + 1 ) = m e a n L ( S C R )
Crossover Stage:
In this stage, the construction of vector Y k ( u ) is made by combining x k h ( u ) with v k h ( u ) elements according to crossover probability of the assignments. The probability of crossover assignments is controlled through C R k ( u ) , which is previously calculated. Elements in Y k ( u ) can be combined as:
Y k ( u ) = v k h ( u ) , h = h r a n d v k h ( u ) , r a n d k h [ 0 , 1 ] C R k ( u ) x k h ( u ) , Otherwise
where, h r a n d is randomly-selected from D.
Population Reductions Stage:
A linear strategy is selected for population size, and it is implemented within the LSHADE algorithm for properly selecting the best population size as:
N P ( u + 1 ) = r o u n d { ( N P m i n N P i n i t i a l N F m a x ) × N F + N P i n i t i a l }
where N P i n i t i a l stands for initial population size, N F , and N F m a x represent the current number of fitness function evaluations and maximum value, respectively. In the LSHADE algorithm, N P m i n is set at four due to the requirements of implemented mutation strategy. At the uth generation, if individuals N P ( u + 1 ) < N P ( u ) , N P ( u + 1 ) N P ( u ) with worst fitness function values were eliminated from populations. The set parameters of implemented LSHADE algorithm were made according to the original LSHADE algorithm’s parameters from [53]. The diagram of the whole design optimization process is shown in Figure 11, and the associated pseudo-code of the LSHADE optimizer is shown in Figure 12.

6. Results, Discussions, and Performance Comparisons

The Matlab program is used for simulating and implementing the proposed FLC MPPT control and optimization process. The FLC is programmed using C-code to facilitate the optimization process. Table 2 shows the main parameters and specifications of the utilized PEMFC model in the selected system case study based on the model data in [27]. In the tested PEMFC system, PEMFC represents the input-side source, boost power converter operating at 20 kHz of PWM switching frequency. The boost DC–DC inductor is 0.5 mH, and output-side capacitor is 500 μ F in the designed system. The tested scenarios are as follows:
  • Scenario 1: Step decrease in membrane water content λ m and constant temperature T.
  • Scenario 2: Step increase in λ m and constant T.
  • Scenario 3: Step decrease in T and constant λ m .
  • Scenario 4: Step increase in T and constant λ m .
  • Scenario 5: Inrush conditions.

6.1. Scenario 1: Step Decrease in λ m and Constant T

In this scenario, the proposed MPPT is compared with classical FLC and d P / d I based PID MPPT method at a step change in membrane water content λ m . A step change decrease is made in λ m from 13 to 10 as shown in Figure 13a, whereas the temperature T is kept constant at 343 K. The obtained results are shown in Figure 13. Figure 13b illustrates PEMFC output power comparisons in this scenario. Although the three studied MPPT algorithms can reach MPP at a steady state, they differ in their transient response. It can be seen that the proposed method achieves faster MPPT with reduced undershoot value, whereas the classical FLC MPPT achieves lower performance than the proposed method, which verifies the benefits of using the d P / d I in the proposed method instead of d P / d V in the classical FLC method. The d P / d I with PID control achieves the worst response in terms of tracking time and peak undershoot value. The incorporation of an optimized FLC with d P / d I for MPPT merges the benefits of both parts. This is reflected in the comparison results of the three studied methods. Figure 13c,d show the PEMFC output voltage and current response in this scenario, respectively. It is worth noting that the classical FLC achieves high oscillations in voltage and current, which is reflected in a reduced lifetime of PEMFC with continuous operation. On the other side, the proposed method achieves smooth voltage and current responses, which can lead to the lifetime extension of PEMFCs.

6.2. Scenario 2: Step Increase in λ m and Constant T

In this scenario, the three MPPT controllers are compared with a step change increase in λ m from 10 to 13 as shown in Figure 14a, whereas T is kept constant at 343 K. The comparison results are demonstrated in Figure 14. The output power comparisons are shown in Figure 14b. At the same time, the output current and voltage comparisons are outlined in Figure 14c,d, respectively. It is clear that the output power of the proposed method is smooth without fluctuations. This, in turn, leads to a longer operating lifetime of PEMFCs using the newly proposed MPPT method. In addition, the output voltage and current of the proposed method behave in a smooth way without overshooting and without oscillations in transients and steady state. Thence, more stable operation of the power converter systems can be achieved using the proposed method compared with the other studied methods. In contrast, the classical d P / d V based FLC MPPT has high oscillations and overshoot value in this case. This, in turn, confirms the superior performance of the proposed FLC method over classical FLC and PID-based MPPT.

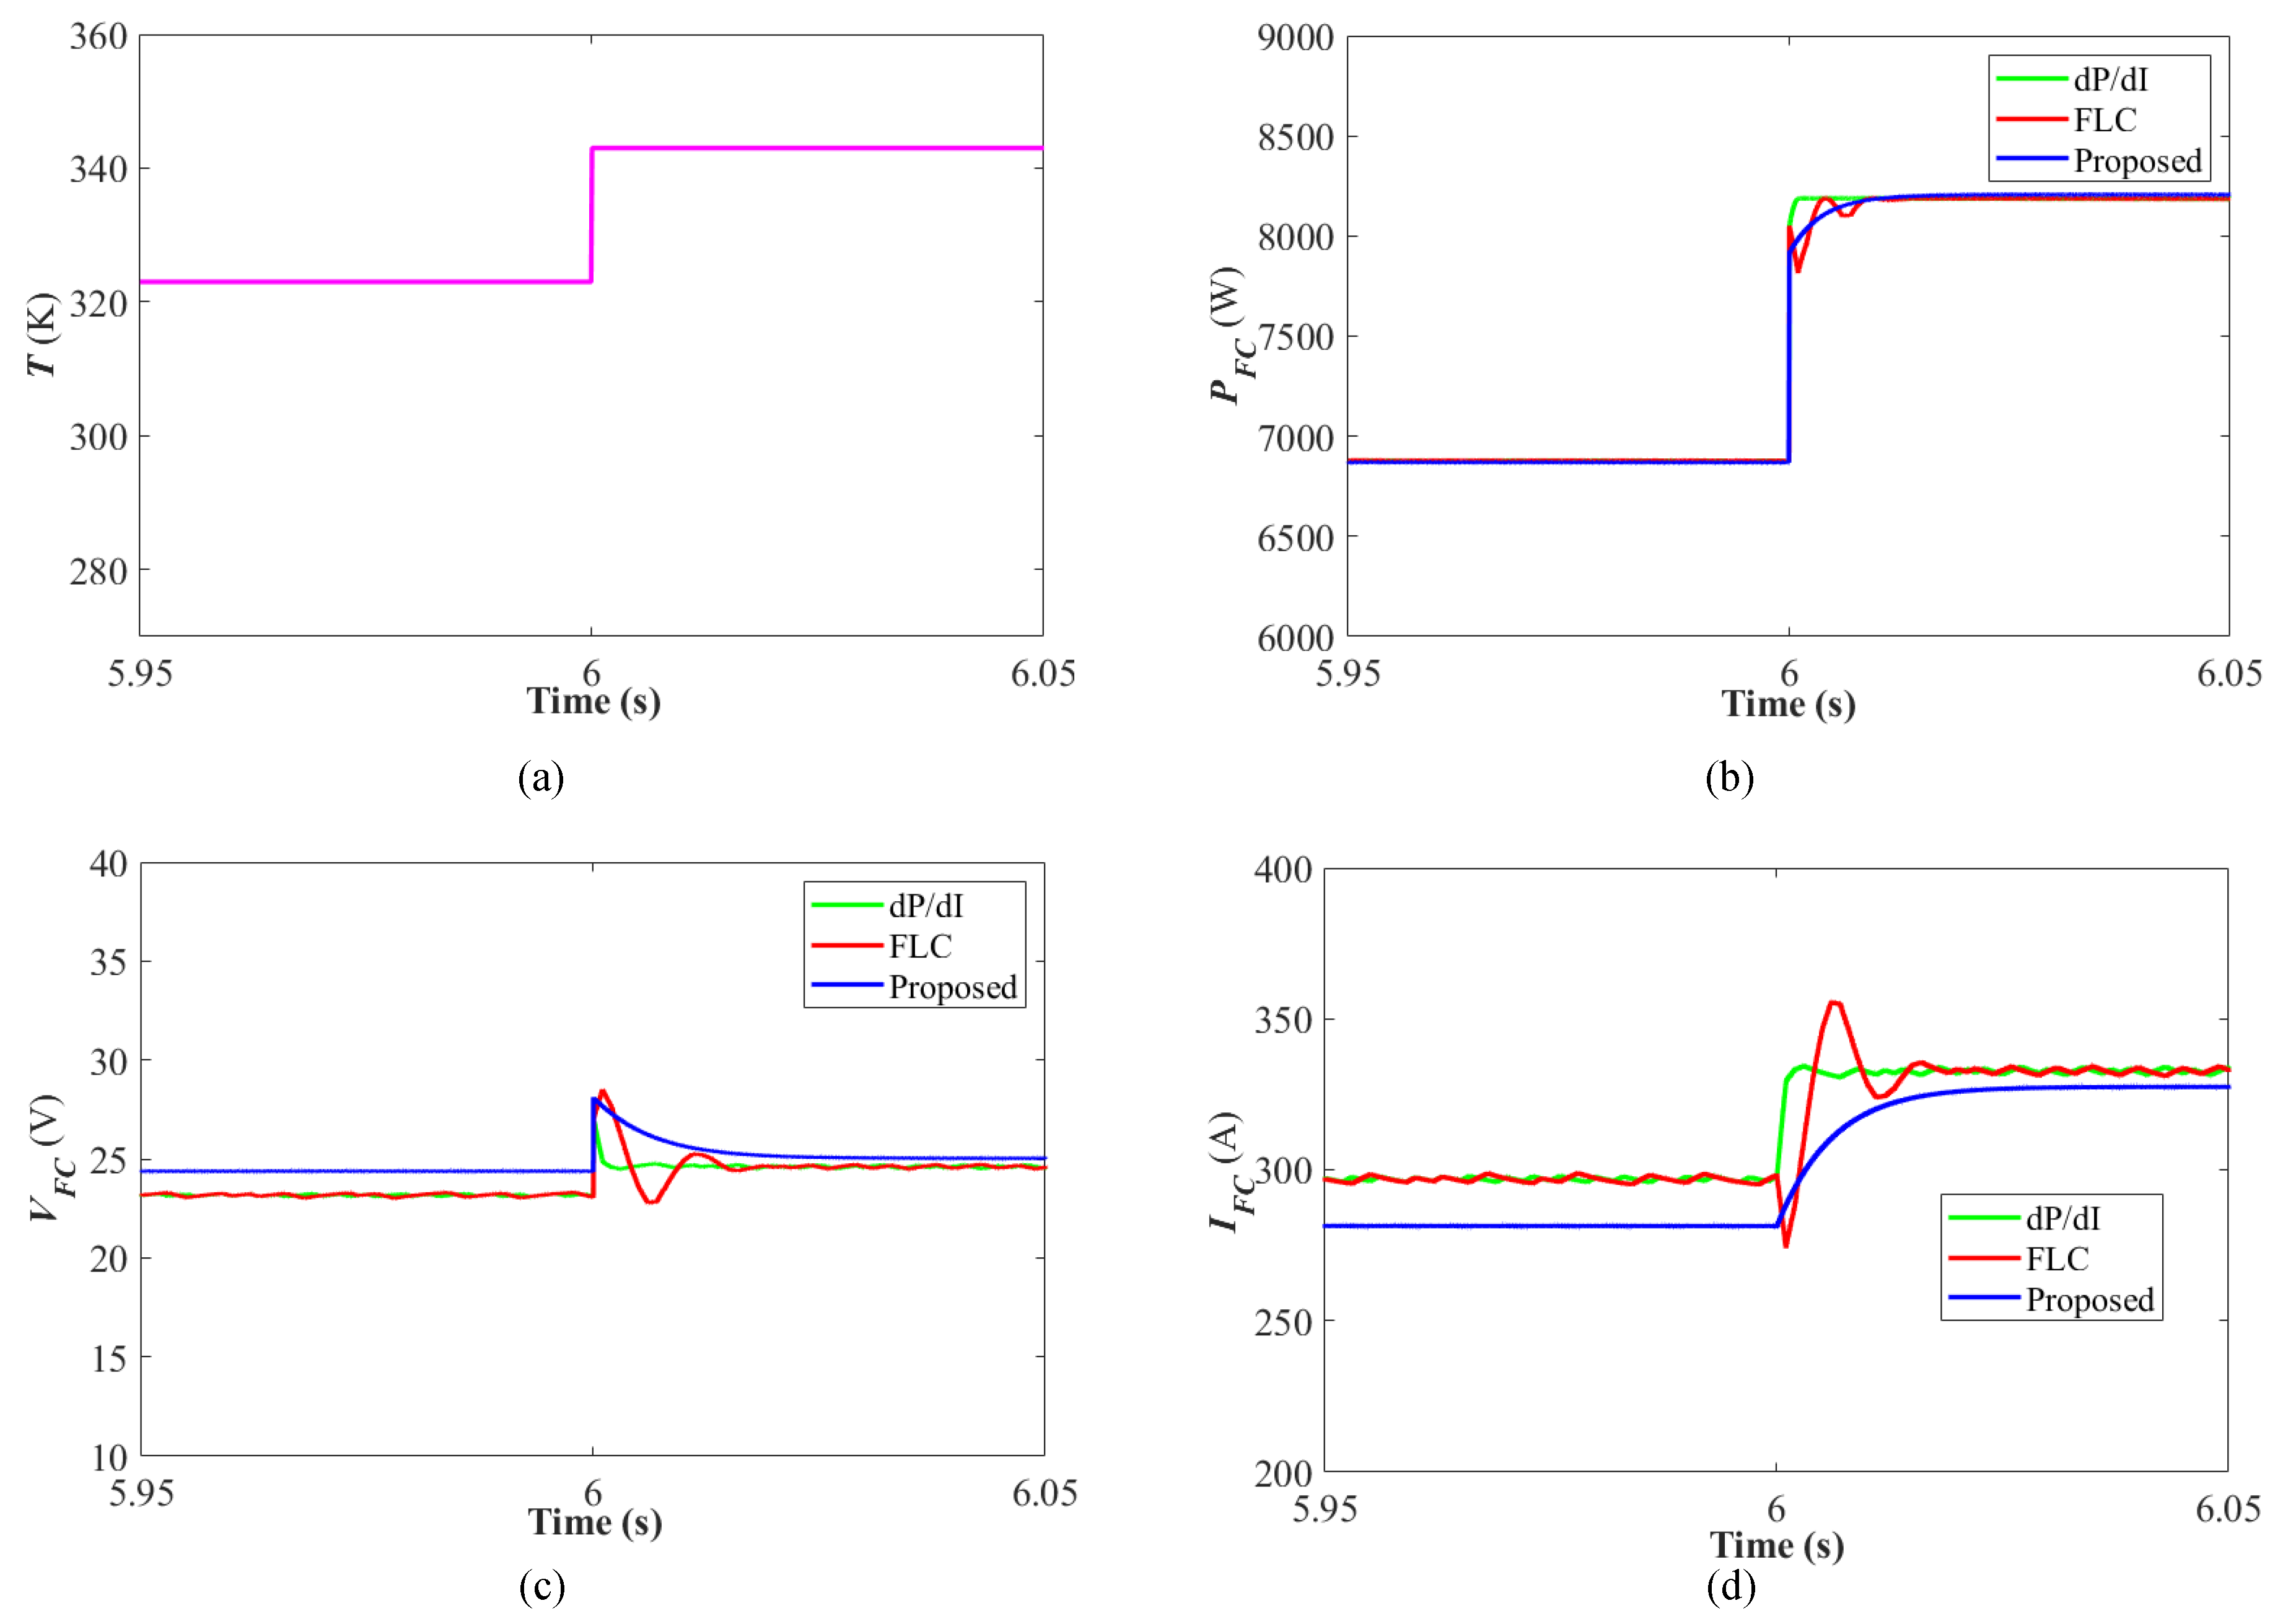
6.3. Scenario 3: Step Decrease in T and Constant λ m

Moreover, the three methods are compared at a step decrease in the temperature T from 343 to 333 K as shown in Figure 15a, and λ m is kept constant at 13 in this scenario. The obtained results are shown in Figure 15. The output power comparison is presented in Figure 15b for this scenario. It can be seen that the fastest response is obtained using the proposed method. The classical FLC has a notable settling time and oscillations in the outputted power from PEMFC. Moreover, the d P / d I PID MPPT control has a steep undershoot value and settling time in this scenario. The FLC improves the performance of the d P / d I method by employing freedom in its design and design optimization using the LSHADE method. In addition, it is clear that the employment of d P / d I achieves better performance than the use of d P / d V for MPPT applications of PEMFCs. From another side, the voltage and current responses are shown in Figure 15c,d, respectively. The proposed method achieves a very smooth response of PEMFC output voltage and current waveforms without oscillations or peak overshoots.

6.4. Scenario 4: Step Increase in T and Constant λ m

In this scenario, a step increase is applied to the temperature T from 323 to 343 K as shown in Figure 16a, while keeping λ m constant at 13. Figure 16 shows the obtained results in this scenario for the proposed method with classical FLC and d P / d I PID MPPT method. The proposed method and d P / d I PID method achieve improved performance for output power, voltage, and current outputs from PEMFCs in this scenario. At the same time, the classical FLC MPPT method achieves the worst response in this scenario compared with the proposed and d P / d I PID methods. It can be clearly seen that the proposed method is better than the other studied methods from the literature. The related benefits include the better stable operation of the PEMFC power conversion system, the prolonged operating lifetime of PEMFCs, and better extraction of PEMFC power at the whole operating range.

6.5. Scenario 5: Inrush Conditions

In this scenario, the studied algorithms are compared for inrush conditions based on the employed PEMFC model. The membrane water content λ m is fixed at 12, and the temperature T is kept constant at 343 K. The obtained results for this scenario are shown in Figure 17. It can be observed that the proposed method has better inrush characteristics compared to the other two algorithms. The output power, voltage, and current reach their steady state without delay or high transients in the proposed method.

6.6. Discussion and Performance Comparison

Table 3 displays a brief performance comparison of the proposed method with featured MPPT methods from the literature. It is worth mentioning that the P&O-based MPPT scheme uses a fixed value for step size in the MPPT process, whereas other methods use a variable step size, which can lead to better performance with variable step size operation. This can be reflected in the flexibility and freedom in design comparisons between MPPT methods. The d P / d I PID method has better flexibility than P&O and INC-based MPPT methods due to the possibility of tuning PID parameters. On another side, FLC methods have better flexibility in designing their MFs. The various optimization algorithms can be adopted for optimum benefit from the flexibilities and freedom in d P / d I PID, classical FLC method, and proposed FLC methods. This, in turn, can lead to more optimized MPPT control in these methods. Furthermore, the proposed method achieves reduced oscillations, low peak overshoot/undershoot values, and shorter tracking time compared with the other considered methods.

7. Conclusions

A modified FLC-based MPPT control scheme is proposed in this paper for PEMFCs in green building applications. The proposed method uses the d P / d I for implementing the proposed FLC MPPT instead of d P / d V used in classical FLC MPPT schemes. Moreover, an optimized design for the proposed FLC MPPT controller is presented in this paper using the LSHADE optimizer. The proposed FLC MPPT scheme has been simulated and compared with the featured MPPT schemes from the literature. The proposed method and obtained results verify the following benefits:
  • The proposed FLC MPPT method achieves faster tracking of the MPP operating point with reduced oscillations due to employing d P / d I in the FLC design. The proposed MPPT scheme achieves lower fluctuations and oscillations in the outputted waveforms from PEMFCs.
  • The obtained results show the accurate and fast tracking for the MPP of PEMFCs using the proposed method in various expected operating scenarios.
  • Moreover, low peak overshoot/undershoot values are obtained through applying the proposed optimized MPPT control scheme at the various studied step change increase/decrease of temperature and/or the membrane water content.
  • Additionally, more flexibility and freedom are obtained from using the FLC with more possibility for optimally designing its membership functions.
Future research includes additional experimental verification of the proposed method. It can also consider the unstable state and low power operating range of PEMFCs in the MPPT design (very low values of membrane water content and temperature). In addition, the detailed physical characteristics of PEMFCs, inrush, and startup conditions can be covered.

Author Contributions

Conceptualization, M.A, A.S., H.R. and E.A.M.; methodology, M.A., H.R., A.M.N. and A.S.; software, M.A., A.S., M.A.E. and H.R.; validation, M.A., M.A.E., A.M.N. and E.A.M.; formal analysis, M.A., A.S. and H.R.; investigation, M.A., A.M.N., E.A.M. and H.R.; resources, H.R., A.M.N. and M.A.E.; data curation, A.S. and H.R.; writing—original draft preparation, M.A., H.R., E.A.M. and A.M.N.; writing—review and editing, A.S., M.A.E. and M.A.; visualization, E.A.M. and H.R.; supervision, H.R. and A.M.N.; project administration, M.A. and H.R.; funding acquisition, M.A.E., A.M.N. and H.R. All authors have read and agreed to the published version of the manuscript.

Funding

This study is supported via funding from Prince Sattam bin Abdulaziz University project number (PSAU/2023/R/1444).

Data Availability Statement

Not applicable.

Conflicts of Interest

The authors declare no conflict of interest.

References

  1. Banihabib, R.; Assadi, M. The Role of Micro Gas Turbines in Energy Transition. Energies 2022, 15, 8084. [Google Scholar] [CrossRef]
  2. Rabbi, M.F.; Popp, J.; Máté, D.; Kovács, S. Energy Security and Energy Transition to Achieve Carbon Neutrality. Energies 2022, 15, 8126. [Google Scholar] [CrossRef]
  3. Ahmed, E.M.; Aly, M.; Elmelegi, A.; Alharbi, A.G.; Ali, Z.M. Multifunctional Distributed MPPT Controller for 3P4W Grid-Connected PV Systems in Distribution Network with Unbalanced Loads. Energies 2019, 12, 4799. [Google Scholar] [CrossRef] [Green Version]
  4. Sulich, A.; Sołoducho-Pelc, L. Changes in Energy Sector Strategies: A Literature Review. Energies 2022, 15, 7068. [Google Scholar] [CrossRef]
  5. Elmelegi, A.; Aly, M.; Ahmed, E.M.; Alharbi, A.G. A simplified phase-shift PWM-based feedforward distributed MPPT method for grid-connected cascaded PV inverters. Sol. Energy 2019, 187, 1–12. [Google Scholar] [CrossRef]
  6. Nindartin, A.; Moon, H.W.; Park, S.J.; Lee, K.T.; Im, J.B.; Kim, J.H. Influencing of the Building Energy Policies upon the Efficiency of Energy Consumption: The Case of Courthouse Buildings in South Korea. Energies 2022, 15, 6679. [Google Scholar] [CrossRef]
  7. Meena, C.S.; Kumar, A.; Jain, S.; Rehman, A.U.; Mishra, S.; Sharma, N.K.; Bajaj, M.; Shafiq, M.; Eldin, E.T. Innovation in Green Building Sector for Sustainable Future. Energies 2022, 15, 6631. [Google Scholar] [CrossRef]
  8. Izam, N.S.M.N.; Itam, Z.; Sing, W.L.; Syamsir, A. Sustainable Development Perspectives of Solar Energy Technologies with Focus on Solar Photovoltaic—A Review. Energies 2022, 15, 2790. [Google Scholar] [CrossRef]
  9. Wang, B.; Zhao, D.; Li, W.; Wang, Z.; Huang, Y.; You, Y.; Becker, S. Current technologies and challenges of applying fuel cell hybrid propulsion systems in unmanned aerial vehicles. Prog. Aerosp. Sci. 2020, 116, 100620. [Google Scholar] [CrossRef]
  10. Lü, X.; Wang, P.; Meng, L.; Chen, C. Energy optimization of logistics transport vehicle driven by fuel cell hybrid power system. Energy Convers. Manag. 2019, 199, 111887. [Google Scholar] [CrossRef]
  11. Vidović, T.; Tolj, I.; Radica, G.; Ćoko, N.B. Proton-Exchange Membrane Fuel Cell Balance of Plant and Performance Simulation for Vehicle Applications. Energies 2022, 15, 8110. [Google Scholar] [CrossRef]
  12. Fedorov, M.; Maslikov, V.; Korablev, V.; Politaeva, N.; Chusov, A.; Molodtsov, D. Production of Biohydrogen from Organ-Containing Waste for Use in Fuel Cells. Energies 2022, 15, 8019. [Google Scholar] [CrossRef]
  13. Rosli, M.I.; Lim, B.H.; Majlan, E.H.; Husaini, T.; Daud, W.R.W.; Lim, S.F. Performance Analysis of PEMFC with Single-Channel and Multi-Channels on the Impact of the Geometrical Model. Energies 2022, 15, 7960. [Google Scholar] [CrossRef]
  14. Beirami, H.; Shabestari, A.Z.; Zerafat, M.M. Optimal PID plus fuzzy controller design for a PEM fuel cell air feed system using the self-adaptive differential evolution algorithm. Int. J. Hydrogen Energy 2015, 40, 9422–9434. [Google Scholar] [CrossRef]
  15. Yang, B.; Wang, J.; Yu, L.; Shu, H.; Yu, T.; Zhang, X.; Yao, W.; Sun, L. A critical survey on proton exchange membrane fuel cell parameter estimation using meta-heuristic algorithms. J. Clean. Prod. 2020, 265, 121660. [Google Scholar] [CrossRef]
  16. Benyahia, N.; Denoun, H.; Badji, A.; Zaouia, M.; Rekioua, T.; Benamrouche, N.; Rekioua, D. MPPT controller for an interleaved boost dc–dc converter used in fuel cell electric vehicles. Int. J. Hydrogen Energy 2014, 39, 15196–15205. [Google Scholar] [CrossRef]
  17. Wu, Y.; Huangfu, Y.; Ma, R.; Ravey, A.; Chrenko, D. A strong robust DC-DC converter of all-digital high-order sliding mode control for fuel cell power applications. J. Power Sources 2019, 413, 222–232. [Google Scholar] [CrossRef]
  18. Samal, S.; Ramana, M.; Barik, P.K. Modeling and simulation of interleaved boost converter with MPPT for fuel cell application. In Proceedings of the 2018 Technologies for Smart-City Energy Security and Power (ICSESP), Bhubaneswar, India, 28–30 March 2018; pp. 1–5. [Google Scholar]
  19. Naseri, N.; Hani, S.E.; Aghmadi, A.; Harouri, K.E.; Heyine, M.S.; Mediouni, H. Proton Exchange Membrane Fuel Cell Modelling and Power Control by P&O Algorithm. In Proceedings of the 2018 6th International Renewable and Sustainable Energy Conference (IRSEC), Rabat, Morocco, 5–8 December 2018; pp. 1–5. [Google Scholar]
  20. Karthikeyan, V.; Das, P.V.; Blaabjerg, F. Implementation of MPPT Control in Fuel Cell Fed High Step up Ratio DC–DC Converter. In Proceedings of the 2018 2nd IEEE International Conference on Power Electronics, Intelligent Control and Energy Systems (ICPEICES), Delhi, India, 22–24 October 2018; pp. 689–693. [Google Scholar]
  21. Mohamed, A.P.; Chandrakala, K.R.M.V.; Saravanan, S. Comparative study of maximum power point tracking techniques for fuel cell powered electric vehicle. IOP Conf. Ser. Mater. Sci. Eng. 2019, 577, 012031. [Google Scholar] [CrossRef]
  22. Rezk, H.; Fathy, A. Performance Improvement of PEM Fuel Cell Using Variable Step-Size Incremental Resistance MPPT Technique. Sustainability 2020, 12, 5601. [Google Scholar] [CrossRef]
  23. Harrag, A.; Messalti, S. Variable Step Size IC MPPT Controller for PEMFC Power System Improving Static and Dynamic Performances. Fuel Cells 2017, 17, 816–824. [Google Scholar] [CrossRef]
  24. Chen, P.Y.; Yu, K.N.; Yau, H.T.; Li, J.T.; Liao, C.K. A novel variable step size fractional order incremental conductance algorithm to maximize power tracking of fuel cells. Appl. Math. Model. 2017, 45, 1067–1075. [Google Scholar] [CrossRef]
  25. Jyotheeswara Reddy, K.; Sudhakar, N. High Voltage Gain Interleaved Boost Converter With Neural Network Based MPPT Controller for Fuel Cell Based Electric Vehicle Applications. IEEE Access 2018, 6, 3899–3908. [Google Scholar] [CrossRef]
  26. Padmanaban, S.; Priyadarshi, N.; Bhaskar, M.S.; Holm-Nielsen, J.B.; Hossain, E.; Azam, F. A Hybrid Photovoltaic-Fuel Cell for Grid Integration With Jaya-Based Maximum Power Point Tracking: Experimental Performance Evaluation. IEEE Access 2019, 7, 82978–82990. [Google Scholar] [CrossRef]
  27. Ahmadi, S.; Abdi, S.; Kakavand, M. Maximum power point tracking of a proton exchange membrane fuel cell system using PSO-PID controller. Int. J. Hydrogen Energy 2017, 42, 20430–20443. [Google Scholar] [CrossRef]
  28. Fathy, A.; Abdelkareem, M.A.; Olabi, A.; Rezk, H. A novel strategy based on salp swarm algorithm for extracting the maximum power of proton exchange membrane fuel cell. Int. J. Hydrogen Energy 2020, 46, 6087–6099. [Google Scholar] [CrossRef]
  29. Rana, K.; Kumar, V.; Sehgal, N.; George, S. A Novel dPdI feedback based control scheme using GWO tuned PID controller for efficient MPPT of PEM fuel cell. ISA Trans. 2019, 93, 312–324. [Google Scholar] [CrossRef]
  30. Shashikant; Shaw, B. Comparison of SCA-Optimized PID and P&O-Based MPPT for an Off-grid Fuel Cell System. In Soft Computing in Data Analytics; Springer: Singapore, 2018; pp. 51–58. [Google Scholar]
  31. Kumar, S.; Shaw, B. Design of Off-grid Fuel Cell by Implementing ALO Optimized PID-Based MPPT Controller. In Soft Computing in Data Analytics; Springer: Singapore, 2018; pp. 83–93. [Google Scholar]
  32. Sahin, M.; Okumus, H. Fuzzy logic controlled parallel connected synchronous buck DC-DC converter for water electrolysis. IETE J. Res. 2013, 59, 280. [Google Scholar] [CrossRef]
  33. Aly, M.; Rezk, H. A MPPT based on optimized FLC using manta ray foraging optimization algorithm for thermo-electric generation systems. Int. J. Energy Res. 2021, 45, 13897–13910. [Google Scholar] [CrossRef]
  34. Rezk, H.; Aly, M.; Al-Dhaifallah, M.; Shoyama, M. Design and Hardware Implementation of New Adaptive Fuzzy Logic-Based MPPT Control Method for Photovoltaic Applications. IEEE Access 2019, 7, 106427–106438. [Google Scholar] [CrossRef]
  35. Harrag, A.; Messalti, S. How fuzzy logic can improve PEM fuel cell MPPT performances? Int. J. Hydrogen Energy 2018, 43, 537–550. [Google Scholar] [CrossRef]
  36. Aly, M.; Rezk, H. An improved fuzzy logic control-based MPPT method to enhance the performance of PEM fuel cell system. Neural Comput. Appl. 2021, 34, 4555–4566. [Google Scholar] [CrossRef]
  37. Cakmak, R.; Altas, I.H.; Sharaf, A.M. Modeling of FLC-Incremental based MPPT using DC–DC boost converter for standalone PV system. In Proceedings of the 2012 International Symposium on Innovations in Intelligent Systems and Applications, Trabzon, Turkey, 2–4 July 2012; pp. 1–5. [Google Scholar] [CrossRef]
  38. Şahin, M.E.; Okumuş, H.İ. Comparison of Different Controllers and Stability Analysis for Photovoltaic Powered Buck-Boost DC-DC Converter. Electr. Power Components Syst. 2018, 46, 149–161. [Google Scholar] [CrossRef]
  39. Al-Gizi, A.G.; Al-Chlaihawi, S.J. Study of FLC based MPPT in comparison with P&O and InC for PV systems. In Proceedings of the 2016 International Symposium on Fundamentals of Electrical Engineering (ISFEE), Bucharest, Romania, 30 June–2 July 2016; pp. 1–6. [Google Scholar] [CrossRef]
  40. Harrabi, N.; Souissi, M.; Aitouche, A.; Chaabane, M. Modeling and control of photovoltaic and fuel cell based alternative power systems. Int. J. Hydrogen Energy 2018, 43, 11442–11451. [Google Scholar] [CrossRef]
  41. Luta, D.N.; Raji, A.K. Comparing fuzzy rule-based MPPT techniques for fuel cell stack applications. Energy Procedia 2019, 156, 177–182. [Google Scholar] [CrossRef]
  42. Priyadarshi, N.; Sharma, A.K.; Azam, F. A Hybrid Firefly-Asymmetrical Fuzzy Logic Controller based MPPT for PV-Wind-Fuel Grid Integration. Int. J. Renew. Energy Res. 2017, 7, 1546–1560. [Google Scholar]
  43. Luta, D.; Raji, A. Fuzzy Rule-Based and Particle Swarm Optimisation MPPT Techniques for a Fuel Cell Stack. Energies 2019, 12, 936. [Google Scholar] [CrossRef] [Green Version]
  44. Raj, A.; Lekhaj, P. An ANFIS Based MPPT Controller for Fuel Cell Powered Induction Motor Drive. In Proceedings of the 2018 International Conference on Smart Grid and Clean Energy Technologies (ICSGCE), Kajang, Malaysia, 29 May–1 June 2018; IEEE: Piscataway, NJ, USA, 2018. [Google Scholar]
  45. Reddy, K.J.; Sudhakar, N. ANFIS-MPPT control algorithm for a PEMFC system used in electric vehicle applications. Int. J. Hydrogen Energy 2019, 44, 15355–15369. [Google Scholar] [CrossRef]
  46. Harrag, A.; Bahri, H. Novel neural network IC-based variable step size fuel cell MPPT controller. Int. J. Hydrogen Energy 2017, 42, 3549–3563. [Google Scholar] [CrossRef]
  47. Guenounou, O.; Dahhou, B.; Chabour, F. Adaptive fuzzy controller based MPPT for photovoltaic systems. Energy Convers. Manag. 2014, 78, 843–850. [Google Scholar] [CrossRef]
  48. Hong, Y.Y.; Buay, P.M.P. Robust design of type-2 fuzzy logic-based maximum power point tracking for photovoltaics. Sustain. Energy Technol. Assess. 2020, 38, 100669. [Google Scholar] [CrossRef]
  49. Dehghani, M.; Taghipour, M.; Gharehpetian, G.B.; Abedi, M. Optimized Fuzzy Controller for MPPT of Grid-Connected PV Systems in Rapidly Changing Atmospheric Conditions. J. Mod. Power Syst. Clean Energy 2020, 9, 376–383. [Google Scholar] [CrossRef]
  50. Storn, R.; Price, K. Differential Evolution—A Simple and Efficient Heuristic for global Optimization over Continuous Spaces. J. Glob. Optim. 1997, 11, 341–359. [Google Scholar] [CrossRef]
  51. Tanabe, R.; Fukunaga, A. Success-History Based Parameter Adaptation for Differential Evolution; IEEE: Piscataway, NJ, USA, 2013. [Google Scholar] [CrossRef] [Green Version]
  52. Awad, N.H.; Ali, M.Z.; Suganthan, P.N.; Reynolds, R.G. An Ensemble Sinusoidal Parameter Adaptation Incorporated with L-SHADE for Solving CEC2014 Benchmark Problems; IEEE: Piscataway, NJ, USA, 2016. [Google Scholar] [CrossRef]
  53. Fathy, A.; Aleem, S.H.E.A.; Rezk, H. A novel approach for PEM fuel cell parameter estimation using LSHADE-EpSin optimization algorithm. Energy Res. 2020, 45, 6922–6942. [Google Scholar] [CrossRef]
Figure 1. Overview of the green building structure with PEMFCs.
Energies 16 01197 g001
Figure 2. The PEMFC power conversion and MPPT system.
Energies 16 01197 g002
Figure 3. The main structure of PEMFCs.
Energies 16 01197 g003
Figure 4. Modeled PEMFC curves at temperature variations with a constant value of water content ( λ m = 12 ) ; (a) P F C - I F C ; (b) V F C - I F C .
Energies 16 01197 g004
Figure 5. Modeled PEMFC curves at water content variations with constant temperature value T = 343 K ; (a) P F C - I F C ; (b) V F C - I F C .
Energies 16 01197 g005
Figure 6. The principal stages in FLC MPPT structure.
Energies 16 01197 g006
Figure 7. The implementation of the proposed FLC MPPT structure and its main components.
Energies 16 01197 g007
Figure 8. Input/output MFs with a seven level design; (a) Input E ( k ) ; (b) Input Δ E ( k ) ; (c) Output Δ D ( k ) .
Energies 16 01197 g008
Figure 9. Design optimization of MFs points; (a) Original MF of E d P / d I ( k ) ; (b) Optimized MF design case 1; (c) Optimized MF design case 2.
Energies 16 01197 g009
Figure 10. The main structure of the proposed LSHADE-based FLC design optimization approach.
Energies 16 01197 g010
Figure 11. The stages of proposed LSHADE-based FLC design optimization.
Energies 16 01197 g011
Figure 12. The stages in the pseudo-code of the LSHADE optimizer algorithm.
Energies 16 01197 g012
Figure 13. Results and comparisons at scenario 1: (a) λ m ; (b) P F C ; (c) V F C ; (d) I F C .
Energies 16 01197 g013
Figure 14. Results and comparisons at scenario 2: (a) λ m ; (b) P F C ; (c) V F C ; (d) I F C .
Energies 16 01197 g014
Figure 15. Results and comparisons at scenario 3: (a) T; (b) P F C ; (c) V F C ; (d) I F C .
Energies 16 01197 g015
Figure 16. Results and comparisons at scenario 4: (a) T; (b) P F C ; (c) V F C ; (d) I F C .
Energies 16 01197 g016
Figure 17. Results and comparisons at inrush conditions: (a) P F C ; (b) V F C ; (c) I F C .
Energies 16 01197 g017
Table 1. The designed rules of the proposed FLC MPPT method.
Input Δ E
MFs NG L 3 NG L 2 NG L 1 ZR L 0 Pos L 1 Pos L 2 PS L 3
E N G L 3 N G L 3 N G L 3 N G L 3 N G L 3 N G L 2 N G L 1 Z R L 0
N G L 2 N G L 3 N G L 3 N G L 3 N G L 2 N G L 1 Z R L 0 P S L 1
N G L 1 N G L 3 N G L 3 N G L 2 N G L 1 Z R L 0 P S L 1 P S L 2
Z R L 0 N G L 3 N G L 2 N G L 1 Z R L 0 P S L 1 P S L 2 P S L 3
P S L 1 N G L 2 N G L 1 Z R L 0 P S L 1 P S L 2 P S L 3 P S L 3
P S L 2 N G L 1 Z R L 0 P S L 1 P S L 2 P S L 3 P S L 3 P S L 3
P S L 3 Z R L 0 P S L 1 P S L 2 P S L 3 P S L 3 P S L 3 P S L 3
Table 2. The specifications and parameters of PEMFC in the studied system.
ParameterValue
T343 (K)
l0.0178 (cm)
A232 (cm 2 )
n2
N F C 35
I m a x 2.00 (A cm 2 )
k r 9.07 × 10 8 (J (mol K) 1 )
F96,484,600 (C (kmol 1 )
R8.31447 (J (mol K) 1 )
q H 2 i n 10 × 10 5 (kmol (S) 1 )
q O 2 i n 5 × 10 5 (kmol ( S) 1 )
k O 2 2.11 × 10 5 (kmol (atom S) 1 )
k H 2 4.22 × 10 5 (kmol (atom S) 1 )
ξ 1 0.944
ξ 2 0.00354
ξ 3 7.8 × 10 8
ξ 4 1.96 × 10 4
Table 3. Performance comparison of featured controllers.
Control Methods for MPPT in Literature
CriteriaP&OINC dP / dI PIDFLCProposed
Ref.Ref. [19]Refs. [21,23]Ref. [29]Refs. [35,43]Proposed
Step typeFixedVariableVariableVariableVariable
FlexibilityVery SmallVery SmallMediumHighVery High
OptimizationNoNoGWOPSOLSHADE
OscillationsHighHighMediumMediumVery small
Time of MPPTHighVery HighHighMediumSmall
Disclaimer/Publisher’s Note: The statements, opinions and data contained in all publications are solely those of the individual author(s) and contributor(s) and not of MDPI and/or the editor(s). MDPI and/or the editor(s) disclaim responsibility for any injury to people or property resulting from any ideas, methods, instructions or products referred to in the content.

