Article

A Hybrid Approach for Low-Voltage AC Series Arc Fault Detection

1
Department of Electrical Engineering, National Chung Cheng University, Chia-Yi 621301, Taiwan
2
Department of Electrical Engineering, National Central University, Taoyuan 320317, Taiwan
3
Nuclear Instrumentation Division, Institute of Nuclear Energy Research, Taoyuan 325207, Taiwan
*
Author to whom correspondence should be addressed.
Energies 2023, 16(3), 1256; https://doi.org/10.3390/en16031256
Submission received: 9 December 2022 / Revised: 13 January 2023 / Accepted: 19 January 2023 / Published: 24 January 2023

Abstract

:
In a low-voltage electric distribution network, arc fault presents a high energy density electricity-discharging phenomenon between conductors, which is often caused by aging of electric facilities, loose contacts and terminals, or insulation failure due to internal and external destructions. A large amount of heat may be created during this discharging, which will further cause the risk of fire hazards to mitigate in the residential environment. Currently, many utility grid operators and electricity users are still devoted to seeking effective detection technology for arc fault protection. This paper proposes a hybrid approach that combines discrete wavelet transform (DWT), empirical mode decomposition (EMD), and dynamic time warping (DTW) methods for low-voltage AC series arc fault detection. In DWT, it uses time–frequency domain characteristics of the arc current signal to extract the occurrence of arc fault. In EMD, it decomposes the complex arc fault current signal into a finite intrinsic mode (IMF) signal; then, instantaneous amplitude of IMF signal is obtained by Hilbert–Huang transform (HHT) as a feature for arc fault identification. Firstly, the results of arc fault detections depend on the results from DWT and EMD. When both two methods detect different results, DTW method will be activated, using the similarity measurements between normal and arc fault current waveforms as an assistant measure to determine the occurrence of arc fault. The performance of the proposed approach is tested and validated using various electric appliances, and the results show that the proposed approach can effectively detect low-voltage AC series arc fault.

1. Introduction

Electrical fire risks arising from various arc faults are commonly seen in residential electrical environments; they often cause considerable hazards to property and people every year. Arc faults can happen from damaged material insulation; abnormal wiring such as crossed, squeezed, overloaded, or frayed cords; switch failure, or loose connections in outlets or sockets. For residential electrical design, circuit wiring lets electricity leap through the air via an electric arc discharging to a surrounding path. Studies have shown that an estimated high temperature of 2000 °C to 4000 °C may possibly be produced by the few amps of arc fault currents [1]. This extreme temperature may melt conductors and ignite nearby flammable materials. To avoid such risks from arc fault events, it is necessary to seek effective safety measures. In recent years, the installation of arc fault circuit interrupters (AFCIs) in low-voltage electrical power applications has received more attention. Several technical standards and electrical codes have been published to provide requirements for designing and developing AFCIs [2,3]. For example, AFCIs first appeared in the National Electrical Code (NEC) in 1999, and the relevant requirements for AFCI protection have been updated in the version of 2020. This code requires that all dwelling sites, such as bedrooms, laundry areas, kitchens, hallways, closets, and garages, install AFCIs under different electrical ratings; it then gives the technical guidance. AFCIs are safety devices that use electronic circuitry with detection algorithms to monitor the current’s flow through the circuits, and they trip when an abnormal arc fault signal is detected.
For AFCI implementation, the technology on arc fault detection is the most critical element. The following studies are associated with arc fault detection or characteristic analysis of arc faults. Artale and et al. proposed a high-resolution low-frequency spectral analysis method of the arc current based on Chirp–Z-Transform (CZT) together with a set of indicators. This method is used for series arc fault detection [4]. For renewable energy application, Lu and et al. presented an all-phase Fast Fourier transform (apFFT)-based detection method to determine the phase jump problem of the third-order harmonic when the arc faults occur [5]. A method based on arc fault differential signal analysis and wavelet transform is proposed in [6] for AC arc fault detection in a solid state power controller (SSPC). The fundamental components of the collected current signals in this method are removed so as to obtain a differential signal as the feature of the arc. Zeng and et al. extracted some parameters of AC arc faults in time and frequency domains, such as the standard deviation of root mean square of the current, the standard deviation of DC component, and the sum of odd harmonic, which are applied to the arc fault detection of the variable frequency system [7]. Fourier analysis method is utilized in [8] to show that certain ranges in the frequency spectrum can be used as indications of arc faults. Based on this analysis, it is possible to detect arc faults by measuring the load currents in the switchgear. Reference [9] introduced the operation principle of AFCIs and discussed how to select different types of AFCIs for series and parallel arc fault detections. An intelligent fully connected neural network (HTFNN)-based method is proposed in [10] that uses hybrid time and frequency characteristics to identify series AC arc faults. Kim and et al. presented a method in [11] for detecting series AC arc faults using voltage measurements instead of the traditional current measurement approach. A unique symmetric energy profile generated by the arc fault is observed in the voltage measurement; then, the threshold based on symmetric energy is set to effectively detect arc faults. Series arc fault detection in low-voltage AC circuit by using Rogowski coil sensor technology is proposed in [12]. In this study, the experimental results clearly show that by detecting the high frequency component of the di/dt, series arc faults can be reliably detected. One AC arc fault detection method based on arc current characteristics of time and frequency domain combined with Mahalanobis distance measurement is proposed in [13]. In addition, as the signal processing technique is widely used in electrical engineering, some signal analysis methods are also investigated for arc fault detection. In terms of the application of the DWT and EMD methods used in this paper, Wu and et al. used a radial basis function neural network (RBFNN)-based method for arc fault detection on low-voltage indoor power lines. In this method, signal features of arc fault currents are derived from DWT and then used as inputs for a neural network model to perform training and testing processes [14]. The authors of [15] proposed a comprehensive analysis for DWT optimal parameter assessment applied to arc fault detections in a residential electrical grid. More and more power electronic devices have been used in electric aircraft systems to replace traditional switches such as contractors and circuit breakers. This created challenges for protections. A detection method that applied DWT for SSPC arc fault detection in electric aircraft systems was thus studied in [16]. A model-based study for series and parallel arc fault detection in buildings was given in [17]. In this study, a mathematical arc model based on energy balance theory was first created by MATLAB/Simulink. Then, DWT method was used to extract the arc fault current signal under different circuit topologies. A combination of DWT method and deep neural network (DNN) model for series arc fault identification was proposed in [18]. In this study, the collected current signals are decomposed in different scales by DWT; then wavelet coefficients were obtained for creating training and testing sets for a neural network model. The high-impedance arc fault problem was investigated in [19]. The authors in this study proposed an EMD and Stockwell (ST)-based method for arc fault classification, where EMD was applied to study the real-time arc voltage signals of different conductor surfaces. Shang and et al., used the EMD method and a one-dimensional convolution neural network (CNN) for residential series arc fault identification in [20]. In this study, a laboratory experimental platform was setup based on GB and UL standards for testing; five different load faults are under analysis.
As mentioned above, most of the studies in arc fault detection focused on identifying the analytic characteristics from arc fault currents or voltages and then creating a feature index as the judgment of the occurrence of arc faults. Although the reviewed methods present effectiveness in arc fault detection, the implementations and settings for some of them are complicated. In addition, it is also known according to the literature survey, most of the detection methods adopt a mixed design rather than the application of an individual method. The purpose of this is to increase the flexibility and accuracy of using these methods. To establish an effective and easy-to-use technique for arc fault detection, this paper follows some of the concepts in the literature, then proposes a hybrid approach that combines DWT, EMD, and DTW techniques for AC series arc fault detection in low-voltage electrical power applications. Major contributions from this study include:
  • AC arc characteristics in time and frequency domains are illustrated for people to understand critical arc features;
  • Laboratory measurements are implemented based on UL 1699 standard; this helps people know the definition of arc fault and know the requirements for how to set up a platform for detections
  • Three signal processing-based analysis methods are individually introduced for people to understand the working principle of each. In addition, a hybrid method procedure is proposed to integrate these methods for arc fault detection. The results of the proposed approach can be used as references for technical staff to design and develop AFCI devices.
The organization of this paper is as follows. In Section 2, the characteristics of arc faults are described; then, the laboratory experiments for arc faults produced from various electric appliances are shown. The implementation of the proposed detection approach is investigated in Section 3. Section 4 gives the performance validation of the proposed detection approach with real arc fault signals in MATLAB. Finally, conclusions are presented in Section 5.

2. Characteristics of AC Series Arc Fault and Laboratory Experiments

Generally, parallel and series are common types of arc faults in low-voltage distribution networks. The former is often caused by a short-circuit between two electric phases and presents a higher fault current; in addition, it can more easily be detected or prevented by using traditional protection devices such as fuses or circuit breakers [21,22]. The latter often occurs due to disconnection between any power lines. Furthermore, a series arc fault is often formed within the circuit connected in series with loads; when series arc fault happens, the magnitude of the line current may be highly reduced with the result that the fault current becomes smaller and cannot easily be detected. To overcome the technical gap between parallel and series arc fault detections, this paper focus on the investigation of AC series arc fault detection.

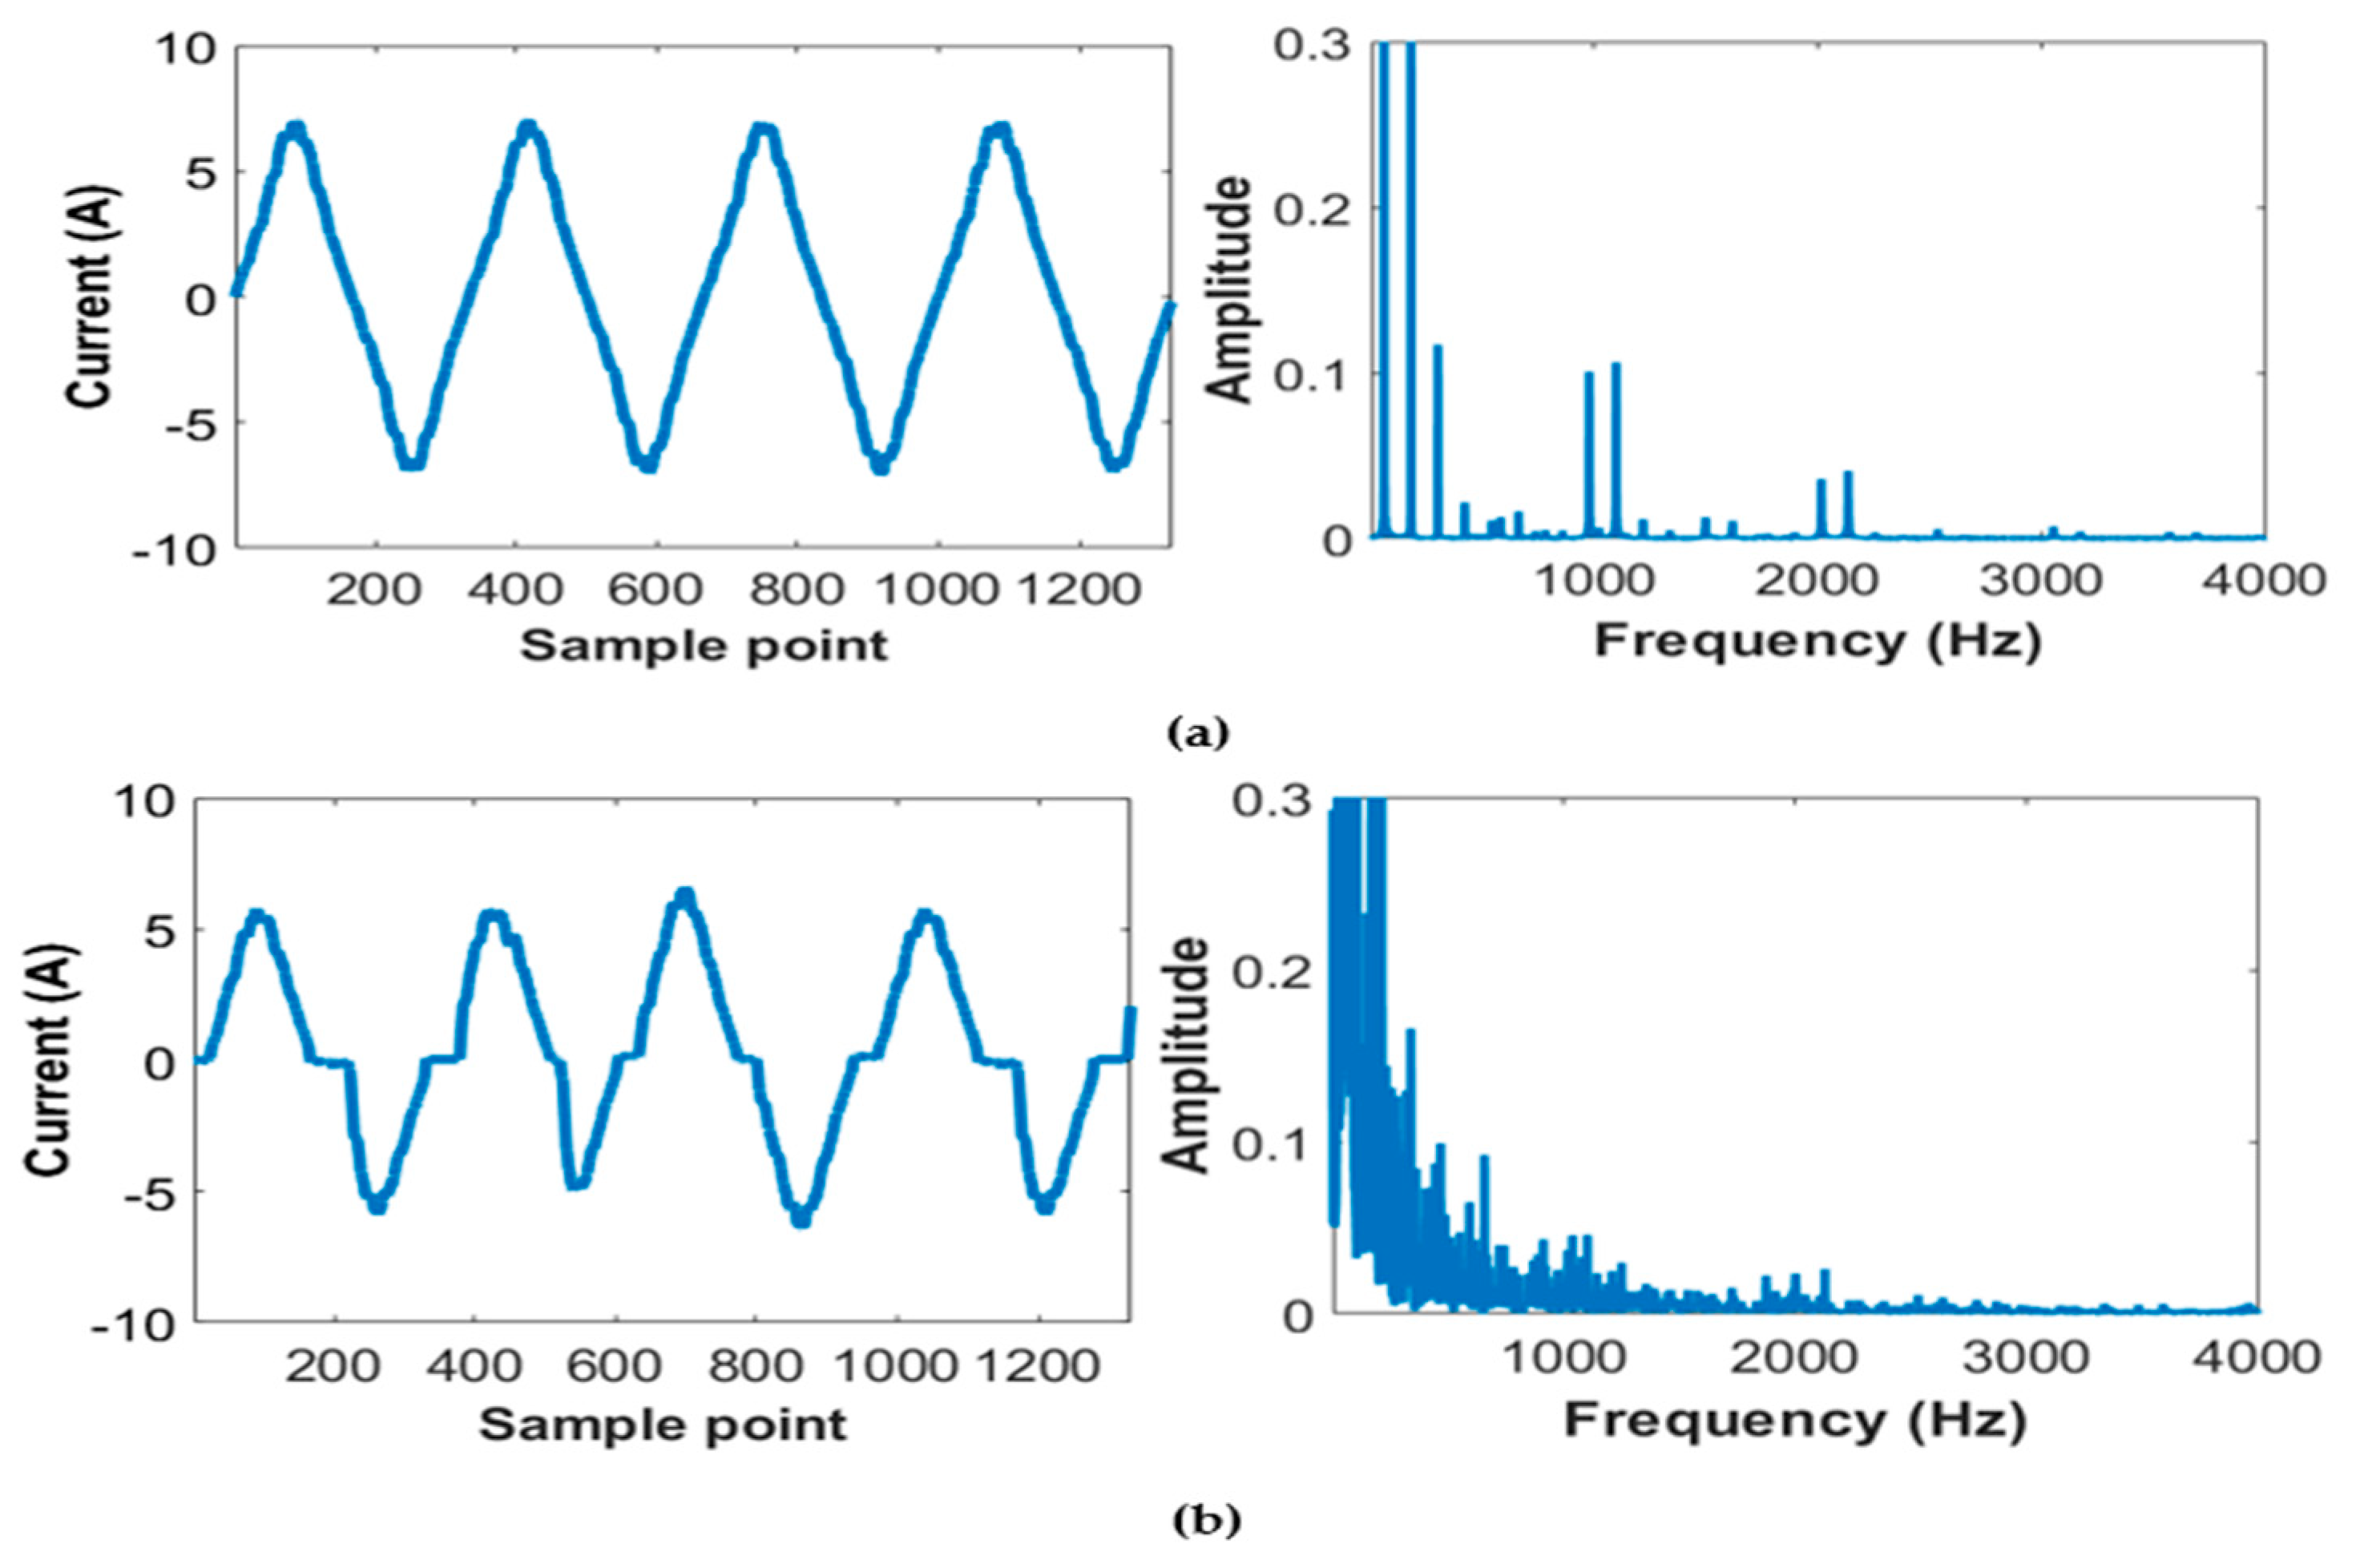
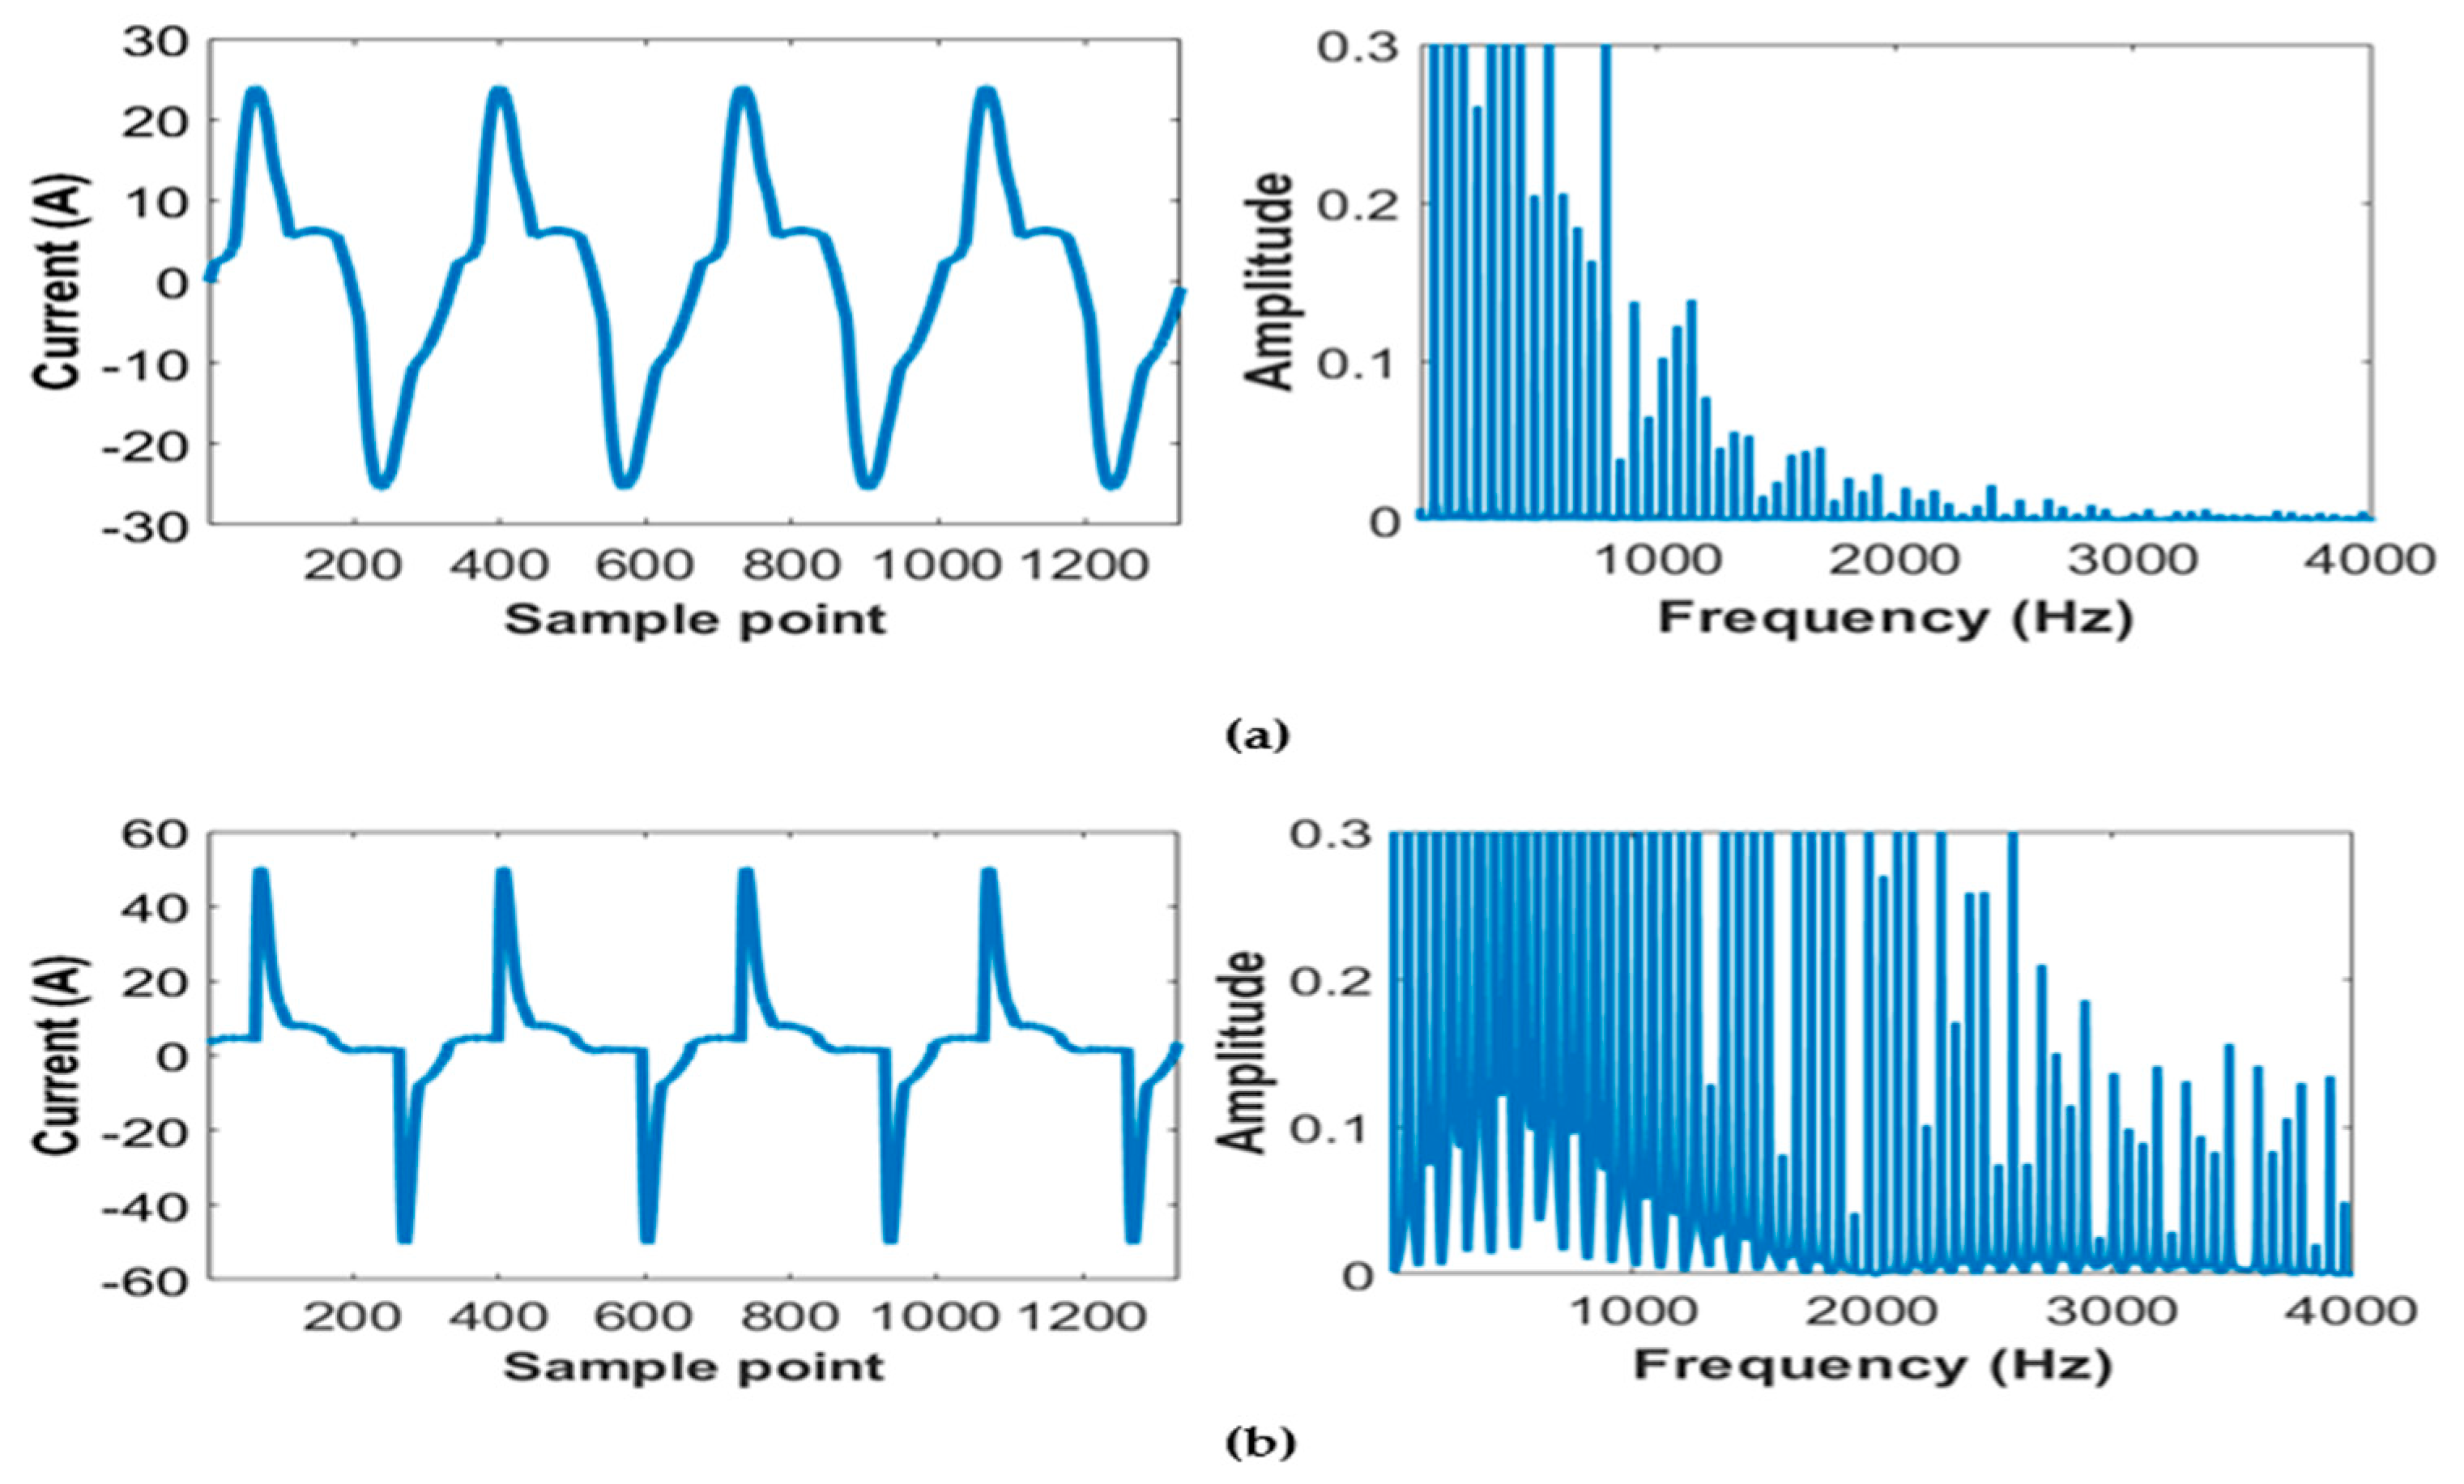
2.1. Characteristic of AC Arc Fault

Figure 1 shows the measured voltage and current waveforms of a series arc fault. Before arc fault forming, both voltage and current waveforms present sinusoidal shapes. When an arc fault occurs, the characteristics of voltage and current in the time domain and frequency domain are separately illustrated as follows [23,24].
  • Arc characteristics in the time domain:
    (a)
    The magnitude of an arc fault current may be generally less than a normal current; this is due to an equivalent impedance existing during the series arc fault which causes the reduction of the current;
    (b)
    A “shoulder” phenomenon can be observed periodically on the current waveform, which is a flat zone at the current pass through zero crossing;
    (c)
    The rising rate of the arc current is steeper than that in normal operation. This is because after the arc has extinguished, it takes some time to let the arc voltage rise enough to re-ignite the arc;
    (d)
    The arc voltage drops instantly when an arc fault occurs; furthermore, the arc voltage waveform presents a square wave.
  • Arc characteristics in the frequency domain:
    (a)
    Unsymmetrical distortions can easily be seen on the arc current/voltage waveforms. This means the low order harmonic components may be introduced;
    (b)
    During arc fault, the frequency component of arc current up to 2 kHz is significantly increased because the arc fault features a broadband signal with a temporal jitter in the arc re-ignition duration;
    (c)
    Frequency components of an arc current between 2 kHz to 5 kHz are caused by the above-mentioned steeply rising current edge after arc re-ignition.

2.2. Criteria for Arc Fault Detection in UL 1699 Standard

For arc fault protection, installing conventional devices such as circuit breakers can only be useful for overloading and short-circuit conditions. They do not provide the ability to protect against an arc fault which is erratically produced and often has reduced currents. AFCIs thus become an alternative that is often employed to prevent fire hazards caused by arc fault in residential or industrial electricity. The working principle of AFCIs is to continuously monitor line currents and identify the features of normal and arc currents. When an arc fault is detected, an AFCI trips its internal contacts, and then de-energizes the circuit to avoid hazards occurring. To ensure the safety and performance of AFCIs that can meet the requirements, the UL 1699 standard has been published for AFCI products in the testing and certification process [1]. UL 1699 contains the testing and certification requirements for various types of AFCIs. According to different features and installation locations, several types of AFCIs are categorized in the standards. In addition, the implementation and setup of three different tests, including the arc detection test, unwanted operation test, and operation inhibition test, are described in the standards. The criteria for all of the tests to identify the occurrence of an arc fault are provided. For low-voltage applications, when four consecutive abnormal signal are detected by AFCIs within 0.5 s, it means an arc fault is detected. AFCIs should immediately interrupt, then de-energize, the circuit. In this paper, the experimental implementations in the laboratory and judgment criteria used in the proposed detection approach all follow the requirements given in the UL 1699 standards.

2.3. Laboratory Experiments

To observe the time- and frequency domain characteristics of series arc faults, four different types of electrical appliance loads, including electric heating (resistive) type, power electronic type, electric machinery (inductive) type, and mixed type, are used for measurement. The experimental setup is shown in Figure 2. The electric appliance loads under test are directly connected to a home socket; meanwhile, an arc generator that is designed in compliance with UL 1699 standards is connected in a series between the home socket and the electric appliance load. An HIOKI PW3198 power quality analyzer with a HIOKI 9694 current sensor and a HIOKI 9438 voltage clamp is employed to record the measurement results. The sampling frequency used in the measurements is 20 kHz, and the measurement results include current waveforms and FFT spectra in both normal and arc fault states of each load.
The measurement results are shown in Figure 3, Figure 4, Figure 5 and Figure 6. In Figure 3, the electric heating load is a 700 W toaster. Its normal current waveform approximates to sinusoidal shape and harmonics are not observable from the FFT spectrum, as shown in Figure 3a. This current waveform becomes distorted during arc fault state, as shown in Figure 3b; meanwhile, the magnitude of an arc fault current is less than a normal current, shoulder phenomenon is observed, and the rising rate of the arc current is faster than the normal current. Harmonic and high frequency components of an arc fault current also easily be found in FFT spectrum. Figure 4 shows measurements for the power electronic type load which consists of 14 spiral compact fluorescent lamps (CFLs); each of them has 23 W power and has a built-in electronic ballast circuit. As shown in Figure 4a, the current waveform of the bulbs in normal state presents the characteristic of nonlinear distortion, which is due to the implementation of electronic ballasts in the lamps. Odd harmonics are clearly observed in the FFT spectrum. The current of the bulbs in arc fault state is still distorted, the magnitude of the current is less than that in normal state, and the peak value of the arc fault current changes sustainably. Both harmonics and high frequency components are more serious than in normal state.
The load of a 500 W vacuum cleaner is measured in Figure 5. The current waveform in normal state closes to a triangle shape with apparent characteristic harmonics, as shown in Figure 5a. At arc fault state, the current waveform shows temporal interruption at several zero-crossing points, but the current flow meanwhile is not interrupted. This interruption is occurred between arc extinguishing and re-ignition, and its duration mostly depends on the distance and plasma density between two electrodes. The inductive characteristic of the loads also has an effect on the duration of this interruption. For a series arc fault, this interruption is quite small and the non-stable characteristics of arc extinguishing and re-ignition easily make violent changes to the magnitude and phase of the current. In addition, obvious harmonics and frequency up to 2 kHz can also easily be found, as shown in Figure 5b. The components of inter-harmonics are usually lower for the loads in normal state. Once an arc fault has happened, these inter-harmonics may increase; this is because the arc fault is a broadband signal with a temporal jitter in the arc re-ignition. The measurement results in Figure 6 are collected from a mixed load that is composed of 14 spiral CFLs, 24 LED T5 tubes (each with 18 W power), a 250 W refrigerator, and a 600 W hair dryer. Variations on the current waveform either in normal or arc fault states depend on the proportion of using different types of loads. A highly steep, rising current edge is found the in arc fault current, as shown in Figure 6b. Generally, this current edge has a rising time from a few microseconds to a hundred microseconds. In FFT analysis, it can be found that the harmonics of a mixed load are mainly distributed at frequency higher than 2 kHz.

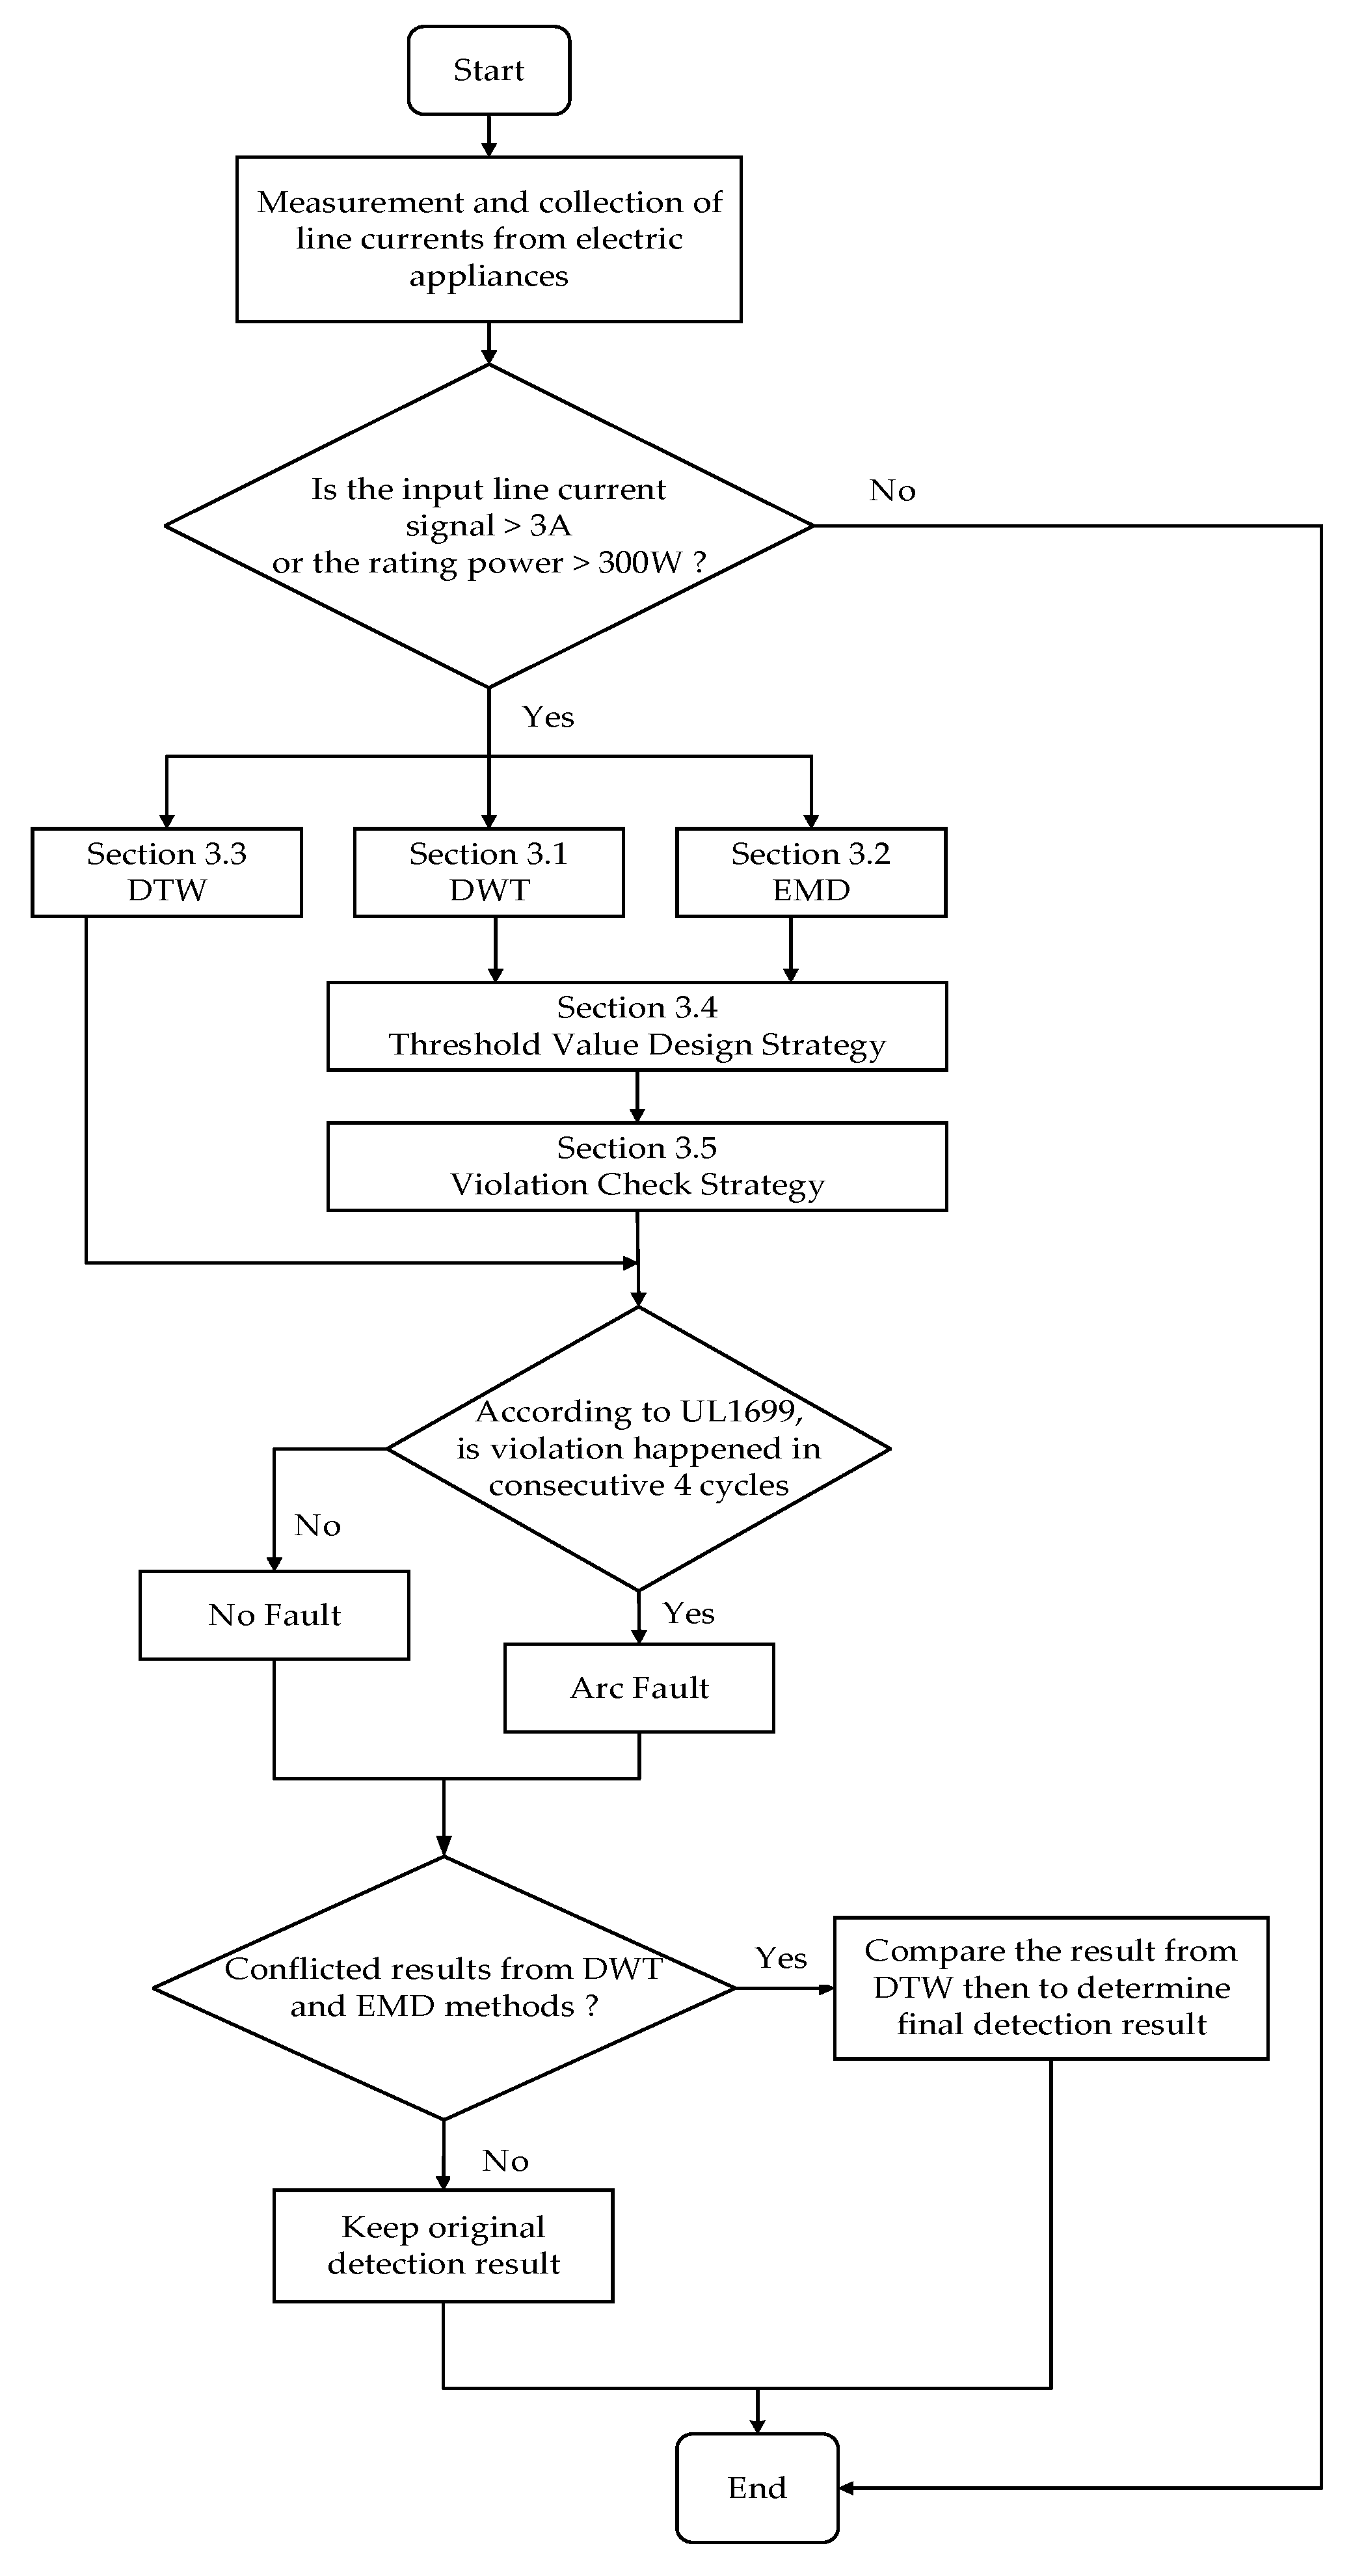
3. Proposed Detection Method

According to the characteristics analysis of low-voltage AC series arc faults in Section 2, it is found that AC series arc fault signal features, both in time and frequency domains, can act as useful indicators for arc fault detection. Thus, this paper proposes a hybrid approach that combines time and frequency domain methods, and includes DWT, EMD, and DTW techniques for AC series arc fault detection. The whole configuration of this proposed approach is shown in Figure 7. It is noted that the line currents are highly reduced during arc fault duration which makes the fault currents not easy to detect. Therefore, the approach proposed in this paper is mainly used for arc fault detection with a current greater than 3 amperes, and arc fault detection with a line current greater than 3 A or rating power higher than 300 W. The implementations of the proposed approach are given below and are outlined in Figure 7:
  • Step 1: According to the setup in Figure 7, measure the line currents from various electric appliances. Meanwhile, 30 cycles of current signal are collected for the coming detection procedure;
  • Step 2: Check if the amplitude of the current or the rating power from the tested electric appliance is higher than 3 A or higher than 300 W, respectively. If not satisfied, stop the detection;
  • Step 3: Apply the current signal measured in Step 1 to DWT, EMD, and DTW methods, respectively. The discussion of each method is given in Section 3.1 to 3.3;
  • Step 4: Apply the threshold value design strategies for DWT and EMD methods in Section 3.4 to calculate the violation energy;
  • Step 5: According to the calculated violation energy in previous step, the violation strategy is separately applied to the DWT and EMD methods for determining the occurrence of arc fault;
  • Step 6: When different detection results are presented from the DWT and EMD methods, the results from the DTW method may be used as a further judgment indicator.

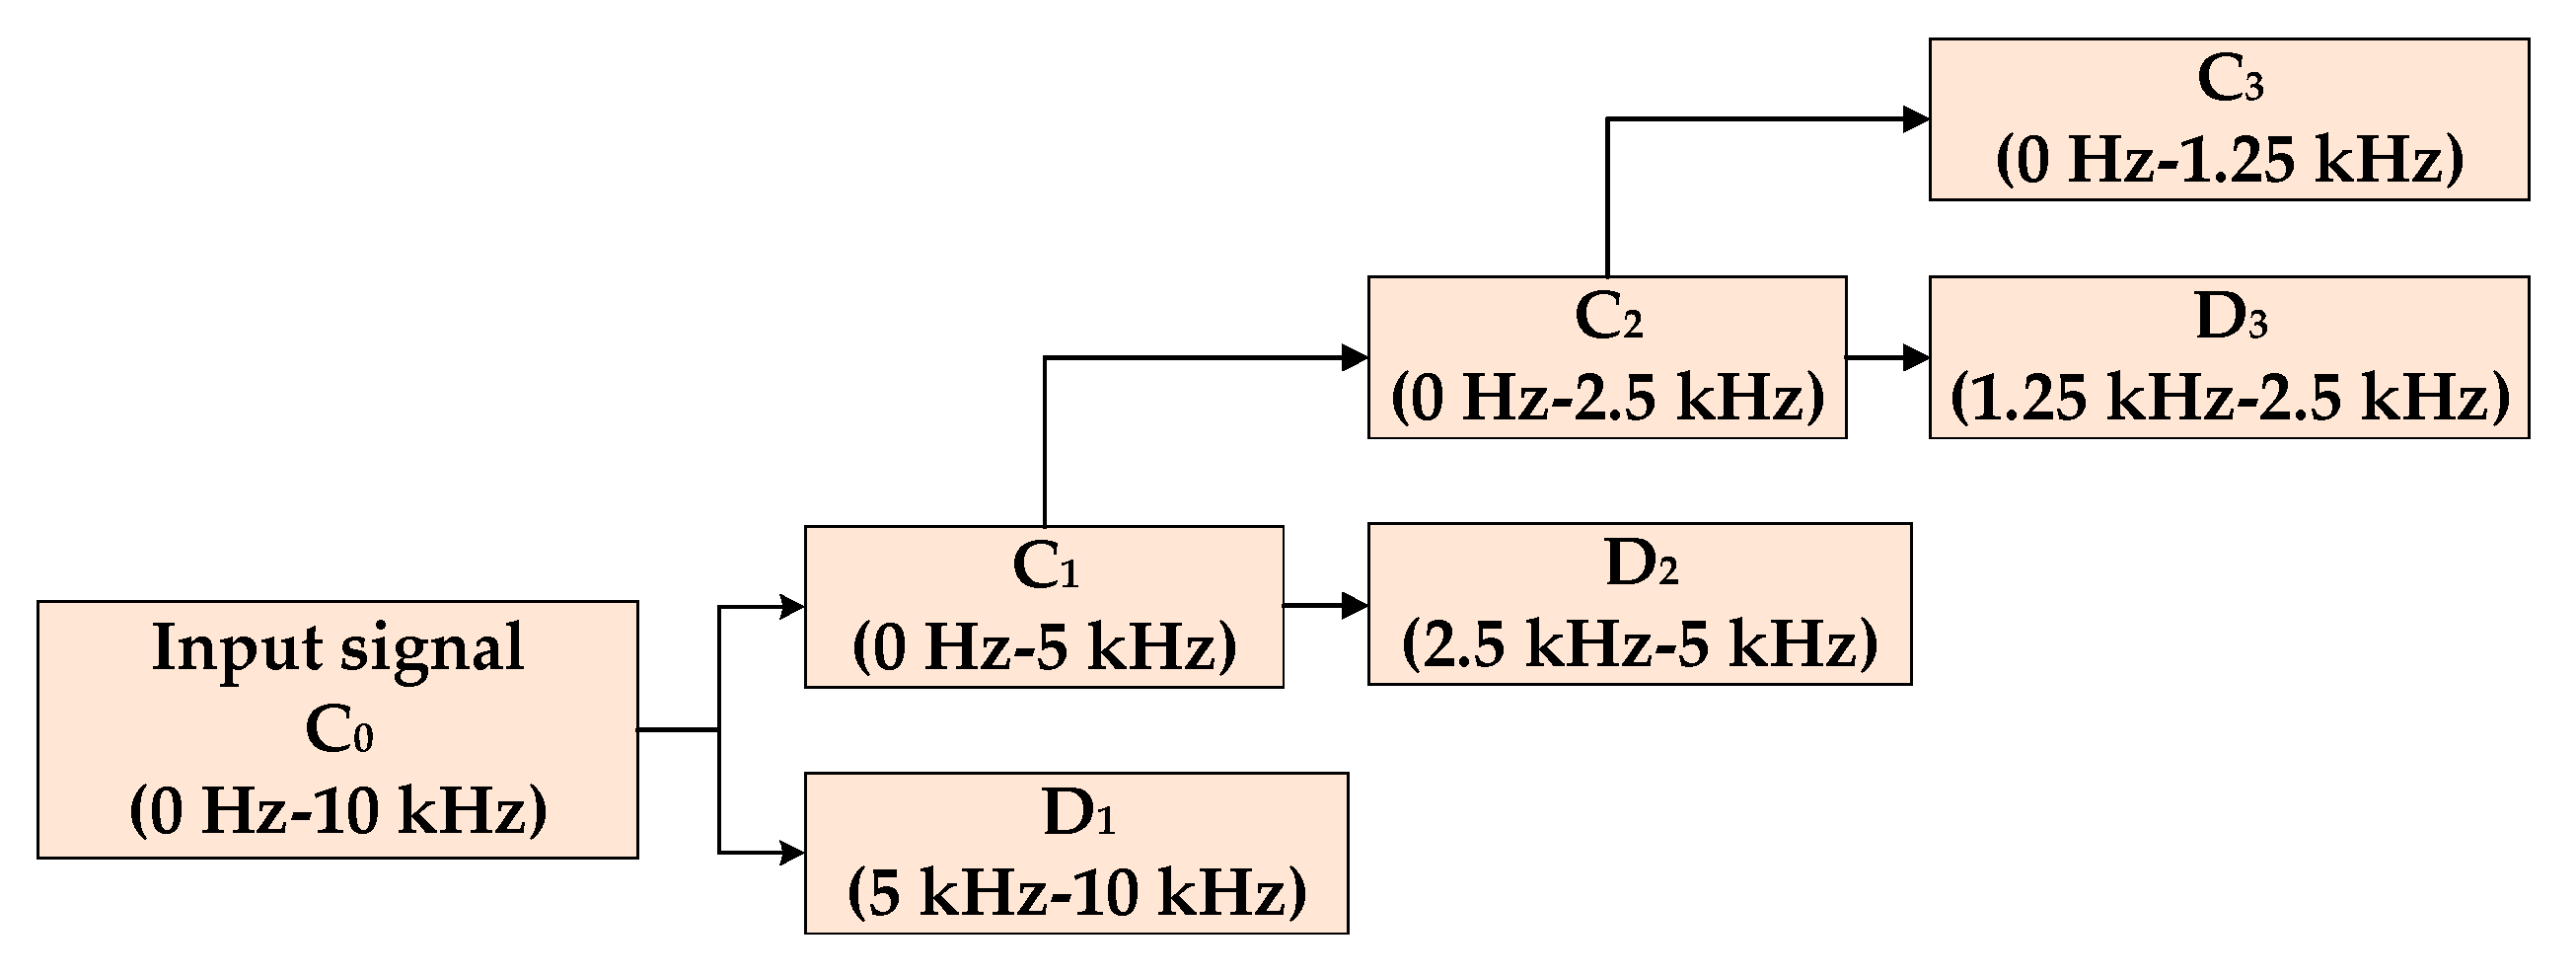
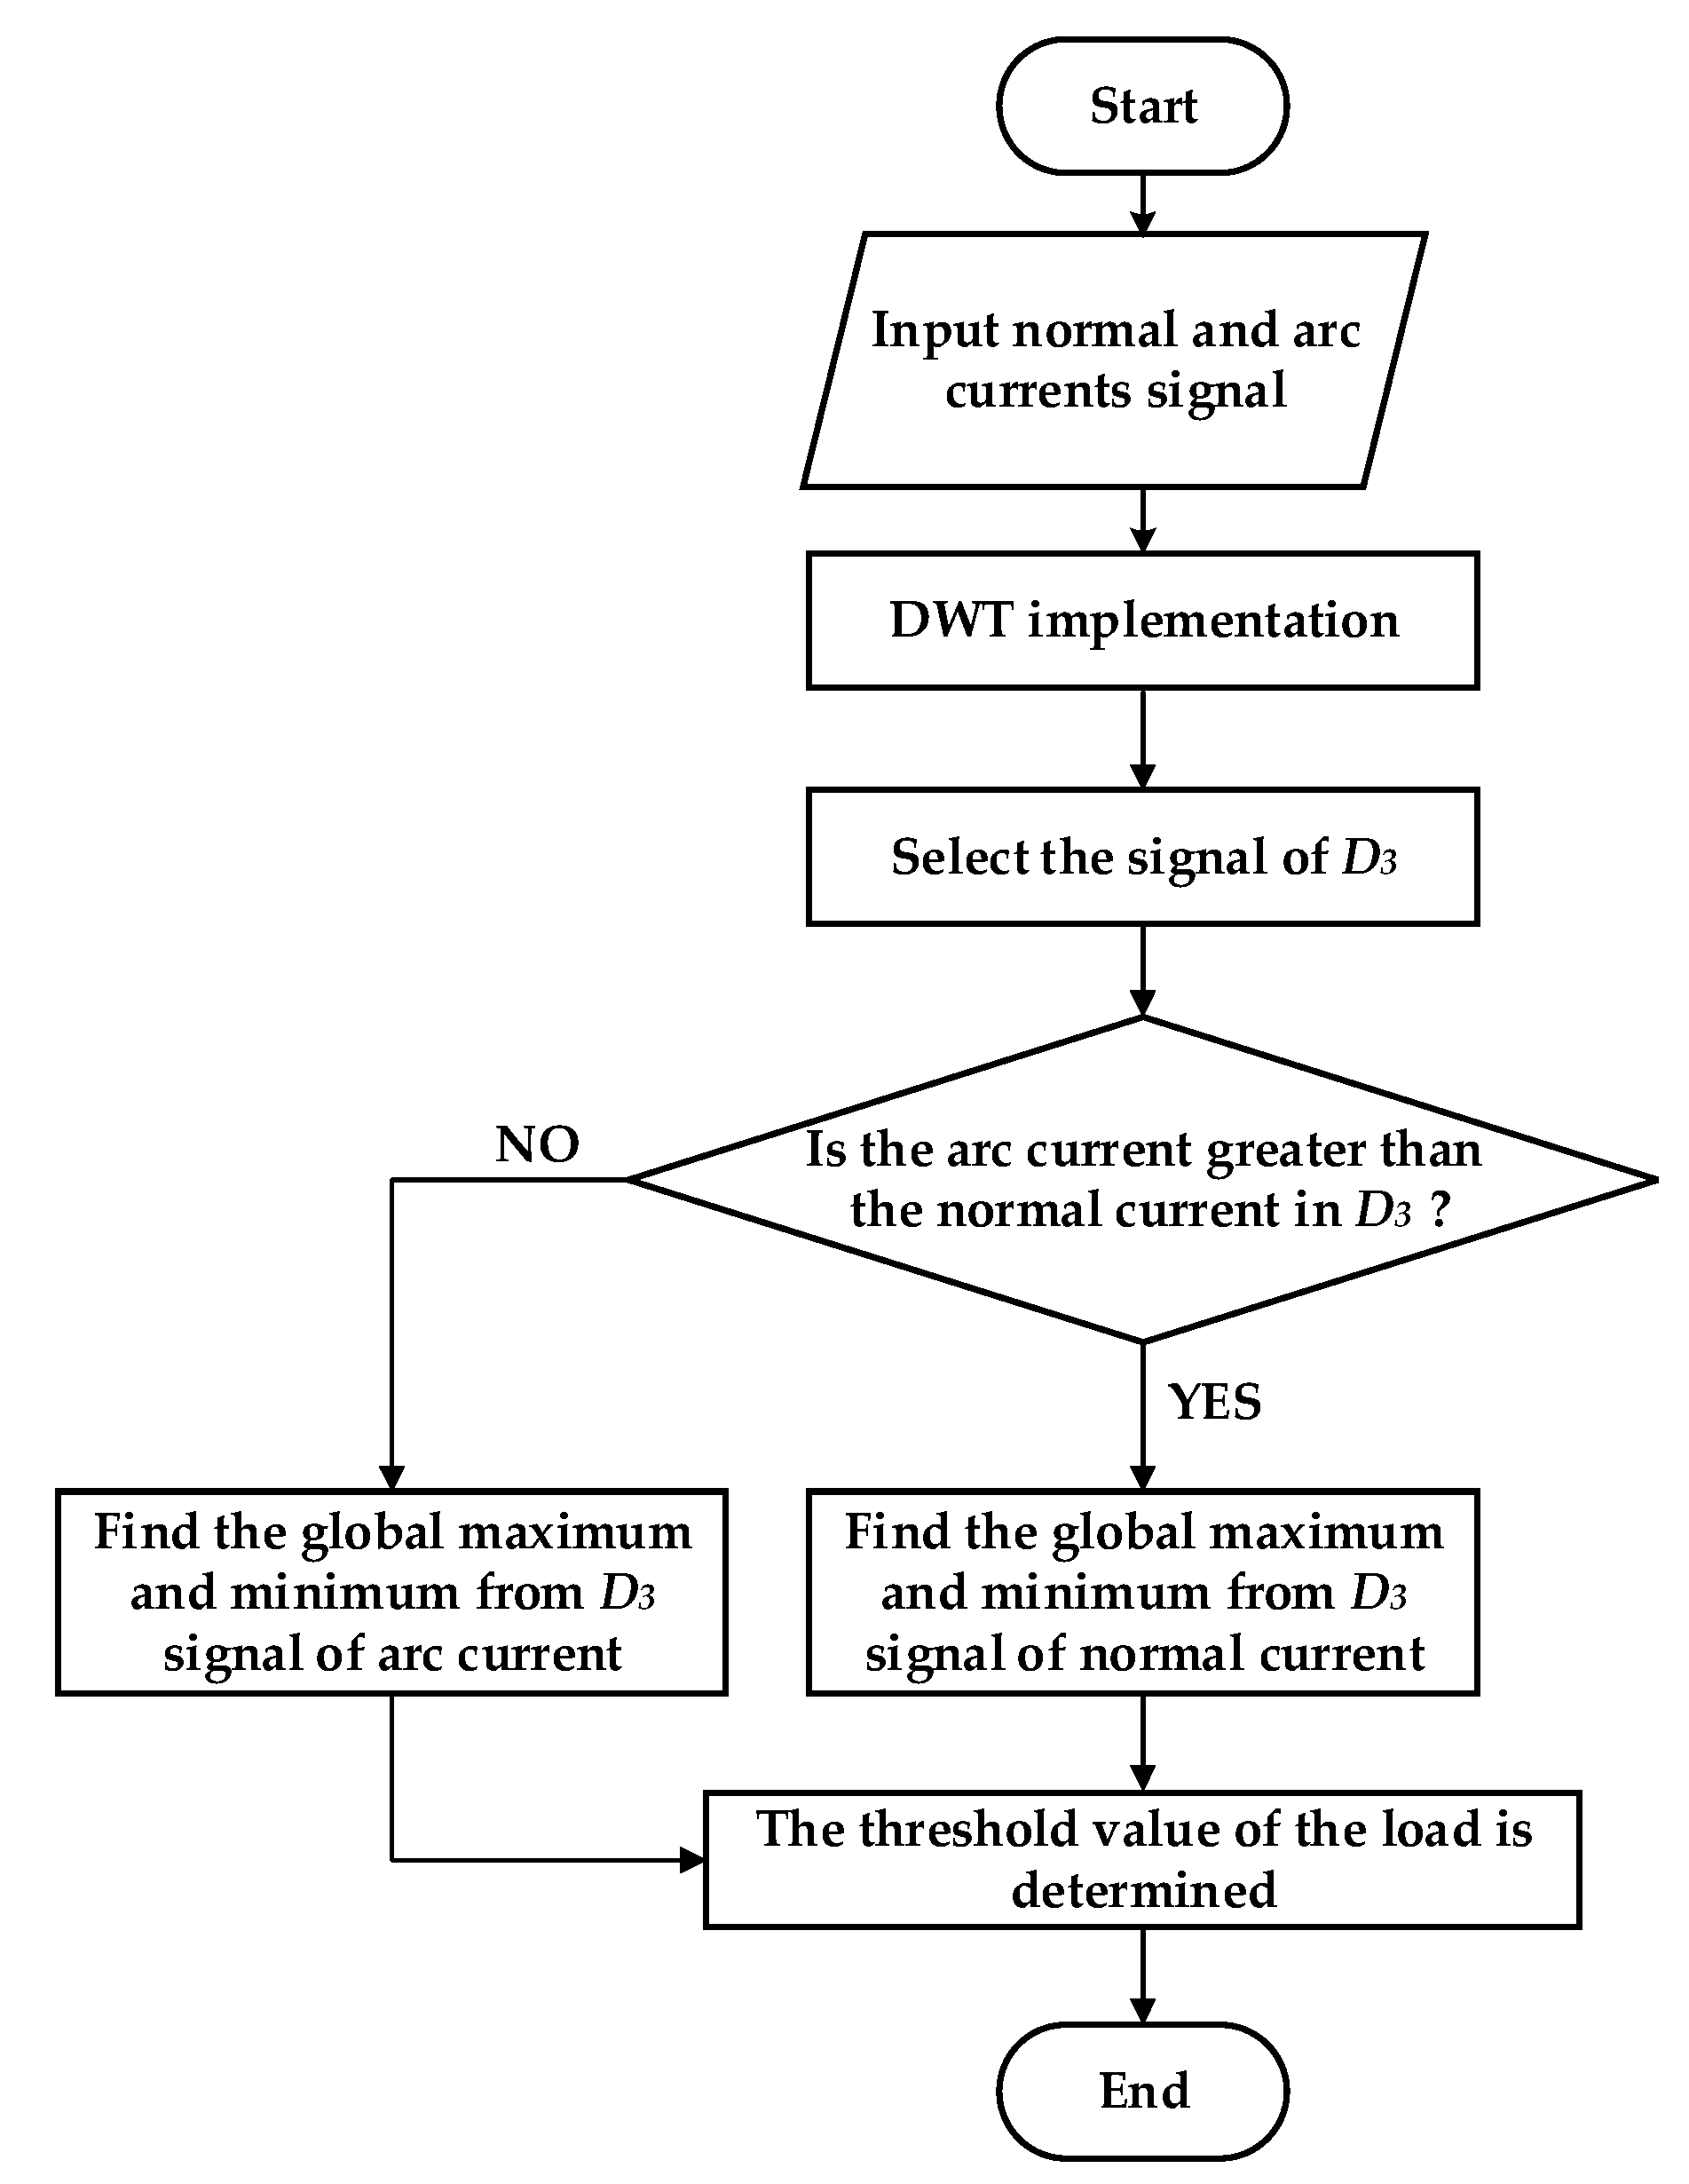
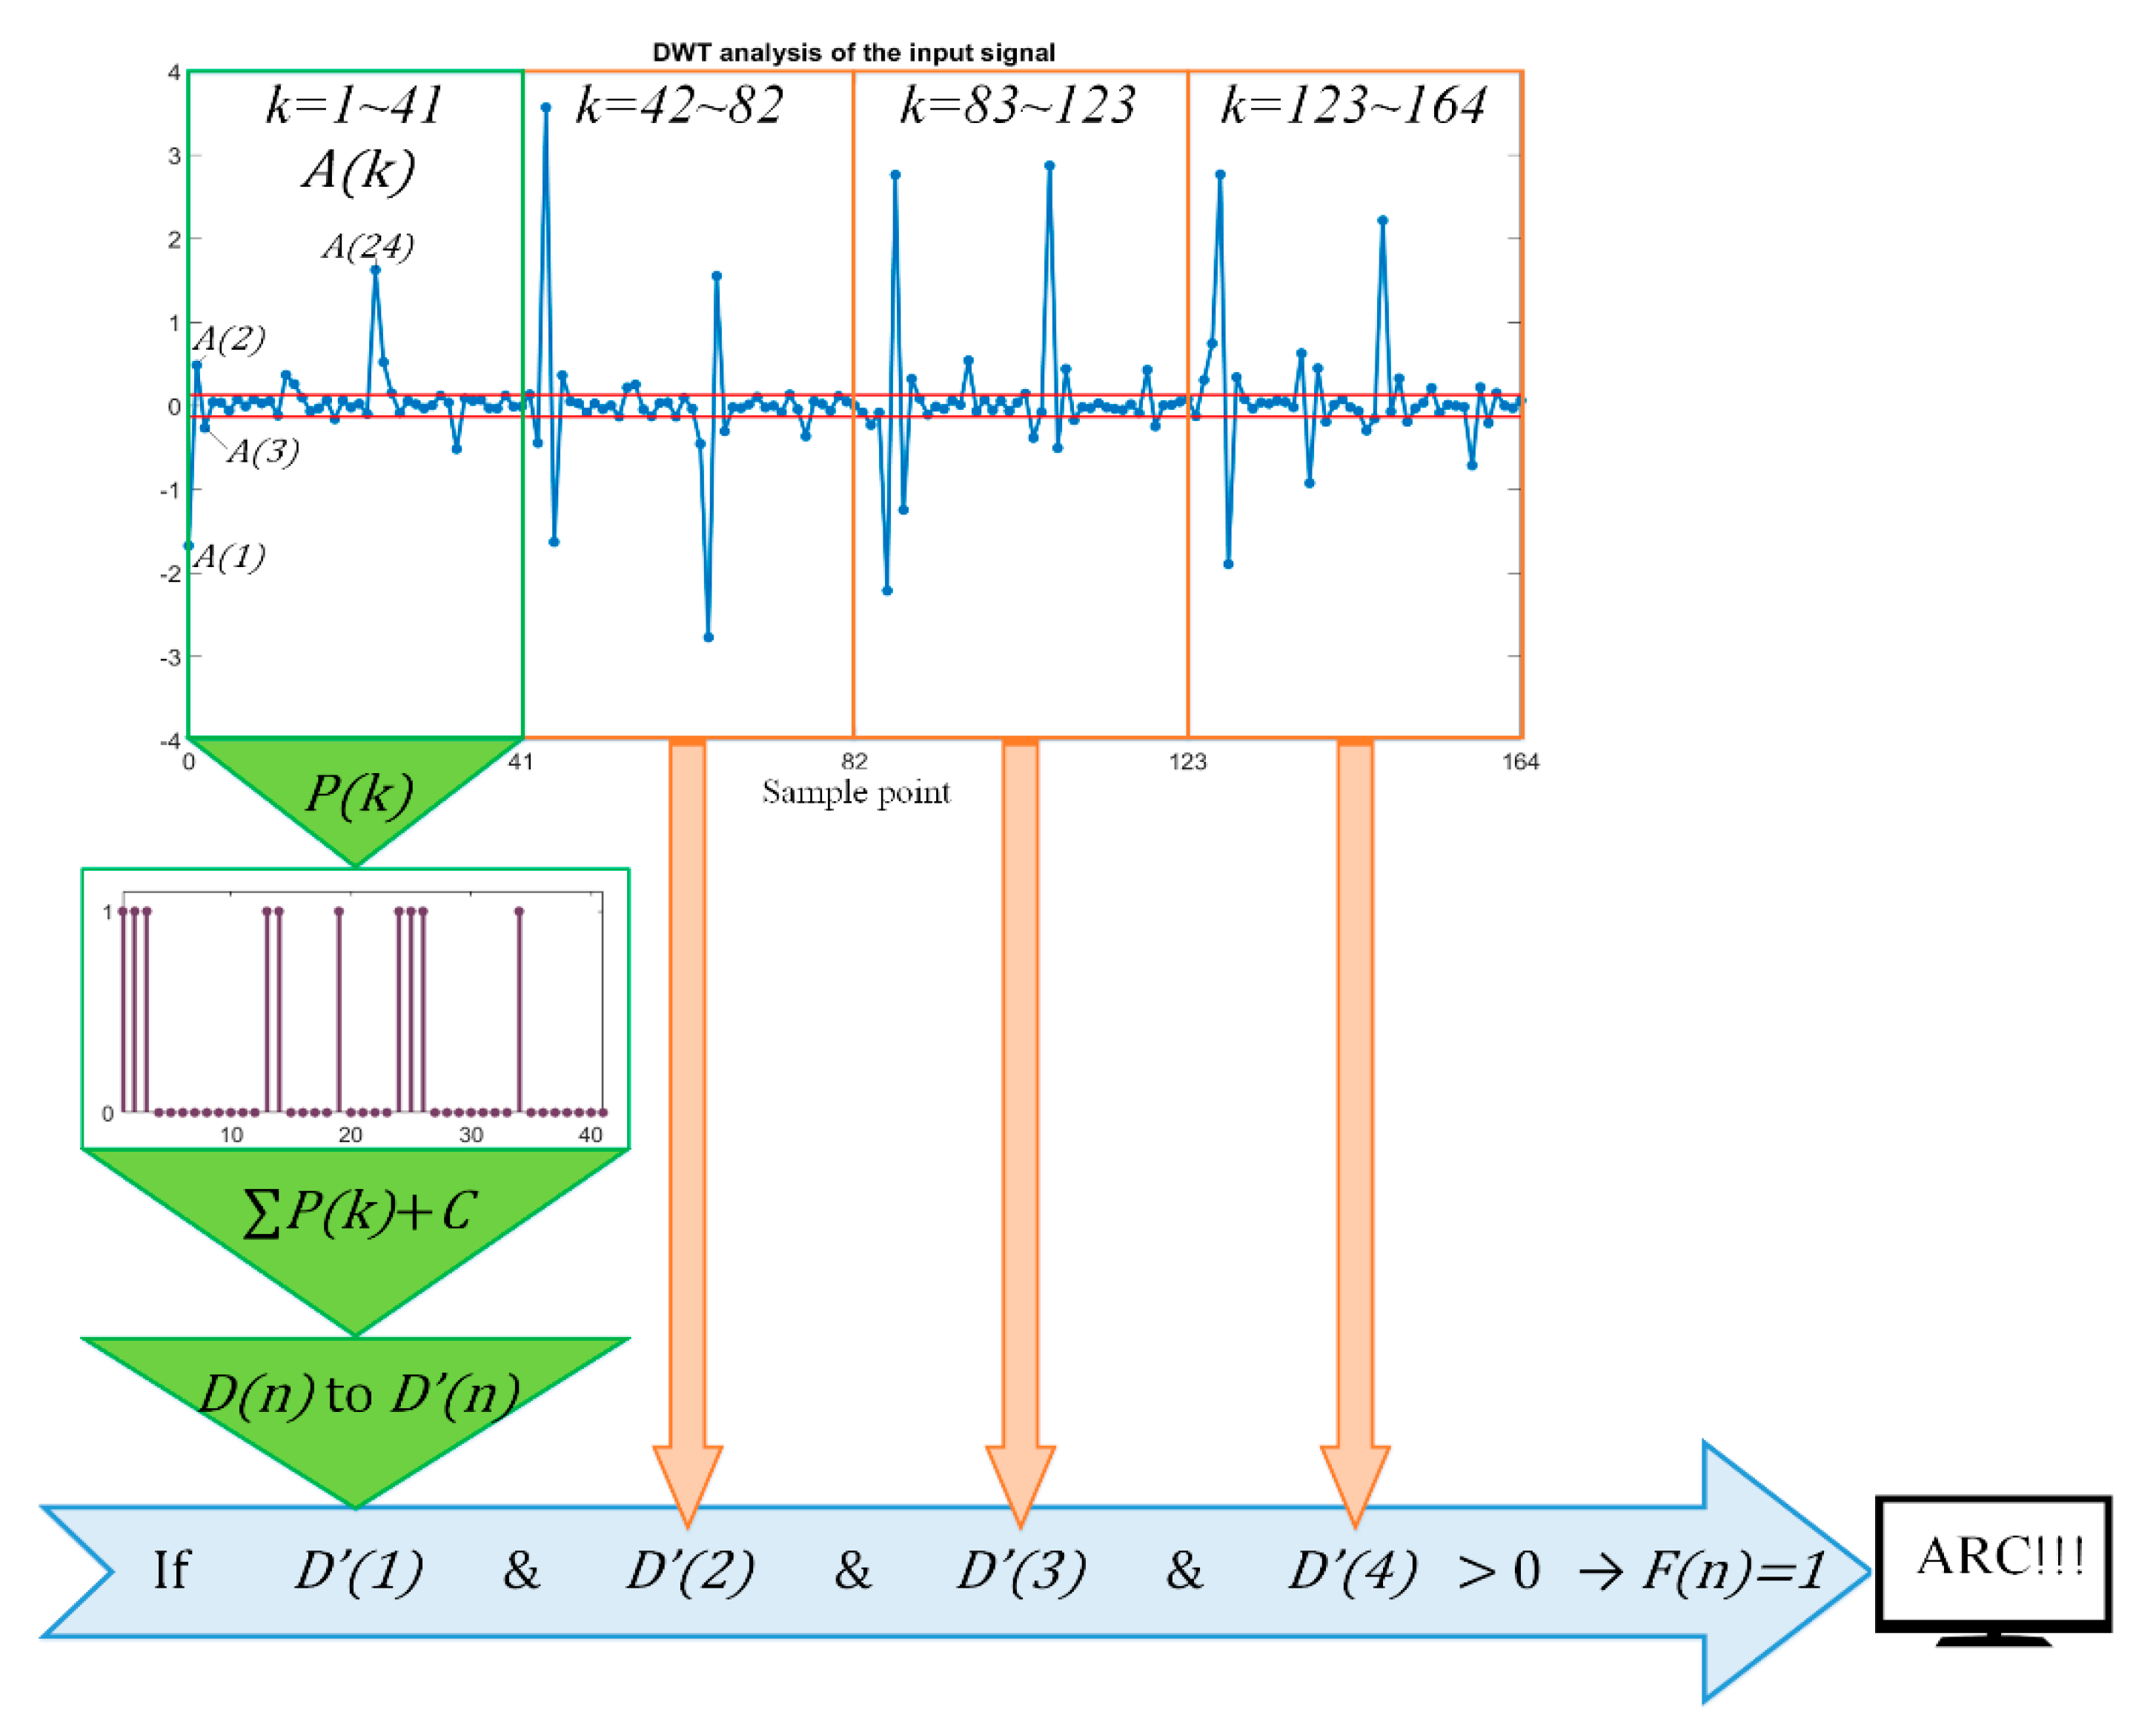
3.1. Discrete Wavelet Transform

The wavelet transform for a continuous signal x(t) is generally presented in (1). Ψ t is the mother wavelet function, where Daubechies 4 is used in this study due to its adequate performance in power quality signal processing [25]; a is the scaling factor, and b is the shifting factor.
Ψ a , b t = 1 a Ψ t b a ,   a   , b   ϵ   R   , a > 0
Discretization of the scaling factor a and the shifting factor b in (1), and according to dyadic wavelet transform, let a = 2m and b = n2m. Equation (1) can be rewritten as
Ψ a , b t = 1 2 m Ψ t 2 m n
where m and n are two integers that permit controlling the dilation and the position of the wavelet signals and help determine a and b in (1). Meanwhile, m dominates the layer number of DWT and n refers to the signal length at each different layer. In (2), DWT can further be presented as
D W T f m , n = 1 2 m k f k Ψ k 2 m n
where D W T f m , n is the DWT coefficient of signal f (k), m and n are the same as those in (2), and k is also the integer operation number.
In the frequency domain, signal analyzed by DWT has the corresponding bandwidth to the different layer. The sampling frequency used in the measurements of this study is 20 kHz. According to the Nyquist theorem, the analytic bandwidth of the input current signal may be located at 0 kHz to10 kHz. In addition, based on the measurements, it is found that the line currents during arc fault from various electric appliances often includes a high frequency (above 1 kHz) component. To let the analysis be under an applicable frequency range, the three layers of the DWT in Figure 8 are used in this paper. With the filter property, DWT can separate a signal into low frequency and high frequency components by decomposition mechanism in every layer; meanwhile, the decomposed high frequency signal from layer 3 (D3) is used for the threshold value strategy design.

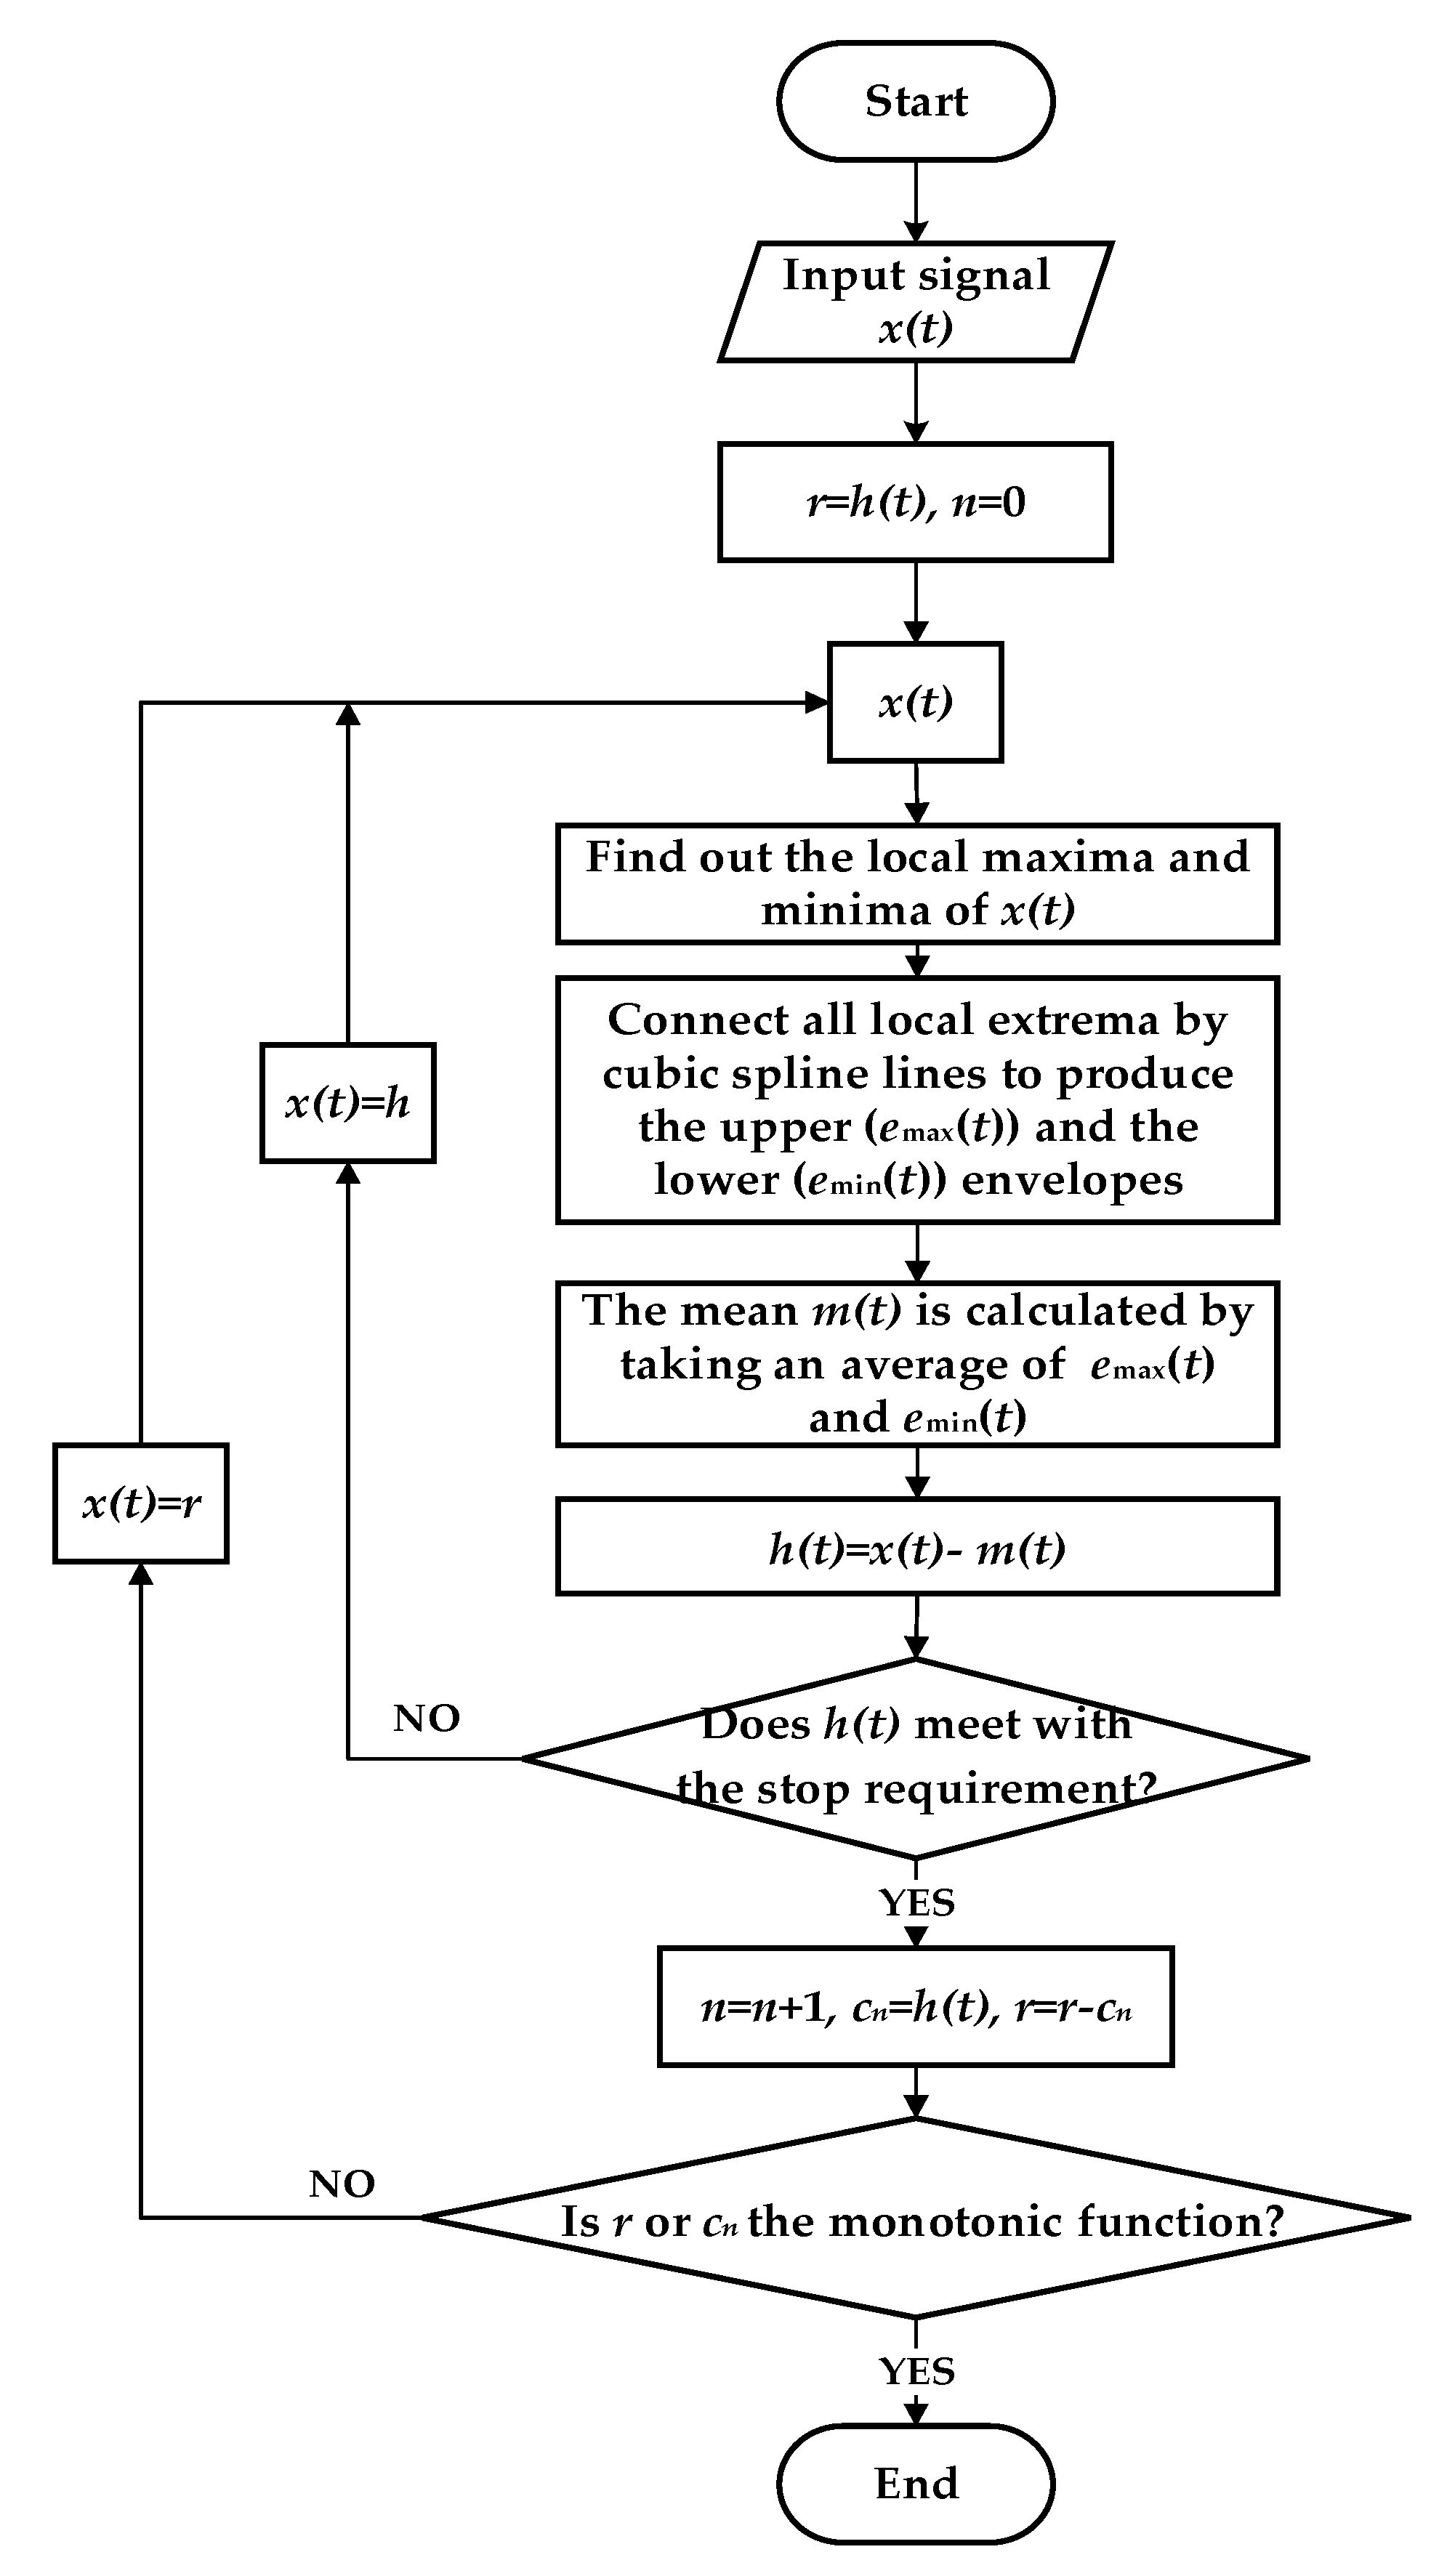
3.2. Empirical Mode Decomposition

EMD originates from an adaptive signal time-frequency analysis method called Hilbert–Huang transform (HHT) [26]. It decomposes a complex signal into a series of IMF and a final residual component. The basic rule for the decomposition is to identify the oscillation property of the signal locally, i.e., to observe the interwoven local maxima and minima among a signal waveform by cubic spline interpolation. The upper and the lower envelopes may be found in this interpolation, and a mean envelop can be determined. Then, a shifting process makes a subtraction between a mean envelop signal and the original signal until an IMF element is found. Residual components from this process will be used to determine the other IMFs by the same mechanism. One IMF function must satisfy following two requirements:
  • For all datasets of the signal, the number of extrema and the number of zero-crossings must be the same or differ at most by one;
  • Within any finite data interval, the mean value of the envelope must be zero.
Equation (4) gives the representation for EMD:
  x t = k = 1 n c k t + r n t
where x(t) is input signal, c is the kth IMF of the signal, and r is the residual component. The flowchart for the implementation of EMD method is shown in Figure 9:
  • Step 1: Find out the local maxima and minima of x(t);
  • Step 2: Connect all local extrema by cubic spline lines to produce the upper e m a x t   and the lower e m i n t   envelopes, respectively;
  • Step 3: Take an average of e m a x t and e m i n t   in the previous step, then obtain the mean envelop, m t = e m a x t + e m i n t 2 ;
  • Step 4: By shifting process, calculate the difference between input signal and mean envelop by x(t) − m(t) = h(t);
  • Step 5: When h(t) meets with the stop requirement, let c = h(t), where c is designated as IMF1. If the stop requirement is not met, the shifting process will continue until an IMF be found;
  • Step 6: Calculate the residual component by input signal and the IMF1, i.e., x(t) − c = r;
  • Step 7: If c or r is the monotonic function, the EMD process is finished. Otherwise, repeat the above steps until all IMFs are found.
According to the assessments of the lab experiments, the elements of IMF2 and IMF 3 are respectively used in this paper for machine load and the loads other than machine.

3.3. Dynamic Time Warping

DTW is a kind of nonlinear warping technique for distance (also called similarity) measurement between two time series sequences [27]. The minimum distance between two sequences indicates their similarity. In conventional Euclidean distance calculation, it cannot work to deal with the problem of the sequences with different lengths, but DTW is a method which compresses or expands the sequences in time so as to be applied to solve this limitation. When using DTW, the cumulative distance value is often as an indicator to determine the measurement of similarity. The implementation of DTW includes the following steps:
  • Step 1: Suppose two time series data i and j with time lengths m and n are collected from normal and abnormal line currents, as shown in (5) and (6). The relative (or so-called local) distance d(i, j) between the points of two sequences is calculated by (7); meanwhile, k = 1, 2, …., K is the corresponding operation number to finish the local distance calculation among data i and j.
i = i 1 , i 2 , , i m
j = j 1 , j 2 , , j n
d i , j = k = 1 K   i k j k 2
  • Step 2: From the calculations in Step 1, build a point-to-point distance table of two data sequences. The cumulative recursive function in (8) is applied to receive d(i, j) and repeatedly makes calculations until all time points in recursive function are completed. Then, another cumulative distance table is built for tracking the optimal warping path. The minimum cumulated distance D (i, j) for data among (1, 1) to (i, j) range can be obtained by (8). For the decision of each warping path, only the current three nearest data sources are concerned. Select the minimum cumulative distance value and add it with the new point-to-point distance value, then to obtain the updated cumulative distance table.
  • Step 3: The following constraints must be satisfied when using DTW:
    (a)
    Boundary constraint: let (i1, j1) = (1, 1) and (ik, jk) = (m, n). These are typical for “anchored beginning and end”.
    (b)
    Local constraint: for any given node (i, j) in the path, the possible input nodes are limited to the ranges of (i−1, j), (i, j−1), and (i−1, j−1). The warping path can be thus guaranteed to be monotonically non-decreasing in its first and second arguments by this constraint. In addition, for any given value in i, it should be possible to find at least one corresponding value in j, and vice versa.
D i , j = d i , j + min D i 1 , j 1 D i 1 , j D i , j 1
Finally, a best warping, minimum cumulative distance is observed.

3.4. Threshold Value Design Strategy

The purpose of setting a threshold value is to identify the normal and arc fault currents of the load. Concepts for the threshold value design of DWT and EMD are shown in Figure 10 and Figure 11, respectively. For these strategies, the current signal from normal operation and arc fault are first input. Then, DWT or EMD methods are separately implemented to obtain the components in frequency domain. Meanwhile, the high frequency component in D3 layer is collected by DWT, and IMF2 and IMF3 components for different loads are collected by EMD. After that, according to the D3 frequency signal or IMF element, judge if the arc fault current is higher than normal current. If yes, find the global maximum and minimum values of the D3 frequency or IMF element in normal current as the threshold limitation. If the arc fault current is less than the normal current, find the same extreme values from the arc current as the threshold limitation.

3.5. Violation Check Strategy

Violation check is the last procedure for arc fault detection by the proposed method. The designed strategy is utilized to satisfy the UL 1699 requirement that defines the arc fault as four consecutive cycles of arc in 0.5 s. As an example of DWT, the concept of violation check strategy is shown in Figure 12. For the measurement data in this study, the sampling frequency is 20 kHz and the sampling time is 0.5 s. Therefore, one original dataset has 10,000 sample points in 30 cycles and each cycle has about 333 sample points. However, since three layer transform is used in DWT in this study, the sample points for each cycle are down to about 41 points. To calculate the violation energy of each point, Equation (9) is first applied to calculate how many data points exceed the threshold value limitations in Section 3.4. In (9), k is the sample point, A k is the input current signal from D3 frequency signal or IMF, and P k presents 1 or 0 depends on whether A k is violated or not. Then, the strategy is extended to use (8) to calculate the violation energy for each cycle. In (8), D n   is the accumulated violation energy for each cycle; meanwhile, a constant correction value C, from experimental experience, is added to enhance the detection flexibility. For easy identification, binary conversion is then used to transfer D n to D n . Finally, to find the conjunction of every four consecutive cycles by (10). AC series arc fault is finally detected when F(n) is 1 and vice versa. The same strategy is applied to the EMD method; the only difference is that the sample points for each cycle are return to 333 points.
  P k = 1 ,     i f   A k > t h r e s h o l d D W T 0 ,     i f   A k t h r e s h o l d D W T
D n = C + k = n 1 41 + 1 41 n P k
D n = 1 ,     i f   D n > 0 0 ,     i f   D n 0
F n   = 1 ,     n n + 3 D n > 0 0 ,   n n + 3 D n = 0

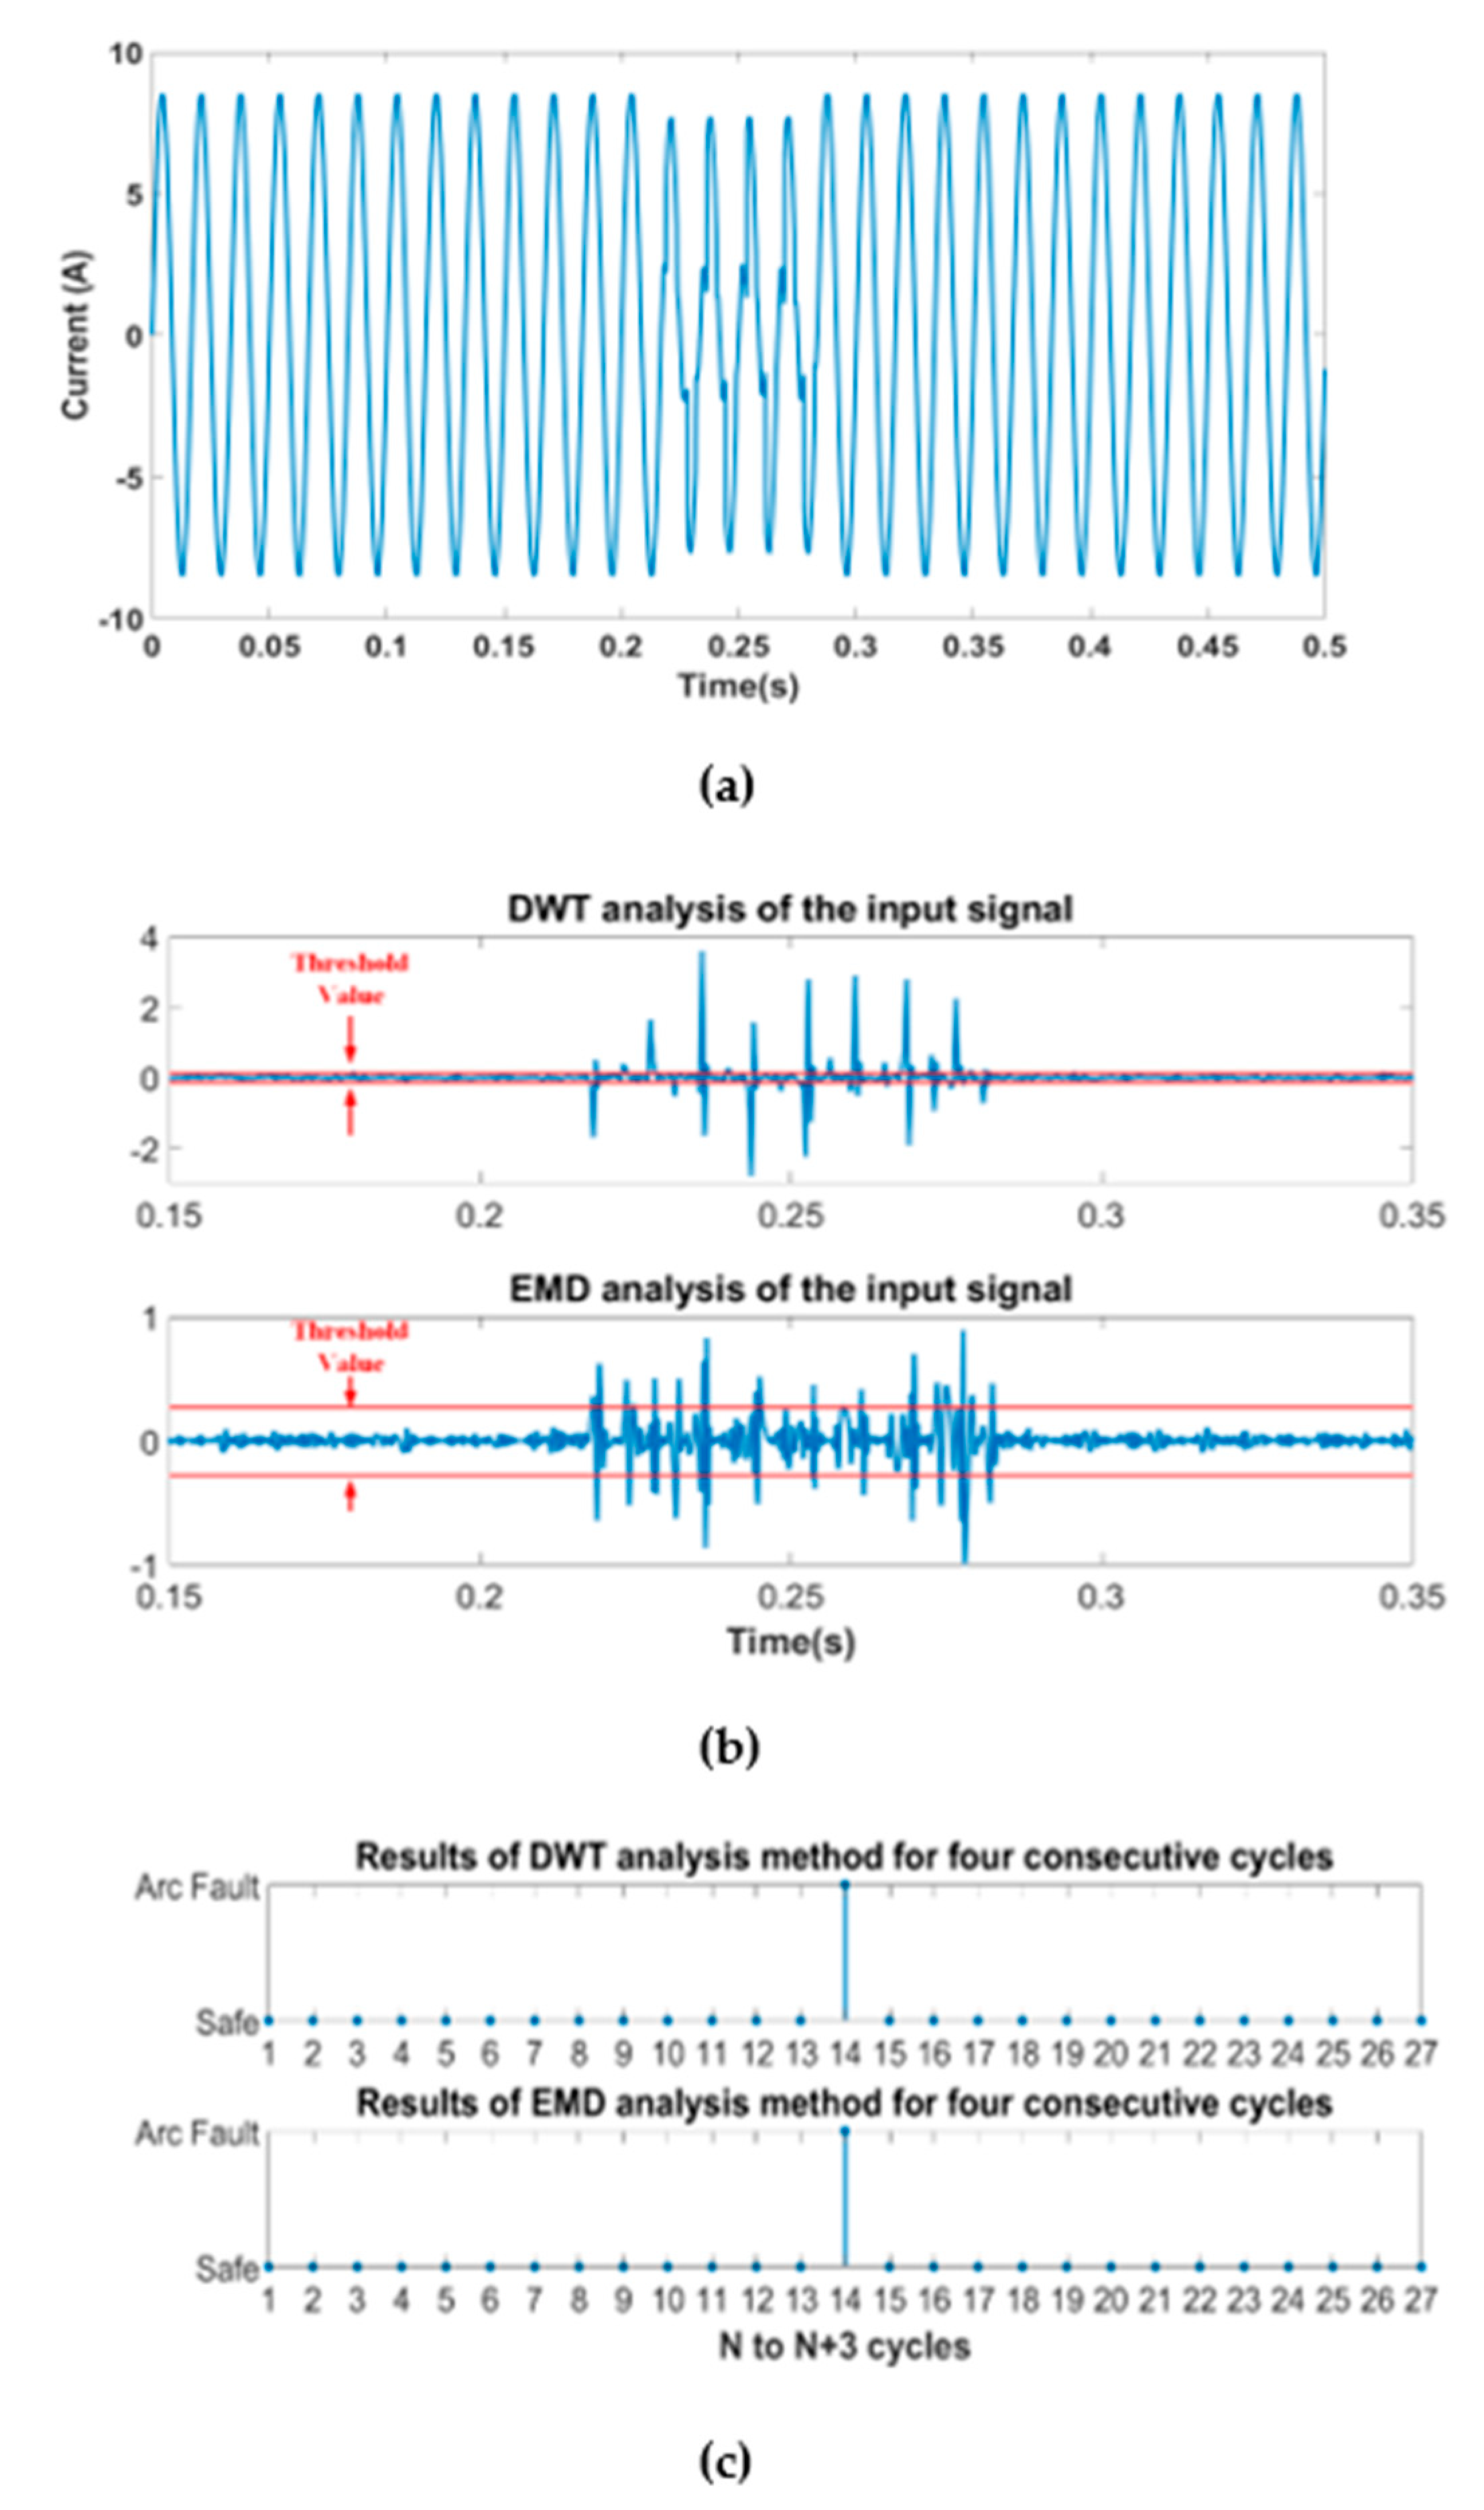
4. Testing and Validations

To verify the performance of the proposed hybrid approach, the detection results from four different load categories are considered in this Section, including a resistive load: electric oven; an inductive load: vacuum cleaner; nonlinear loads: several CFLs; and a mixed load: includes a number of CFLs and LED T5 tubes, an AC refrigerator motor, and a hair dryer. Table 1 shows the parameters used for different load categories in this paper. In addition, all the testing results are obtained and analyzed by the procedure shown in Figure 7. The result of each test is presented in three parts: (a) the input current signal; (b) signal analysis of DWT and EMD; (c) the detection result of each method.

4.1. Case 1: Results of Electric Oven Testing

Time domain current waveform of the electric oven is shown in Figure 13a. In Figure 13a, the current has experienced series arc fault at the time around 0.22 s to 0.28 s, and the current at the rest of the times represents the normal operation state. Through the analysis of using the DWT and EMD methods, the obvious variations on DWT and EMD signals appearing at the same arc fault time period of that in Figure 13a are captured, as shown in Figure 13b. It is found in Figure 13c, while applying the violation strategy in Section 3.4 to calculate these signals’ variation, a series arc fault is detected at the 14th cycle by both the DWT and EMD methods. The DTW method does not activate in this case since the DWT and EMD methods provide the same detection results.

4.2. Case 2: Results of Vacuum Cleaner Testing

Arc fault detection results of the vacuum cleaner are shown in Figure 14. Figure 14a,b presents the input current waveform and signal analysis of DWT and EMD, respectively. In Figure 14c, it is found that DWT does not detect the arc fault, although a part of signal variation higher than threshold value can be visually observed in Figure 14b, but its fault index presents as false after statistic calculation. This invalid detection result from DWT is thought to be caused by the waveforms with too-similar features between arc fault and normal currents. For the EMD method, arc fault can be effectively detected. Due to a conflict occurring in the results of the DWT and EMD methods, the DTW method in this case is activated, and it provides the same detection result as that in EMD, i.e., finding the arc fault occurring at the 14th cycle time, as in Figure 14c.

4.3. Case 3: Results of Fluorescent Lamps Testing

Because the single fluorescent lamp has lower power, 14 fluorescent lamps are connected in parallel and are thus adopted for testing. To observe the time domain current waveform in Figure 15a, the current from the fluorescent lamp load presents higher nonlinear distortions than the electric oven and the vacuum cleaner. According to such a load property, it can be found from the DWT and EMD analysis in Figure 15b that the signal variations of normal operation currents are higher than the currents during an arc fault period. Such signal features make the setting of a threshold value in Table 1 different from other loads. The detection result of this load testing is given in Figure 15c. Both DWT and EMD methods detect the arc fault at the same time period and the DTW method does not need to be activated in this case.

4.4. Case 4: Results of Mixed load Testing

In this case, the combination of 14 fluorescent lamps, 24 LED T5 tubes, one AC refrigerator motor, and one hair dryer with the ratings in Table 1 and connected in parallel is formed as a mixed load for testing. Figure 16a shows the time domain current waveform of this mixed load. DWT and EMD signal analysis is given in Figure 16b. Similar to the case in Section 4.1, the obvious signal variations appear at the same arc fault time period of that in Figure 16a. While applying the statistic strategy to calculate these signal variations, a series arc fault can be detected by both the DWT and EMD methods; therefore, the DTW method also does not need to be activated in this case.
To further verify the performance of the proposed detection approach in this paper, twelve different load categories are applied for testing. Twelve loads in Table 2 are categorized into heating, lighting, machine, and mixed types; meanwhile, the minimum power rating is 322 W of No. 6 and the maximum one is 1604 W of No. 11 mixed load, i.e., Case 4 in Section 4.4. The results of the detection validation of the proposed approach are presented in Table 2 as well. It is found that when individually using DWT or EMD methods for series arc fault detection, failed detections may happen under certain load types. For DWT, it failed at load No. 5 and No. 8, while series arc fault in loads No. 10 and 11 could not be detected by EMD. The reasons for these misjudgments are: (i) the signal features between normal and arc fault currents derived from DWT or EMD are not significantly obvious, and (ii) if arc fault currents for some of the lighting loads are rapidly changed, it may lead to a prolonged shoulder phenomenon and further affect the calculation of threshold values. However, the addition of DTW in the proposed approach compensates for the failure condition of only using DWT or EMD. DTW may well be activated under the above-mentioned misjudgment cases and effectively finish the series arc fault detections.
Table 3 gives comparisons between the proposed approach and some of the papers surveyed in the Introduction section in the issue of arc fault detection. In fact, the results from these methods have been validated under different simulated/on-site experimental scenarios and each of them has individual considerations on design. To use a quantitative result to compare these methods may not be objective; therefore, in addition to the target accuracy of each paper, method framework, testing load types, critical elements in methods, and applications have been summarized in Table 3. It can be observed that the proposed approach, by being tested in various load categories, is more general than some of the other papers. Based on the implementation and result analysis, it is also concluded that the proposed approach can provide useful detection with lower method complexity.

5. Conclusions

Up to the present, arc fault problems have existed in electric environments in various forms. Wherever electric power is available, different types of arc faults can easily be encountered either in household, industrial, and commercial power, or from endogenous equipment operation characteristics. When arc faults are unintentionally caused, they often pose serious threats to the life of operation facilities, building assets, and personnel safety. Consequently, the issue of arc fault protection is currently still concerning; meanwhile, the most critical is the development of detection technology. A hybrid approach that consists of discrete wavelet transform, empirical mode decomposition, and dynamic time warping in three different time and frequency domain techniques is therefore proposed in this paper. According to the assessments from laboratory experiments, the proposed approach is currently dedicated to the low-voltage distribution network (110 V and 60Hz) with a line current of less than 3 amperes or rating power of the load less than 300 Watts. To follow the requirements of the UL 1699 standards, current signals with specific cycles are captured as indictors in the proposed approach for detections. Various electric appliance loads with different ratings are used for testing. The testing results show that the proposed approach can effectively operate on AC series arc fault detections in a flexible and lower-complexity manner. Extended applications for the proposed approach in this study can apply to various power quality disturbance detections such as harmonics and flickers, and arc fault detections in renewable energy systems such as solar PV power generations. Planned future works based on this paper will focus on the investigation of more intelligent detection techniques for various arc fault types or for high-power electric system applications, and carrying out the proposed approach in real hardware design.

Author Contributions

All authors were involved throughout the study of this research work. Individual contributions include: conceptualization and methodology, Y.-J.L. and C.-I.C.; software, W.-C.F.; validation, analysis, and investigation, Y.-J.L. and W.-C.F.; writing—original draft preparation and editing Y.-J.L. and W.-C.F.; writing—review, Y.-D.L., C.-C.C. and Y.-F.C.; supervision, Y.-J.L. All authors have read and agreed to the published version of the manuscript.

Funding

This research was funded by the Institute of Nuclear Energy Research, Taiwan, R.O.C., grant number 111A013 (111_2001_02_20_01); and by the Ministry of Science and Technology, Taiwan, R.O.C., grant number MOST 110-2221-E-194-031-MY2.

Data Availability Statement

Not applicable.

Conflicts of Interest

The authors declare no conflict of interest.

References

  1. Wu, Y.; Song, Z.; Wang, J. A method for parallel arc fault detection and identification. In Proceedings of the 2nd International Conference on Computer Science and Electronics Engineering, Hangzhou, China, 22–23 March 2013. [Google Scholar]
  2. UL standard for safety: Arc-Fault Circuit Interrupters, UL 1699, 3rd ed.; Underwriter Laboratories Inc.: Northbrook, IL, USA, 2017.
  3. NFPA70, National Electrical Code, 2017.
  4. Artale, G.; Cataliotti, A.; Cosentino, V.; Di Cara, D.; Nuccio, S.; Tinè, G. Arc fault detection method based on CZT low-frequency harmonic current analysis. IEEE Trans. Instrum. Meas. 2017, 66, 888–896. [Google Scholar] [CrossRef]
  5. Lu, S.; Zhang, D.; Phung, T. Arcing fault detection in the scenario with renewable energy generation. In Proceedings of the 43rd Annual Conference of the IEEE Industrial Electronics Society, Beijing, China, 29 October–1 November 2017. [Google Scholar]
  6. Zhao, Y.; Zhang, X.; Dong, Y.; Li, W. Characteristics analysis and detection of AC arc fault in SSPC based on wavelet transform. In Proceedings of the IEEE International Conference on Aircraft Utility Systems, Beijing, China, 10–12 October 2016. [Google Scholar]
  7. Zeng, K.; Xing, L.; Zhang, Y.; Wang, L. Characteristics analysis of AC arc fault in time and frequency domain. In Proceedings of the IEEE Prognostics and System Health Management Conference, Harbin, China, 9–12 July 2016. [Google Scholar]
  8. Müller, P.; Tenbohlen, S.; Maier, R.; Anheuser, M. Characteristics of series and parallel low current arc faults in the time and frequency domain. In Proceedings of the IEEE Holm Conference on Electrical Contacts, Charleston, SC, USA, 4–7 October 2010. [Google Scholar]
  9. Gregory, G.D.; Wong, K.; Dvorak, R.F. More about arc-fault circuit interrupters. IEEE Trans. Ind. Appl. 2004, 40, 1006–1011. [Google Scholar] [CrossRef]
  10. Wang, Y.; Zhang, F.; Zhang, X.; Zhang, S. Series AC arc fault detection method based on hybrid time and frequency analysis and fully-connected neural network. IEEE Trans. Ind. Inform. 2018, 15, 6210–6219. [Google Scholar] [CrossRef]
  11. Kim, J.C.; Neacsu, D.O.; Lehman, B.; Ball, R. Series AC arc fault detection using only voltage waveforms. In Proceedings of the IEEE Applied Power Electronics Conference and Exposition, Anaheim, CA, USA, 17–21 March 2019. [Google Scholar]
  12. Sritrai, E.; Kittiratsatcha, S.; Polmai, S. Low voltage series arc fault detection using Rogowski coil. In Proceedings of the IEEE International Conference on Engineering, Applied Sciences, and Technology, Phuket, Thailand, 4–7 July 2018. [Google Scholar]
  13. Cai, X.; Wang, L.; Sun, Q.; Meng, Z. AC arc fault detection based on mahalanobis distance. In Proceedings of the IEEE 15th International Power Electronics and Motion Control Conference, Novi Sad, Serbia, 6 September 2012. [Google Scholar]
  14. Wu, C.J.; Liu, Y.W. Smart detection technology of serial arc fault on low-voltage indoor power lines. Electr. Power Energy Syst. 2015, 69, 391–398. [Google Scholar] [CrossRef]
  15. Qj, O.; Jovanovic, S.; Lezama, J.; Schweitizer, P. Discrete wavelet transform optimal parameters estimation for arc fault detection in low-voltage residential power networks. Electr. Power Syst. Res. 2017, 143, 130–139. [Google Scholar]
  16. Li, W.; He, K.; Liu, W.; Zhang, X.; Dong, Y. A fast arc fault detection method for AC solid state power controllers in MEA. Chin. J. Aeronaut. 2018, 31, 1119–1129. [Google Scholar] [CrossRef]
  17. Saeed, E.A.; Abdulhassan, K.M.; Al-Atbee, O.Y.K. Series and parallel arc fault detection in electrical buildings based on discrete wavelet theory. Iraqi J. Electr. Electron. Eng. 2021, 17, 94–101. [Google Scholar] [CrossRef]
  18. Yu, Q.; Hu, Y.; Yang, Y. Identification method for series arc faults based on wavelet transform and deep neural network. Energies 2020, 13, 142. [Google Scholar] [CrossRef] [Green Version]
  19. Lala, H.; Karmakar, S. Classification of arc fault between broken conductor and high-impedance surface: An empirical mode decomposition and stockwell transform-based approach. IET Gener. Transm. Distrib. 2020, 14, 5277–5286. [Google Scholar] [CrossRef]
  20. Shang, T.; Wang, W.; Peng, J.; Xu, B.; Gao, H.; Zhai, G. Series arc fault identification based on complete ensemble empirical mode decomposition with adaotive noise and convolution neural network. Int. J. Metrol. Qual. Eng. 2022, 13, 11. [Google Scholar] [CrossRef]
  21. Lang, M.; Jones, K. Exposed to the arc flash hazard. IEEE Trans. Ind. Appl. 2015, 51, 51–61. [Google Scholar] [CrossRef]
  22. Muhammed Ajmal, C.N.; Venkata Raghavendra, I.; Naik, S.; Ray, A.; Krishnamoorthy, H.S. A modified hybrid DC circuit breaker with reduced arc for low voltage DC grids. IEEE Access 2021, 9, 132267–132277. [Google Scholar] [CrossRef]
  23. Gregory, G.D.; Scott, G.W. The arc-fault circuit interrupter: An emerging product. IEEE Trans. Ind. Appl. 1998, 34, 928–933. [Google Scholar] [CrossRef]
  24. Müller, P.; Tenbohlen, S.; Maier, R.; Anheuser, M. Artificial low current arc fault for pattern recognition in low voltage switchgear. In Proceedings of the IEEE Holm Conference on Electrical Contacts, Vancouver, BC, Canada, 14–16 September 2009. [Google Scholar]
  25. Brito, N.S.D.; Souza, B.A.; Pires, F.A.C. Daubechies wavelets in quality of electrical power. In Proceedings of the IEEE International Conference on Harmonics and Quality of Power, Athens, Greece, 14–16 October 1998. [Google Scholar]
  26. Plamanescu, R.; Dumitrescu, A.; Albu, M.; Suryanarayanan, S. A hybrid Hilbert-Huang method for monitoring distorted time-varying waveforms. Energies 2021, 14, 1864. [Google Scholar] [CrossRef]
  27. He, Y.; Zhang, X.; Wu, W.; Zhang, J.; Bai, W.; Guo, A.; Chen, Y. Faulty line selection method based on comprehensive dynamic time warping distance in a flexible grounding system. Energies 2022, 15, 471. [Google Scholar] [CrossRef]
Figure 1. Voltage and current waveforms of series arc fault.
Energies 16 01256 g001
Figure 2. Experimental setup for AC series fault measurements.
Energies 16 01256 g002
Figure 3. Measurement results for toaster (a) normal state, (b) arc fault state.
Energies 16 01256 g003
Figure 4. Measurement results for spiral energy saving bulbs (a) normal state, (b) arc fault state.
Energies 16 01256 g004
Figure 5. Measurement results for a vacuum cleaner (a) normal state, (b) arc fault state.
Energies 16 01256 g005
Figure 6. Measurement results for mixed loads (a) normal state, (b) arc fault state.
Energies 16 01256 g006
Figure 7. Flowchart of the proposed hybrid approach.
Energies 16 01256 g007
Figure 8. The analytic bandwidth of 3-layer DWT.
Energies 16 01256 g008
Figure 9. Flowchart for EMD method.
Energies 16 01256 g009
Figure 10. Setting of the threshold for the DWT.
Energies 16 01256 g010
Figure 11. Setting of the threshold for the EMD.
Energies 16 01256 g011
Figure 12. Violation check strategy.
Energies 16 01256 g012
Figure 13. Series arc fault detection results of the electric oven (a) input current signal, (b) DWT and EMD analysis signals, and (c) the detection result of each method.
Energies 16 01256 g013
Figure 14. Series arc fault detection results of the vacuum cleaner load (a) input current signal, (b) DWT and EMD analysis signals, and (c) the detection result of each method.
Energies 16 01256 g014
Figure 15. Series arc fault detection results of the fluorescent lamps (a) input current signal, (b) DWT and EMD analysis signal, and (c) the detection result of each method.
Energies 16 01256 g015
Figure 16. Series arc fault detection results of the mixed load (a) input current signal (b) DWT and EMD analysis signals, and (c) the detection result of each method.
Energies 16 01256 g016
Table 1. Parameters of different load categories used in testing.
Load CategoryRatingDWT
Range of Threshold Value
EMD
Range of Threshold
Value
Electric oven700 W0.1262~−0.13520.1408~−0.1422
Vacuum cleaner500 W0.5259~−0.52000.2300~−0.2400
CFLs *322 W >0.3560 or <−0.3967 >0.2091 or <−0.2053
Mixed load **1604 W 1.4736~−1.59276.3004~−6.7665
*: it consists of 14 CFLs (23 W/per lamp). **: it consists of 24 LED tubes (18 W/per tube), 14 CFLs (23 W/per lamp), one 250W AC motor, and one 600W hair dryer.
Table 2. Detection results from more various load categories.
Load
Types
No.Power
Rating
Load
Elements
Only
DWT
Only
EMD
Proposed Approach
Heating Load1 (Case 1)
2
3
700 W
600 W
650 W
1 Electric oven
1 Electric pot
1 Toaster
O
O
O
O
O
O
O
O
O
Lighting Load4 (Case 3)
5
6
432 W
360 W
322 W
24 LED T5 tubes a
10 Fluorescent tubes b
14 CFLs c
O
F
O
O
O
O
O
O
O
Machine Load7
8 (Case 2)
9
420 W
500 W
500 W
6 Electric fans
1 Vacuum cleaner
RF d + RL e
O
F
O
O
O
O
O
O
O
Mixed Load10
11 (Case 4)
12
1065 W
1604W
1465 W
No. 1 + No. 4 + No. 9
No. 4 + No. 6 + RF + HD f
5 CFLs + No. 8 + RF + HD
O
O
O
F
O
F
O
O
O
a: 18 W/per tube; b: 36 W/per tube; c: 23 W/per lamp; d RF: one 250 W refrigerator motor; e RL: one 250 W resistance; f HD: one 600 W hair dryer; O: successful detection; F: failed detection.
Table 3. Comparisons of different method applications.
Method
Type
PaperFrameworkTesting
Load
Critical
Element
Applications
DWT[14]RBFNN+
DWT
Household loadsDb10 mother wavelet and 3-layerIndoor low-voltage power lines series arc fault detection
[15]DWTResistive, inductive, and dimmer loadsVarious mother wavelets and layersDWT parameters estimation for arc fault detection in residential power networks
[16]FFT+
DWT
Adjustable loadDb10 mother wavelet and 9-layer Arc fault detection for SSPC in electric aircraft system
[17]DWTMathematic arc model with resistance componentDb2 mother wavelet and 3-layerApplied DWT to energy-balanced series and parallel arc models
[18]DNN+
DWT
Filament lamp, inductance coil, and TVSymplets8 (Sym8) and 5-layerCombines DWT and DNN models for series arc fault identification
EMD[19]EMD+
ST
High-voltage facilities with different conductors and medium surfacesIMF1~IMF9To deal with the high-impedance arc fault classification problem
[20]EMD+
CNN
Heater, induction cooker, computer, microwave oven, and vacuum cleanerIMF1~IMF8Series arc fault identification for residential power networks
Proposed-DWT+
EMD+
DTW
As that in Table 2Db4 mother wavelet, 3-layer, IMF2 and IMF3A hybrid approach for low-voltage series arc fault detection
Disclaimer/Publisher’s Note: The statements, opinions and data contained in all publications are solely those of the individual author(s) and contributor(s) and not of MDPI and/or the editor(s). MDPI and/or the editor(s) disclaim responsibility for any injury to people or property resulting from any ideas, methods, instructions or products referred to in the content.

