Abstract
Malfunctions in relay protection devices are predominantly caused by current transformer (CT) saturation which produces distortion in current measurements and disturbances in power system protection. The development of deep learning in power system protection is on the rise recently because of its robustness. This study presents a CT saturation detection where the secondary current becomes distorted. The proposed scheme offers a wide range of saturation detection and consists of a moving-window technique and stacked denoising autoencoders. Moreover, Bayesian optimization was used to minimize the difficulty of determining neural network structure for the proposed approach. The performance of the algorithm was evaluated for a-g faults on 154 kV and 345 kV overhead transmission line in South Korea. The waveform variation has been generated by PSCAD for different scenarios that heavily influence CT saturation. Moreover, a comparative analysis with other methods demonstrated the superiority of the proposed DNN method. With the proposed algorithm to detect CT saturation, it significantly yielded high accuracy and precision for CT saturation detection which were approximately 99.71% and 99.32%, respectively.
1. Introduction
Current transformer (CT) saturation distorts the waveform shape in the measured secondary current, which initially results in incorrect current measurement and leads to malfunction of the protective IEDs. CTs are not saturated when the fault current does not increase to approximately 20 times that of the rated current, and the burden on the secondary side does not go beyond its nominal value [1]. As many complicated systems expand and heavy loads increase, the probability of accidental CT saturation may increase in the system. CT saturation which is initiated due to high fault current may adversely impact the healthy operation of the protective IEDs. To prevent the equipment from sustaining great damage caused by CT saturation, a proper and accurate detection algorithm is inevitably required to maintain the healthy operation of power systems.
1.1. Literature Overview
This section will highlight some promising CT saturation detection approaches which have been proposed to deal with malfunctions due to CT saturation. With respect to CT saturation detection, various approaches based on the estimation of numerical parameters, analysis of variation in current signals, and the use of intelligent systems (Gaussian, neural networks, and more) have been continuously proposed to address this issue.
An intelligent approach that uses the Gaussian mixture model is described in [2]; it classifies the saturated and non-saturated regions. However, these methods rely heavily on human features and could suffer from overfitting problems during validation. The authors in [3,4] introduced other intelligent approaches (particle swarm optimization and genetic algorithm) to differentiate between saturation and non-saturation fragments. Due to unstable convergence in both approaches, it dramatically reduces the generalization performance of the network. Furthermore, an analysis of CT saturation was thoroughly observed in [5], based on decision tree and wavelet transform. As this approach uses signal processing techniques with wavelet decomposition, an extensive scheme is required for signal processing techniques to extract meaningful and useful features. The author in [6] classified the saturation types (no saturation, light saturation, and heavy saturation) based on feature extraction with machine and fine-tuning strategy to yield high accuracy in CT saturation classification; however, it failed to detect endpoints of saturation in each cycle, which made it impractical in power system protection.
A traditional detection method based on waveforms obtained from the second and third derivatives was implemented in [7,8] to detect saturation interval. The utilization of a Lanczos filter was mentioned in [9] for CT saturation. Although both methods have a low computation burden, they may not accurately detect the end of some saturation when there is a smooth current variation at the endpoints of saturation; moreover, both methods are also prone to high-frequency components. Thus, for practical applications, the signal should be pre-conditioned by a low-pass filter prior to applying these methods. A novel CT saturation detection method using the least error square (LES) technique was presented in [10]. Another detection method was found in [11], in which symmetrical components were used to determine the saturation duration. A detection approach was based on a short-data window impedance, and samples taken from the CT and busbar voltage are highlighted in [12]. The analysis of the distance between consecutive points in the plans formed by the difference function of the sampled signal was adopted in [13] to detect CT saturation intervals. A technique based on mathematical morphology was proposed in [14] for CT saturation detection and compensation; however, the identification of saturation under noisy conditions was not secured. Discrete wavelet transform (DWT)-based methods were proposed to detect the onset and endpoint of CT saturation [15,16]. However, the proper mother wavelet selection heavily increases the computation burden. The second derivative of the Savitzky–Golay (SG) approach [17] was proposed to detect CT saturation with the presence of noise. However, the presence of harmonics was not included in the evaluation. The use of a dual method based on the second difference and zero crossing principle [18] was employed to address CT saturation. The integration of a SG filter and empirical mode decomposition (EMD) [19] was applied to address and provide reliably accurate detection of CT saturation under noisy conditions. In [20], CT saturation intervals were well-detected based on the estimation error of the Extended Kalman Filter (EKF). Its merits were accuracy and robustness for noise measurement and harmonics.
1.2. Motivation and Contribution
Recently, it has been undoubtedly proven that the application of deep learning is a powerful tool to tackle problems occurring in modern power systems. Articles from [21,22] show very promising results in removing direct current (DC) offsets from power systems when there is a faulted condition with one full cycle and less than a cycle. Moreover, it is evident from previous studies [23] that deep neural networks can be used effectively to compensate for CT saturation in the presence of noise and harmonics. To extend the capabilities of deep neural networks in the power systems, this study presents a novel method for CT saturation detection, inspired by a stacked denoising autoencoder (SDG) and moving-window technique, to obtain the exact onsets and endpoints of each saturation. SDG alone is not sufficient to accurately detect the exact saturation interval; therefore, a moving-window technique was adopted in combination with SDG to provide accurate and quick detection of CT saturation.
The main superiorities of the proposed algorithm are listed as follows:
- The uncertainty of DNN structure was addressed by employing Bayesian optimization to obtain the best structure of the DNN for detecting CT saturation and to offer an ideal detection algorithm in power systems against CT saturation;
- Second, the use of SDAE ensured the optimal weights and bias for the DNN structure to detect CT saturation in many conditions;
- Third, the quick response and accuracy of detecting CT saturation were secured without the use of a low pass filter under noisy and harmonic conditions;
- Lastly, unlike conventional approaches, the proposed DNN method did not depend on CT characteristics, power system parameters, etc.
This study is organized as follows. In Section 2, the properties of CT saturation and data acquisition for the training and testing phase are given. A detailed description of the development of CT saturation detection with a stacked denoising autoencoder is provided in Section 3. Section 4 presents the detection results of CT saturation and comparative analyses with other benchmark models. The concluding remarks and some information regarding potential research are provided in Section 5.
2. Mechanism of CT Saturation and Data Preprocessing
In this section, the details and non-linear behavior of CT saturation are discussed, in order to understand the main causes of CT saturation, which provides better insight into the influencing factors of CT saturation. With this, the detection model can properly function under several given saturation conditions. In addition, data preprocessing is a vital step in building a concrete detection model that could be applicable to other system variations.
2.1. Properties of CT Saturation
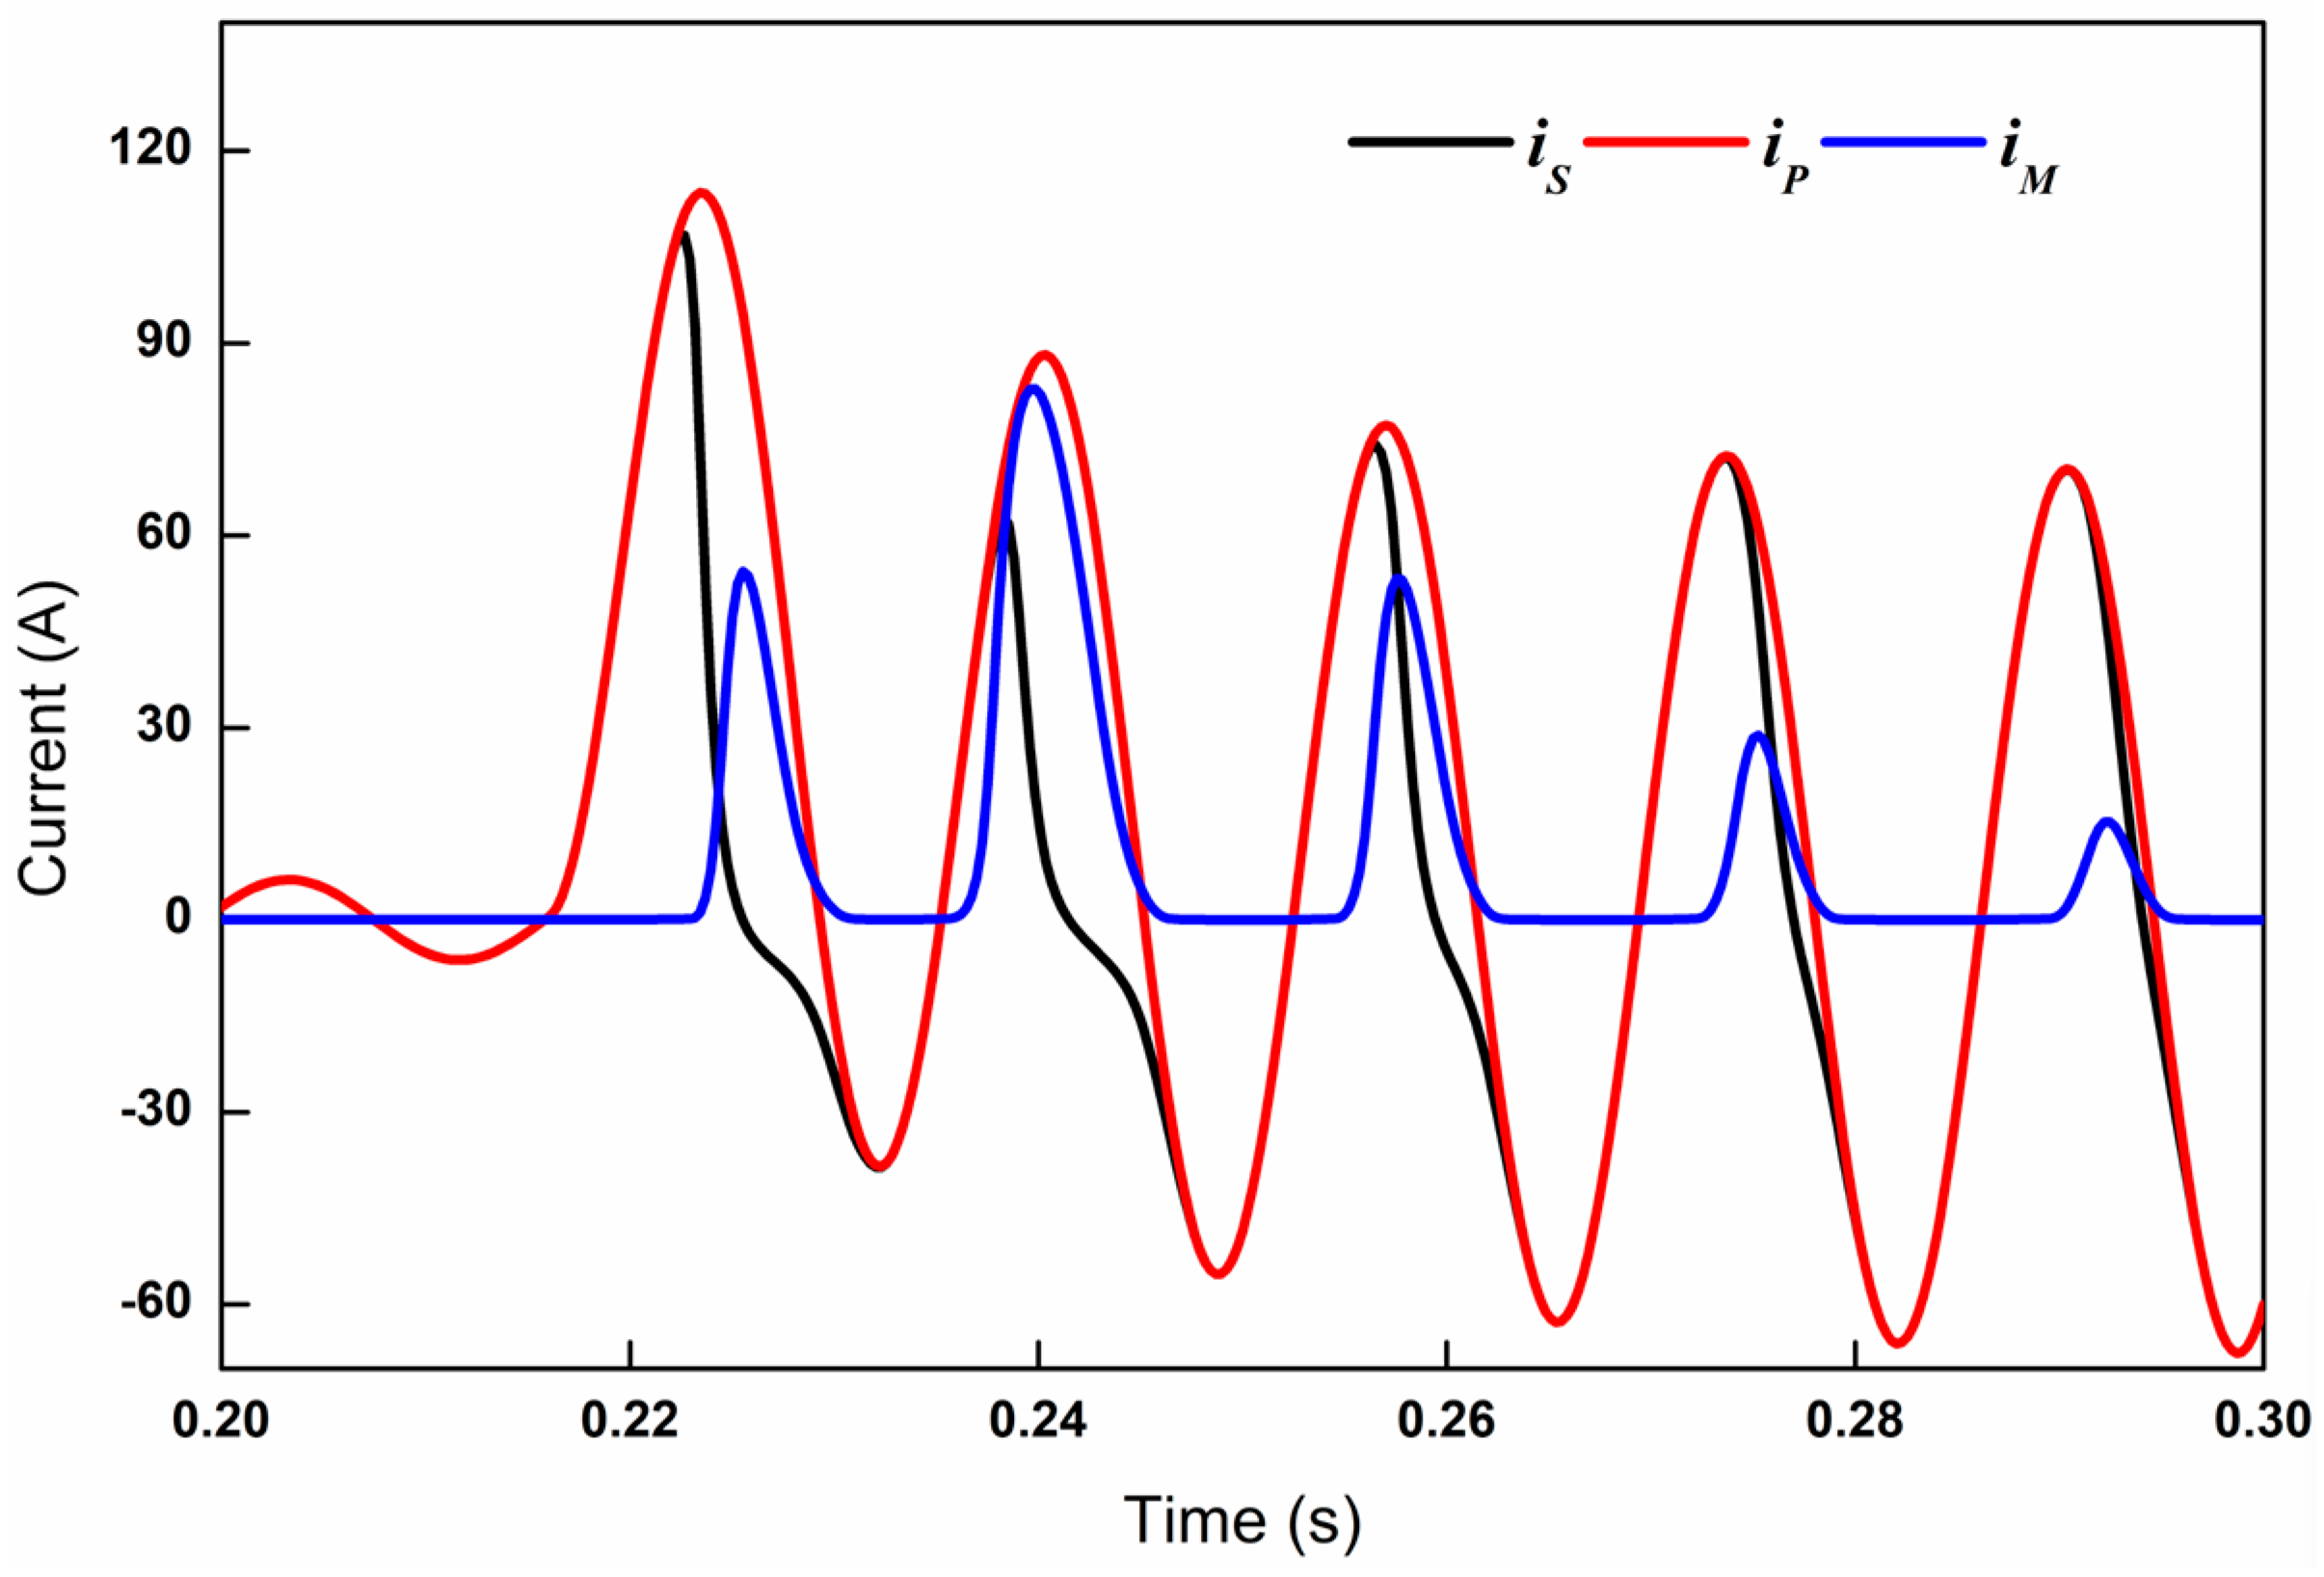
The secondary current measured from a CT may become distorted due to CT saturation since the fault current in power systems largely contains DC components. The undistorted and distorted secondary current waveforms in a power system are illustrated in Figure 1. The magnitude of the secondary current decreases in the saturation duration. To simplify the abovementioned terms, and are selected to describe the undistorted and distorted current, respectively. During a fault condition, the current waveform contains decaying DC offsets, as follows:
where is the phase angle of the j-th harmonic component, is the amplitude of the j-th harmonic component, is the magnitude of the DC component, and τ is the time constant of the system.
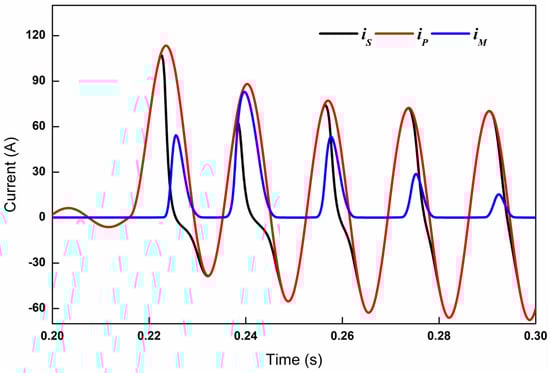
Figure 1.
Measured current waveform from CT with unsaturated and saturated waveforms.
λ(t) is proportional to , and it can be expressed as follows, where N is transformer turns:
Using the magnetizing curve, (2) can be simply rewritten as shown below:
However, the value is approximately zero before saturation begins as illustrated in Figure 1, before the fault occurs, and at the first saturation instant can be subsequently given with the saturation slope from the saturation curve SCT:
Therefore, the secondary current measured from CT, which is used as the input dataset to DNN, is the difference between primary current and magnetizing current ; it is given in (5), as follows:
The magnetizing current is assumed to be approximately zero during normal operating conditions. However, cannot be negligible during the fault condition, due to the nonlinear characteristic of the CT. Therefore, a sudden increment of this can be used as the key to categorizing the saturation interval. is monitored by applying the moving-window algorithm to accurately determine the onsets and endpoints of saturation. Consider magnetizing current , where i is the index of the magnetizing current; by applying the moving-window algorithm, we can form a matrix of as follows, where is the moving step and m is window length:
where and are equal to 1 and 5, respectively. Furthermore, saturation information is required to be determined to feed deep learning networks as a label, and it can be acquired by summing the length of the dataset in each window. Thus, the criterion is given as follows:
where D denotes the index of saturation information, and is the index of the input signal. The sensitivity of saturation detection heavily relies on , as it particularly means a smaller demonstrates higher sensitivity in the case of heavy saturation. Therefore, the threshold of detection must be carefully selected, as it determines the robustness of the algorithm. Numerical simulation revealed that a suitable threshold is between 0 and 0.22, and 0.16 was adopted to detect CT saturation. The state of detection is 1 when the sum of a normalized magnetizing current in a window exceeds the threshold; otherwise, it is 0.
Since we wanted to extend the capability of the proposed DNN to accurately detect CT saturation on other power systems’ voltages, the input matrix is required to be normalized to the range of [−1, 1]. Moreover, normalization provides a smaller computation burden during the training of the DNN. The normalization of the input is expressed in (8).
2.2. Data Acquisition and Data Properties for Training
Although the deep learning approach is independent of physical constraints in CTs, a thorough analysis is undoubtedly necessary to figure out the major influencing factors on CT saturation, which could optimize the datasets to improve the accuracy and generalization of the detection model for CT saturation. Therefore, the proposed DNN method was trained on simulated datasets from the IEEE Power System Relaying Committee (PSRC) [24]. Core-induced flux has been validated and proven to be usable for conducting research, which shares similar characteristic to CTs used in the industry. Moreover, various parameters were thoroughly considered that are highly subject to CT saturation, such as fault inception angle (FIA), X/R ratio, remnant flux, and CT burden. The parameters are listed in Table 1, in which the saturation is severe when it reaches the highest remnant flux of 80% and a fault inception angle of 00. The saturation variation was carefully considered for the training, as it becomes stable for other systems. The training data were roughly 15,680, which corresponds to 11,038,720 datasets. To make it immune to harmonics and noise without the use of a low-pass filter, the saturated signal is generated with Gaussian White Noise and harmonic from the second to fifth order. The noise magnitude was added to saturated datasets , and its magnitude was given by a signal-to-noise ratio (SNR) that is expressed in (9):

Table 1.
CT saturation highly influential parameters for training datasets.
3. CT Saturation Detection Framework Based on Deep Neural Network
This section introduces the concepts and strategies implemented to detect CT saturation interval. To deepen the structure of the DNN, unsupervised pre-training and supervised fine-tuning were adopted in the proposed detection scheme. Details of the benchmark models are well-demonstrated in [25,26].
3.1. Unsupervised Feature Extraction Technique Using Stacked Denoising Autoencoders
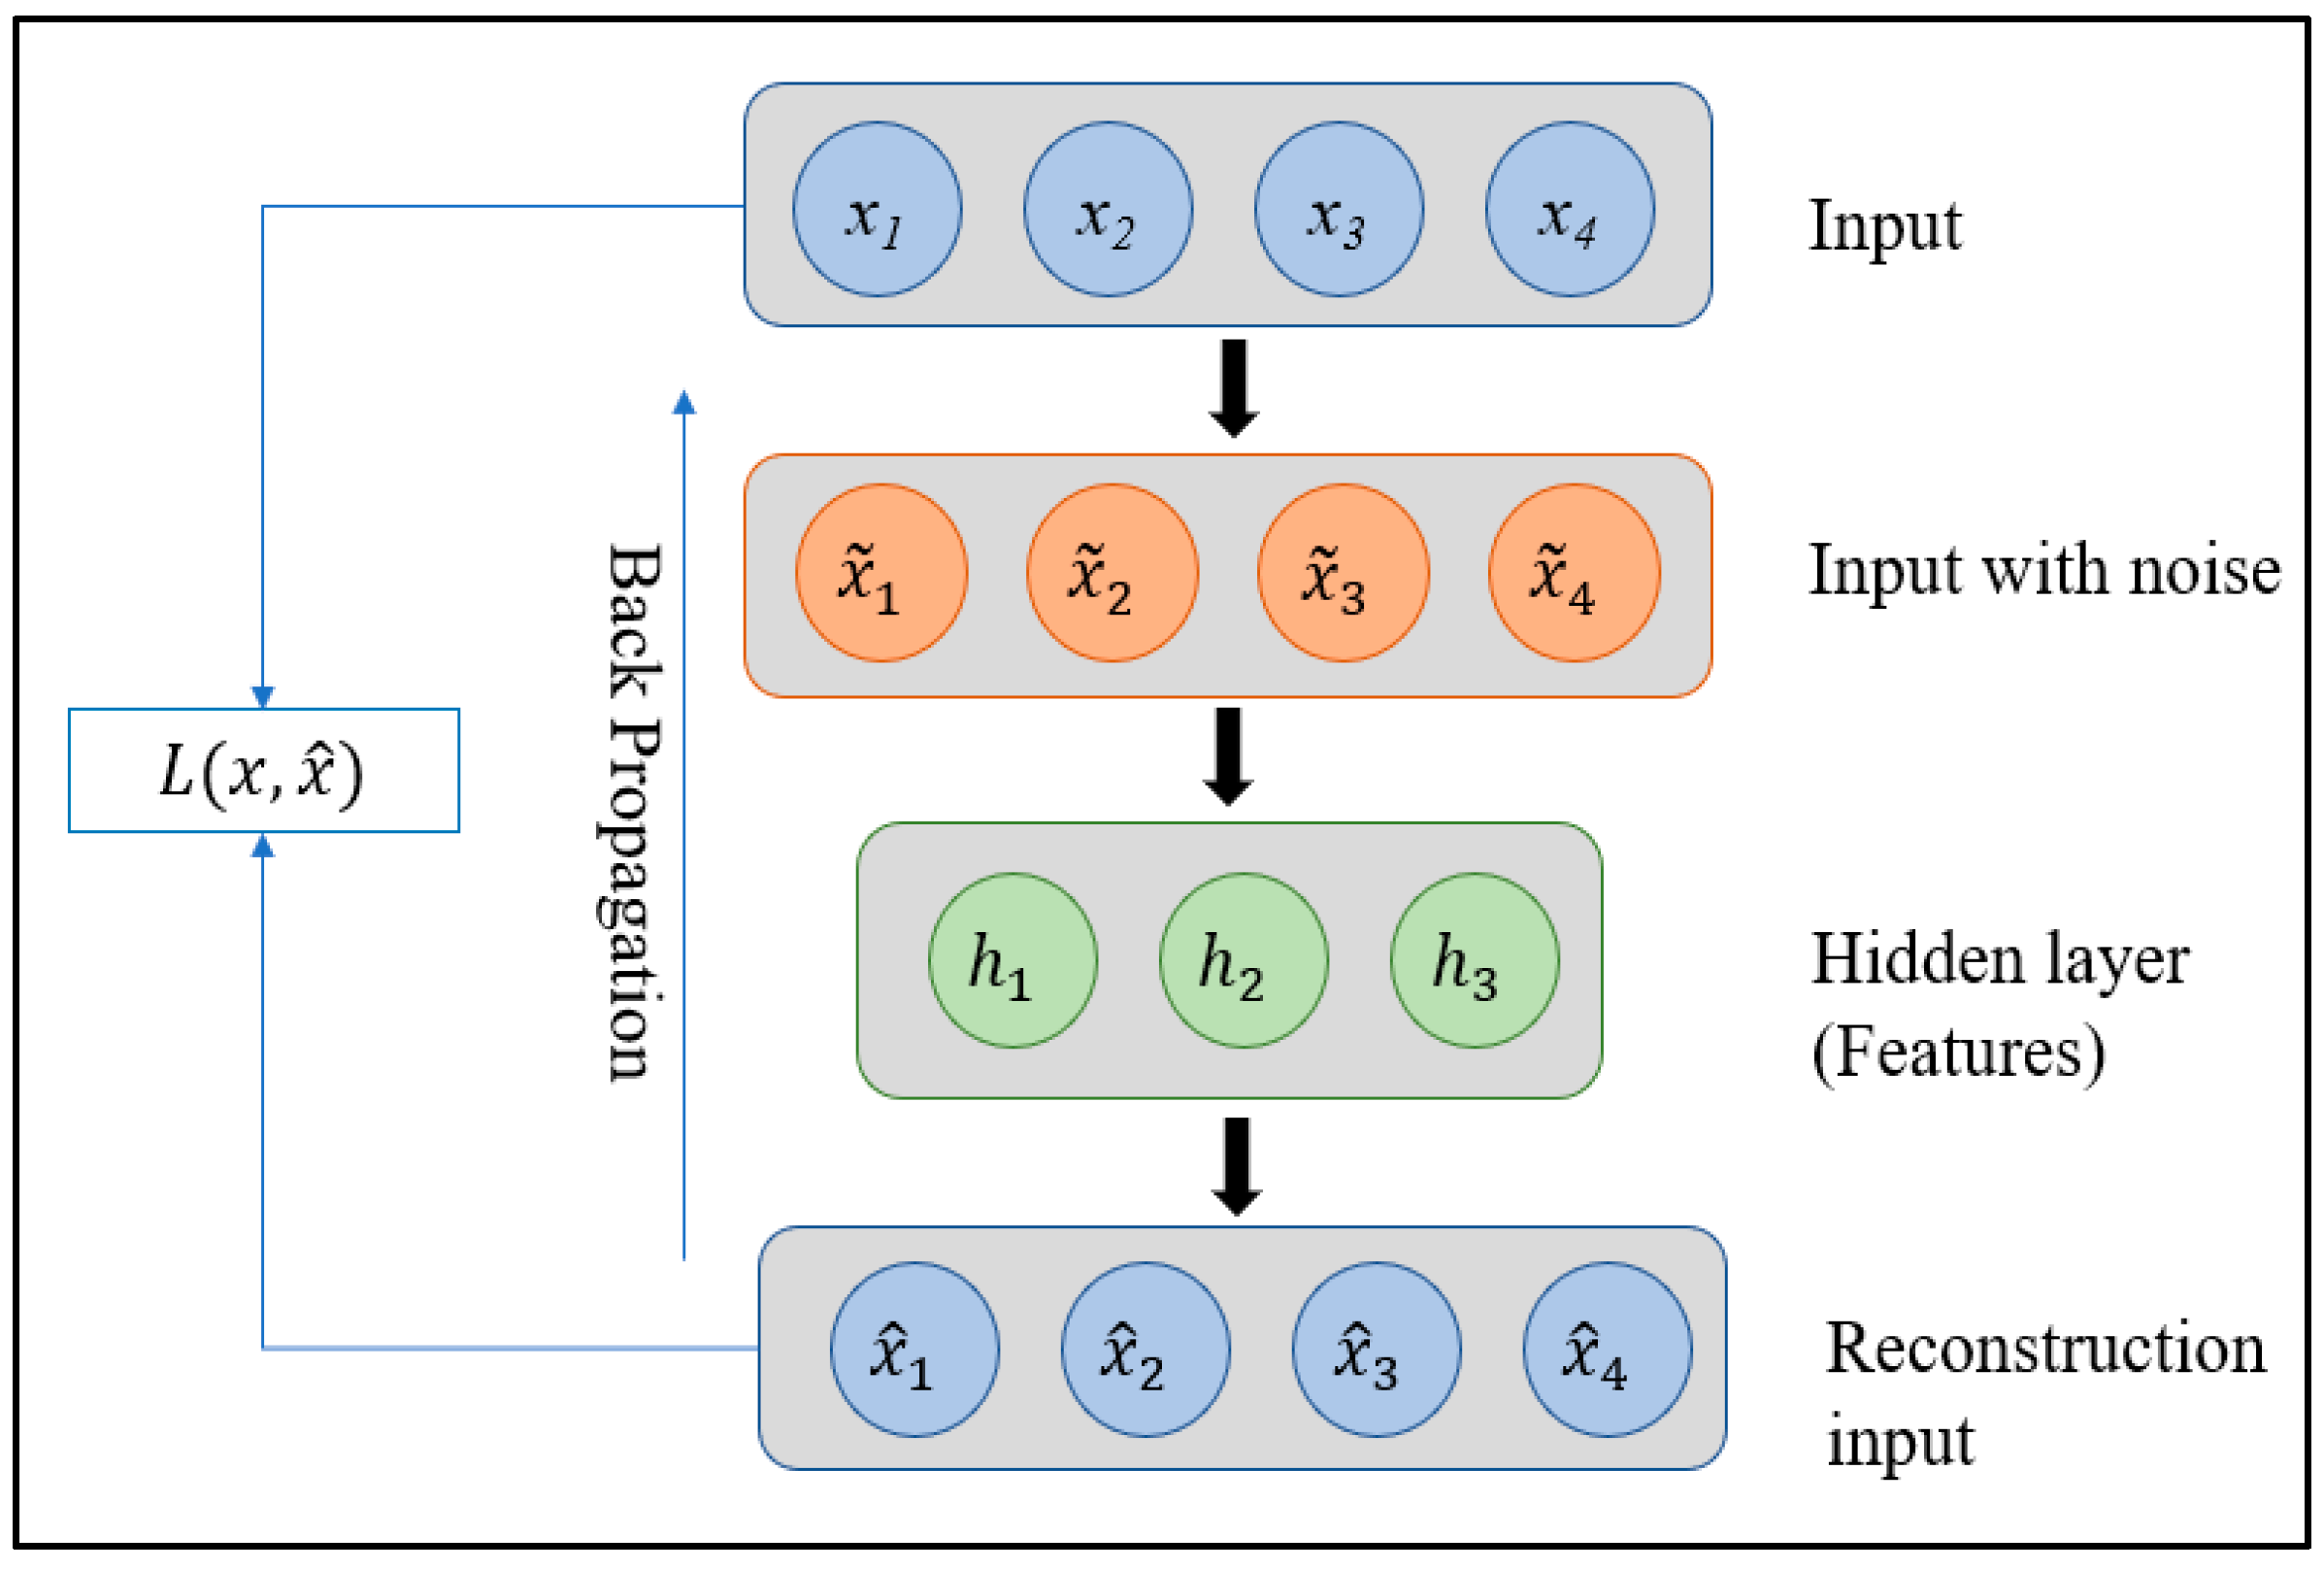
When the original autoencoders contain many hidden layer neurons, they become very time-consuming and converge slowly, although the classification accuracy is improved. The model can learn the repeated representations of the original input data; therefore, Vincent [27] proposed stacked denoising autoencoders (SDAE) to overcome the abovementioned problems. Compared with original autoencoders, the denoising autoencoder (DAE) aims to reconstruct the dataset that is corrupted by noise. Concretely, a DAE consists of an input layer, a hidden layer, and an output layer, which is called a reconstruction layer; the training process ensures that the output vectors correspond well to the input pattern for each unlabeled data x ∈ R. The structure of SDAE is depicted in Figure 2.
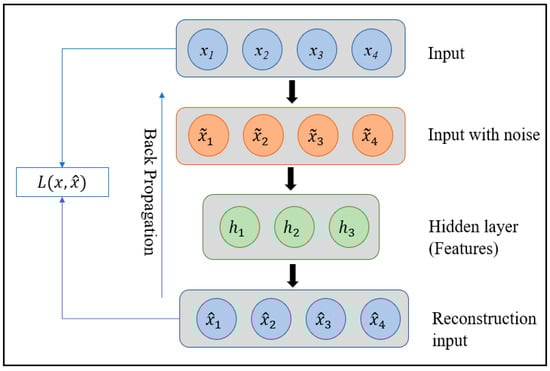
Figure 2.
Typical structure of denoising autoencoders.
The training process is properly completed when the hidden nodes give effective feature representation of the data in the training datasets. The output vectors of a DAE are computed as follows, from [23]:
where is the Leaky ReLu activation function for the encoding layer. The linear function is the decoding layer activation function for the regression task. By incorporating an Adam optimizer, the training could proceed. Since the goal was to minimize the difference between the input and reconstructed output, a capable cost function is required to complete the task. The cost function utilized two important terms, namely the root mean square error and weight decaying. The expression of the cost function is expressed as follows, from [6]:
where the first part of the cost function measures the error between the input and reconstructed output, and the second part is the weight decaying that limits the value of weights so that the DAE is not prone to overfitting. The cost function was optimized by iteratively updating weights and bias with backpropagation; converges to a desired value after a certain iteration and the denoising autoencoder is achieved.
The first phase of the proposed DNN was the unsupervised pre-training, in which the DAE was trained iteratively, layer by layer, to construct a deeper network. The hidden saturated features in the first DAE were extracted that highly represented the input dataset in a low dimension. Using the hidden features hk of the first DAE as the raw input for the next DAE, another representation features could be extracted. This, therefore, could secure a highly relevant representation of the saturated waveform in each DAE. After several DAEs were well-trained, many saturated hidden features stacked together. After several DAEs were stacked, the pre-training model was completed, and called stacked denoising autoencoders (SDAEs); the pre-trained parameters such as weights and bias were kept and stored for further training to possibly achieve high accuracy. At the top level, a classification layer was added to the model to achieve the classification for CT saturation. The structure of the proposed SDAE is depicted in Figure 3.
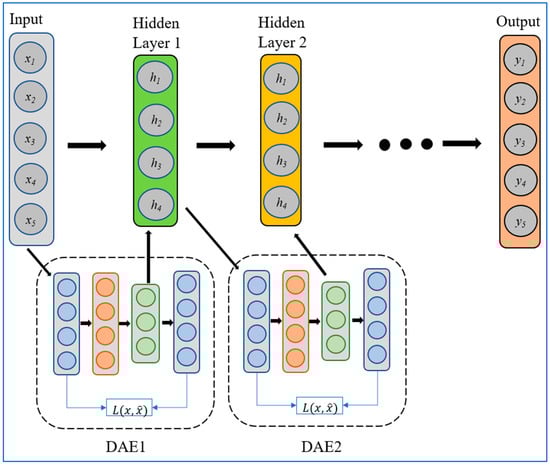
Figure 3.
The structure of the proposed SDAEs.
3.2. Detection of CT Saturation Interval Using Fine-Tuning Strategy
As a training stage, the pre-trained model was further optimized using parameters from all of the encoding layers in the pre-training phase, with the backpropagation algorithm to minimize the error. Using the weights and bias , with as initial weights and bias for the fine-tuning, the deeper network could be established for CT saturation detection. We gave the label and extract features from the last stage to the sigmoid layer, in order to detect the onsets and endpoints of CT saturation in each cycle. Thus, the classification outputs produced less error, and provided a high accuracy. The sigmoid layer yields probabilities in the range of [0–1], and it was calculated as follows:
where j is the output class and is the stochastic variable of the output class corresponding to the input dataset . Consequently, the output of the sigmoid classifier was given in a 2-dimensional vector containing two possible classes (saturated and non-saturated class). The maximum probability of each class was determined as follows.
Likewise, the sigmoid classifier converged to the global minimum by iteratively optimizing the cost function in (10).
where is the i-th scalar value from the sigmoid output in (10), is the corresponding target value, and the weight decay term is also attached to the cost function.
3.3. Selection of Hyperparameters Used in the Proposed Detection Model
The training hyperparameters proposed in this model remarkably affect the final output from the sigmoid classifier; therefore, they must be carefully chosen to ensure the optimum output. Traditionally, searching for the set of hyperparameters is conducted via random selection; however, this technique is very time-consuming. Many popular optimizations used in many recent deep learning, such as grid search, random search, and more, have been well-explained to tune for training hyperparameters. Among those optimizations, Bayesian optimization stands out as the search for training hyperparameters that is more effective within the minimum number of function evaluations. Bayesian optimization operates based on two main principles: the surrogate and acquisition models. Assume that we have a set of parameters x and the objective function f, which is our deep learning function. We designed a set of parameters as a three-dimensional vector consisting of learning rate, batch size, and number of neurons. After the three-dimensional vector was determined, the Bayesian initialized some random point to evaluate f. Then, it used Gaussian Process (GP) as a surrogate model to mimic the structure of the objective function . Expected improvement (EI) was defined as an acquisition function to choose the next samples to be evaluated and maximize the potential optimal points on the basis of information contained in GP. This process is iterated until the stopping criteria or convergence was reached. is defined as follows:
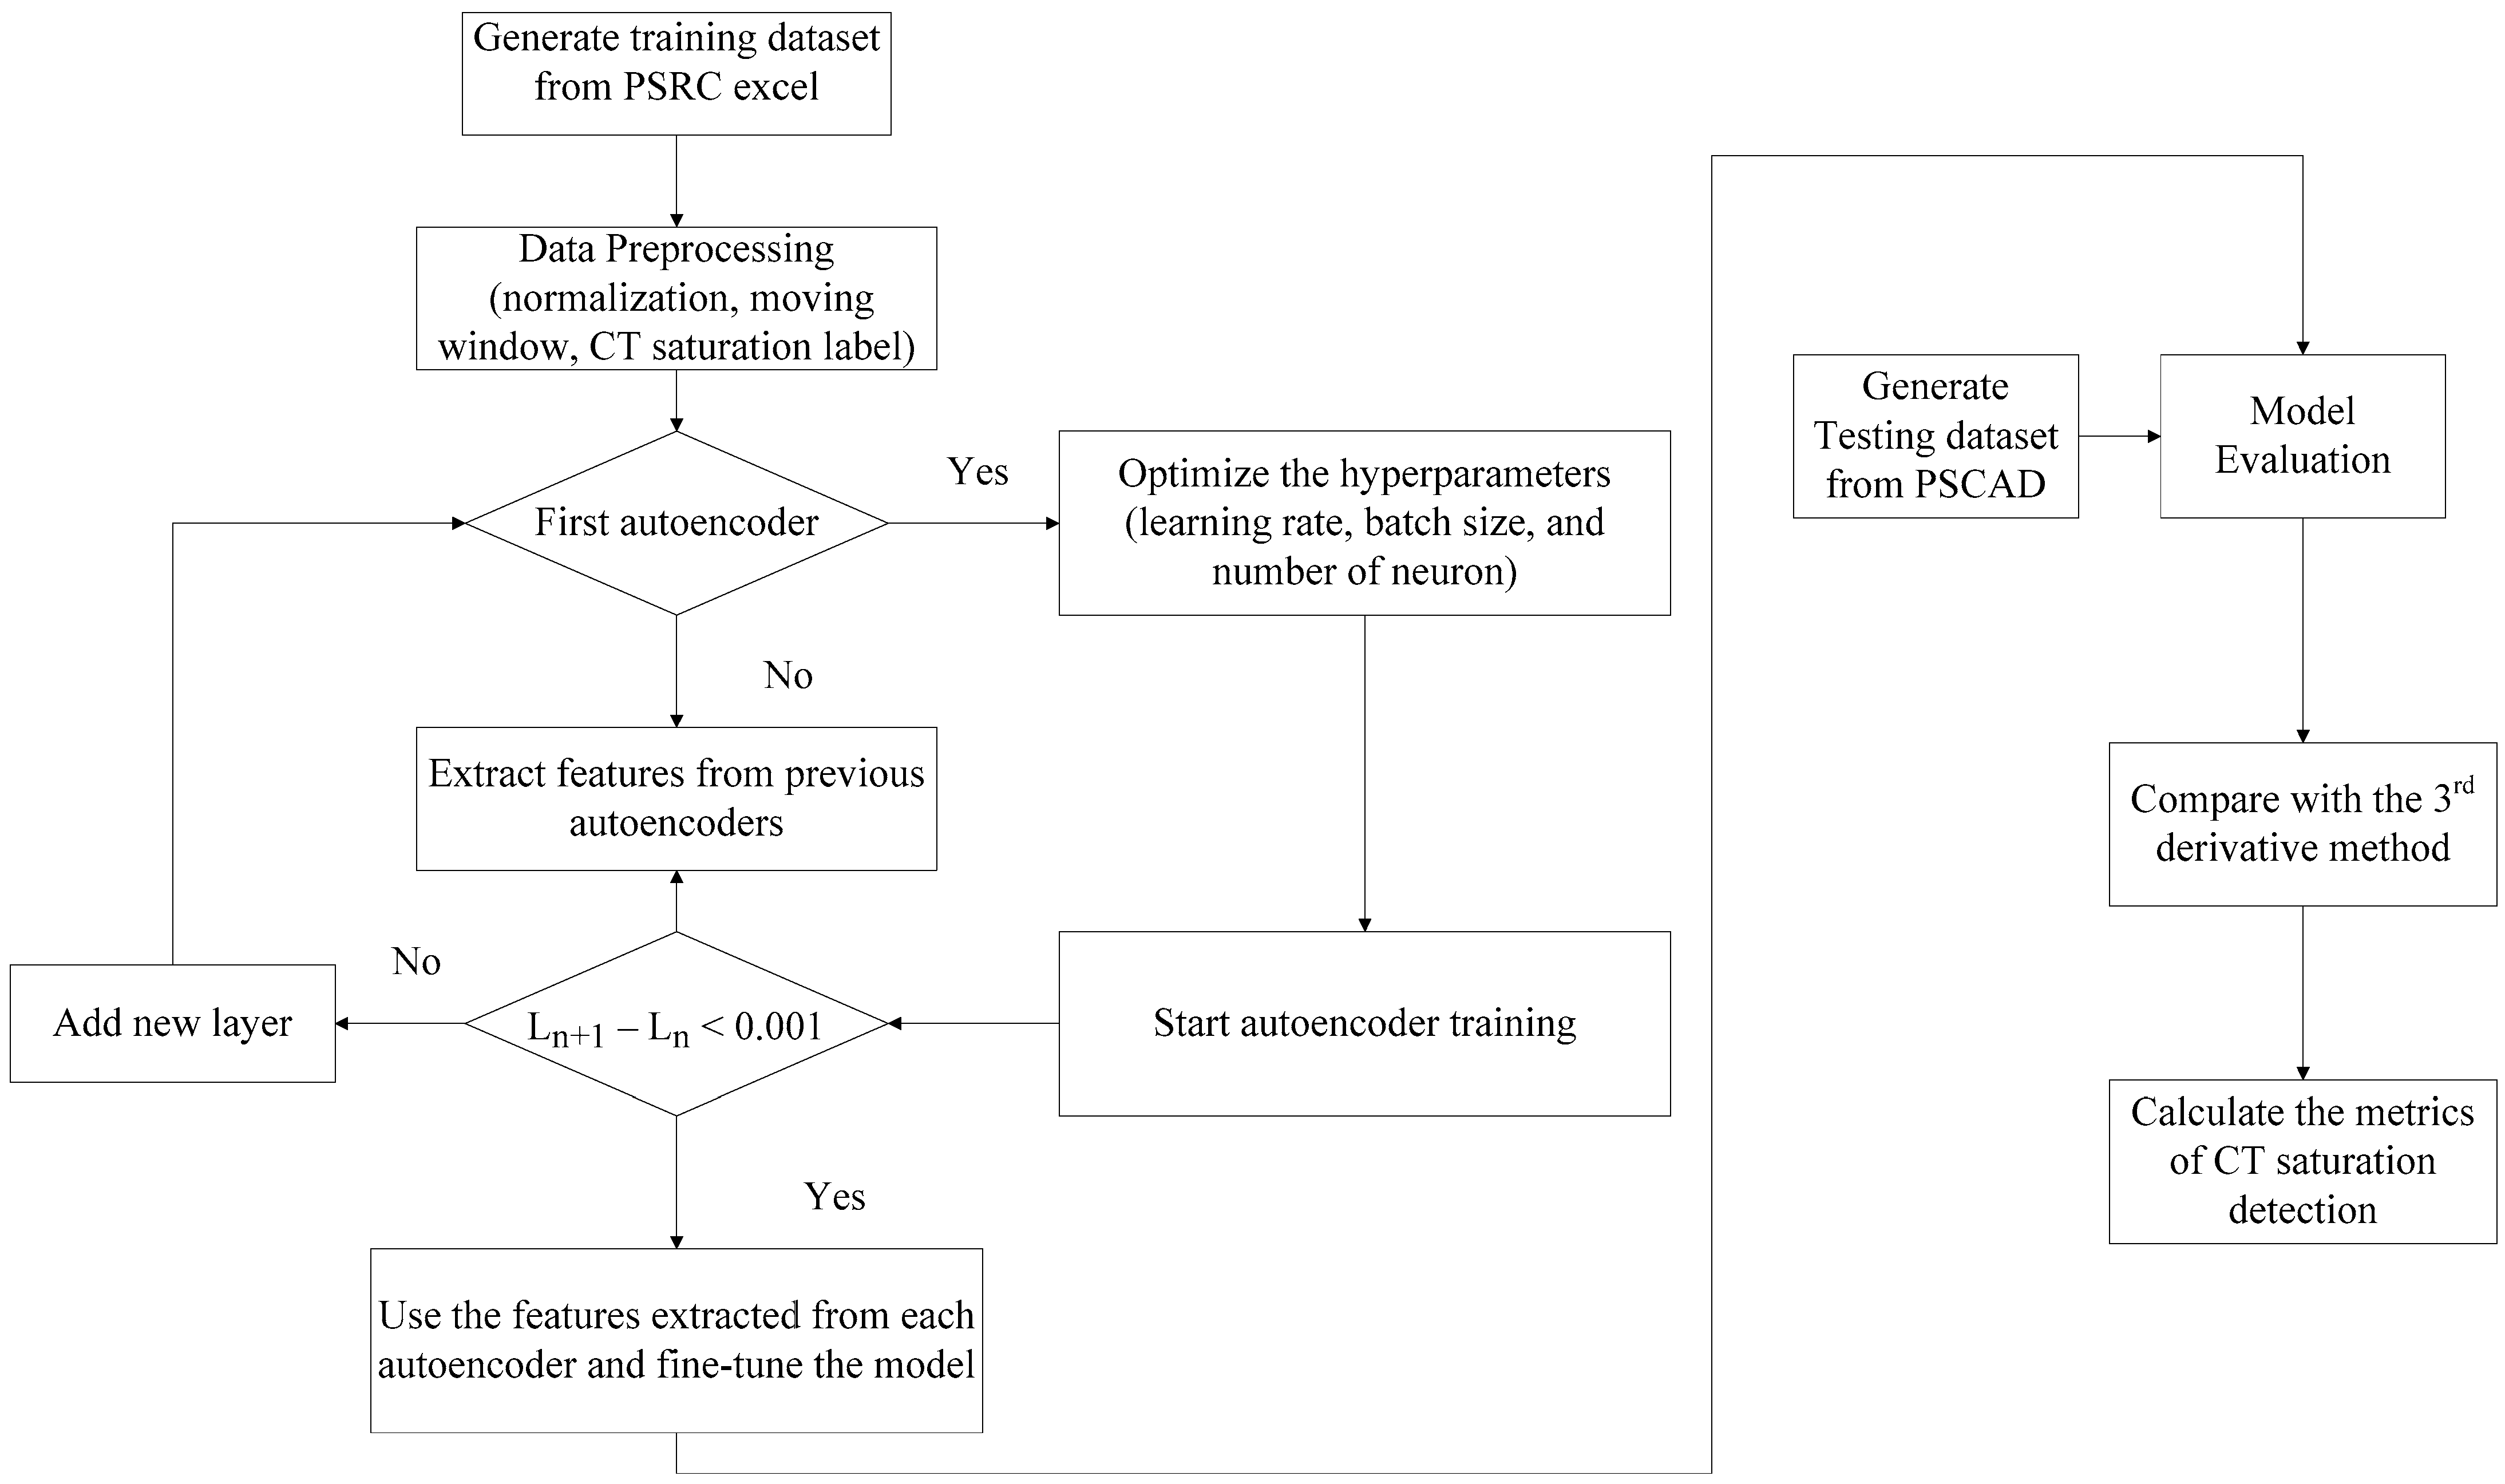
where is the maximum value that experienced during the optimization process. The flowchart of the proposed DNN based method is given in Figure 4, as follows.
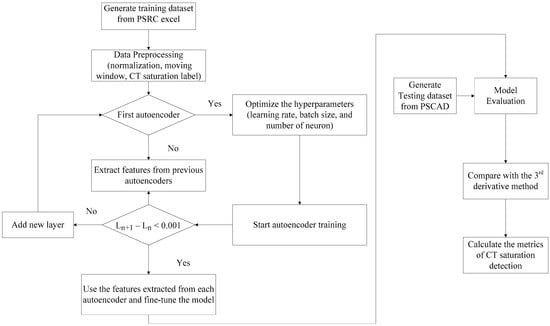
Figure 4.
Framework of the proposed DNN based method for CT saturation detection.
4. Performance Evaluation
4.1. Simulation Model
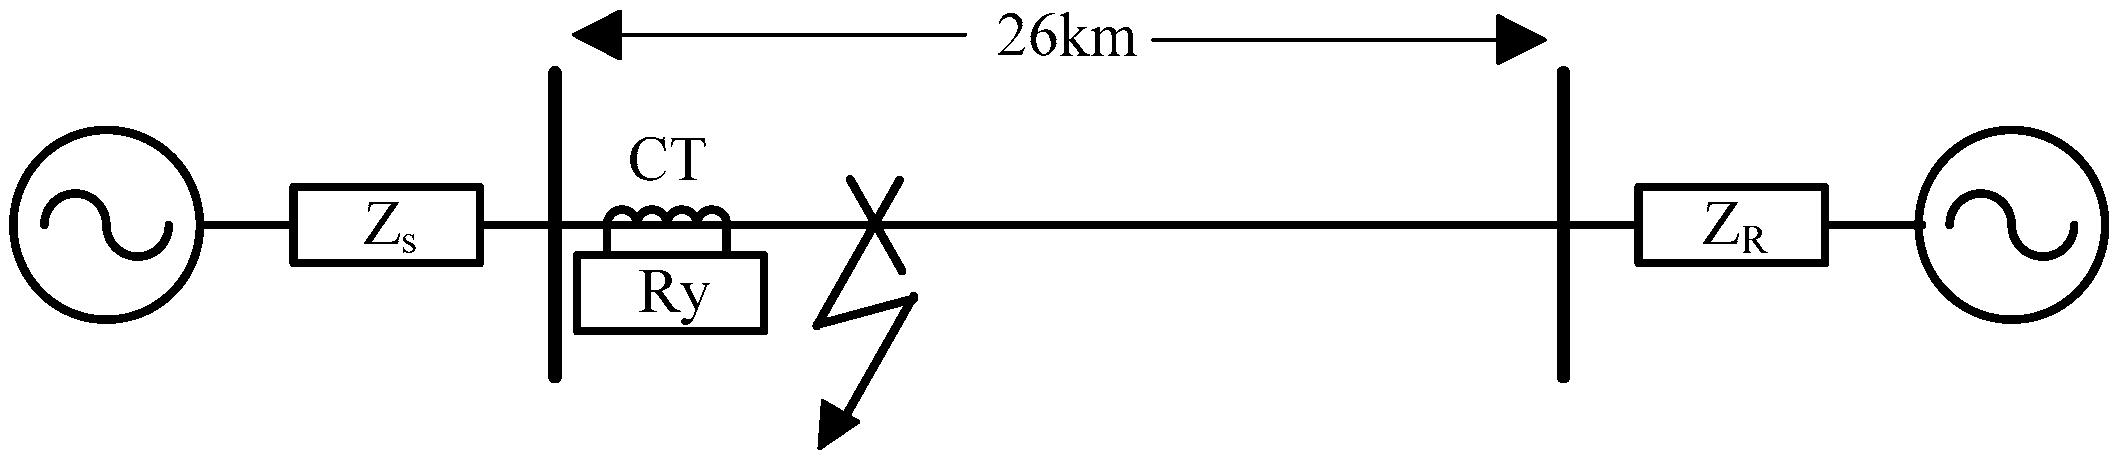
To demonstrate the efficiency of the proposed detection algorithm, a three-phase overhead transmission line, as shown in Figure 5, was modeled in PSCAD/EMTDC. It consisted of a built-in CT model [28] with a turn ratio of 2000/5, and a resistive burden of 3.42 Ω. Many saturation variations caused by high remnants and fault inception angles were considered in this evaluation. Different remnant fluxes determine the first saturation index, and different fault inception angles influence the severity of the CT saturation. The accuracy of the proposed method was investigated for a 154 kV and a 345 kV overhead transmission line in Korea. The sampling frequency was set to 3840 Hertz or 64 samples per cycle in 60 Hz systems. The transmission line parameters are shown in Appendix A. The proposed approach was used as a benchmark model to compare with the third difference function in [8].

Figure 5.
The transmission line, modeled with sources at both ends.
4.2. Network Model
TensorFlow is one of the most common deep learning platforms developed by Google. It offers a high-level API to streamline the network model and the training process of the network model. Therefore, TensorFlow was adopted in this study to construct the network model and the training for saturation detection. The structure of the proposed DNN can highly impact the performance of the given tasks. Thus, it is necessary to thoroughly tune the training hyperparameters with the optimization and the depth of DNN architecture empirically in prior to the training. The set of hyperparameters obtained is listed in Table 2.
Table 2.
Training hyperparameters optimized by BO.
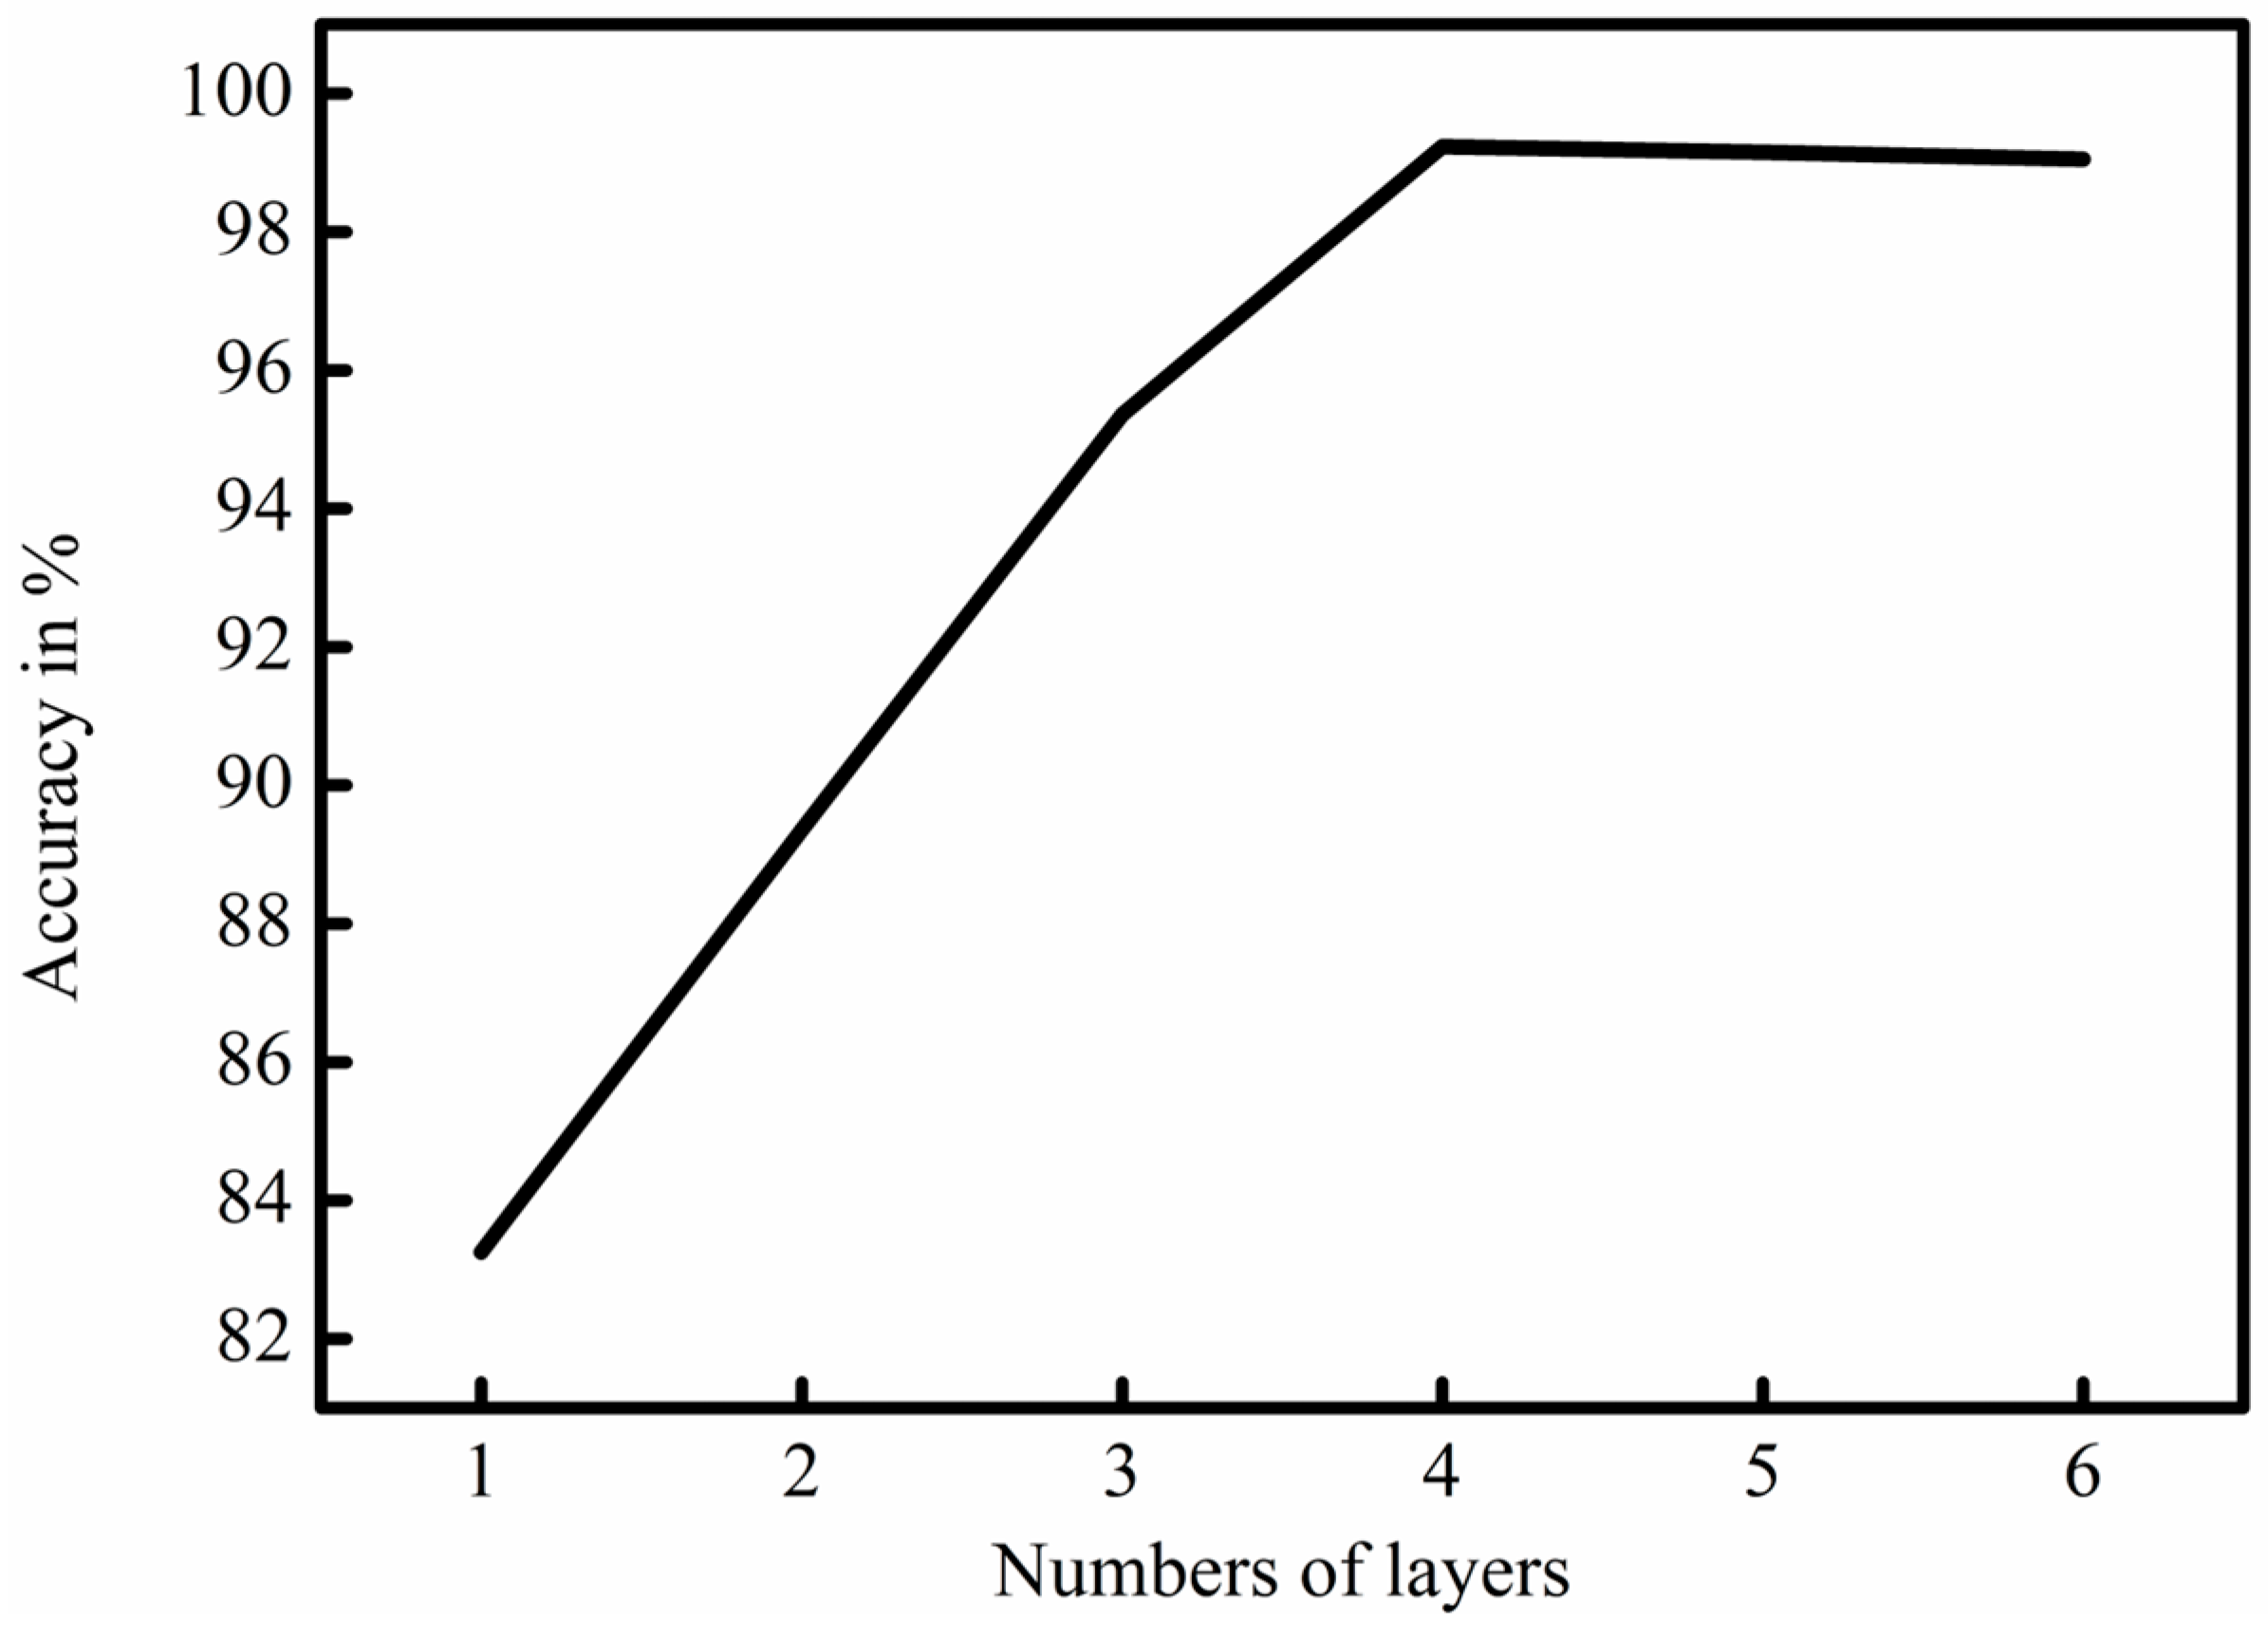
To define the correct depth of the architecture for CT saturation detection, we empirically experiment with the different numbers of hidden layers until there is no increase in accuracy when a new layer is added. We can specifically achieve that by verifying the quantizing accuracy between the predicted outputs and labels. In Figure 6, the accuracy of five hidden layers does not significantly improve performance of CT saturation detection, and the computation burden as the number of layers becomes more complex; therefore, the number of layers is determined to be four.

Figure 6.
The accuracy of the impact of numbers of layers.
In both unsupervised and supervised learning mode, the mean square error is adopted to quantize the error between the network output and reference output. Adam optimizer is used in the network buildup for the network’s gradient backpropagation and parameter update in each epoch. A decaying learning rate is applied for better and fast convergence performance in which 1 × 10⁻³ is given as the initial learning rate and then decreased exponentially every loop.
4.3. Effectiveness of Verification
To prove the performance of the detection algorithm proposed in this research, we used a confusion matrix. Conventionally, accuracy is merely used to measure the efficiency of the correctly predicted dataset over the total dataset. The drawback of accuracy alone is that it cannot discriminate misclassification in the mode, as it may be misleading for poor detection when there is a limited number of datasets. A confusion matrix summarizes the classification performance that visualizes the representation of the actual and predicted values. The following metrics were used to quantify performance of the detection:
where and refer to the numbers of true positives and true negatives (correctly classified), respectively, while and denote the numbers of false positives and false negatives (incorrectly classified), respectively. These four metrics are particularly essential for saturation detection because they display the misclassification of the saturated fragment. Using the metrics given by the confusion matrix, the correct saturation classification and false saturation detection could be computed to verify the performance of the proposed algorithm. For the detection of CT saturation, and are the most important metrics to consider whether the detection model can be practically used in a real-time protection system. refers to the rate of the correct detection for saturation compared to the actual saturation, whereas indicates saturation is misclassified by the model.
4.4. Discussion on Performance of the Proposed DNN and Other Benchmark Model
To investigate the efficiency of the proposed method, the performance of the detection scheme was evaluated on 154 kV and 345 kV systems, considering the various remnant fluxes in the CT core and fault inception angles. For the first evaluation, the saturation case without remnant flux was considered in order to verify the detection sensitivity. In Figure 7, the saturated and unsaturated waveforms and the CT saturation detection signal are depicted. A fault occurring on phase A was imposed at 5 km from Bus 1, and the FIA is 00 and the CT is fully resistive. The result shows that it detected saturation quickly in one sample after saturation occurred, which was very promising for the protection algorithm. Meanwhile, the third derivatives method estimated the saturation point quickly in the first fault cycle when there was a spike of third derivative current that displays the identical saturation onset to the proposed DNN. It produced an outstanding result in detecting the onset of saturation in every cycle. However, in terms of accuracy of saturation endpoints, it yielded poor performance because the third derivates current at the endpoint was approximately zero, that is, lower than the threshold. Furthermore, the accuracy, CSC, and FSD are 99.77%, 97.42%, and 0.002%, respectively.
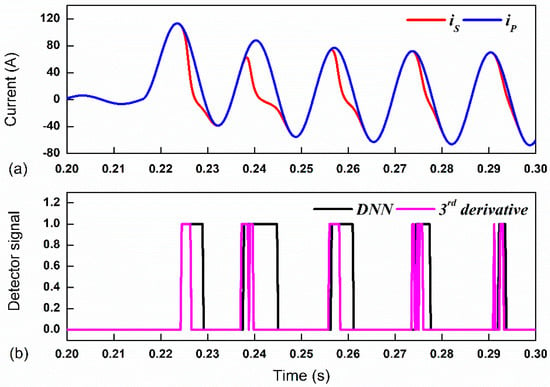
Figure 7.
The detection result of CT saturation on the 154-kV (FIA of 00, and remnant flux of 0%). (a) Saturated and non-saturated waveform; (b) Detection signals.
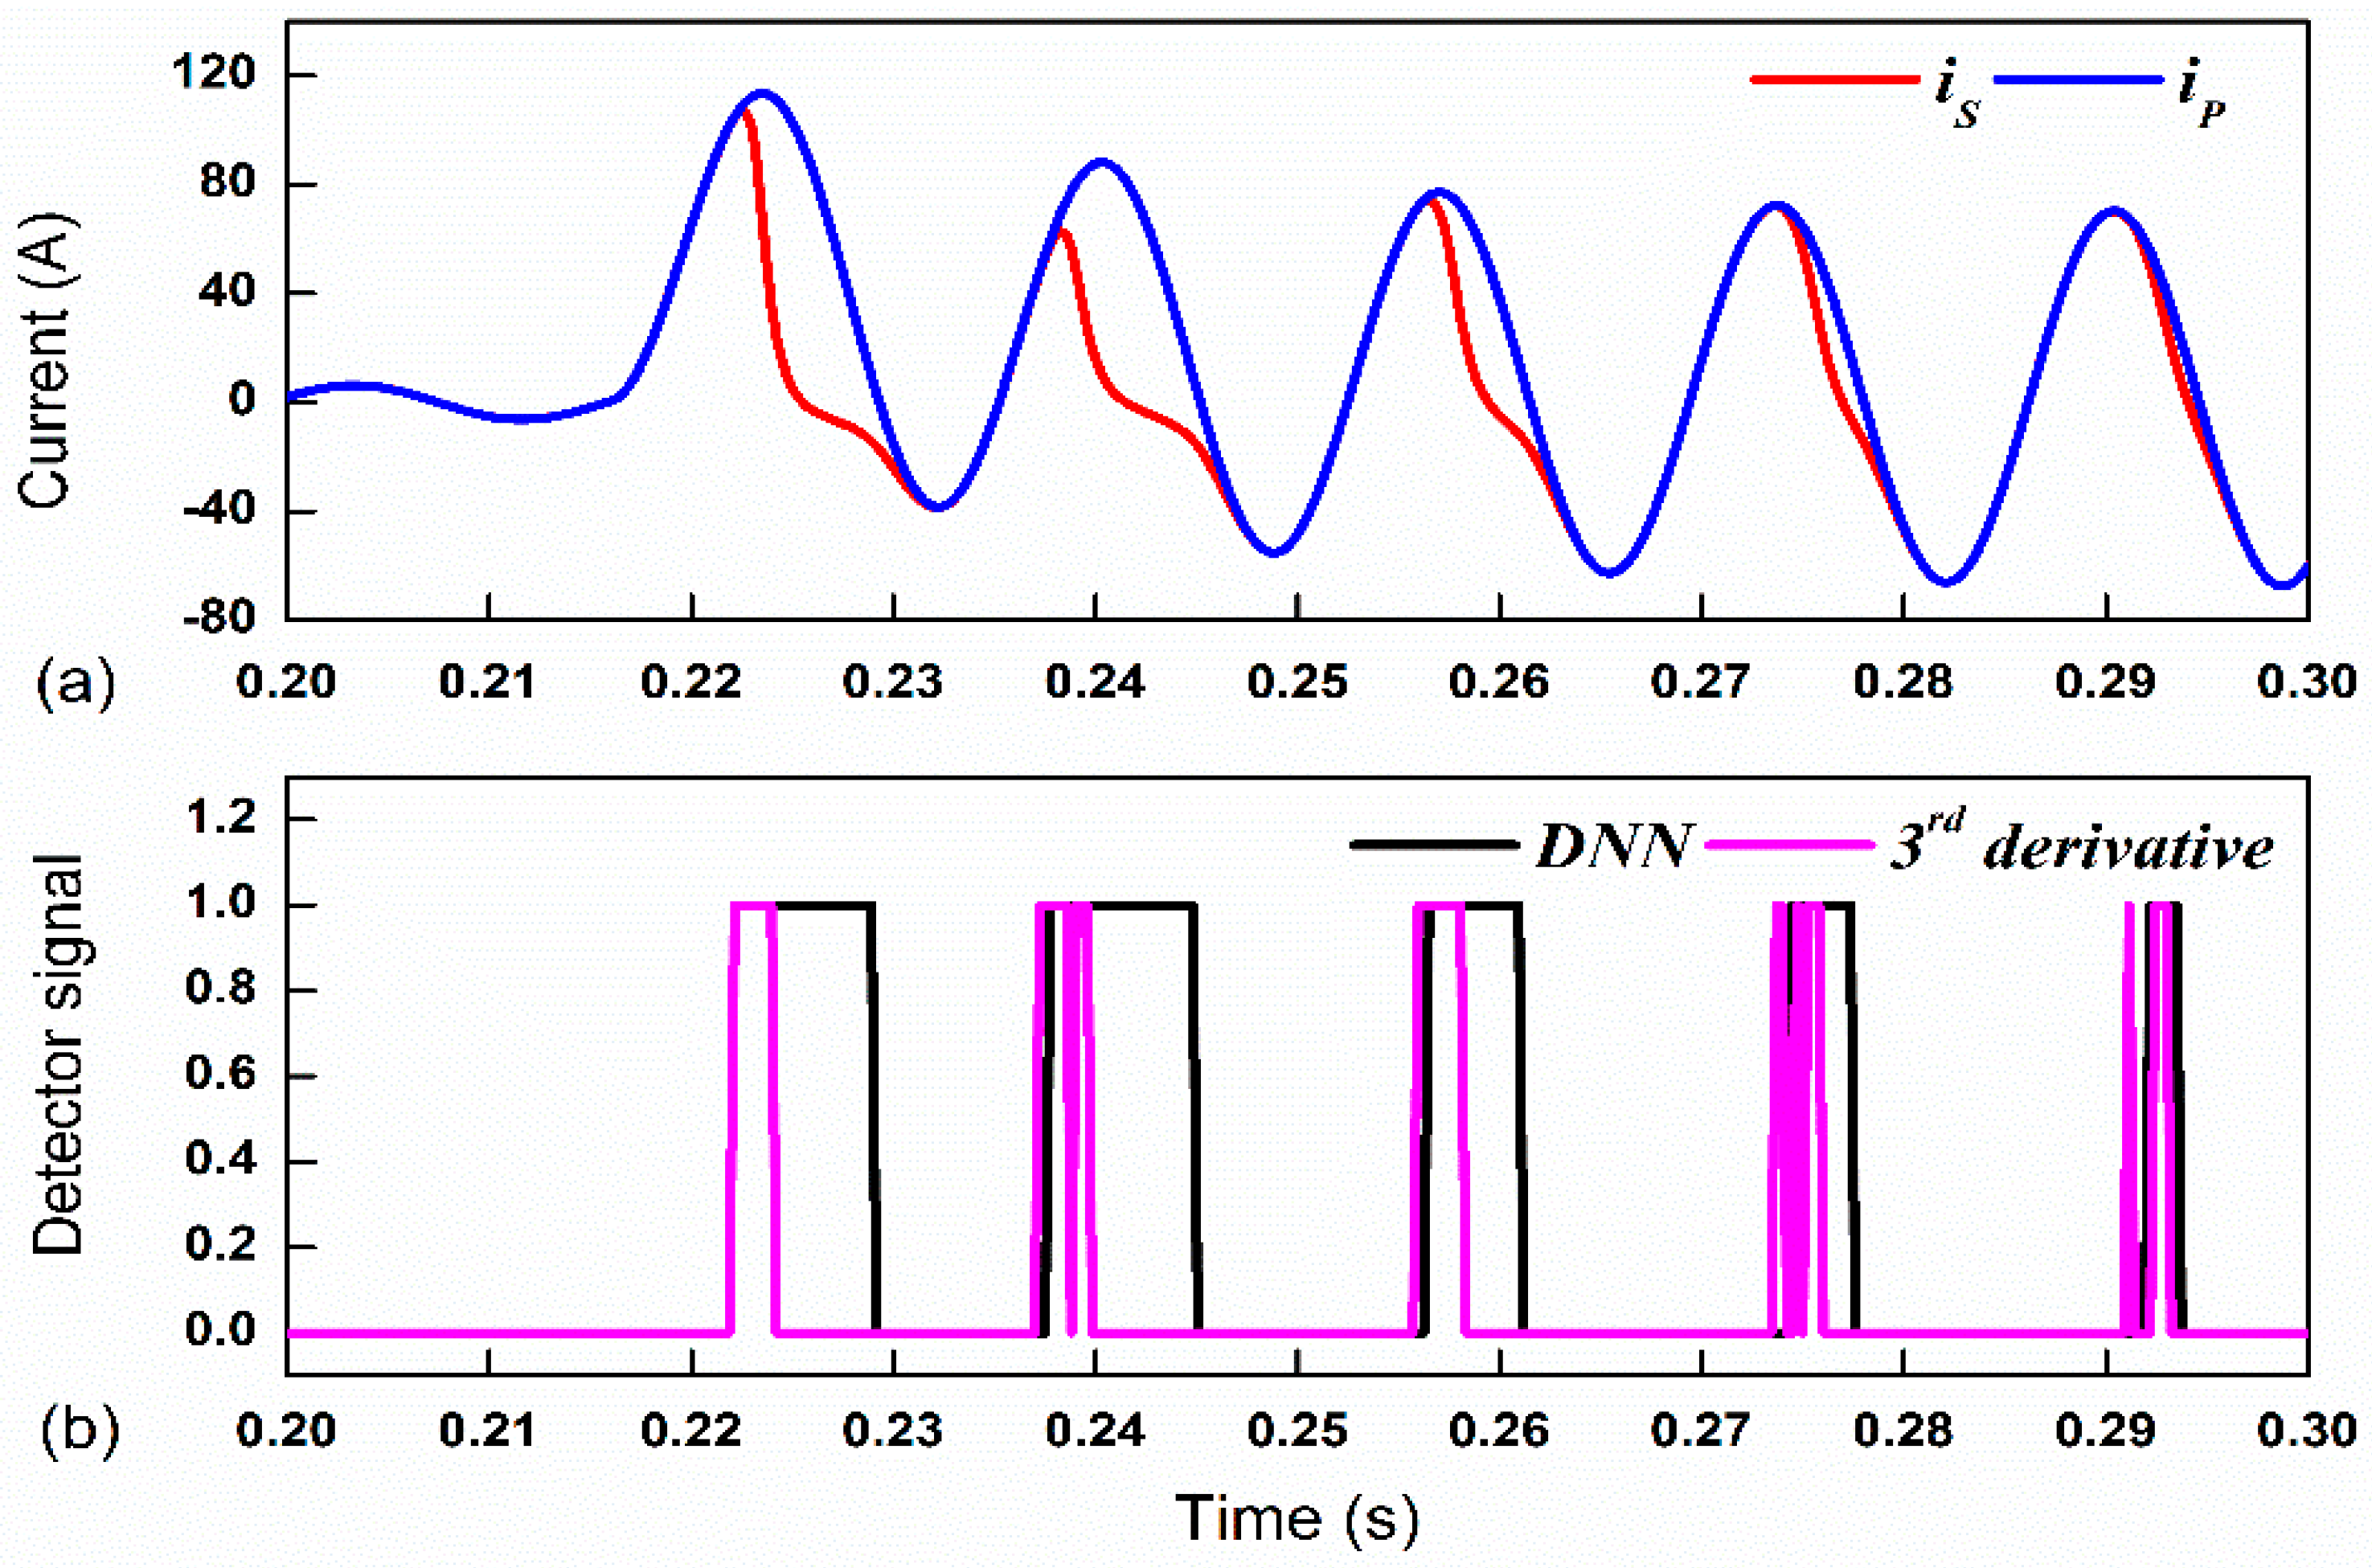
Next, we evaluated the performance of the proposed method when the remnant flux was considered. Figure 8 shows the waveform for another test case, in which remnant flux was increased to 80%. The beginning of saturation was quicker than the previous case due to high remnant flux. From Figure 5, it was observed that from 80% remnant flux, in the first cycle, the saturation severity was less than the second cycle. One can observe that the saturated fragment of CT secondary current was correctly detected in less than one sample after saturation occurred. Likewise, the response from the third derivatives approach displayed a swift and correct detection when saturation occurred; however, it falsely detected the endpoint of saturation in each cycle. The DNN method yielded a higher accuracy, in terms of endpoint detection. The accuracy achieved was 99.69%, and the CSC and FSD obtained from the proposed method were 96.81% and 0.015%, respectively. Thus, the performance of the proposed method was immune to the condition change in remnant flux.
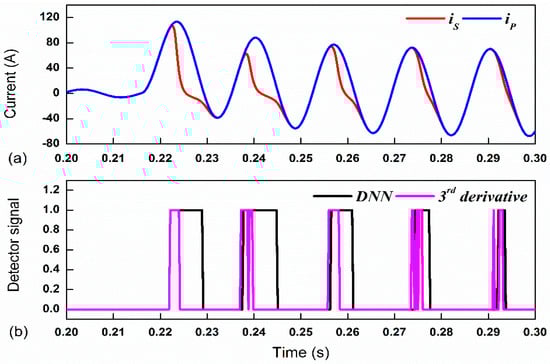
Figure 8.
The detection result of CT saturation on the 154-kV (FIA of 00, and remnant flux of 80%). (a) Saturated and non-saturated waveform; (b)Detection signals.
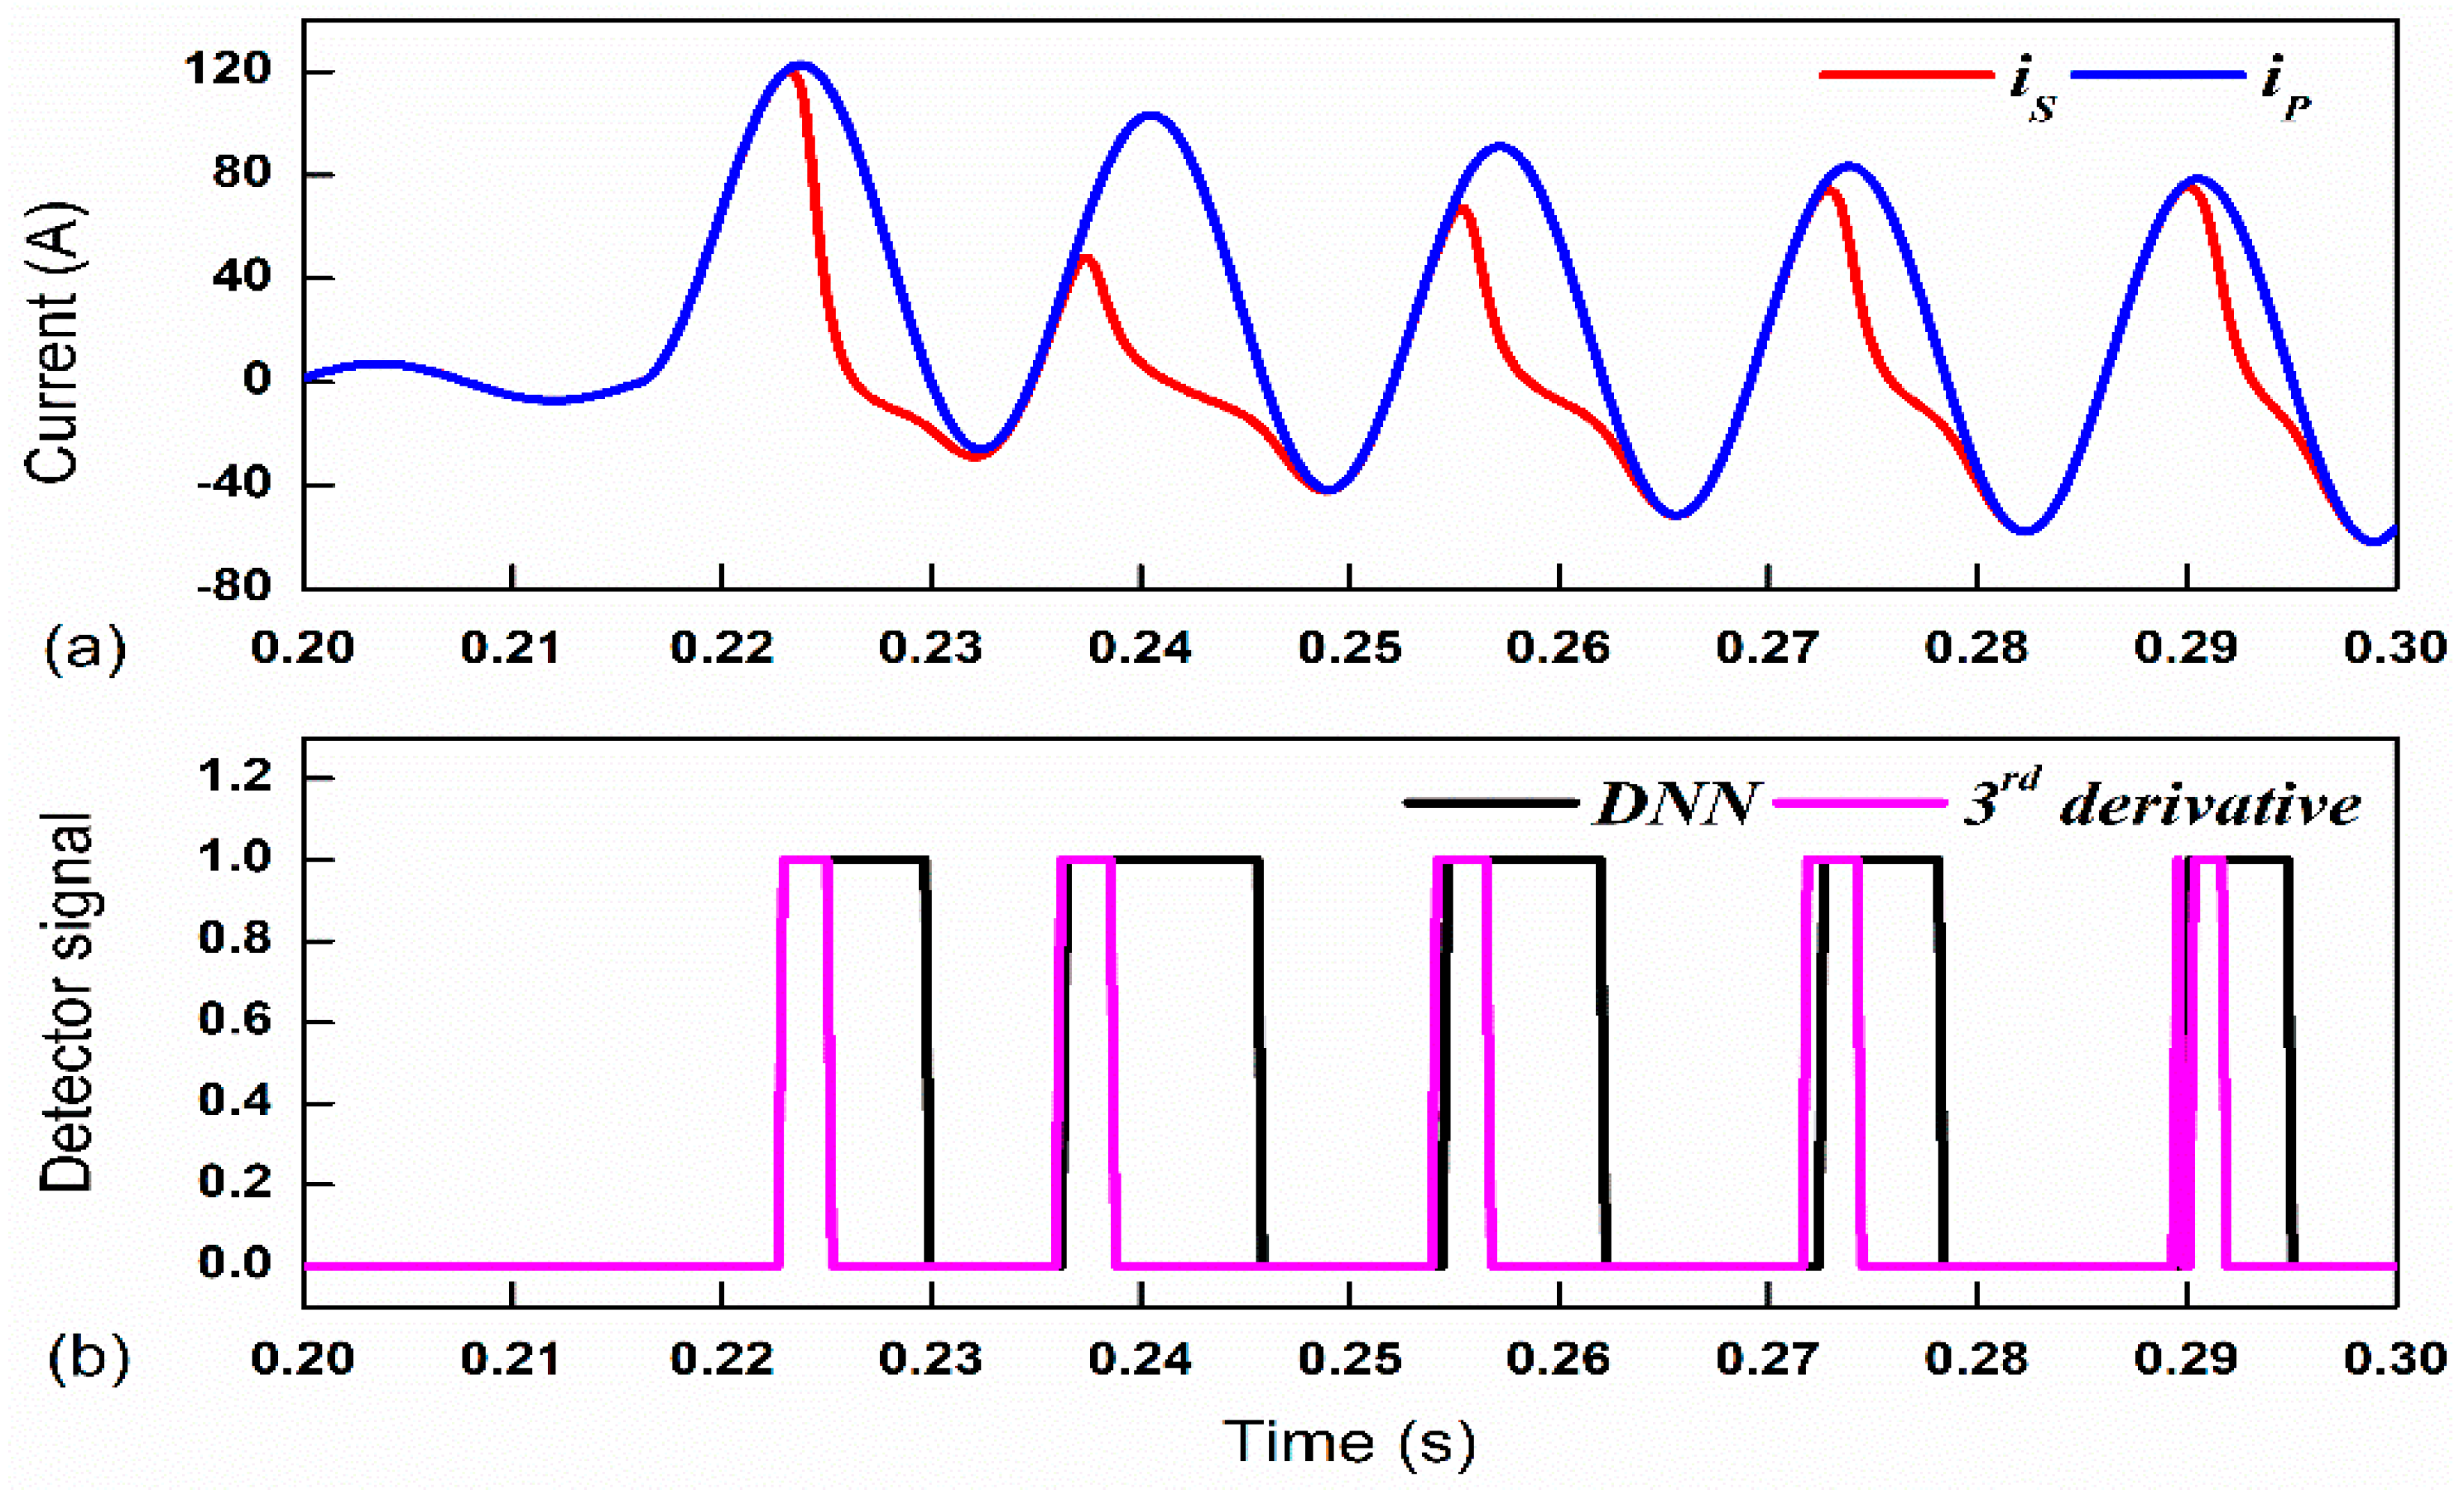
To prove the detection capability on other power system voltage using the proposed DNN, the saturation waveform on the 345 kV system was simulated with FIA of 00 and remnant flux of 80%, which corresponds to the most severe saturation in this case study. The detection accuracy on the 345 kV system was thoroughly verified. As depicted in Figure 9, the saturation decayed slowly because of the large time constant. It was observed that the precision of saturation detection was very accurate and quick. Similarly, the onsets of saturation were accurately detected using the third derivatives method. Unfortunately, it produced a malfunction in which the endpoint of saturation occurred faster. CSC and FSD yielded roughly 97.25% and 0.016%, respectively, whereas the accuracy almost reached the maximum value of 99.36%.
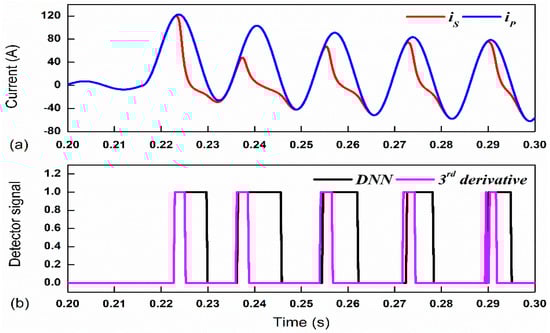
Figure 9.
The detection result of CT saturation on the 345-kV (FIA of 00, and remnant flux of 80%). (a) Saturated and non-saturated waveform; (b) Detection signals.
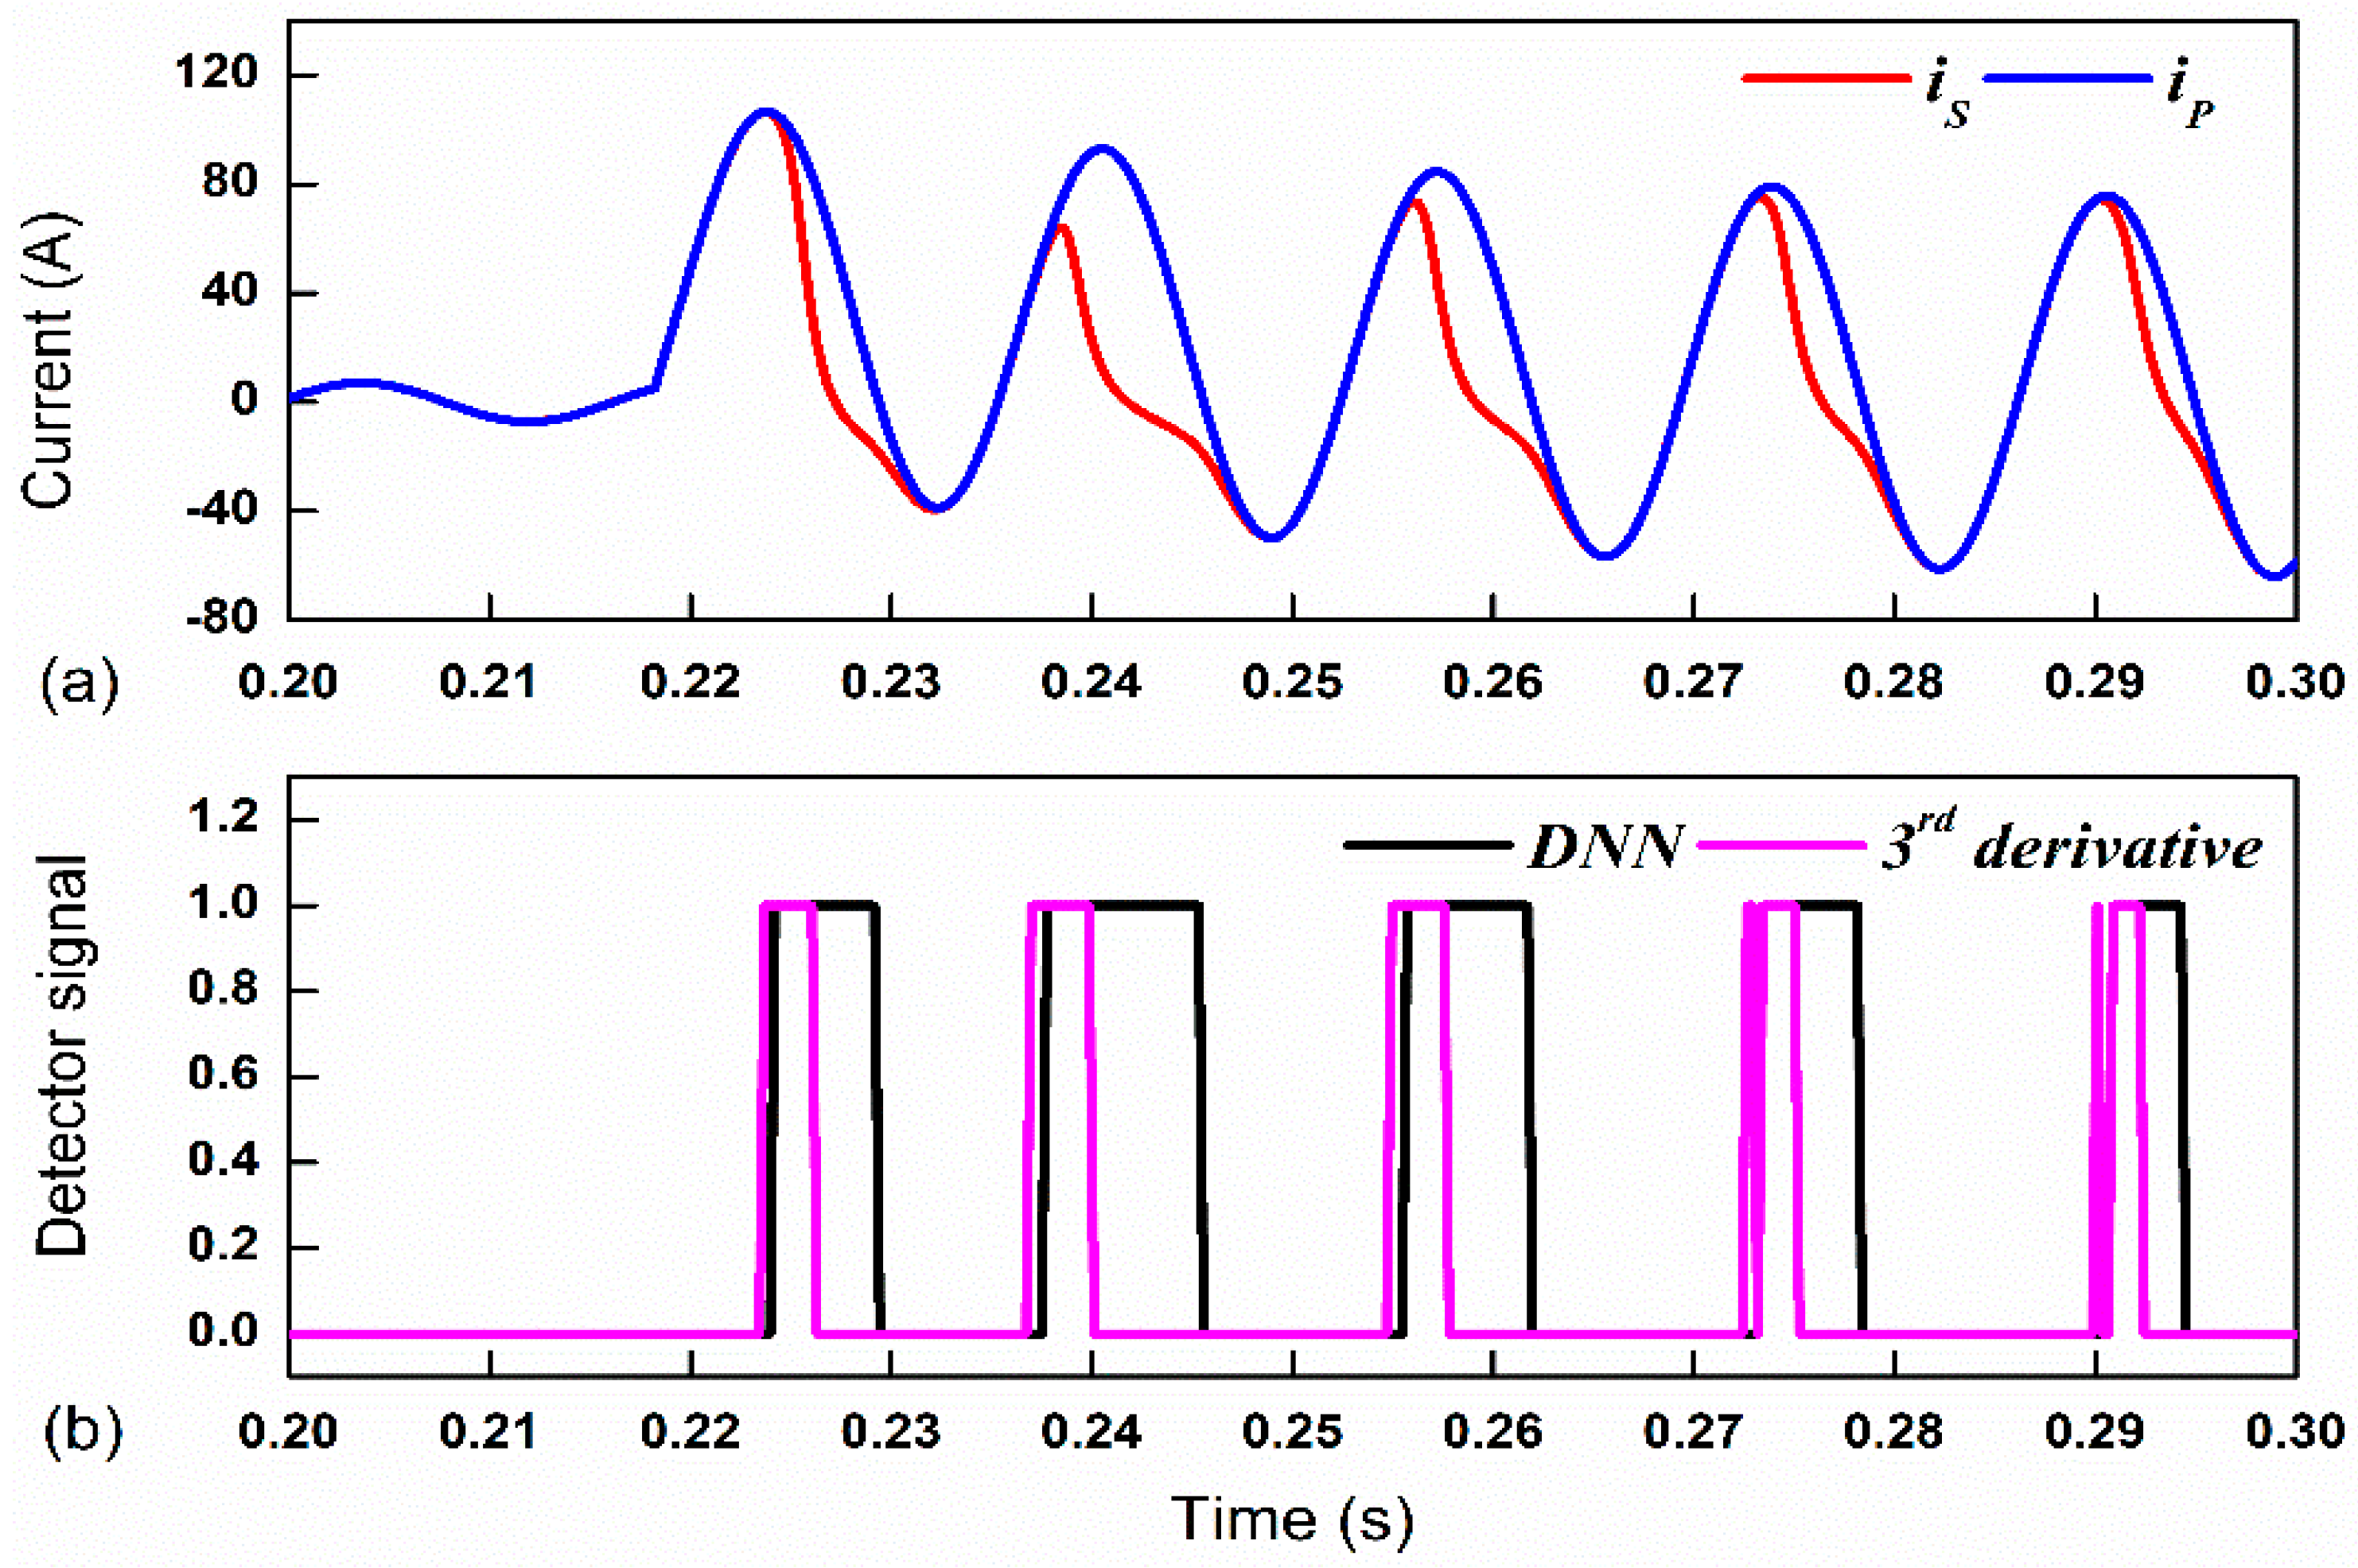
In order to verify the performance of the proposed algorithm for different FIAs, FIA was set to 450 which outputs less severe saturation than the previous case. Results for the FIA of 450 are illustrated in Figure 10; the saturation in each cycle was not as severe as the above case. It is noticeable that the saturation interval was precisely detected with the third derivatives method for each time saturation that occurred. Despite the quick response to the saturation, the endpoints were mis-detected. The output response from the DNN method gives a better estimation of the endpoint saturation that was usable in detecting the saturation interval. The accuracy, CSC, and FSD yielded from DNN were 98.12%, 96.75%, 0.019%, respectively. Therefore, the effect of varying the FIA on the performance of the proposed DNN approach was negligible because the input was normalized to exact similar range. According to the statistics of FSD yield in Table 3 and Table 4, they clearly indicate that the rate of misclassification was greatly reduced.

Figure 10.
The detection result of CT saturation on the 154-kV (FIA of 450, and remnant flux of 80%). (a) Saturated and non-saturated waveform; (b) Detection signals.
Table 3.
Metrics measured from DNN for the 154kV system.
Table 4.
Metrics measured from DNN for the 345kV system.
4.5. Generalization Performance Verification
The generalization of the proposed DNN on CT models in PSCAD/EMTDC was demonstrated. The JA model is another CT model which was built and provided in PSCAD/EMTDC with a slightly different characteristic of saturation. Unlike the Lucas model, JA is modeled on the basis of the physics of magnetic material, which may be identical to the real application. The JA model is a built-in model of PSCAD/EMTDC, with parameter traversal such as CT ratio, remnant flux, burden, and so on. Table 5 shows the saturation detection performance provided by the JA model, in terms of overall accuracy, CSC, and FSD. In conclusion, the performance of the proposed DNN was still promising, yielding the best accuracy and effectiveness despite being trained with the Lucas CT model.
Table 5.
Overall metrics measured from DNN for the JA CT model.
The capabilities of the proposed DNN produce promising results for CTs which share similarities in characteristics and the saturation curve. According to Table 5, it can be obviously concluded that the similar characteristic from the JA model does not provide a detrimental effect on the performance of the proposed DNN in detecting CT saturation. The ACC, CSC, and FSD clearly demonstrate the strong impact of the DNN application in solving the given tasks. From the above results displayed in Figure 7, Figure 8, Figure 9 and Figure 10, the impact of influencing factors on CT saturation, such as fault inception angle, and remnant flux, is minuscule on the DNN model. It detects the CT saturation interval precisely in each cycle and the proportion of misclassification during the saturation and non-saturation is minimized to the lowest rate according to the FSD displayed in Table 3, Table 4 and Table 5.
5. Conclusions
In this study, an intelligent method consisting of SDAEs and moving data algorithm is proposed for CT saturation detection. SDAEs were established with the lowest error and high accuracy to build a deeper network. The training dataset contained random noise, and harmonics were included in the training phase to demonstrate the capability of SDAEs to suppress noise in case of noisy conditions. BO was a great tool to optimize the network training parameters, which reduced the uncertainty in deep learning parameter searching. The performance of SDAEs was thoroughly verified on the simulated data from PSCAD/EMTDC, which covered many saturation variations such as fault inception angles, remnant flux, and power system levels. Compared with [8], output from SDAEs produced the highest accuracy, and could be a potential tool to be used to detect saturation in real systems. The generalization of the detection scheme was realized on another built-in CT model in PSCAD/EMTDC. Regarding future research, hardware implementation will be developed and applied in real-time simulation using RTDS simulation. The limitation of the proposed BDNN is that it is generalized to only some of the specific current transformers that share similar characteristics with the CTs used in the training phase.
Author Contributions
Conceptualization, S.K. and S.-R.N.; methodology, S.K., K.-J.S. and S.-R.N.; supervision, S.-R.N.; validation, S.K. and C.-S.K.; writing—original draft, S.K. and S.-R.N.; writing— review and editing, S.K., C.-S.K. and K.-J.S. All authors have read and agreed to the published version of the manuscript.
Funding
This research was supported by the Korea Research Foundation with funding from the government (Ministry of Education) in 2021 (No. NRF-2021R1F1A1061798).
Institutional Review Board Statement
Not applicable.
Informed Consent Statement
Not applicable.
Data Availability Statement
Not applicable.
Conflicts of Interest
The authors declare no conflict of interest.
Appendix A
Table A1.
The system data used for the testing part in the performance evaluation section is given in detail. The transmission line parameters used in this study is applicable in Korean system.
Table A1.
The system data used for the testing part in the performance evaluation section is given in detail. The transmission line parameters used in this study is applicable in Korean system.
| Sequence | Parameters | Value | Unit | |
|---|---|---|---|---|
| 154 kV | 345 kV | |||
| Positive & Negative | R1, R2 | 0.0419 | 0.0169 | Ω/km |
| L1, L2 | 0.8921 | 0.6617 | mH/km | |
| C1, C2 | 0.0128 | 0.0141 | µF/km | |
| Zero | R0 | 0.0293 | 0.1354 | Ω/km |
| L0 | 2.6657 | 2.4874 | mH/km | |
| C0 | 0.0042 | 0.0046 | µF/km | |
References
- C37.110-2007; IEEE Guide for the Application of Current Transformers Used for Protective Relaying Purposes. IEEE: Piscataway, NJ, USA, 2008; pp. 1–90.
- Haji, M.M.; Vahidi, B.; Hosseinian, S.H. Current Transformer Saturation Detection Using Gaussian Mixture Model. J. Appl. Res. Technol. 2013, 11, 79–87. [Google Scholar] [CrossRef]
- Rebizant, W.; Bejmert, D. Current Transformer Saturation Detection with Genetically Optimized Neural Networks. IEEE Trans. Power Del. 2007, 22, 820–827. [Google Scholar] [CrossRef]
- Moradi, A.R.; Alinejad Beromi, Y.; Kiani, K.; Moravej, Z. Artificial Intelligence Based Approach for Identification of Current Transformer Saturation from Faults in Power Transformers. Int. J. Smart Electr. Eng. 2014, 3, 37–46. [Google Scholar]
- Sheng, Y.; Rovnyak, S.M. Decision trees and wavelet analysis for power transformer protection. IEEE Trans. Power Deliv. 2002, 17, 429–433. [Google Scholar] [CrossRef]
- Ali, M.; Son, D.H.; Kang, S.H.; Nam, S.R. An Accurate CT Saturation Classification Using a Deep Learning Approach Based on Unsupervised Feature Extraction and Supervised Fine-Tuning Strategy. Energies 2017, 10, 1830. [Google Scholar] [CrossRef]
- Kang, Y.C.; Lim, U.J.; Kang, S.H.; Crossley, P.A. Compensation of the distortion in the secondary current caused by saturation and remanence in a CT. IEEE Trans. Power Del. 2004, 19, 1642–1649. [Google Scholar] [CrossRef]
- Kang, Y.C.; Ok, S.H.; Kang, S.H. A CT saturation detection algorithm. IEEE Trans. Power Del. 2004, 19, 78–85. [Google Scholar] [CrossRef]
- Schettino, B.M.; Duque, C.A.; Silverira, P.M.; Ribeiro, P.F.; Cerqueira, A.S. A New Method of Current Transformer Saturation Detection in the Presence of Noise. IEEE Trans. Power Del. 2014, 29, 1760–1767. [Google Scholar] [CrossRef]
- Hooshyar, A.; Sanaye-Pasand, M. Accurate measurement of the fault current contaminated with decaying DC offset and CT saturation. IEEE Trans. Power Del. 2012, 27, 773–783. [Google Scholar] [CrossRef]
- Villamagna, N.; Crossley, P. A CT Saturation Detection Algorithm Using Symmetrical Components for Current Differential Protection. IEEE Trans. Power Del. 2006, 21, 38–45. [Google Scholar] [CrossRef]
- Fernandez, C. An Impedance-Based CT Saturation Detection Algorithm for Bus-Bar Differential Protection. IEEE Trans. Power Del. 2001, 16, 468–472. [Google Scholar] [CrossRef]
- dos Santos, E.M.; Cardoso, G.; Farias, P.E.; Morais, A.P. CT Saturation Detection Based on the Distance Between Consecutive Points in the Plans Formed by the Secondary Current Samples and Their Difference Functions. IEEE Trans. Power Del. 2013, 28, 29–37. [Google Scholar] [CrossRef]
- Lu, Z.; Smith, J.S.; Wu, Q.H. Morphological Lifting Scheme for Current Transformer Saturation Detection and Compensation. IEEE Tran. Circuits Syst. 2008, 55, 3349–3357. [Google Scholar] [CrossRef]
- Hong, Y.Y.; Wei, D.W. Compensation of distorted secondary current caused by saturation and remanence in a current transformer. IEEE Trans. Power Del. 2010, 25, 47–54. [Google Scholar] [CrossRef]
- Hong, Y.Y.; Chang-Chian, P.C. Detection and correction of distorted current transformer current using wavelet transform and artificial intelligence. IET Gener. Transmiss. Distrib. 2008, 2, 566–575. [Google Scholar] [CrossRef]
- Schettino, B.M.; Duque, C.A.; Silverira, P.M. Current-transformer saturation detection using Savitzky–Golay filter. IEEE Trans. Power Del. 2016, 31, 1400–1401. [Google Scholar] [CrossRef]
- Dashti, H.; Pasand, M.S.; Davarpanah, M. Fast and Reliable CT Saturation Detection Using a Combined Method. IEEE Trans. Power Del. 2009, 24, 1037–1044. [Google Scholar] [CrossRef]
- Biswal, S.; Biswal, M. Detection of current transformer saturation phenomenon for secured operation of smart grid power network. Electr. Power Syst. Res. 2016, 175, 105926. [Google Scholar] [CrossRef]
- Naseri, F.; Kazemi, Z.; Farjah, E.; Ghanbari, T. Fast Detection and Compensation of Current Transformer Saturation Using Extended Kalman Filter. IEEE Trans. Power Del. 2019, 34, 1087–1097. [Google Scholar] [CrossRef]
- Kim, S.B.; Sok, V.; Kang, S.H.; Lee, N.H.; Nam, S.R. A Study on Deep Neural Network-Based DC Offset Removal for Phase Estimation in Power Systems. Energies 2019, 12, 1619. [Google Scholar] [CrossRef]
- Sok, V.; Lee, S.-W.; Kang, S.-H.; Nam, S.-R. Deep Neural Network-Based Removal of a Decaying DC Offset in Less Than One Cycle for Digital Relaying. Energies 2022, 15, 2644. [Google Scholar] [CrossRef]
- Key, S.; Kang, S.H.; Lee, N.H.; Nam, S.R. Bayesian Deep Neural Network to compensate for Current Transformer Saturation. IEEE Access 2021, 9, 154731–154739. [Google Scholar] [CrossRef]
- IEEE Power System Relaying and Control Committee, “CT Saturation Theory and Calculator. Available online: http//www.pes-psrc.org (accessed on 5 February 2022).
- Hinton, G.E.; Osindero, S.; The, Y.W. A fast learning algorithm for deep belief nets. Neural Comput. 2006, 18, 1527–1557. [Google Scholar] [CrossRef]
- Bengio, Y.; Lamblin, P.; Popovici, D.; Larochelle, H. Greedy Layer-wise Training of Deep Networks. In Proceedings of the 19th International Conference on Neural Information Processing Systems NIPS’06, Vancouver, BC, Canada, 4–7 December 2006; pp. 153–160. [Google Scholar]
- Vincent, P.; Larochelle, H.; Lajoie, I.; Bengio, Y.; Manazagol, P.A. Stacked Denoising Autoencoders: Learning Useful Representations in a Deep Network with a Local Denoising Criterion. J. Mach. Learn. Res. 2010, 11, 3371–3408. [Google Scholar]
- Lucas, J.R.; McLaren, P.G.; Keerthipala, W.W.L.; Jayasinghe, R.P. Improved simulation models for current and voltage transformers in relay studies. IEEE Trans. Power Deliv. 1992, 7, 152–159. [Google Scholar] [CrossRef]


Disclaimer/Publisher’s Note: The statements, opinions and data contained in all publications are solely those of the individual author(s) and contributor(s) and not of MDPI and/or the editor(s). MDPI and/or the editor(s) disclaim responsibility for any injury to people or property resulting from any ideas, methods, instructions or products referred to in the content. |
© 2023 by the authors. Licensee MDPI, Basel, Switzerland. This article is an open access article distributed under the terms and conditions of the Creative Commons Attribution (CC BY) license (https://creativecommons.org/licenses/by/4.0/).