Article

Numerical Analysis of In Situ Conversion Process of Oil Shale Formation Based on Thermo-Hydro-Chemical Coupled Modelling

1
Research Institute of Petroleum Exploration and Development, PetroChina, Beijing 100083, China
2
Key Laboratory of Oil and Gas Production, CNPC, Beijing 100083, China
3
Engineering and Technology Department, Qinghai Oilfield, PetroChina, Dunhuang 736202, China
4
Drilling and Production Technology Research Institute of Qinghai Oilfield PetroChina, Dunhuang 736202, China
*
Authors to whom correspondence should be addressed.
Energies 2023, 16(5), 2103; https://doi.org/10.3390/en16052103
Submission received: 26 October 2022 / Revised: 30 December 2022 / Accepted: 6 January 2023 / Published: 21 February 2023
(This article belongs to the Special Issue Development of Unconventional Oil and Gas Fields)

Abstract

:
The in situ conversion process (ICP) is a retorting method pyrolyzing the kerogen in shale into oil and gas products, which shows great potential to promote the recovery of oil shale resources. In this work, a thermo-hydro-chemical-coupled model for the in situ conversion process is established, considering the temperature dependence of key properties and the transverse isotropy caused by the layered characteristics of oil shale. Based on the proposed model, a series of simulations is conducted to evaluate the production performance of the in situ conversion process of oil shale reservoirs. The results indicate that energy efficiency reaches a maximum of 2.7 around the fifth year of the heating process, indicating the feasibility of in situ conversion technology. Furthermore, the sensitivity analysis shows that the heating temperature should be higher than 300 °C to avoid the energy output being less than the energy input, and the oil/gas ratio decreases with increasing heating temperature. Moreover, thermal conductivity is positively with production while heat capacity is negatively correlated, and the energy efficiency decreases with increasing thermal conductivity and matrix heat capacity. Finally, the heating period should be no longer than 4 years to maximize the heating efficiency.

1. Introduction

With the increasing consumption of conventional energy resources, the search for new energy alternatives has become an important issue. As an unconventional energy resource, oil shale is widely distributed all over the world and abundant in reserves. The equivalent production of shale oil is 689 billion tons, which is four times the reserves of crude oil. Therefore, the effective exploitation of oil shale resources is of great significance to solve the increasingly strained global energy problem [1,2,3,4]. High-maturity oil shale reservoirs are rich in liquid oil and gas, which can be directly exploited after using horizontal well hydraulic fracturing technology to improve its permeability. Reservoirs of low maturity are rich in various macromolecular solid organic matters (kerogen), and only contain a small amount of movable oil and gas. It is necessary to convert the solid kerogen into liquid products by retorting methods to exploit low-maturity oil shale reservoirs [5,6,7,8]. There are two main retorting methods for low-maturity oil shale, one is aboveground retorting, and the other is in situ conversion technology, i.e., underground retorting. The aboveground retorting is only suitable for oil shale reservoirs with a shallow embedding depth and causes enormous damage to the environment. In addition, the aboveground retorting process needs to be carried out in an anaerobic environment, which will inevitably produce a large amount of toxic gases and residues while producing shale oil and shale gas [9,10,11]. In situ conversion technology supplies energy to the reservoir through strategically drilled wells to pyrolyze the kerogen in oil shale to produce oil and gas; additionally, the permeability of oil shale formations is improved, which subsequently promotes the extraction of oil and gas products through the production wells [12,13,14], as shown in Figure 1. Compared with aboveground retorting, in situ conversion technology is a more environmentally friendly, cost-efficient, and an effective approach for the exploitation of low-maturity oil shale reservoirs [15,16]. However, due to the complex geological environment of the oil shale reservoir and enormous energy and time costs, in situ conversion technology is still in the development stage, and a series of engineering and scientific problems hindering the practice of the technique needs to be solved sooner rather than later [15].
In situ conversion technologies can be divided into four categories according to the heating methods: in situ conduction heating, in situ convection heating, in situ combustion heating, and radiation heating [17,18,19]. Among them, the in situ heating conduction technology is the most mature, using electric heaters to heat the oil shale reservoir so that the kerogen can be pyrolyzed into oil and gas products, and it has achieved great success in the field tests of Royal Dutch Shell [20]. No matter which heating method is used, there are two main challenges in the in situ conversion process: one is to heat the shale oil reservoir to the pyrolysis temperature of kerogen, and the other is to extract the generated oil and gas products to the ground. The pyrolysis temperature of kerogen is rather high and the initial permeability of oil shale is very low, which limit the exploitation of oil shale resources [21,22,23]. Field tests require enormous energy input, and often up to several years, while laboratory experiments cannot capture the complex geological environment of oil shale reservoirs [24,25]. Therefore, the numerical simulation method has become a powerful tool that can provide theoretical guidance and technical support for the practical application of in situ conversion technology.
Figure 1. Schematic diagram of the in situ conversion process [12,20].
Energies 16 02103 g001
To precisely reflect the pyrolysis of various substances during the in situ conversion process, a reliable kinetic model is required, which has a key influence on the accuracy of the model, especially the prediction of oil and gas production [26,27,28,29]. Hubbard and Robinson [30] proposed a multi-stage pyrolysis model of kerogen that includes various stages of bitumen, oil, gas, and coke. Based on the kinetic theory proposed by Antony and Howard [31], Campbell et al. [32] analyzed the non-isothermal kinetics process of the pyrolysis for Colorado oil shale and concluded that the pyrolysis of kerogen undergoes three different stages with the change of temperature. Burnham and Braun [33] proposed a reaction kinetic model combining multiple serial and parallel reactions, which was widely used in later simulations and gained satisfactory results. To understand the complex mechanisms associated with the in situ conversion process and the effects of the engineering and reservoir parameters on production, most researchers have adopted multi-physics modeling. Considering borehole reflux heat loss and well skin effects of the production well, Shen et al. [34] conducted a simulation based on a field test of Shell in Colorado, and the results obtained were in good agreement with the production data. Fan et al. [35] developed a thermo-hydro-chemical numerical formulation and analyzed the effects of heating temperature, heater spacing, and heater pattern on the production performance of the in situ conversion process. Song et al. [36] proposed a novel method using multilateral wells to conduct in situ conversion via steam injection and conducted a sensitivity analysis of oil shale properties and well arrangements. Given the anisotropy of the properties of oil shale, Wang et al. [37] established a thermal-hydraulic-mechanical model to investigate the in situ oil shale pyrolysis process by superheated steam.
Although many researchers have tried to establish a coupled multi-physics model to describe the complex physical and chemical behavior during the in situ conversion process, they generally have an insufficient coupling of various physical fields and some dynamic changes of key physical properties, such as thermal conductivity and permeability, are ignored, as well as the transverse isotropy of physical properties caused by the layered characteristics of oil shale [25,38]. In this work, a fully coupled thermo-hydro-chemical model is established to achieve a comprehensive analysis of in situ conversion technology. First, a chemical reaction model is adopted to simulate the multi-stage pyrolysis of kerogen in the in situ conversion process. Second, the output of oil and gas products is described by a seepage model. Finally, the temperature field is calculated based on the energy conservation equation considering heat conduction, heat convection, and reaction enthalpy [5,35]. On this basis, a series of simulations is carried out to evaluate the production performance and heating efficiency during the in situ conversion process, which provides a comprehensive understanding and scientific guidance for in situ conversion technology.
The remaining part of this work is organized as follows: The thermo-hydro-chemical coupled governing equation is illustrated in detail in Section 2. In Section 3.1, a base case is established to evaluate the production performance of the in situ conversion process of oil shale. The influence of heating temperature and thermophysical properties of oil shale are analyzed in Section 3.2 and Section 3.3, respectively. The sensitivity analysis of the heating period is carried out in Section 3.4. Main findings of this work are stated in Section 4.

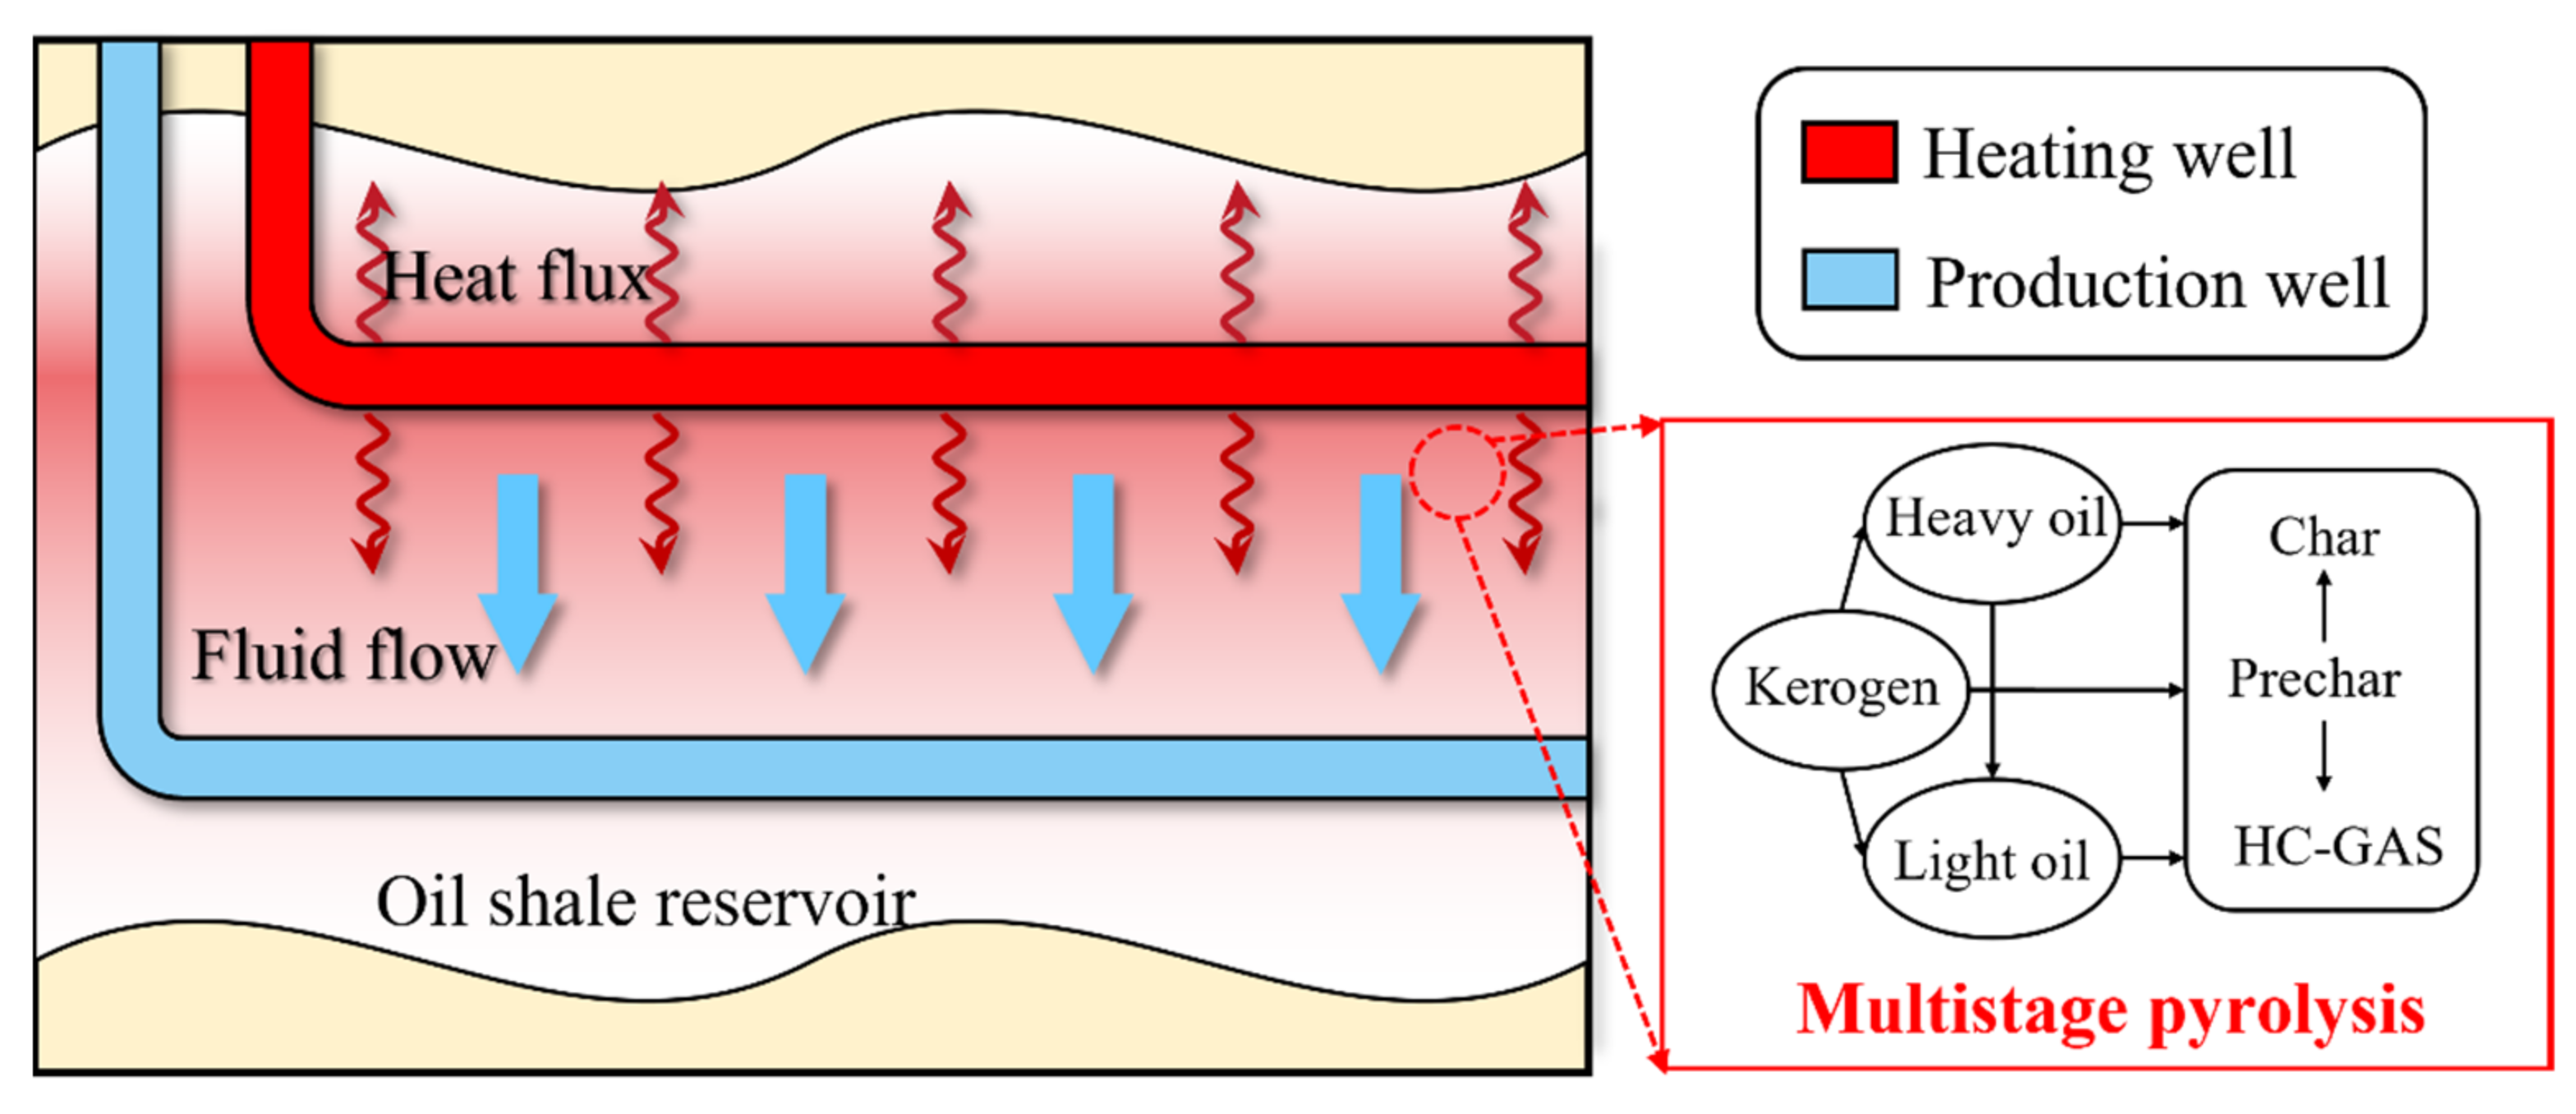
2. Model Description

2.1. Basic Assumptions

(1)
The flow of fluid products is considered as single-phase flow.
(2)
The deformation of oil shale is negligible.
(3)
The density of solid components is constant.
(4)
Due to the layered characteristics of oil shale, it is considered as a transversely isotropic material.
(5)
The porosity of oil shale is described as a function of temperature.

2.2. Pyrolytic Reaction Kinetics

As mentioned, the thermal decomposition of kerogen in oil shale is a complex process involving a series of multistage pyrolysis reactions. In the modeling of the in situ conversion process, the chemical reaction plays a decisive role in the alteration of the concentration of each substance. In this work, the chemical reaction model is adopted from Pei et al. [39], which is simplified based on the chemical reaction model proposed by Braun and Burnham [33] in 1992. The simplification of the model reduces the computation time while maintaining accuracy as much as possible. It should be noted that the kerogen in the model cannot be described by a specific chemical formula, because it is an organic mixture composed of macromolecular compounds, and a normalized form CH1.5N0.026O0.05 is adopted to represent kerogen [40]. Another challenge is that the heavy oil, light oil, and hydrocarbon gas (hereinafter referred to as HC gas) in the reaction model exist as integrated components, which makes it difficult to obtain their physical and chemical properties. Therefore, the physical and chemical properties of alkanes with the closest molecular weight are adopted instead. The details of chemical reaction kinetics are shown in Table 1.
In this work, the first-order rate law is used to calculate the reaction rate of each reactant [41]:
r j = K j c i v i j
K j = A j exp E j R g T
where the subscript j represents the j-th reaction and i represents the reactant, rj is the reaction rate (mol/(m3·s)), ci is the molar concentration (mol/m3), vij is the stoichiometric number of reactant i in the j-th reaction. The forward rate constant is defined as Kj (1/s), which can be calculated by the Arrhenius expression [41]. Aj is the reaction frequency factor (1/s), Ej represents the reaction activation energy (J/mol), Rg denotes the ideal gas constant (J/(mol·K)), and T is the thermodynamic temperature (K).
The change in the concentration of fluid components during the in situ conversion process depends on the chemical reaction, convection, and diffusion, and the governing equation based on the mass conservation equation is expressed as [42]:
ε c i t + J i + u c i = R i
where ε is oil shale porosity, u is the flow velocity (m/s), Ji is the diffusion flux (mol/(m2·s)), Ri is the total reaction rate of component i (mol/(m3·s)):
J i = D i c i
R i = j r j v i j
where the diffusion coefficient of substance i (m2/s) is denoted as Di.
Compared with fluid components, the effects of diffusion and convection of solid components can be ignored. Furthermore, the change in porosity does not contribute to the change in the solid concentration [34]. Therefore, the concentration of solid components is calculated as:
c i t = R i
Finally, the energy change Q (J) resulting from the multistage pyrolysis of kerogen is expressed as:
Q = j r j H j
where Hj is the change in enthalpy (J/mol) of reaction j.

2.3. Flow in Porous Media

The pyrolysis of kerogen generates a large amount of oil and gas products, which are directed to the production wells due to a pressure gradient. Since the flow of underground oil and gas products can be regarded as laminar flow through sediments, Darcy’s law is valid for the flow velocity calculation [43]:
u = κ μ p + g
Here u is the flow velocity (m/s), κ denotes the permeability of oil shale (m2), μ is the dynamic viscosity (Pa·s), p represents the fluid pressure (Pa), g is the gravity acceleration (m/s2).
The equation of mass conservation of fluid in porous media can be described as:
t ε ρ + ρ u = Q m
where ρ represents the density of the fluid (kg/m3), and Qm is the mass source/sink term (kg/(m3·s)), which is determined by the generation/consumption of total fluid products (heavy oil, light oil, HC gas) in multistage pyrolysis reaction of kerogen, and it is calculated as follows:
Q m = i j r j v i j M i
where Mi is the molecular weight of substance i. Combining Equations (8)–(10), the governing equation of pressure is obtained as:
ε ρ t ρ κ μ p + g = i j r j v i j M i
The accuracy of the fluid velocity calculation is vital for the prediction of production, where porosity and permeability play key roles as shown in Equations (8) and (9). As a kind of tight sedimentary rock, the porosity and permeability of oil shale reservoirs are very low, which cannot provide a feasible storage and flow path for oil and gas [44,45]. During the in situ conversion process, the porosity and permeability of oil shale will be greatly improved due to the pyrolysis of kerogen and the formation of thermal cracks, which promotes the output of oil and gas products. Experiments show that the porosity of oil shale can be improved from 0–0.05 to more than 0.2, and the permeability can be improved from 0.0001 mD to more than 1 mD [46,47,48]. To precisely describe the evolution of porosity during the in situ conversion process, this work presents an approach using the porosity–temperature interpolation function relationship obtained by experiments. [46]. The variation of permeability with porosity can be described by the following Carman–Kozeny equation:
κ = κ 0 × ε ε 0 3 × 1 ε 0 1 ε 2
where ε0 and κ0 are the initial porosity and permeability, respectively. Considering the difference of permeability in orthogonal directions caused by the bedding characteristic of oil shale, the permeability perpendicular to beddings is set to one-tenth of the permeability parallel to beddings [25,39,49].

2.4. Heat Transfer Model of Porous Media

Temperature is a decisive factor in the in situ conversion process. Not only is the reaction rate of kerogen pyrolysis determined by temperature, but many key properties are temperature-dependent. There are two main types of heating methods involved in the in situ conversion process, one is the heat conduction caused by the heating well; the other is heat convection owing to the flow of high-temperature oil and gas products. In addition, the change in enthalpy of chemical reactions will also serve as a heat source/sink. In summary, the calculation of the temperature field based on the energy conservation equation is [50]:
ρ C p eff   T t + ρ C p , l u T + k e f f T = Q
where Q denotes the heat source caused by chemical reactions, (ρCp)eff is the equivalent heat capacity, keff is the equivalent thermal conductivity (W/(m·K)) [50]:
ρ C p eff   = 1 ε ρ s C p s + ε ρ f C p f
k eff   = 1 ε k s + ε k f
where ρs, Cps and ρf, Cpf represent the density and volumetric heat capacity (J/m3) of oil shale matrix and fluid products, respectively, ks is the thermal conductivity of the oil shale matrix, and kf is the thermal conductivity of fluid products. Considering the layered characteristics of oil shale, the thermal conductivity parallel to the bedding direction ks_par is set different from the thermal conductivity perpendicular to the bedding direction ks_per, which is adapted from Wang et al. [38]:
k s = k s _ p a r 0 0 k s _ p e r
k s _ p a r = 4.563 × 10 6 × T 273.15 2 0.00119 × T 273.15 + 0.7581
k s _ p e r = 1.176 × 10 6 × T 273.15 2 0.00285 × T 273.15 + 1.9381

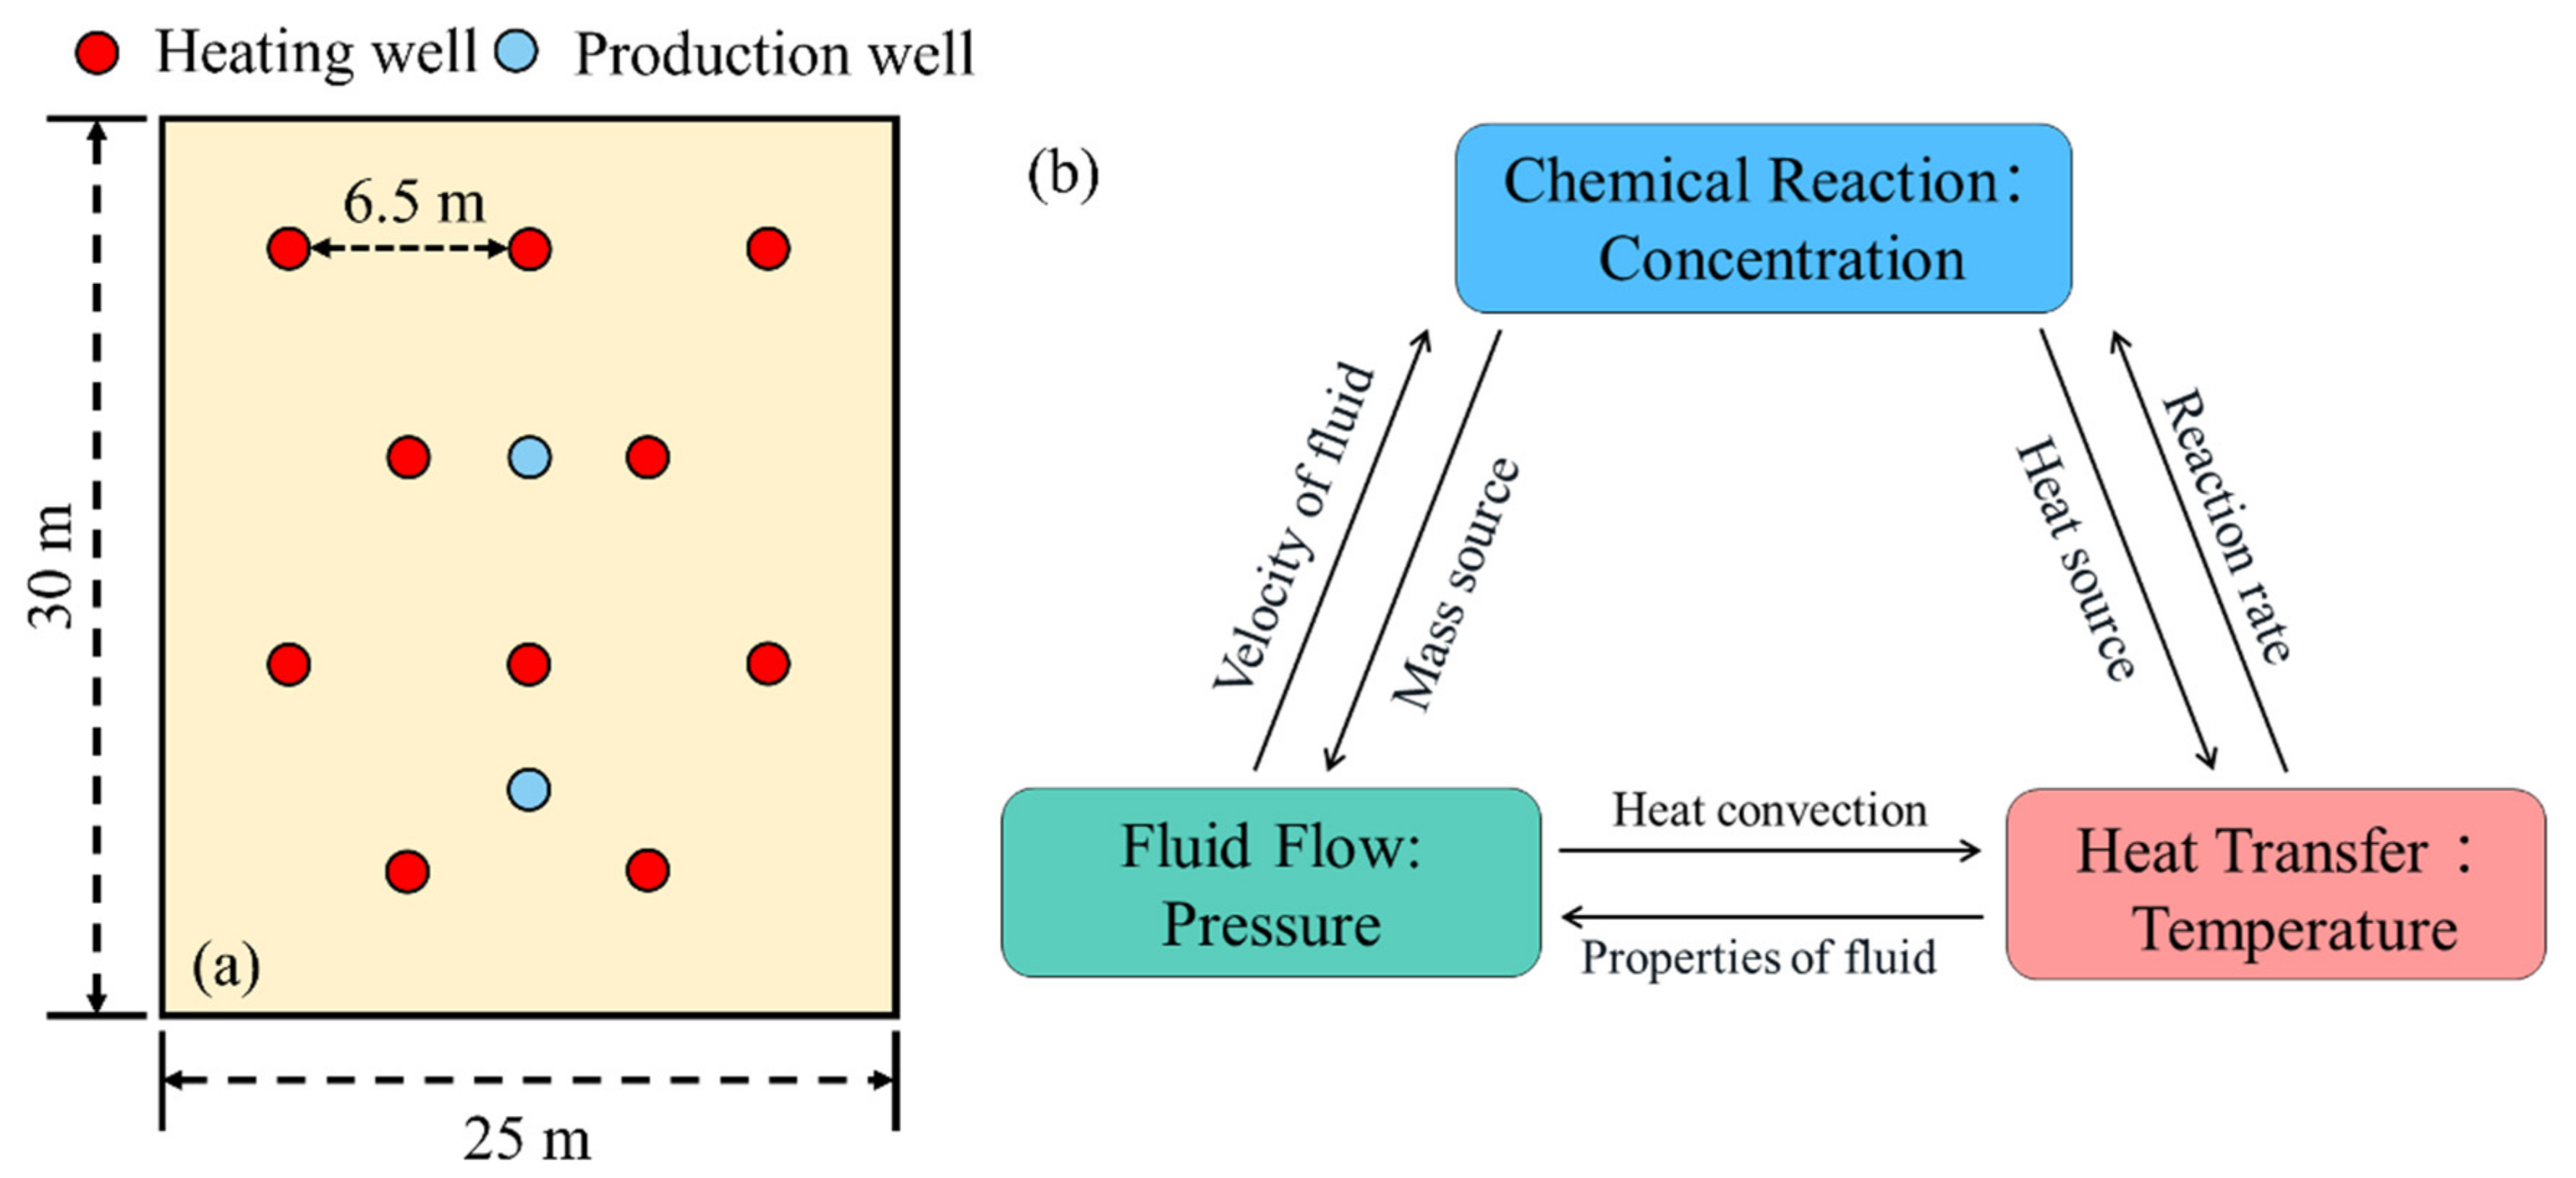
2.5. Numerical Model and Input Parameters

Based on the in situ conduction conversion technology, a two-dimensional simplified oil shale reservoir model, with a size of 25 m × 30 m, is established as shown in Figure 2a. The model is designed with 10 heating wells (which are distributed as regular triangles with a side length of 6.5 m) and 2 production wells. The initial temperature of the oil shale reservoir is set to 20 °C, the initial pressure is set to 8 MPa, the temperature of the heating wells is set to a constant value of 360 °C, the bottom hole pressure of the production well is set to 1 MPa, and the total simulation time is 8 years. Surrounding the oil shale reservoir is a heat loss zone with a boundary that is thermally insulated far from the reservoir model in Figure 2a. In other words, there is only mass and energy exchange at the boundary of the heating wells and the production wells. All results in this study are calculated by assuming a reservoir thickness of 1 m. The input parameters are summarized in Table 2.
In summary, a thermo-hydro-chemical coupled model for the in situ conversion process is established, and the temperature dependence and the transverse isotropy of the physical properties of oil shale are taken into account in this work. The relationship of the coupled physical fields is shown in Figure 2b, and the key parameters are listed in Table 2. The proposed model was implemented in COMSOL Multiphysics, which is a finite element analysis software developed by COMSOL Incorporation in Stockholm, Sweden. Four modules were used to solve the model: Heat Transfer Module, Darcy Flow Module, Chemical Engineering Module, and Transport of the Dilute Species Module, where the GMRES iterative solver was adopted. Based on the proposed model, a series of analyses is carried out to reveal the internal mechanism of the in situ conversion process.

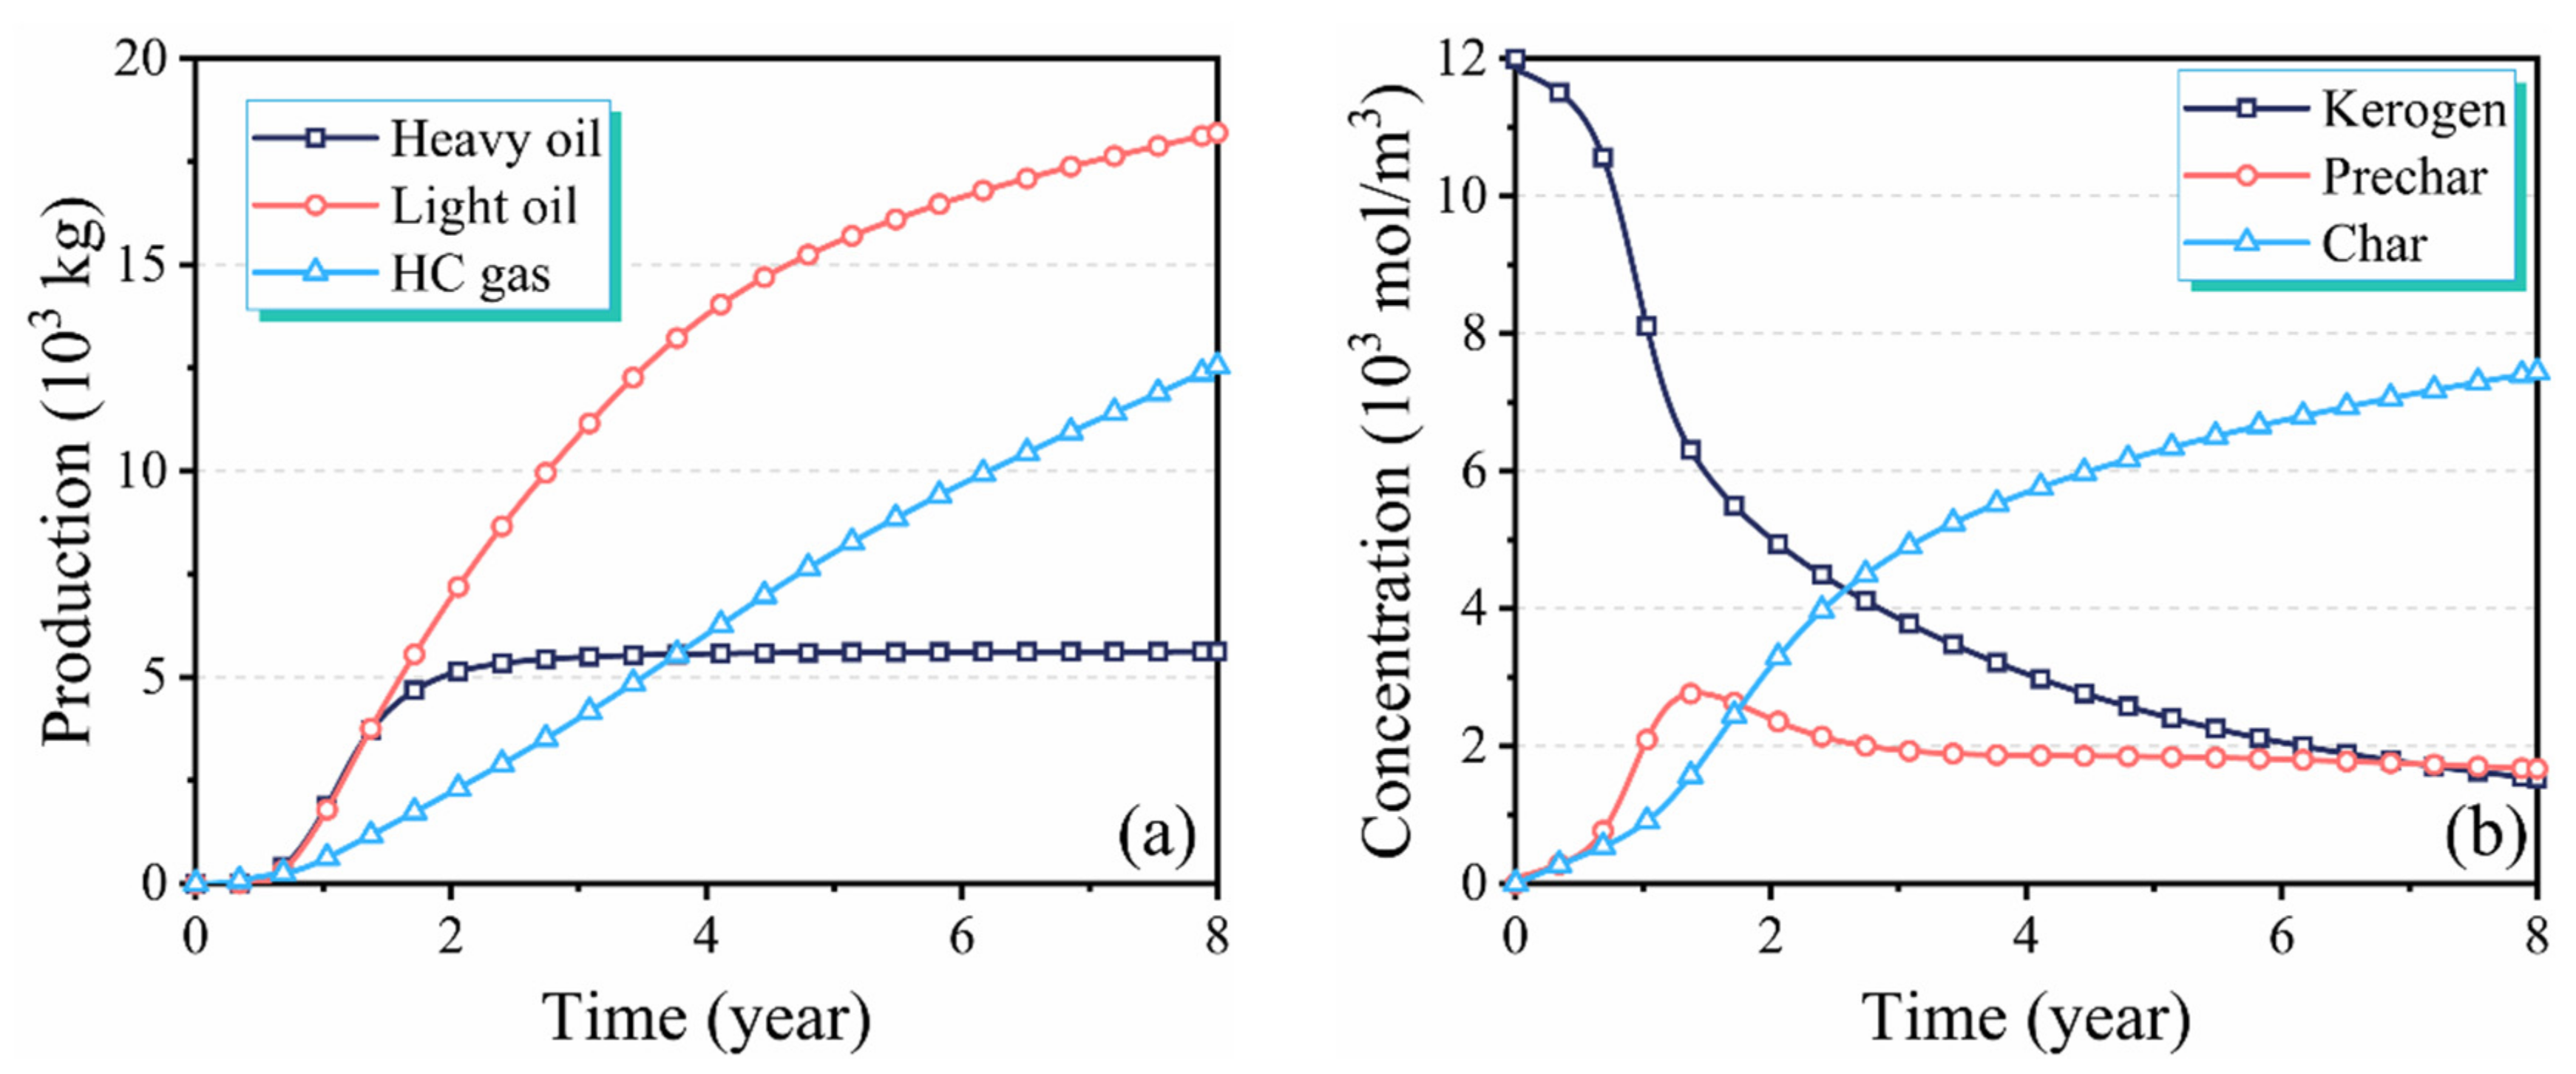
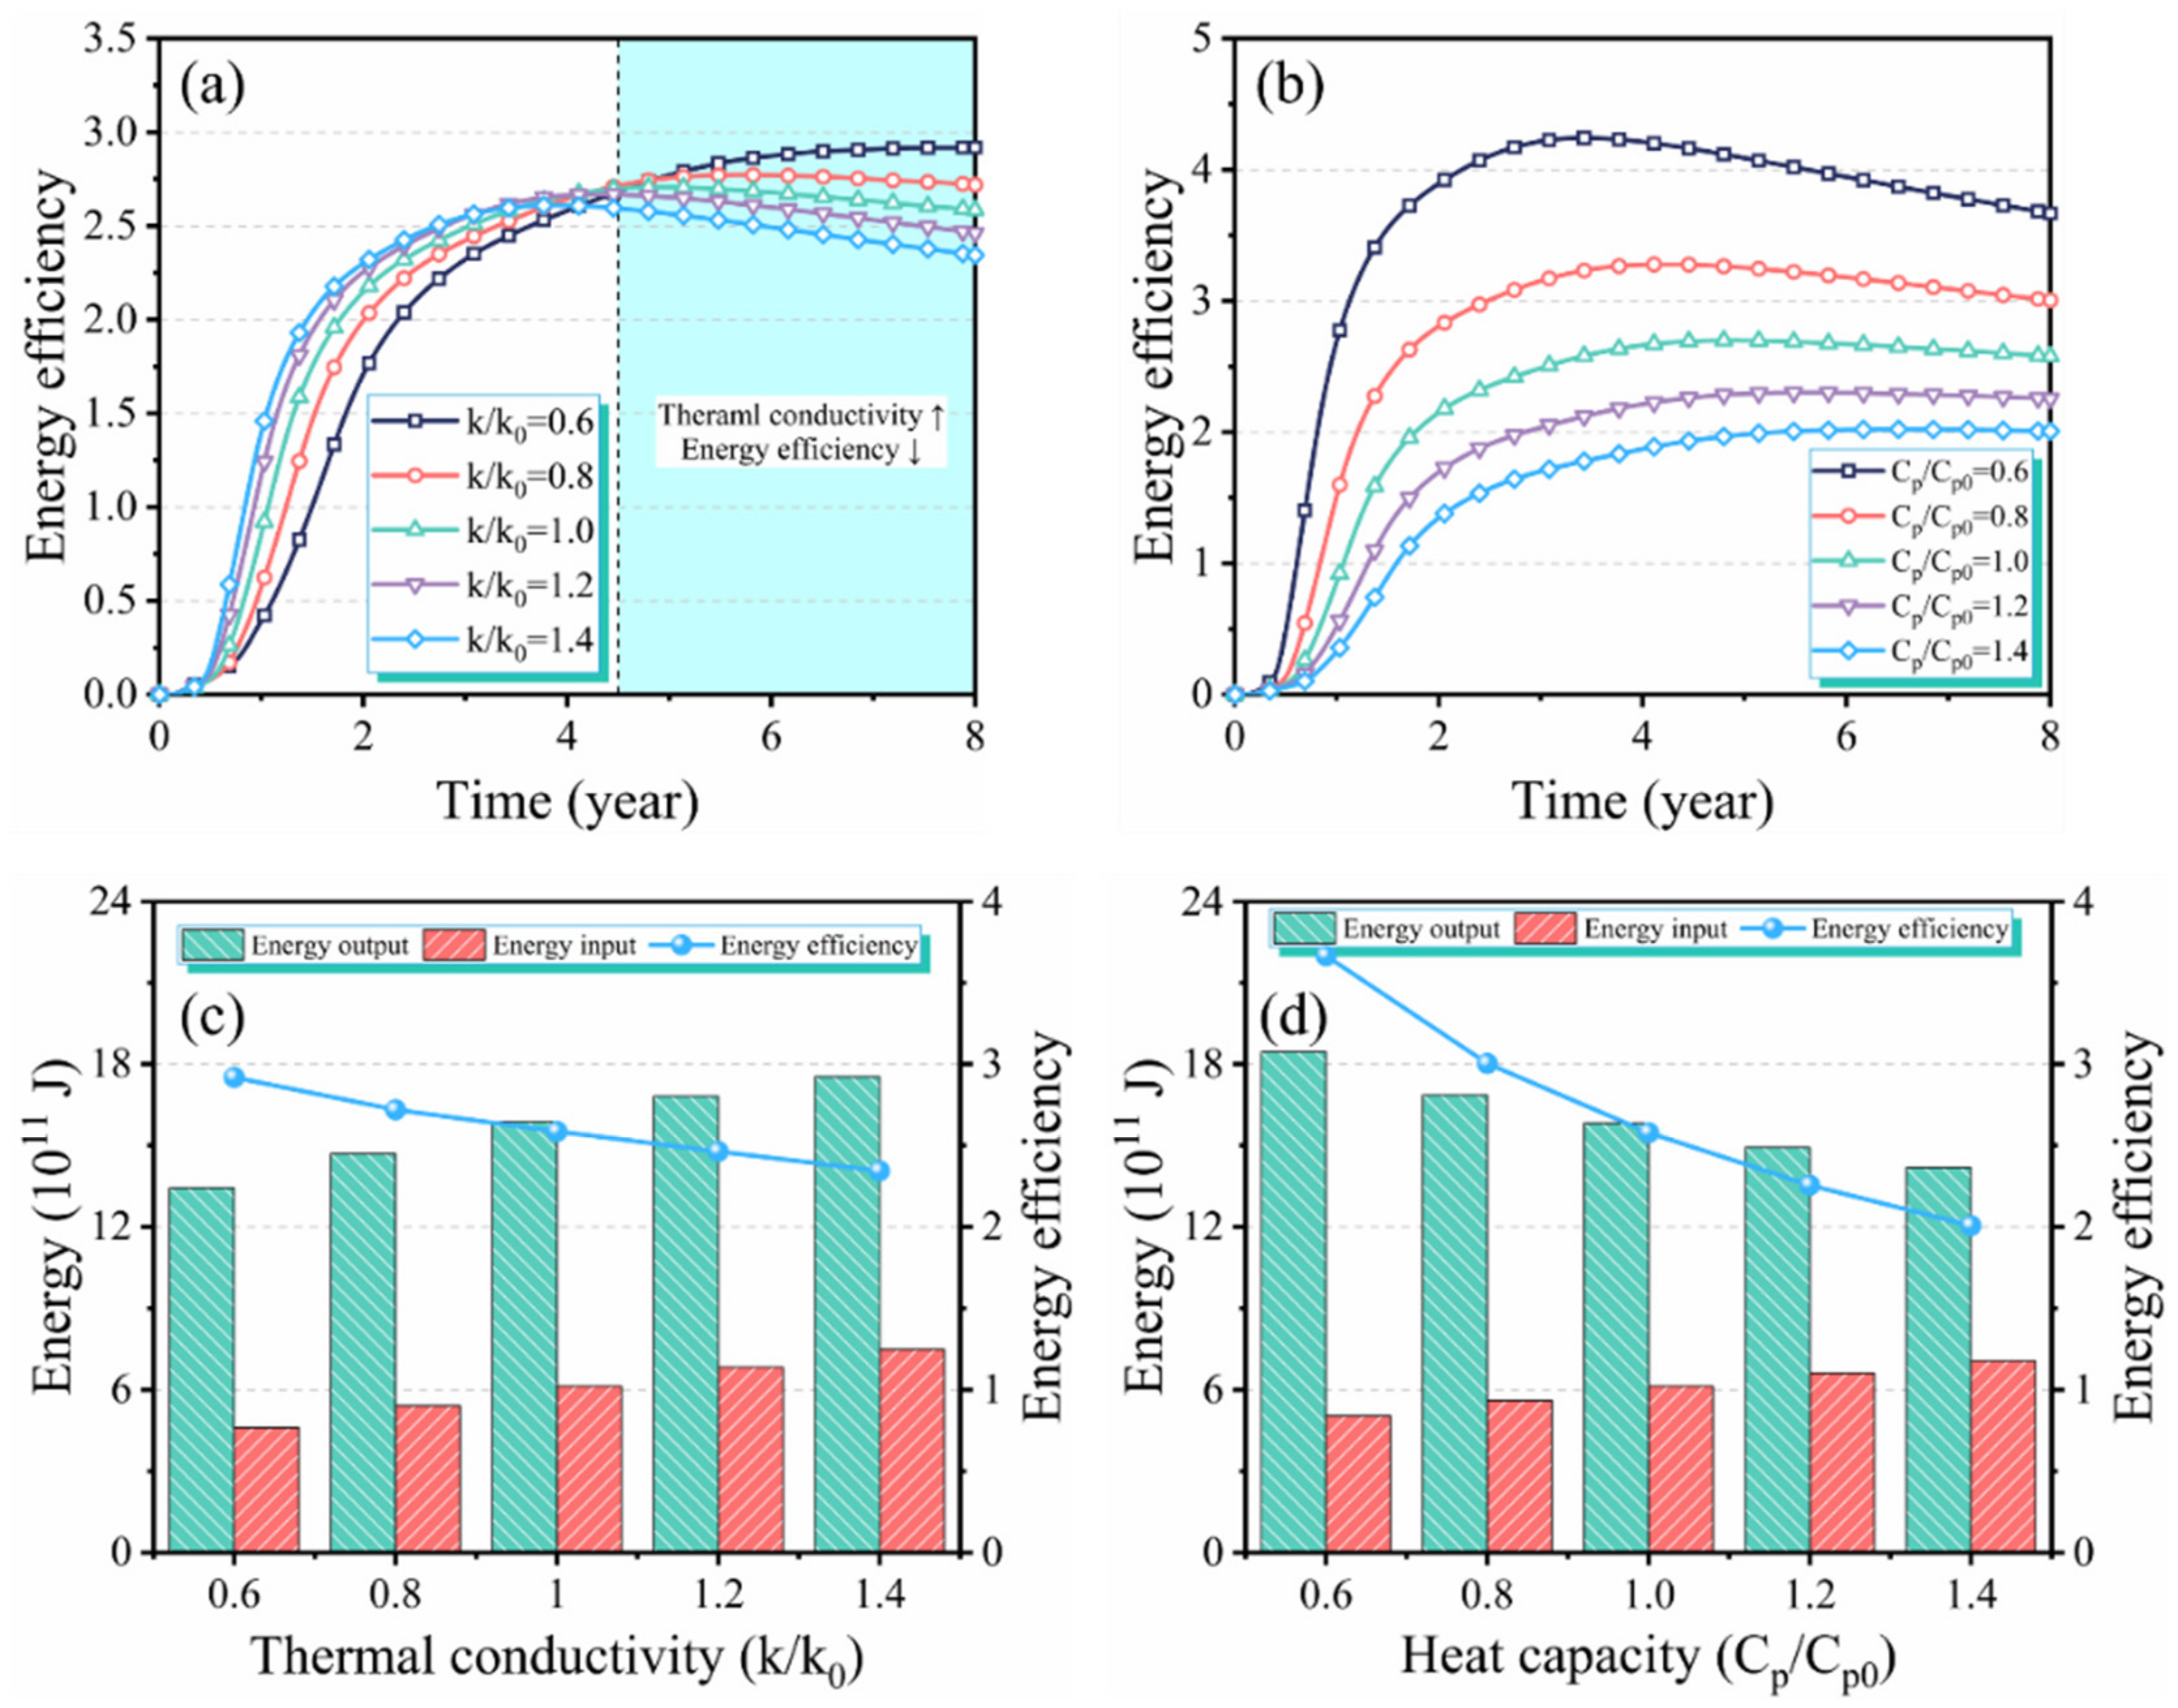
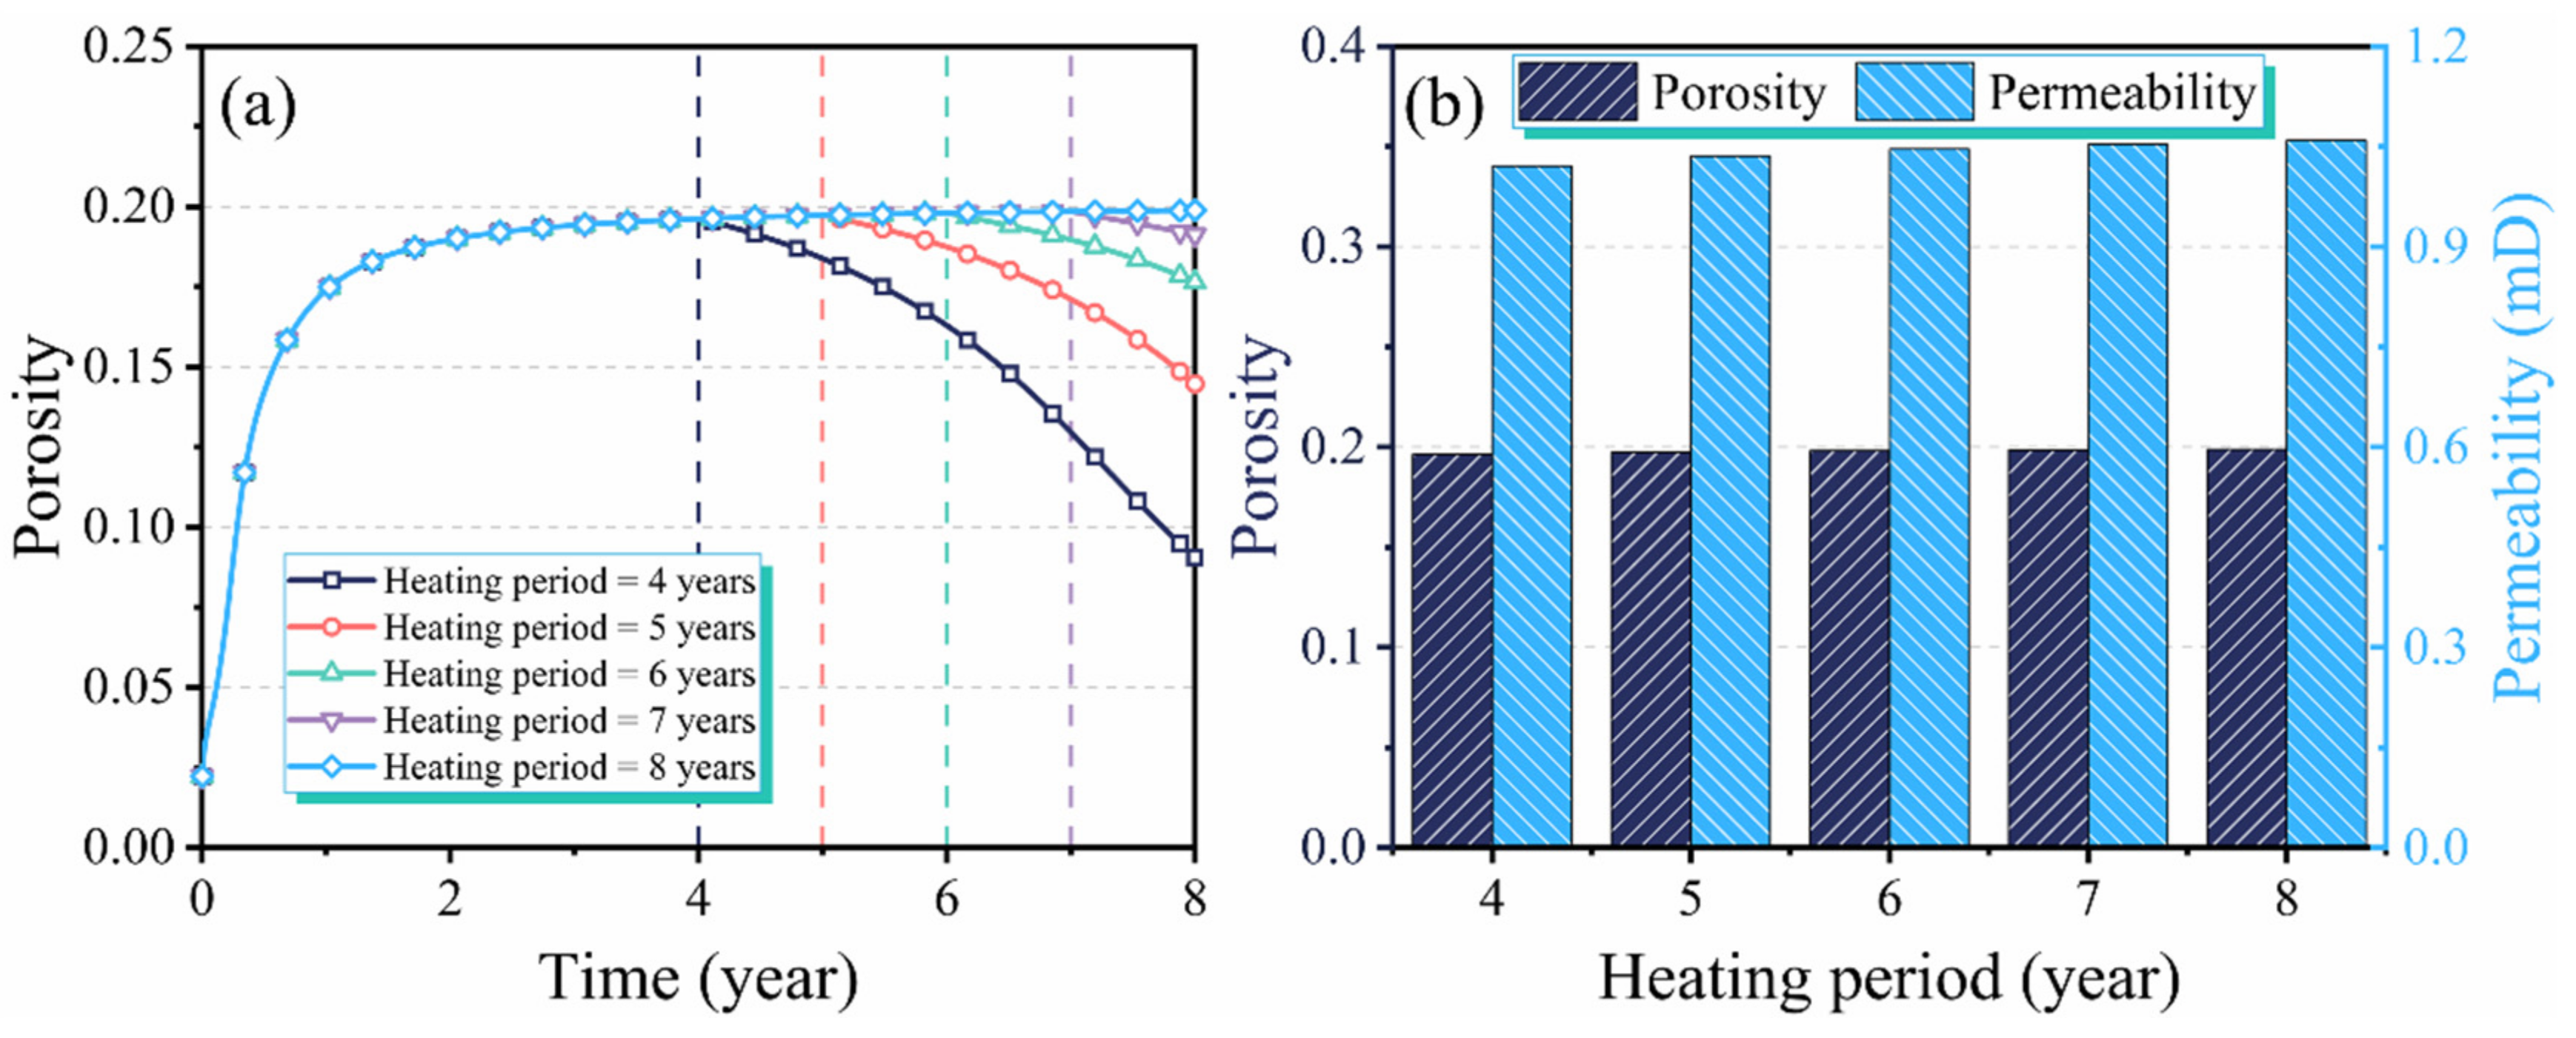
3. Results and Discussions

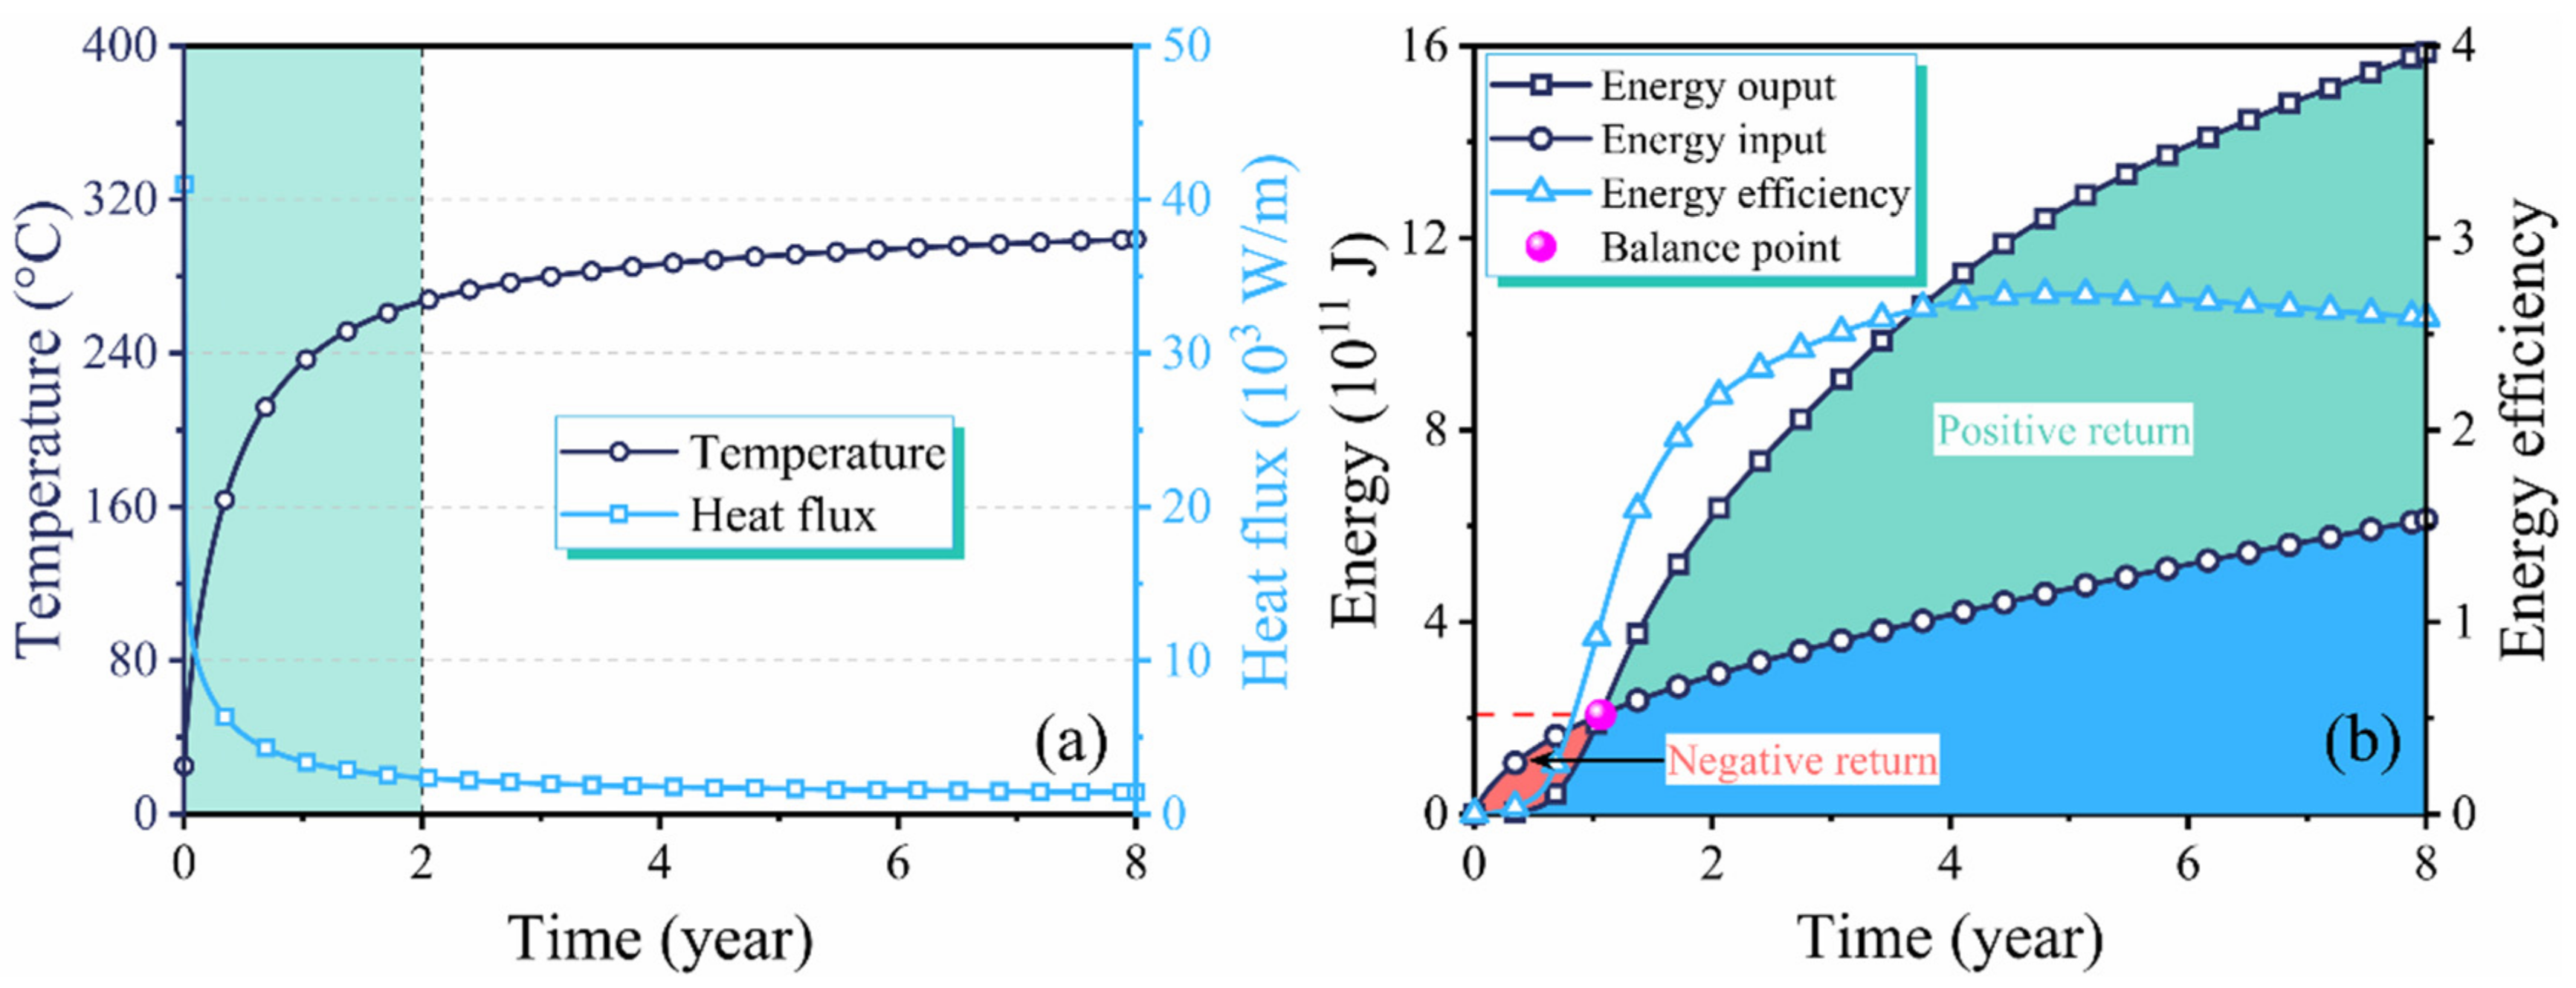
3.1. Performance Evaluation of In Situ Conversion Process

Figure 3a and Figure 4a illustrate the temperature distribution and evolution of the reservoir during the in situ conversion process. Results show that the temperature of the oil shale formation increases continuously with the heating time, and the average temperature of the simulated area finally reaches about 300 °C. Meanwhile, the heat flux of heating wells decreases rapidly with the heating time as shown in Figure 4a, which means that the energy input is mainly concentrated in the first two years of the heating process, and this is the reason for the stable average temperature after 2 years of heating. With the increase in reservoir temperature, the kerogen in oil shale is gradually pyrolyzed into oil and gas products and cokes, and more than 50% of the kerogen pyrolysis occurs in the first two years of the heating process, as shown in Figure 3b.
The production and concentration curves of the fluid products (oil and gas) and cokes are presented in Figure 5a,b, respectively. As the primary product of kerogen pyrolysis, the production of heavy oil increases rapidly during the first two years of the heating process and then remains almost constant while the concentration of prechar shows a fluctuating trend of first increasing and then decreasing. This is because the high temperature in the later stage of the heating process promotes the pyrolysis of the primary products. As the final product of kerogen pyrolysis, production of HC gas and the concentration of char increase continuously. Although light oil is the primary product of kerogen pyrolysis, the pyrolysis of light oil is more difficult than that of heavy oil and prechar, thus the production of light oil keeps increasing.
Energy efficiency is a key indicator of the feasibility of in situ conversion technology. This study analyzed the variations of the input energy, output energy, and energy efficiency during the in situ conversion process. The input energy (Ein) is obtained by integrating the heat flux of the heating well (J), the output energy (Eout) denotes the sum of the total standard-state combustion heat of the produced heavy oil, light oil, and HC gas (J), and the energy efficiency (η) is defined as the ratio of output energy to input energy, which can be calculated as follows [36,39]:
E i n = q i n d s d t
E o u t = i = 1 3 c i Δ H i
η = E o u t E i n
It is shown in Figure 4b that the output energy is less than the input energy in the first year of the heating process, which leads to a negative return. After 390 days of heating, the energy flow reaches a balanced state, with the energy efficiency obtained is 1. Then, the production of oil and gas grows continuously, and the energy efficiency is also improved at this stage, which reaches a maximum value of 2.7 around the fifth year. Subsequently, as the increment in production of oil declines, the energy efficiency slightly decreases to about 2.6.
In conclusion, the pyrolysis of kerogen, and the output of heavy oil and light oil are concentrated in the first four years of the heating process, and the energy efficiency also keeps increasing. After five years of heating, the energy efficiency gradually decreases, meaning that the benefits of heating in the following years are considerably low. Therefore, it is necessary to reduce the heating period to obtain the highest energy efficiency, which will be investigated in Section 3.4.

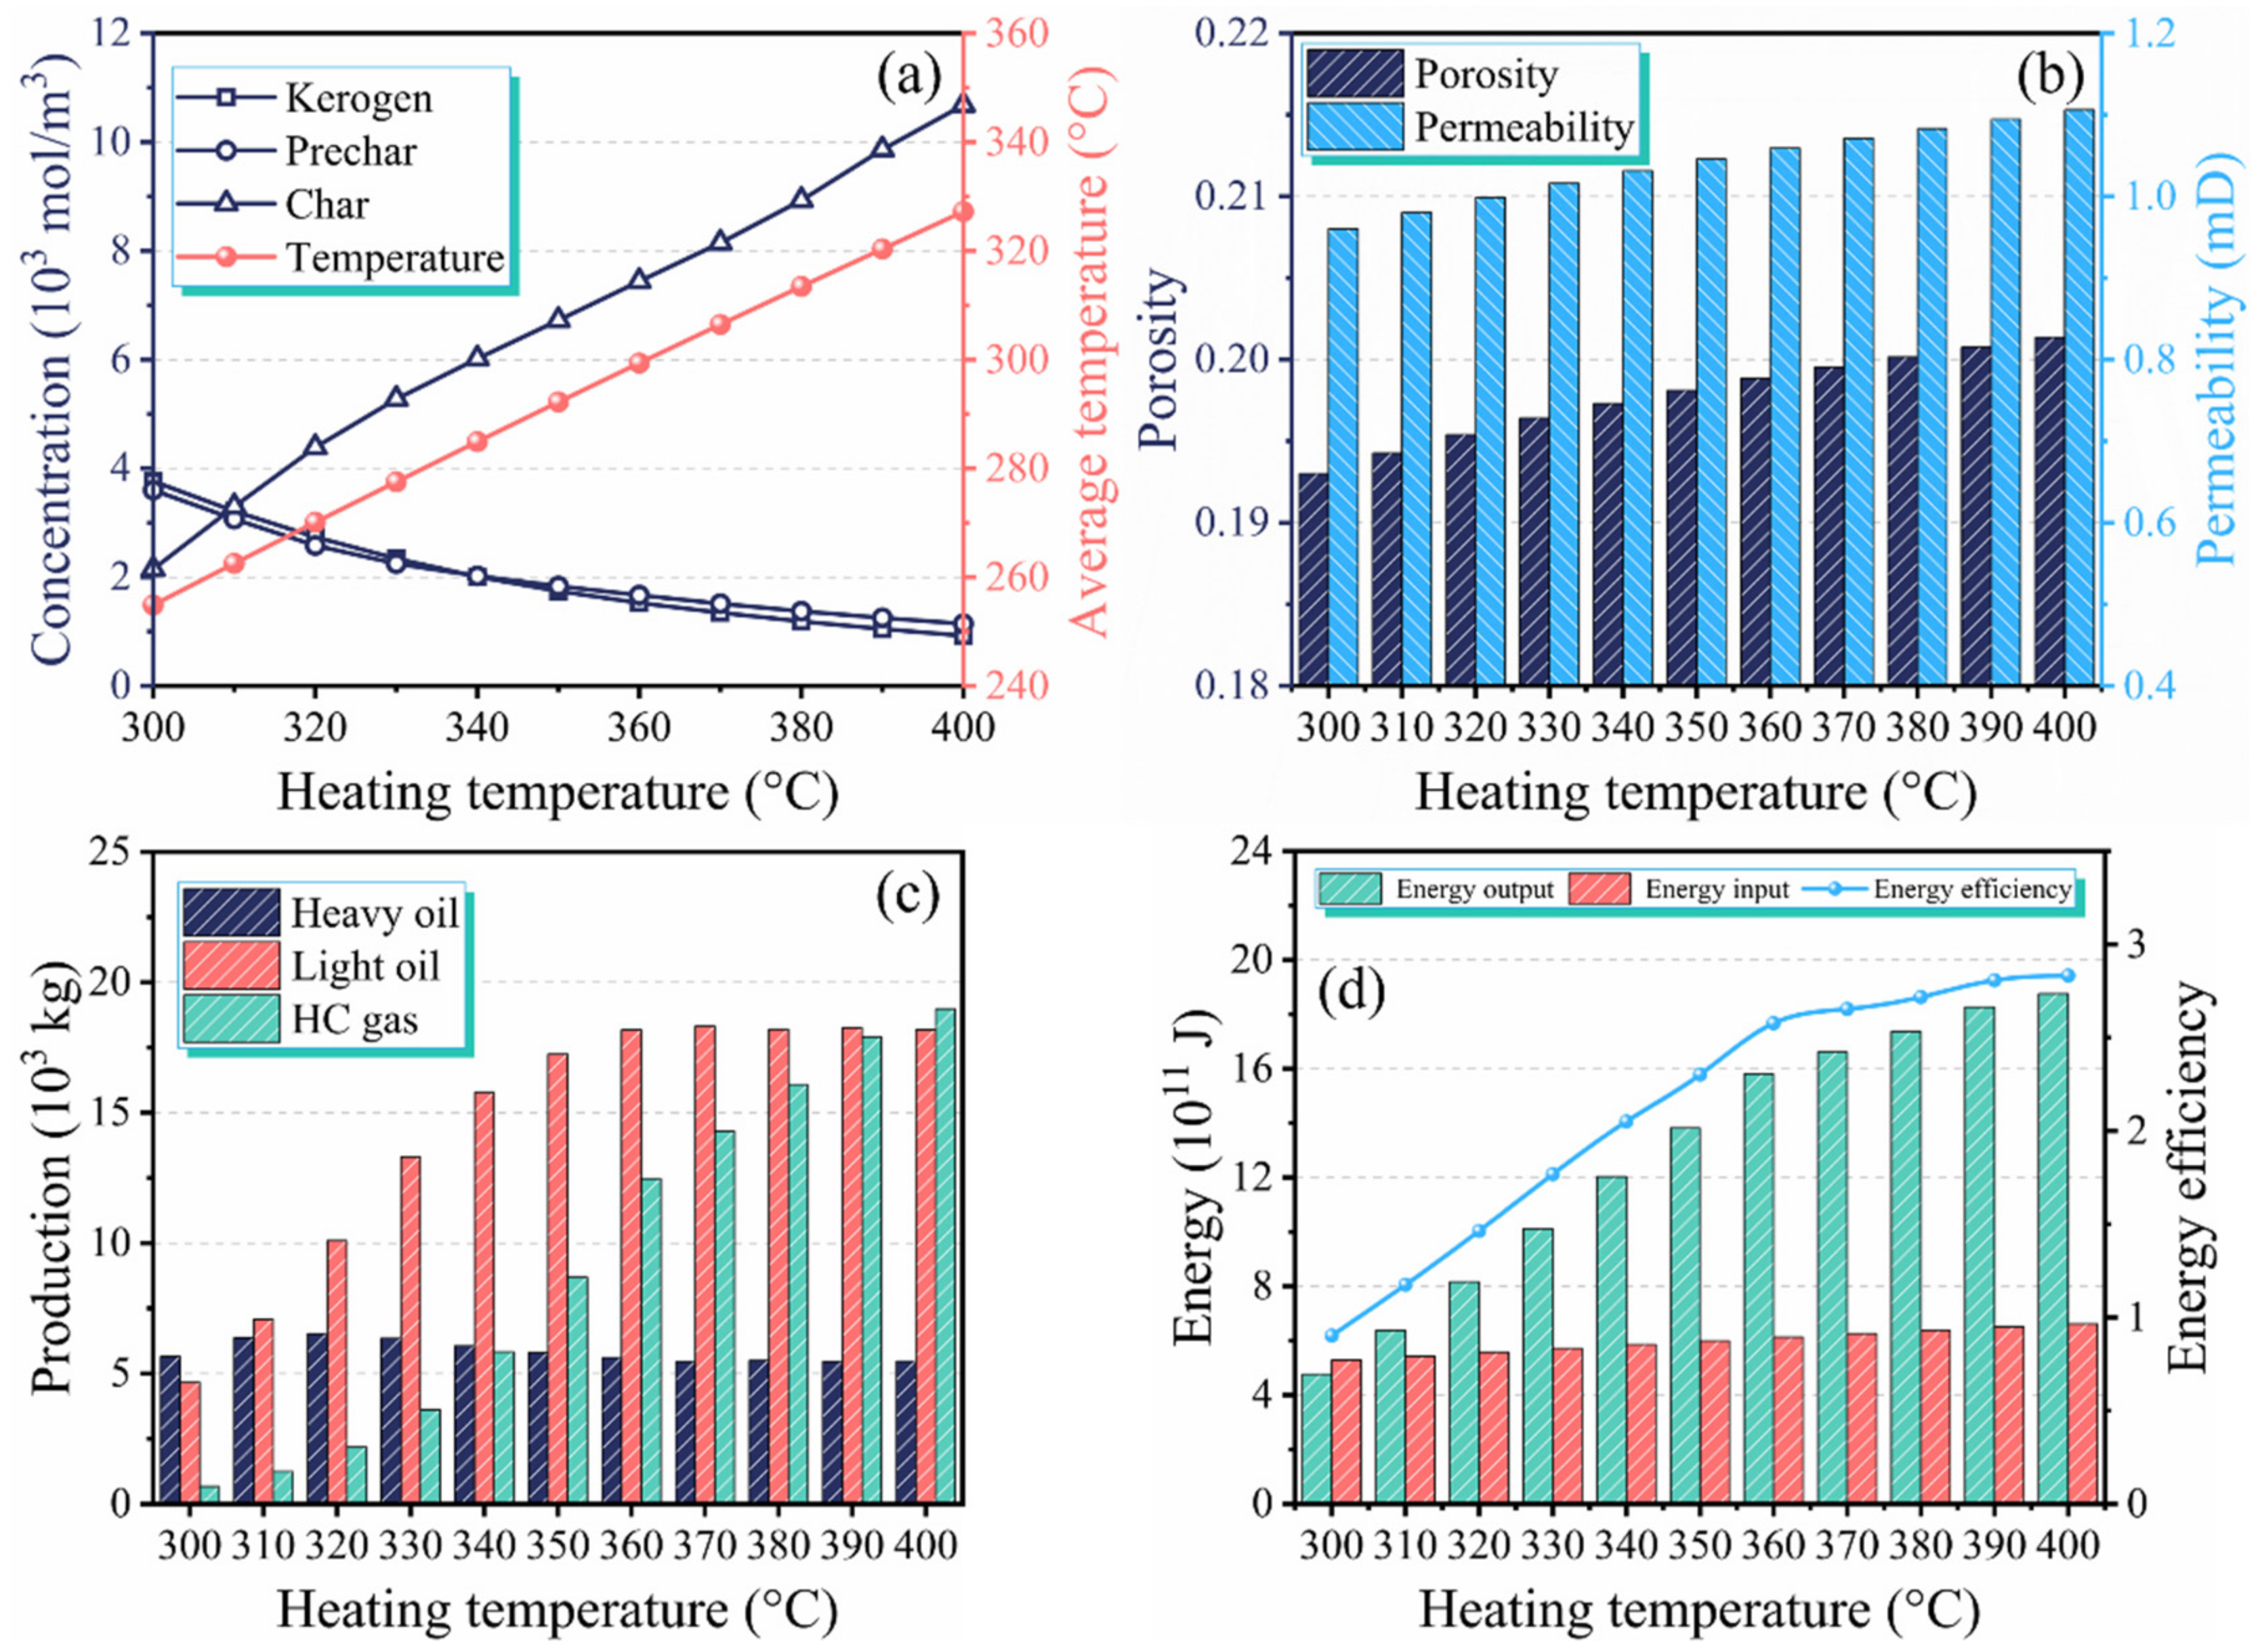
3.2. Effect of Heating Temperature on Production Performance

Temperature is a key factor that has a comprehensive influence on the production performance of oil shale reservoir during the in situ conversion process. On the one hand, the pyrolysis rate is determined by temperature as shown in Equations (1) and (2). On the other hand, some of the key properties such as porosity, permeability, and conductivity are temperature-dependent. In this section, the influence of different heating temperatures in the range of 300 °C to 400 °C on the ICP is investigated. Figure 6a shows the variation of concentrations of kerogen and cokes, as well as the average temperature of the reservoir. As the heating temperature increases from 300 °C to 400 °C, the average reservoir temperature raises from 255 °C to 327 °C, the kerogen concentration decreases from 3762 to 923 mol/m3, and the pyrolysis rate (ratio of pyrolyzed kerogen to its initial concentration) is improved from 68.65 to 92.31%. As the primary pyrolysis product of kerogen, the concentration of prechar continuously declines, while that of the final pyrolysis product char builds up at an almost constant rate. As shown in Figure 6b, the increment of heating temperature also improves the porosity and permeability of the oil shale, implying that the oil and gas products can flow into the production well more efficiently. However, the increment of the heating temperature is not completely beneficial. As illustrated in Figure 6c, with the heating temperature increasing, the production of heavy oil first increases and then decreases, and reaches the maximum value at 320 °C. The production of light oil gradually builds up and remains constant at a temperature of 360 °C. Moreover, the production of HC gas continues to increase, which means that the oil/gas ratio in the product continuously decreases with increasing heating temperature. A higher heating temperature indicates more energy input. As shown in Figure 6d, the input energy, output energy, and energy efficiency continuously increase with the heating temperature, but the increment in energy efficiency gradually slows down when the temperature exceeds 360 °C. It should be noted that when the heating temperature is 300 °C, the final energy efficiency is less than 1. In this situation, the entire in situ conversion has a lager input energy than output energy, which should be avoided. In short, the heating temperature must be higher than 300 °C; however, the oil/gas ratio in the product decreases with increasing heating temperature, and the benefit of increasing the heating temperature over 360 °C is limited.

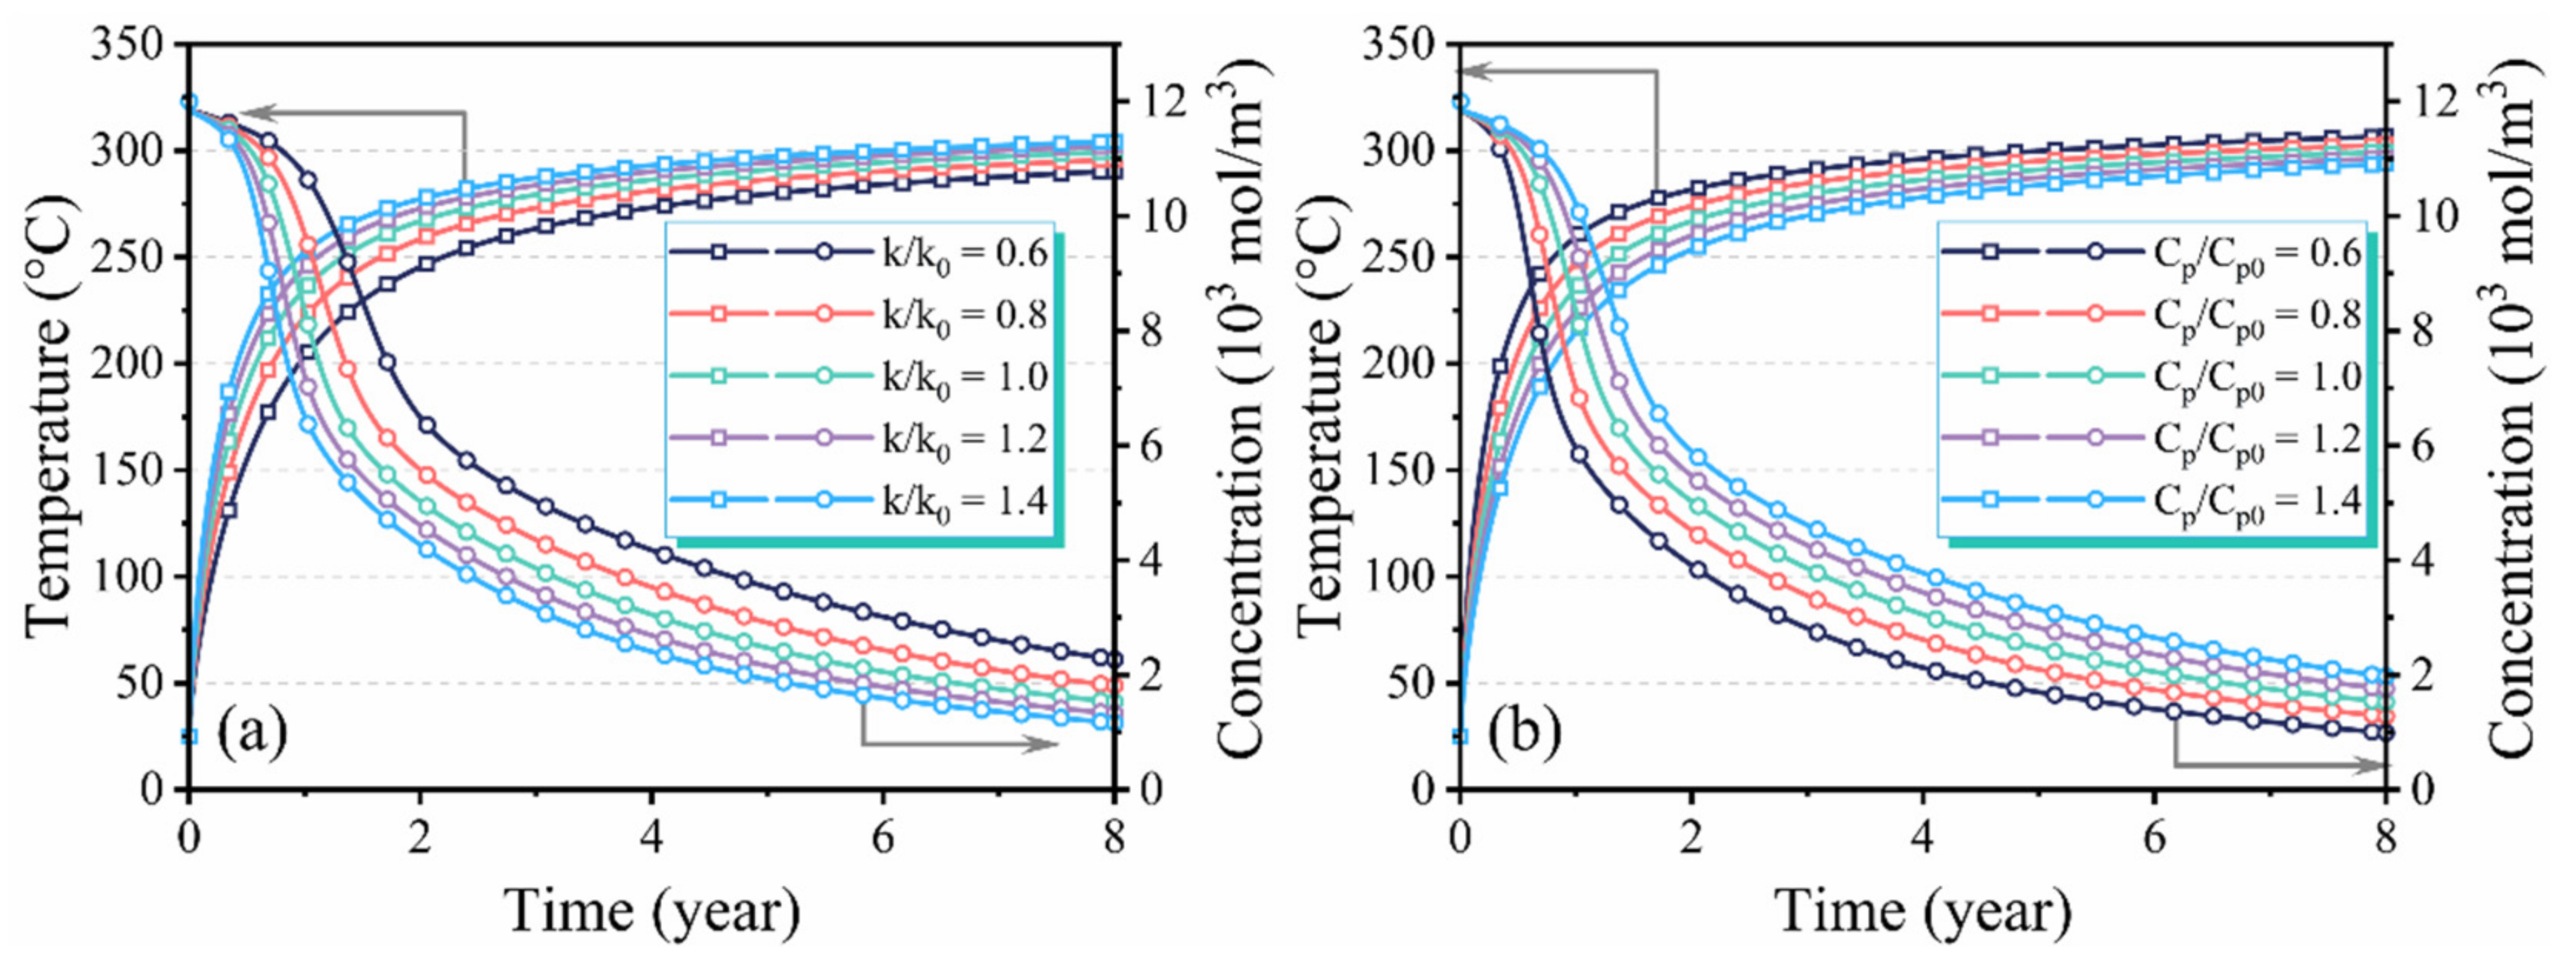
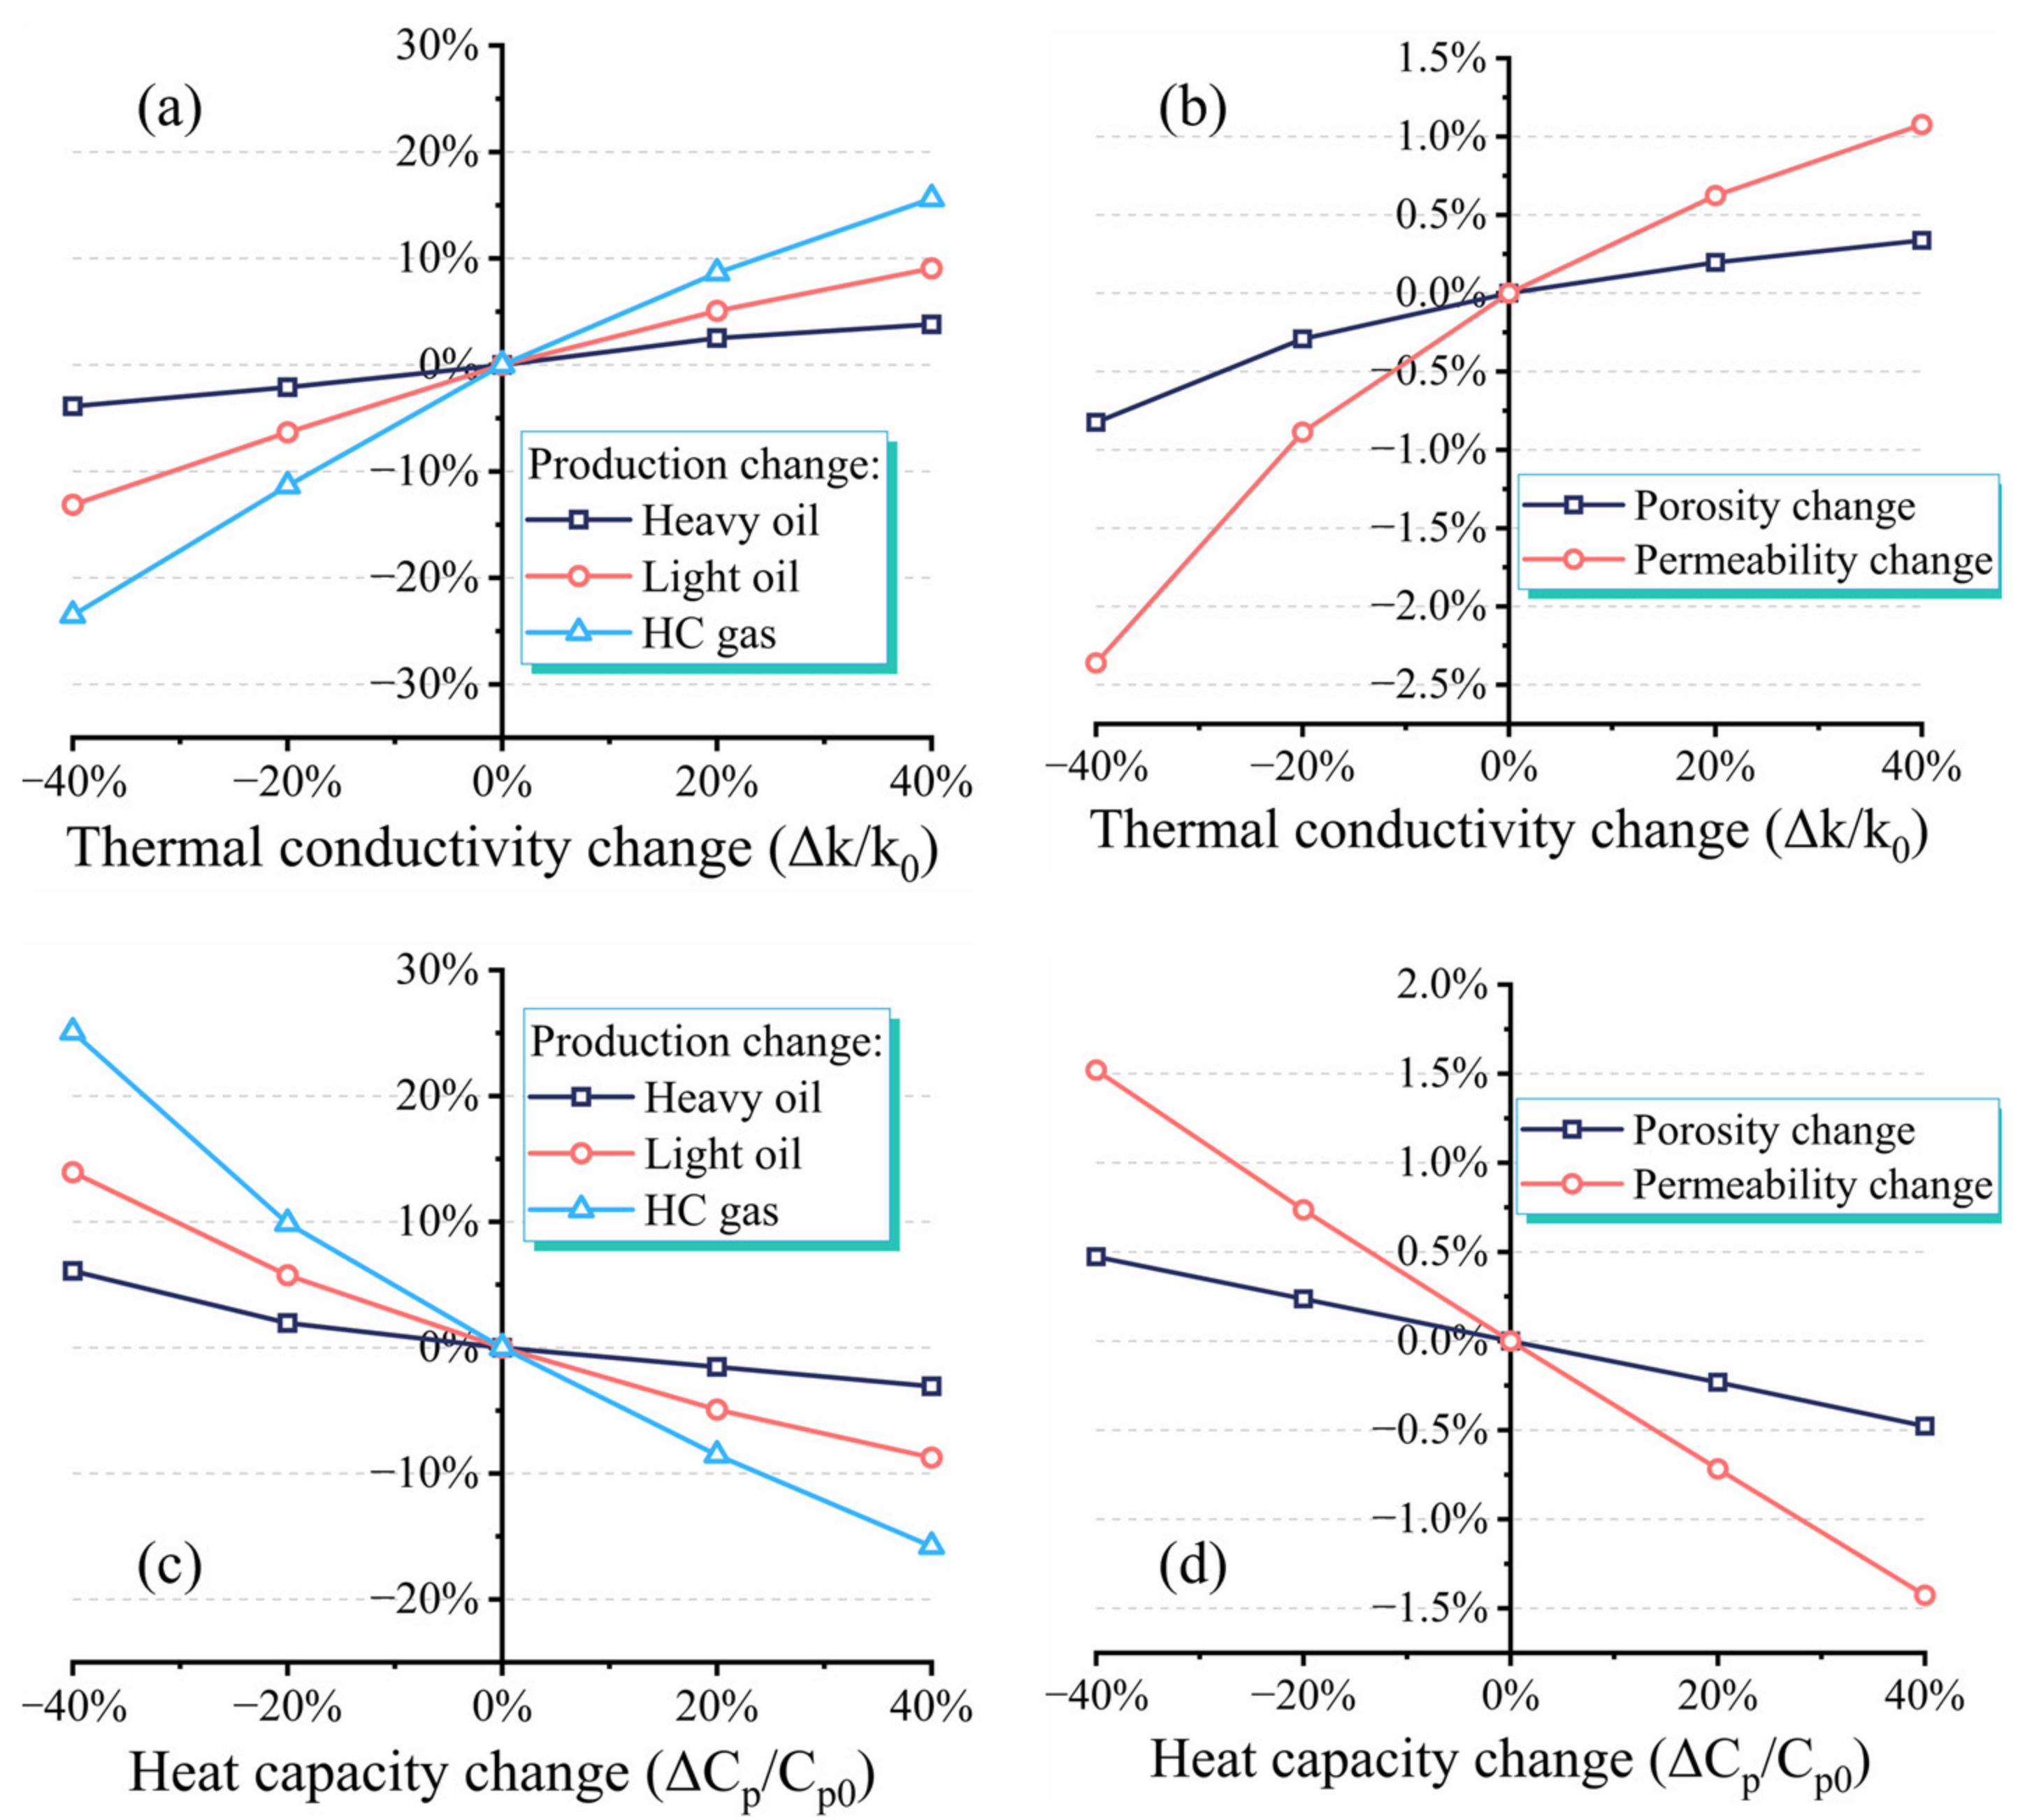
3.3. Effect of Thermophysical Properties on Production Performance

In addition to the heating temperature, the thermophysical properties of oil shale, such as thermal conductivity and heat capacity, also have great influence on the temperature changing in the reservoir, as reflected in Equations (13) and (15). Assuming that the thermal conductivity and heat capacity of oil shale in the base case are k0 and Cp0, the effects of thermal conductivity ranging from 0.6 k0 to 1.4 k0 and heat capacity ranging from 0.6 Cp0 to 1.4 Cp0 on production performance are analyzed in this section. As illustrated in Figure 7a, with the increase in thermal conductivity, the average temperature of the reservoir builds up, which accelerates the pyrolysis of the kerogen. As shown in Figure 8a, in the early stage of the heating process, the energy efficiency is improved with the increasing thermal conductivity. However, when the heating time exceeds 4.5 years, with the increase in thermal conductivity, the energy efficiency decreases instead. The energy input and output are presented in Figure 8c. It can be observed that more kerogen is pyrolyzed, and more output energy is obtained with the increment in thermal conductivity. However, the input energy also increases at the same time, and its rising amplitude is greater than that of the output energy, resulting in a decline in the final energy efficiency. In Section 3.1, it was shown that the benefit of heating in the later stage is small, so higher thermal conductivity leads to more energy being wasted in the later stage of heating, resulting in lower energy efficiency.
As shown in Figure 7b, as the heat capacity of oil shale increases, the average temperature of the reservoir decreases, and less kerogen is pyrolyzed. This is because a larger heat capacity means more energy is required to heat the oil shale reservoir to a specific temperature. At the same time, the production of oil and gas decreases, reducing the output energy, which ultimately results in lower energy efficiency as shown in Figure 8b,d. Unlike the thermal conductivity, a decrease in the heat capacity means less energy is needed to heat the oil shale reservoir, whereas an increase in thermal conductivity denotes a higher heating rate and the total energy entering into the oil shale reservoir is the same. Therefore, the heating efficiency in Figure 8a,b shows different trends in the later stage of the heating process.
As shown in Figure 9a,b, the sensitivity of the cumulative production of fluid components to the change in thermal conductivity and heat capacity is ranked as heavy oil > light oil > HC gas. Meanwhile, oil and gas products are more sensitive to any reduction in thermal conductivity and heat capacity than they are to any increment in the two parameters. Porosity and permeability show insensitivity to changes in thermal conductivity and heat capacity.

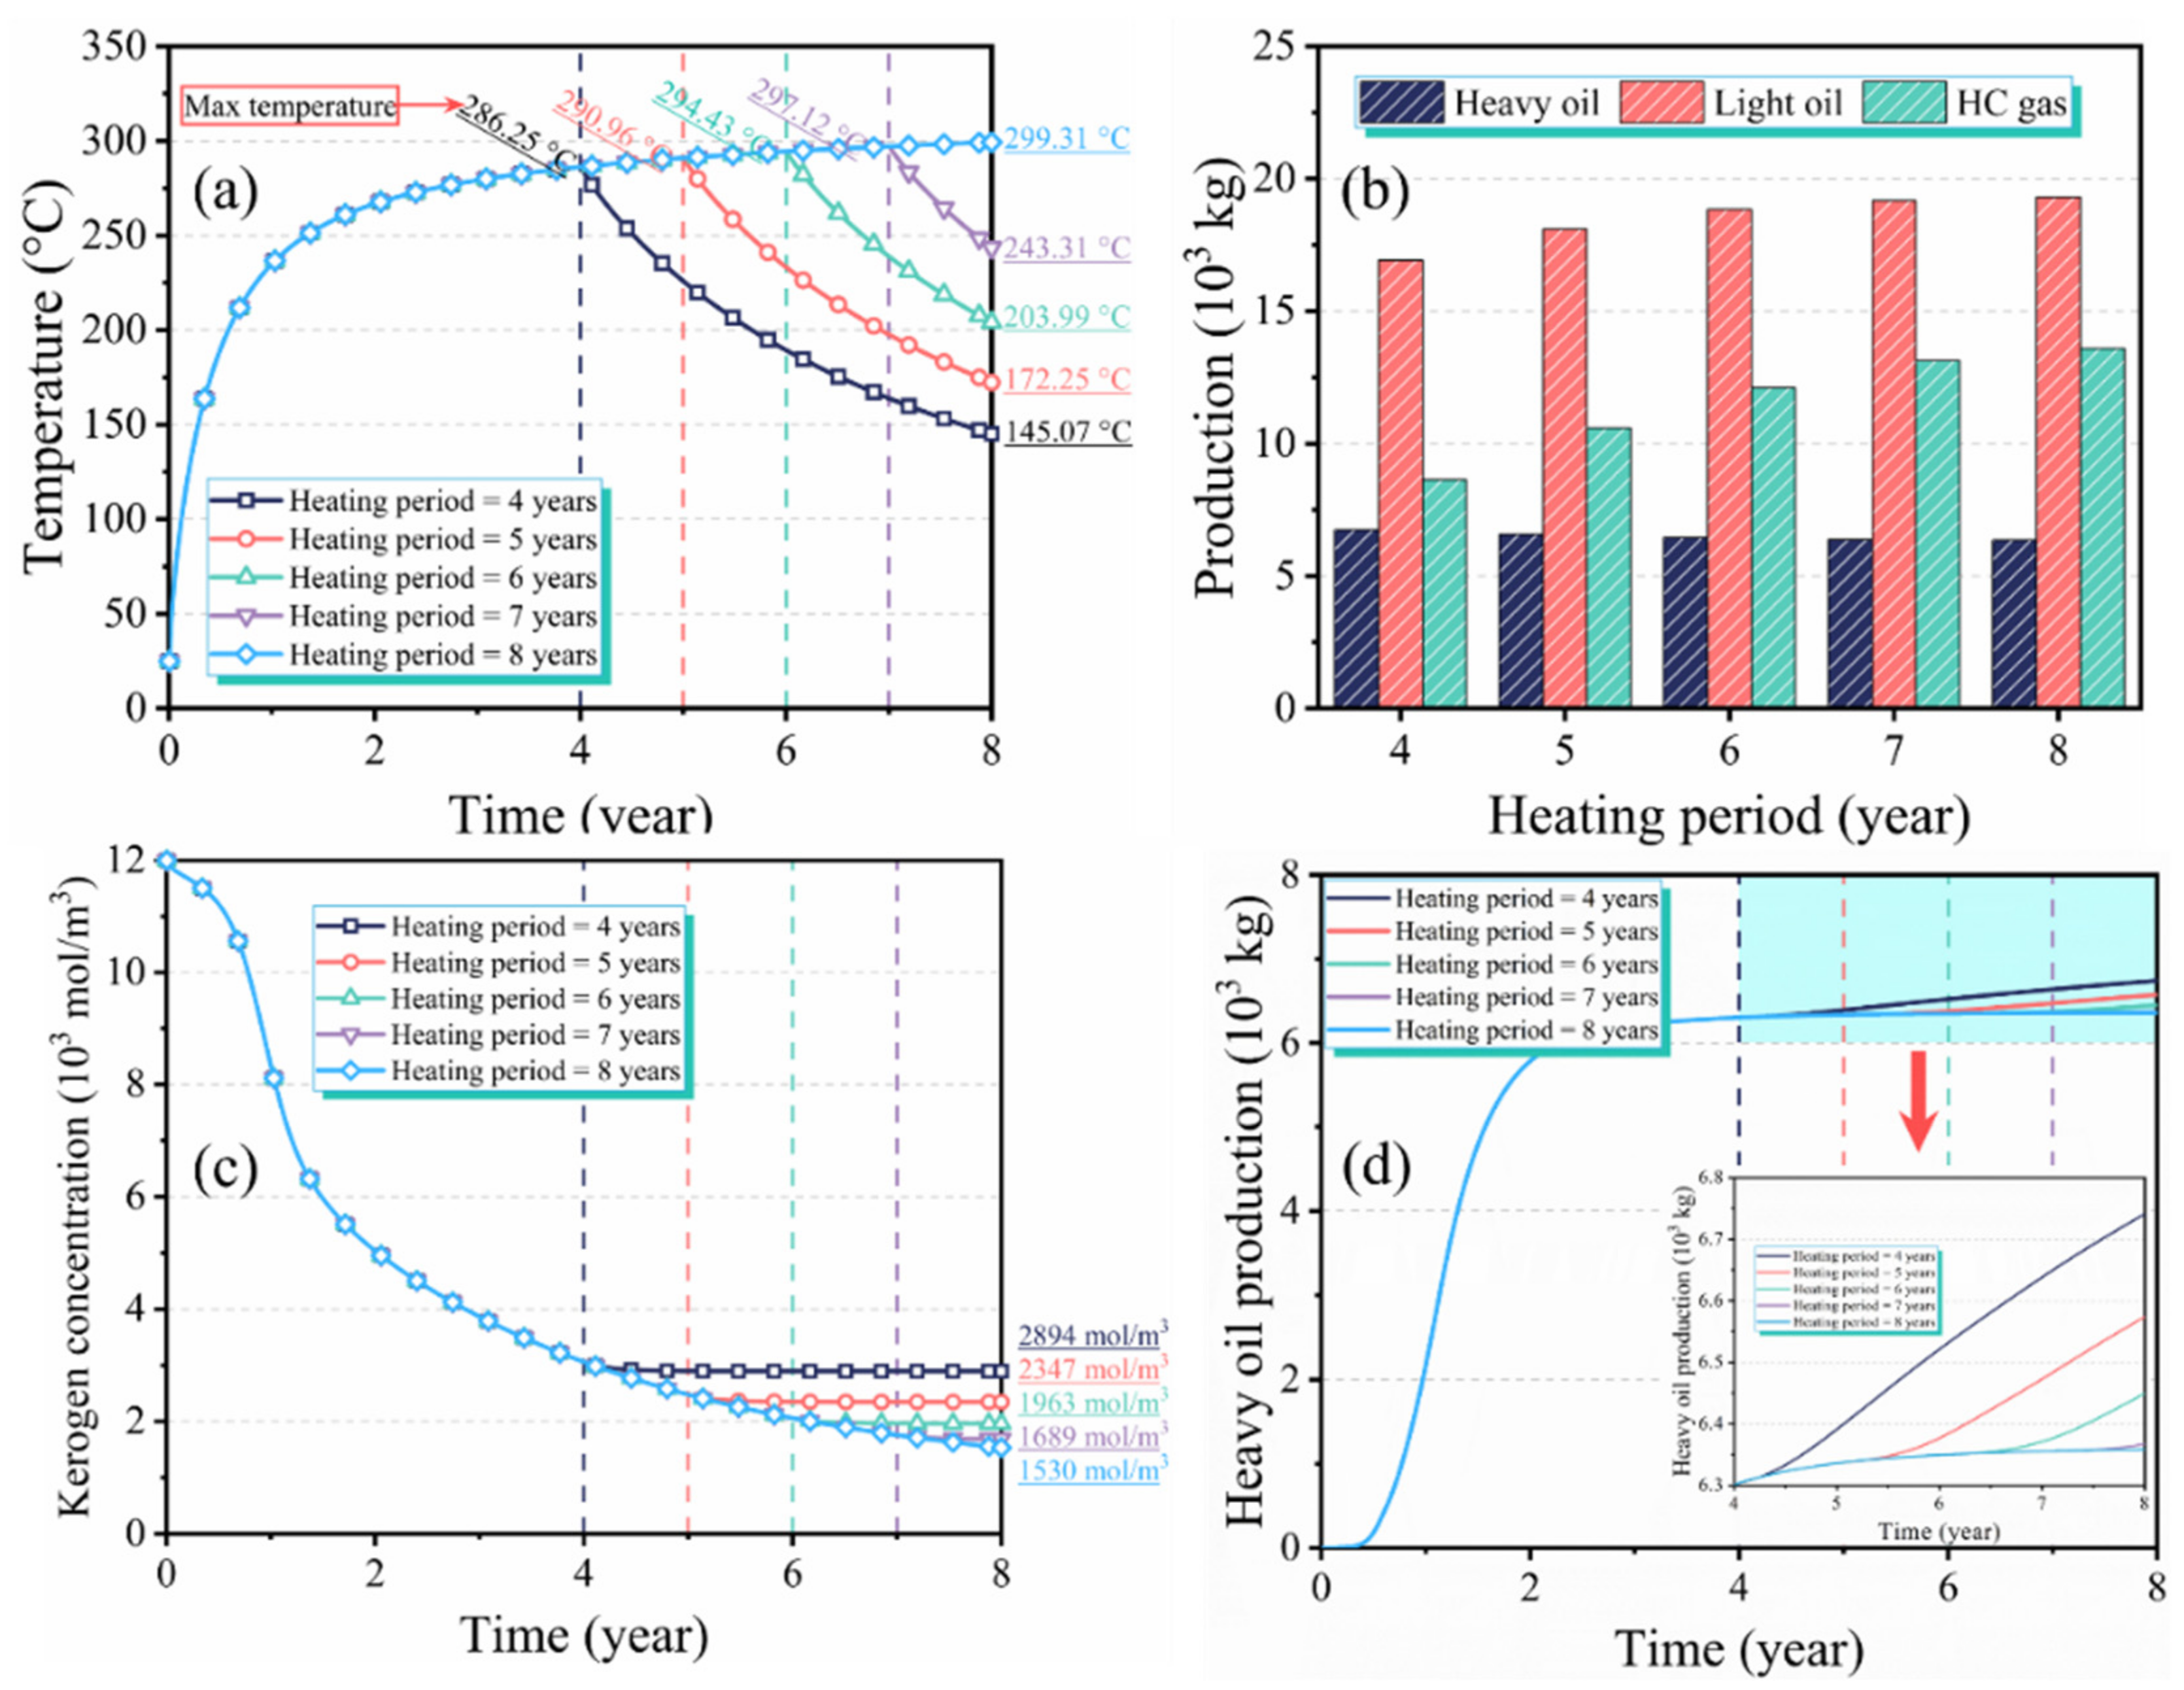
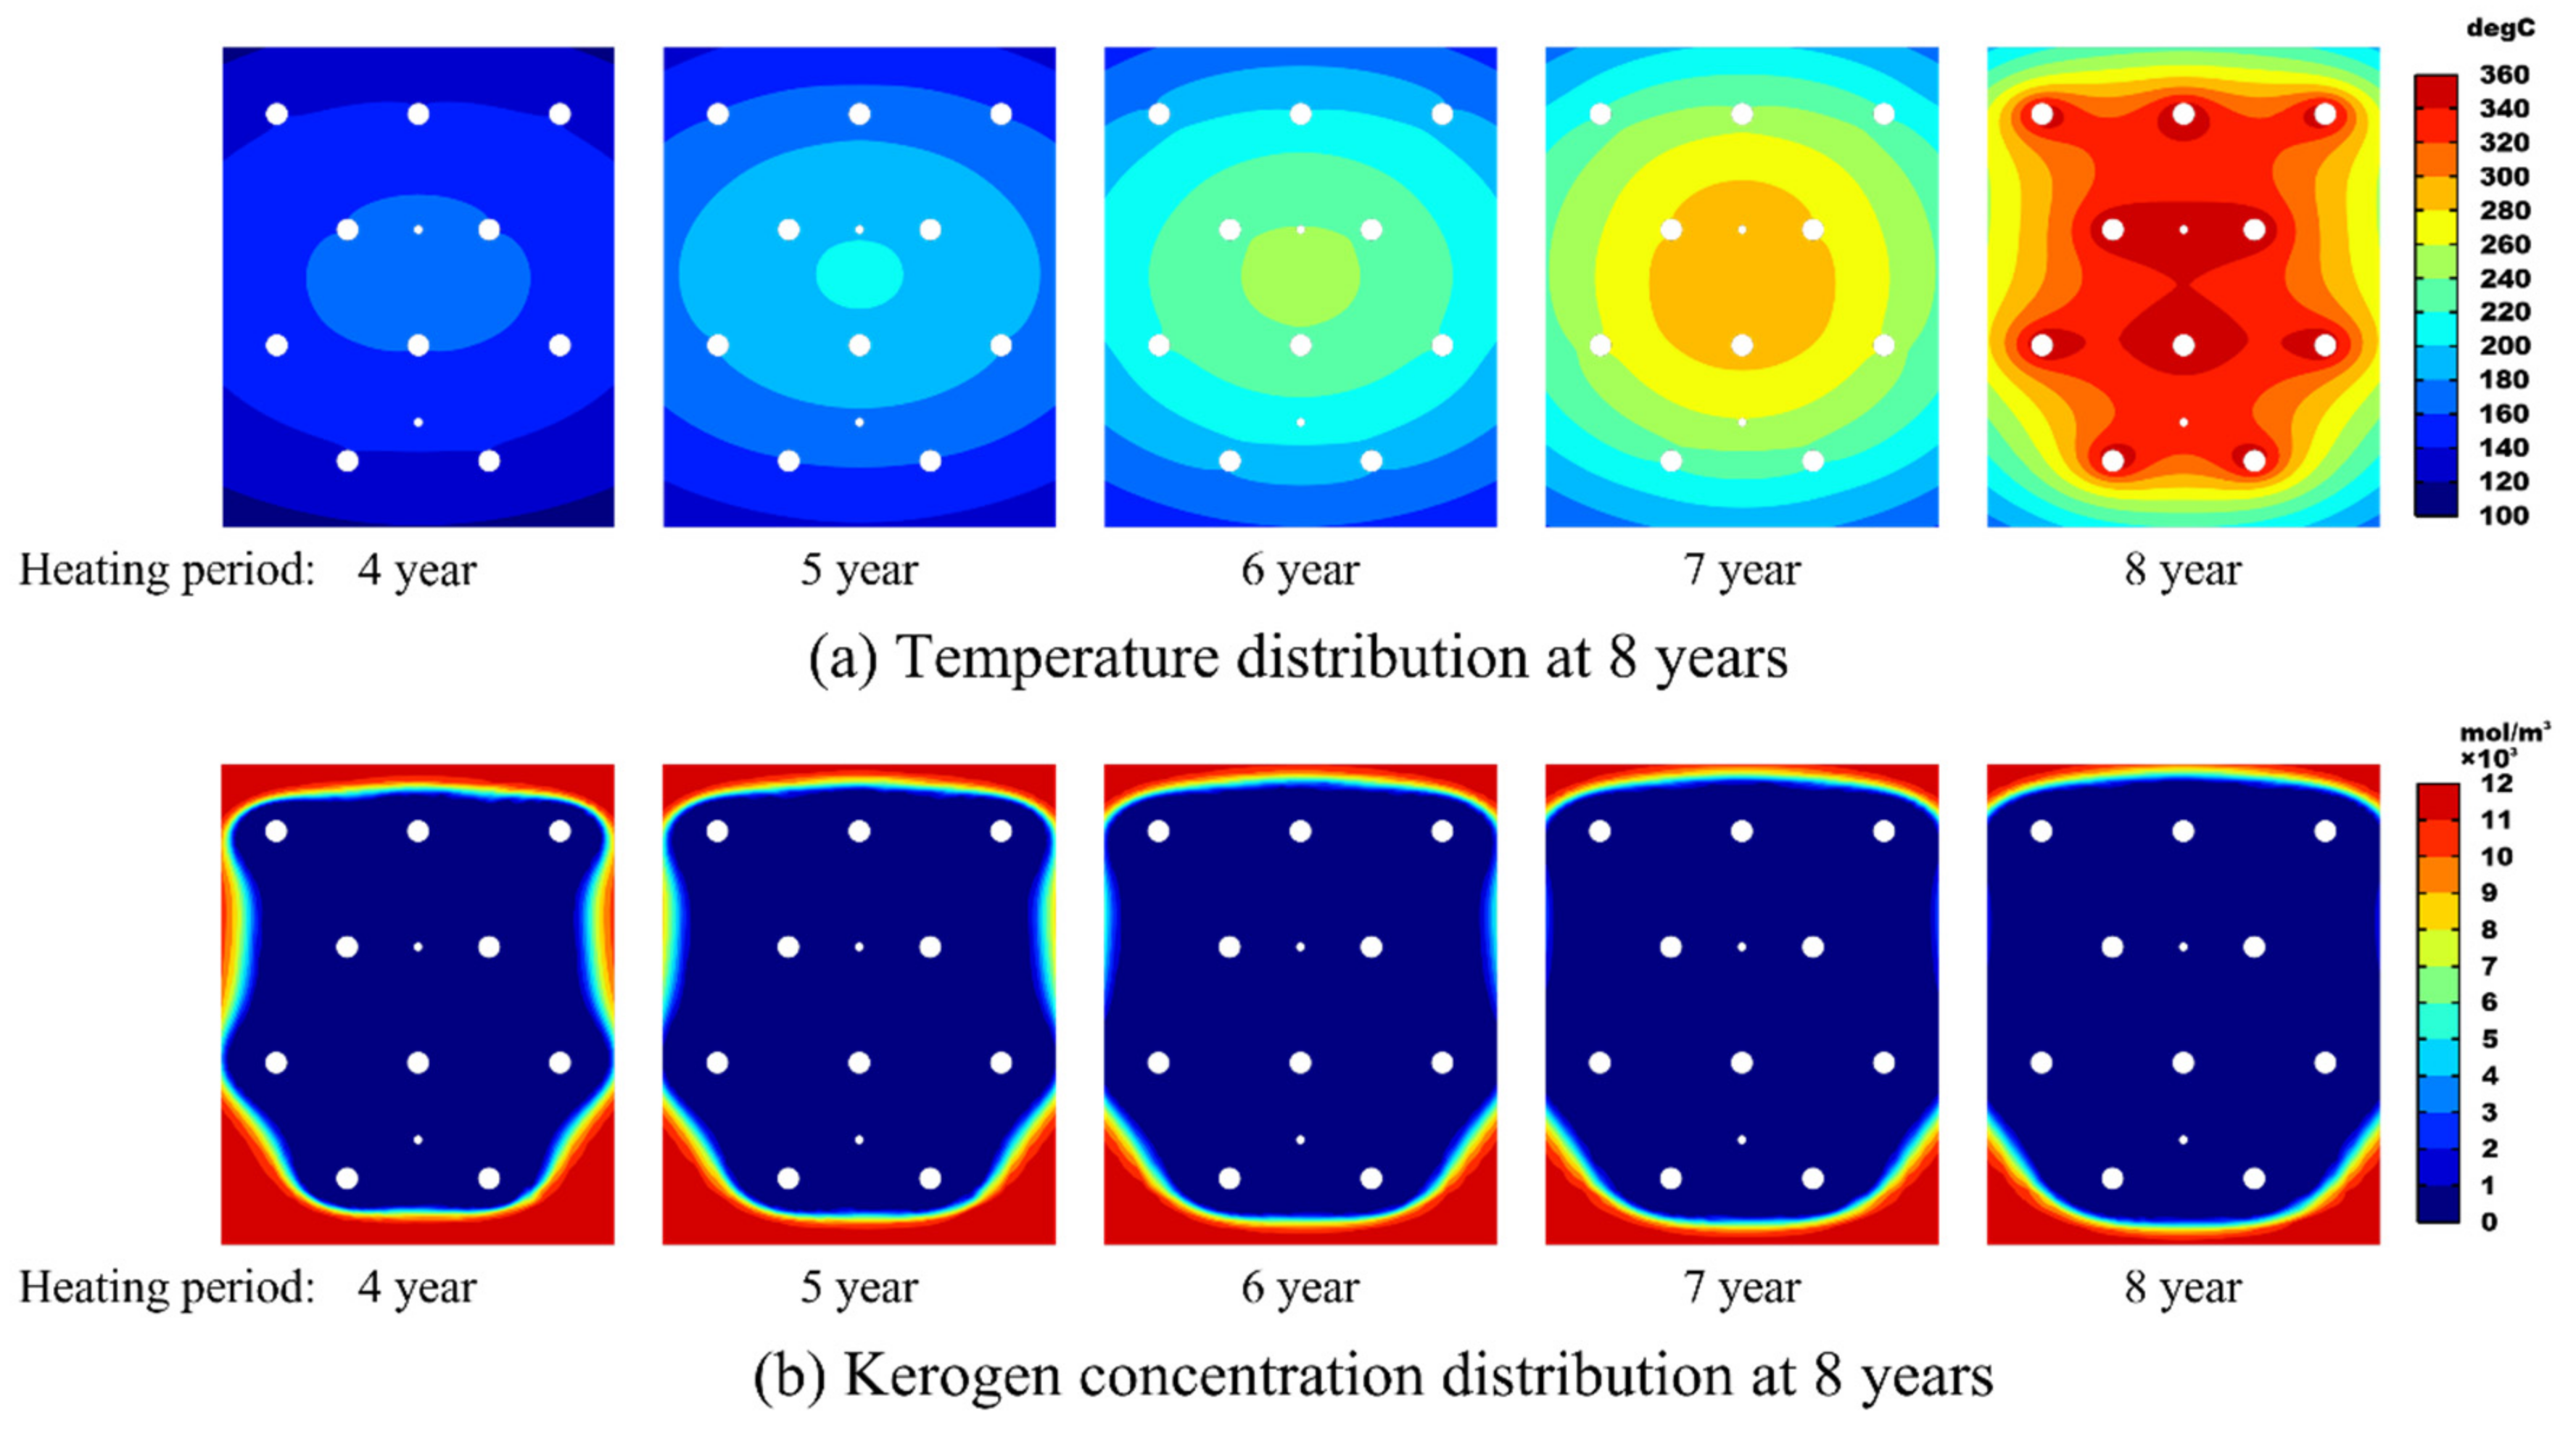
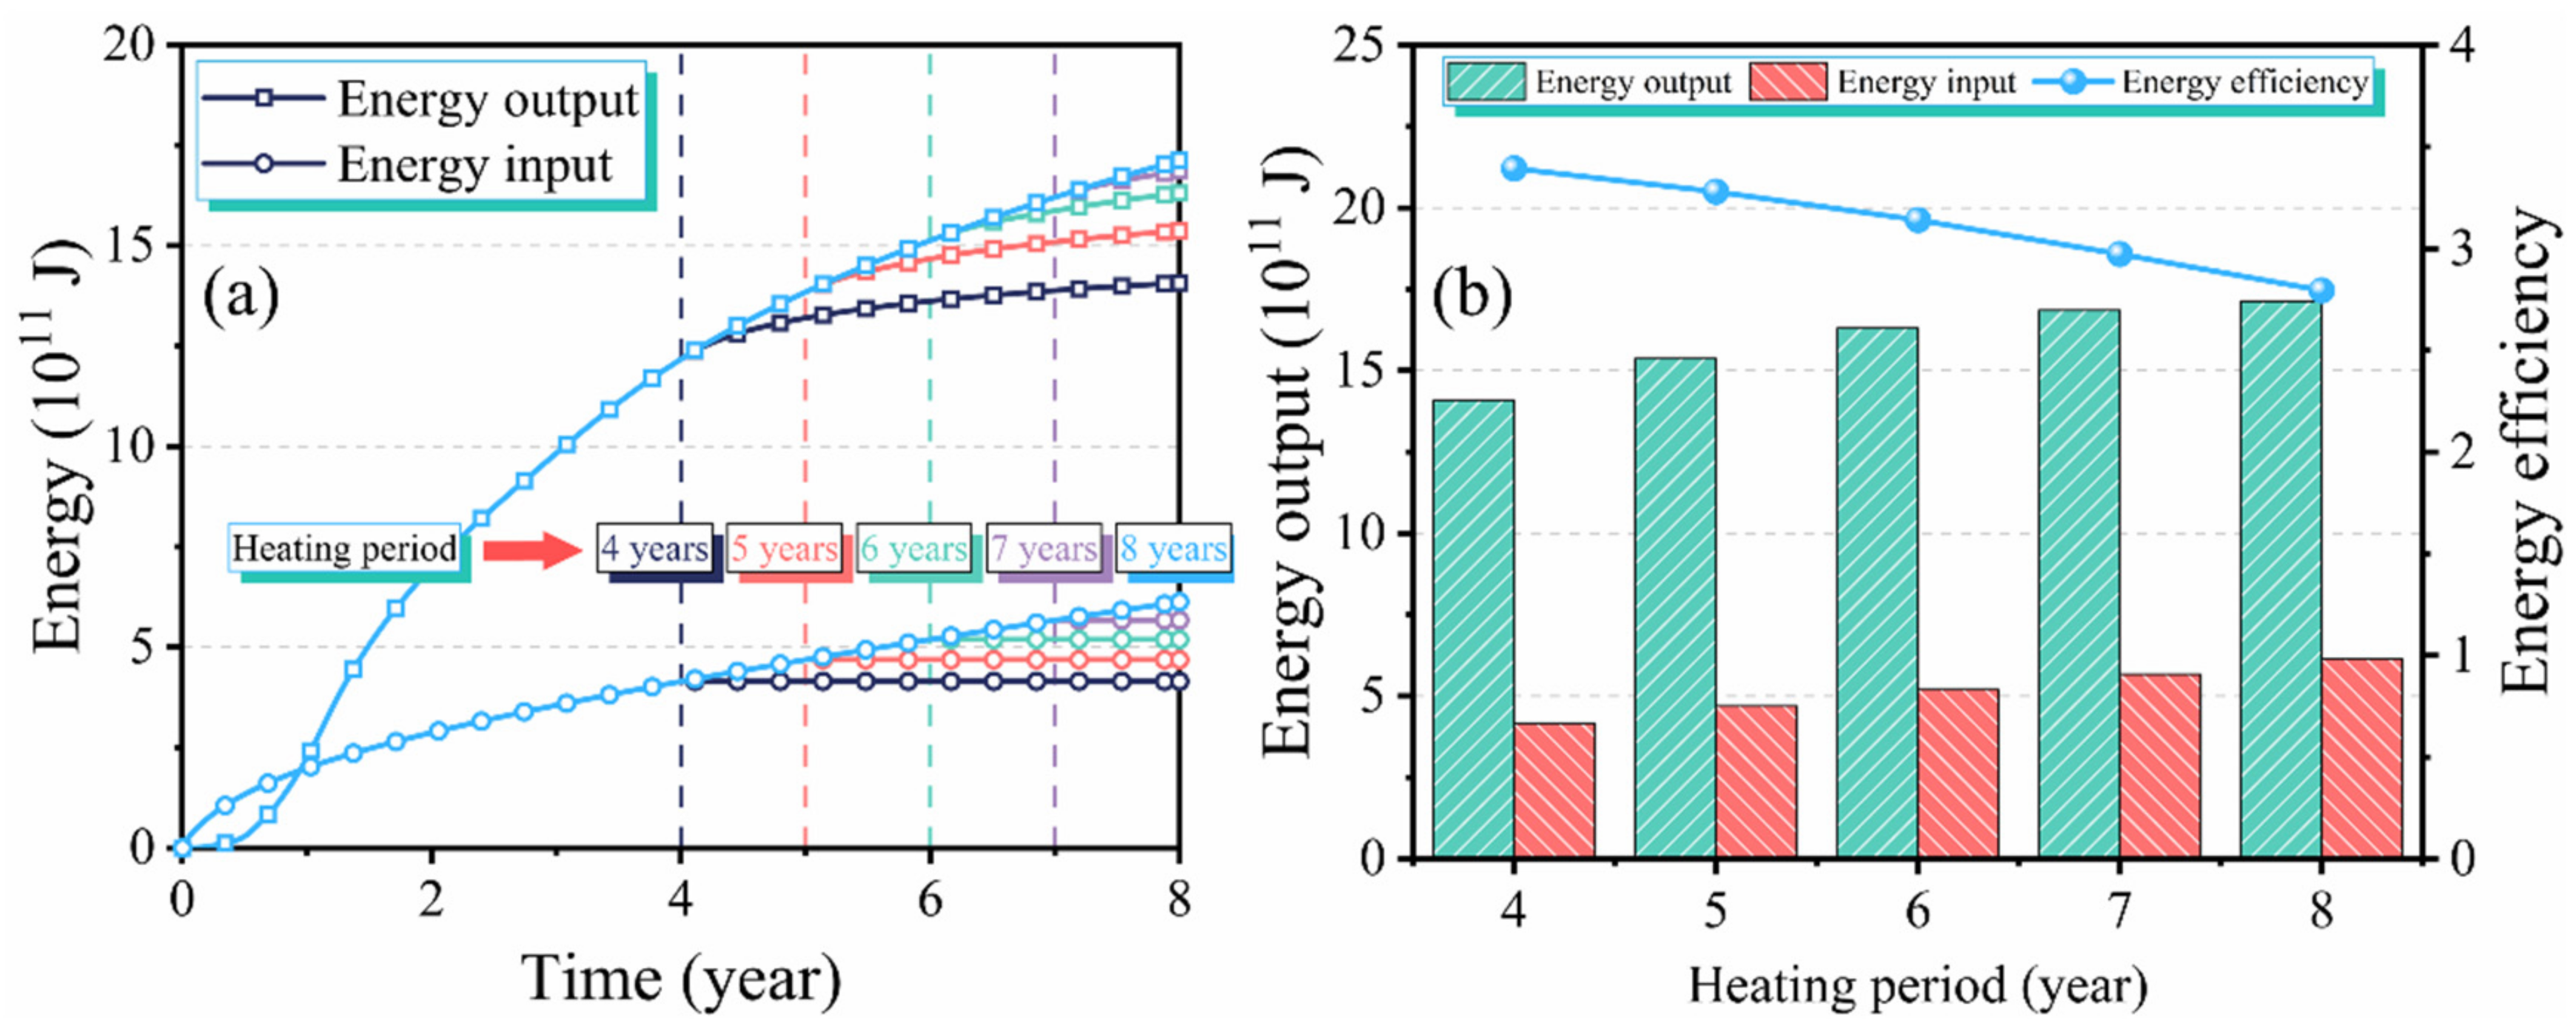
3.4. Effect of the Heating Period on Production Performance

As mentioned in Section 3.1, the output of heavy oil and light oil is concentrated in the first 4 years of the heating period, and the energy efficiency gradually decreases after five years, so the heating period should be shortened to obtain the highest benefit. To this end, this section analyzes the effect of a heating period ranging from four to eight years on the in situ conversion process. Note that the physical operation of shutting down the heating well is mathematically represented by a change in the boundary conditions, i.e., from a constant heating temperature to a thermally-insulated boundary (from the Dirichlet boundary condition to the Neumann boundary condition). In addition, the porosity-temperature relationship adopted in this study is monotonically increasing, which means that the decrease in formation temperature after shutting down the heating well will lead to a decrease in porosity, which is unreasonable. The increase in porosity with temperature can be considered to be caused by the pyrolysis of kerogen and other solid substances and thermal cracks, but the decrease in temperature will not affect these irreversible changes [46,48]. Therefore, to avoid a decrease in porosity after stopping the heating, the historical maximum value of porosity is defined as εm, and the change of historical parameter εm can be described by the Kuhn-Tucker relationship:
ε ˙ m 0 , ε ˙ m ε 0 , ε ˙ m ε ˙ m ε = 0
As shown in Figure 10a and Figure 11a, after shutting down the heating wells, the reservoir temperature gradually decreases, and a shorter heating period leads to a lower average reservoir temperature. Although the average temperature is lower, most of the kerogen is pyrolyzed when the heating period is 4 years as shown in Figure 10c and Figure 11b, and the pyrolysis rate of kerogen is 75.88%. As the heating period reaches eight years, the pyrolysis rate is improved to 87.25%. Figure 10b presents the production with different heating periods. It is observed that the effect of the heating period on the production of heavy oil is minimal. As the heating period decreases, the production of heavy oil is improved slightly, as shown in Figure 10d, because a higher temperature can lead to more pyrolysis of heavy oil. The production of light oil increased slightly with the increase in the heating period, while the production of HC gas is significantly improved with the increasing heating period.
Figure 12a depicts the variation of average unmodified porosity. It is observed that if the historical maximum value of porosity is not adopted, the porosity will decrease unreasonably after the heating stops. Figure 12b presents the historical maximum porosity and the corresponding permeability; it can be seen that the effect of the heating period on porosity and permeability is negligible. Finally, the influence of the heating period is analyzed from the perspective of energy. Figure 13a shows that the output energy continues to increase after stopping the heating, while the input energy does not change. As shown in Figure 13b, both input energy and output energy increase with a longer heating period, but the growth of the former is higher than the latter, which leads to decreasing energy efficiency.

4. Conclusions

In this work, a thermo-hydro-chemical-coupled model for the in situ conversion process is established to evaluate the production performance of oil shale reservoirs, where the temperature dependence of key parameters and the transverse isotropic characteristic of oil shale are considered. Subsequently, the internal mechanism of the in situ conversion process is comprehensively analyzed. It is found that the increase in the primary products of kerogen pyrolysis is concentrated in the early stage of the heating period, while the yield of the secondary products keeps increasing during the heating process. The energy efficiency of the in situ conversion process is greater than 1 after heating to 390 days and shows a trend of increasing first and then decreasing, reaching a maximum of 2.7 around the fifth year of the heating process. In addition, a sensitivity analysis is performed to study the effect of the heating temperature, the thermophysical properties of oil shale, and the heating period on production performance. It is observed that the heating temperature should be higher than 300 °C, otherwise the energy efficiency will be less than 1, but a higher heating temperature will lead to a smaller oil/gas ratio, and a heating temperature higher than 360 °C is associated with limited benefits. Additionally, higher thermal conductivity and smaller matrix heat capacity improve the oil and gas production, and oil production is more sensitive to the change in the thermophysical properties than gas production. Finally, it is found that when the heating period is more than 4 years, any increase in the heating period does not significantly affect the amount of pyrolyzed kerogen and oil production, and the energy efficiency decreases with increasing heating period due to more energy input.

Author Contributions

Conceptualization, J.J., W.J. and J.L.; methodology, X.Z., W.C. (Wei Cheng) and T.Y.; validation, J.J. and J.S.; formal analysis, J.J.; investigation, W.J., W.C. (Wei Cheng) and Z.Y.; resources, J.S.; data curation, X.Z.; writing—original draft, J.J.; writing—review & editing, Z.Y., W.C. (Weixi Chen) and T.Y.; visualization, W.C. (Weixi Chen); project administration, J.L.; funding acquisition, J.L. All authors have read and agreed to the published version of the manuscript.

Funding

This work is supported by the “Study on testing and evaluation of in situ stress and rock mechanical properties of low maturity shale oil reservoir”, Project Number: 2019D-500806, PetroChina RIPED.

Institutional Review Board Statement

Not applicable.

Informed Consent Statement

Not applicable.

Data Availability Statement

The data presented in this study are available on request from the corresponding author. The data are not publicly available due to privacy reasons.

Conflicts of Interest

The authors declare no conflict of interest.

References

  1. Wang, S.; Jiang, X.; Han, X.; Tong, J. Investigation of Chinese Oil Shale Resources Comprehensive Utilization Performance. Energy 2012, 42, 224–232. [Google Scholar] [CrossRef]
  2. World Energy Council. Survey of Energy Resources; World Energy Council: London, UK, 2010. [Google Scholar]
  3. Micheal, M.; Xu, W.; Jin, J.; Yu, H.; Liu, J.; Jiang, W.; Liu, H.; Wu, H. A Multi-Scale Quadruple-Continuum Model for Production Evaluation of Shale Gas Reservoirs Considering Complex Gas Transfer Mechanisms and Geomechanics. J. Pet. Sci. Eng. 2022, 213, 110419. [Google Scholar] [CrossRef]
  4. Li, Q.; Xu, S.; Zhang, L.; Chen, F.; Wu, S.; Bai, N. Shale Oil Enrichment Mechanism of the Paleogene Xingouzui Formation, Jianghan Basin, China. Energies 2022, 15, 4038. [Google Scholar] [CrossRef]
  5. Lee, K.J.; Moridis, G.J.; Ehlig-Economides, C.A. A Comprehensive Simulation Model of Kerogen Pyrolysis for the In-Situ Upgrading of Oil Shales. SPE J. 2016, 21, 1612–1630. [Google Scholar] [CrossRef]
  6. Hazra, K.G.; Lee, K.J.; Economides, C.E.; Moridis, G. Comparison of Heating Methods for In-Situ Oil Shale Extraction. In Proceedings of the IOR 2013-17th European Symposium on Improved Oil Recovery, Saint Petersburg, Russia, 16 April 2013; European Association of Geoscientists & Engineers: Bunnik, Netherlands, 2013; p. cp-342-00038. [Google Scholar]
  7. Micheal, M.; Xu, W.; Xu, H.; Zhang, J.; Jin, H.; Yu, H.; Wu, H. Multi-Scale Modelling of Gas Transport and Production Evaluation in Shale Reservoir Considering Crisscrossing Fractures. J. Nat. Gas Sci. Eng. 2021, 95, 104156. [Google Scholar] [CrossRef]
  8. Yu, H.; Chen, J.; Zhu, Y.; Wang, F.; Wu, H. Multiscale Transport Mechanism of Shale Gas in Micro/Nano-Pores. Int. J. Heat Mass Transf. 2017, 111, 1172–1180. [Google Scholar] [CrossRef]
  9. Li, X.; Zhou, H.; Wang, Y.; Qian, Y.; Yang, S. Thermoeconomic Analysis of Oil Shale Retorting Processes with Gas or Solid Heat Carrier. Energy 2015, 87, 605–614. [Google Scholar] [CrossRef]
  10. Han, X.X.; Jiang, X.M.; Cui, Z.G. Studies of the Effect of Retorting Factors on the Yield of Shale Oil for a New Comprehensive Utilization Technology of Oil Shale. Appl. Energy 2009, 86, 2381–2385. [Google Scholar] [CrossRef]
  11. Selberg, A.; Viik, M.; Pall, P.; Tenno, T. Environmental Impact of Closing of Oil Shale Mines on River Water Quality in North-Eastern Estonia. Oil Shale 2009, 26, 169–183. [Google Scholar] [CrossRef]
  12. Xu, H.; Yu, H.; Fan, J.; Xia, J.; Liu, H.; Wu, H. Formation Mechanism and Structural Characteristic of Pore-Networks in Shale Kerogen during in-Situ Conversion Process. Energy 2022, 242, 122992. [Google Scholar] [CrossRef]
  13. Brandt, A.R. Converting Oil Shale to Liquid Fuels: Energy Inputs and Greenhouse Gas Emissions of the Shell in Situ Conversion Process. Environ. Sci. Technol. 2008, 42, 7489–7495. [Google Scholar] [CrossRef]
  14. Hui, H.; Ning-Ning, Z.; Cai-Xia, H.; Yan, L.; Qing-Yong, L.; Na, D.; Xiao-Yan, H. Numerical Simulation of In Situ Conversion of Continental Oil Shale in Northeast China. Oil Shale 2016, 33, 45. [Google Scholar] [CrossRef]
  15. Kang, Z.; Zhao, Y.; Yang, D. Review of Oil Shale In-Situ Conversion Technology. Appl. Energy 2020, 269, 115121. [Google Scholar] [CrossRef]
  16. Raukas, A.; Punning, J.-M. Environmental Problems in the Estonian Oil Shale Industry. Energy Environ. Sci. 2009, 2, 723–728. [Google Scholar] [CrossRef]
  17. Kang, Z.; Zhao, Y.; Yang, D.; Tian, L.; Li, X. A Pilot Investigation of Pyrolysis from Oil and Gas Extraction from Oil Shale by In-Situ Superheated Steam Injection. J. Pet. Sci. Eng. 2020, 186, 106785. [Google Scholar] [CrossRef]
  18. Crawford, P.; Biglarbigi, K.; Dammer, A.; Knaus, E. Advances in World Oil-Shale Production Technologies. In Proceedings of the SPE Annual Technical Conference and Exhibition, OnePetro, Denver, CO, USA, 21–24 September 2008. [Google Scholar]
  19. Crawford, P.M.; Killen, J.C. New Challenges and Directions in Oil Shale Development Technologies. Oil Shale Solut. Liq. Fuel Dilemma 2010, 1032, 21–60. [Google Scholar]
  20. Fowler, T.D.; Vinegar, H.J. Oil Shale ICP—Colorado Field Pilots. In Proceedings of the SPE Western Regional Meeting, San Jose, CA, USA, 24 March 2009; SPE: San Jose, CA, USA, 2009; p. SPE-121164-MS. [Google Scholar]
  21. Yu, H.; Fan, J.; Xia, J.; Liu, H.; Wu, H. Multiscale Gas Transport Behavior in Heterogeneous Shale Matrix Consisting of Organic and Inorganic Nanopores. J. Nat. Gas Sci. Eng. 2020, 75, 103139. [Google Scholar] [CrossRef]
  22. Yu, H.; Xu, H.; Fan, J.; Zhu, Y.-B.; Wang, F.; Wu, H. Transport of Shale Gas in Microporous/Nanoporous Media: Molecular to Pore-Scale Simulations. Energy Fuels 2021, 35, 911–943. [Google Scholar] [CrossRef]
  23. Zhu, C.; Guo, W.; Sun, Y.; Li, Q.; Deng, S.; Wang, Y.; Cui, G. Reaction Mechanism and Reservoir Simulation Study of the High-Temperature Nitrogen Injection in-Situ Oil Shale Process: A Case Study in Songliao Basin, China. Fuel 2022, 316, 123164. [Google Scholar] [CrossRef]
  24. Ryan, R.C.; Fowler, T.D.; Beer, G.L.; Nair, V. Shell’s in Situ Conversion Process− from Laboratory to Field Pilots. In Oil Shale: A Solution to the Liquid Fuel Dilemma; ACS Publications: Washington, DC, USA, 2010; pp. 161–183. ISBN 1947-5918. [Google Scholar]
  25. Wang, G.; Yang, D.; Zhao, Y.; Kang, Z.; Zhao, J.; Huang, X. Experimental Investigation on Anisotropic Permeability and Its Relationship with Anisotropic Thermal Cracking of Oil Shale under High Temperature and Triaxial Stress. Appl. Therm. Eng. 2019, 146, 718–725. [Google Scholar] [CrossRef]
  26. Al-Ayed, O.S.; Matouq, M.; Anbar, Z.; Khaleel, A.M.; Abu-Nameh, E. Oil Shale Pyrolysis Kinetics and Variable Activation Energy Principle. Appl. Energy 2010, 87, 1269–1272. [Google Scholar] [CrossRef]
  27. Burnham, A.K.; Braun, R.L. Global Kinetic Analysis of Complex Materials. Energy Fuels 1999, 13, 1–22. [Google Scholar] [CrossRef]
  28. Kuang, W.; Lu, M.; Yeboah, I.; Qian, G.; Duan, X.; Yang, J.; Chen, D.; Zhou, X. A Comprehensive Kinetics Study on Non-Isothermal Pyrolysis of Kerogen from Green River Oil Shale. Chem. Eng. J. 2019, 377, 120275. [Google Scholar] [CrossRef]
  29. Bouamoud, R.; Moine, E.C.; Mulongo-Masamba, R.; El Hamidi, A.; Halim, M.; Arsalane, S. Type I Kerogen-Rich Oil Shale from the Democratic Republic of the Congo: Mineralogical Description and Pyrolysis Kinetics. Pet. Sci. 2020, 17, 255–267. [Google Scholar] [CrossRef]
  30. Hubbard, A.B.; Robinson, W.E. A Thermal Decomposition Study of Colorado Oil Shale; US Department of the Interior, Bureau of Mines: Washington, DC, USA, 1950; Volume 4744. [Google Scholar]
  31. Anthony, D.B.; Howard, J.B. Coal Devolatilization and Hydrogastification. AIChE J. 1976, 22, 625–656. [Google Scholar] [CrossRef]
  32. Campbell, J.H.; Gallegos, G.; Gregg, M. Gas Evolution during Oil Shale Pyrolysis. 2. Kinetic and Stoichiometric Analysis. Fuel 1980, 59, 727–732. [Google Scholar] [CrossRef]
  33. Braun, R.L.; Burnham, A.K. PMOD: A Flexible Model of Oil and Gas Generation, Cracking, and Expulsion. Org. Geochem. 1992, 19, 161–172. [Google Scholar] [CrossRef]
  34. Shen, C. Reservoir Simulation Study of An In-Situ Conversion Pilot of Green-River Oil Shale. In Proceedings of the SPE Rocky Mountain Petroleum Technology Conference, Denver, CO, USA, 14 April 2009; SPE: Denver, CO, USA, 2009; p. SPE-123142-MS. [Google Scholar]
  35. Fan, Y.; Durlofsky, L.; Tchelepi, H.A. Numerical Simulation of the In-Situ Upgrading of Oil Shale. SPE J. 2010, 15, 368–381. [Google Scholar] [CrossRef]
  36. Song, X.; Zhang, C.; Shi, Y.; Li, G. Production Performance of Oil Shale In-Situ Conversion with Multilateral Wells. Energy 2019, 189, 116145. [Google Scholar] [CrossRef]
  37. Wang, G.; Liu, S.; Yang, D.; Fu, M. Numerical Study on the In-Situ Pyrolysis Process of Steeply Dipping Oil Shale Deposits by Injecting Superheated Water Steam: A Case Study on Jimsar Oil Shale in Xinjiang, China. Energy 2022, 239, 122182. [Google Scholar] [CrossRef]
  38. Wang, G.; Yang, D.; Kang, Z.; Zhao, J. Anisotropy in Thermal Recovery of Oil Shale—Part 1: Thermal Conductivity, Wave Velocity and Crack Propagation. Energies 2018, 11, 77. [Google Scholar] [CrossRef]
  39. Pei, S.; Wang, Y.; Zhang, L.; Huang, L.; Cui, G.; Zhang, P.; Ren, S. An Innovative Nitrogen Injection Assisted In-Situ Conversion Process for Oil Shale Recovery: Mechanism and Reservoir Simulation Study. J. Pet. Sci. Eng. 2018, 171, 507–515. [Google Scholar] [CrossRef]
  40. Braun, R.L.; Burnham, A.K. Mathematical Model of Oil Generation, Degradation, and Expulsion. Energy Fuels 1990, 4, 132–146. [Google Scholar] [CrossRef]
  41. Zhu, J.; Yi, L.; Yang, Z.; Li, X. Numerical Simulation on the in Situ Upgrading of Oil Shale Reservoir under Microwave Heating. Fuel 2021, 287, 119553. [Google Scholar] [CrossRef]
  42. Zhu, J.; Yi, L.; Yang, Z.; Duan, M. Three-Dimensional Numerical Simulation on the Thermal Response of Oil Shale Subjected to Microwave Heating. Chem. Eng. J. 2021, 407, 127197. [Google Scholar] [CrossRef]
  43. Whitaker, S. Flow in Porous Media I: A Theoretical Derivation of Darcy’s Law. Transp. Porous Media 1986, 1, 3–25. [Google Scholar] [CrossRef]
  44. Xu, W.; Yu, H.; Micheal, M.; Huang, H.; Liu, H.; Wu, H. An Integrated Model for Fracture Propagation and Production Performance of Thermal Enhanced Shale Gas Recovery. Energy 2023, 263, 125682. [Google Scholar] [CrossRef]
  45. Geng, Y.; Liang, W.; Liu, J.; Cao, M.; Kang, Z. Evolution of Pore and Fracture Structure of Oil Shale under High Temperature and High Pressure. Energy Fuels 2017, 31, 10404–10413. [Google Scholar] [CrossRef]
  46. Zhao, J.; Yang, D.; Kang, Z.; Feng, Z. A Micro-CT Study of Changes in the Internal Structure of Daqing and Yan’an Oil Shales at High Temperatures. Oil Shale 2012, 29, 357. [Google Scholar] [CrossRef]
  47. Wang, L.; Zhao, Y.; Yang, D.; Kang, Z.; Zhao, J. Effect of Pyrolysis on Oil Shale Using Superheated Steam: A Case Study on the Fushun Oil Shale, China. Fuel 2019, 253, 1490–1498. [Google Scholar] [CrossRef]
  48. Saif, T.; Lin, Q.; Singh, K.; Bijeljic, B.; Blunt, M.J. Dynamic Imaging of Oil Shale Pyrolysis Using Synchrotron X-Ray Microtomography. Geophys. Res. Lett. 2016, 43, 6799–6807. [Google Scholar] [CrossRef]
  49. Pei, S.; Cui, G.; Wang, Y.; Zhang, L.; Wang, Q.; Zhang, P.; Huang, L.; Ren, S. Air Assisted in Situ Upgrading via Underground Heating for Ultra Heavy Oil: Experimental and Numerical Simulation Study. Fuel 2020, 279, 118452. [Google Scholar] [CrossRef]
  50. Wang, G.; Yang, D.; Kang, Z.; Zhao, J.; Lv, Y. Numerical Investigation of the in Situ Oil Shale Pyrolysis Process by Superheated Steam Considering the Anisotropy of the Thermal, Hydraulic, and Mechanical Characteristics of Oil Shale. Energy Fuels 2019, 33, 12236–12250. [Google Scholar] [CrossRef]
  51. Speight, J.G. Lange’s Handbook of Chemistry; McGraw-Hill Education: New York, NY, USA, 2017; ISBN 1-259-58609-X. [Google Scholar]
Figure 2. Schematics for the geometry and the coupling relationship of the model: (a) two-dimensional oil shale reservoir model; (b) the relationship of the coupled physical fields.
Energies 16 02103 g002
Figure 3. Temperature and kerogen concentration distribution during the in situ conversion process: (a) temperature distribution; (b) kerogen concentration distribution.
Energies 16 02103 g003
Figure 4. Temperature and energy evolution during the in situ conversion process: (a) evolution of average reservoir temperature and heat flux of heating wells; (b) evolution of energy input, energy output, and energy efficiency.
Energies 16 02103 g004
Figure 5. Evolution of production of fluid components and concentration of solid components during the in situ conversion process: (a) cumulative production of heavy oil, light oil, and hydrocarbon gas; (b) the average concentration of kerogen, prechar, and char.
Energies 16 02103 g005
Figure 6. Effect of heating temperature on: (a) average reservoir temperature and concentration of solid matter; (b) average porosity and permeability; (c) cumulative production of oil and gas products; (d) cumulative input energy, output energy and energy efficiency.
Energies 16 02103 g006
Figure 7. Effect of thermophysical properties of oil shale on average reservoir temperature: (a) thermal conductivity; (b) heat capacity.
Energies 16 02103 g007
Figure 8. Evolution of energy efficiency under different: (a) thermal conductivity; (b) heat capacity. Cumulative input energy, output energy and energy efficiency under different; (c) thermal conductivity; (d) heat capacity.
Energies 16 02103 g008
Figure 9. Sensitivity analysis of thermal conductivity on (a) cumulative production of fluid components. (b) average porosity and permeability. Sensitivity analysis of heat capacity on (c) cumulative production of fluid components. (d) average porosity and permeability.
Energies 16 02103 g009
Figure 10. Effect of the heating period on: (a) average reservoir temperature; (b) cumulative production of fluid components; (c) the average concentration of kerogen; (d) production of heavy oil.
Energies 16 02103 g010
Figure 11. Effect of the heating period on: (a) temperature distribution; (b) kerogen concentration distribution.
Energies 16 02103 g011
Figure 12. Porosity and permeability under different heating periods: (a) evolution of average unmodified porosity; (b) average porosity and permeability.
Energies 16 02103 g012
Figure 13. Effects of the heating period on: (a) input and output energy evolution; (b) cumulative input energy, output energy and energy efficiency.
Energies 16 02103 g013
Table 1. Reaction model for multistage pyrolysis of kerogen [39].
ReactionsFrequency Factor (1/s)Activation Energy (kJ/mol)Enthalpy (kJ/mol)
Kerogen → 0.010699 Heavy oil + 0.009722 Light oil + 0.007131 HC gas + 0.641083 Prechar3.0 × 1013213.384−335
Heavy oil → 0.661282 Light oil + 1.503765 HC gas + 13.4175 Prechar1.0 × 1013226.09−46.5
Light oil → 3.237828 HC gas+ 5.182242 Prechar5.0 × 1011226.09−46.5
Prechar → 0.017177 HC gas + 0.99021 Char1.0 × 1013226.09−46.5
Table 2. Parameters used in the simulations.
ParameterValueSource
Initial reservoir temperature25 °C-
Initial reservoir pressure8 MPa-
Heating temperature360 °C-
Bottom hole pressure1 MPa-
Initial thermal conductivity of the fluid mixture0.1 W/(m·K)-
Initial porosity of oil shale0.019[46]
Initial permeability of oil shale0.001 mD-
Initial heat capacity of the fluid mixture2050 J/(kg·K)[51]
Initial dynamic viscosity of the fluid
mixture
1.2 × 10⁻³ Pa·s[51]
Initial density of the fluid¥mixture700 kg/m3[51]
Density of oil shale2520 kg/m3[35]
Molecular weight of kerogen14.70 g/mol[39]
Molecular weight of heavy oil382.4 g/mol[39]
Molecular weight of light oil215.7 g/mol[39]
Molecular weight of HC gas46.3 g/mol[39]
Molecular weight of prechar12.7 g/mol[39]
Molecular weight of char12.0 g/mol[39]
Disclaimer/Publisher’s Note: The statements, opinions and data contained in all publications are solely those of the individual author(s) and contributor(s) and not of MDPI and/or the editor(s). MDPI and/or the editor(s) disclaim responsibility for any injury to people or property resulting from any ideas, methods, instructions or products referred to in the content.

