Article

Influence of Battery Energy, Charging Power, and Charging Locations upon EVs’ Ability to Meet Trip Needs

by
Willett Kempton
1,2,*,
Nathaniel S. Pearre
1,3,
Randall Guensler
4 and
Vetri V. Elango
4,5
1
Center for Research in Wind, College of Earth, Ocean, and Environment, University of Delaware, Newark, DE 19711, USA
2
Department of Electrical and Computer Engineering, University of Delaware, Newark, DE 19711, USA
3
Renewable Energy Storage Laboratory, Dalhousie University, Halifax, NS B3H 4R2, Canada
4
School of Civil and Environmental Engineering, Georgia Institute of Technology, 790 Atlantic Drive, Atlanta, GA 30332, USA
5
Google LLC, Mountain View, CA 94043, USA
*
Author to whom correspondence should be addressed.
Energies 2023, 16(5), 2104; https://doi.org/10.3390/en16052104
Submission received: 1 January 2023 / Revised: 7 February 2023 / Accepted: 15 February 2023 / Published: 21 February 2023
(This article belongs to the Section E: Electric Vehicles)

Abstract

:
One year of high-resolution driving data from a sample of 333 instrumented gasoline passenger vehicles are used to create a trip inventory of U.S. vehicle travel requirements. A set of electric vehicles (EVs) is modeled, differing in battery size (kWh), recharging power (kW), and locations for charging when parked. Each modeled EV’s remaining energy is tracked while traversing the entire sample’s trip inventory in order to estimate how well each EV meets all U.S. driving requirements. The capital cost of refueling infrastructure is estimated per car, for gasoline and for each analyzed combination of charging station locations. We develop three metrics of the ability of different EV characteristics to meet trip requirements: the percentage of trips successfully met by each modeled EV, the number of days that the driver must “adapt” EV use to meet more demanding trip requirements, and the total driver time required for refueling. We also segment the market of trip patterns per car, finding that 25% to 37% of the vehicle population could meet all their drivers’ trip needs with a smaller-battery EV combined with community charging. This potential combination of EVs and charging would enable lower-price EVs and lower-cost recharging power, and would broaden EV availability to groups for whom today’s EVs and charging configurations are less accessible.

1. Introduction

As an energy carrier for the vehicle fleet, liquid fuels have the desirable characteristic of high energy density. From this derive the two primary concerns about the ongoing transition from liquid fuels to electricity: driving range achieved by a full charge (a concern about energy storage) and the time required to refill the battery (a concern about charging power). Another more subtle difference between liquid fuels and electricity is that electricity is ubiquitous in the developed world, whereas liquid fuels are available only from specialized retailers with bulk storage, pumping, and environmental controls. For electricity, any parking spot within a wire run of electric power distribution is a potential refueling station. This leads to the third primary variable affecting EV trip success: availability of recharging facilities at locations where the driver parks for other reasons. When multiple charging locations are available, the driver can follow a strategy of “charge when stopped” rather than “seek charge when low” [1].
In considering the requirements for electric passenger vehicles to replace liquid-fueled ones, an interesting though possibly misleading statistic is that on an average day in the U.S., light vehicles are driven for only one hour and travel on average 35 miles [2]. All mass-produced electric battery vehicles store more than enough energy for that average day (itemized subsequently). One step more advanced, but still a univariate quantification of EV adequacy, is to determine the number of days for which a given battery capacity (in kWh) is sufficient for the entire day’s driving [3,4]. A small refinement is to disaggregate from this mean to a distribution of daily driving patterns by individuals, looking for each driver’s maximum daily trip distance over one or more years; this per-driver analysis has found, for example, that an EV with 100 mile (161 km) range could meet 100% of the driving needs of the least-driving ¼ of the population (see Figure 7 of [5]). Another approach has been to calculate an optimal battery size [6]. We posit that the “optimal” size is not a point but a function of quantitative tradeoffs, such as the number of days per year one would need to stop to charge en route or substitute another vehicle for a long trip. Thus, this study will analyze the distribution of observed trips over a full year, then quantify the ability of different modeled EVs and charging to meet the actual distribution of travel of different market segments.

1.1. Driving Range Needs

There is limited empirical analysis of the distribution of driver range needs, in part due to the cost of high time resolution GPS driving data for many vehicles over one or several years. Studies based on surveys or small samples give varying results. For example, one study investigating range examined a small set of vehicles sampled for few days each and suggested that more than 95% of daily driving can be accomplished with 100 miles of electric range [7]. One large sample study, although it had individual trip resolution, nevertheless concluded that a small-battery vehicle would be sufficient based on average daily distances [3]. The U.S. government similarly tabulates average driving per day [2].
Another prior EV study followed 450 leased BMW Mini E vehicles. Among its conclusions was that the limited range (70–100 miles) did not encumber mobility most of the time. Specifically, 45% of drivers reported using the Mini E for 90–100% of trips. Moreover, charging overnight at home was reported to be adequate to satisfy most travel needs [8]. More quantitatively, Pearre et al. [5] examined full-day driving and counted days of insufficient range. Similar to Steinberg [8], Pearre et al. found that more than half of the fleet could meet 95% of driving needs with 100 miles range using only overnight home charging [5].
Such studies, reporting the average distance traveled or range to meet “most” trips, do not capture the car buyers who purchase a vehicle to cover their own needs on all days. A complete vehicle-purchase-relevant analysis also need not be restricted to home charging. Thus, we assert the importance of the long-term monitoring of each vehicle studied to establish requirements based on a trip inventory of all trips over a year for each vehicle. With such a trip inventory for each driver, the analysis can also answer market segmentation questions such as “What proportion of drivers will find that a vehicle with a given range meets 100% of their travel needs in a year?” as well as whole-population questions such as “How often will a vehicle with given range and charging power fail to meet U.S. driving needs?” or “If charging is available at most stops, can battery size be reduced?”
The problems of range limits and speed of recharging have also been addressed technically, for example, by very high-power charging (350 kW), which attempts to approach gasoline-fueling speed (but incurs an expensive, heavy hose and awkward plug insertion), or the plug-in hybrid vehicle (PHEV), which carries a separate liquid fuel system to take over when the battery is empty. Although stopping for gasoline seems inconvenient to an EV driver, it is familiar to liquid-fuel vehicle drivers and thus does not yet deter gasoline car or PHEV purchase [9]. To gain an understanding of the EV transition, we focus here on battery EVs without liquid fuel, as the more challenging vehicle class and as they represent ⅔ of today’s plug-in sales, a fraction that is growing over time [10]. We hence use “gasoline” to refer to any automotive liquid fuels.

1.2. Approach of This Study

To understand electric vehicle adoption and needed battery and charging capabilities, we will evaluate under what circumstances EVs can successfully provide the transportation services now provided by gasoline vehicles. To this end, this study extracts the trips taken, and the stops already made (as possible charging opportunities), over a year for 333 gasoline vehicles, creating a trip inventory. Then, we model EVs and run them through exactly the same trips taken by the 333 gasoline cars over one year. When a simulated EV fails to achieve all the same trips as the gasoline vehicle did—because the battery empties before reaching the next charging station—it is counted as a negative on our three metrics: lower trip success, needed range adaptations, or added fueling time to stop at a fast en route charger. Unlike studies focused on daily driving, which implicitly assume only home charging, here we tabulate battery drawdown and refill, distinguishing among multiple trips in a day, each with its own time of departure, travel distance, and stops for daily tasks with potential charging opportunities, in order to compare availability of charging stations at one, two, or many parking locations.

1.3. Charging Infrastructure

Society’s shift from liquid fuels to electricity entails, among other things, reconceptualizing vehicle fueling. Today’s vehicle fuels are expensive, inefficient, flammable, and toxic. These characteristics have led to centralized, commercial fueling where drivers stop primarily or exclusively to fuel, fill the vehicle in a few minutes, and pay the supplier. In the emerging practice of electric fueling, fueling is slow but the recharge infrastructure is widely distributed, mostly at locations where vehicles will be parked for reasons other than fueling (e.g., home, work, shopping, visiting). In addition, required electric safety features are inexpensive and built into devices (charging station and vehicle), the fuel is inexpensive (per mile), and fuel payment may not be a separate transaction or may not even be metered (e.g., home and some workplaces).
Prior to our primary analysis based on the trip inventory, it is useful to compare gasoline with electric fueling infrastructure. The U.S. has approximately 287 million light vehicles, more than one per adult. In 2021, there were 108,790 gasoline stations [11], or one per 2638 vehicles. The cost to build one station (excluding property) is approximately USD one million (Building a gasoline station costs from USD 700,000 to 1.4 M (data from [12], adjusted for inflation to 2022); for the sale of an operating station, mid-range prices are USD 250,000 to 2 M [13]). Thus, for 2638 vehicles the infrastructure cost is USD 379 per vehicle served. Since electric refueling is an enhancement to an existing parking space, it is also useful to compare the cost of a parking space, which varies with neighborhood density from USD 3978 to 22,630 [14], or less for the 20% of the population in rural areas where the only improvement needed is to add paving. The parking space is not an added cost to EV charging, but it is useful to remember the relative cost to enhance that space by adding a charging station. All costs are shown in Table 1 (rounded).
For the installed cost of AC recharging, we assume USD 1500 to 3000, or more if significant new wiring is necessary. These figures are for a more mature market with USD 1500 for home charging, USD 3000 for workplace or parking lot, and USD 70,000 for 150 kW DC charging. The cost comparisons do not include maintenance costs, which are lowest for AC charging without billing or network authorization (typical of home or workplace, some shopping), higher for stations with authorization and billing (typical for en route), and highest for DC charging [1]. (Simple AC charging stations can have over a 10-year lifespan with occasional replacement of the connector, whereas DC stations have exhibited a more limited lifetime (e.g., 5 years) with frequent maintenance. By using fast AC charging, up to 120 kW has recently been standardized, at much lower capital and maintenance cost than DC charging at the same power [15]. Fast AC charging could make fast en route charging more cost-effective in the future, but neither maintenance costs nor fast AC charging savings are included in Table 1’s illustrative cost comparison).
Our analysis examines three levels of the locational availability of AC charging stations: only one for each EV (at home), two per car (home + work), or many per car (most parking locations). We also analyze one AC charger at home plus a shared fast charger en route, that is, one AC charger dedicated per EV plus one DC shared by 300 EVs. Finally, the cost is calculated for only DC chargers, assuming one per 30 users (cars per DC charger are from [16]). From these assumptions, the station costs per vehicle are compared in Table 1. We will also analyze charging at all stops of ½ h or more, which we estimate to be four stations per car in the U.S.; of those stops, home and one-shift workplaces typically provide one dedicated charger per EV. (The U.S. parking space population is approximately eight per car, but that is overbuilt due to zoning requirements, whereas cities that have rationalized parking requirements manage with half that number [17]. Also, some low-usage parking spaces will not merit charging investment.) Thus, we use four charging stations per car (Home + Work + 2) to estimate cost of chargers at all stops [17]). We will assume a DC charger at an installed cost of USD 70 K would, if used only for long trips, be shared among 300 cars [16], so a home AC plus an en route charger divided by 300 cars would be USD 1500 + 233, notably less than one home plus three dedicated AC chargers.
The higher cost of electric charging equipment in comparison to gasoline stations is significant but may be justified by the lower cost of fuel and maintenance. To estimate fuel, an annual 15,000 miles of driving at 27 mpg (about the U.S. fleet average [18]) would require 555 gallons at USD 3.50, or 4200 kWh at ¢12 (assuming 280 Wh/mile). Maintenance for a gasoline car is 6 ¢/mile and for an EV, 3 ¢/mile [19]. The lower electricity fuel cost saves USD 1486 per year, and with maintenance savings, total operating savings would be USD 1936 per year (USD 1486 + 450). Thus, most configurations of station cost are small in comparison to operating savings. Table 1’s comparison is illustrative but incomplete because station installation costs vary greatly by location, and customer per-kWh fees are much higher for DC stations and for stations requiring authorization, factors not considered in Table 1.
New parking spaces need not be built for charging stations—it is most efficient to add charging where EV drivers already park for other purposes. Nevertheless, the parking space row in Table 1 reminds us that the current cost of parking space per car is far more than the cost of adding a charging station, more so because U.S. parking space per car is so overbuilt [17].
The ongoing national efforts for EV charging stations, e.g., in the U.S. [20], further motivates understanding alternative possible buildouts and the best utilization and value among the alternatives. To do so, we will quantify trip success against charger availability in the following analysis, then reconsider the equipment costs in Table 1.

2. Materials and Methods

2.1. Data Sources and Validity

The trip and parking duration analysis is based on a one-second resolution database of U.S. vehicle use, previously collected in order to study traffic patterns, driver behavior, and vehicle emissions [21]. Vehicles were selected for the study by random stratified sampling from 13 counties in the Atlanta, GA, greater metropolitan area [22]. The sampled area accounts for roughly half of Georgia’s population. The study participants over-represent the highest income groups and under-represent the lowest income groups but in other respects are a good sample of the regional population demographics [23]. Car use in the Atlanta region and in Georgia is just slightly above contemporaneous U.S. averages, so the sample is a reasonable one to test if EVs can adequately match the car travel patterns. For further discussion of the sample, see [5].
For the study, whenever the ignition of one of the instrumented vehicles was turned on, a GPS receiver and computer in that vehicle would record vehicle position, time, and several operating variables once per second until the vehicle was again switched off. All travel during the study period is included in the resulting dataset. Of the total sample, about 1/3 of the cars were eliminated due to quality checks or an inability to identify home and work locations. Specifically, to be included, each car required the following:
(i)
active for at least 9 months of the sampled year;
(ii)
parked at a “home” location at least 35% of the time;
(iii)
identified Home and Work (defined in Section 2.2) within 150 miles of Atlanta;
(iv)
at least 95% of trips successfully recorded a trip distance greater than zero.
This effort resulted in many terabytes of second-by-second vehicle positions, covering 333 individual cars in 269 households over a period of one to three years.
The analyses reported here are based upon on the portion of these data covering the calendar year 2004, a leap year of 366 days. Second-by-second data from each vehicle were pre-processed into individual “trips”. Each trip is defined as a duration of the vehicle’s ignition being turned on (a trip is from key-on to key-off) and is described by a start time and location, end time and location, and distance. Our EV model treats stopped times between trips as potential times for EV recharge, even though the vehicles creating the trip inventory were gasoline-fueled vehicles.
For this analysis, we assumed that for stops of less than 30 min, the driver would judge plugging in and recharging not worth the bother for a short charge, so for pairs of trips with a 30 min or less stop between them, we here concatenate into one trip with duration and distance summed.

2.2. Home and Work Locations

To analyze how the data on travel patterns inform electric vehicle charging opportunities, it is important to know when vehicles are at locations that would be more likely to have charging stations, or ‘Electric Vehicle Supply Equipment’ (EVSE).
First, we identify the most frequent parking locations for each vehicle. “Home” for each vehicle is identified as a location
(i)
that the vehicle is parked for the greatest cumulative number of hours during the year of the study; and
(ii)
any other locations where the vehicle, over the year, spends more than 100 cumulative hours between 1 am and 5 am.
Criterion (ii) was included in the definition of “Home” to address multi-house families (vacation homes, driving teens with divorced parents, couples not yet living together, etc.), as well as cars sold and people who moved during the study. We capitalize “Home” when referring to the locations meeting this definition. For those vehicles with more than one Home location, parking at any of them counts as parking at Home. The number of cumulative nighttime hours for criterion (ii) was selected by trial and error to give results most consistent with NHTS survey data. When the criterion (ii) cutoff was less than 100 nighttime hours, the vehicles at Home at night dropped. When the criterion was much more than 100 h, the vehicles parked at Work (defined below) during workdays fell significantly.
After identifying Home, we labeled as “Work” the place with the second most hours parked, excluding stops within 40 m from Home (to account for street or alternative parking near Home). Since the U.S. has more vehicles than full-time jobs, some “Work” locations may be school, a hobby or leisure, or another frequent daytime destination, and not necessarily a workplace. Other locations less frequent than “Work” will be discussed with charging “Everywhere”. The labels Home and Work may be incorrect for a few cases such as home-workers or night shift-workers, those with non-stationary job overnights (contractors, traveling sales), and the unemployed. Nevertheless, because these labels are used to model where we place EVSEs, the Home and Work labels by definition identify the most used parking locations. With these provisos, the labels Home and Work will be used for the following analysis.
The histogram in Figure 1 shows the distribution of time at Home and at Work (fractions are normalized if the vehicle’s data spanned less than one year). As an example, the tallest black bar in Figure 1 indicates that about 16% of vehicles are parked at Home between 60 and 65% of the time. More broadly, a majority (68%) spends between 55% and 80% of the time parked at Home, with a mean of 70% (As a quick check, consider a commuting vehicle, for example, that is away from home 8:30 am to 5:30 pm workdays, and spends 3 h away from home each day of the weekends and holidays, together with a two-week vacation. Such a vehicle would be spending 71% of the year at Home, the mean of our sample in Figure 1).
The grey bars in Figure 1 are the fraction of the time parked at Work. A typical full-time job in the U.S. is just under 2000 h at work, just under 22% of the year. Since not all jobs are full-time, we expect few vehicles parked at Work more than 22% of the time, which Figure 1 confirms. The tallest Work bar is leftmost, 52% (cropped in figure). This bar is for vehicles spending 0 to 0.05 of the time (e.g., less than 36 h per month) at Work. Our results are compatible with the NHTS result that only 27% of trips are to or from work [25]. We find the mean time at Work is 8%, with a median of 5%, again reminding that our identification of “Work” is the most frequent daytime destination for that vehicle, not necessarily an employer.
The distribution at Home and at Work is also a function of time of day. The time-of-day analysis both validates our location labels and reveals driver behavior. We divided each day in the year into a series of 10 min time spans, counting the cars parked at each location at each time. These totals are normalized by the number of cars in the study through time, and then separated into workdays versus weekend or holidays. The list of U.S. federal holidays was refined based on driving patterns. (Specifically, federal holidays with driving patterns characteristic of workdays, or conversely, non-holidays with holiday patterns (e.g., Friday after Thanksgiving), were correspondingly categorized for analysis in Figure 2). In Figure 2, these distributions are graphed by their mean, maximum, minimum, and standard deviation for each 10 min interval.
Figure 2 shows that the number of cars at Home is at maximum and constant from midnight to 5 am on workdays. On workdays, 35% leave Home and arrive at Work by 9 am. The fraction at Work overnight is 3.5%, corresponding to Labor statistics on night shift-work [26]. On weekdays, 40% of the fleet is at Work. One tenth of that 40% leave Work for an hour at lunchtime, and the population at Work declines steadily from 3 pm to 5 pm, then continues to decline more slowly from 5 pm to 9 pm, with a few continuing to depart through midnight. On weekends, those at Work rise only to 12% by mid-day.
Overall, Figure 1 and Figure 2 suggest that inferred Home and Work locations are reasonable. These locations are also corroborated by their correspondence with National statistics and with the authors’ personal driving experience.

2.3. Translating Electrical Energy into Driving Distance

To understand how EV driving and range capabilities relate to energy requirements, we estimate energy consumption per distance. The essential measurements of energy efficiency are given in Table 2, based on EV passenger car data from manufacturer specifications, reviews, or our calculations. The test cycles and representativeness of sources on the vehicles in Table 2 are not totally comparable, due to the incommensurate testing standards and our varying sources.
The reported or calculated energy consumption of EVs in Table 2 spans from 130 to 644 Wh/mile (metric energy efficiency of 2.50 to 12.4 km/kWh). The very high efficiency of the Aptera 2e is achieved by a design optimized for aerodynamics and low weight, at the cost of carrying only two passengers and an unconventional sedan body. Conversely, the very low efficiency for the GMC Hummer reflects curb weight over 9000 lbs. and drive power of 1000 hp. Ignoring the outliers, energy consumption of EV sedans is within 230 to 333 Wh/mile. Thus, we will use the midpoint value of 280 Wh/mile (5.75 km/kWh) as a representative efficiency value to derive range in our EV model, per Equation (1a) or (1b).
R (mi) = E (kWh)/C (0.280 kWh/mile)
R (km) = E (kWh) × η (5.75 km/kWh)
where
R is range in the given units,
E is battery energy in kWh,
C is energy consumption in kWh/mile, and
η is energy efficiency in metric units, km/kWh.
We note that this calculation of range is a simplification. Some EVs are more efficient and some less, per Table 2, and the calculation does not consider temperature, driving patterns, or differences among EV models. However, a constant conversion was required to simplify the EV model and to focus on the primary variables that were the target of this study.

3. EV Model Description

We model a diverse virtual fleet of EVs with a distribution of battery capacities and recharge powers, spanning recent and current EV product offerings. In operation, the EV model tracks each battery’s electrical energy (the state of charge) of each modeled EV for each day as they attempt to match the observed vehicle use patterns in the trip inventory. The output of the model quantifies the ability of differing EVs to complete the trip inventory. Thus, successful trip completion is recorded if the battery energy does not fall to zero during the day’s travel. Distance traveled is converted to reduction in on-board energy at a constant energy consumption of 280 Wh/mile, as noted above.
An increase in the battery energy level occurs at the stops designated to have charging, at the charging power in the EV model and over the duration of the stop in the trip inventory.

3.1. Battery Energy and Recharge Power

The energy capacity of an electric vehicle’s battery is a primary design consideration, as it is one of the predominant factors determining the distance that an EV can travel between charges, and because batteries are expensive and heavy, it also strongly affects the vehicle cost and weight. To evaluate the relationship between battery size and the ability to complete trips, the EV model includes 11 values of battery size, from 2.5 kWh to 100 kWh, which at 280 Wh per mile traveled implies vehicles with driving ranges of between 9 and 357 miles from a full charge. The calculated range, rather than the manufacturers’ claimed range, is used on the X-axis of the following graphs.
The recharging power is the speed at which the EV can take in energy over time. Maximum recharging power is determined by the battery management system, the maximum power of the power electronics onboard the vehicle and of the plug and circuit connecting the EV to the grid. The lowest of these power capabilities is limiting and in this discussion is referred to as the “plug power”. Twelve plug power levels were defined in the EV model, from 1.2 to 100 kW. The smallest of these, 1.2 kW, is achieved even by a minimal supply such as the U.S. standard 120 Volts supplying 10 Amps (a minimal EU 230 V, 1ϕ at 10A is 2.3 kW). An intermediate value of 10 kW corresponds to conventional North American household wiring for large appliances (e.g., 240 Volts drawing 42 Amps). Higher levels between 40 and 50 kW are now available in much of Europe, using the 3ɸ at 400 V power common there [27]. The upper end of the modeled range, 100 kW, would require U.S. industrial utility service such as 120 Amps, 3Φ at 480 Volts. Systems of 50 to 150 kW power are used for en route charging but are impractical at many locations: in homes, this power level cannot be secured, and at long-duration parking (work or shopping) it is not cost-effective compared to 10 kW or 20 kW low-cost AC charging.

3.2. Charging Station Availability by Location

The final variable that will affect EVs’ ability to meet travel needs is the degree to which charging stations (EVSEs) are available where needed. We model three levels of buildout, based on EVSEs being available: (i) at Home, (ii) at Home and at Work, and (iii) at all stops in the trip inventory (Everywhere). The first level of EVSE availability assumes that vehicles will be able to charge only when they are at Home (as noted, an assumption from many studies). The second level assumes that vehicles will be able to charge both at Work and at Home. The third level assumes that vehicles will be able to charge anywhere they stop, in short, “Everywhere”—although for cost-efficiency some rarely used parking would not merit charging stations.
As noted previously, stops of less than 30 min of the gasoline vehicles between successive trips or trip segments never include charging, whereas stops longer than that are allowed to be assigned to charge (Home, Work, Everywhere). Thus, a brief stop at a gas station or coffee shop during a longer trip will not increase an EV’s modeled state of charge. This reflects the practice some EV drivers express that they plug in opportunistically if the stop is long enough to bother and if a charger is easily accessible [1].

4. Results

4.1. Success or Failure to Complete Trips

The EV model operates by “running” modeled electric vehicles, with differing battery size and charging power, through the trip inventory (333 gasoline vehicles over a year). The battery state of charge of each vehicle is modeled: rising when the vehicle stops where charging is available, falling as the vehicle covers distance. A count of failure to match travel needs is incremented whenever the battery drops to empty during a trip. Trip failures are quantified in two ways: the success fraction is 100% minus trip failure percentage, or days with a trip failure are “adaptation days”.
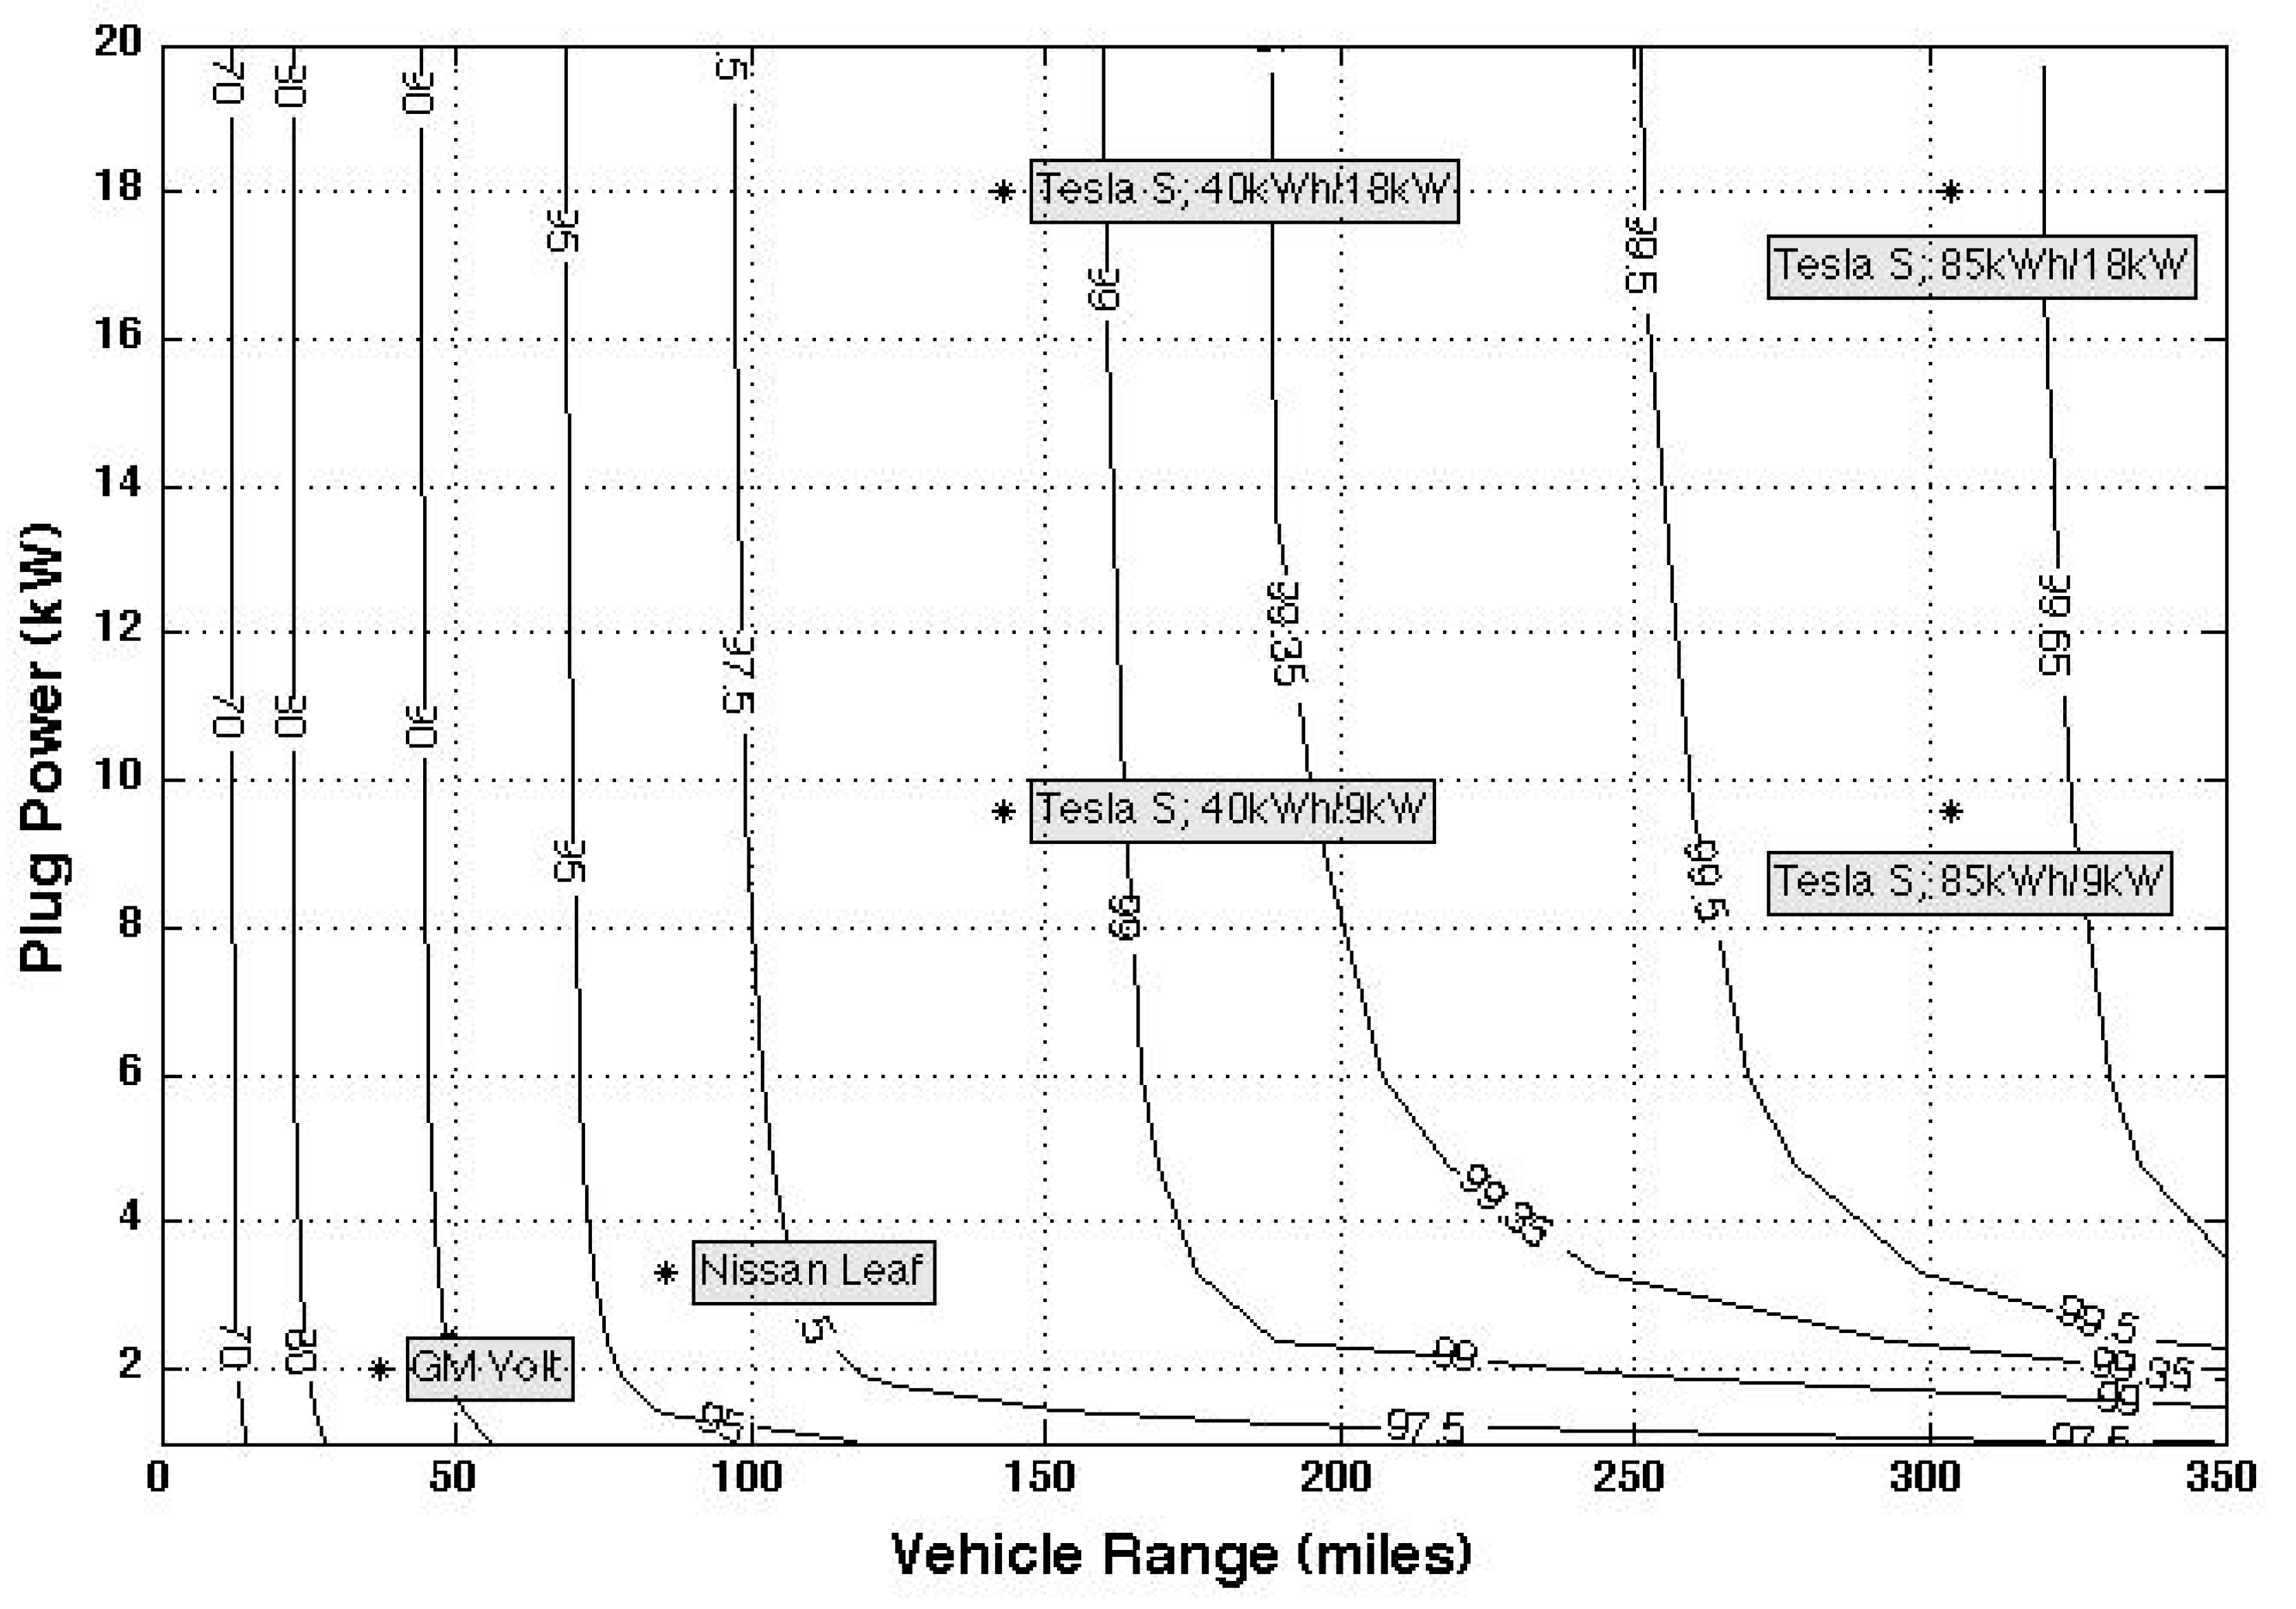
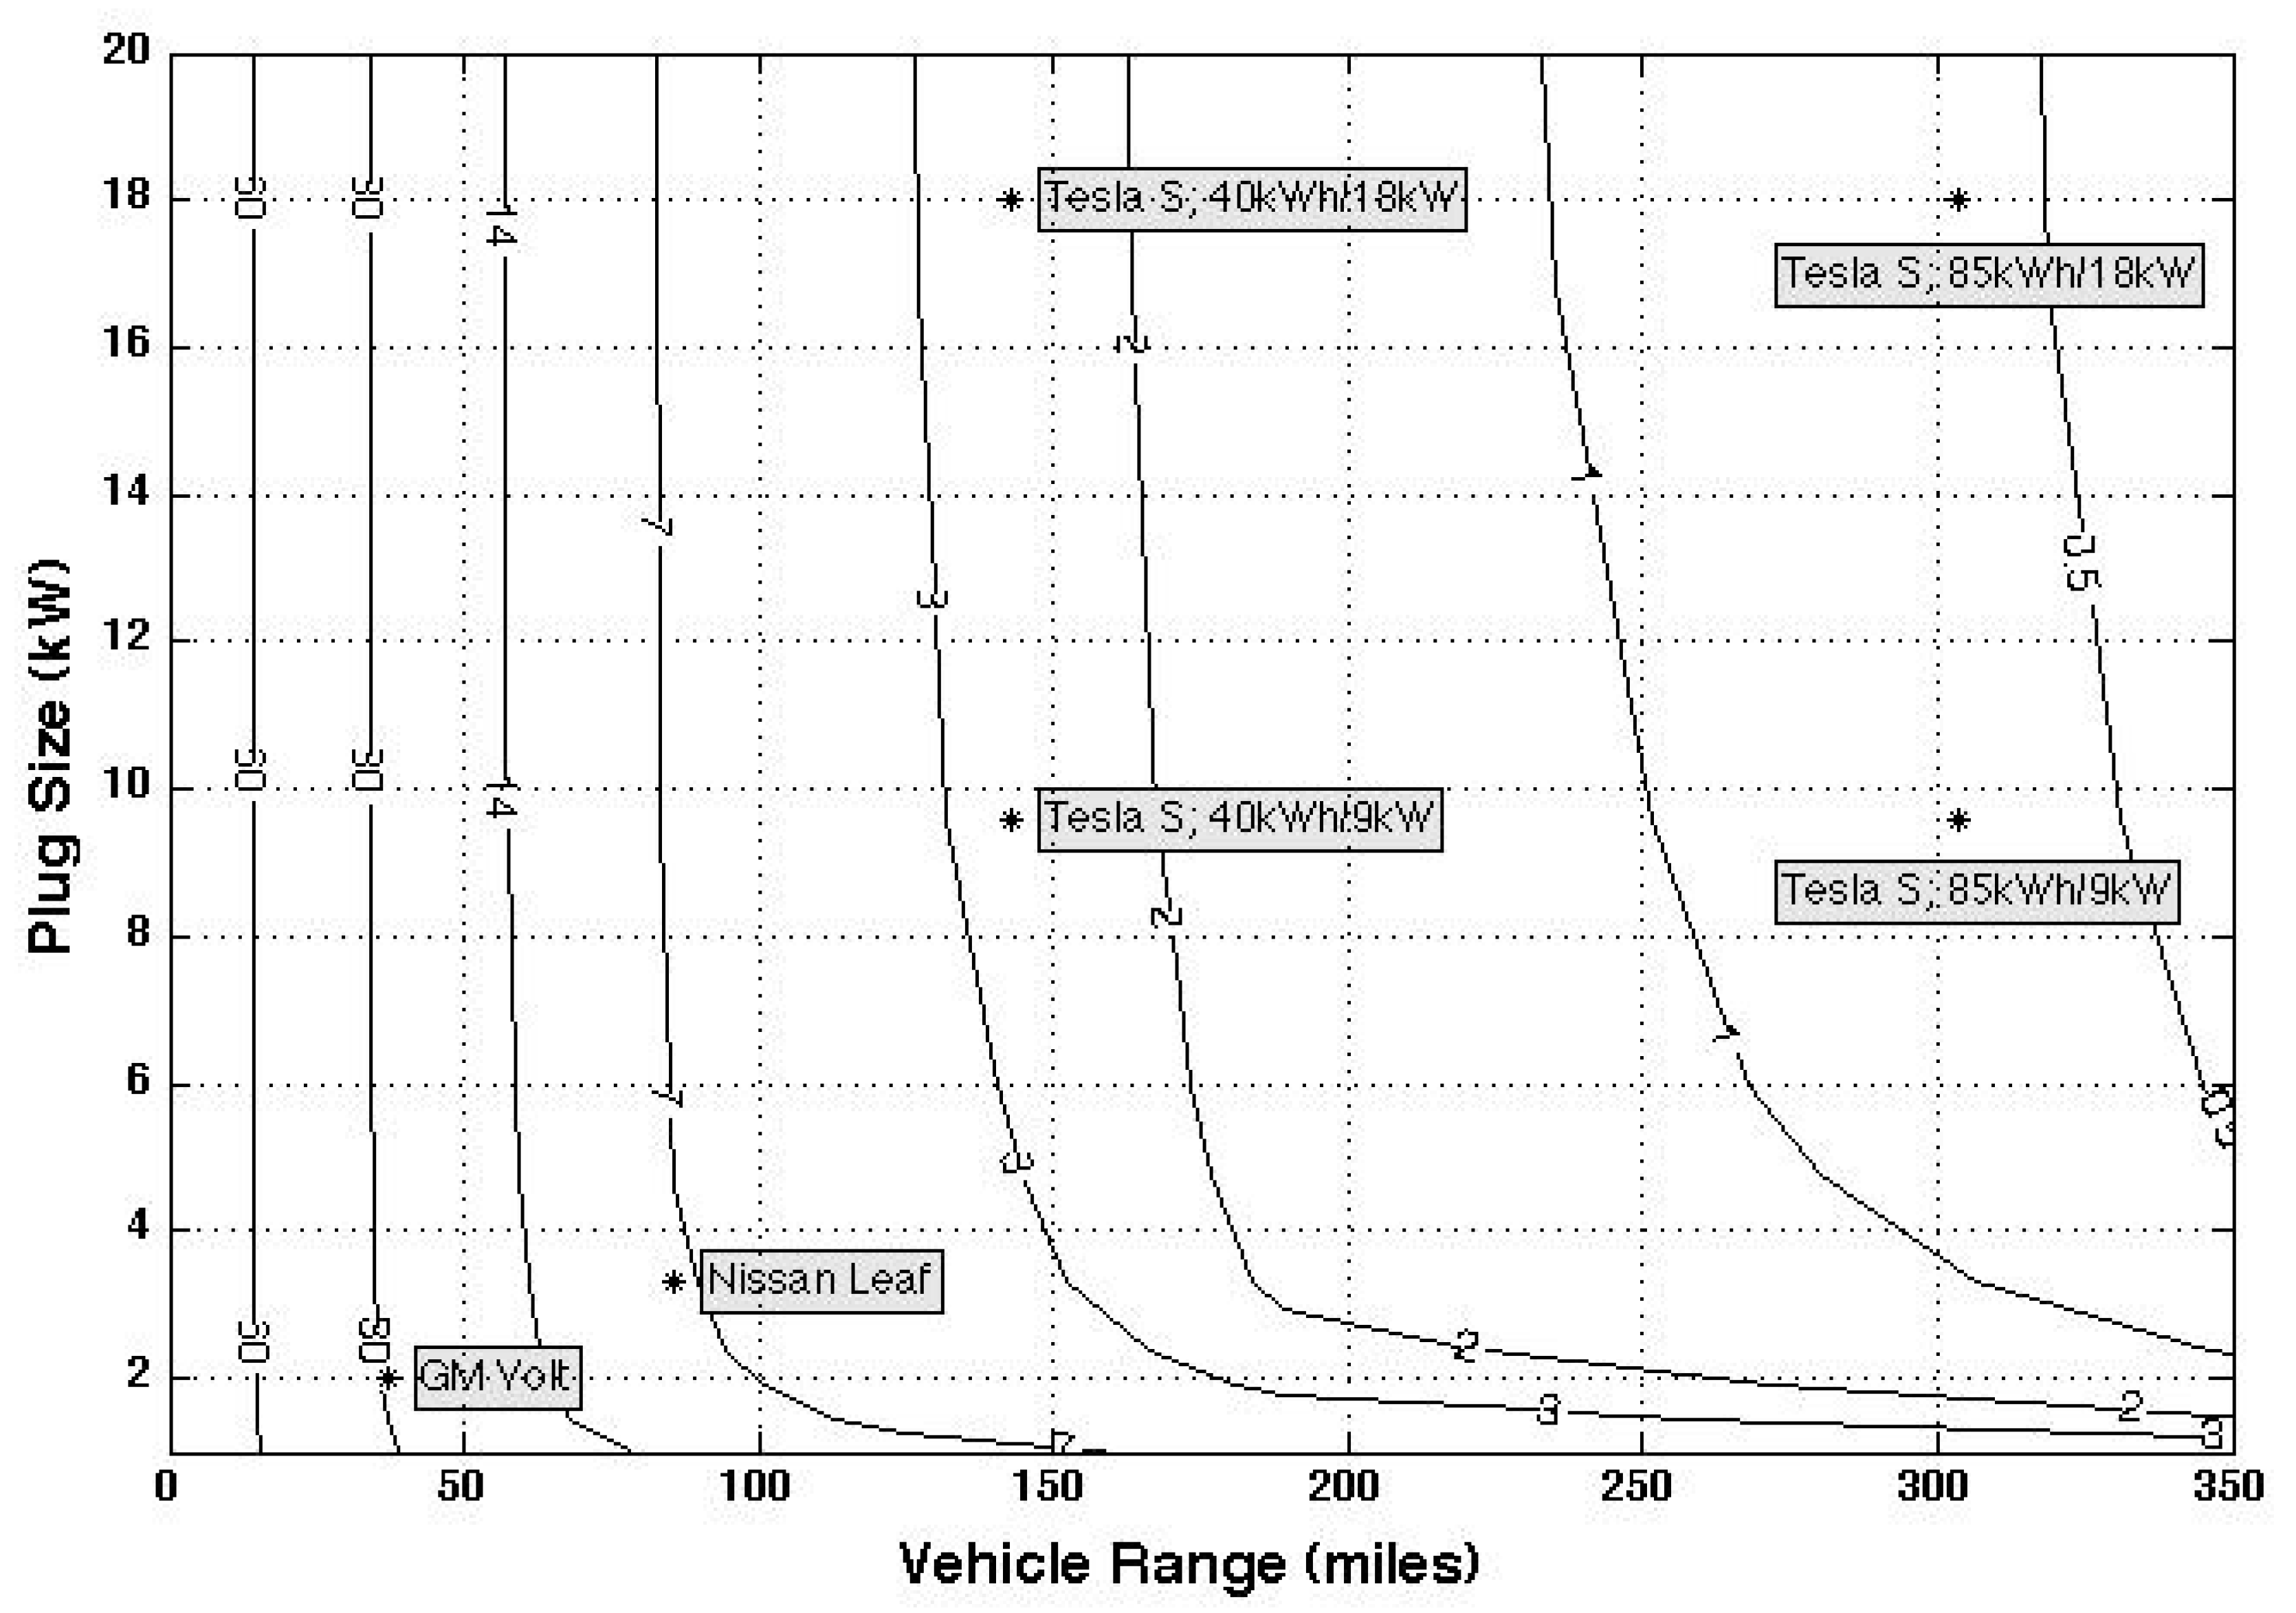
As an example, the success fraction for EVs charging at Home only is plotted in Figure 3. This is the count of trip failures, normalized by each vehicle’s total number of trips. For the overall adaptation count in Figure 3, each vehicle’s fraction of successful trips was averaged across the fleet. The modeled EVs’ range is on the X-axis, and the plug power is on the Y-axis. The surface of all possible EVs is depicted by contour lines, with the number on each contour being the percentage of successful trips. While plug power up to 100 kW was modeled, only those up to 20 kW are displayed in the first several figures. Twenty kW roughly corresponds to the limits of the most common AC charging connectors: the U.S. Society of Automotive Engineers (SAE) standard J-1772, in the U.S. and Japan (up to 19.2 kW at 240 V), or the most common three-phase European plug, the IEC 62196-2 “type 2” (yielding 22 kW at 32 Amp or 11 kW at 16 Amp). Above 20 kW, Figure 3 shows that plug size has very little effect on failure rate—as seen by the near vertical success contour lines at the top of the range (thus the graph’s top is cropped in the figure). This is presumably because Figure 3 is calculated for Home charging only, a situation where a full charge can typically be reached overnight for all but the slowest plug power connections and largest batteries. Plug power is more important when charging time is shorter and/or for batteries that store more energy.
To help interpret Figure 3, several plug-in vehicles from Table 2 have been marked with an asterisk and labeled on the figure. For example, the original 2011 Nissan Leaf is at the graph location corresponding to its 24 kWh battery, per Equation (1a), its 85-mile range (on the X-axis), and the car’s internal 3.3 kW charger (on the Y-axis). With Home charging only, that vehicle lies between the 95% and the 97.5% success contour lines. In other words, this EV, charged only at home, would successfully complete about 96% of the trips in the trip inventory. By contrast, the asterisk locating a Tesla Model S with an 85 kWh battery (calculated 303-mile range) and a 9 kW Home charger shows that it would successfully complete between 99.5% and 99.65% of the trip inventory even if charged only at Home. Note that the original Chevy Volt, with only 40 miles of all-electric range, accommodates about 85% of round trips, but being a plug-in hybrid, the 15% “trip failures” mean only that the Volt’s built-in gasoline engine then automatically starts in order to complete the trip (and requires time to refill with gasoline later).
The relationships in Figure 3 are illustrated by following lower and higher success rate contours. Suppose only a modest goal is desired, 80% of trip success, that is, the EV makes 80% of trips, but 20% of the time it relies on things like alternative transportation or added stops to recharge. Figure 3’s 80% contour shows that can be met by a vehicle with only 30 miles range and 2 kW charge power. Above 2 kW (moving up the 80% line), higher charge power has little apparent benefit to this vehicle, since range is its main limitation. By contrast, if the success goal is 99% of all cars’ trips now served by gasoline, following along the 99% contour, two contrasting vehicle configurations can achieve this: either (1) a 19 kW charger with about 160 miles range or (2) a 2 kW charger and a bigger battery with 250 miles range. The cost tradeoff favors the larger 19 kW charger at an incremental cost of roughly USD 250–2000, rather than adding 100 miles of range at an incremental retail cost of USD 6100 (The OEM cost of an EV battery pack in 2021 was USD 157/kWh on a usable-energy basis [28]. Adding 40% (assembly + vehicle weight support upgrades + retail markup), yields a consumer cost of USD 220/kWh. Thus, adding 100 mi at 280 Wh/mi adds about USD 6160 to the cost).
In more general terms, the efficacy of faster charging compared to an enlarged battery can be seen in Figure 3 as the slope, when tracing up each line of equal trip success: the steeper the slope, the greater the benefit of a larger battery; the flatter the slope, the greater the benefit of added charging power.
The surface topography in Figure 3 suggests some further general principles for charging at Home only. If an EV’s goal is only a majority of gasoline trips (e.g., 80%), a small battery is adequate and faster Home charging does not make much difference. On the other hand, to meet a goal of almost all trips, a bigger battery is required. Nevertheless, a high success fraction, say of 99%, can be met by many different combinations of battery size and recharge power—specifically in Figure 3, by every combination of X- and Y-axis values lying along the 99% line.
Another general finding is the non-linearity of trip success. Going from 70% to 80% trip success requires less than 10 miles added battery. But incrementing only ½%, from 99% to 99.5%, requires adding over 100 miles. Disproportionally large increases in battery size and/or charging speed are needed to reach 100% success. This will be examined with regard to more charging locations and adaptations as alternatives to very large batteries in Section 4.3.
The reader should recall that the trip success contour lines in Figure 3 are based on success for the entire 333 vehicle trip inventory, as will a subsequent analysis of needed “adaptation days”. However, these definitions of trip success or the need for adaptation are analogous to designing a car to meet the needs of all drivers. In Section 4.6, we will subdivide the trip inventory of all 333 cars’ driving requirements to identify what EV characteristics are needed to meet the needs of different subsets of drivers, that is, we do a market segmentation.

4.2. Charging Availability and “Trip Chains” from EVSE to EVSE

In the preceding analysis a “trip” was defined as travel from one stopped location to another one. In evaluating the effects of varying charging station availability (EVSEs at Home only, Home and Work, or at all stops), the functional definition of a trip is refined to be travel from a stop with EVSE access to the next. Two trips with no EVSE between them are a “trip chain.” For example, when we model EVSEs at both Home and Work, the trip chains possible are from Home to Work, from Work to Home, and from Home back to Home, in each case ignoring intermediate stops since this model specified that they lack EVSEs and thus have no charging during those stops.
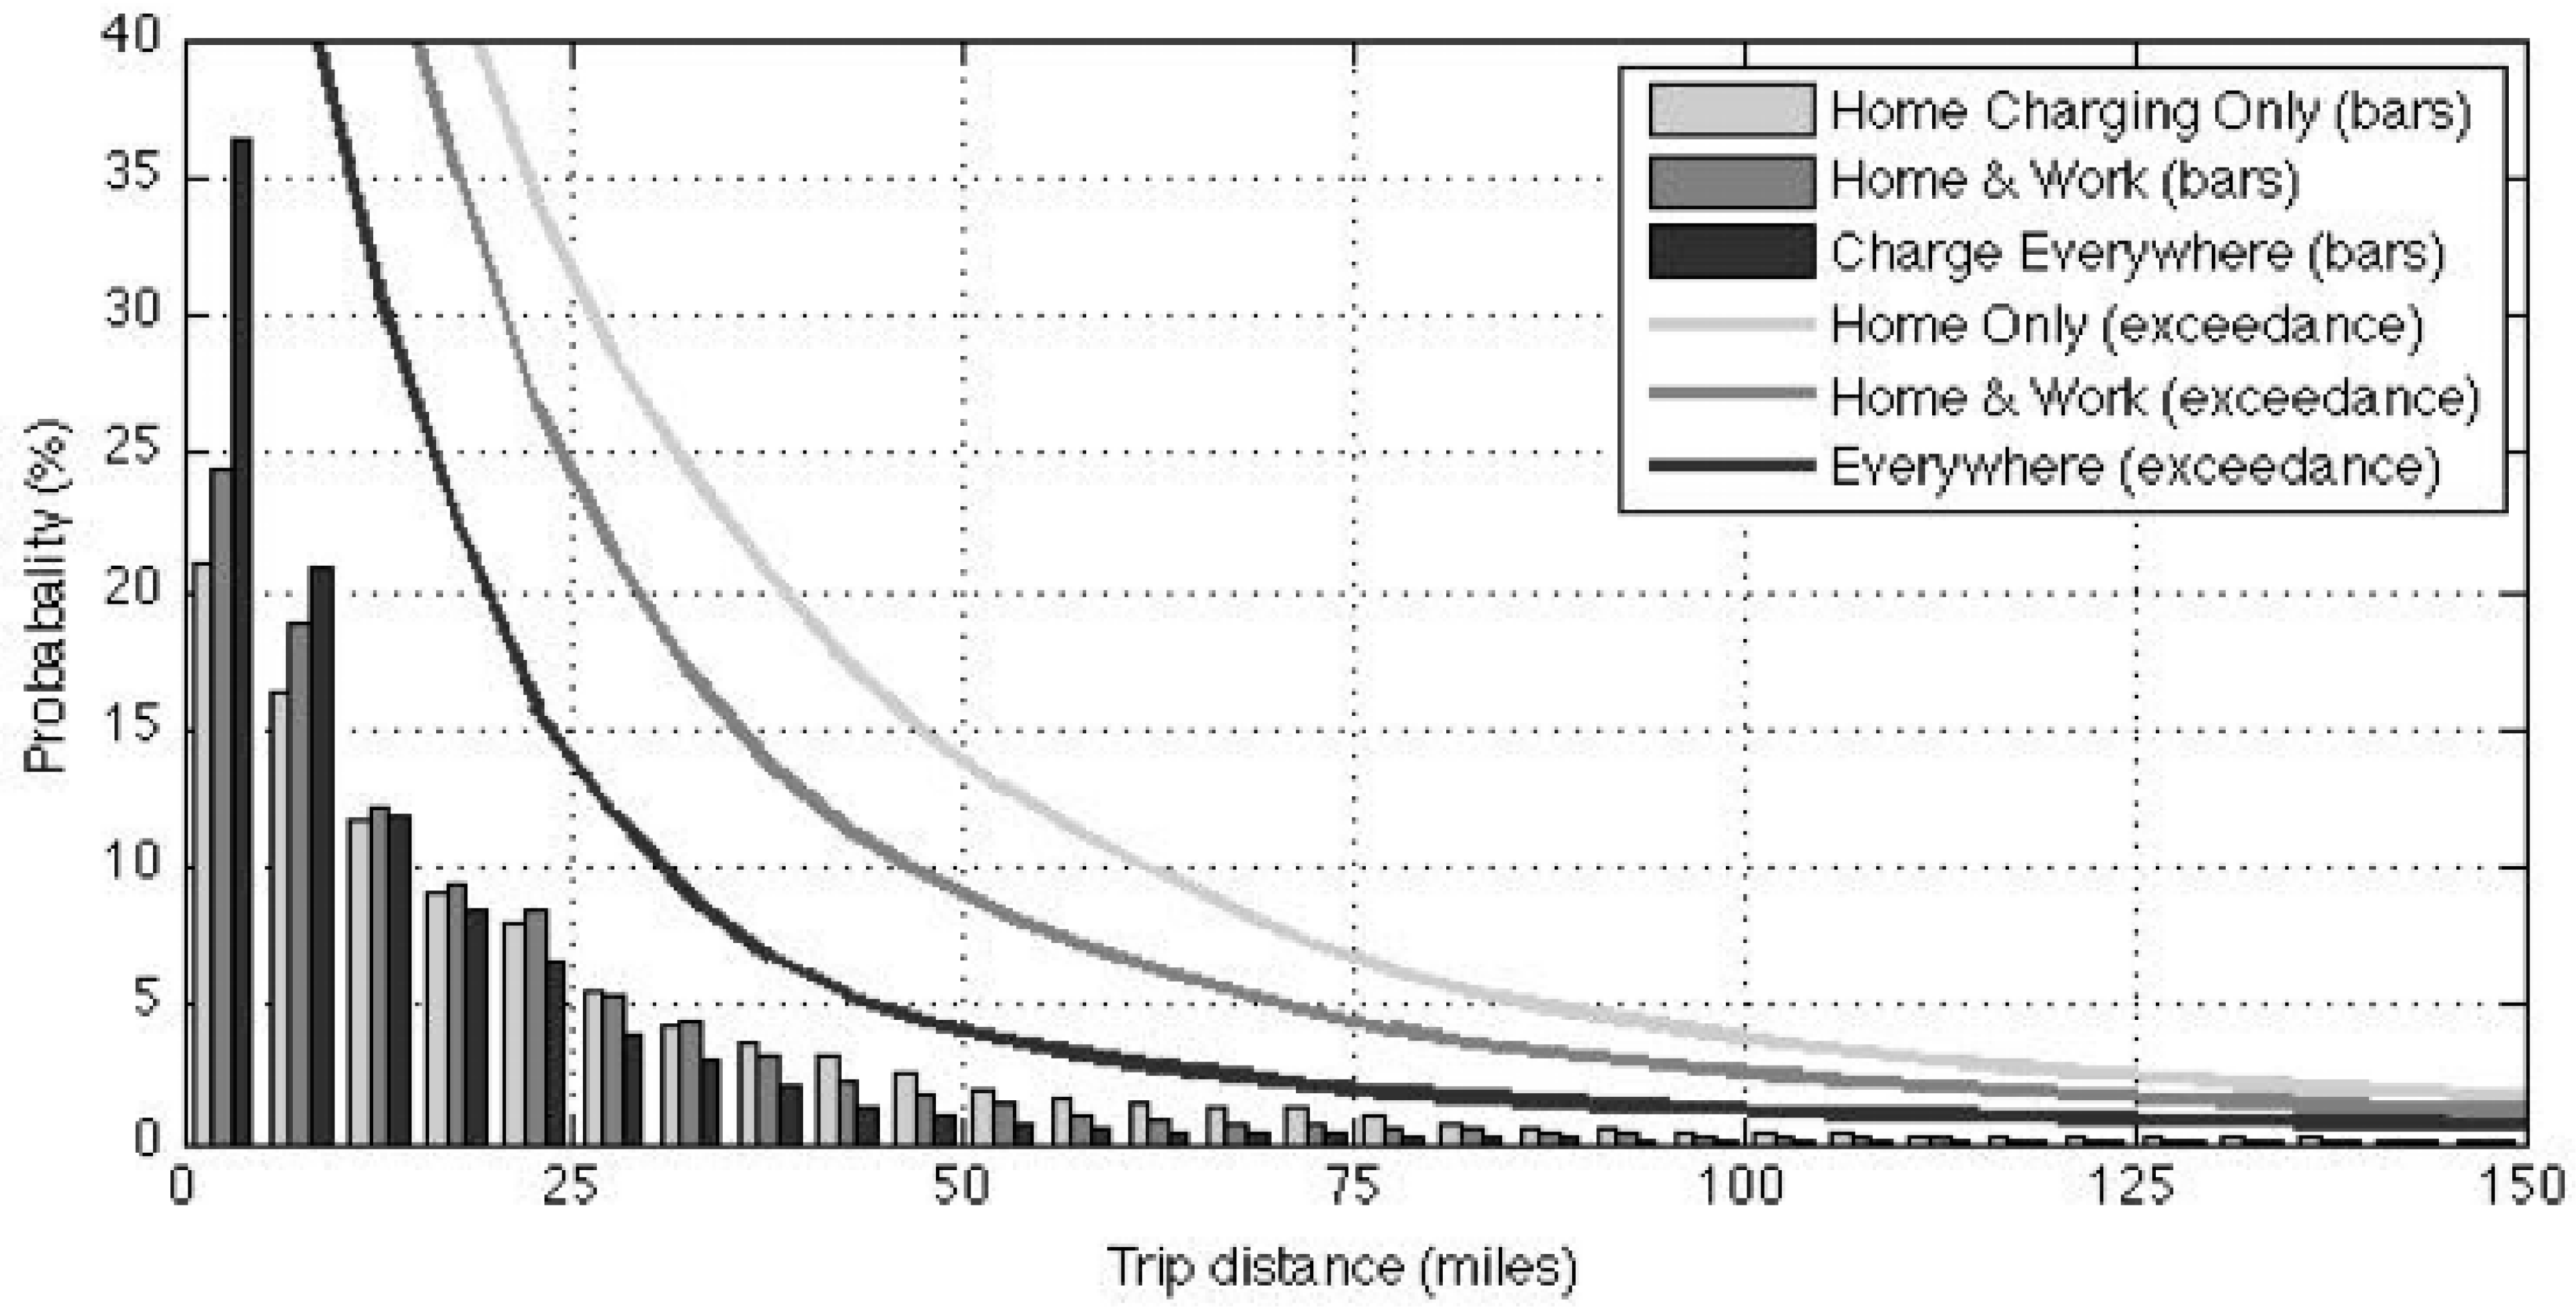
Figure 4 illustrates the distribution of trip chain lengths in the trip inventory, comparing the three modeled charger locations. The bars indicate the percentage of trip distances in 5-mile increments. By definition, when charging at Home only, trip chains are longer, and when charging Everywhere (at all stops), trips are shorter. The three lines in Figure 4 show the exceedance, that is, the percentage of trip chains longer than the given distance on the X-axis. For example, with Home charging only (the lightest line in Figure 4), 14% of trip chains exceed 50 miles. However, if charging is available at every stop, only 4% of trips exceed 50 miles (black line). Looking at the vertical spread of the three exceedance lines, and measuring down from “Home only exceedance”, we see that adding Work charging substantially drops the number of trips (Y-axis) longer than each given distance (X-axis). Then, additionally adding charging Everywhere decreases it about the same amount again. Note that Figure 4 is built only from the data on trips; it does not depend on any modeled EV and chargers.
Distributions of actual trip distances have long tails. Although the X-axis of Figure 4 is truncated to 150 miles, to meet 100% of trips for all 333 cars, an EV must drive over 1000 miles (1610 km) without recharging (per Figures 3 and 4 in [5]). An EV designed to meet slightly less than 100% of trips, or a driver adapting their vehicle behavior a few times per year, can significantly reduce the vehicle’s range requirement. We will quantify this subsequently. Of course, gasoline vehicles cannot drive 1000 miles without stopping either; they “adapt” by refueling, not reflected as stops in our trip inventory since gasoline filling is shorter than ½ h.

4.3. Metric for Adjusting to Limited Range and “Adaptation Days” per Year

Because the locations of available EVSEs affect the length and count of trip chains, we must define a metric insensitive to different EVSE deployments. Rather than a percentage (trip successes over the total trips each vehicle takes), the next metric is the number of days per year on which alternative travel arrangements would be necessary. This metric corresponds to what Pearre et al. [5] refer to as “adaptation days,” giving example adaptations including
(1)
substituting another vehicle (e.g., swap for a gasoline vehicle in the household or rent one);
(2)
making an additional or longer stop to recharge during the day or en route;
(3)
delaying some travel (e.g., instead of three side errands after work today, only do two today and the third tomorrow); or
(4)
choosing a different mode of transport (commuter rail, bus, air, etc.).
Of the above adaptations, the current article explicitly models and quantifies adaptations (1) and (2). It also analyzes the use of existing stops in the trip inventory as charging opportunities when stopped for other purposes and quantifies the resulting improvement in trip success.
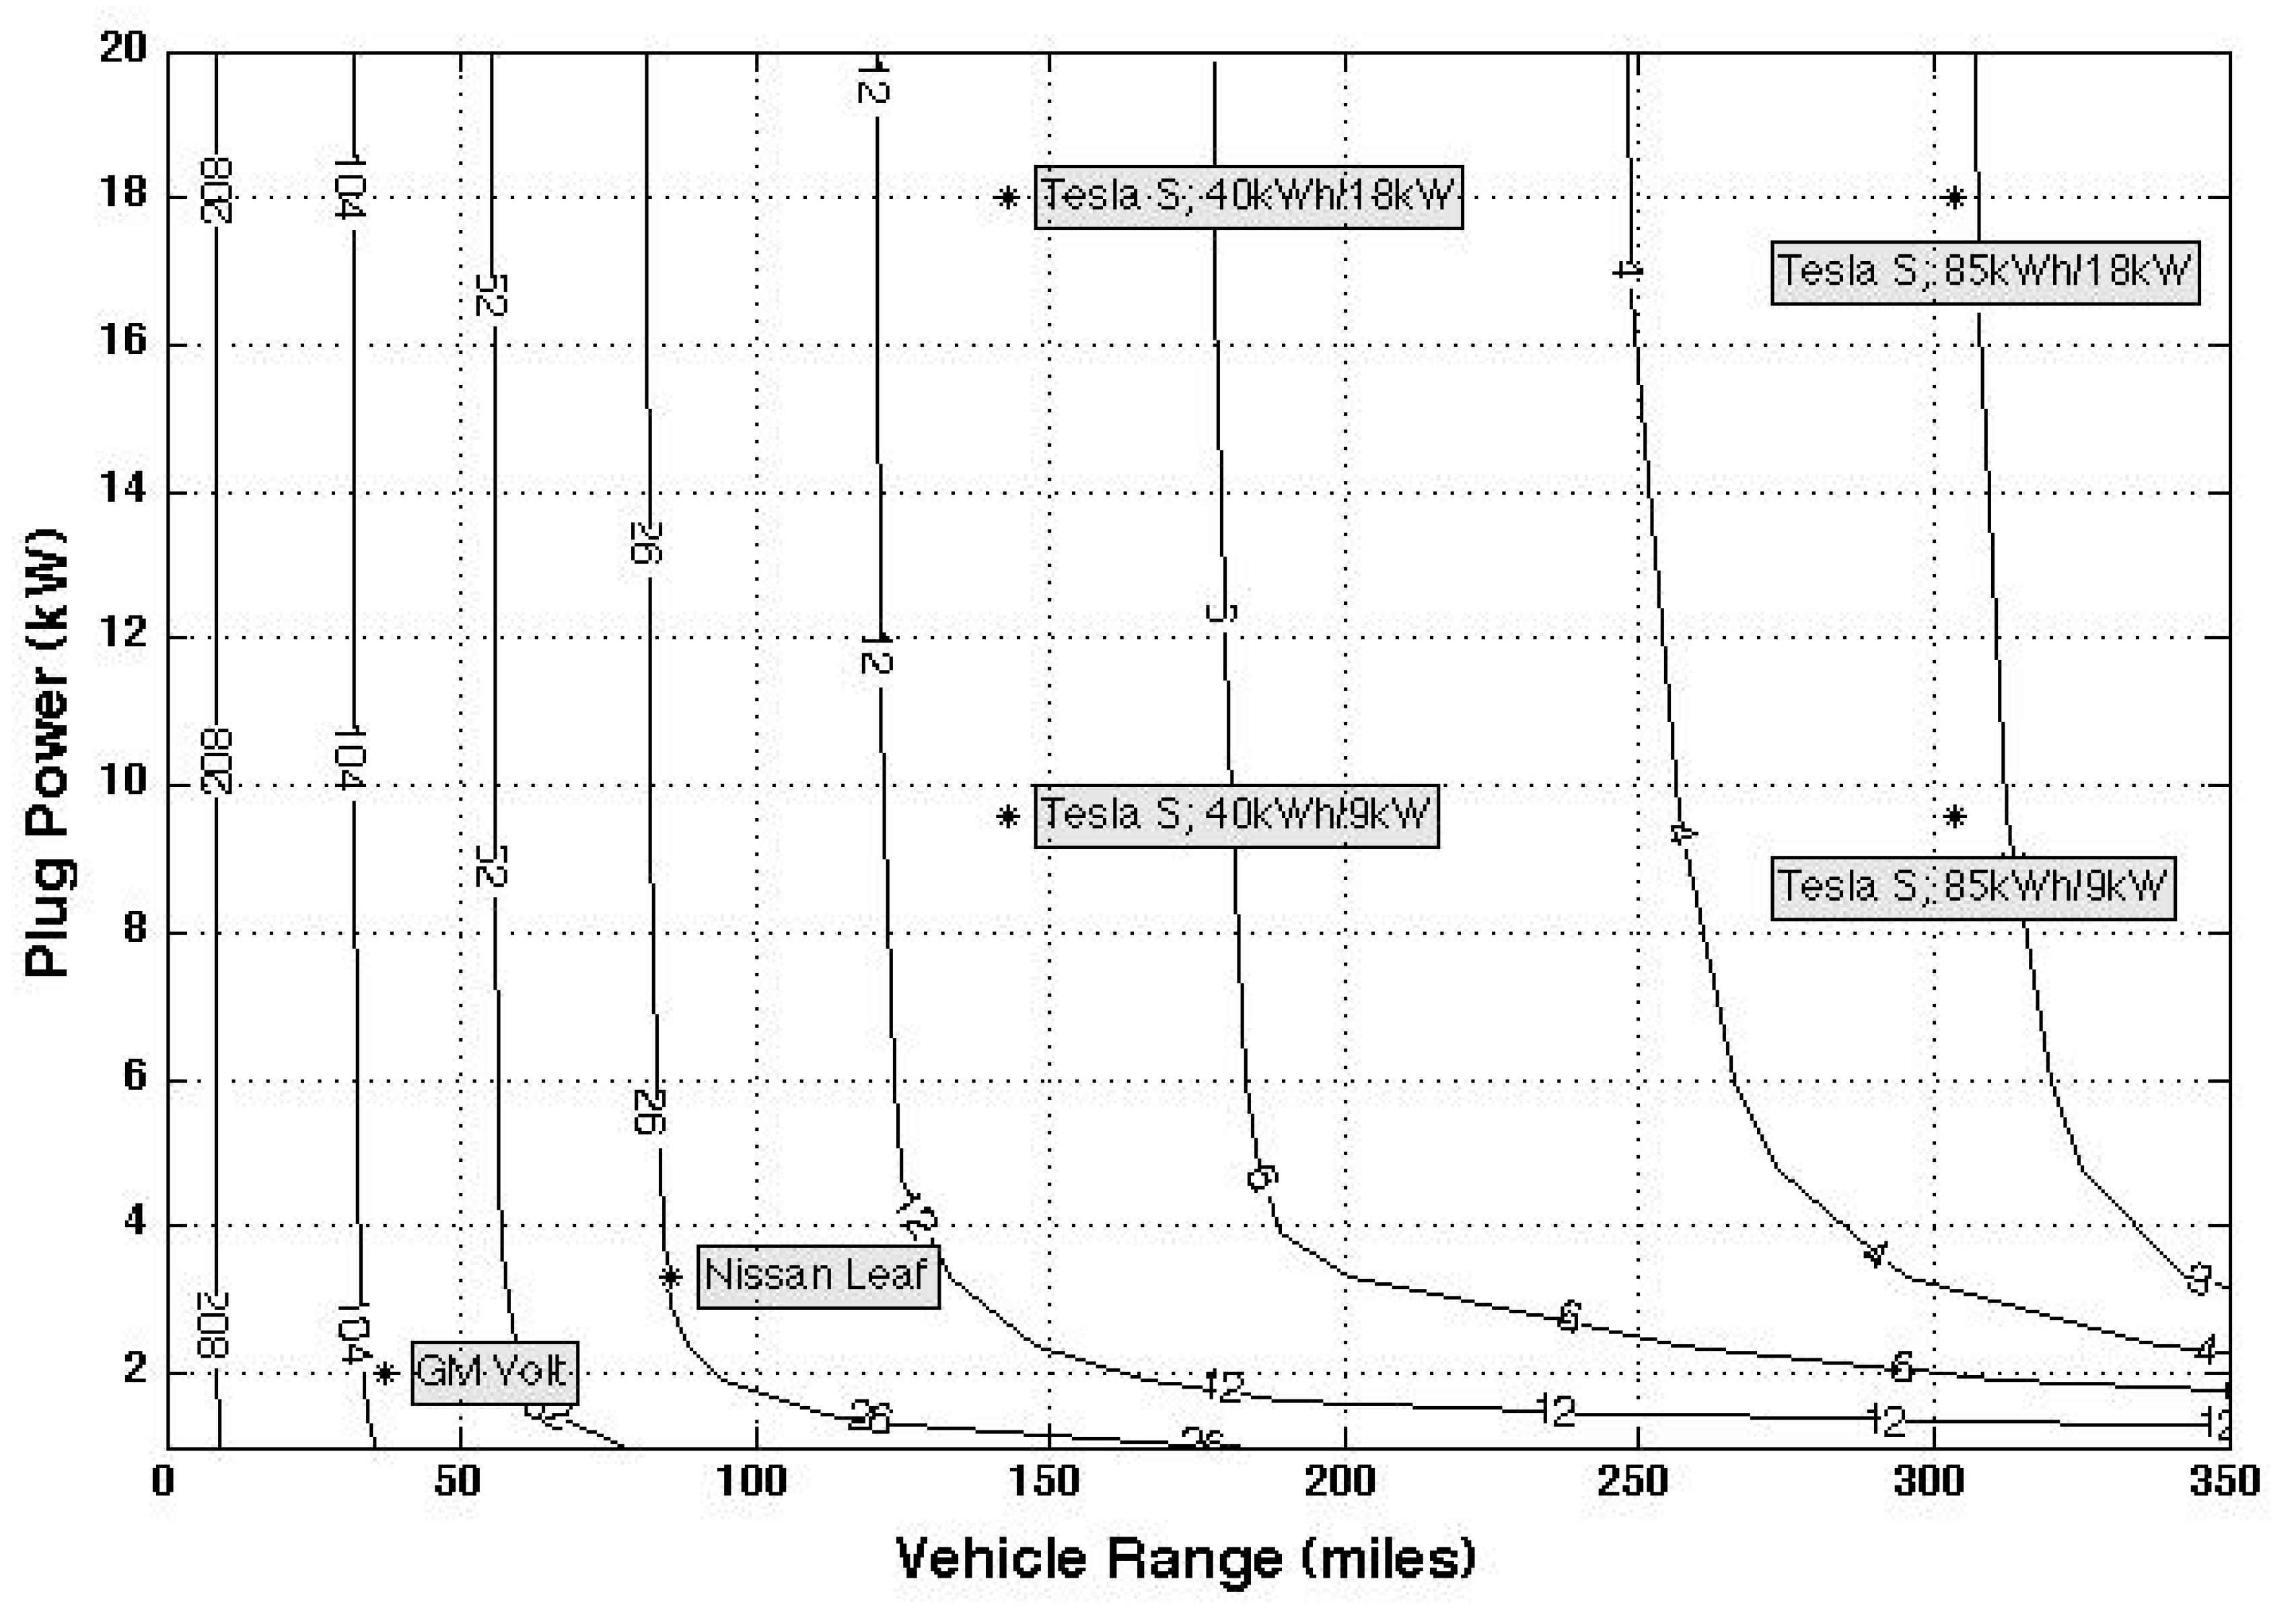
The “adaptation days” metric quantifies potential driver inconvenience, valid to compare across changes in other variables such as charging locations. The prior Figure 3 results measured in success fraction of Home charging only are presented in Figure 5 using this measure of adaptation days.
Again, the axes are vehicle range and charging power, thus each point on the space represents an EV of given range and charging power. Figure 5 shows, for example, that the original Nissan Leaf, with 86 miles of range and a 3 kW charge power, would require driver adaptation 26 times a year, or every other week. As another illustrative example, the GM Volt would need either its built-in gasoline range extender, or some other adaptation, about 100 times a year (about twice a week). In contrast, an 85 kWh Tesla Model S would require adaptations slightly over 3 days a year. All these Figure 5 adaptation counts are based on charging only at Home.
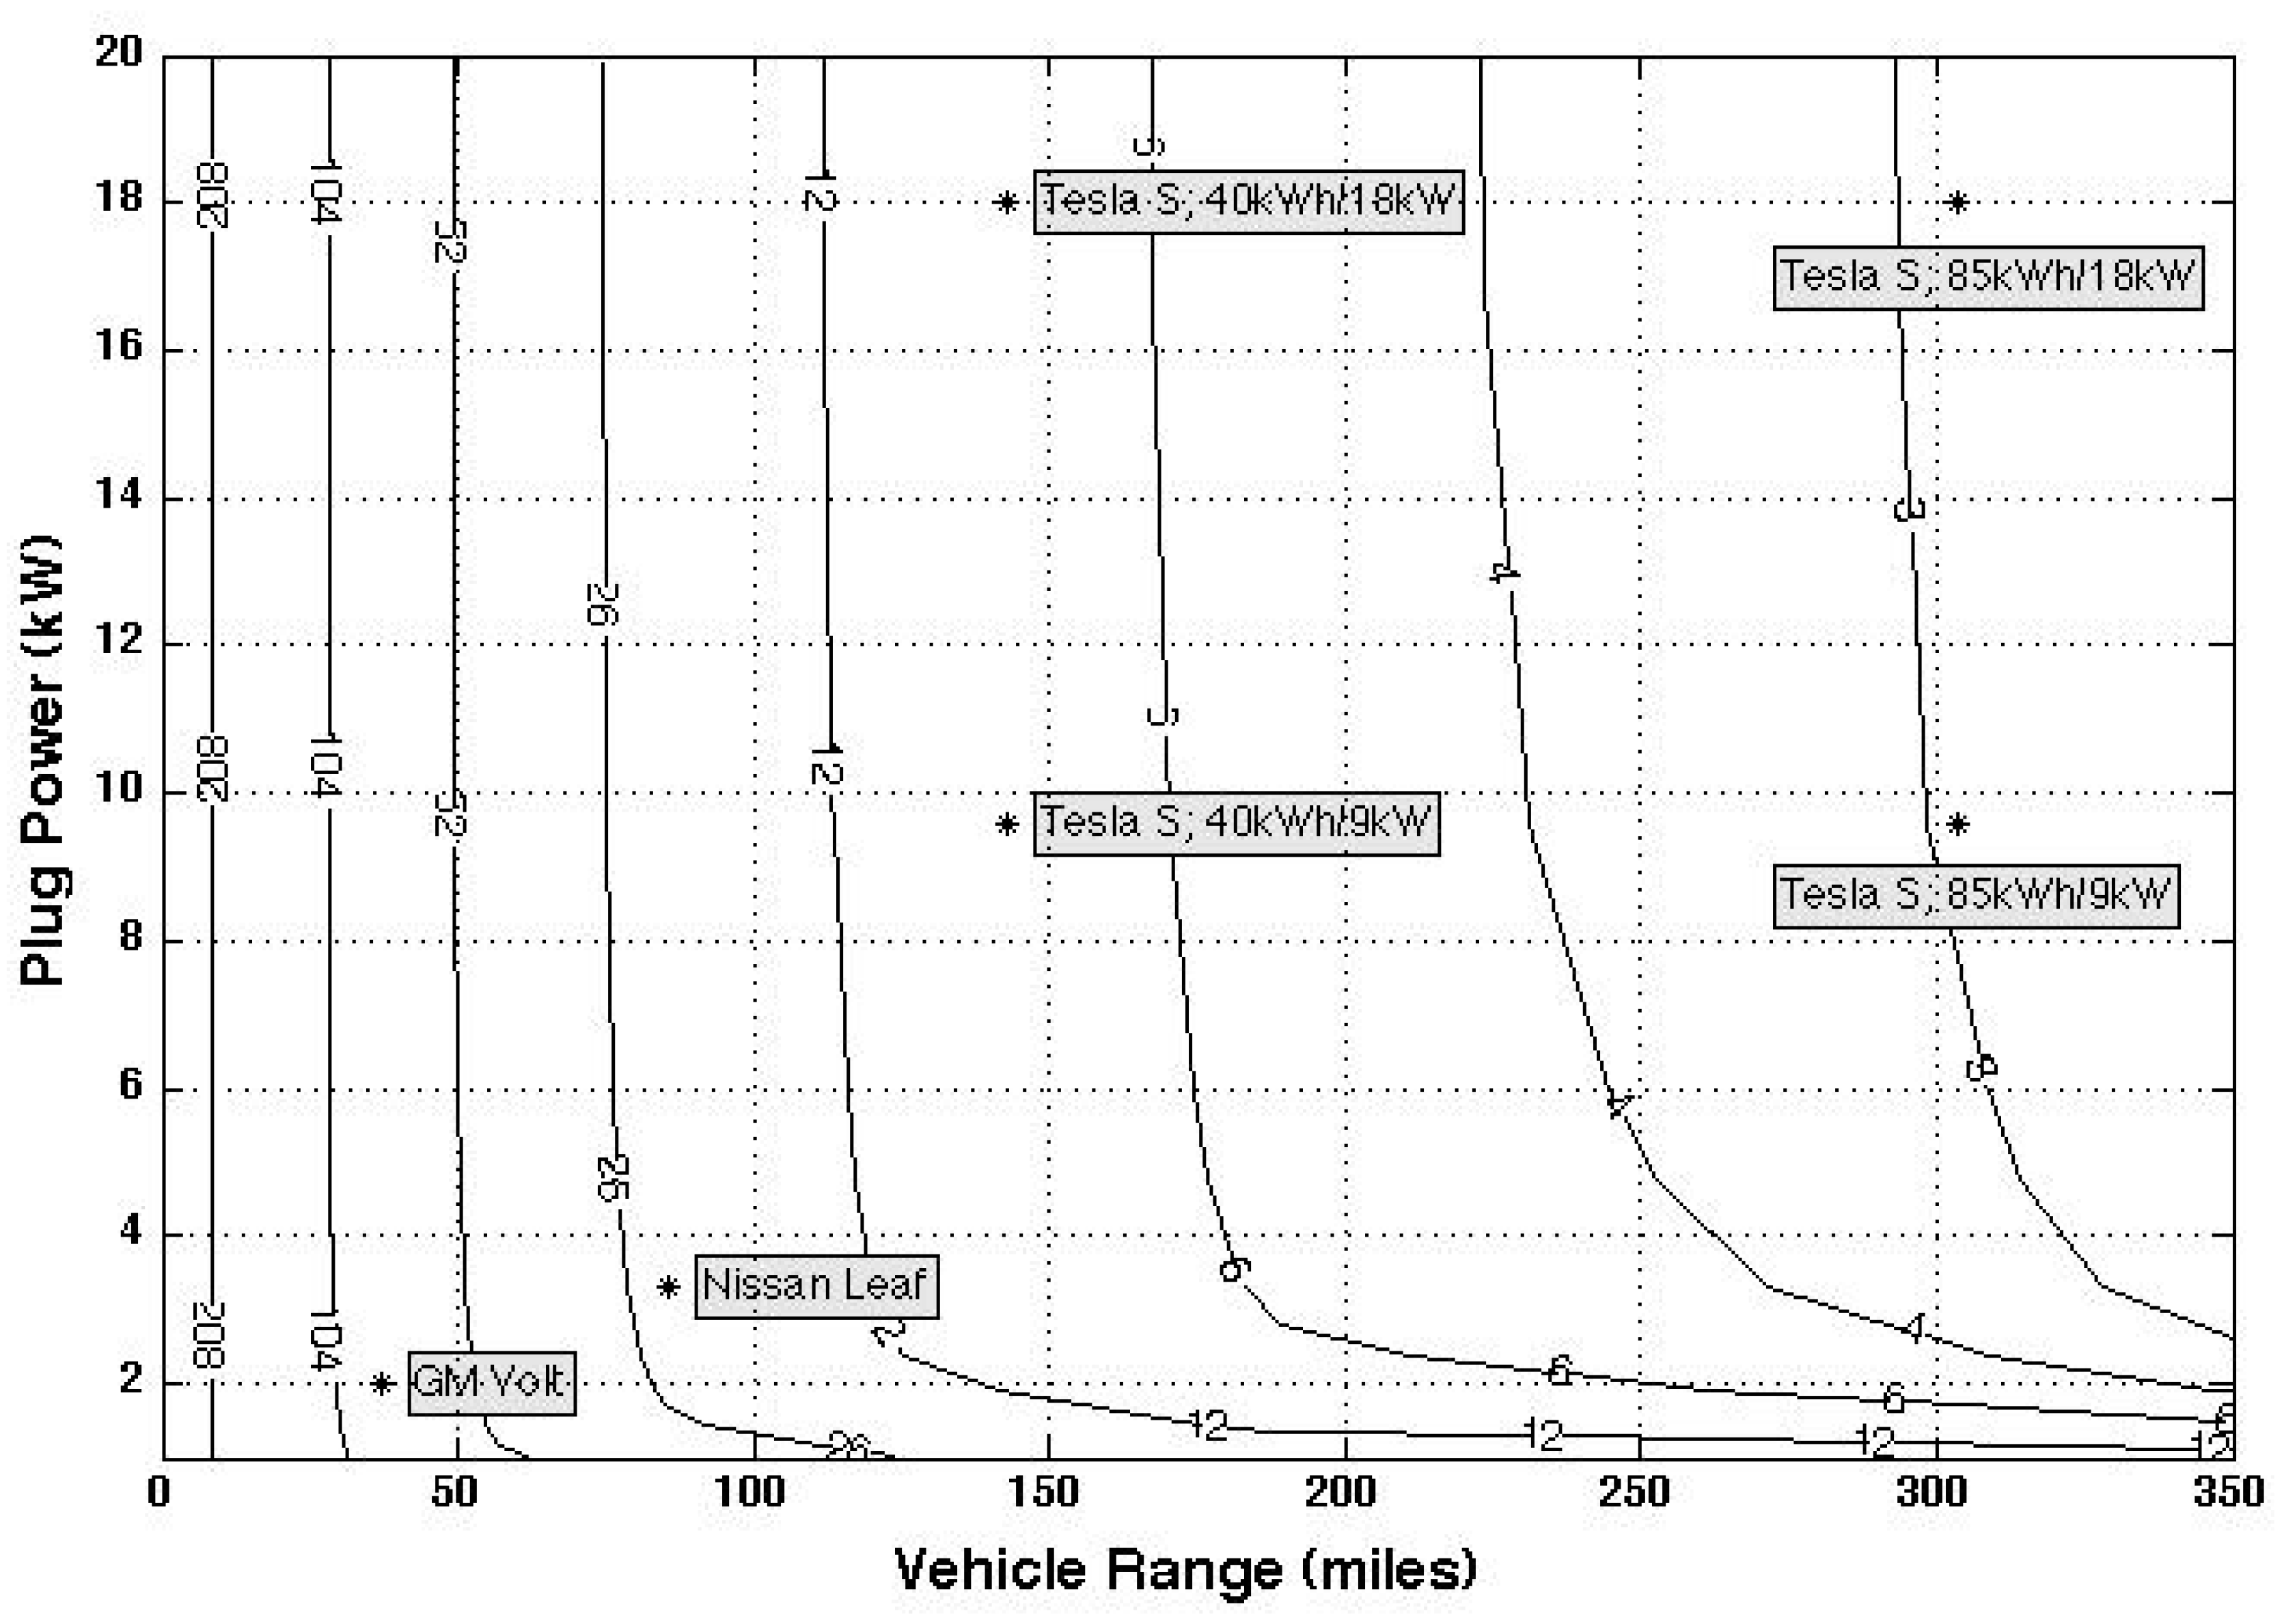
Figure 6 shows that if EVSEs are available at Work locations as well as Home, fewer adaptations are needed. This is seen by the lower numbers of adaptation days for the six example vehicles shown in both figures. It is also seen by the leftward and downward movement of the adaptation day contour lines in Figure 6 compared to Figure 5.
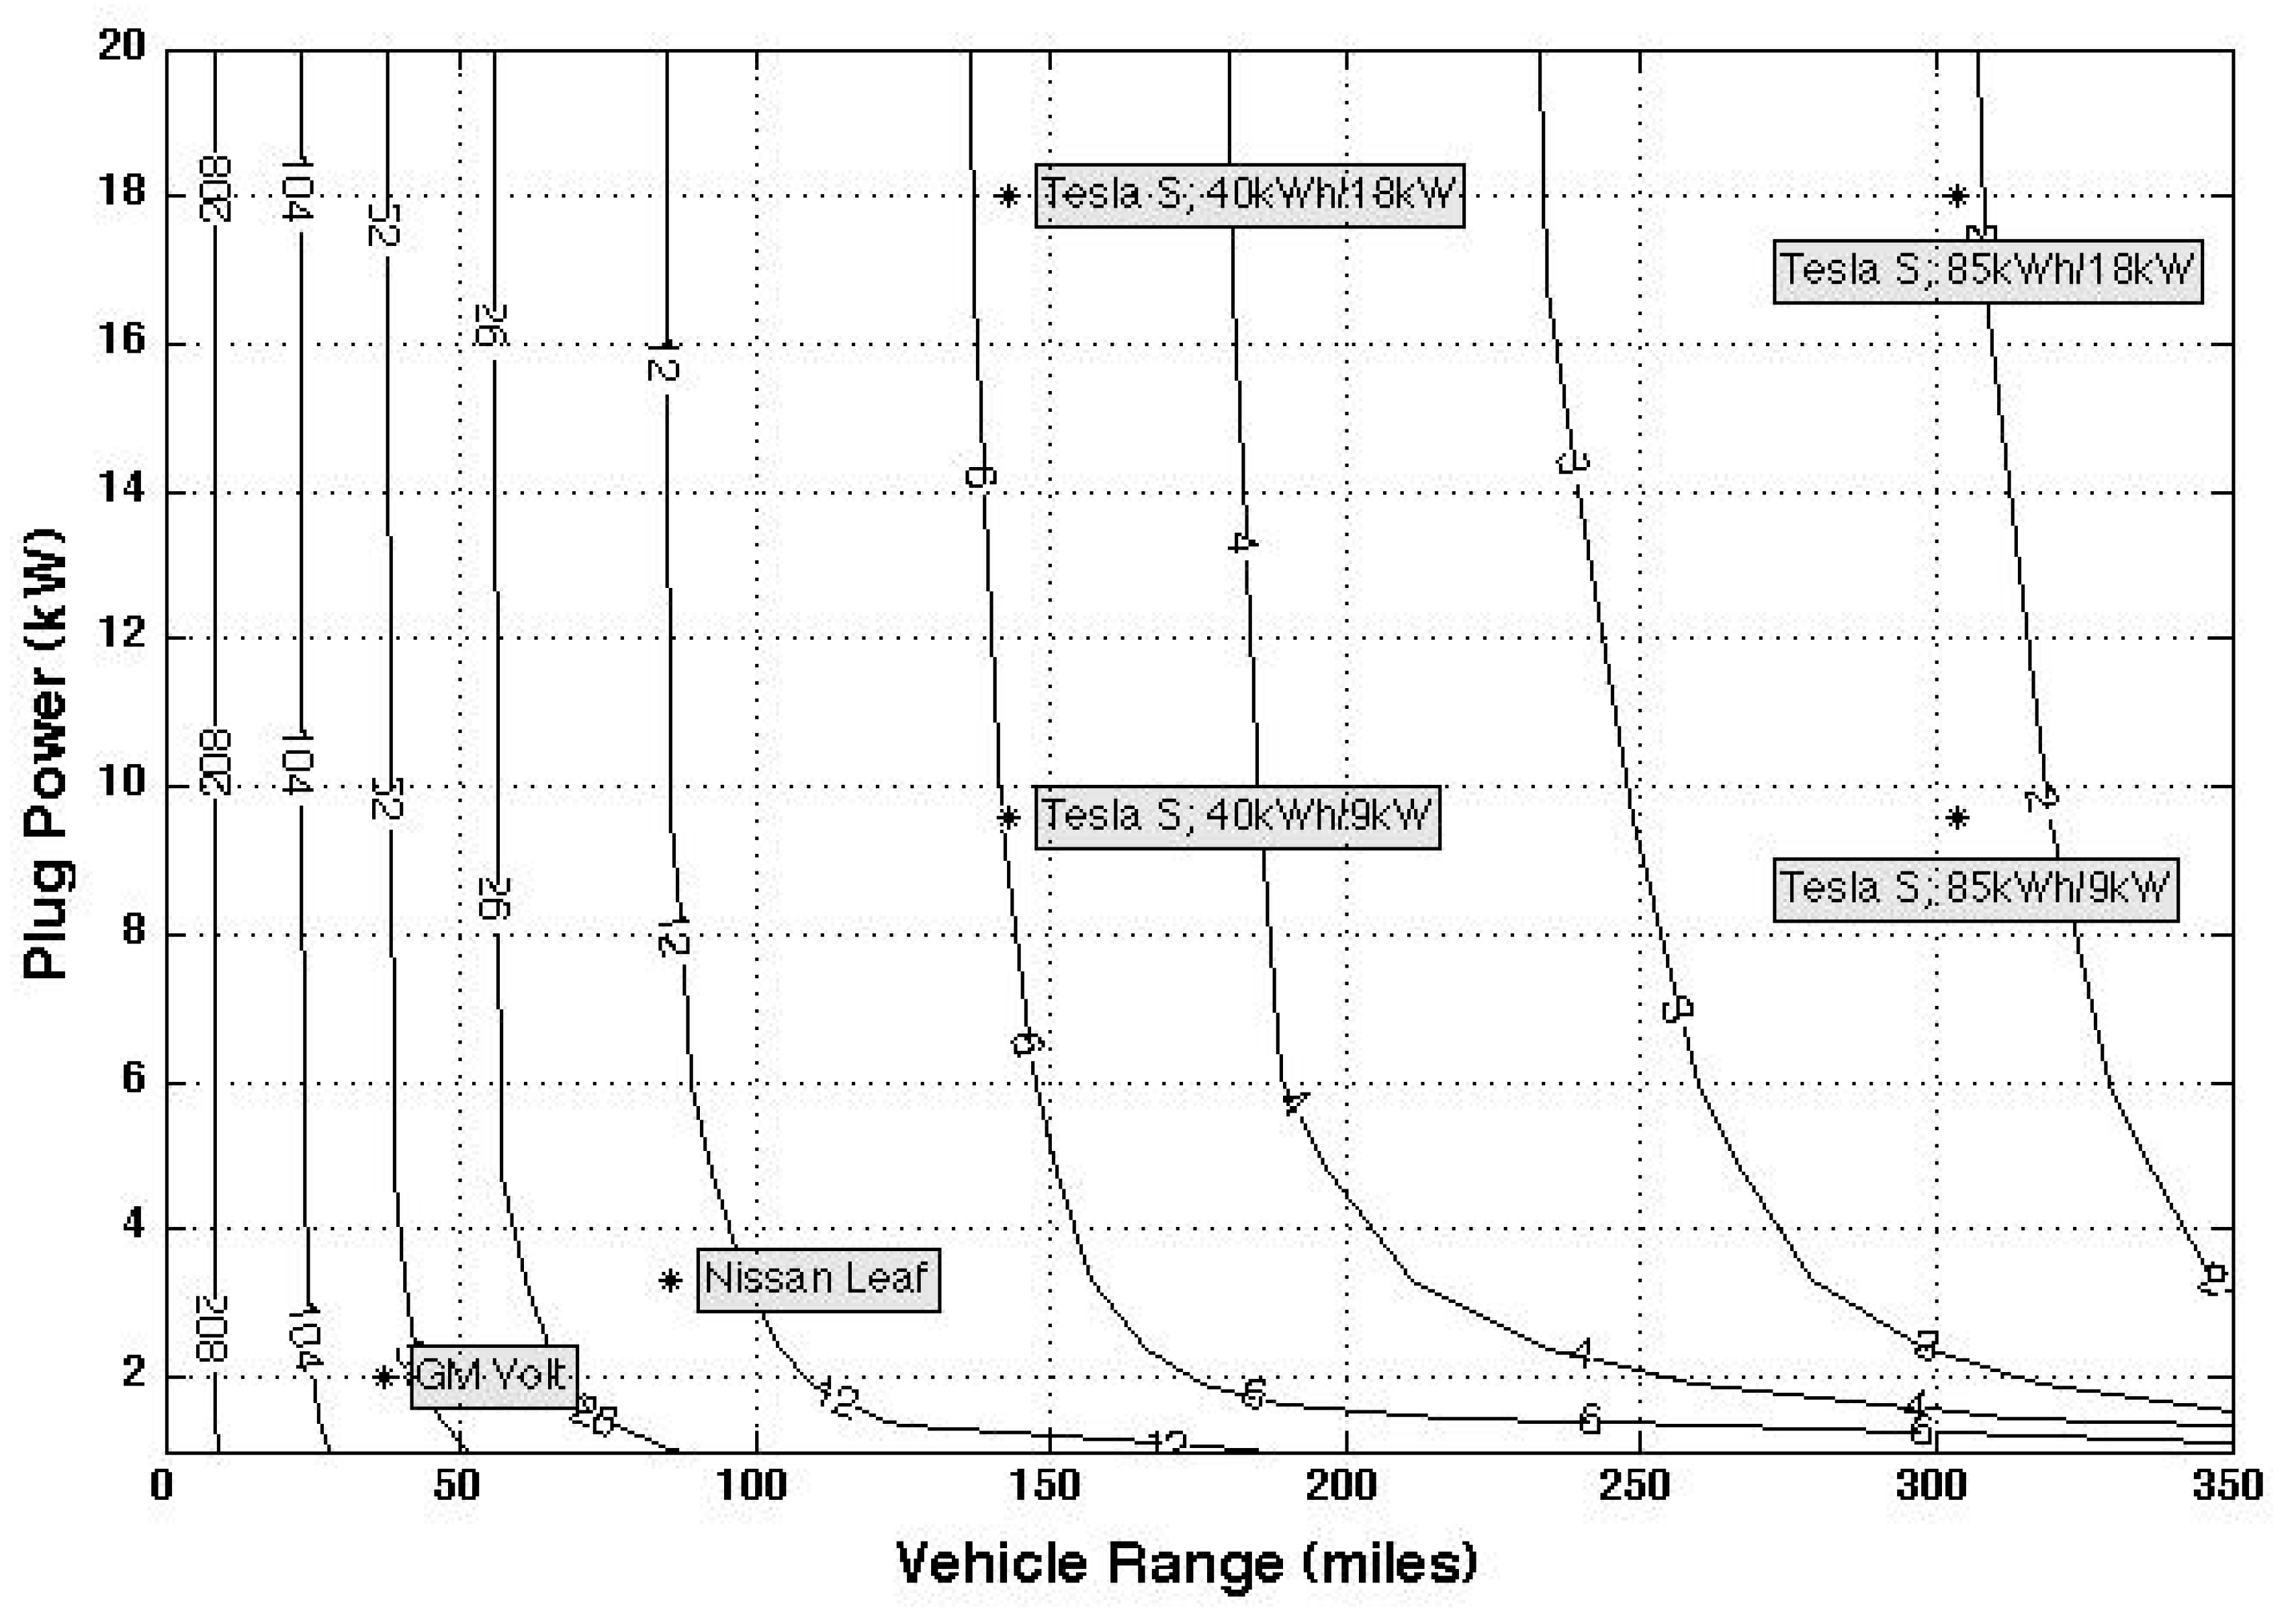
If we allow the modeled EVs to charge Everywhere, that is during all stops longer than ½ h, the adaptations required are in Figure 7.
Figure 7 indicates that for EVs with any levels of range and plug power, charging at all stops produces another reduction in adaptation days. We can compare the effect of more AC charging at stops on a less capable EV, the original 2011 Nissan Leaf, versus the 85 kWh Tesla Model S. For the Nissan Leaf, going from charging only at Home to charging Everywhere reduced adaptations from 26 to just over 12 per year (compare Figure 5 versus Figure 7). Note this substantial increase in functionality is achieved simply by increasing availability of low-cost, low-power AC charging stations at stops that the car is making anyway. A smaller improvement is realized for the fast charging (18 kW) 85 kWh Tesla S, which goes from just over three to just over two adaptations per year. That is, having more AC chargers in community locations to charge where drivers stop anyway provides a large improvement to a small-battery vehicle, while providing a much smaller improvement to a more expensive large-battery vehicle. We’ll return to this finding in the discussion.
Intuitively, two adaptations per year seems a small inconvenience (depending on the form of adaptation), whereas 12 and certainly 50 adaptations per year seems unacceptable. To quantify the comparison of adaptation counts, we can compare the range adaptation counts in Figure 5, Figure 6 and Figure 7 with other forms of adaptation. For example, any vehicle (gasoline or electric) requires a form of “adaptation” in that it must be occasionally taken in for regular maintenance or repairs. Service visits (excluding collisions) average 1.67 times per year [29]. In addition, gasoline vehicles require 50 trips to the gas station and fuel refills per year (calculated in the next section). The reader can consider the inconvenience of various EV range adaptations versus the inconvenience of going to a station to refuel and of taking the vehicle in for service; here, we offer them as quantitative benchmarks to compare with our adaptation day counts.

4.4. En Route Charging Time Required to Complete All Trips

Our EV model and trip inventory can also be used to calculate the kWh shortfall on long trips. In this section, rather than simply counting each day’s unsuccessful trip(s) as one additional “adaptation day”, here we calculate the kWh shortfall for each of those unsuccessful trips. From the kWh shortfall and the charging power in kW, we then calculate the precise time required to recharge the vehicle via an added stop en route and complete each of those trips. That is, here we quantitatively characterize the adaptation of charging en route as an addition to travel time not required by the gasoline cars in our trip data.
Fast en route EV charging is similar to gasoline refueling; that is, when more onboard energy is needed, the trip is interrupted, and one drives to specific locations to refill with energy. For this analysis, we deviate from this article’s previously discussed charging behavior, all of which assumed that charging only occurs when the driver is stopped for other reasons (Home, Work, etc.). In this section, we assume that en route stations are available along travel corridors (as many countries are installing), and those stations are used by the model only when a trip drains the battery before reaching the next stop with a charging station. Thus, the en route recharge is the only adaptation needed, and it adds to the time required for the trip rather than being counted as a trip failure (More precisely, for each vehicle, it is the additional amount of energy needed to complete any trips that emptied the battery, summed through the year. Dividing energy shortfall per year by the model’s fast-charger power produces a duration, in hours per year, spent at en route charging stations to complete all trips).
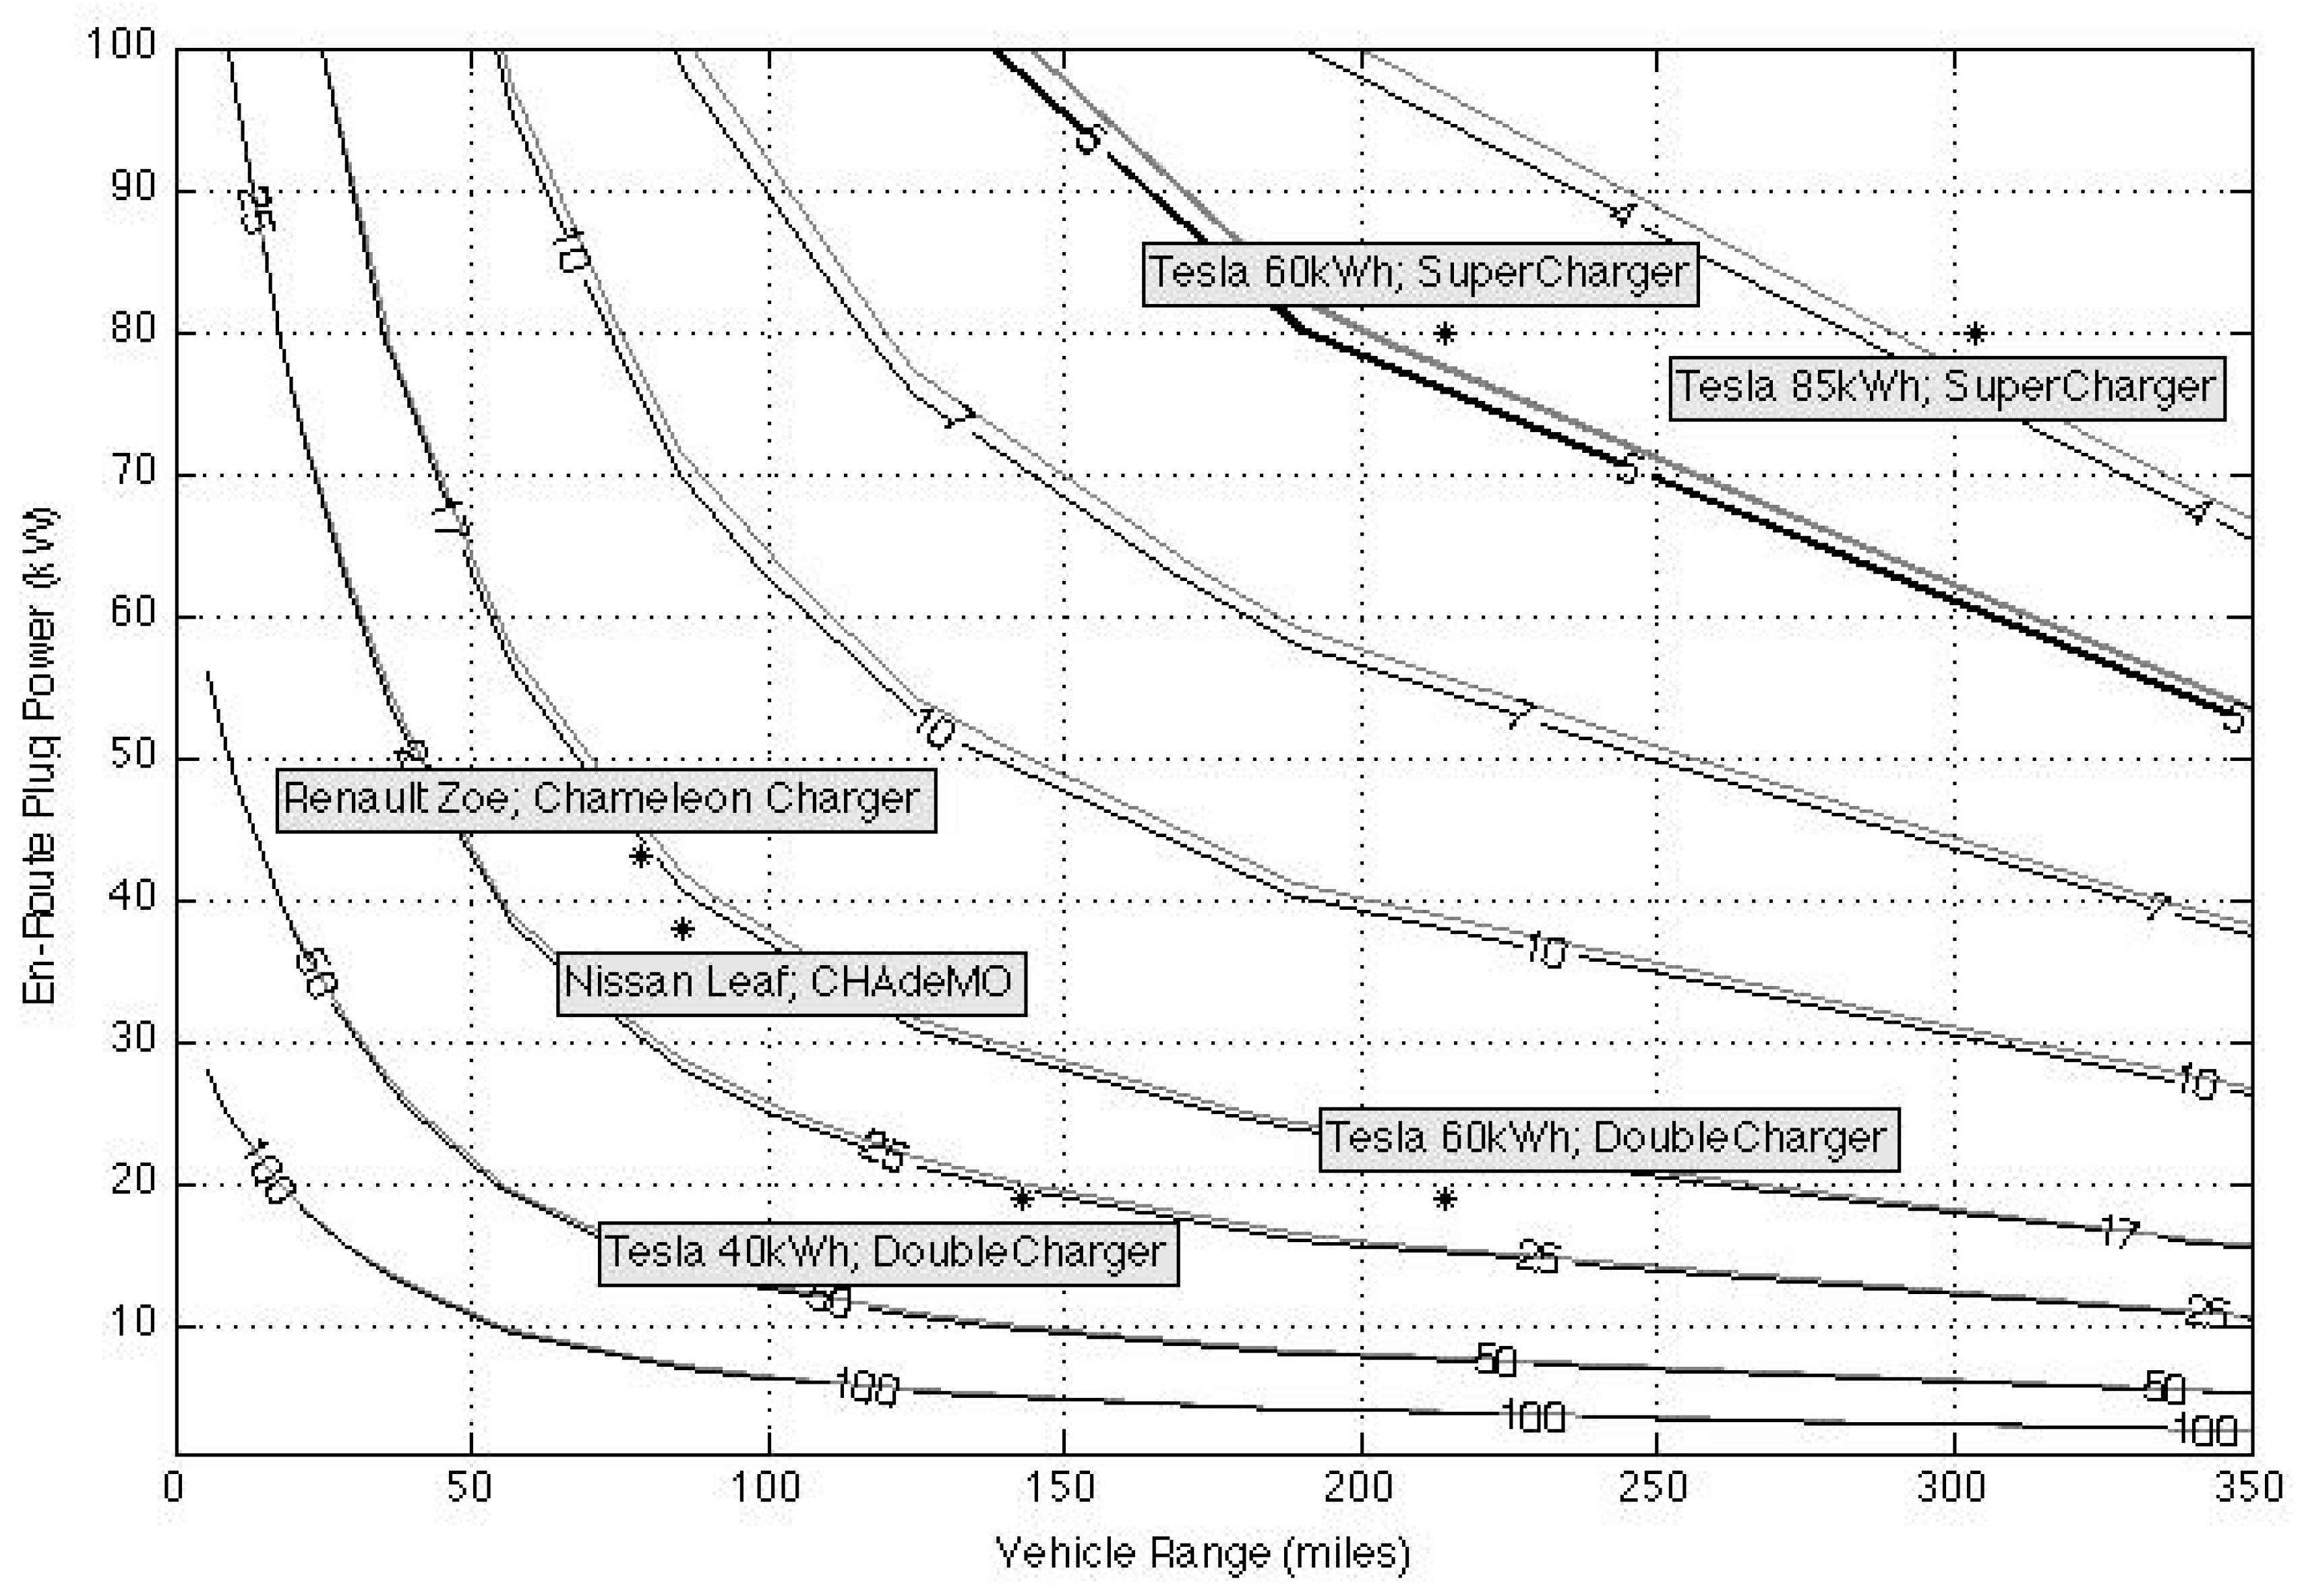
Only Home charging is considered in Figure 8, at both 6 kW and 17 kW. To complete the time analysis, we also estimate the driver engagement time for plugging and unplugging the Home charging station. For Home charging, no time is consumed by waiting for the charge to complete. Based on our own simple stopwatch measures, this is found to be about 7–8 s to plug in and the same to unplug, or 15 s total per charge event. We simplify the time consumed calculation by assuming the typical case of one Home charge per 24 h, thus yearly driver engagement time for Home charging is 15 s/day times 365 days, or 1.52 h/year (Alternatively, if one compared time for charging at both Home and Work, that would increase the daily plug–unplug time but reduce the need for en route charging; we did not consider that additional comparison worth additional space here). Most dedicated Home charging uses an existing reserved space not usable by the public, installed as a simple added circuit on the home electric system. Thus, there is no authorization, credit card swipe, etc. This both simplifies the transaction so it can be completed in the mentioned 7–8 s, and also increases the reliability of the charger.
Figure 8 shows contour lines through the space corresponding to lines of equal hours/year for electric vehicle charging time consumed. Note that we are counting hours to insert and remove the plug daily plus time waiting for en route charging to complete; time at home or at work is not time separately consumed for charging. Moreover, note that although the Y-axis units are kW as before, here the axis only labels the kW of en route charging, whereas all prior graphs showed the kW of normal daily charging. We do compare the daily power of 6 kW versus 17 kW Home charging via parallel grey (6 kW) versus black lines (17 kW) along each contour. Note that the power level of the en route charging has a far greater effect on time required for charging (large increases in time contours as one looks from the top to bottom of the chart) than does the Home charging power level (black and grey lines are very close together). To understand the “en route plug power”, note that during a fast charging session, as the battery fills, the power drops below that reported by the manufacturer; the Y-axis in Figure 8 represents the average power over the charging session.
Figure 8 shows, for example, that the driver of a vehicle with 17 kW at-Home charging, 70 kW en route charging, and 250 miles range, would spend about 5 h per year charging. These five hours are the sum of 3.5 h waiting at 70 kW en route charging stations and about 1.5 h plugging in and unplugging at home. Note that the less time-consuming Home charging accounts for far more charging events and far more total energy added to the EV than does en route charging. As another comparison in Figure 8, Teslas had a “double AC charger” that could charge at 19 kW; comparing that vehicle with one using the supercharger averaging 80 kW, both with a 60 kWh battery, shows a drop from 20 h/year to under 5 h/year. This substantial improvement quantitatively affirms Tesla Corp’s early decision to provide fast en route charging in order to sell their EVs.
How should we interpret the charging times in Figure 8—is that a lot of time or a little? The obvious comparison is with how much time we spend fueling gasoline vehicles. As we previously showed in Figure 3, Figure 4, Figure 5, Figure 6 and Figure 7 and the accompanying analysis, Home charging meets most needs, with “adaptation days” rare for large-battery EVs. Gasoline fueling is quicker but always occurs away from home and generally requires driving to a station and waiting during fueling. To calculate total time for gasoline refueling, an average car driving 12,000 miles/year at 27 mpg will consume 444 gallons of gasoline. Gasoline industry statistics give the average refuel as 8.8 gallons [30], consistent with the research finding that refueling on average adds 2/3 to the tank [31]. Dividing 444 gallons per year by 8.8 gallons per refuel is 50 visits to a fueling station. Trips to refuel with gasoline require 5.6 min at the gas station [32]. Time to drive to the gasoline station averages 5 min [33], of which we estimate 3 min are additional travel time (Although 5 min is the reported travel time to fuel, some of those trips are en route to other destinations, while others are trips for the purpose of refueling. Forty percent of drivers prioritize price in choosing a fueling location (for them, the 5 min may be all added travel), and another seven percent take a round trip just to refuel (for them, 10 min). Considering all these cases, 3 min seems a reasonable approximation for added driving time to achieve a gasoline refill). Thus, total gasoline fueling time is 50 visits times 8.6 min/visit, or about 7 h per year.
A line marked “7” (third down from the top) has been added to Figure 8 for gasoline fueling time to compare with EV charging time. Note that the 7 h gasoline contour was simply drawn for comparison appropriately between 5 and 10 h on the surface, whereas all the EV lines are derived from the range and charging power of the modeled EV.
The EVs in the upper right of Figure 8 spend less time yearly for fueling than the 7 h yearly of a gasoline vehicle. In addition, many EV users do other activities while fast charging en route [1] not considered here. Older or more moderately priced EVs, for example, the original 2011 Nissan leaf with Home and en route charging, would require 25 adaptations (per Figure 5). If those adaptations were via en route charging with the Leaf’s optional CHAdeMO charger averaging 38 kW, the driver would consume a total 18 h/year charging (Figure 8). Those characteristics of the early EVs, and the scarcity at that time of fast en route charging, surely contributed to the perception that EVs require drivers to spend a lot more time refueling than with gasoline. By contrast, drivers of contemporary 2023 EVs, with a range over 200 miles and en route charging power of at least 100 kW, will spend less time refueling than drivers of gasoline cars (Figure 8). Moreover, those who regularly plug in during long parking opportunities (Home or Work) verbally report little or no time required for fueling and state that low time-and-effort fueling is an advantage of their EV [1]. In sum, vehicle capabilities, trip requirements, and whether other activities are done while charging, appear to be major determinants of how likely EV drivers perceive en route charging to be an inconvenience.

4.5. Multi-Vehicle Households

About 60% of U.S. households own more than one vehicle [34]. When these multi-vehicle households anticipate a long trip or a driving-intensive day, it may be simple to take a fueled vehicle rather than an EV. This concept was described by Kurani et al. [35] as a “hybrid household”. Today, with increasing numbers of multi-EV households, one might similarly choose their household’s large-battery, fast-charging EV for a longer trip. The fraction of households with multiple-vehicle ownership is given in Table 3, which shows that our trip inventory sample’s ownership rates are similar to contemporaneous national averages [34].
The model realistically required that vehicle exchanges would only happen when both vehicles were at home. For simplicity, we modeled Home charging only, thus the only trip chains are Home–to–Home. We refer to this form of range adaptation as intra-household vehicle substitution, or vehicle swapping for short. For each of the 167 multi-vehicle households, potential EV swaps were extracted, based on a sequence of three times:
(i)
finding times when all household vehicles were in use (T1);
(ii)
identifying the following swap opportunity—with two vehicles at Home (T2);
(iii)
finding the preceding swap opportunity for those two vehicles (T0); and
(iv)
assigning to the EV the shorter Home–to–Home trip chains between T0 and T2.
To rephrase this scenario from the household drivers’ perspective, the multi-vehicle model simulates drivers swapping a non-range-constrained vehicle for the modeled EV for long trips. In the resulting set of trips, we count adaptation days. The results are in Figure 9, which may be compared with Figure 5. Figure 5 was without intra-household vehicle substitution, and Figure 9 is with it. Figure 9 does not count intra-household substitution as an “adaptation”; if it did, Figure 9 would be exactly the same as Figure 5.
Intra-household vehicle substitution significantly reduces adaptations required (compare Figure 9 with Figure 5). This is with only a Home charger—no fast en route charging and no charging at other locations. For example, in multi-vehicle households with only Home charging, an EV with either a 250-mile range and 10 kW charger, or a 300-mile range with only a 4 kW Home charger, requires one or fewer adaptations per year (see the “1” line in Figure 9). Without swapping, these EVs require about four adaptation days per year. Swapping does not lower the adaptations to zero because on some days, a few outlying households had all their vehicles’ daily driving exceed the EV’s range.

4.6. Segmentation of the EV Market—Need for a Moderate-Capability EV

Recently, more attention has been paid to improving EV usability for underserved, low-income, and urban communities. The lowest income households drive half as many VMT as high-income households, and urban households drive less than rural ones [36]. Several studies have shown that a smaller-battery vehicle can meet all household needs for a significant fraction of households [5,37,38]. This paper’s data further elucidate this suggestion. Table 4 gives eight example EVs (varying in battery kWh and charging kW), examples that span a range of actual vehicles (per Table 2). Note that this paper’s prior metrics show trip success or hours spent charging across the entire database of 333 trip patterns. The shortfall of that approach is to ignore that each individual only requires their own specific set of trips; no one individual requires meeting trips of all 333 drivers in our trip inventory. Following that logic, this section segments the set of the 333 cars’ trip inventory, dividing into users with similar needs. Previously, Kempton suggested such segmentation, giving as illustrative examples for EV segments, one EV of 240 km range (250 miles) and one of 1000 km (620 miles), but these numbers lacked quantitative justification [37]. A more quantitative approach to market segment has been taken in newer studies such as [38] and is refined in this paper for Table 4. Here, we tabulate the number of households for which those EV characteristics and availability of chargers meet every single trip taken in the year.
For example, the first line in Table 4 shows that an EV with a 10.4 kWh battery, charging at 2 kW, and only charging at Home, will fully meet the trip needs of less than 1% of vehicle owners, clearly not a viable market share. Nor does 24 kWh with 3.3 kW seem viable at 4.8% potential market. A bigger jump in the fully satisfied market share is achieved by increasing to a 40 kWh battery. An EV of 40 kWh (range of 143 mi/230 km) with 9.6 kW Home charging meets all driving needs of 11.4% of drivers; adding low-cost AC chargers in added community locations, it meets the needs of 25% of drivers (or 38% of those with another car in the household). Again, these are people who meet 100% of their trip needs with no adaptation or added time all year—and 25% is a significant market segment. As noted in the discussion of Figure 7, adding low-cost AC chargers in more locations helps a modest-battery-sized vehicle more than it helps a large-battery vehicle.
This finding has equity and EV-access implications. The large-battery vehicle (85+ kWh, 9.6 kW charging) with only Home charging meets all trips with zero adaptations for 33% of drivers. More precisely, if every driver had this EV, the whole population would average only 3 adaptation days per year (Figure 5), which could be met, for example, by using fast charging on only 3 days per year. However, the 85 kWh EV is notably more expensive and the faster DC-charging events also cost several times more per kWh of electricity. In other words, the current predominant configuration is best suited for people who can afford a higher-priced new car, who have dedicated parking at home, and who do not mind paying a premium, perhaps more than gasoline, for en route DC charging. This solution, in its favor, is cost-effective in equipment (Table 1) and works well as measured by the few adaptations needed and low time spent.
The urban multi-family housing resident, elderly driver, or low-income car owner on average drives fewer miles, may not have a driveway or any dedicated parking, and is likely more sensitive to high vehicle cost and high en route charging cost. Our analysis suggests an alternative: a 40 kWh EV would cost USD 9900 less. (The 40 kWh vehicle is 45 kWh less in battery size than the 85 kWh one. Retail cost delta, including mounting, battery management, etc., is approximately USD 220/kWh, or for 45 kWh reduction, USD 9900 less cost.) Yet with Home and community 10 kW charging, that EV would meet 100% of the needs of a market segment including 25% of drivers (Table 4). Home charging might not be available to the urban poor; thus, to serve the urban poor, the “charge everywhere” option would need to include street or lot parking in residential areas near home, as also shown by [38]. The installation of low-cost community charging in residential areas would make EV charging accessible to residents without dedicated parking. As EVs continue their price decline and a used-EV market grows, providing common public charging in dense areas would make the moderate-range EV more affordable than gasoline is today and could also appeal to market segments who make very few long-distance driving trips, prefer a smaller car, and/or are unable to pay for an expensive new EV.

5. Conclusions

One goal of this research responds to the prior finding that the distribution of trips has a very long tail, and that longer trips, though infrequent, constrain the ability of EVs to entirely satisfy the trip requirements of existing liquid-fueled vehicles. The long tail of trip distances means that meeting the longest few trips, or accommodating the furthest-traveling households, via a bigger battery becomes increasingly expensive for each successively longer (yet less common) long trip. Thus, this article has quantified the relative effects of battery size, charger power, charger location, and vehicle swaps to meet trip needs.
How do larger batteries compare with faster and more ubiquitous charging? As shown in Figure 5, Figure 6, Figure 7, Figure 8 and Figure 9, smaller batteries (thus low range) are the primary driver of the need for adaptation. Faster charging, whether daily or en route, has a smaller but important effect—at lower cost. For example, on a small-battery vehicle such as the early Leaf, with less than 100 miles range, adaptation days are reduced very little by upgrading from 3.3 kW charging to 6.6 kW. On a larger-battery vehicle such as the 85 kWh Model S, the difference between 3 kW and 10 kW charging cuts adaptation days in half; in other words, faster AC charging (e.g. at Home and Work) can allow reducing vehicle battery size from 300 miles to about 250 miles (depending on charging availability) without increasing the adaptation days. These examples illustrate a general finding of practical significance because faster AC charging is substantially less expensive than larger batteries, yet the two are functionally equivalent in their effect on EVs meeting the U.S. trip inventory.
This analysis has shown that for long-dwell charging locations such as at Home or Work, there is little marginal benefit from increasing charging power above 10 kW. However, if fast charging stations are available to vehicles on long trips, the ability of a 150- to 200-mile vehicle to recharge at 100 kW would reduce the total time EV drivers spend at dedicated charging stops—specifically these can reduce the recharging time to levels below what we currently spend to do gasoline refueling (Figure 8). Increases in either battery range or charging power above those levels yield only minimal further time savings. That is, the current approach with Home charging plus a very small number of higher-speed chargers along travel routes would reduce to a minimum both EV drivers’ time spent and adaptations needed. Table 1 gives a sense of the potential cost-effectiveness of this solution (granting the current issues with DC charger reliability and maintenance, not included in Table 1). In such a system, Home (and possibly Work) AC chargers provide the bulk of energy, with en route fast charging needed by only 50% of vehicles, those vehicles use relatively few en route chargers, and they do so infrequently. Yet for that 50%, high-power fast chargers are important for facilitating their long trips.
The analysis of multi-car households shows that on average the number of adaptation days drops dramatically if the driver simply picks a gasoline car when a longer trip is planned. This is true for any EV configuration of battery and charging power. Moreover, because two thirds of U.S. households own more than one vehicle, we find that over one third of all U.S. households could replace an existing vehicle with a modest 40 kWh EV (range of 150 miles or 240 km) without compromising their current mobility at all. For multi-vehicle households, a very modest EV—75 miles (120 km) of range and 3 kW charging—could satisfy 40% of multi-vehicle households (equivalent to 25% of all households). Multi-vehicle households could have two roles. First, as a transition strategy during the time that many EV households will retain an older gasoline vehicle. Second, in a post-gasoline future, understanding multi-vehicle household range needs could guide two-EV households to choose one EV capable of longer trips and fast en route charging, plus a second EV at lower cost with a smaller battery and only needing modest charging power.
More generally, our measures of adaptation days and refilling time required are not meant to imply that buyers will demand zero adaptations to EVs. That people will make some adaptations is both expected and has been observed from EV buyer and user evidence (e.g., [1,39]). And, as we quantified in this article, some EV-range adaptations and time used are comparable to gasoline vehicles’ scheduled maintenance or trips to filling stations. The market segmentation here shows how, and how much, the right combination of battery size, charging power, and more charging locations can expand the type of drivers for whom even modest-sized electric vehicles are highly appropriate. These findings have marketing and educational implications.
This analysis shows that there is a substantial market segment (≈25% of all drivers) who would achieve 100% of their driving needs with an EV with only a 40 kWh battery, especially if there are multiple AC chargers available where they regularly drive. From this perspective, the large-battery (85+ kWh) EV with Home charging and DC fast charging along freeway routes—seen as cost-effective and convenient—could now be qualified as targeting a higher-income, higher-VMT driver with dedicated home parking. In contrast, the 40 kWh EV with community charging may be a better match to a segment that could include communities not yet fully participating in the EV transition.
Subsequent research to specify the practicality of a widely applicable 40 kWh EV requires several approaches: add to our car and trip focus new methods to identify the stops best suited for charging [40], to develop policies and business models for low-cost urban charging, and to compare policies to enable the proposed modest-battery EV. Such research would clarify the transition path, guide charger placement policies, and aid market development for an EV better targeted for this market segment.

Author Contributions

Conceptualization, W.K. and N.S.P.; methodology design, N.S.P. and W.K.; data analysis, N.S.P. and V.V.E.; visualization, N.S.P.; writing, N.S.P. and W.K.; supervision, W.K.; original data acquisition, R.G. and V.V.E.; funding acquisition, W.K. and R.G.; project administration, W.K. All authors have read and agreed to the published version of the manuscript.

Funding

This analysis was supported by funding from AC Propulsion and from the U.S. Department of Energy, (grant number DE-FC26-08NT01905), W. Kempton, PI. The driving data used were collected by the Georgia Institute of Technology (GIT) with support from the Federal Highway Administration and the Georgia Department of Transportation (R. Guensler, PI).

Data Availability Statement

Under requirements of the GIT Institutional Review Board, the data were destroyed after the full analysis period. Because the primary data contained vehicle speeds, ignition on/off, and 1 s resolution GPS locations of all travel and stops, they were considered highly sensitive. As a confirmation that they were in fact sensitive, the data were requested in three court cases: one involving an accident at a stop sign and two in divorce cases. Therefore, the data are no longer available.

Acknowledgments

Regina McCormack researched information on gasoline refueling. Thanks to the late Tom Turrentine of UC Davis for suggesting that Kempton contact Guensler about this collaboration. Comments by the anonymous reviewers were helpful and appreciated.

Conflicts of Interest

All authors declare no conflict of interest.

References

  1. Sprei, F.; Kempton, W. Electric Vehicle Adoption Limited by Liquid Fuel Mental Models. 2023; manuscript under review. [Google Scholar]
  2. Federal Highway Administration (FHWA). Highway Statistics 2020. 2022. Available online: https://www.fhwa.dot.gov/policyinformation/statistics/2020/# (accessed on 20 December 2022).
  3. Needell, Z.; McNerney, J.; Chang, M.; Trancik, J.E. Potential for widespread electrification of personal vehicle travel in the United States. Nat. Energy 2016, 1, 16112. [Google Scholar] [CrossRef] [Green Version]
  4. Plötz, P.; Jakobson, N.; Sprei, F. On the distribution of individual daily driving distances. Transp. Res. Part B 2017, 101, 213–277. [Google Scholar] [CrossRef]
  5. Pearre, N.S.; Kempton, W.; Guensler, R.L.; Elango, V.V. Electric vehicles: How much range is required for a day’s driving? Transp. Res. Part C Emerg. Technol. 2011, 19, 1171–1184. [Google Scholar] [CrossRef]
  6. Shi, X.; Pan, J.; Wang, H.; Cai, H. Battery electric vehicles: What is the minimum range required? Energy 2019, 166, 352–358. [Google Scholar] [CrossRef]
  7. Gonder, J.; Markel, T.; Thornton, M.; Simpson, A. Using Global Positioning System Travel Data to Assess Real-World Energy Use of Plug-In Hybrid Electric Vehicles. Transp. Res. Rec. J. Transp. Res. Board 2007, 2017, 26–32. [Google Scholar] [CrossRef]
  8. Steinberg, R. Innovative Transport Solutions. Real-World Experience with Electric Driving; BMW Group: Washington, DC, USA, 2010. [Google Scholar]
  9. Shiau, C.N.; Kaushal, N.; Hendrickson, C.T.; Peterson, S.B.; Whitacre, J.F.; Michalek, J.J. Optimal Plug-In Hybrid Electric Vehicle Design and Allocation for Minimum Life Cycle Cost, Petroleum Consumption, and Greenhouse Gas Emissions. J. Mech. Des. 2010, 132, 091013. [Google Scholar] [CrossRef]
  10. Alliance for Automotive Innovation. Electric Vehicle Sales Dashboard. 2022. Available online: https://www.autosinnovate.org/resources/electric-vehicle-sales-dashboard (accessed on 19 June 2022).
  11. US Census Bureau. NAICS 447 Gasoline Stations, Table “Establishments”. 2022. Available online: https://www.bls.gov/iag/tgs/iag447.htm (accessed on 29 December 2022).
  12. Reed Construction Data. Gasoline Station Construction Cost (www.reedconstruction.com). Now Called Construction Market Data. 2011. Available online: www.cmdgroup.com (accessed on 12 December 2022).
  13. Gas Stations USA. Buy a Gas Station. Available online: https://www.gasstationsusa.com/ (accessed on 20 December 2022).
  14. Eric, S. Quantified Parking: Comprehensive Parking Inventories for Five US Cities. Research Institute for Housing America. 2018. Available online: https://www.mba.org/docs/default-source/research---riha-reports/18806-research-riha-parking-report.pdf (accessed on 20 December 2022).
  15. Society of Automotive Engineers (SAE). J3068: Electric Vehicle Power Transfer System Using a Three-Phase Capable Coupler. (Revised 2022). 2022. Available online: https://www.sae.org/standards/content/j3068_201804/ (accessed on 1 December 2022).
  16. Pearre, N.S.; Swan, L.G.; Burbidge, E.; Balloch, S.; Horrocks, L.; Piper, B.; Anctil, J. Regional Electric Vehicle Fast Charging Network Design Using Common Public Data. World Electr. Veh. J. 2022, 13, 212. [Google Scholar] [CrossRef]
  17. Shoup, D. (Ed.) Parking and the City; Routledge: New York, NY, USA, 2018. [Google Scholar]
  18. U.S. Department of Transportation, National Highway Traffic Safety Administration. Fleet Fuel Economy Performance Report. 2018. Available online: https://one.nhtsa.gov/cafe_pic/CAFE_PIC_fleet_LIVE.html (accessed on 16 May 2018).
  19. Chris, H. Electric Vehicle Ownership Costs, (Special Report). Consumer Reports. 2020. Available online: https://advocacy.consumerreports.org/wp-content/uploads/2020/10/EV-Ownership-Cost-Final-Report-1.pdf (accessed on 20 December 2022).
  20. Federal Highway Administration. National Electric Vehicle Infrastructure (NEVI) Formula Program, Formula Program Guidance. Available online: https://www.fhwa.dot.gov/environment/nevi/formula_prog_guid/ (accessed on 18 November 2022).
  21. Schönfelder, S.; Li, H.; Guensler, R.; Ogle, J.; Axhausen, K.W. Analysis of Commute Atlanta Vehicle Instrumented GPS data: Destination Choice Behavior and Activity Spaces. Arb. Verk. Und Raumplan. IVT EHS 2006, 303, 1–24. [Google Scholar] [CrossRef]
  22. Guensler, R.; Williams, B.; Ogle, J. The Role of Instrumented Vehicle Data in Transportation Decision Making. In Proceedings of the Fourth International Conference on Decision Making in Urban and Civil Engineering (DMinUCE), London, UK, 6–8 November 2002. [Google Scholar]
  23. Ogle, J.; Guensler, R.; Elango, V. Georgia’s Commute Atlanta Value Pricing Program: Recruitment Methods and Travel Diary Response Rates. Transp. Res. Rec. J. Transp. Res. Board 2005, 1931, 28–37. [Google Scholar] [CrossRef]
  24. Pearre, N.S. Location, Duration, and Power; How American’s Driving Habits and Charging Infrastructure Inform Vehicle-Grid Interactions. Ph.D. Thesis, University of Delaware, Newark, NJ, USA, 2013. Available online: https://www.proquest.com/openview/809a8c5a9589b123d4e3e65ed1e56da9 (accessed on 6 January 2023).
  25. Santos, A.; McGuckin, N.; Nakamoto, H.; Gray, D.; Liss, S. 2009 National Household Travel Survey; Summary of Travel Trends; the U.S. Department of Transportation Federal Highway Administration (FHWA): Washington, DC, USA, 2011. [Google Scholar]
  26. Bureau of Labor Statistics. Workers on Flexible and Shift Schedules in 2001; Bureau of Labor Statistics: Washington, DC, USA, 2002.
  27. Kempton, W.; Marra, F.; Anderson, P.B.; Garcia-Valle, R. Business models and control and management architecture for EV electrical grid integration. In Electric Vehicle Integration into Modern Power Networks; Garcia-Valle, R., Lopes, J.A.P., Eds.; Springer: Berlin/Heidelberg, Germany, 2012; ISBN 978-1-4614-0133-9. [Google Scholar]
  28. US Department of Energy, Vehicle Technologies Office. “2021: DOE Estimates That Electric Vehicle Battery Pack Costs in 2021 Are 87% Lower Than in 2008”. 4 October 2021, Fact (FOTW) #1206 Dataset. 2021. Available online: https://www.energy.gov/eere/vehicles/articles/fotw-1206-oct-4-2021-doe-estimates-electric-vehicle-battery-pack-costs-2021 (accessed on 1 December 2022).
  29. Henry, J. Electric Vehicle Service Costs 30% Lower Than Gasoline Vehicles, Says Research Firm We Predict. Forbes Online. 28 October 2021. Available online: https://www.forbes.com/sites/jimhenry/2021/10/28/electric-vehicle-service-costs-30-lower-than-gasoline-vehicles-says-research-firm-we-predict (accessed on 20 December 2022).
  30. National Association of Convenience Stores. State of the Industry Report of 2011 Data; NACS: Alexandria, VA, USA, 2012. [Google Scholar]
  31. Turrentine, T.; Kurani, K. The Household Market for Electric Vehicles. Testing the Hybrid Household Hypothesis: A Reflexively Designed Survey of New-car-buying, Multi-vehicle California Households; Technical Report No. 61982080. OSTI Identifier 270521; University of California Davis, Institute of Transportation Studies: Davis, CA, USA, 1995. [Google Scholar]
  32. Adornato, B.; Patil, R.; Filipi, Z.; Bareket, Z.; Gordon, T. Characterizing naturalistic driving patterns for Plug-in Hybrid Electric Vehicle analysis. In Proceedings of the IEEE Vehicle Power and Propulsion Conference, Dearborn, MI, USA, 7–10 September 2009; pp. 655–660. [Google Scholar] [CrossRef]
  33. Kitamura, R.; Sperling, D. Refueling Behavior of Automobile Drivers. Transp. Res. Part A 1987, 21A, 235–245. [Google Scholar] [CrossRef]
  34. U. S. Department of Transportation. Omnibus Household Survey; USDOT-BTS 2003b; U.S. Department of Transportation: Washington, DC, USA, 2003. [Google Scholar]
  35. Kurani, K.S.; Turrentine, T.; Sperling, D. Testing electric vehicle demand in ‘hybrid households’ using a reflexive survey. Transp. Res. Part D Transp. Environ. 1996, 1, 131–150. [Google Scholar] [CrossRef] [Green Version]
  36. Fricker, J.D.; Kumapley, R.K. Updating Procedures to Estimate and Forecast Vehicle-Miles Traveled; Technical Summary, INDOT Research; Publication No. FHWA/IN/JTRP-2002/10, SPR-2468; Joint Transportation Research Program, Purdue University: West Lafayette, IN, USA, 2002. [Google Scholar] [CrossRef] [Green Version]
  37. Kempton, W. Driving Range. Nat. Energy 2016, 131, 16131. [Google Scholar] [CrossRef]
  38. Wei, W.; Ramakrishnan, S.; Needell, Z.A.; Trancik, J.E. Personal vehicle electrification and charging solutions for high-energy days. Nat. Energy 2021, 6, 105–114. [Google Scholar] [CrossRef]
  39. Hidrue, M.K.; Parsons, G.R.; Kempton, W.; Gardner, M.P. Willingness to pay for electric vehicles and their attributes. Resour. Energy Econ. 2011, 33, 686–705. [Google Scholar] [CrossRef] [Green Version]
  40. Metais, M.-O. Toward a cleaner mobility: Developing Charging Infrastructure for Electric Vehicle Transition. Ph.D. Thesis, l’Université Paris-Saclay, Gif-sur-Yvette, France, 2023. preparing. [Google Scholar]
Figure 1. Distribution of time at Work (grey bars) and time at Home (black). The X-axis gives fractions of time over the year, so 0.1 means 10% of the time over the year. The leftmost bar is truncated; its actual height is 0.52. Reprinted by permission, from Pearre [24].
Energies 16 02104 g001
Figure 2. Fraction of fleet at Home and Work each hour on workdays (left plot) and on weekends and holidays (right plot). The means for the year’s data are the black middle line for Home and the light grey middle line for Work. Reprinted by permission, from Pearre [24].
Energies 16 02104 g002
Figure 3. Success fraction (in percent of round trips) for charging at Home only. Success is a percentage of all cars and all trips over the year’s trip inventory. Reprinted by permission, from Pierre [24].
Energies 16 02104 g003
Figure 4. Distribution of distances of trip chains (EVSE to EVSE) in the trip inventory, comparing the three definitions of charging locations. Reprinted by permission, from Pearre [24].
Energies 16 02104 g004
Figure 5. Adaptation days per year of Home charging only. Reprinted by permission, from Pearre [24].
Energies 16 02104 g005
Figure 6. Adaptation days for charging at Home and at Work. Reprinted by permission, from Pierre [24].
Energies 16 02104 g006
Figure 7. Adaptation days for vehicles that charge at all stops. Reprinted by permission, from Pearre [24].
Energies 16 02104 g007
Figure 8. Time required for charging (in hours per year, labelled on each black contour line). Lines represent equal numbers of hours per year. The Y-axis gives the en route charging power (averaged over charging session), while line shading indicates two Home charging power levels—either 17 kW (black lines) or 6 kW (grey lines). Gasoline vehicles on average spend about 7 h per year for refueling (calculated in text and shown by the pair of lines third down from the top right, labeled “7”).
Energies 16 02104 g008
Figure 9. Adaptation days per year among households with multiple vehicles, where the EV is used for the shorter trip, and an available household gasoline vehicle (or a long-range EV) is swapped for the longer trip. Home charging only. Reprinted by permission, from Pearre [24].
Energies 16 02104 g009
Table 1. Gasoline versus electric charging equipment in the U.S., compared with parking spaces. Each has a count and approximate cost. EV station costs are calculated for differing combinations of charging stations, corresponding to the charging-location analysis in this article (calculations in text).
Cars:StationStation Cost (USD)Station Cost/Car (USD)
Gasoline2638:11,000,000379
Parking space1:84000–23,00032–92 K
EV chargingHome1:115001500
H + Work1:21500 + 30004500
H + Work + 21:41500 + 3000 × 310,500
Shared DC30:170,0002333
H + shared DC≈1:11500 + 70,000 ÷ 3001733
Table 2. Reported battery capacity, range, calculated energy consumption (Wh/mile), and energy efficiency (km/kWh) for diverse EVs, including older and newer models. Ranked by battery capacity in kWh.
VehicleUsable Battery Capacity (kWh)Reported Range (miles)Energy Consumption (Wh/mile)Energy Efficiency (km/kWh)
Chevy Volt (2012)10.4402606.19
Aptera 2e13.010013012.4
Renault Zoe 201322932366.82
Nissan Leaf (2011)24713404.73
Tesla S 40 (2012)401392875.61
Chevy Bolt (2023)652592516.41
Tesla S 85853002835.67
Ford Mach-E Rt. 1 (2022)913122915.53
GMC Hummer 20222123296442.50
Table 3. This sample’s proportion of multiple-vehicle ownership, compared with the contemporaneous U.S. national average per NHTS [34]. Reprinted by permission, from Pearre [24].
One CarTwo CarsThree or More
National Avg34.2%40.5%25.2%
Trip Inventory Sample37.9%45.2%16.9%
Table 4. Percentage of households that never require adaptations, given the EVs’ attributes (rows) and comparing across charging locations (columns under “Households meeting all yearly trips”).
EV AttributesHouseholds Meeting All Yearly Trips (%)
Battery (kWh) and Charging (kW)Range (miles)Range (km)Charging Home OnlyCharging Home and WorkCharging EverywhereIntra-House Substitution
10.4 and 237600.40.41.311.8
24 and 3.3861384.84.88.127.2
40 and 3.314323011.211.92236.5
40 and 9.614323011.412.625.337.9
40 and 1814323011.712.825.538.2
85 and 3.330649231.13248.250.4
85 and 9.630649232.833.452.851.9
85 and 1830649233.534.253.952.1
Disclaimer/Publisher’s Note: The statements, opinions and data contained in all publications are solely those of the individual author(s) and contributor(s) and not of MDPI and/or the editor(s). MDPI and/or the editor(s) disclaim responsibility for any injury to people or property resulting from any ideas, methods, instructions or products referred to in the content.

