Review

Progress of Seepage Law and Development Technologies for Shale Condensate Gas Reservoirs

1
School of Civil and Resource Engineering, University of Science and Technology Beijing, Beijing 100083, China
2
Bob L. Herd Department of Petroleum Engineering, Texas Tech University, 2500 Broadway, Lubbock, TX 79409, USA
*
Authors to whom correspondence should be addressed.
Energies 2023, 16(5), 2446; https://doi.org/10.3390/en16052446
Submission received: 1 February 2023 / Revised: 27 February 2023 / Accepted: 1 March 2023 / Published: 3 March 2023

Abstract

:
With the continuous development of conventional oil and gas resources, the strategic transformation of energy structure is imminent. Shale condensate gas reservoir has high development value because of its abundant reserves. However, due to the multi-scale flow of shale gas, adsorption and desorption, the strong stress sensitivity of matrix and fractures, the abnormal condensation phase transition mechanism, high-speed non-Darcy seepage in artificial fractures, and heterogeneity of reservoir and multiphase flows, the multi-scale nonlinear seepage mechanisms are extremely complicated in shale condensate gas reservoirs. A certain theoretical basis for the engineering development can be provided by mastering the percolation law of shale condensate gas reservoirs, such as improvement of productivity prediction and recovery efficiency. The productivity evaluation method of shale condensate gas wells based on empirical method is simple in calculation but poor in reliability. The characteristic curve analysis method has strong reliability but a great dependence on the selection of the seepage model. The artificial intelligence method can deal with complex data and has a high prediction accuracy. Establishing an efficient shale condensate gas reservoir development simulation technology and accurately predicting the production performance of production wells will help to rationally formulate a stable and high-yield mining scheme, so as to obtain better economic benefits.

1. Introduction

With the reduction of conventional oil and gas resources and the strategic transformation of energy structure, the sustainable development of shale gas reservoir has the potential to fully meet the growing energy demand. Shale condensate gas reservoir plays an increasingly important role in the development of unconventional gas resources in the world. This resource target is relatively new and has great development potential. Its exploitation technology is challenging, which is mainly characterized by incorporating complicated multi-scale seepage law involved in the development of shale condensate gas reservoirs. Currently, great research progress on the multi-scale seepage law and the exploitation technology has been made in recent years. However, some difficult research problems remain to be solved in the future, such as the limitation of experimental equipment and nonupgraded research methods. In this paper, novel theories of seepage law emerging, experimental methods, and exploitation techniques of shale condensate gas reservoirs are reviewed and discussed. The paper is not only very helpful to provide ideas and guidance in time for upcoming difficulties in research and technology development, but also provides technical support for exploitation strategy innovation, so as to improve shale gas recovery efficiency and maximize economic benefits of shale condensate gas reservoirs.
In the process of development, the better expansibility of shale condensate gas reservoir can alleviate the reduction of reservoir pressure. Moreover, some condensate gas reservoirs exist in the liquid phase and have strong fluidity. Hence, condensate gas reservoirs usually have a high output. That is, in actual engineering, the transition area of condensate and gas have the highest output, the best economic benefits, and better development prospects [1]. However, when the pressure drops below the dew point pressure, the condensate will be blocked. The flow resistance of gas phase and liquid phase will increase, and the productivity of producing wells will decrease. Moreover, the matrix porosity and permeability of shale condensate gas reservoir are very low, with micro/nanopores. The diameter and distribution of pores will affect the change of the fluid phase state, and also increase the critical condensate oil saturation. That is, the minimum saturation of condensate oil flow increases, and the recovery rate of condensate gas reservoir decreases. Natural gas production and liquid recovery will be significantly reduced with the reduction of oil–gas two-phase flow or even the three-phase flow of oil, gas, and water under water-bearing conditions [2,3,4].
The multi-scale nonlinear seepage law of shale condensate gas reservoir is complicated. First, in micro/nanopores, gas flow has Knudsen diffusion, molecular diffusion, and other multi-scale flow characteristics. Second, there is an adsorption–desorption mechanism. Furthermore, shale matrix and fractures have strong stress sensitivity. Finally, with the decrease in reservoir pressure, the formation pressure of shale condensate gas reservoir is gradually lower than the dew point pressure, and the condensate begins to precipitate. When the local reservoir pressure is lower than the critical flow pressure, the precipitated condensate flows near the production wellbore, forming the oil–gas two-phase flow or even the oil–gas–water three-phase flow under the condition of water. This special phase behavior may have an important impact on reservoir development. Shale condensate gas reservoirs are very dense, with an extremely low permeability and difficult fluid flow, and they are usually developed by large-scale hydraulic fracturing, which leads to the existence of multi-scale pore space composed of a tight matrix, microfractures, and hydraulic fractures [1]. Therefore, it is particularly important to master the multi-scale complex seepage law of shale condensate gas reservoir development based on multi-physical field coupling, so as to establish an efficient simulation technology for shale condensate gas reservoir.
The complete production process of production wells in shale condensate gas reservoirs includes two parts: early fracturing flowback stage and long-term production stage, and their production rules are different. In the long-term production stage, fracturing fractures may be closed, the adsorbed gas may be desorbed, and condensate oil is released, all of which will affect the productivity of production wells [2,3,4]. The above factors should be taken into account in the accurate production evaluation method of shale condensate gas reservoir. The establishment of an efficient simulation technology for shale condensate gas reservoir development can accurately predict the production performance of production wells, which is helpful to make reasonable and stable production plans with a high yield, so as to obtain better economic benefits.

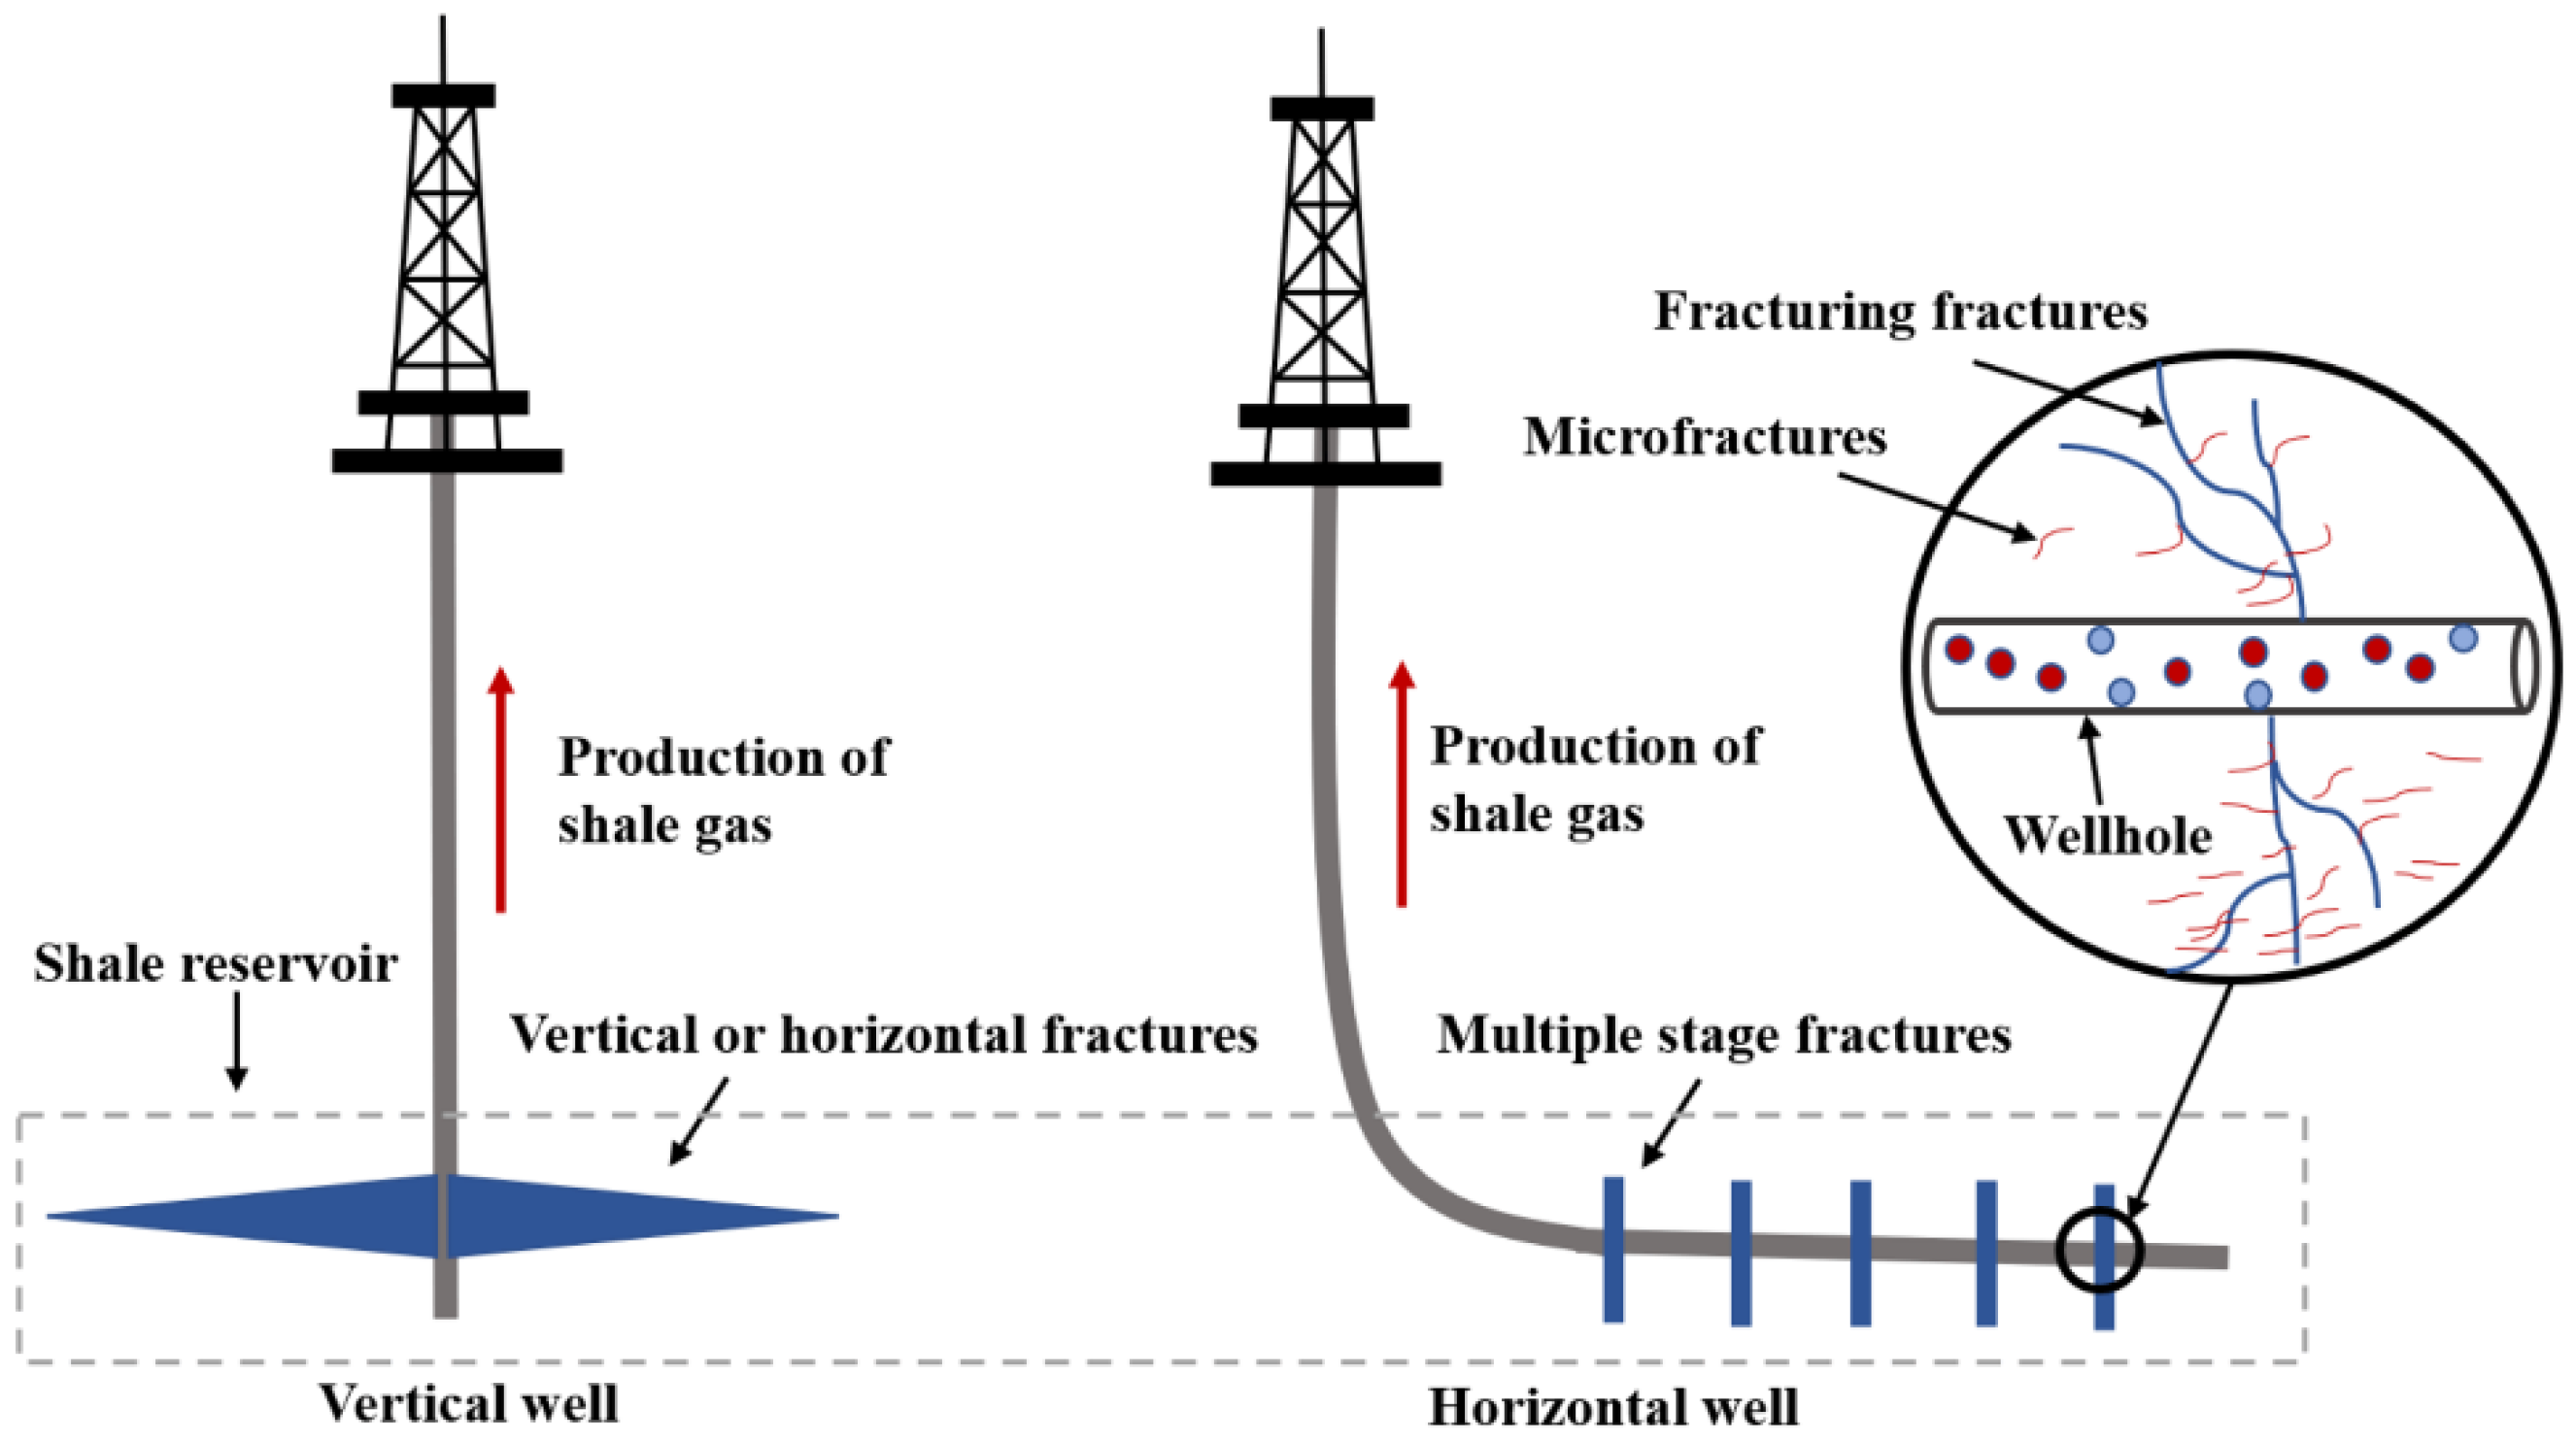
2. Reservoir Characteristics, Resource Distribution, and Exploitation Methods for Shale Condensate Gas Reservoirs

Shale gas usually exists in the adsorbed state and free state. Adsorbed shale gas usually exists in organic matter. About 20%–82% of shale gas exists in the adsorbed state, and different shales have different adsorbed gas ratios, with an average of about 50% [5]. Free shale gas usually exists in pores. Rock porosity is an important parameter for determining free gas content. Shale is very dense, with a small pore size and a large specific surface area, which is the main space for gas occurrence [6]. The pore types are diverse and the structures are complex. The pore structure of shale condensate gas reservoir is quite different from that of dry gas reservoir. In shale condensate gas reservoir, there are mainly organic matter (OM) pores, clay mineral (CM) pores, intragranular dissolution (ID) pores, and microfractures [7]. Micropores and mesoporous pores are mainly provided by OM and CM pores, while macropores are mainly provided by CM pores and microfractures [7].
The shale gas development of China has been led by Sinopec and PetroChina. The Jurassic shale in Sichuan Basin is characterized by abundant resources and great exploitation prospects. Hu et al. found that the first shale condensate gas reservoir in China developed under an abnormally high pressure and low geothermal system in the Jurassic strata of the Fuxing area in eastern Sichuan [8]. The shale condensate reservoir is buried at a moderate depth of 2200–2950 m [9]. The average permeability is greater than 0.1 mD, and the average porosity is more than 4%. The pore types are diverse, and the proportion of macropores and mesoporous pores is large, while the proportion of micropores is small. Eighty percent of shale gas in the reservoir is stored in inorganic pores in the free state [9]. Macrofractures do not develop, and there are a few microfractures and nanoscale organic shrinkage fractures [9].
The dew-point pressure of Fuye 10 HF well is 46.07 MPa, the P–T diagram clearly shows the characteristics of shale condensate gas reservoir, and the gas–oil ratio of blowout is 1243–3142 m3/m3 [9]. The “dense-fracture volume stimulation” has a good effect, but the production law of oil and gas in high-pressure shale condensate gas reservoir is still unclear, so it is urgent to develop reasonable and efficient production methods [9].
Condensate gas reservoirs are mainly found in Eagle Ford, Duvernay, Marcellus, and other shale formations. The Duvernay shale in the Simonette block is rich in condensate gas and volatile oil, with an effective thickness of 30–45 m, a high TOC of 2–6%, an effective porosity of 3–6%, and a permeability of 0.0001–0.0003 mD. According to the gas-oil ratio, it can be divided into a volatile oil zone, an ultra-high condensate oil zone, and a high condensate oil zone. In the process of development, the ultra-high condensate oil zone and the high condensate oil zone with a high recovery rate should be used first, and then the volatile oil zone should be used to increase the total production [10,11,12]. The Eagle Ford shale has strong anisotropy and is weaker when failure along the bedding is possible [13].
Large-scale hydraulic fracturing and horizontal wells are mainly adopted for shale condensate gas reservoirs. The combination of these two technologies has greatly improved the production of shale gas reservoirs. Fracturing has been used in oil and gas production since the 1950s, and horizontal wells have been used in oil production since the early 1980s [14]. In the 1980s and 1990s, Mitchell Energy and Development conducted experiments in the Barnett shale in north Central Texas, resulting in commercialization of deep shale gas production and the emergence of large-scale shale gas production [14]. The comprehensive application of horizontal wells and multistage fracturing makes the production volume of shale gas reservoir expand from the radial flow state in a limited radius centered on vertical wells to the ellipsoidal flow state centered on horizontal wells, which greatly improves the productivity [15]. The production comparison between a vertical well and a horizontal well is shown in Figure 1. The network horizontal well group, which has become the mainstream model in the world, makes the production space of shale condensate gas reservoir more three-dimensional, and the production efficiency is higher and the cost is significantly reduced.
The production process of shale condensate gas reservoirs at home and abroad is mainly divided into four steps: well drilling, fracturing and completion, production, and external centralized transport. The basic process is shown in Figure 2.
Depletion production is often used in condensate gas reservoirs in China, and, thus, in the process of production, gas reservoir pressure drops, condensate oil is precipitated, and the interfacial tension of condensate oil is constantly changing [16]. Moreover, the reservoir stress sensitivity of shale condensate gas reservoir is relatively strong. If the pressure is released, the hydraulic fracture is rapidly released during the mining process, the permeability of the reservoir in the fracture area and its adjacent area decreases, and the peripheral gas is difficult to enter the main fracture system. The cumulative production of individual wells will be reduced [17]. Therefore, the shale condensate gas reservoir should be controlled pressure production.
Relevant studies have shown that controlled pressure production can significantly delay the rate of production decline and improve the Estimated Ultimate Recovery (EUR) of a single well [17,18,19,20]. In practical engineering, cyclic CO2 injection is usually used to significantly increase the output of shale condensate gas reservoirs, and at the same time, CO2 can be stored underground to achieve carbon sequestration [21,22,23,24,25,26]. In addition, flue gas injection is also a development method of oil and gas recovery enhancement with higher economic benefits; the main components of flue gas are N2 and CO2, as well as a small amount of SO2, CO, and NOx [27,28]. Carbon capture, utilization, and storage (CCUS) can help mitigate global warming, reach the goal of carbon peak and carbon neutrality, and promote the low-carbon transformation of socio-economic systems ultimately. At present, CCUS is still at the early stage of technology development in the development of shale gas reservoirs, and relevant technical theories are not mature. Furthermore, the field pilot test of CCUS is rare in shale condensate gas reservoirs. Therefore, there is a broad research prospect in CCUS technology and involved complicated coupled mechanics in shale condensate gas reservoirs.
The time-lapse seismic methods are very sensitive to gas changes and may be used to monitor production in shale condensate reservoirs. Seismic time lapse studies are efficient to monitor the production of gas in any phase, due to the sensitivity of some seismic attributes to fluid contents. The elastic waveform inversion method can be used in time-lapse studies, where the velocity can be estimated from seismic data acquired at different periods [29]. Furthermore, seismic wave attenuation, well known by its high sensitivity to fluids (gas and liquid) content, can be used for such a purpose [30]. This can be explained by scattering and intrinsic attenuation mechanisms, which are due to heterogeneities and saturation of fluids [31]. However, seismic wave attenuation remains difficult to be accurately estimated due to its high sensitivity to seismic noise, and thus it requires a robust methodology.
Shale condensate gas reservoirs are characterized by tightness, low porosity, and low permeability, and must be fractured before commercial exploitation. Fracturing fractures are quite different from natural fractures in terms of morphology and conductivity [32]. Therefore, it is very important to establish realistic flow models for a shale condensate gas reservoir to accurately predict productivity.

3. Research Status of Seepage Law of Shale Condensate Gas Reservoir

Shale condensate gas reservoir has nanoscale pores and fluid migrates mainly in microfractures and fracturing fractures in the reservoir. The migration process of shale condensate gas reservoir has multi-scale complex nonlinear seepage law. The main influencing factors include the multi-scale flow characteristics of shale gas, the adsorption–desorption mechanism, the strong stress sensitivity of the shale matrix and fractures, the abnormal condensate phenomenon around the gas well caused by the drop in reservoir pressure during the development of the shale gas reservoir, the high speed non-Darcy flow in the artificial fractures of shale, the heterogeneity of the reservoir and the multiphase flow. Mastering the seepage law of shale condensate gas reservoir can provide a theoretical basis for the engineering technology development of the shale gas reservoir.

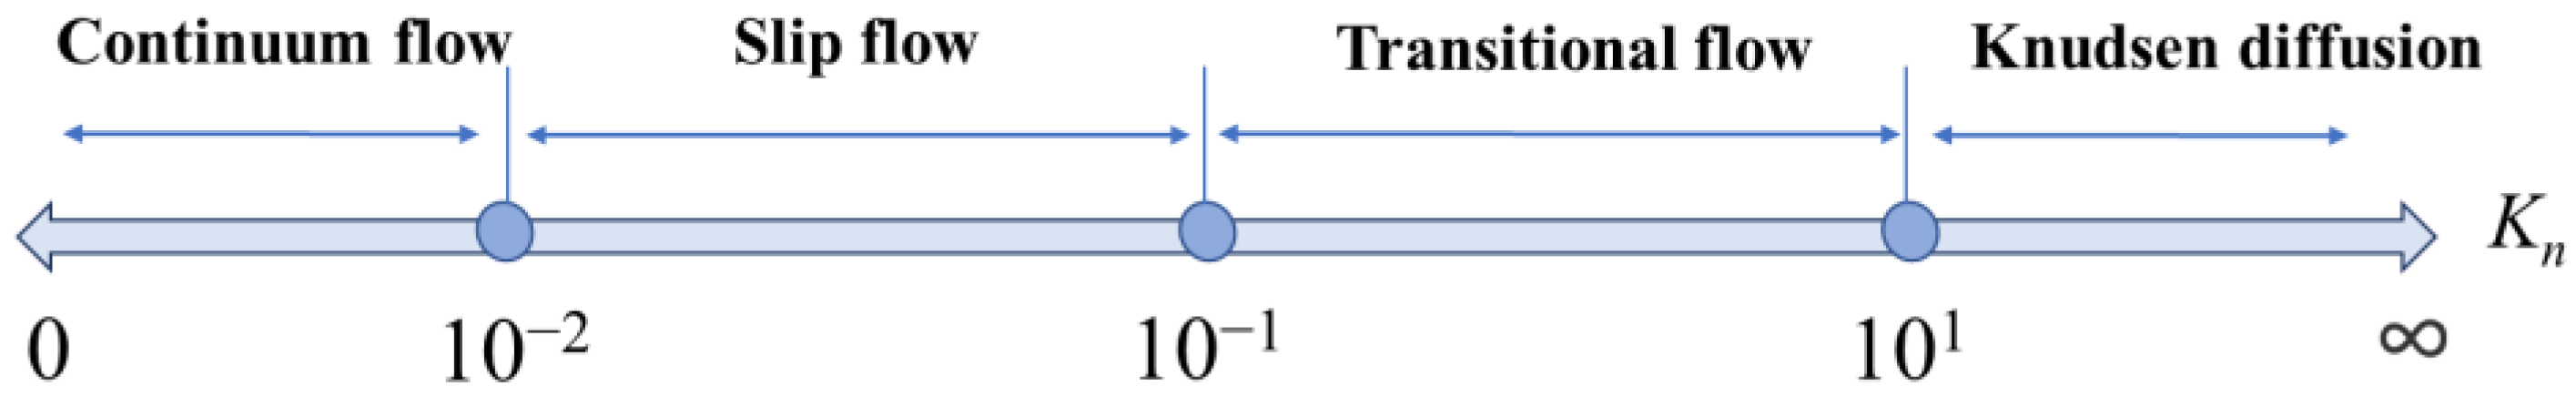
3.1. Multiscale Migration Mechanism of Shale Gas

Shale gas can exist in four states: fracture free gas, pore free gas, pore wall adsorbed gas, and kerogen dissolved gas [33]. At the nanoscale, according to the intensity of the interaction between gas molecules and pore walls, the transport mechanism can be divided into continuous flow, slip flow, transitional flow, Knudsen diffusion, single-layer adsorbed gas surface diffusion, multi-layer adsorbed gas surface diffusion, and configuration diffusion [34].
Based on the physical adsorption characteristics of shale gas in nanoscale pores, the International Union of Pure and Applied Chemistry (IUPAC) classified pores into macropores (pore diameter > 50 nm), mesoporous pores (2–50 nm), and micropores (<2 nm) [35]. The free path of gas molecules is much smaller than the pore diameter of macropores, the collision mainly occurs between gas molecules, and the collision frequency between gas molecules and the pore wall is very low. At this time, it is mainly continuous flow [36,37]. With the decrease in pore diameter or gas pressure, the free path of gas molecules will increase. When the free path of gas molecules and pore diameter are of the same scale, the collision frequency between gas molecules and the pore wall increases to a degree that cannot be ignored. In this case, it is slip-off flow, transition flow, or Knudsen diffusion [37,38]. When the pore diameter and the gas molecule diameter are at the same scale, only a single gas molecule is allowed to pass through the pore, and the collision frequency between the gas molecule and the pore wall is large, resulting in configuration diffusion [37,39,40].
When gas molecules are adsorbed by the pore wall, surface diffusion occurs. Surface diffusion is a very complex physical phenomenon, which is the interaction between diffused gas molecules and nanoscale pore walls, and it is affected by the interaction force between diffused gas molecules (such as van der Waals force, electrostatic force, etc.), so factors affecting surface diffusion mainly include pressure, temperature, properties of the nanopore wall, properties of the gas molecules, interactions between the gas molecules and the nanopore wall, etc. [40]. Surface diffusion, an activation process of adsorbed gas molecules, is a continuous process in which diffused particles jump randomly between adsorption sites, and each jump requires a minimum activation energy, which is usually proportional to the adsorption energy of the adsorbed gas molecules and nanoscale pore walls, and passes through an activation transition state [41].
In nanoscale pores, besides free gas transport, there is also adsorbed gas transport on the pore wall. When the free gas is adsorbed by the wall surface, the adsorbed gas migrates under the action of the adsorption potential field. The gas surface transport quantity is the gas quantity of adsorbed gas passing through the unit cross-sectional area within a unit time, as follows [42]:
J s = C s v s
where Cs is the adsorption gas concentration and vs is the migration rate.
In the process of shale gas transmission, when the free path of gas molecules is of the same scale as the nanoscale pore, the collision frequency between the gas molecules and the pore wall is large, the gas is not in thermodynamic equilibrium, and gas slip-off flow occurs. Kn [43] was defined in order to determine whether the hydrodynamic equilibrium was established:
K n = λ d n
where λ is the ratio of the gas mean-free-path, that is, the distance between two collisions of gas molecules, m. dn is the characteristic length of nanopore, m.
As is shown in Figure 3, based on the hydrodynamic balance and gas flow, the gas flow region and the gas molecular flow are divided as follows, according to Kn [44,45,46,47,48]:
(1) When Kn < 0.001, gas intermolecular collision is dominant, gas flow meets the continuity condition, and the N–S equation and Fourier’s law of thermal conductivity apply. This section is a continuum region where the gas molecular migration is continuous flow, which can be expressed by the Hagen–Poiseuille equation, as follows [15]:
J v = ξ mb r 2 P 8 μ g R T d P d l
where Jv is the flow rate of gas continuous flow, mol/(m2·s); r is the pore radius, m; µg is gas viscosity, Pa·s; R is the gas constant, J/(mol·K); T is the formation temperature, K; P is reservoir pressure, Pa; l is the distance of the gas transmission direction, m; ξmb is the correction coefficient of gas flow in the porous medium.
In this case, the gas migration capacity is proportional to the square of the nanoscale pore radius. That is, the gas migration capacity is very sensitive to the pore structure; gas migration capacity is proportional to pressure; since gas viscosity is a function of T1/2, gas migration capacity is proportional to T−3/2, that is, temperature has a significant effect on the gas migration capacity.
(2) When 0.001 < Kn < 0.1, the collision between gas molecules and shale pore wall gradually increases, but the collision frequency between gas molecules is still higher than that between gas molecules and pore wall, and gas molecules have velocity on nanopore wall.
In the calculation, the N–S equation and Fourier’s law of thermal conductivity are usually used in the vast gas area, but the boundary should consider the velocity slip and temperature jump at the junction of the gas and solid. This section is a slip region where the gas molecular migration is slip flow, which can be expressed as [47]:
J vs = ξ mb r 2 P 8 η R T μ g ( 1 + α K n ) ( 1 + 4 K n 1 K b ) d P d l
where Jvs is the rate of slip flow, mol/(m2·s); b is the gas slippage constant, dimensionless; α is the rarefied effect coefficient and has no dimensionality. With the increase in Kn, the slippage effect becomes more obvious and the gas transmission volume increases.
(3) When 0.1 < Kn < 10, the collision frequency between gas molecules is equivalent to the collision frequency between gas molecules and the pore wall surface. This section is a transition region where the gas molecular migration is transitional flow.
(4) When Kn > 10, the collision between gas molecules and pore wall is very frequent so that the collision between gas molecules can be ignored. This section is a free region where gas molecular migration is Knudsen diffusion, which can be expressed as [33]:
J K = 2 3 ξ mb r ( 8 π R T m ) 1 2 d P d l
where JK is the amount of gas in Knudsen diffusion, mol/(m2·s); m is the molar mass of the gas, kg/mol. Knudsen diffusion amount of gas increases as the molecular weight of the gas decreases; Knudsen diffusivity is independent of gas pressure and viscosity; Knudsen diffusion capacity is proportional to T−1/2, that is, Knudsen diffusion capacity is relatively insensitive to temperature.
Free gas in shale nanoscale pores is transported under a pressure gradient or concentration gradient, and the main influencing factors are the pore diameter and gas phase pressure which affects the free path of gas molecules. In a typical shale development process, the pore diameter is 2–1000 nm and the pressure is 1–50 MPa, so Kn is around 0.0002–6 [48]. Kn can be used to determine the transport mechanism of gas molecules in shale nanoscale pores.

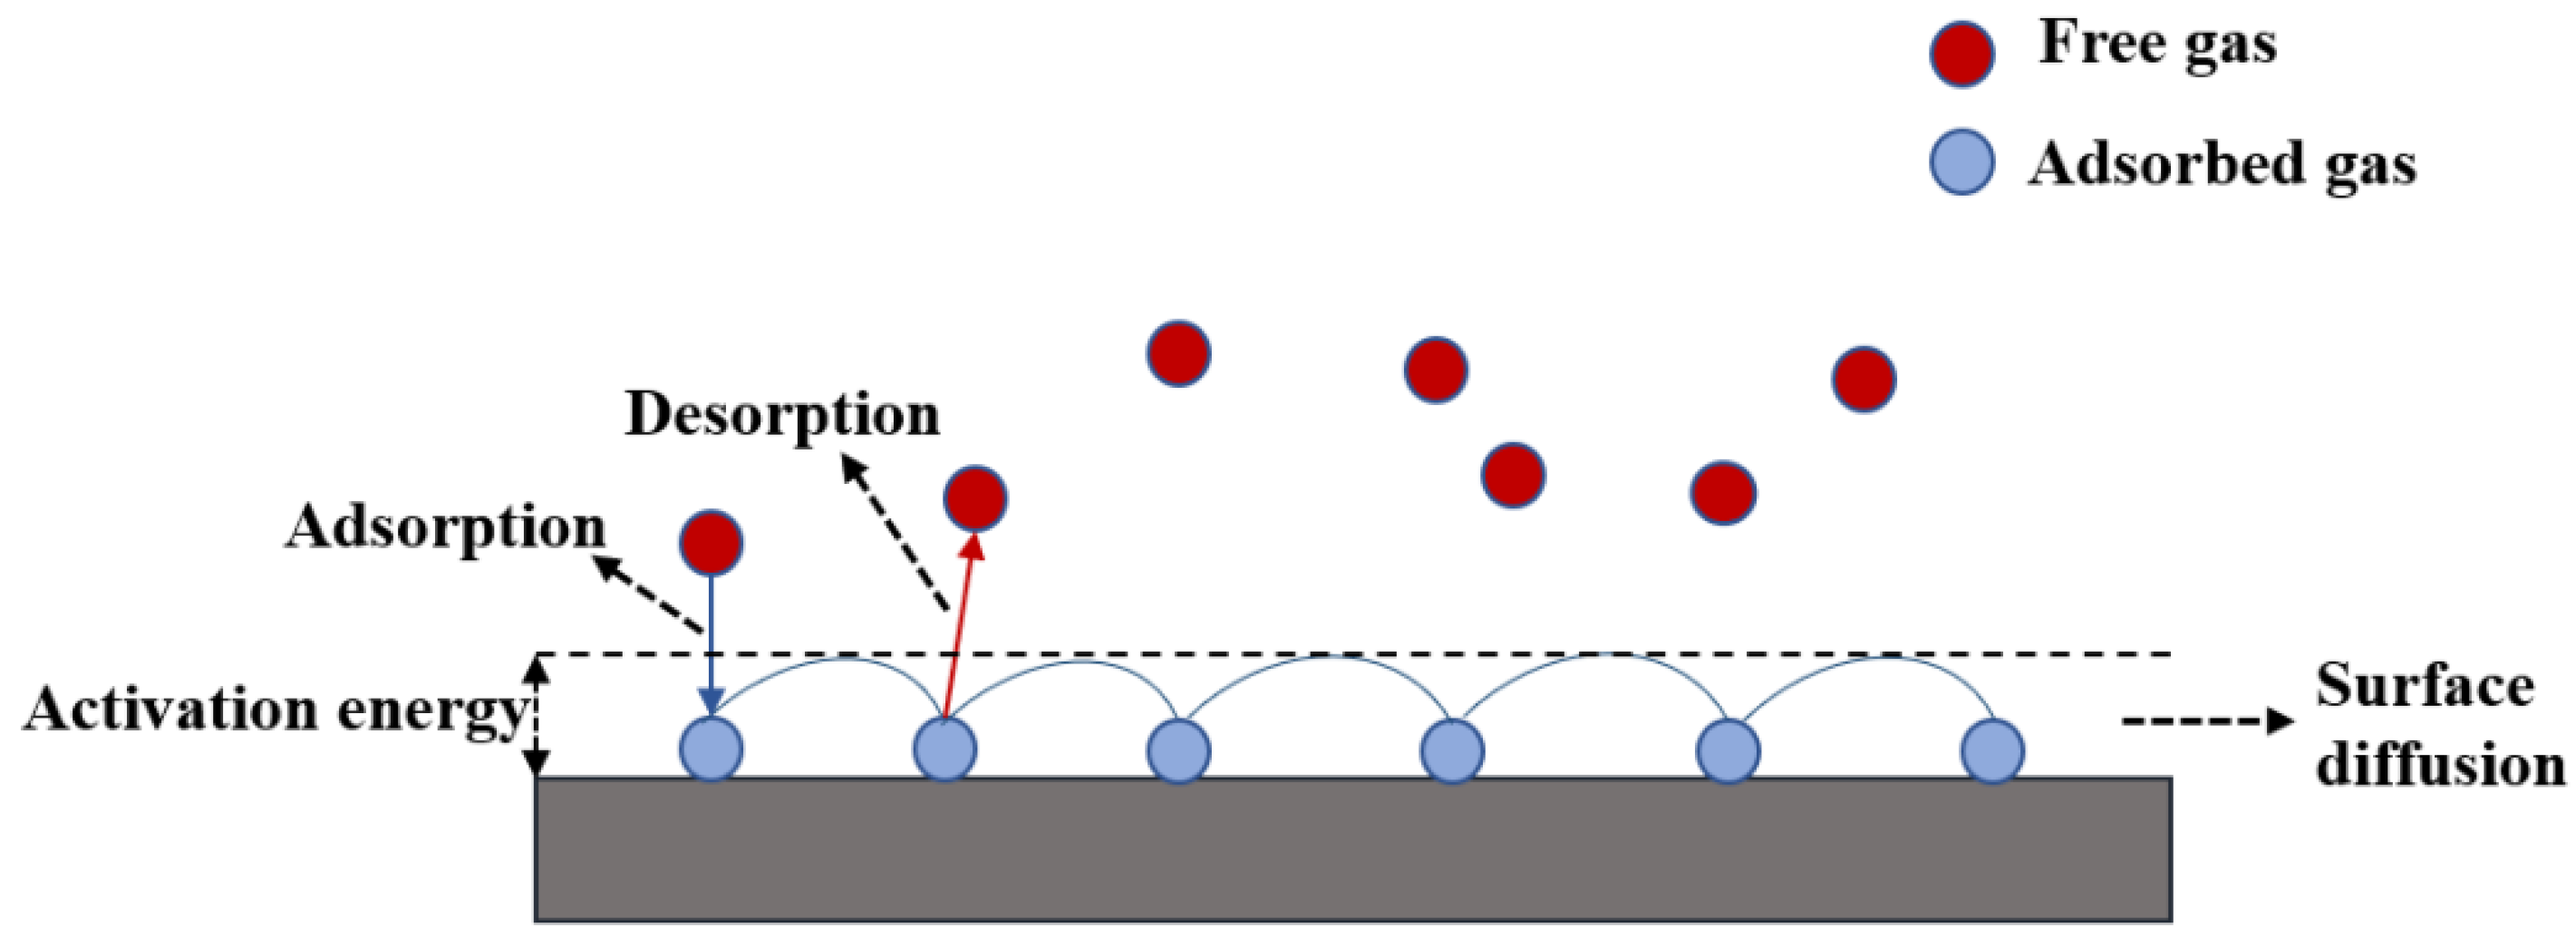
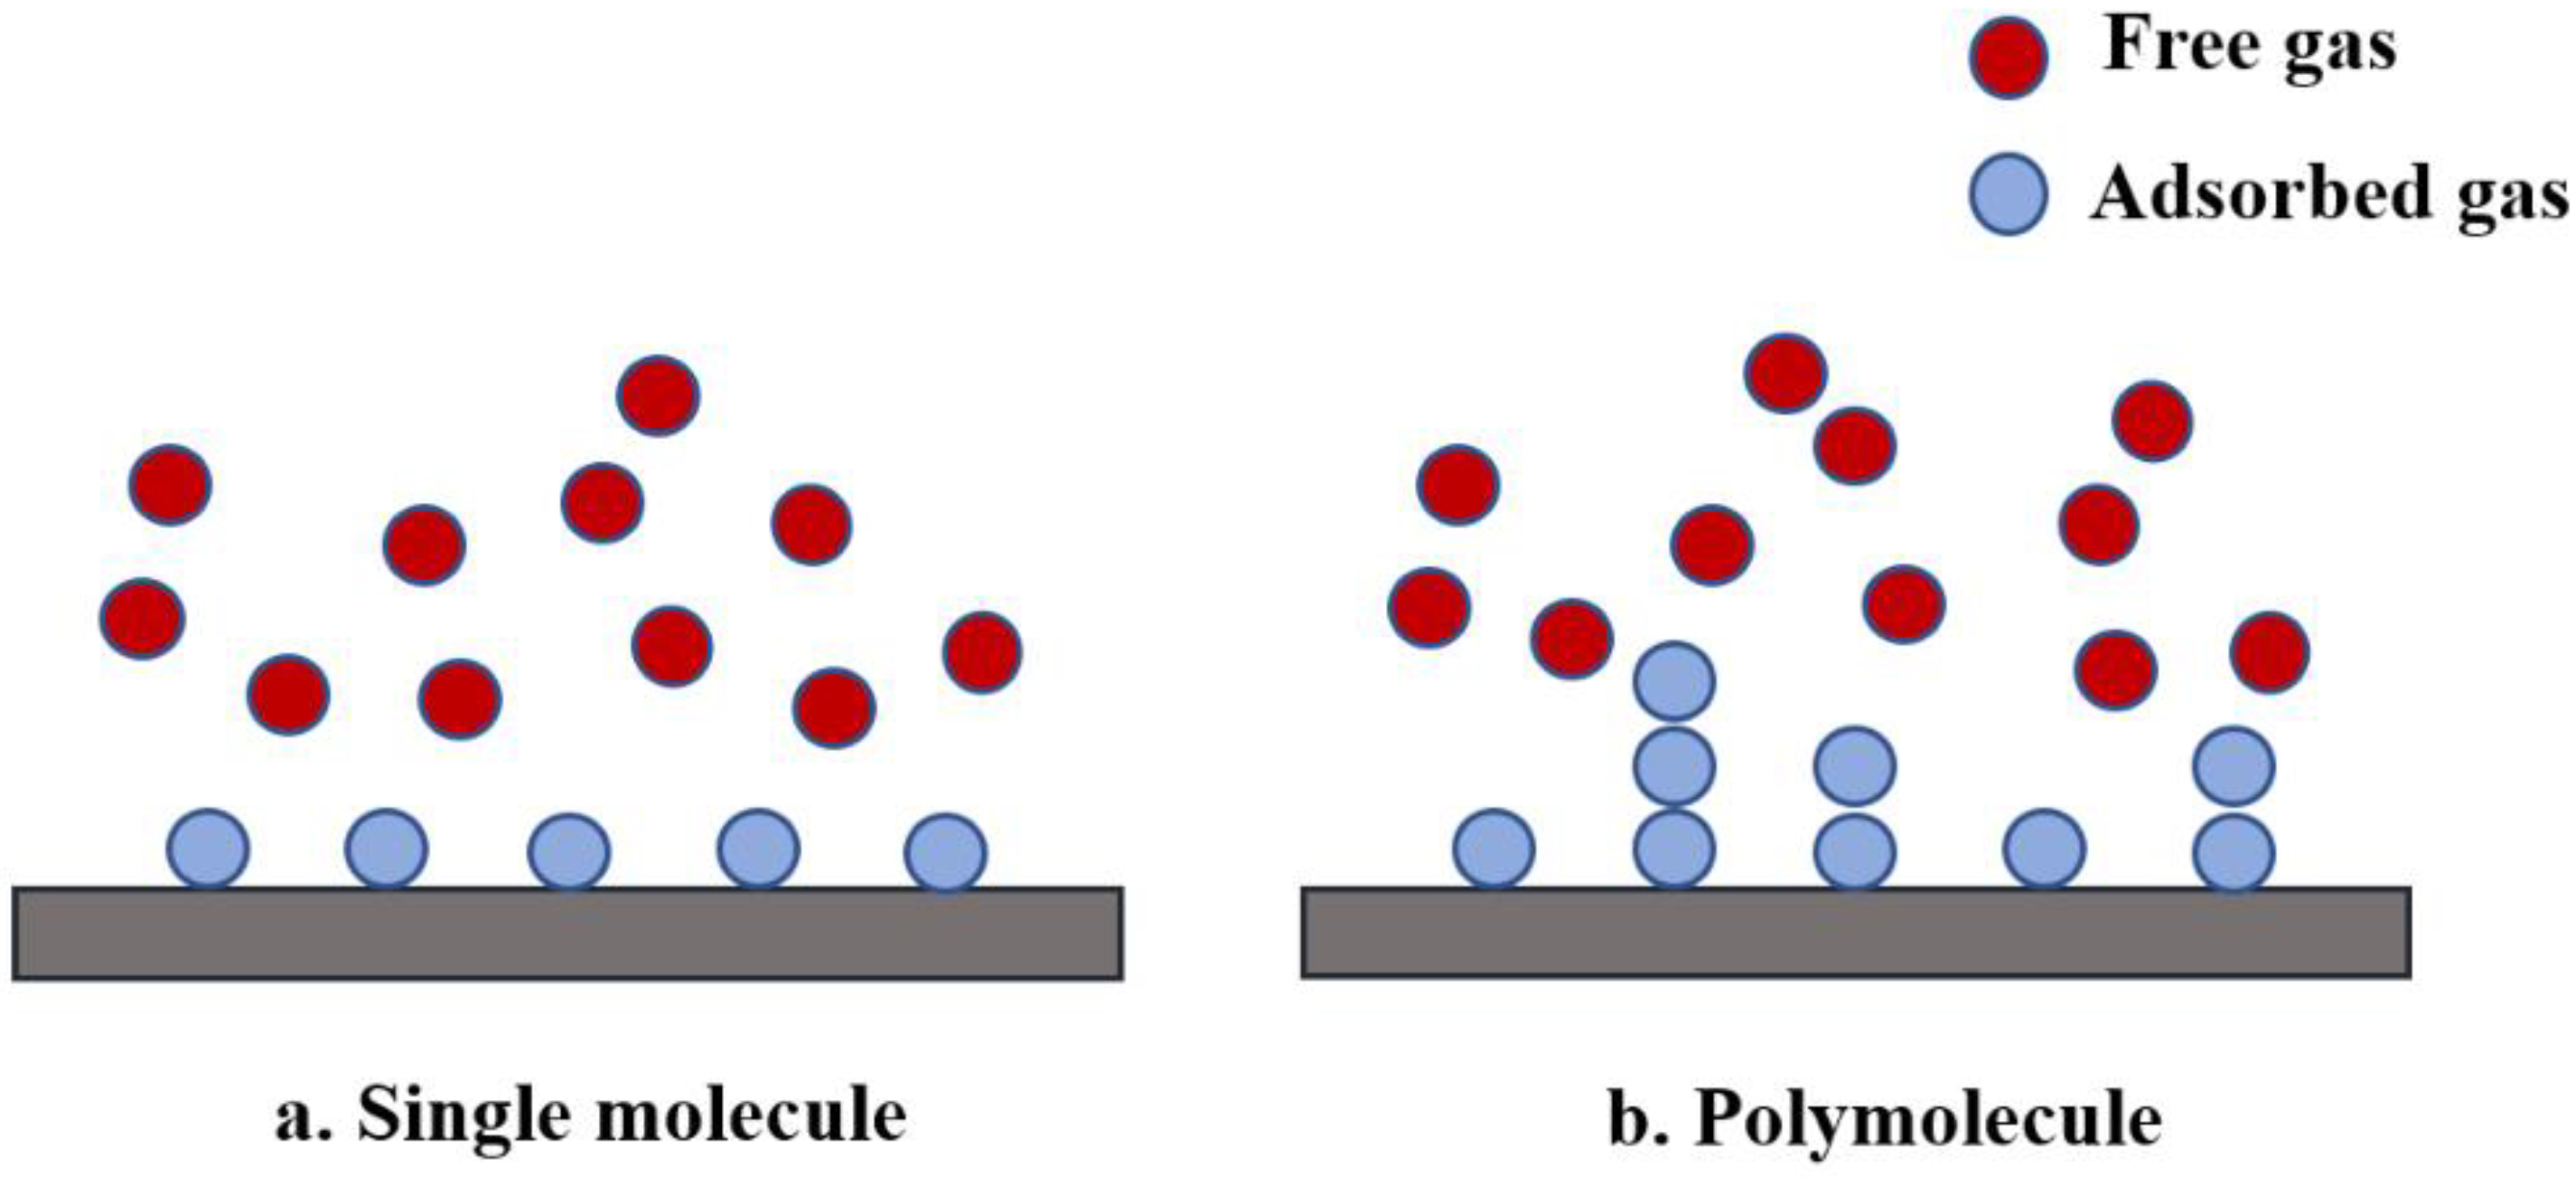
3.2. Adsorption–Desorption Mechanism

Adsorbed gas and free gas coexist in shale condensate gas reservoir, and the adsorption–desorption of gas molecules is an important factor affecting its nonlinear seepage mechanism, as shown in Figure 4. Therefore, understanding the adsorption and desorption mechanism of shale condensate gas reservoir is helpful to make better production plans, so as to improve productivity.
The desorption and adsorption of shale gas is reversible [49]. When the adsorption and desorption of shale condensate gas reservoir are in dynamic equilibrium, the adsorption velocity and desorption velocity are equal. In the process of production, free gas in fractures is constantly extracted, reservoir pressure decreases, and the desorption rate of gas molecules is greater than the adsorption rate, that is, desorption occurs [50].
The specific area of nanoscale pores in shale is large and most of them are oil-wet, which has a strong adsorption effect on gas molecules [39]. The adsorption of shale gas can be divided into physical adsorption and chemical adsorption, and physical adsorption is the main one. The reversible physical adsorption is caused by the van der Waals force between the adsorbed gas and the nanoscale pore wall and the adsorbed gas molecules lose one degree of freedom, so the kinetic energy is converted into the heat related to adsorption and the heat consumed by physical adsorption is less. Chemisorption is irreversible and is adsorbed by ionic bonds, which requires a large energy to open ionic bonds during desorption [15].
The main factors affecting the adsorption capacity of shale are organic matter content, reservoir temperature, formation pressure, shale water content, gas reservoir composition, etc.
Lu and Li [51] discovered that the adsorption capacity of shale samples was approximately linearly related to the total organic matter content, that is, gas dissolution in organic matter was the main mechanism of adsorption gas storage; the adsorbed gas volume decreased with increasing temperature. Yu and Sepchroori [52] showed that the adsorption capacity of CH4 in Barnett shale increases with the increase in pressure. Yuan et al. [53] found that in shale with high water content, the adsorption capacity and diffusion coefficient of gas decreased significantly, that is, the gas storage capacity and gas transport rate of shale were reduced by the presence of water.
Typical gas adsorption models, namely the relationship between adsorption capacity and pressure under isothermal conditions, mainly include the following models [54,55]:
(1) Henry adsorption theory [56,57]
The Henry adsorption formula is as follows:
M = k p
where M is the mass of adsorbed gas on solid per unit mass, p is the equilibrium pressure of gas, and k is a constant. When the pressure is low, the isotherm is close to a straight line, which is in line with Henry adsorption theory.
(2) Freundlich adsorption theory [58]
The Freundlich adsorption formula is as follows:
M = k p n
where n is a constant, which depends on the adsorbent, the type of adsorbent, and the adsorption temperature.
(3) Langmuir adsorption theory [59]
The Langmuir monolayer adsorption formula:
N = a N 0 p 1 + a p
The above formula is more suitable for single-molecule adsorption [60]. As is shown in Figure 5, Molecular layer adsorption model can be divided into single-molecule adsorption and poly molecule adsorption.
Through experiments, Lu and Li [61] proved that Langmuir model could accurately characterize adsorption at a single temperature, but was not applicable to multiple temperatures, while the bi-Langmuir model could accurately characterize the influence of pressure and temperature. Ambrose et al. [62,63] calculated the volume of pore space occupied by free gas and the adsorbed layer based on the Langmuir adsorption model, improved the traditional method, proposed a new algorithm to calculate shale gas geological reserves, and studied the adsorption characteristics of methane in organic matter. The results showed that it was very important to consider the adsorption of multiple components in shale gas reservoir calculation. Multi-component adsorption with the extended Langmuir model was simulated by Yang et al. and the role of multi-component adsorption in the development of Eagle Ford shale condensate reservoir was studied [64]. The adsorption law of pores with different shapes still conformed to the Langmuir single-layer adsorption law was proved by Song et al. [65].
(4) BET adsorption theory:
Brunauer et al. [66] studied the multi-molecular layer adsorption theory, namely the BET adsorption theory. The multi-molecular layer adsorption formula is as follows:
v = v m c p ( p 0 p ) [ 1 + ( c 1 ) ( p / p 0 ) ]
Generally, when p/p0 = 0.05–0.35, the above formula is valid.
Yu et al. [67] conducted methane adsorption experiments on Marcellus shale core samples, and found for the first time that gas adsorption in shale gas reservoirs was characterized by multilayer adsorption, and the experimental results deviated from Langmuir isotherm and matched the BET isotherm. By comparing historical data, it is found that gas adsorption obeying the BET isotherm contributes more to the total recovery than gas adsorption obeying the Langmuir isotherm.
Related studies found that adsorption significantly increased the volume of condensate [68], resulting in fluid accumulation and blockage in the reservoir, and reduction in production output. Therefore, the technology of determining desorption pressure and re-injecting gas into the reservoir to slow down the desorption rate, that is, recycling gas injection to improve oil recovery, has broad research prospects.

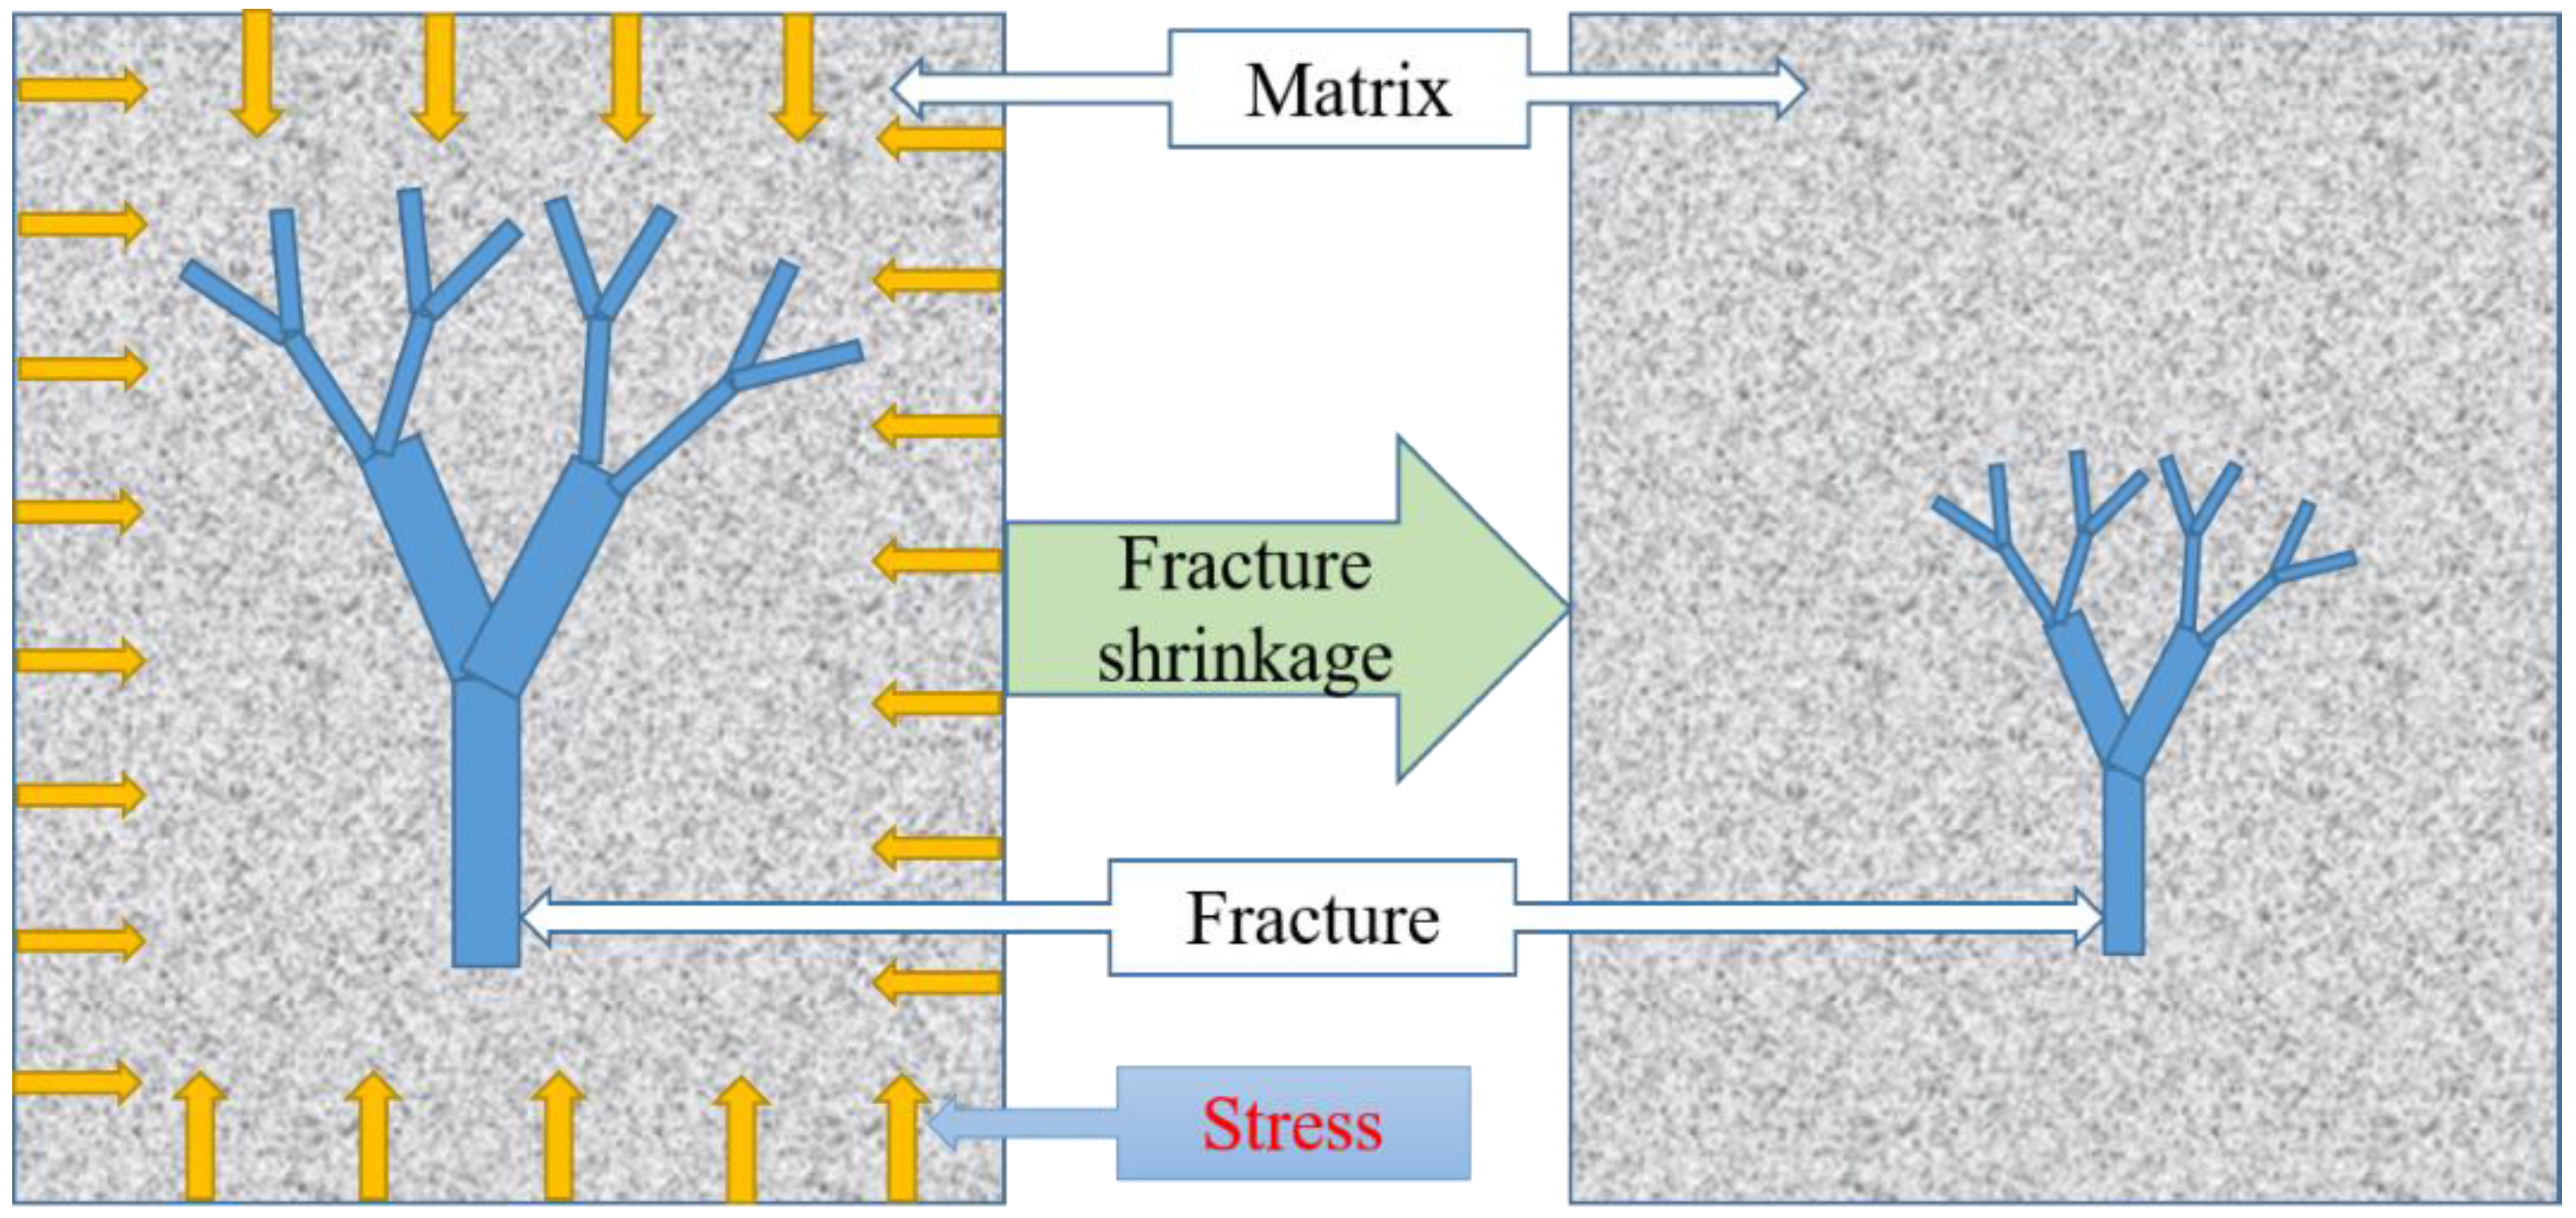
3.3. Strong Stress Sensitivity Characteristics of Shale Matrix and Fracture

The matrix pores of shale gas reservoirs are at the nanometer scale. There are a certain number of micron-sized pores and a large number of microfractures in shale reservoirs. In the process of shale gas production, with the continuous exploitation of shale gas, the pore pressure decreases, and the natural fractures may gradually close, which leads to the decrease in reservoir permeability. It shows strong stress sensitivity characteristics. Not only is there stress sensitivity in the shale matrix, the stress sensitivity in the stimulated reservoir volume (SRV) area is more serious. Stress sensitivity is an important characteristic of shale reservoir, which has a great influence on permeability. The diagram of strong stress sensitivity characteristics of fractures is shown in Figure 6.
At present, some scholars have conducted a series of studies on the strong stress sensitivity of reservoirs. From 2019 to 2022, based on core displacement experiments of fractured shale [69], pressure pulse attenuation experiments [69,70], and triaxial core compression experiments [71], the damage mechanism of stress sensitivity of the reservoir was explored by Xue et al. In addition, in 2019, the effect of stress sensitivity on material permeability under different pressures and gas compositions was explored by Singh et al. [72,73]. From 2019 to 2022, the influence of stress sensitivity coefficients of matrix [74,75], microfractures [74], and hydraulic fractures [74,75] on gas production was analyzed by Liu et al. Based on the above research, stress sensitivity is an important characteristic of shale reservoir, which has a great influence on the permeability field.

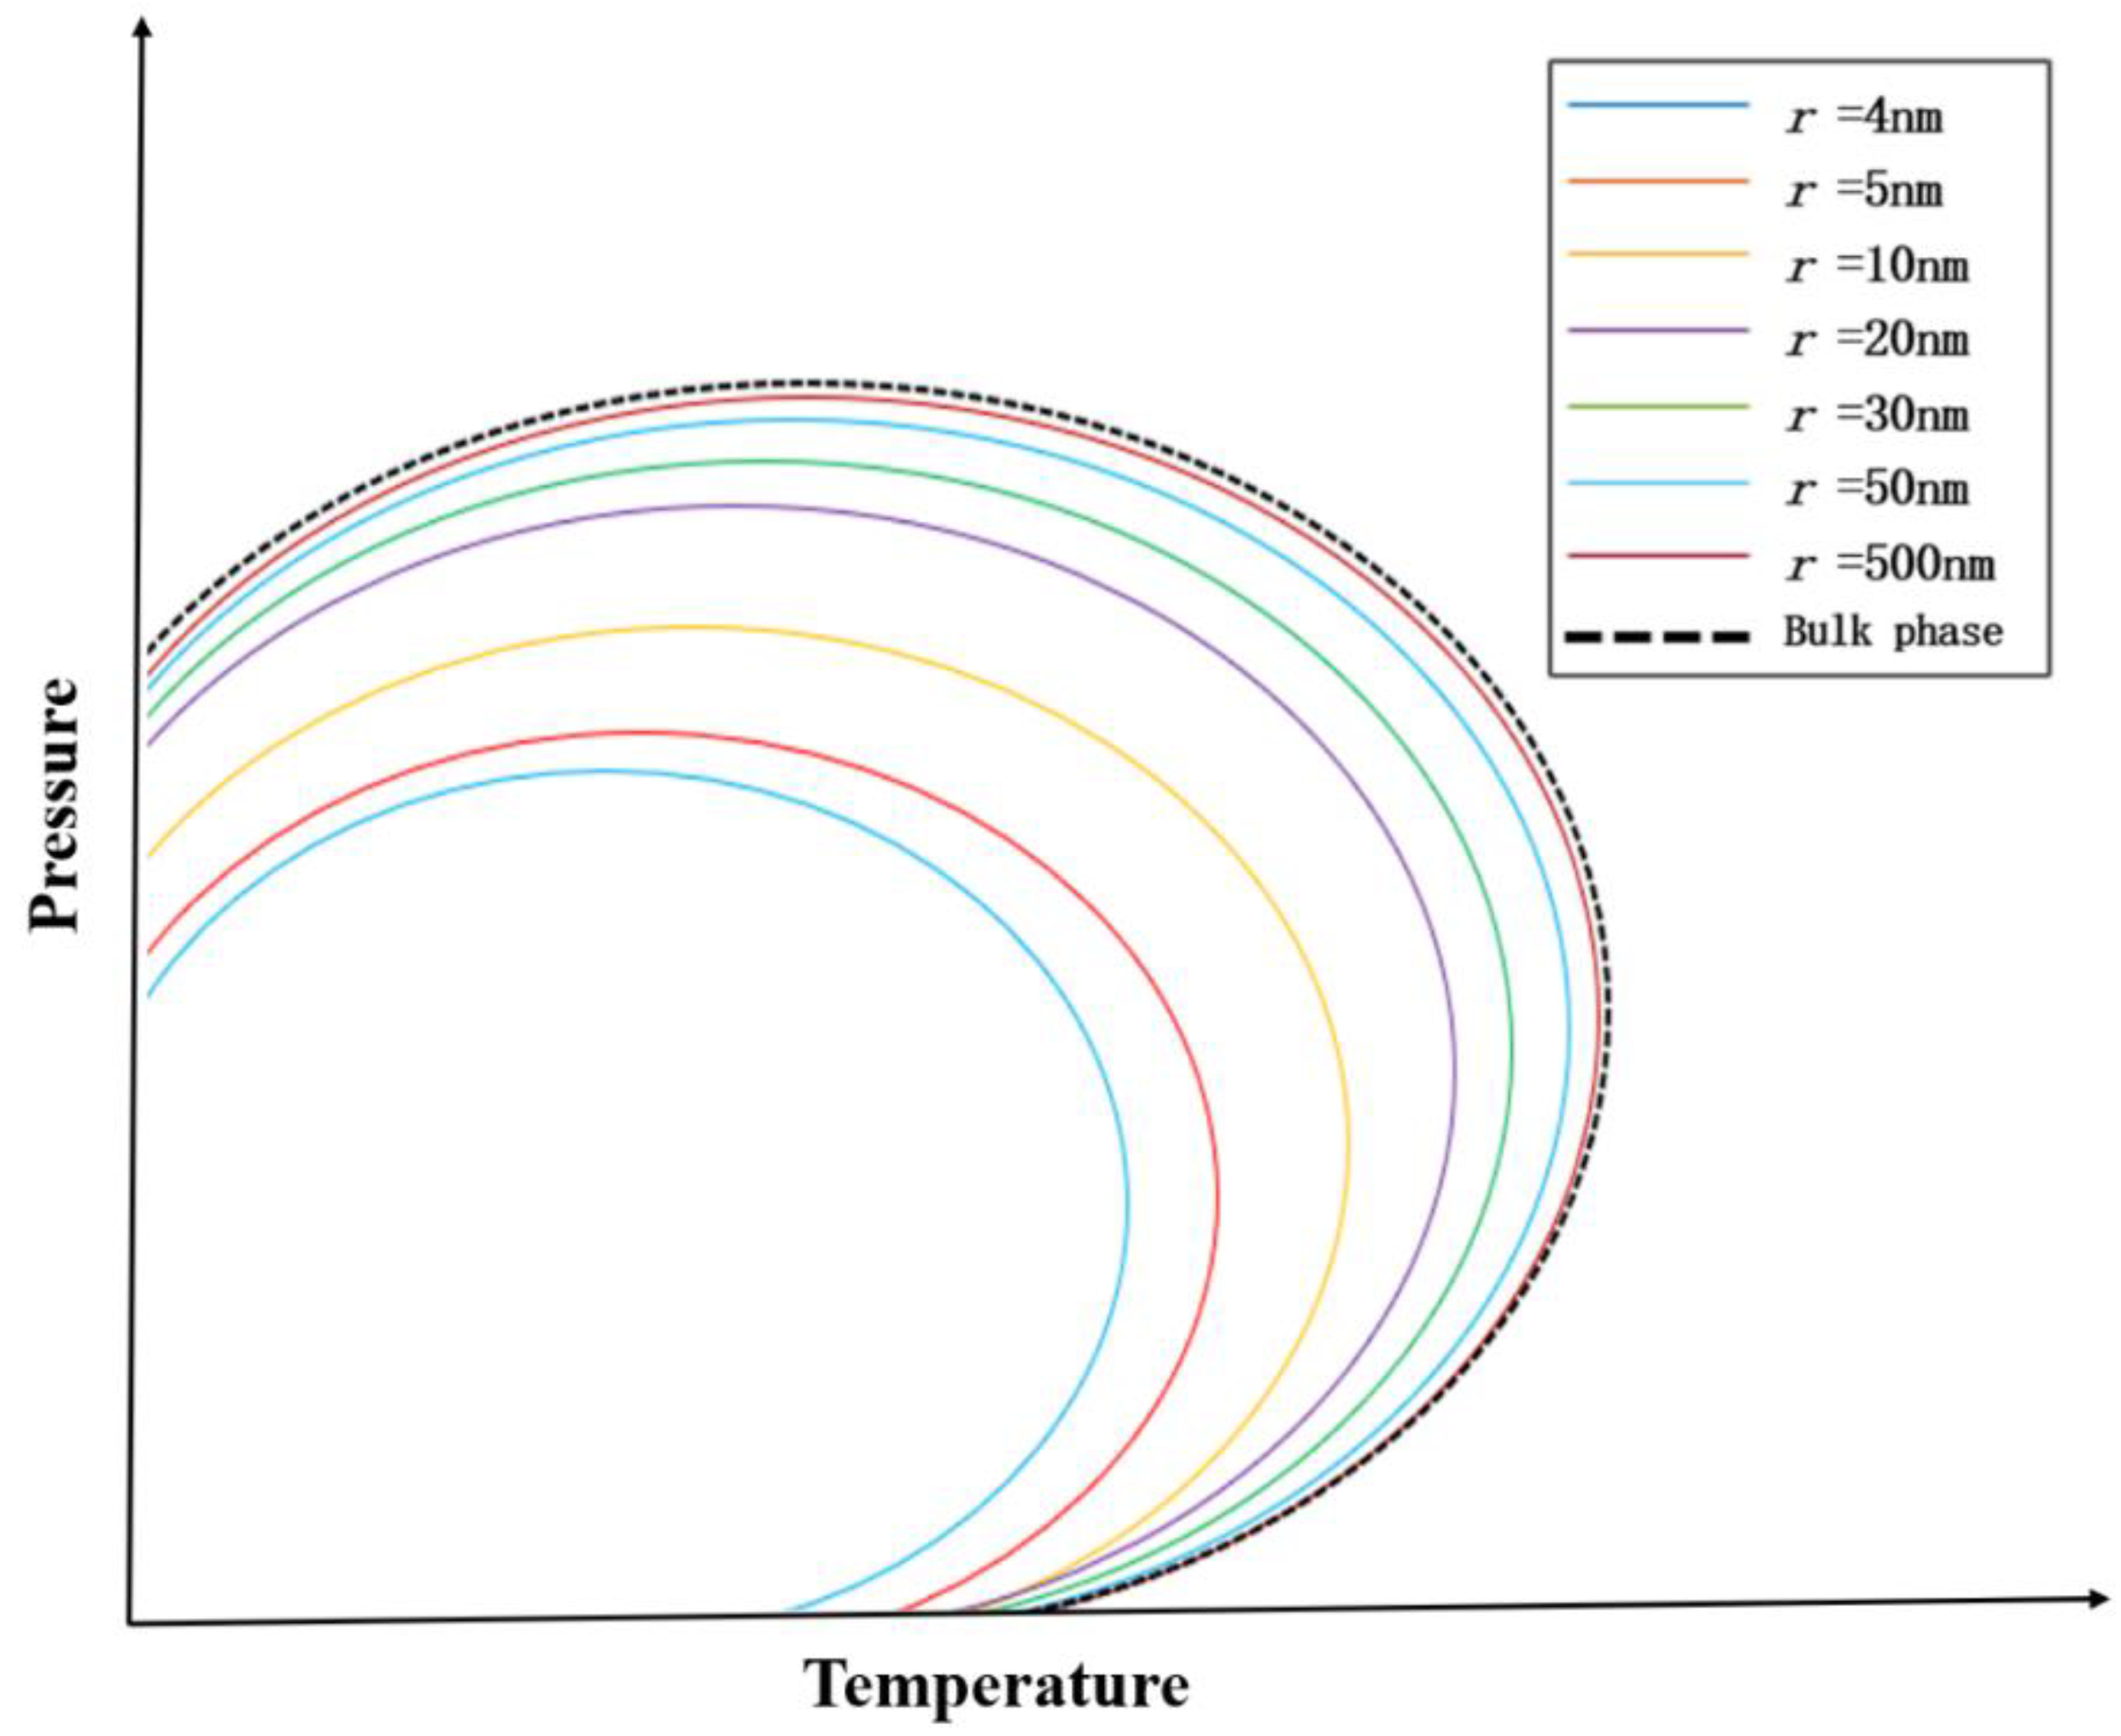
3.4. Special Phase Transition Mechanism of Shale Gas Anomalous Condensation

Compared with conventional reservoirs, the fluid flow in shale is not only complex, but also affected by various transport mechanisms, such as confining phase behavior. Nanopores in shale matrix may lead to significant changes in capillary pressure and critical properties (critical pressure and critical temperature). The phase equilibrium behavior in shale reservoirs may also differ significantly from the bulk fluid phase equilibrium behavior in PVT units [74,75].
Many scholars have begun to study the mechanism of phase transition in nanopores. In 2011, Sapmanee [76] et al. found that when the pores reached the micrometer and nanometer scales, the pore confinement effect would change the fluid properties. Due to the pore confinement effect, the space limitation in the tiny pores would affect the phase behavior, fluid properties and flow behavior of the fluid. In 2012, Du et al. [77] obtained the effect of capillarity on fluid phase balance by studying PVT properties of confined fluid in nanopores. In 2017, Bui and Akkutlu [78] et al. found that the fluid in nanopores changes significantly with the pore size, and the change of capillary pressure and critical properties (critical pressure and critical temperature) in nanopores may have a significant impact on the fluid phase behavior. In 2022, Tian [79] et al. established a tight reservoir relative permeability model in order to study the effect of nano-confinement on relative permeability and reservoir flow, and the results showed that with the decrease of pore size, the effect of nano-confinement on relative permeability became increasingly significant.
Due to the existence of the pore confinement effect, the phase equilibrium of the fluid will also be different. Different from the conventional phase state calculation process, many scholars have proposed phase state calculation methods considering the pore confinement effect. Currently, two parts of the methodology exist to account for nanoconfinement effects, namely, critical property shift and consideration of capillary pressure.
(1) Critical property shift
The critical temperature displacement equation is based on the state equation [80]:
Δ T c = T c T c p T c = 0.9409 σ L J r 0.2415 ( σ L J r p ) 2
Δ P c = P c P c p P c = 0.9409 σ L J r 0.2415 ( σ L J r p ) 2
σ L J = 0.244 T c P c 3
where Tc and Pc are the bulk critical temperature and pressure, Tcp and Pcp are the pore critical temperature and pressure, respectively, the critical pressure and temperature are corrected by the above equations.
(2) Capillary pressure
Due to the large capillary pressure in nanopores and the phase pressure difference when oil and gas phases coexist, capillary pressure should be considered for calculation. The well-known Yang Laplace equation is usually used for capillary pressure in porous media [81]:
P cap = 2 σ cos θ r
where σ is interfacial tension, which is the surface tension between solid and fluid; θ is the contact angle; and r is the radius of the capillary in the porous medium. The interfacial tension [82] can be calculated by the following equation:
σ 1 4 = ρ L x i P c h , i ρ v y i P c h , i
where ρv and ρL are the densities of the gas and liquid phases, respectively, and Pch,i are the parachute model parameters of the liquid or gas phases, which can be obtained by empirical formulas. xi and yi are the molar fractions of gas phase and liquid phase components, which can be obtained by the phase equilibrium calculation method proposed by Yuan Zhang [83] et al. The specific steps are shown in Figure 7.
Through the above calculation process, the phase state diagram can be drawn for different pore diameters, and the phase state diagram considering the pore confinement effect is roughly shown in Figure 8 [84].
Many scholars have undertaken research on phase shift and pore confinement and achieved certain results. In 2011, a simple, fast, and reliable alternative to a similar method in flash calculations was proposed by Yinghui [85], which realized the rapid convergence of phase calculation. In 2017, Brian [86] et al. found that the smaller the pore size, the higher the ratio of the specific surface area of the pore to the volume of the fluid, and the smaller pore can inhibit the gas bubble point. Based on the above characteristics, Brian carried out simulations through the relative permeability model to explain the capillary pressure and the interaction between the fluid and the matrix. In 2017, Arash [87] et al. carried out thermodynamic modeling of fluid reservoirs with different PVT properties considering the effect of pore size, and proposed detailed steps of finding the bubble point line and dew point line. The results showed that the established thermodynamic model could better simulate the PVT properties of shale condensates. In 2018, Liu [74] et al. established a mixed model of condensate gas reservoir by considering the influence of various transport mechanisms, such as the behavior of the pore-confined phase in the shale matrix. They simulated the phase transition under nano-confinement by using the quasi-critical properties in nanopores and introduced the specific calculation process. In 2019, An improved artificial neural network model was proposed by Wang [88] to achieve high-precision phase stability prediction, which not only reduces the computational cost, but also naturally and accurately predicts the saturation pressure, so as to accurately describe the phase behavior of the fluid. In 2020, Bai [89] et al. used the component model considering the limiting phase behavior to simulate the multiphase flow in the reservoir, introduced the capillary pressure into the workflow of the phase stability test and flash calculation, and evaluated the influence of the limiting phase behavior on the production dynamics. The results showed that the limiting phase behavior effect inhibited the gas bubble point pressure, thereby improving the production. In 2021, Chen [90] et al. improved the NPT-GEMC method through molecular simulation technology to study the constraint effect of phase behavior of different component reservoir fluids in multi-scale (nanoscale + macroscale) media. The results show that a large number of recombinant fractions are trapped in the nanopores, resulting in a much lower condensate yield than expected. In 2021, Zhang Tao [91] et al. described the dynamic process of phase equilibrium based on the P–R equation of state, and developed a set of adaptive deep learning algorithms on this basis. The neural network was used for simulation and prediction, which had good accuracy and prediction effect, and could also significantly capture the influence of capillary action. It is a powerful means to predict phase behavior. In 2022, a multi-component hydrocarbon transport model based on a pore network was proposed by Song [92], and elaborated the thermodynamic mechanism of multi-component hydrocarbon transport. On the pore network model, considering the change in the oil–gas capillary pressure with oil saturation, a coupling model of thermodynamic phase equilibrium and fluid occurrence was further established to characterize the phase behavior. In 2022, Kong [84] et al. conducted a large number of studies on the behavior of fluid phase constrained by nanopores in tight shale reservoirs, optimized the equation of state (PR EOS), calculated the behavior of phase constrained by nanopores by changing the key properties of different components, and proposed a characterization method for the behavior of fluid phase in nanopores. In 2022, a calculation process of micro-nano confined space phase was proposed by Wei Bing [93], which took into account the changes in capillary pressure, critical temperature, and critical pressure. Based on the improved EOS equation, the convergence rate of multi-component mixtures was greatly accelerated, and the traditional calculation method was simplified. In 2022, Du [94] et al. considered the influence of molecular adsorption and confinement effects in nanoscale shale pores on fluid phase behavior, and proposed an equation of state considering adsorption to study fluid properties and phase behavior changes during gas injection in condensate gas reservoirs. In 2022, Zhang [95] et al. established a comprehensive thermodynamic model to simulate the shale condensates gas reservoir, which is suitable for bulk fluids and confined fluids. Through experimental simulation, it was shown that capillary interaction and adsorption will lead to an obvious deviation of the phase envelope. In addition, pore geometry also has a significant impact on phase behavior. This model provides useful insights into the phase behavior of nanopores.
In recent years, some scholars have found that CO2 injection will also have an impact on the behavior of the fluid phase. In 2021, a new approach proposed by Zheng [96] is to study the phase behavior of hydrocarbon systems considering nanopore confinement and modify the phase equilibrium calculation. The results show that the decrease in nanopore size leads to a significant difference in the phase envelope, and the confinement of nanopore reduces the bubble point pressure. With the decrease in pore size, the interfacial tension decreases, and the capillary pressure increases significantly. Zhang [97] et al. also found the effect of CO2 injection on the fluid phase balance in nanopore confinement. The results showed that the nanopore confinement effect could not be ignored, and the smaller the pore size, the greater the nanopore confinement effect, and the confinement helped to suppress the bubble point pressure. In 2022, Ruan Hongjiang [98] analyzed the phase characteristics of condensate gas based on the gas–liquid two-phase equilibrium theory through the phase state experiment of CO2 injection. The experimental results showed that with the increase of the proportion of CO2 injection, the phase state of condensate gas reservoir would shift to different degrees, and the parameter yield of condensate gas reservoir could also be effectively improved. According to the research of the above scholars, with the injection of CO2, the phase behavior will shift to different degrees, and unlike the pore limitation mentioned above, the injection of CO2 helps to suppress the bubble point pressure, as shown in Figure 9 [97]. CO2 injection can not only change the phase balance and have a certain impact on the phase behavior of the fluid, but also improve the efficiency of oil and gas flow, evaporation, and condensation flooding. This makes the technology of CO2 injection have great potential to store CO2 to cope with global warming and effectively reduce greenhouse gas emissions, which will have great potential in future oil and gas extraction.

3.5. High-Speed Non-Darcy Flow in Artificial Fractures of Shale Reservoirs

However, in fact, high velocity flow cannot be accurately described by Darcy’s law. When the flow reaches a high velocity or a high Reynolds number, the inertial effect will also become significant. Sometimes an inertial term is added to the Darcy equation, called the Forchheimer term, to explain the nonlinear behavior of pressure difference and velocity data [99]:
P = μ k v + β ρ v 2
where β is non-Darcy flow coefficient, and the parameters depend on reservoir characteristics, including permeability, porosity, channel complexity, or curvature; P is reservoir pressure, MPa; ρ is the density of flowing fluid, kg/m3; k is the permeability of porous media, mD; μ is gas viscosity, Pa·s; v is the gas flow rate, m·s−1.
The microfractures of shale reservoir show Darcy seepage characteristics. In the artificial fracture area of shale, due to the multi-scale pore medium structure and multi-reservoir characteristics of shale reservoir, the shale migration mechanism is very complex, and the flow state of fluid may have high-speed non-Darcy flow. The Darcy equation that only considers viscous flow cannot be described. In order to determine whether the flow of shale gas in artificial fractures belongs to high-speed non-Darcy flow, the Reynolds number obtained by the following formula is usually used as the basis [15]:
R e = 1 1.75 × 10 3.5 v k ρ μ φ 1.5
where Re is the Reynolds number; φ is the porosity of porous media. Through experiments, Zhu et al. [99] found that the flow in artificial fractures outside the critical Reynolds number Re of 0.2–0.3 belongs to high-speed non-Darcy flow.
Some experimental [100] or theoretical [101,102,103] research on high-speed non-Darcy flow has been carried out. In 2018, using a new proposed experimental measurement method of permeability and inertia coefficient of porous media under high-speed non-Darcy flow, the parameters of high-speed non-Darcy flow of polyethylene porous materials were tested by Zhang et al. [100]. From 2019 to 2022, transport phenomena such as high-speed non-Darcy flow during shale gas production were characterized by Chen et al. [101,102,103]. The above research provides a certain reference for the study of high-speed non-Darcy flow of shale gas reservoirs.

3.6. Reservoir Heterogeneity

Compared with conventional gas reservoirs, shale gas reservoirs have completely different reservoir geological, physical, and mechanical properties. The pore structure of shale reservoirs is complex and multi-scale, which is mainly composed of four different types of porous media. Due to the variety of shale gas storage methods and different organic matter content, there are great differences in reservoir properties.
Shale condensate gas reservoirs have the characteristics of a small porosity and low permeability. Reservoir heterogeneity is strong, and natural fractures are generally developed. Due to the differences in the formation environment of different types of organic-rich shale reservoirs, shale reservoirs have multiple vertical heterogeneity, and the lateral permeability of shale reservoirs is also quite different from the vertical permeability. Due to the relatively complex matrix composition of shale reservoirs, the matrix itself has certain heterogeneity. Because bedding and fractures control the shape and spatial distribution of fracturing fractures, with the increase in depth, shale reservoirs have strong heterogeneity and anisotropy in the horizontal direction, which results in the vertical heterogeneity of shale oil and gas reservoirs being significantly stronger than the horizontal heterogeneity. Parameters such as organic matter abundance, porosity, permeability, reservoir fracability, in situ stress, gas content, and absorption ratio change greatly in the vertical direction.
After hydraulic fracturing, the SRV area around main fracture will produce irregular complex network fractures, and the density of microfractures gradually decreases to the surrounding area, which will lead to strong heterogeneity of permeability and porosity in the SRV area around main fracture. The fractal characteristics of the reservoir in the SRV area are more obvious. The diagram of reservoir heterogeneity at the SRV area is shown in Figure 10.
The expression of non-uniform porosity at the SRV area considering stress sensitivity is as follows [104,105]:
φ = φ w i ( y w F / 2 ) D 2 exp ( C φ ( p i p ) )
The expression of non-uniform permeability at the SRV area considering stress sensitivity is as follows [104,106]:
k = k w i ( y w F / 2 ) D θ 1 2 exp ( C k ( p i p ) )
where y is the distance to the main fracture, m; φwi is the initial porosity at y = wF/2; D is the fractal dimension; wF is the width of main fracture, m; kwi is the initial permeability at y = wF/2, mD; θ1 is the fractal index; pi is the initial pressure, MPa; Ck is the permeability compression coefficient, MPa−1; Cφ is the porosity compression coefficient, MPa−1.
At present, a series of experimental [107,108] and theoretical [107,109,110,111,112] studies on reservoir heterogeneity characteristics have been carried out. In 2021, using high-precision high-pressure mercury intrusion (HPMI) experimental technology, the micro/nanopore structure characteristics of shale oil were studied, and based on fractal theory, its heterogeneity was characterized by Xia et al. [107]. In 2022, using computed tomography (CT), the pore distribution of shale at a full scale was characterized by Zhan et al., and the characteristics showed horizontal uniformity and vertical heterogeneity at the macroscale [108]. In addition, in the theoretical research on reservoir heterogeneity characteristics, from 2019 to 2022, based on fractal theory [109,110], the Gaussian distribution function [109], and the lognormal probability density function [111], the distribution of reservoir permeability and seepage law were characterized by Qi et al. In 2019, the expression of the apparent permeability of nanopore gas was also deduced by Liu et al. [15]. The above research provides some guidance for the characterization of reservoir heterogeneity.

3.7. Multiphase Flow

During the production of shale condensate gas reservoirs, the formation pressure keeps dropping. When the bottom hole pressure is lower than the dew point pressure, the condensate will begin to precipitate, and when the local layer pressure is lower than the critical flow pressure, the precipitated condensate will form a continuous phase and begin to flow near the wellbore, and eventually form the seepage state of oil, gas, and water two-phase flow, or even the three-phase flow of oil, gas, and water under water conditions.
Relative permeability data are important basic data in the process of oil and gas reservoir development, which can be widely used in many aspects, such as numerical simulation of oil and gas reservoirs, dynamic analysis of production data, and EUR, so as to evaluate and reasonably adjust production measures and planning [112,113]. The inaccuracy of relative permeability estimation will adversely affect reservoir resource evaluation and development [114].
During reservoir engineering development, oil, water, and gas phases may coexist, and three-phase flow usually occurs when water saturation is higher than residual water saturation and oil and gas are mobile phases [113]. Three-phase relative permeability is required to calculate reservoir dynamic data, under production conditions such as carbon dioxide, burning reservoir, water-gas flooding, steam flooding, micellar injection, nitrogen injection, etc. [113].
The methods of estimating and measuring relative permeability curve directly in laboratory are mainly divided into the steady-state method and the unsteady-state method. The steady-state method is used to measure relative permeability by injecting fluid into porous media with a constant oil–water ratio until saturation and pressure are in equilibrium, and then the saturation, pressure, and flow under this equilibrium state are obtained, and the relative permeability is calculated by Darcy formula [115]. Each measurement point requires the fluid saturation distribution in the rock to reach a stable state, which takes a long time and is not applicable to dense shale [116]. The measurement of relative permeability by the unsteady-state method assumes that the distribution of oil and water saturation in rock samples is a function of time and distance in the process of water flooding, so the relative permeability of two phases can be calculated by measuring the flow rate (or pressure drop) in the process of water flooding with a constant pressure drop (or constant velocity) [115]. It is difficult to measure three-phase flow experimentally. Therefore, the relative permeability curves of oil–water and oil–gas are usually obtained experimentally at home and abroad, and then calculated using the mathematical model proposed by Stone [117,118] in 1970 and 1973 and modified by later generations. As far as we know, it is difficult to directly measure the relative permeability of shale condensate gas reservoir with the existing instruments and equipment, so it is urgent to develop more suitable experimental equipment for shale condensate gas reservoir.
Shale condensate gas reservoirs have a small porosity, a low permeability, and a large capillary force [119], which will have a certain impact on the relative permeability. In 2004, the multiphase permeability under different water saturation and net overburden stress was studied by Shanley et al. and capillary pressure and net overburden stress were analyzed to better understand the relationship between rock structure and gas production [120]. In 2017, the obtained capillary pressure curve was integrated by Brian Stimpson and Maria Barrufet to obtain the relative permeability curve [86]. In 2022, Su et al. [121] improved the traditional JBN method and established a processing method for experimental data of oil–water relative permeability. The results showed that with the increase in capillary force, the relative permeability of the oil phase increased, but the relative permeability of the water phase did not change significantly. In 2022, considering the change in oil and gas capillary pressure with oil saturation, a multi-component hydrocarbon transport model and a coupled thermodynamic phase equilibrium fluid occurrence model in the pore network were established by Song et al. [91] to study the thermodynamic mechanism of multi-component hydrocarbon transport. The results showed that the initial pressure gradient was affected by yield stress and pore size.
Relative permeability is affected by reservoir pressure performance, water saturation, pore size, pore distribution, and pore connectivity. In 2011, Orangi et al. [122] found that reservoir fracturing performance was very sensitive to fracture permeability and matrix relative permeability. In 2017, Ojha et al. [115] found that the relative permeability of water phase decreased sharply with the decrease in water saturation, while the relative permeability of hydrocarbons decreased at a relatively slow and constant rate with the increase in water saturation. However, this method did not consider the effects of relative permeability hysteresis and mixed wettability. In 2020, Li et al. [123] found that the relative permeability curve was mainly affected by pore diameter distribution. The smaller the pore radius was, the stronger the gas migration capacity was, and the larger the relative permeability of the gas phase was. If pore connectivity was known, the flow capacity of shale gas under different humidity and the flow behavior of shale gas in pores could be obtained. In 2022, Tian et al. [79] discovered that the influence of the abnormal viscosity effect on the relative permeability of water and oil phases was related to the average pore radius. With the increase in the slip length of the oil phase, the relative permeability of the water phase decreased, as did the relative permeability of the oil phase. With a more significant contact angle effect, the relative permeability of the water phase increased, but the relative permeability of the oil phase had no obvious change. However, the effect of pore connectivity and fluid distribution was ignored.
It is difficult to measure the phase behavior of multi-hydrocarbon fluids in micro/nanoscale channels by conventional experimental methods. Advanced microfluidic experimental technology can be used to study the characteristics of fluid phase in the nanoscale limited space, which can provide certain data support for unconventional shale gas development engineering technology. In 2021, Song et al. [124] designed a microfluidic experiment and fed the processed experimental data into a deep neural network (DNN) model, which was a deep learning algorithm. The results showed that phase saturation, wetting sequence and pore topology were the key factors affecting the relative permeability of the two phases.
However, as far as we know, with insufficient instruments and equipment, microfluidic technology only stays in the phase visualization stage, because the nanochannel is too narrow to measure some flow parameters, that is, to simulate the dynamic process of fluid flow in the nanopores. In addition, the analysis chip is mostly disposable, and the experimental cost is generally high. At present, the application of microfluidic technology in the phase state research of shale condensate gas reservoirs is just being developed, and a large room for development still exists in the future for the production of more accurate microfluidic chips, equipment upgrading to measure fluid dynamic flow characteristics, and other aspects.

4. Research Status of the Theory, Methods, and Technology of Shale Condensate Gas Reservoir Development

4.1. Theory, Methods, and Technology of Shale Condensate Gas Production Well Dynamic Data Analysis

The production well dynamic data analysis of shale condensate gas reservoir is that according to the production dynamic characteristics of production wells, reservoir engineering methods are used comprehensively to analyze the physical properties of reservoirs and the production decline law of production wells, so as to accurately predict the production capacity of production wells and provide theoretical basis and technical support for rational production allocation and efficient development [125,126]. At present, shale condensate gas production well dynamic data analysis methods are mainly divided into the empirical method, the characteristic curve analysis method, and the artificial intelligence method.

4.1.1. Empirical Method

The common empirical methods for the analysis of production well dynamic data of shale condensate gas reservoir include the Arps decline model, PLE decline model, Duong decline model, GEPD decline model, SEPD decline model, LGM decline model, etc. This kind of method is simple to calculate, but the characteristics of reservoir seepage in shale condensate gas development are not fully considered. It is greatly affected by geography, production mode and other factors, and its reliability is poor.
(1) Arps decline model
Arps decline model does not require the parameters of the reservoir or well test, and can predict and calculate production based on the empirical relationship between production and time. This method is suitable for the analysis of production decline in shale gas condensate wells with constant pressure production and flow reaching the boundary control flow [127,128,129,130]. The Arps decline model can be further divided into exponential decline, hyperbolic decline and harmonic decline. Specific models are as follows:
q t = q i ( 1 + a D i t ) 1 / a
where qi: initial daily output, 104 m3/d; qt: daily output at time t, 104 m3/d; Di: initial decline rate, d−1; t: decline time, d; a: decreasing index, dimensionless. When a = 0, it is exponential decline; when 0 < a < 1, it is hyperbolic decline; when a = 1, it is harmonic decline.
The cumulative output is
Q t = { q i D i ( 1 e D i t ) ,   exponential   decline   q i D i ln ( 1 + D i t ) ,   harmonic   decline q i D i ( 1 a ) [ 1 ( 1 + a D i t ) 1 1 n ] ,   hyperbolic   decline
where Qt is the cumulative output at time t, 104 m3/d. The hyperbolic decline model is the most widely used in shale gas production decline prediction. In practical application, the decline index a often exceeds 1, so it is usually called the generalized hyperbolic decline model.
(2) PLE decline model
Ilk et al. [131] modified the traditional exponential decline model and proposed the PLE decline model considering that the decline rate of shale gas well production would decrease in the later period:
q t = q i exp ( D t D 1 c t c )
where a is the time index, dimensionless; D is the decline rate at infinite time, d−1; D1 is the first-day decline rate, d−1. This method is suitable for shale gas condensate production wells with a constant pressure production (or close to constant pressure production), and the flow is in the linear flow, bilinear flow, or transition flow before boundary control flow.
(3) Duong decline model
Based on the characteristics of linear fracture flow in shale condensate gas production wells during long-term production, Duong [132] proposed a new decline model for production decline after fracturing of tight gas wells:
q = q 1 t n
After separating variables and integrating, the cumulative output can be written as
G p = q 1 t 1 d 1 d
where q1 is the first-day tight gas well production; d is the fracture flow index, for linear flow, d = 1/2, for bilinear flow, d = 1/4. This method is suitable for shale gas condensate production wells with constant pressure production (or close to constant pressure production), and the flow is in the linear flow or bilinear flow. The Duong decline model is more suitable for the early production decline of production wells [133] and it is easily affected by the fluctuation of production data and prone to multiple solutions [134].
(3) GEPD decline model
In 2021, the GEPD decline model proposed by Chen is [135]
q = q i exp ( t δ / c )
where δ is the universal exponent, 0 < δ < 1; when t = 0, q = qi, and q is the initial theoretical production of the well.
The well controlled production can be derived as follows:
G p = q i c 1 / δ δ Γ ( 1 δ )
In 2021, Chen [135] used two production decline models to evaluate shale gas well production, and found that the GEPD decline model was closer to the reality than the hyperbolic decline model.
Most typical production decline models of shale condensate gas reservoirs are fitted to production data, and different parameters have different effects on production data, so parameter determination is particularly critical. In the actual development process, the flow of shale condensate gas reservoir has different stages, but the empirical method only uses a single function to predict the output of the whole production process, which has large errors and lacks rigor.

4.1.2. Characteristic Curve Analysis Method

The characteristic curve analysis method is to use the known production data to carry out inversion and fitting, so as to predict the productivity more accurately. However, the characteristic curve analysis method is related to the production mode and stage of gas reservoir, which has higher requirements for the selection of seepage model and should consider complex effects. Therefore, the selection of the seepage mathematical model is particularly important.
In 2017, considering the characteristics of fluid phase transition and fracture network during development, using a trilinear flow model to characterize SRV and a Langmuir isothermal adsorption model to characterize the adsorption–desorption of gas, a production well productivity prediction model for shale condensate gas reservoirs was established by Wu et al. [136]. In 2019, considering the half-length of hydraulic fractures, the number of fractures, fracture spacing, and the adsorption–desorption mechanism of gas molecules, the semi-analytical solution of the production decline curve under variable pressure was obtained by Lu et al. [137]. In 2020, Zhang and Meybodi [138] clarified the fracture properties of a multi-fractured horizontal well (MFHW) by iteratively calculating fracture volume, permeability, fracture compressibility, and permeability modulus, and hydraulic fracture dynamics was determined by analyzing flowback data and long-term production data. In 2020, based on the pressure transient analysis (PTA) and rate transient analysis (RTA) of production data of shale gas condensate reservoirs, a semi-analytical mathematical model for multi-stage hydraulically fractured wells (MHFW) of shale condensate gas reservoirs was established by Dahim et al. [139]. According to the rich gas production of MHFW, the type curves of RTA and PTA were drawn. The effects of the horizontal well length, controls of linear and elliptical flows, the number of multi-fractures, and other factors on pseudo pressure and yield data were studied. In 2021, Luo et al. [140] used the source function method to discretized fractures, superimposed the hydraulic fracture model, and coupled the two models to obtain the unsteady seepage flow and productivity model of MFHW in shale gas reservoirs. They then analyzed the influences of fracture conductivity, fracture half-length, fracture spacing, skin factor, reservoir ratio, and leakage coefficient on productivity. In 2021, a new RTA was developed by Ren and Lau [141] to analyze shale gas production data by establishing trilinear flow models and simplifying equations to characterize bilinear and linear flow states. In 2021, considering the distribution of kerogen and the complex migration mechanism of gas, a production analysis model for shale gas reservoirs was established by Zeng et al. [142] to evaluate production. In 2023, a production prediction method for shale condensate gas reservoir based on the convolution equation was proposed by Wang et al. [143], which was applied to predict the dynamic production of horizontal wells in Duvernay shale condensate gas reservoir. Compared with the production decline analysis method in HIS Harmony RTA, this method has a better fitting effect and a higher accuracy in predicting EUR.
The analysis of dynamic production data of oil and gas reservoirs by the characteristic curve analysis method is usually based on some linear assumptions, but the production principle of shale condensate gas reservoirs is characterized by complexity and nonlinearity. Therefore, nonlinear problems should be considered more carefully when applying this method to dynamic data analysis, and the linearization solution of nonlinear problems should be further studied. Therefore, the applicability of this method in the field of production dynamic data analysis of shale condensate gas reservoir needs to be further improved.

4.1.3. Artificial Intelligence Method

In practical engineering, artificial intelligence technology plays an important role in analyzing complex dynamic production data and accurately predicting output.
In 2017, according to the characteristics of reservoir reconstruction data, an adaptive threshold denoising production prediction model was proposed based on a BP neural network nonlinear prediction algorithm by Zhu et al. [144]. In 2017, a principal component analysis method was proposed to analyze Eagle Ford production data to predict production by Khanal et al. [145]. In 2021, a machine learning model was established to predict the five-year cumulative production curve of MHFW by Chaikine and Gates [146]. In 2021, a machine learning method was used to analyze the production data of Duvernay shale condensate gas reservoir and Kong et al. [147] found that the important factors affecting cumulative production in the first 12 months were percentage, condensate/gas ratio (CGR), completion length, fracturing fluid volume/length, and reservoir pressure. Furthermore, CGR is also the most important factor affecting long-term production. In 2021, based on the deep learning algorithm, the EUR evaluation method for shale gas wells was designed by Liu et al. [148]. In 2022, based on the machine learning model, a production prediction model was established by Bhattacharyya and Vyas [149]. The Eagle Ford production data was analyzed so that the production decline curve and EUR were predicted. Comparing the results with the actual data, it was found that the machine learning model could simulate the reservoir well. In 2022, based on machine learning methods, Hui et al. [150] estimated that the main factors affecting unconventional shale gas production were production metrics, formation pressure, effective porosity, total organic carbon, gas saturation, and shale thickness.
The production data analysis method based on artificial intelligence can process complex data with large amount of information and quantify the influence of multiple factors on productivity. In application, a certain amount of basic data is required as learning samples. However, the existent production dynamic data of shale condensate gas reservoirs are relatively limited in comparison with conventional reservoirs, so physical constraints for the development of shale condensate gas reservoirs should be added to improve the accuracy of prediction results when applying the artificial intelligence method to productivity prediction.

4.2. Theory, Method, and Technology of Numerical Simulation of the Shale Condensate Gas Reservoir

Numerical simulation of shale condensate gas reservoir is where an established model or commercial software is used to simulate the complex phase change and flow state of multi-components in the production process of shale condensate gas reservoir, to understand the characteristics of fluid flow and the main control factors affecting production well output, so as to provide a theoretical basis and technical scheme for production practice.
When modeling is used for simulation, the fluid–structure coupling model is usually established based on the characteristics of reservoir containing multi-scale pores and fractures and the characteristics of fluid multi-component and multi-phase state. Typical fluid–structure coupling models mainly include the equivalent continuum model, dual medium fluid–structure coupling model, discrete fracture model, etc. [151]. The equivalent continuum model is to characterize fractures based on equivalent mechanics, treat the reservoir as a continuum, and then analyze it further based on continuum theory. This model is relatively simple and has large errors; the material exchange between fractures and matrix rocks is considered, but the anisotropy of matrix is ignored, so it is more suitable for the spatial scale across small fractured matrix; the development of discrete fracture model is relatively mature [151]. The embedded discrete fracture model is a branch of the discrete fracture model, which can simulate the complex fracture matrix and does not require mesh encryption near the fracture as the discrete fracture model does, thus running faster [152]. In addition, some scholars [153] proposed to establish a hybrid model, that is, to establish a single porous medium model, a dual medium model, and an embedded discrete fracture model, respectively, to simulate the unmodified fracturing area, the reformed fracturing area, and the hydraulic fracture, and to establish a seepage model to simulate fluid flow.
Many scholars have carried out a series of research on the numerical simulation of shale condensate gas reservoir. In 2014, Haghshenas et al. [68] established a heterogeneous reservoir model and used commercial software CMG to study the effects of heavy hydrocarbon component desorption, pore structure and connectivity, fluid composition, and flowing bottom pressure on production. In 2015, the method of numerical analysis was used by Wan et al. to analyze experimental data of cyclic nitrogen injection, and the results showed that molecular diffusion played an important role in the process of oil extraction, and cyclic injection technology could significantly improve production [154]. In 2016, considering multicomponent apparent permeability, adsorption, and molecular diffusion, the shale gas condensate reservoir model was established, an equation of the state model was used to simulate the complex phase changes of the fluid, and the effects of capillary pressure and multi-component mechanism on the production were studied by Jiang and Younis [4]. It was also found that CO2 huff-n-puff could significantly improve the hydrocarbon recovery. In 2018, Wan and Mu [3] numerically simulated the effect of cyclic CO2 injection under nanopore effect on production well recovery in an Eagle Ford shale condensate gas reservoir. In 2018, Pankaj et al. [155] used a complex hydraulic fracture model to simulate the whole wellbore and found that cyclic CO2 injection could significantly improve the oil recovery by numerical simulation. In 2019, Liu et al. [74] developed a hybrid model of the composition and migration mechanism of fluid flow in condensate gas reservoirs, and microfractures and hydraulic fractures are conducted by the multiple interacting continua model and the embedded discretized fracture model. Based on this model, the effect of gas migration mechanism on the production of multistage fractured horizontal wells was analyzed. The results showed that Knudsen diffusion mainly occurred when simulated reservoir volume was absent and matrix permeability was very low. The adsorption effect was mainly related to the reservoir pressure level. In 2021, Jing et al. [156] established a reservoir model of MFHW, used an equation of state model to simulate the flow state of Duvernay shale condensate, and quantified the effects of the nanoconfinement effect, adsorption, and molecular diffusion on production. It was found that recovery could be improved by adjusting production–injection ratios. In 2022, an RTA-assisted numerical history-matching technique, which could improve the accuracy of numerical simulation of shale condensate gas reservoirs, was proposed by Hamdi et al. [157]. The calibrated model could be used to optimize oil production technology.
When numerical simulation is used to simulate the oil–gas–water phase characteristics of shale condensate gas reservoir, much more formation and fluid parameters of shale condensate gas reservoir (such as relative permeability, multi-scale flow characteristics, heterogeneity of shale, etc.) are involved and are also difficult to estimate. As a result, there will be great uncertainties in the history fitting process for the numerical simulation. It is suggested that the experimental ability to test the formation and fluid parameters of shale condensate gas reservoir should be emphasized in future research, which can largely help to more accurately describe the characteristics of complicated flow progress and provide strong support for numerical simulation technology.

5. Summary and Prospect

In this paper, the reservoir characteristics, resource distribution, and development mode of shale condensate gas reservoir are summarized, as well as the research progress of seepage law and development technology of shale condensate gas reservoir at home and abroad in recent years. The following conclusions are drawn:
(1)
The permeability and porosity of shale condensate gas reservoir are very low, and the recoverable reserves are very rich, which has a considerable development prospect. The combination of large-scale hydraulic fracturing and horizontal wells, and controlled pressure production through the injection of gas (such as CO2, N2, flue gas, etc.) during production, have greatly increased the production of shale condensate gas reservoirs while achieving carbon sequestration. Theories related to CCUS are still at the early stage of development in the development of shale gas reservoirs.
(2)
Compared with common reservoirs, the seepage law of shale condensate gas reservoir is more complicated: the migration mechanism of shale gas is related to pore diameter, temperature, pressure, gas molecular properties, and other factors. There is adsorption and desorption in the process of migration of shale condensate gas reservoir; during the production process, pore pressure decreases, natural fractures gradually close, and reservoir permeability decreases, showing strong stress sensitivity; the decrease in reservoir pressure leads to abnormal condensate around the gas well during development; in the artificial fracture area of shale, the migration mechanism of shale is very complicated due to the characteristics of multi-scale pore medium structure and multi-reservoir mode, and the fluid flow state may be high-speed non-Darcy flow; shale reservoir has complex heterogeneous characteristics; in the production process of shale condensate gas reservoir, when the formation pressure is lower than the dew point pressure, the condensate will start to precipitate, and when the formation pressure is lower than the critical flow pressure, the condensate will form continuous phases and start to flow near the wellbore, and eventually form a multiphase flow.
(3)
The dynamic data analysis method of production wells in shale condensate gas reservoirs predicts productivity by analyzing the physical properties of oil and gas reservoirs and the production decline law of production wells. Among them, the empirical method is simple to calculate, but it is greatly affected by geography, mining mode and other factors, and its reliability is poor. The characteristic curve analysis method is more widely used in engineering and has strong reliability, but it depends on the selection of seepage model. In addition, the linear solution of nonlinear problems should be studied to improve its applicability when it is applied to shale condensate gas reservoirs involving very complicated seepage law. Artificial intelligence method can process complex data and determine the influence degree of different influencing factors, and it has high prediction accuracy and needs certain basic data as support. However, the existing production data of shale condensate gas reservoirs are relatively limited in comparison with conventional reservoirs, so it is necessary to add physical constraints to improve the accuracy of production prediction.
(4)
Mastering the complex seepage law involved in shale condensate gas reservoir development by designing new experiments so as to obtain more accurate data, establishing efficient shale gas reservoir development simulation technology (productivity prediction based on the analysis of dynamic production data, numerical simulation of oil, and gas reservoirs, the injection of CO2, N2, or flue gas to enhance oil and gas recovery, etc.), understanding the main controlling factors that affect fluid flow and production, and accurately predicting the production performance of production wells are conducive to an efficient development and improvement of economic benefits.

Author Contributions

Conceptualization, W.L.; methodology, W.L. and C.Q.; investigation, Y.Y., C.Q., C.L. and B.L.; data curation, Y.Y., C.Q., C.L. and B.L.; writing—original draft preparation, Y.Y., C.Q., C.L. and B.L.; writing—review and editing, W.L. and Q.Y.; supervision, W.L.; funding acquisition, W.L. and Q.Y. All authors have read and agreed to the published version of the manuscript.

Funding

W.L. thanks the financial support from the CNPC Innovation Found (Grant No. 2021DQ02-0901). Additionally, Q.Y. thanks the financial support from the Matejek Family Faculty Fellowship.

Data Availability Statement

No new data were created or analyzed in this study. Data sharing is not applicable to this article.

Conflicts of Interest

The authors declare no conflict of interest.

Notation Annotation

JsGas surface transport quantity
CsAdsorption gas concentration
vsMigration rate
KnKnudsen number
λRatio of the gas mean-free-path
dnCharacteristic length of nanopore
JvFlow rate of gas continuous flow
rPore radius
µgGas viscosity
RGas constant
TReservoir temperature
PReservoir pressure
lDistance of gas transmission direction
ξmbCorrection coefficient of gas flow in porous medium
JvsRate of slip flow
bGas slippage constant
αRarefied effect coefficient
JKKnudsen diffusion amount of gas
mMolar mass of the gas
MMass of adsorbed gas on solid per unit mass
pEquilibrium pressure
TcBulk critical temperature
PcBulk critical pressure
TcpPore critical temperature
PcpPore critical pressure
σLJL-J size parameter
σInterfacial tension
θContact angle
rRadius of the capillary in the porous medium
ρvDensities of the gas phases
ρLDensities of the liquid phases
Pch, iParachute model parameters of the liquid or gas phases
xiMolar fractions of gas phase components
yiMolar fractions of liquid phase components
ΔTcRelative critical temperature change
ΔPcRelative critical pressure change
PLLiquid phase pressure
PvGas phase pressure
PcapCapillary pressure
KiEquilibrium constant of component i
ziMole fraction of component i in the total hydrocarbon mixture
nAmount of total substance in the hydrocarbon mixture
nLAmount of total substance in the liquid phase
nVAmount of total substance in the gas phase
KijBinary coefficient
βNon-Darcy flow coefficient
kPermeability of porous media
μGas viscosity
vGas flow rate
ReReynolds number
yDistance to the main fracture
φwiInitial porosity
DFractal dimension
wFWidth of main fracture
kwiInitial permeability
θ1Fractal index
piInitial pressure
CkPermeability compression coefficient
CφPorosity compression coefficient
qiInitial daily output
qtDaily output at time t
DiInitial decline rate
tDecline time
nDecreasing index
cTime index
DDecline rate at infinite time
D1First-day decline rate
q1First-day tight gas well production
dFracture flow index
δUniversal exponent

References

  1. Chen, L.; Bai, Y.H.; Xu, B.X.; Li, Y.Z.; Dong, Z.Q. Numerical simulation method of shale condensate gas reservoir and its application in Eagle Ford. In Proceedings of the 31st National Natural Gas Annual Conference (2019) (03 Unconventional Gas Reservoirs), Hefei, China, 30 October 2019; pp. 557–572. [Google Scholar]
  2. Nagarajan, N.R.; Orangi, A. Condensate Blocking and Mitigation in Liquid-Rich Shale Reservoirs: An Integrated PVT Modeling and Simulation Evaluation. In Proceedings of the Unconventional Resources Technology Conference, Houston, TX, USA, 23–25 July 2018. [Google Scholar]
  3. Wan, T.; Mu, Z.J. The use of numerical simulation to investigate the enhanced Eagle Ford shale gas condensate well recovery using cyclic CO2 injection method with nano-pore effect. Fuel 2018, 233, 123–132. [Google Scholar] [CrossRef]
  4. Jiang, J.; Younis, R.M. Compositional modeling of enhanced hydrocarbons recovery for fractured shale gas-condensate reservoirs with the effects of capillary pressure and multicomponent mechanisms. J. Nat. Gas Sci. Eng. 2016, 34, 1262–1275. [Google Scholar] [CrossRef]
  5. Hill, D.G.; Nelson, C.R. Gas productive fractured shales: An overview and update. Gas Tips 2000, 6, 4–13. [Google Scholar]
  6. Zou, C.N.; Dong, D.Z.; Wang, S.J.; Li, J.Z.; Li, X.J.; Wang, Y.M.; Li, D.; Cheng, K.M. Geological characteristics, formation mechanism and resource potential of shale gas in China. Pet. Explor. Dev. 2010, 37, 641–653. [Google Scholar] [CrossRef]
  7. Qiu, H.; Jiang, Z.; Liu, Z.; Chang, J.; Su, Z.; Yang, Z.; Zhou, W. Difference in pore structure characteristics between condensate and dry shale gas reservoirs: Insights from the pore contribution of different matrix components. J. Nat. Gas Sci. Eng. 2021, 96, 104283. [Google Scholar] [CrossRef]
  8. Hu, D.G.; Shu, Z.G.; Guo, Z.F.; Li, X.; Chen, M.K. Discovery of the first shale condensate gas reservoir in Jurassic strata in the Fuxing area, eastern Sichuan. Geol. China 2021, 48, 1980–1981. [Google Scholar]
  9. Shu, Z.G.; Zhou, L.; Li, X.; Liu, H.T.; Zeng, Y.; Xie, H.G.; Yao, M.J.; Wang, Y.C. Geological characteristics of gas condensate reservoirs and their explotation and development prospect in Jurassic continental shale of the Dongyuemiao member of ziliujing formation, Fuxing area, eastern Sichuan basin. Oil Gas Geol. 2021, 42, 212–223. [Google Scholar]
  10. Kong, X.W.; Wang, P.; Xia, Z.H.; Zhang, X.L.; Qv, L.C.; Guo, L.C.; Guo, Z.K. Geological characteristics and fluid distribution of the Upper Devonian Duvernay shale in Simonette block in the Western Canada Sedimentary Basin. China Pet. Explor. 2022, 27, 93–107. [Google Scholar]
  11. Wang, J.W.; Hou, C.H.; Wang, T.; Li, J.S.; Liu, R.M.; Wei, Z.P. Study on reasonable well spacing of horizontal wells in Duvernay shale condensate gas reservoir in Canada. Pet. Geol. Eng. 2021, 35, 43–47. [Google Scholar]
  12. Dunn, L.; Schmidt, G.; Hammermaster, K.; Brown, M.; Bernard, R.; Wen, E.; Befus, R.; Gardiner, S. The Duvernay Formation (Devonian): Sedimentology and Reservoir Characterization of a Shale Gas/Liquids Play in Alberta, Canada; Canadian Society of Petroleum Geologists: Calgary, AB, Canada, 2012. [Google Scholar]
  13. Hsu, S.C.; Nelson, P.P. Characterization of eagle ford shale. Eng. Geol. 2002, 67, 169–183. [Google Scholar] [CrossRef]
  14. EIA, U.S. Review of Emerging Resources: US Shale Gas and Shale Oil Plays; Energy Information Administration, US Department of Energy: Wahington, DC, USA, 2011.
  15. Liu, Y.W.; Gao, D.P.; Li, Q.; Wan, Y.Z.; Duan, W.J.; Zeng, X.G.; Li, M.Y.; Su, Y.; Fan, Y.; Li, S.; et al. Mechanical frontiers in shale-gas development. Adv. Mech. 2019, 49, 201901. [Google Scholar]
  16. Bi, J.X.; Qi, Z.L.; Guo, P.; Sun, L.; Wang, S.P. Experiment research on condensate oil/gas phase permeability during pressure dropping production. Nat. Gas Ind. 2006, 26, 108–110. [Google Scholar]
  17. Qi, Y.D.; Jia, A.L.; Wei, Y.S.; Wang, J.L. Theoretical understanding and field practice of shale gas managed pressure production. In Proceedings of the 31st National Natural Gas Annual Conference (2019) (03 Unconventional Gas Reservoirs), Hefei, China, 30 October 2019; pp. 334–342. [Google Scholar] [CrossRef]
  18. Chen, X.Z.; Zheng, J.; Liu, M.Y.; Chen, M.; Yang, H.; Chen, C.; Xiao, H.S.; Yu, Y. Feasibility study and field trail of precise managed pressure production Technology for Shale Gas Wells. Drill. Prod. Technol. 2022, 45, 79–83. [Google Scholar]
  19. Wang, G.D. Study on optimization method of pressure control production system in shale gas wells in south Sichuan. Mod. Chem. Res. 2022, 18, 174–176. [Google Scholar]
  20. Yu, Y.; Yin, Q.; Ye, C.Q.; Chen, M.; Chen, C.; Wang, W.L.; Zhou, W.; Xiang, Y. Application of precision pressure control production technology in Ning 209H49 platform. Nat. Gas Oil 2022, 40, 32–37. [Google Scholar]
  21. Meng, X.B.; Meng, Z.; Ma, J.X.; Wang, T.F. Performance evaluation of CO2 huff-n-puff gas injection in shale gas condensate reservoirs. Energies 2018, 12, 42. [Google Scholar] [CrossRef] [Green Version]
  22. Fakher, S. Investigating factors that may impact the success of carbon dioxide enhanced oil recovery in shale reservoirs. In Proceedings of the SPE Annual Technical Conference and Exhibition, Calgary, AB, Canada, 30 September–2 October 2019. [Google Scholar]
  23. Fakher, S.; Imqam, A. Flow of carbon dioxide in micro and nano pores and its interaction with crude oil to induce asphaltene instability. SN Appl. Sci. 2020, 2, 1–13. [Google Scholar] [CrossRef]
  24. Zhang, L.; Chen, L.; Hu, R.; Cai, J. Subsurface multiphase reactive flow in geologic CO2 storage: Key impact factors and characterization approaches. Adv. Geo Energy Res. 2022, 6, 179–180. [Google Scholar] [CrossRef]
  25. Garipova, A.; Mukhina, E.; Cheremisin, A.; Spivakova, M.; Kasyanenko, A.; Cheremisin, A. Numerical Simulation Study of Huff-n-Puff Hydrocarbon Gas Injection Parameters for Enhanced Shale Oil Recovery. Energies 2023, 16, 1555. [Google Scholar] [CrossRef]
  26. Du, F.; Nojabaei, B. A Review of Gas Injection in Shale Reservoirs: Enhanced Oil/Gas Recovery Approaches and Greenhouse Gas Control. Energies 2019, 12, 2355. [Google Scholar] [CrossRef] [Green Version]
  27. Yan, F.P.; Guo, Y.W.; Shan, X.H.; Chen, Y.C.; Cao, M.J.; Chun, H.L.; Wang, J.; Zhang, X.Y. Experimental study on improving recovery efficiency of shale gas by injecting flue gas: A case study of MZ gas field in Ordos Basin. Pet. Geol. Dev. Daqing 2022, 41, 146–153. [Google Scholar]
  28. Ma, H.; Yang, Y.; Zhang, Y.; Li, Z.; Zhang, K.; Xue, Z.; Zhan, J.; Chen, Z. Optimized schemes of enhanced shale gas recovery by CO2-N2 mixtures associated with CO2 sequestration. Energy Convers. Manag. 2022, 268, 116062. [Google Scholar] [CrossRef]
  29. Takougang, E.M.T.; Al, M.Y.; Bouzidi, Y.; Bouchaala, F.; Sultan, A.A.; Mohamed, A.I. Characterization of a carbonate reservoir using elastic full-waveform inversion of vertical seismic profile data. Geophys. Prospect. 2020, 68, 1944–1957. [Google Scholar] [CrossRef]
  30. Bouchaala, F.; Ali, M.Y.; Matsushima, J. Compressional and shear wave attenuations from walkway VSP and sonic data in an offshore Abu Dhabi oilfield. Comptes Rendus Geosci. 2021, 353, 337–354. [Google Scholar] [CrossRef]
  31. Matsushima, J.; Ali, M.Y.; Bouchaala, F. A novel method for separating intrinsic and scattering attenuation for zero-offset vertical seismic profiling data. Geophys. J. Int. 2017, 211, 1655–1668. [Google Scholar] [CrossRef]
  32. Sun, H.; Yao, J.; Sun, Z.X.; Fan, D.Y. Recent development and prospect on numerical simulation of shale gas reservoirs. Pet. Geol. Recovery Effic. 2015, 19, 46–49. [Google Scholar]
  33. Swami, V.; Settari, A.T.; Javadpour, F. A numerical model for multi-mechanism flow in shale gas reservoirs with application to laboratory scale testing. In Proceedings of the EAGE Annual Conference & Exhibition Incorporating SPE Europec, London, UK, 10–13 June 2013. [Google Scholar]
  34. Roque-Malherbe, R.M.A. Adsorption and Diffusion in Nanoporous Materials; CRC Press: Boca Raton, FL, USA, 2007. [Google Scholar]
  35. Thommes, M.; Kaneko, K.; Neimark, A.V.; Olivier, J.P.; Rodriguez-Reinoso, F.; Rouquerol, J.; Sing, K.S. Physisorption of gases, with special reference to the evaluation of surface area and pore size distribution (IUPAC Technical Report). Pure Appl. Chem. 2015, 87, 1051–1069. [Google Scholar] [CrossRef] [Green Version]
  36. Hwang, S.T. Membranes in separations. Tech. Chem. 1975, 7, 52–90. [Google Scholar]
  37. Xiao, J.; Wei, J. Diffusion mechanism of hydrocarbons in zeolites—I. Theory. Chem. Eng. Sci. 1992, 47, 1123–1141. [Google Scholar] [CrossRef]
  38. Wang, M.; Li, Z. Nonideal gas flow and heat transfer in micro-and nanochannels using the direct simulation Monte Carlo method. Phys. Rev. E 2003, 68, 046704. [Google Scholar] [CrossRef] [Green Version]
  39. Wu, K.L.; Chen, Z.X. Review of gas transport in nanopores in shale gas reservoirs. Pet. Sci. Bull. 2016, 1, 91–127. [Google Scholar]
  40. Auerbach, S.M.; Carrado, K.A.; Dutta, P.K. Handbook of Zeolite Science and Technology; CRC Press: Boca Raton, FL, USA, 2003. [Google Scholar]
  41. Wu, K.; Li, X.; Wang, C.; Yu, W.; Chen, Z. A model for surface diffusion of adsorbed gas in nanopores of shale gas reservoirs. In Proceedings of the Offshore Technology Conference, Houston, TX, USA, 4–7 May 2015. [Google Scholar]
  42. Medveď, I.; Černý, R. Surface diffusion in porous media: A critical review. Microporous Mesoporous Mater. 2011, 142, 405–422. [Google Scholar] [CrossRef]
  43. Javadpour, F.; Fisher, D.; Unsworth, M. Nanoscale gas flow in shale gas sediments. J. Can. Pet. Technol. 2007, 46, 10. [Google Scholar] [CrossRef]
  44. Zhang, T. Fluids Transport Models in Gas-Shale Nanoporous Media; China University of Petroleum: Beijing, China, 2021. [Google Scholar] [CrossRef]
  45. Moghaddam, R.N.; Jamiolahmady, M. Slip flow in porous media. Fuel 2016, 173, 298–310. [Google Scholar] [CrossRef]
  46. Zhang, W.M.; Meng, G.; Wei, X. A review on slip models for gas microflows. Microfluid. Nanofluidics 2012, 13, 845–882. [Google Scholar] [CrossRef]
  47. Wang, S. Gas Adsorption/Desorption and Flow Mechanism in Shale Matrix; China University of Petroleum: Beijing, China, 2019. [Google Scholar] [CrossRef]
  48. Wu, K.; Li, X.; Wang, C.; Chen, Z.; Yu, W. Apparent permeability for gas flow in shale reservoirs coupling effects of gas diffusion and desorption. In Proceedings of the Unconventional Resources Technology Conference, Denver, CO, USA, 25–27 August 2014; pp. 2328–2345. [Google Scholar]
  49. Zhang, L.P.; Pan, R.F. Major Accumulation Factors and Storage Reconstruction of Shale Gas Reservoir. China Pet. Explor. 2009, 14, 20–23+2. [Google Scholar]
  50. Chen, D.J. Single Well Productivity Analysis of Shale Condensate Gas Reservoir. Master’s Thesis, Southwest Petroleum University, Chengdu, China, 2014. [Google Scholar]
  51. Lu, X.C.; Li, F.C.; Watson, A.T. Adsorption measurements in Devonian shales. Fuel 1995, 74, 599–603. [Google Scholar] [CrossRef]
  52. Yu, W.; Sepehrnoori, K. Simulation of gas desorption and geomechanics effects for unconventional gas reservoirs. In Proceedings of the SPE Western Regional & AAPG Pacific Section Meeting 2013 Joint Technical Conference, Monterey, CA, USA, 19–25 April 2013. [Google Scholar]
  53. Yuan, W.; Pan, Z.; Li, X.; Yang, Y.; Zhao, C.; Connell, L.D.; Li, S.; He, J. Experimental study and modelling of methane adsorption and diffusion in shale. Fuel 2014, 117, 509–519. [Google Scholar] [CrossRef]
  54. Liang, H.B.; Xiang, Z.P.; Xiao, Q.H.; Yuan, Y.Z.; Yan, W.D.; Liu, X.S. Comparative analysis and application of the shale gas absorbing model. Pet. Geol. Oilfield Dev. Daqing 2017, 36, 159–167. [Google Scholar]
  55. Yao, J.; Sun, H.; Huang, Z.Q.; Zhang, L.; Zeng, D.Q.; Sui, H.G.; Fan, D.Y. Key mechanical problems in the development of shale gas reservoirs (in Chinese). Sci. Sin. Phys. Mech. Astron. 2013, 43, 1527–1547. [Google Scholar] [CrossRef]
  56. King, G.R. Material balance techniques for coal seam and Devonian shale gas reservoirs. In Proceedings of the SPE Annual Technical Conference and Exhibition 1990, New Orleans, LA, USA, 23–26 September 1990. [Google Scholar]
  57. Fathi, E.; Akkutlu, I.Y. Macro-kinetics of matrix gas release and its influence on coalbed methane flow and Production. In Proceedings of the Latin American and Caribbean Petroleum Engineering Conference, Cartagena de Indias, Colombia, 31 May–30 June 2009. [Google Scholar]
  58. Sheindorf, C.H.; Rebhun, M.; Sheintuch, M. A Freundlich-type multicomponent isotherm. J. Colloid Interface Sci. 1981, 79, 136–142. [Google Scholar] [CrossRef]
  59. Langmuir, I. The adsorption of gases on plane surfaces of glass, mica and platinum. J. Am. Chem. Soc. 1918, 40, 1361–1403. [Google Scholar] [CrossRef] [Green Version]
  60. Yang, S.; Wu, W.; Xu, J.; Ji, D.; Chen, Z.; Wei, Y. Modeling of methane/shale excess adsorption under reservoir conditions. SPE Reserv. Eval. Eng. 2018, 21, 1027–1034. [Google Scholar] [CrossRef]
  61. Lu, X.C.; Li, F.C.; Watson, A.T. Adsorption studies of natural gas storage in Devonian shales. SPE Form. Eval. 1995, 10, 109–113. [Google Scholar] [CrossRef]
  62. Ambrose, R.J.; Hartman, R.C.; Diaz-Campos, M.; Akkutlu, I.Y.; Sondergeld, C.H. New pore-scale considerations for shale gas in place calculations. In Proceedings of the SPE Unconventional Gas Conference, Pittsburgh, PA, USA, 23–25 February 2010. [Google Scholar]
  63. Ambrose, R.J.; Hartman, R.C.; Akkutlu, I.Y. Multi-component sorbed-phase considerations for shale gas-in-place calculations. In Proceedings of the SPE Production and Operations Symposium, Oklahoma City, OK, USA, 27–29 March 2011. [Google Scholar]
  64. Yang, S.; Wu, K.; Xu, J.; Li, J.; Chen, Z. Roles of multicomponent adsorption and geomechanics in the development of an Eagle Ford shale condensate reservoir. Fuel 2019, 242, 710–718. [Google Scholar] [CrossRef]
  65. Song, W.H.; Yao, J.; Zhang, K. Study on gas adsorption and transport behavior in shale organic nanopore. Chin. J. Theor. Appl. Mech. 2021, 53, 2179–2192. [Google Scholar]
  66. Brunauer, S.; Emmett, P.H.; Teller, E. Adsorption of gases in multimolecular layers. J. Am. Chem. Soc. 1938, 60, 309–319. [Google Scholar] [CrossRef]
  67. Yu, W.; Sepehrnoori, K.; Patzek, T.W. Evaluation of gas adsorption in Marcellus Shale. In Proceedings of the SPE Annual Technical Conference and Exhibition, Amsterdam, The Netherlands, 27–29 October 2014. [Google Scholar]
  68. Haghshenas, B.; Soroush, M.; Brohi, I.; Clarkson, C.R. Simulation of liquid-rich shale gas reservoirs with heavy hydrocarbon fraction desorption. In Proceedings of the SPE Unconventional Resources Conference, The Woodlands, TX, USA, 1–3 April 2014. [Google Scholar]
  69. Xue, D.; Zhang, S.A.; Wu, X.M.; Li, X.; Du, J.; Lu, C. Sensitivity experiment of shale gas reservoir of Chang 7 reservoir in Xiasiwan oilfield. Lithol. Reserv. 2019, 31, 135–144. [Google Scholar]
  70. Kang, Y.L.; Lai, Z.H.; Chen, M.J.; Hou, T.F.; You, L.J.; Bai, J.J.; Yu, Z.H. Stress sensitivity experiments of shale gas diffusion coefficients based on the pressure decay method. Nat. Gas Ind. 2022, 42, 59–70. [Google Scholar]
  71. Zhao, X.L.; Yang, Z.M.; Wang, Z.Y.; Lin, W.; Xiong, S.C.; Luo, Y.T.; Niu, Z.K.; Xia, D.B. An Experimental Study on Stress Sensitivity of Tight Sandstones with Different Microfractures. Adv. Civ. Eng. 2020, 2020, 1865464. [Google Scholar] [CrossRef]
  72. Singh, H.; Cai, J.C. Chapter 6-Permeability of Fractured Shale and Two-Phase Relative Permeability in Fractures. In Petrophysical Characterization and Fluids Transport in Unconventional Reservoirs; Elsevier: Amsterdam, The Netherlands, 2019; pp. 105–132. [Google Scholar]
  73. Jia, B.; Feng, R.M.; Tsau, J.S.; Barati, R. Chapter 15-Multiphysical Flow Behavior in Shale and Permeability Measurement by Pulse-Decay Method. In Petrophysical Characterization and Fluids Transport in Unconventional Reservoirs; Elsevier: Amsterdam, The Netherlands, 2019; pp. 301–324. [Google Scholar]
  74. Liu, L.J.; Yao, J.; Sun, H.; Huang, Z.Q.; Yan, X.; Li, L.L. Compositional modeling of shale condensate gas flow with multiple transport mechanisms. J. Pet. Sci. Eng. 2019, 172, 1186–1201. [Google Scholar]
  75. Li, H.; Yu, H.Y.; Yang, H.F.; Tong, D.E.N.G.; Xu, L.I.; Yang, W.U. Adaptive stress sensitivity study of fractured heterogeneous tight reservoir. Pet. Drill. Tech. 2022, 50, 99–105. [Google Scholar]
  76. Sapmanee, K. Effects of Pore Proximity on Behavior and Production Prediction of Gas/Condensate. Master’s Thesis, University of Oklahoma, Norman, OK, USA, 2011. [Google Scholar]
  77. Du, L.G.; Chu, L.F. Understanding Anomalous Phase Behavior in Unconventional Oil Reservoirs. In Proceedings of the SPE Canadian Unconventional Resources Conference, Calgary, AB, Canada, 30 October–1 November 2012. [Google Scholar]
  78. Khoa, B.; Akkutlu, I.Y. Hydrocarbons recovery from model-Kerogen nanopores. Soc. Pet. Eng. 2017, 22, 854–862. [Google Scholar]
  79. Tian, W.B.; Wu, K.L.; Chen, Z.X.; Gao, Y.L.; Li, J.; Wang, M.Y. A relative permeability model considering nanoconfinement and dynamic contact angle effects for tight reservoirs. Energy 2022, 258, 124846. [Google Scholar] [CrossRef]
  80. Zarragoicoechea, G.J.; Kuz, V.A. Critical shift of a confined fluid in a nanopore. Fluid Phase Equilivria 2004, 220, 7–9. [Google Scholar] [CrossRef]
  81. Adamson, A.W. Physical Chemistry of Surfaces, 5th ed.; John Wiley & Sons: New York, NY, USA, 1990. [Google Scholar]
  82. Weiaug, C.F.; Katz, D.L. Surface tensions of methane-propane mixtures. Ind. Eng. Chem. 1943, 35, 239–246. [Google Scholar] [CrossRef]
  83. Zhang, Y.; Lashgari, H.R.; Di, Y.; Sepehrnoori, K. Capillary Pressure Effect on Hydrocarbon Phase Behavior in unconventional Reservoirs. In the SPE Low Perm Symposium; Society of Petroleum Engineers: Denver, CO, USA, 2016; Paper Number: SPE-180235-MS. [Google Scholar]
  84. Kong, X.W.; Wang, H.J.; Yu, W.; Wang, P.; Liu, L.; Zhang, W.J. Phase Behavior in Nanopores and Its Indication for Cyclic Gas Injection in a Volatile Oil Reservoir from Duvernay Shale. Lithosphere 2022, 2022, 5261253. [Google Scholar] [CrossRef]
  85. Li, Y.H.; Russell, T.; Johns, b.; Ahmadi, K. A rapid and robust alternative to Rachford–Rice in flash calculations. Fluid Phase Equilibria 2012, 316, 85–97. [Google Scholar] [CrossRef]
  86. Stimpson, B.C.; Maria, A. Barrufet Constructing Oil/Gas Capillary Pressure and Relative Permeability Curves from a Distribution of Pores in Shale Reservoirs. In Proceedings of the Unconventional Resources Technology Conference, Austin, TX, USA, 24–26 July 2017. [Google Scholar]
  87. Kamari, A.; Li, L.; Sheng, J.J. Effects of rock pore sizes on the PVT properties of oil and gas-condensates in shale and tight reservoirs. Petroleum 2021, 7, 235. [Google Scholar] [CrossRef]
  88. Wang, K.; Luo, J.; Wei, Y.Z.; Wu, K.L.; Li, J.; Chen, Z.X. Practical application of machine learning on fast phase equilibrium calculations in compositional reservoir simulations. J. Comput. Phys. 2020, 401, 109013. [Google Scholar] [CrossRef]
  89. Bai, Y.H.; Liu, L.J.; Fan, W.P.; Sun, H.; Huang, Z.Q.; Yao, J. Coupled compositional flow and geomechanics modeling of fractured shale oil reservoir with confined phase behavior. J. Pet. Sci. Eng. 2021, 196, 107608. [Google Scholar] [CrossRef]
  90. Chen, F.X.; Bi, R.; Hadi, N. Molecular Simulation of Multi-scale Multi-Component Hydrocarbon Phase Behavior in Liquid-Rich Shale Reservoirs. In Proceedings of the Unconventional Resources Technology Conference, Houston, TX, USA, 26–28 July 2021. [Google Scholar]
  91. Zhang, T.; Bai, H.; Sun, S.Y. Fast and accurate phase equilibrium calculations for condensate shale gas reservoirs. Chin. J. Theor. Appl. Mech. 2021, 53, 2156–2167. [Google Scholar] [CrossRef]
  92. Song, W.H.; Yao, J.; Zhang, K.; Yang, Y.F.; Sun, H.; Wang, Z.J. Nano-scale multicomponent hydrocarbon thermodynamic transport mechanisms in shale oil reservoir. J. Pet. Sci. Eng. 2022, 219, 111093. [Google Scholar] [CrossRef]
  93. Wei, B.; Zhong, M.T.; Zhao, J.Z.; Wang, D.L.; Kadet, V.; You, J.L. Prediction method for the minimum miscibility pressure of crude oil and natural gas in micro-nano confined space. Acta Petrolei Sinica 2022, 43, 1604–1613. [Google Scholar]
  94. Du, F.S.; Jiang, S. The Phase Behaviors of Confined Shale Fluids Considering Adsorption Effect. J. Energy Resour. Technol. Apr. 2023, 145, 042601. [Google Scholar] [CrossRef]
  95. Zhang, M.; Liu, R.J.; Hu, J.J.; Zhang, Y. A Pore-Geometry-Based Thermodynamic Model for the Nanoconfined Phase Behavior in Shale Condensate Reservoirs. Lithosphere 2022, 2022, 1989358. [Google Scholar] [CrossRef]
  96. Zheng, Z.X.; Di, Y.; Wu, Y.S. Nanopore confinement effect on the phase behavior of CO2/hydrocarbons in tight oil reservoirs considering capillary pressure, fluid-wall interaction, and molecule adsorption. Geofluids 2021, 2021, 1–18. [Google Scholar] [CrossRef]
  97. Zhang, K.; Liu, Q.Q.; Wang, S.H.; Feng, D.; Wu, K.L.; Dong, X.H.; Chen, S.N.; Chen, Z.X. Effects of Nanoscale Pore Confinement on CO2 Displacement. In Proceedings of the Unconventional Resources Technology Conference, San Antonio, TX, USA, 1–3 August 2016; Volume 2021, p. 2435930. [Google Scholar]
  98. Ruan, H.J. Study on Phase Characteristics of CO2 Injection in Condensate Gas Reservoir Rich in Condensate Oil. J. Chongqing Univ. Sci. Technol. (Nat. Sci. Ed.) 2022, 4, 26–29. [Google Scholar]
  99. Zhu, W.Y.; Chen, Z.; Song, Z.Y.; Wu, J.F.; Li, W.G.; Yue, M. Research progress in theories and technologies of shale gas development in China. Chin. J. Eng. 2021, 43, 1397–1412. [Google Scholar]
  100. Zhang, X.W.; Yao, Z.H.; Hao, P.F. Numerical and Experimental Study of Compressible Gas Flow through a Porous/Fluid–Coupled Area. J. Porous Media 2018, 21, 311–328. [Google Scholar] [CrossRef]
  101. Chen, J.N.; Li, T.T.; Wu, S.H. A New Unsteady Productivity Prediction Method of Fracturing Horizontal Wells in Low-Permeability Gas Reservoirs. Fresenius Environ. Bull. 2019, 28, 3300–3308. [Google Scholar]
  102. Wang, H.; Chen, L.; Qu, Z.G.; Yin, Y.; Kang, Q.J.; Yu, B.; Tao, W.Q. Modeling of multi-scale transport phenomena in shale gas production-A critical review. Appl. Energy 2020, 262, 114575. [Google Scholar] [CrossRef]
  103. Li, B.; Zhou, Y.; Li, S.; Ye, Y.; Liu, H. Injection-production optimization of fault-karst reservoir-considering high-speed non-Darcy effect. J. Petrol. Explor. Prod. Technol. 2022, 12, 1023–1036. [Google Scholar] [CrossRef]
  104. Liu, W.C.; Zhang, Q.T.; Dong, Y.R.; Chen, Z.X.; Duan, Y.Y.; Sun, H.D.; Yan, X.M. Analytical and numerical studies on a moving boundary problem of non-Newtonian Bingham fluid flow in fractal porous media. Phys. Fluids 2022, 34, 023101. [Google Scholar] [CrossRef]
  105. Kong, X.Y. Advanced Seepage Flow Mechanics; Press of China University of Science and Technology: Hefei, China, 1999. [Google Scholar]
  106. Wang, G.Q.; Zhang, R.; Cui, L.L. Transient Pressure Behavior of a Horizontal Well in a Naturally Fractured Gas Reservoir with Dual-Permeability Flow and Stress Sensitivity Effect. Geofluids 2022, 2022, 5993701. [Google Scholar] [CrossRef]
  107. Xia, D.; Yang, Z.; Gao, T.; Li, H.; Lin, W. Characteristics of micro- and nano-pores in shale oil reservoirs. J. Petrol. Explor. Prod. Technol. 2021, 11, 157–169. [Google Scholar] [CrossRef]
  108. Zhan, H.M.; Fang, F.F.; Li, X.Z.; Hu, Z.M.; Zhang, J. Shale Reservoir Heterogeneity: A Case Study of Organic-Rich Longmaxi Shale in Southern Sichuan. Energies 2022, 15, 913. [Google Scholar] [CrossRef]
  109. Qi, Q.; Zhu, W.Y. Moving boundary analysis of fractured shale gas reservoir. Chin. J. Eng. 2019, 41, 1387–1396. [Google Scholar]
  110. Mohammadhossein, H.S.; Mohammad, A.; Jalal, F. Practical Solutions for Rate-transient Analysis of Tight/Shale Reservoirs with Interfracture Induced Heterogeneity. SPE Res. Eval. Eng. 2020, 23, 648–663. [Google Scholar]
  111. Zeng, Y.J.; Lei, Q.H.; Wang, Z.N.; Ding, S.D.; Liu, K.; Huang, X.; Huang, Z.Q.; Wang, X.G. Numerical simulation of fluid injection-induced fault slip in heterogeneous shale formations. Comput. Geotech. 2021, 134, 104120. [Google Scholar] [CrossRef]
  112. Lu, W.F.; Qin, J.S.; Wu, K.Y.; Liu, Q.J.; Yan, S.J. A review of testing methods for pore permeability and relative permeability of low permeability rocks. Spec. Oil Gas Reserv. 2011, 18, 1–6+135. [Google Scholar]
  113. Lu, W.F.; Ma, D.S.; Liu, Q.J.; Zhang, Z.B.; Wu, K.Y.; Li, Y.J. A review of testing methods for three-phase relative permeability curves. Xinjiang Oil Gas 2012, 8, 40–45+3. [Google Scholar]
  114. Ojha, S.P.; Misra, S.; Tinni, A.; Sondergeld, C.; Rai, C. Relative permeability estimates for Wolf-camp and Eagle Ford shale samples from oil, gas and condensate windows using adsorption-desorption measurements. Fuel 2017, 208, 52–64. [Google Scholar] [CrossRef]
  115. GB/T 28912-2012; Method for Determination of Relative Permeability of Two-Phase Fluids in Rocks. Standards Press of China: Beijing, China, 2013.
  116. Qin, J.S.; Li, A.F. Reservoir Physics; China University of Petroleum Press: Dongying, China, 2003. [Google Scholar]
  117. Stone, H.L. Probability model for estimating three-phase relative permeability. J. Pet. Technol. 1970, 22, 214–218. [Google Scholar] [CrossRef]
  118. Stone, H.L. Estimation of three-phase relative permeability and residual oil data. J. Can. Pet. Technol. 1973, 12, 4. [Google Scholar] [CrossRef]
  119. Yao, Y.M. The Research of the Capillary Effect on the Multi-Phase Flow in Tight Oil and Gas Reservoir. Ph.D. Thesis, University of Science and Technology of China, Hefei, China, 2021. [Google Scholar] [CrossRef]
  120. Shanley, K.W.; Cluff, R.M.; Robinson, J.W. Factors controlling prolific gas production from low-permeability sandstone reservoirs: Implications for resource assessment, prospect development, and risk analysis. AAPG Bull. 2004, 88, 1083–1121. [Google Scholar] [CrossRef] [Green Version]
  121. Su, H.; Wang, D.; Zhang, P.; An, Y.; Fu, Y.; Lu, J.; Huang, F.; Zhang, H.; Ren, Z.; Li, Z. A New Method to Calculate the Relative Permeability of Oil and Water in Tight Oil Reservoirs by Considering the Nonlinear Flow. Geofluids 2022, 2022, 9450967. [Google Scholar] [CrossRef]
  122. Orangi, A.; Nagarajan, N.R.; Honarpour, M.M.; Rosenzweig, J. Unconventional shale oil and gas-condensate reservoir production, impact of rock, fluid, and hydraulic fractures. In Proceedings of the SPE Hydraulic Fracturing Technology Conference, The Woodlands, TX, USA, 24–26 January 2011. [Google Scholar]
  123. Li, R.; Chen, Z.; Wu, K.; Liu, X.; Dou, L.; Yang, S.; Xu, J. A fractal model for gas-water relative permeability curve in shale rocks. J. Nat. Gas Sci. Eng. 2020, 81, 103417. [Google Scholar] [CrossRef]
  124. Song, H.; Liu, C.; Lao, J.; Wang, J.; Du, S.; Yu, M. Intelligent Microfluidics Research on Relative Permeability Measurement and Prediction of Two-Phase Flow in Micropores. Geofluids 2021, 2021, 1–12. [Google Scholar] [CrossRef]
  125. Zhang, X.F.; Tang, J.W.; Wei, Y.S.; Jiang, C.Y. Individual well management and dynamic production analysis of Sulige gas field. J. Southwest Pet. Univ. (Sci. Technol. Ed.) 2009, 31, 110–114+187. [Google Scholar]
  126. Wang, X.D.; Hu, Y.L.; Ding, Y.P. A model of production data analysis for horizontal wells. Pet. Explor. Dev. 2010, 37, 99–103. [Google Scholar]
  127. Arps, J.J. Analysis of decline curves. Trans. AIME 1945, 160, 228–247. [Google Scholar] [CrossRef]
  128. Chen, Y.Q.; Fu, L.B.; Xu, J.Q. Application and comparison of two production decline models in shale gas wells and tight gas wells. Pet. Geol. Recovery Effic. 2021, 28, 84–89. [Google Scholar]
  129. Zhang, D.D.; Li, Z.P.; Su, H. Production decline trend of shale gas. Lithol. Reserv. 2015, 27, 138–144. [Google Scholar]
  130. Bai, Y.H.; Chen, G.H.; Xu, B.X.; Feng, R.Y.; Chen, L. Comparison of typical curve models for shale gas production decline prediction. China Pet. Explor. 2016, 21, 96–102. [Google Scholar]
  131. Ilk, D.; Rushing, J.A.; Perego, A.D.; Blasingame, T.A. Exponential vs. hyperbolic decline in tight gas sands: Understanding the origin and implications for reserve estimates using Arps’ decline curves. In Proceedings of the SPE Annual Technical Conference and Exhibition, Denver, CO, USA, 21–24 September 2008. [Google Scholar]
  132. Duong, A.N. An unconventional rate decline approach for tight and fracture-dominated gas wells. In Proceedings of the Canadian Unconventional Resources and International Petroleum Conference, Calgary, AL, Canada, 19–21 October 2010. [Google Scholar]
  133. Wang, N.T.; Du, L.N.; He, H.B.; Lin, H.-Y.; Zhu, M.-Q. New method for analysis of oil and gas well production decline. Nat. Gas Geosci. 2020, 31, 335–339. [Google Scholar]
  134. Wang, K.; Li, H.T.; Li, L.J.; Zhang, Q.; Bu, C.Z.; Wang, Z.Q. Research on three widely-used empirical decline methods for shale gas wells in Weiyuan block of the Sichuan Basin. Nat. Gas Geosci. 2019, 30, 946–954. [Google Scholar]
  135. Chen, Y.Q.; Xu, J.Q.; Fu, L.B. Establishment and application of pan exponential decline model for forecasting production rate and recoverable reserves of shale gas wells. Pet. Geol. Recovery Effic. 2021, 28, 132–136. [Google Scholar]
  136. Wu, Y.H.; Chen, L.S.; Huang, S.J.; Bai, Y.H.; Xu, B.X.; Ding, G.Y. A tri-linear model for production prediction in retrograde shale gas reservoirs. Nat. Gas Geosci. 2017, 28, 1745–1754. [Google Scholar]
  137. Lu, T.; Li, Z.P.; Lai, F.P.; Meng, Y.; Ma, W.L.; Sun, Y.P.; Wei, M.Q. Blasingame decline analysis for variable rate/variable pressure drop: A multiple fractured horizontal well case in shale gas reservoirs. J. Pet. Sci. Eng. 2019, 178, 193–204. [Google Scholar] [CrossRef]
  138. Zhang, F.Y.; Meybodi, H.E. A Semianalytical Method for Two-Phase Flowback Rate-Transient Analysis in Shale Gas Reservoirs. SPE Plast. Eng. 2020, 25, 1599–1622. [Google Scholar] [CrossRef]
  139. Dahim, S.; Taghavinejad, A.; Razghandi, M.; Rigi, H.R.; Moeini, K.; Jamshidi, S.; Sharifi, M. Pressure and rate transient modeling of multi fractured horizontal wells in shale gas condensate reservoirs. J. Pet. Sci. Eng. 2020, 185, 106566. [Google Scholar] [CrossRef]
  140. Luo, A.; Li, Y.; Wu, L.; Peng, Y.; Tang, W. Fractured horizontal well productivity model for shale gas considering stress sensitivity, hydraulic fracture azimuth, and interference between fractures. Nat. Gas Ind. B 2021, 8, 278–286. [Google Scholar] [CrossRef]
  141. Ren, W.X.; Lau, H.C. New Rate-Transient Analysis for Fractured Shale Gas Wells Using a Tri-linear Flow Model. J. Nat. Gas Sci. Eng. 2020, 80, 103368. [Google Scholar] [CrossRef]
  142. Zeng, J.; Liu, J.S.; Li, W.; Leong, Y.K.; Elsworth, D.; Guo, J.C. Shale gas reservoir modeling and production evaluation considering complex gas transport mechanisms and dispersed distribution of kerogen. Pet. Sci. 2021, 18, 195–218. [Google Scholar] [CrossRef]
  143. Wang, P.; Liu, W.; Huang, W.; Qiao, C.; Jia, Y.; Liu, C. Dynamic Productivity Prediction Method of Shale Condensate Gas Reservoir Based on Convolution Equation. Energies 2023, 16, 1479. [Google Scholar] [CrossRef]
  144. Zhu, H.; Kong, D.Q.; Qian, X. Shale Gas Production Prediction Method Based on Adaptive Threshold Denoising BP Neural Network. Sci. Technol. Eng. 2017, 17, 128–132. [Google Scholar]
  145. Khanal, A.; Khoshghadam, M.; Lee, W.J.; Nikolaou, M. New forecasting method for liquid rich shale gas condensate reservoirs with data driven approach using principal component analysis. J. Nat. Gas Sci. Eng. 2017, 38, 621–637. [Google Scholar] [CrossRef]
  146. Chaikine, I.A.; Gates, I.D. A machine learning model for predicting multi-stage horizontal well production. J. Pet. Sci. Eng. 2021, 198, 108133. [Google Scholar] [CrossRef]
  147. Kong, B.; Chen, Z.; Chen, S.; Qin, T. Machine learning-assisted production data analysis in liquid-rich Duvernay Formation. J. Pet. Sci. Eng. 2021, 200, 108377. [Google Scholar] [CrossRef]
  148. Liu, Y.Y.; Ma, X.H.; Zhang, X.W.; Guo, W.; Kang, L.-X.; Yu, R.-Z.; Sun, Y.-P. A deep-learning-based prediction method of the estimated ultimate recovery (EUR) of shale gas wells. Pet. Sci. 2021, 18, 1450–1464. [Google Scholar] [CrossRef]
  149. Bhattacharyya, S.; Vyas, A. Machine learning based rate decline prediction in unconventional reservoirs. Upstream Oil Gas Technol. 2022, 8, 100064. [Google Scholar] [CrossRef]
  150. Hui, G.; Chen, Z.; Wang, Y.; Zhang, D.; Gu, F. An integrated machine learning-based approach to identifying controlling factors of unconventional shale productivity. Energy 2022, 266, 126512. [Google Scholar] [CrossRef]
  151. Yan, X. Hydro-Mechanical Coupling Simulation and Its Application to Shale Gas Reservoirs. Ph.D. Thesis, China University of Petroleum (East China), Dongying, China, 2019. [Google Scholar] [CrossRef]
  152. Liu, L.F.; Zhao, Y.L.; Zhang, L.H.; Xie, J.; Zhang, B.H.; Wu, J.F. A mathematical Derivation and Numerical Calculation Method for Embedded Discrete Crack Model. Patent CN111079335B, 30 October 2020. [Google Scholar]
  153. Yan, X.; Huang, Z.; Yao, J.; Li, Y.; Fan, D. An efficient embedded discrete fracture model based on mimetic finite difference method. J. Pet. Sci. Eng. 2016, 145, 11–21. [Google Scholar] [CrossRef]
  154. Wan, T.; Yu, Y.; Sheng, J.J. Experimental and numerical study of the EOR potential in liquid-rich shales by cyclic gas injection. J. Unconv. Oil Gas Resour. 2015, 12, 56–67. [Google Scholar] [CrossRef] [Green Version]
  155. Pankaj, P.; Mukisa, H.; Solovyeva, I.; Xue, H. Boosting oil recovery in naturally fractured shale using CO2 huff-n-puff. In Proceedings of the SPE Argentina Exploration and Production of Unconventional Resources Symposium, Neuquen, Argentina, 14–16 August 2018. [Google Scholar]
  156. Jing, G.; Chen, Z.; Hui, G. Optimization of improving liquids recovery from Duvernay Shale condensate reservoirs. In Proceedings of the Asia Pacific Unconventional Resources Technology Conference, Virtual, 16–18 November 2021; pp. 1328–1341. [Google Scholar]
  157. Hamdi, H.; Clarkson, C.R.; Ghanizadeh, A. RTA-Assisted Numerical History-Matching and Co-Optimization of CO2 Storage and HnP Performance for a Near Critical Gas Condensate Shale Well. In Proceedings of the SPE Annual Technical Conference and Exhibition, Houston, TX, USA, 3–5 October 2022. [Google Scholar]
Figure 1. Production comparison between a vertical well and a horizontal well (modified from [15]).
Energies 16 02446 g001
Figure 2. Production process of shale condensate gas reservoirs (modified from [15]).
Energies 16 02446 g002
Figure 3. Classification of gas molecular flow types (modified from [48]).
Energies 16 02446 g003
Figure 4. Adsorption and desorption of gas molecules (modified from [48]).
Energies 16 02446 g004
Figure 5. Molecular layer adsorption model (modified from [54]).
Energies 16 02446 g005
Figure 6. Diagram of strong stress sensitivity characteristics of fractures.
Energies 16 02446 g006
Figure 7. Flow chart of phase equilibrium calculation (modified from [83]).
Energies 16 02446 g007
Figure 8. Schematic diagram of phase shift at different diameters (modified from [84]).
Energies 16 02446 g008
Figure 9. Schematic diagram of phase shift in different CO2 cases (modified from [97]).
Energies 16 02446 g009
Figure 10. Diagram of reservoir heterogeneity at the SRV area.
Energies 16 02446 g010
Disclaimer/Publisher’s Note: The statements, opinions and data contained in all publications are solely those of the individual author(s) and contributor(s) and not of MDPI and/or the editor(s). MDPI and/or the editor(s) disclaim responsibility for any injury to people or property resulting from any ideas, methods, instructions or products referred to in the content.

