Article

Identification of Key Events and Emissions during Thermal Abuse Testing on NCA 18650 Cells

1
Department of Chemical Engineering Materials Environment, Sapienza University of Rome, via Eudossiana 18, 00184 Rome, Italy
2
INSTM Reference Laboratory for Engineering of Surface Treatments, via Eudossiana 18, 00184 Rome, Italy
*
Author to whom correspondence should be addressed.
Energies 2023, 16(7), 3250; https://doi.org/10.3390/en16073250
Submission received: 1 March 2023 / Revised: 26 March 2023 / Accepted: 3 April 2023 / Published: 5 April 2023
(This article belongs to the Section D2: Electrochem: Batteries, Fuel Cells, Capacitors)

Abstract

:
Thermal abuse of lithium-ion batteries (LIBs) leads to the emission of gases, solids, fires and/or explosions. Therefore, it is essential to define the temperatures at which key events occur (i.e., CID activation, venting, and thermal runaway (TR)) and to identify the related emissions for identifying the hazards to which people and especially rescue teams are exposed. For this purpose, thermal abuse tests were performed on commercial lithium nickel cobalt aluminum oxide (NCA) 18650 cells at 50% state of charge in a reactor connected to an FT-IR spectrometer by varying test conditions (feed gas of N2 or air; heating rates of 5 or 10 °C/min until 300 °C). In particular, the concentrations of the gases and the composition of the condensed-phase emissions were estimated. As regards gases, a high concentration (1695 ppmv) of hydrofluoric acid (HF) was measured, while the emissions of condensed matter consisted of organic compounds such as polyethylene oxide and paraffin oil, and inorganic compounds containing Li (0.173 mg/m3) and Al (0.344 mg/m3). The main safety concerns were caused by the temperatures (564 ± 85 °C) reached by the cell during TR, by the HF concentration which exceeded the toxicity limits of 30 ppm, the IDLH defined by the NIOSH, and the diameter of the particles (1.54 ± 0.69 µm) that rose the PM2.5 concentration. These results are also useful for identifying personal protection equipment for rescue teams.

Graphical Abstract

1. Introduction

Lithium-ion batteries (LIBs) find applications in many fields, such as electrical vehicles (EVs), mobile device, and energy storage system (ESS) [1]. The main disadvantage that is emerging is the thermal runaway (TR) of the cell encountered when subjected to abuse. The term abuse indicates an irreversible event in LIBs that can be initiated in several ways, i.e., electrically, mechanically, or thermally [2]. In all cases it can be considered a direct cause of LIBs’ TR [3], leading to the decomposition of internal components and multiple exothermic reactions in a wide range of temperatures [4] with the emission of smoke, gases, the projection of fragments, fire and/or explosion [5]. To improve battery safety, protection devices such as a positive temperature coefficient (PTC), a current interrupt device (CID), a top vent, a bottom vent, and a protection circuit can be integrated into the commercial 18650 Li-ion cells, depending on the manufacturer [6].
Once the abuse initiates the exothermic reactions, the heat produced increases the temperature and pressure inside the cell causing the activation of the protection devices installed on a single cell [7]. If the activation of protection devices is not sufficient to balance the pressure and the temperature increase inside the cell, the temperature rises faster, causing TR. Three key events can be distinguished over time: first the CID activation [8], then the venting, and finally TR [9]. The CID activation is due to the increase in the internal pressure, which leads to the opening of the circuit with the electrical insulation of one of the electrodes, at a predefined internal pressure of about 1.0–1.2 MPa [6]. Then, there is the venting, at an internal pressure of about 2.2–2.3 MPa [6], with gases emitted from the vent valve. Finally, TR occurs when the temperature increases with a self-heating rate (SHR) greater than 10 °C/min.
Therefore, to improve battery safety it is essential to control these events and this work aimed to contribute to it by defining the temperatures at which they occur and evaluating the related emissions to identify the hazards to which people and especially rescue teams are exposed.
In the literature, there are several studies that investigate the thermal stability of the single components of the cell and/or induce thermal abuse tests on the whole cell. The tests conducted on single components or on whole cells lead to different thermal response [10]; in fact, the full cell presents a higher heating rate and temperature with respect to single components [11]. These studies are usually performed through differential scanning calorimetry (DSC) [12] or a thermal gravimetric analysis (TGA) [13]. Comparing the materials of the positive electrodes of the most used commercial batteries, it emerged that LFP (lithium iron phosphate) is the most thermally stable due to the lack of oxygen production up to 500 °C, followed by the lithium cobalt oxide (LCO) and lithium nickel cobalt aluminum oxide (NCA), which is the most reactive and has a lower thermal stability than the other cathodes [10].
Various international standards and regulations were published for the safety testing of cells, modules, or packages under abusive conditions [14]. Specifically, thermal tests evaluate the safety performance and the thermal stability of a system under conditions of temperature change. The thermal stability test on a cell, module, and battery pack, according to the UN/ECE Regulation No. 100 [15], has allowed researchers to identify the temperature where the main events begin, by increasing it sequentially, in 5 °C steps with a holding time of 30 min at each incremental step, until the temperature reaches 200 °C above the battery’s maximum operating temperature.
The thermal abuse tests studies, conducted on single cells and modules, are usually performed via a cone calorimeter [16,17], a single burning item (SBI) [18], or combustion chambers [19] to obtain information on the temperature of the key events, the heat release rate (HRR) [17], the mass loss, and the chemical and structural modifications of the cell components. Regarding the characteristics of single Li-ion cells, the main factors influencing the behavior under thermal abuse conditions of the cell are the chemical composition and the state of charge (SoC). The SoC determines the electrochemical potential energy possessed by the device [19]; a higher SoC causes a higher oxygen consumption, compared to a lower SoC, and a sharp increase in the thermal hazard with different gaseous products. Experimental conditions, such as the heating rate and atmosphere, influence the results [20]. External heating can be applied either by direct flame exposure, i.e., a propane burner, or through a radiative heater, leading to higher temperatures and the production of small molecules [21]. Finally, the tests can be conducted in an oxidative atmosphere, which leads to the complete combustion of the organic compounds (i.e., electrolyte solution), or in an inert atmosphere which causes pyrolysis with the production of gases and solid particles [21].
To analyze the emitted gases, Fourier transform infrared (FT-IR) spectroscopy or gas chromatography (GC) can be connected online to the reaction chamber [18,19]. The gases produced during TR are mainly carbon monoxide (CO), carbon dioxide (CO2), methane (CH4), fluorinated compounds, such as hydrofluoric acid (HF), phosphorous oxyfluoride (POF3), and phosphorous pentafluoride (PF5) [22,23], and electrolyte solvents such as dimethyl carbonate (DMC), ethylene carbonate (EC), and/or diethyl carbonate (DEC) [21].
The production of fluorinated compounds, such as HF, POF3, and PF5, is due to the decomposition reaction of the binder (polyvinylidene fluoride PVDF), the Li salt used as electrolyte, and the active cathode material [18]. The production of all these gases increases with the SoC; in fact, fully charged batteries have the most serious toxicity [19]. Moreover, in the tests carried out in an air atmosphere the combustion produces more off-gas, but at the same time the toxicity of the off-gas is reduced compared to pyrolysis in N2 for the unburned products, such as CO [21].
The solid particles ejected from an LIB can be composed of carbon, organic compounds (i.e., carbonates), metals, metal oxides, and other species, in composition and particle sizes, depending on the type of cell and the abuse conditions [24]. However, a comprehensive safety assessment is still lacking, with few or no investigation into the size and nanostructures of particles present in gases during the TR of LIBS.
For this purpose, the behavior resulting from the thermal abuse of commercial 18650 cells (NCA) at a 50% SoC at two different heating rate (5 and 10 °C/min) and two feed-gas compositions, air and nitrogen (N2), was investigated in this work. The key events (i.e., CID activation, venting, and TR) were characterized by temperature and pressure. Furthermore, the characterization and quantification of the products emitted during the thermal abuse of the cell was performed. The different composition of the feed gas made it possible to distinguish between the products which were generated inside the cells, in N2, and those which were formed outside the cells by a reaction with air. In order to have a complete picture of the products emitted, the gaseous and condensed phase emissions were analyzed using various techniques. The gases were analyzed by an FT-IR spectrometer (Spectrum 3, Pekin Elmer, Waltham, DC, USA) while the condensed phase was analyzed by ATR-FT-IR spectroscopy for the organic components and by ICP-OES, AAS, and SEM-EDS for the inorganic part.
These results give a more comprehensive understanding on the dangerousness of cells when subjected to thermal abuse according to the limit temperature, obtained by the thermal stability tests, and the toxicity of gas and condensed-phase emissions, comparing it to the immediately dangerous to life or health limit (IDLH) value.

2. Materials and Methods

2.1. Materials

Test were conducted on commercial lithium-ion cells (Panasonic’s NCR 18650). The cathode was made of lithium nickel cobalt aluminum oxides (NCA), the anode was made of graphite while the electrolyte was made of LiFP6 salt dissolved in organic carbonate solvents (i.e., dimethyl carbonate (DMC) and ethylene carbonate (EC)). Figure 1 shows the cell with its dimensions (a) and the technical specifications (b).
Before the thermal abuse tests, the cells were subjected to a procedure consisting of five charge–discharge cycles for the formation of the solid electrolyte interface (SEI). Then, the cells were charged using a PS80002U series power supply from Elektro-Automatik (EA), Viersen, Germany. Cells were charged to a state of charge (SoC) of 50%, applying a constant current (CC) load of 12 A for 1 h, at a maximum limit voltage of 3.50 V.

2.2. Lab-Scale Setup: Reactor, Transfer Line, and FT-IR Spectroscopy

The cell was positioned in a stainless-steel tubular reactor, fluxed with nitrogen (N2) or air, heated up by an electrical oven (PID-controlled) and connected via a transfer line to the gas cell for the Fourier transform infrared (FT-IR) spectroscopy analysis. Figure 2 illustrates a photograph of the laboratory plant for the thermal abuse tests.
The gas flow (N2 or air) entering the reactor was regulated by a mass flow controller at a constant flow rate of 500 Nml/min. The reactor consists of a cylindrical stainless-steel tube closed at the ends by two removable flanges; on one of them a support was mounted with a cell holder for the 18650 cells (Figure 3a). Three thermocouples (Figure 3b) were positioned inside the reactor and connected to an external data logger. Two thermocouples were located on the cell surface, TC1 (positive electrode side) at 0.5 mm from the venting valve and TC2 (negative electrode side) at 0.5 mm from the cell bottom, while TC3 measured the gas temperature under the cell support. A differential pressure transducer monitored the pressure inside the reactor chamber.
A filter unit, consisting of three filters with different filtering properties, as reported in Table 1, was connected to the gas outlet to purify the gas before it was flushed into the gas cell for FT-IR analysis via transfer line. The gas flow to the FT-IR cell was regulated by a vacuum pump with a sampling flow of 150 mL/min. To avoid condensation, the filter, the transfer line, and the cell were heated up to 180 °C. The gases were analyzed by an FT-IR spectrometer (Spectrum 3, Pekin Elmer) coupled with a mercury cadmium telluride (MCT) detector cooled with liquid nitrogen, to increase its sensitivity. Through Perkin Elmer’s TimeBase software, FT-IR spectra were acquired continuously for the entire test. Table 1 reports the specifications of the setup.

2.3. Methods

2.3.1. Thermal Stability Test Conditions

The thermal stability test of UN/ECE Regulation No. 100 [15] has made it possible to identify the temperature at which TR begins by increasing the temperature in steps of 5 °C with a holding time of 30 min at each incremental step, up to a temperature of 200 °C above the maximum operating temperature of the battery or until a catastrophic event such as venting occurs. The thermal stability test was conducted on cells both in air and N2.

2.3.2. Thermal Abuse Test Conditions

Thermal abuse tests were conducted on 50% SoC cells with an inlet flow of N2 or air of 500 Nml/min, over a temperature range of 20–300 °C, with two heating rates, 5 and 10 °C/min. The setpoint temperature was maintained while after TR, the oven was switched off.

2.3.3. FT-IR

The main gaseous products were essentially composed of hydrofluoric acid (HF), carbon monoxide (CO), carbon dioxide (CO2), methane (CH4), and the electrolyte solvents (dimethyl carbonate (DMC), ethylene carbonate (EC), and diethyl carbonate (DEC)). The spectra of the standard gases, at different concentrations (ppmv), were collected according to the spectrometer and software parameters reported in Table 1. Table 2 reports the wavenumbers relative to each gas, expressed in cm−1, obtained by the standard gas analysis.
For each gas, a characteristic wavelength was selected for subsequent quantification using SpectrumQuant software (Version 10.7.2.1630) (Perkin Elmer, Waltham, MA, USA). The characteristic wavelength was chosen among the wavenumbers present in the standard spectrum following three criteria: (i) the absorbance at the chosen wavenumber did not saturate as the concentration increased, (ii) it showed a linear trend with the concentration, increasing as the concentration increased, and (iii) the wavenumber was unique, therefore attributable only to the gaseous compound under examination and not in common with other species. Through the software tool, from the relationship between the %T and the concentration for each specific wavelength (in bold in Table 2), it was possible to obtain the calibration lines relating to each gas. Finally, the gas concentration of each compound was obtained by applying the relevant calibration line.

2.3.4. ATR-FT-IR

Primary filters, both before and after abuse tests, were analyzed by this technique. The ATR-FT-IR spectra of the collected condensed phase were obtained by subtracting the spectrum, obtained under the same operating conditions, of the filter. The spectra were collected using the following spectrometer parameters: a resolution of 4 cm−1 in a spectral range between 4000 cm−1 and 650 cm−1 with a scan/spectrum of 8 and detected by an MIR TGS detector. The identification was obtained by comparing the spectra with the spectra available in the library.

2.3.5. SEM-EDS

Surface morphology analyses were performed with an FEG-SEM Tescan Mira3 (Tescan, Brno, Czech Republic) equipped with the Edax Octane Elect EDS system (Edax/Ametek Inc., Wiesbaden, Germany). SEM analyses were conducted on the primary filter (PTFE) both before and after abuse tests. A layer of carbon film was deposited on the filters to make the surface conductive for the SEM analysis by a Leica EM SCD005 (Leica Microsystems S.R.L., Buccinasco (MI), Italy) top sputter coater. Compositional analyses were performed with energy-dispersive X-ray spectroscopy (EDX) to verify the presence of other elements in the filter. SEM-EDX analyses were performed with a beam voltage of 15.0 kV and a working distance from the source of 15.00 mm, at different magnifications, depending on the size of the particles detected in the filter plots. EDX analyses were therefore conducted on the particles’ point and area.

2.3.6. ICP-OES and AAS

Approximately 0.060 g of filter were weighed and kept in the muffle at 530 °C for 8 h. Then, 10 mL of reverse aqua regia was added to 3 parts of nitric acid 69% (HNO3) and 1 part of hydrochloric acid 37% (HCl). The digestion was performed at room temperature (20 °C) for 3 h. At the end of the digestion, the samples were filtered and then diluted with ultrapure water up to a final volume of 100 mL. The samples were finally analyzed by atomic absorption spectroscopy (AAS) or inductively coupled plasma with optical emission spectrometry (ICP-OES) according to the metal and quantified by comparing with the correspondent standard calibration line.

3. Results

3.1. Thermal Abuse Tests: Temperature and Pressure Profile

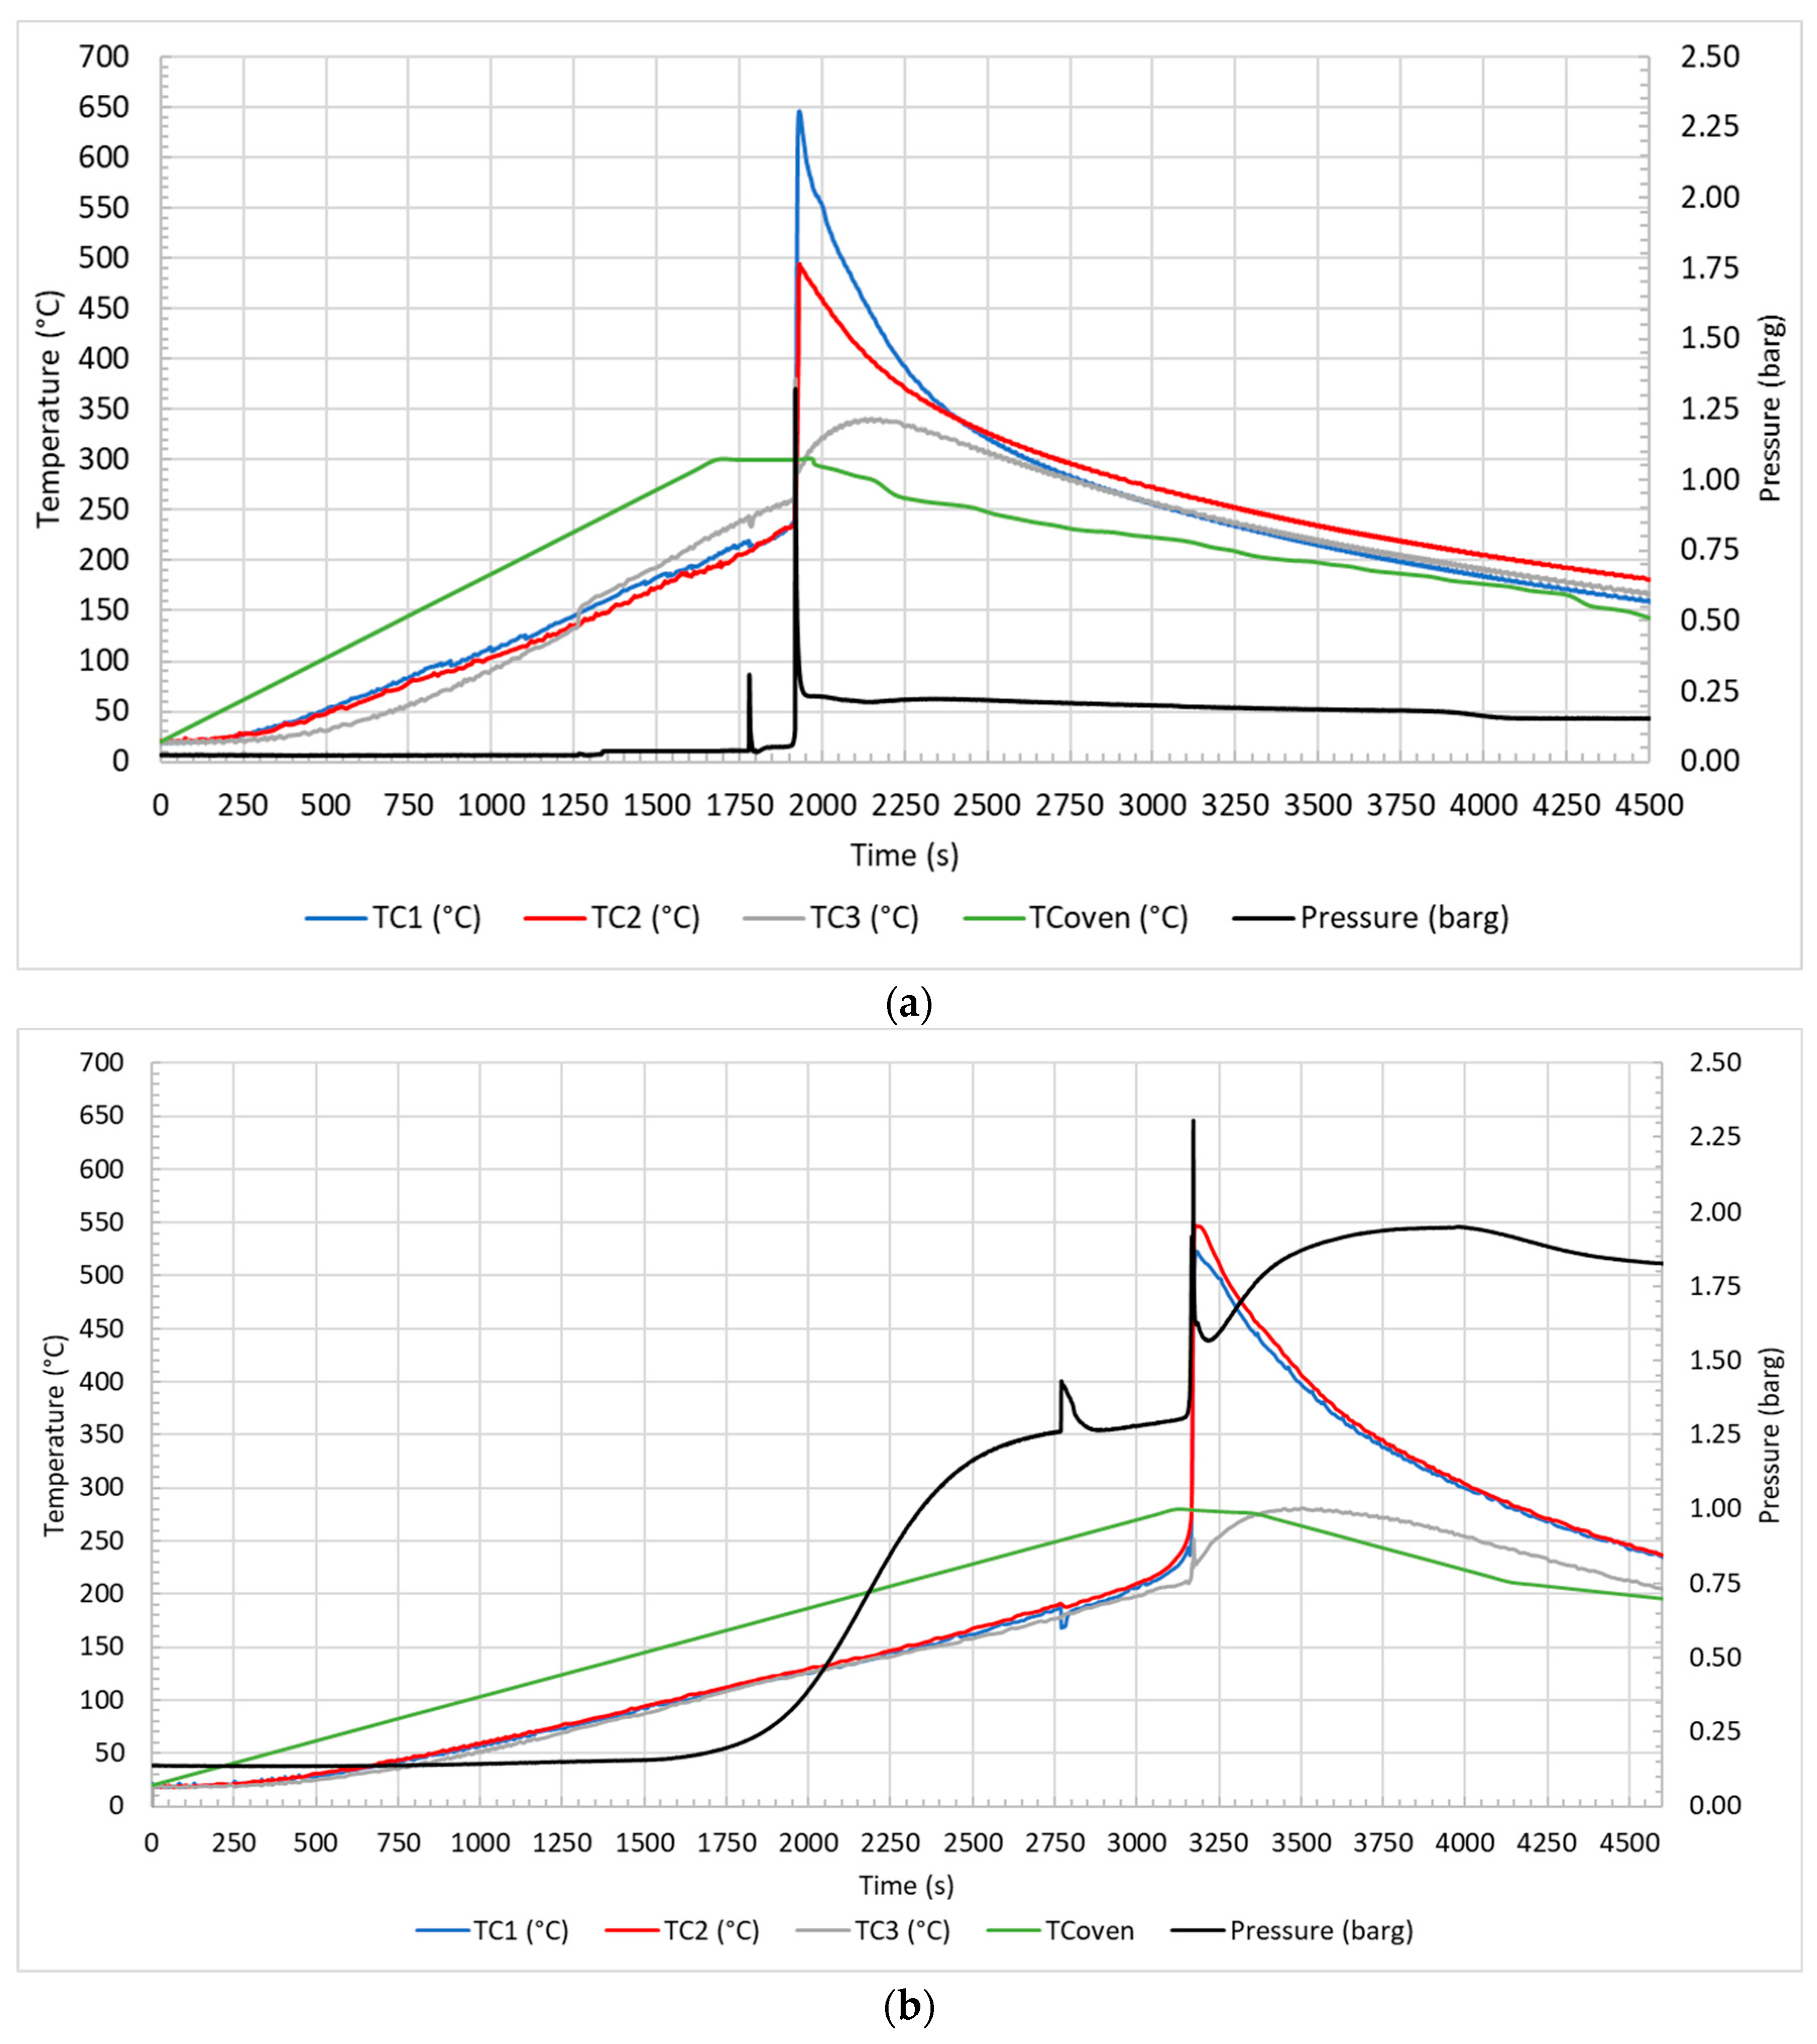
Figure 4 illustrates the profile of temperature and pressure observed during the test in air at 10 °C/min (a) and 5 °C/min (b) and in N2 at 10 °C/min (c) and 5 °C/min (d).
The first event that was observed at 1217 s and 135 °C (Figure 4a), at 1672 s and 106 °C (Figure 4b), at 1184 s and 128 °C (Figure 4c), and at 1754 s and 107 °C (Figure 4d) was the CID activation due to the increase in internal pressure, which led to the opening of the circuit with the electrical insulation of one of the electrodes. Then, venting occurred at 1780 s and 212 °C (Figure 4a), 2770 s and 179 °C (Figure 4b), 1793 s and 195 °C (Figure 4c), and 2393 s a 171 °C (Figure 4d), with the emission of gases from the vent valve due to the increasing pressure inside the cell. Regarding the venting, it could be observed both an increase in the pressure and a decrease in the surface temperature of the cell (TC1 and TC2). This phenomenon was due to the release of the electrolyte solution, which increased the pressure in the reactor, and to its evaporation with consequent heat absorption due to the endothermic phase change (vaporization), which decreased the temperature of the cell surface. In the case of tests conducted in air, the phenomenon was characterized by a narrow peak, a rapid decrease followed by an increase in temperature in a few seconds, while in the case of N2, the temperature variation was less defined, and the heating was dilated over time. These two distinct trends were both due to the gas fed to the reactor and to the temperature reached at the moment of venting. Once released into the reactor fed with air, the electrolyte solution evaporated almost completely, because the temperatures (179–212 °C) were higher than the boiling point of the electrolyte solvents (for DMC Tboiling = 90 °C, and for EC Tboiling = 248 °C), and then burned with air. In the case of nitrogen, the lower temperatures (171–195 °C), especially at 5 °C/min, allowed only a partial vaporization of the solution; therefore, the change in temperature was less evident. Moreover, since nitrogen is an inert gas, there was no combustion of the electrolyte solvents. Subsequently, TR occurred at 1910 s and 235 °C (Figure 4a), 3122 s and 230 °C (Figure 4b), 2115 s and 221 °C (Figure 4c), and 3107 s and 213 °C (Figure 4d) under different conditions. TR refers to the moment in which the temperature increases with a SHR higher than 10 °C/min; a peak in temperature was observed, higher for tests in air than in N2, than the temperature decreased slowly. In summary, each key event was defined by a relative temperature and pressure. Table 3 reports the average temperature, recorded on the cell surface by TC1 and TC2, and the pressure of the key events in the different thermal abuse test conditions.
From the comparison, the CID-activation temperatures and venting temperatures were not significantly different for tests conducted at the same heating rate in air or N2 but were higher for tests performed at a higher heating rate (10 °C/min). On the contrary the TR and peak temperatures were more affected by the feed gas used in the tests than by the heating rate. In air, the cell temperature was affected by the combustion of the organic compounds (mainly electrolyte) emitted by the cell that occurred outside the cell, as described in the following section.

3.2. Thermal Abuse Tests: Gas Profile and Quantification

In addition to the increase in temperature and pressure, the heating caused the emission of gases. The spectra obtained from the FT-IR spectrometer during the tests performed at 5 °C/min in air (a) and in N2 (b) are reported in Figure 5.
Figure 5 illustrates the absorbance profile as a function of the wavenumber. Regarding the CID activation, there was an increase in the absorbance, which became more evident at the venting phase, followed by a maximum in absorbance for most of the wavenumbers and then a decrease. It was observed that absorbance increased later in N2 than in air but decreased earlier. The typical wavenumbers, to identify the main species emitted, are reported in Table 2. Through quantification software, it was possible to quantify, in ppmv, the main gases, i.e., HF, CO, CO2, CH4, DMC, and EC, as emitted during the test, as shown in Figure 6.
From the concentration profiles, it is possible to notice that the first released gas was HF after the CID activation at 1672 s (Figure 6a) and 1754 s (Figure 6b). The other gases (CH4, CO, and CO2) and DMC and EC vapors were instead emitted from the venting phase, and a sudden increase in their concentrations corresponding to TR was observed, except for DMC in the case of air (and DMC and CO in the case of N2) that first decreased and then increased again. The maximum concentration values of HF (1300 and 1700 ppmv) were reached at the maximum temperature both in air and N2, respectively. This was similar for CO (35,000 ppmv) and CO2 (100,000 ppmv) in N2 but not in air, where the maximum concentrations of CO (60,900 ppmv) and CO2 (90,000 ppmv) were shifted after the peak temperature. This behavior gave evidence of the combustion outside the cell of the gases emitted during TR. From the profile of each gas, it was possible to observe that the emitted amount of HF, DMC, and EC were not significantly affected by the test conditions. DMC and EC were the main electrolyte solvents, while HF was due to the decomposition of the electrolyte salt, LiPF6 [7]. The CO and CO2, on the other hand, were strictly dependent on the test conditions; in fact, in air, the total amount of CO2 was higher (1–13 times depending on the heating rate) than the total amount of CO, while in nitrogen, it was the opposite. Even the CH4 production was dependent from the operating conditions.

3.3. Thermal Abuse Tests: Condensed-Phase Emissions

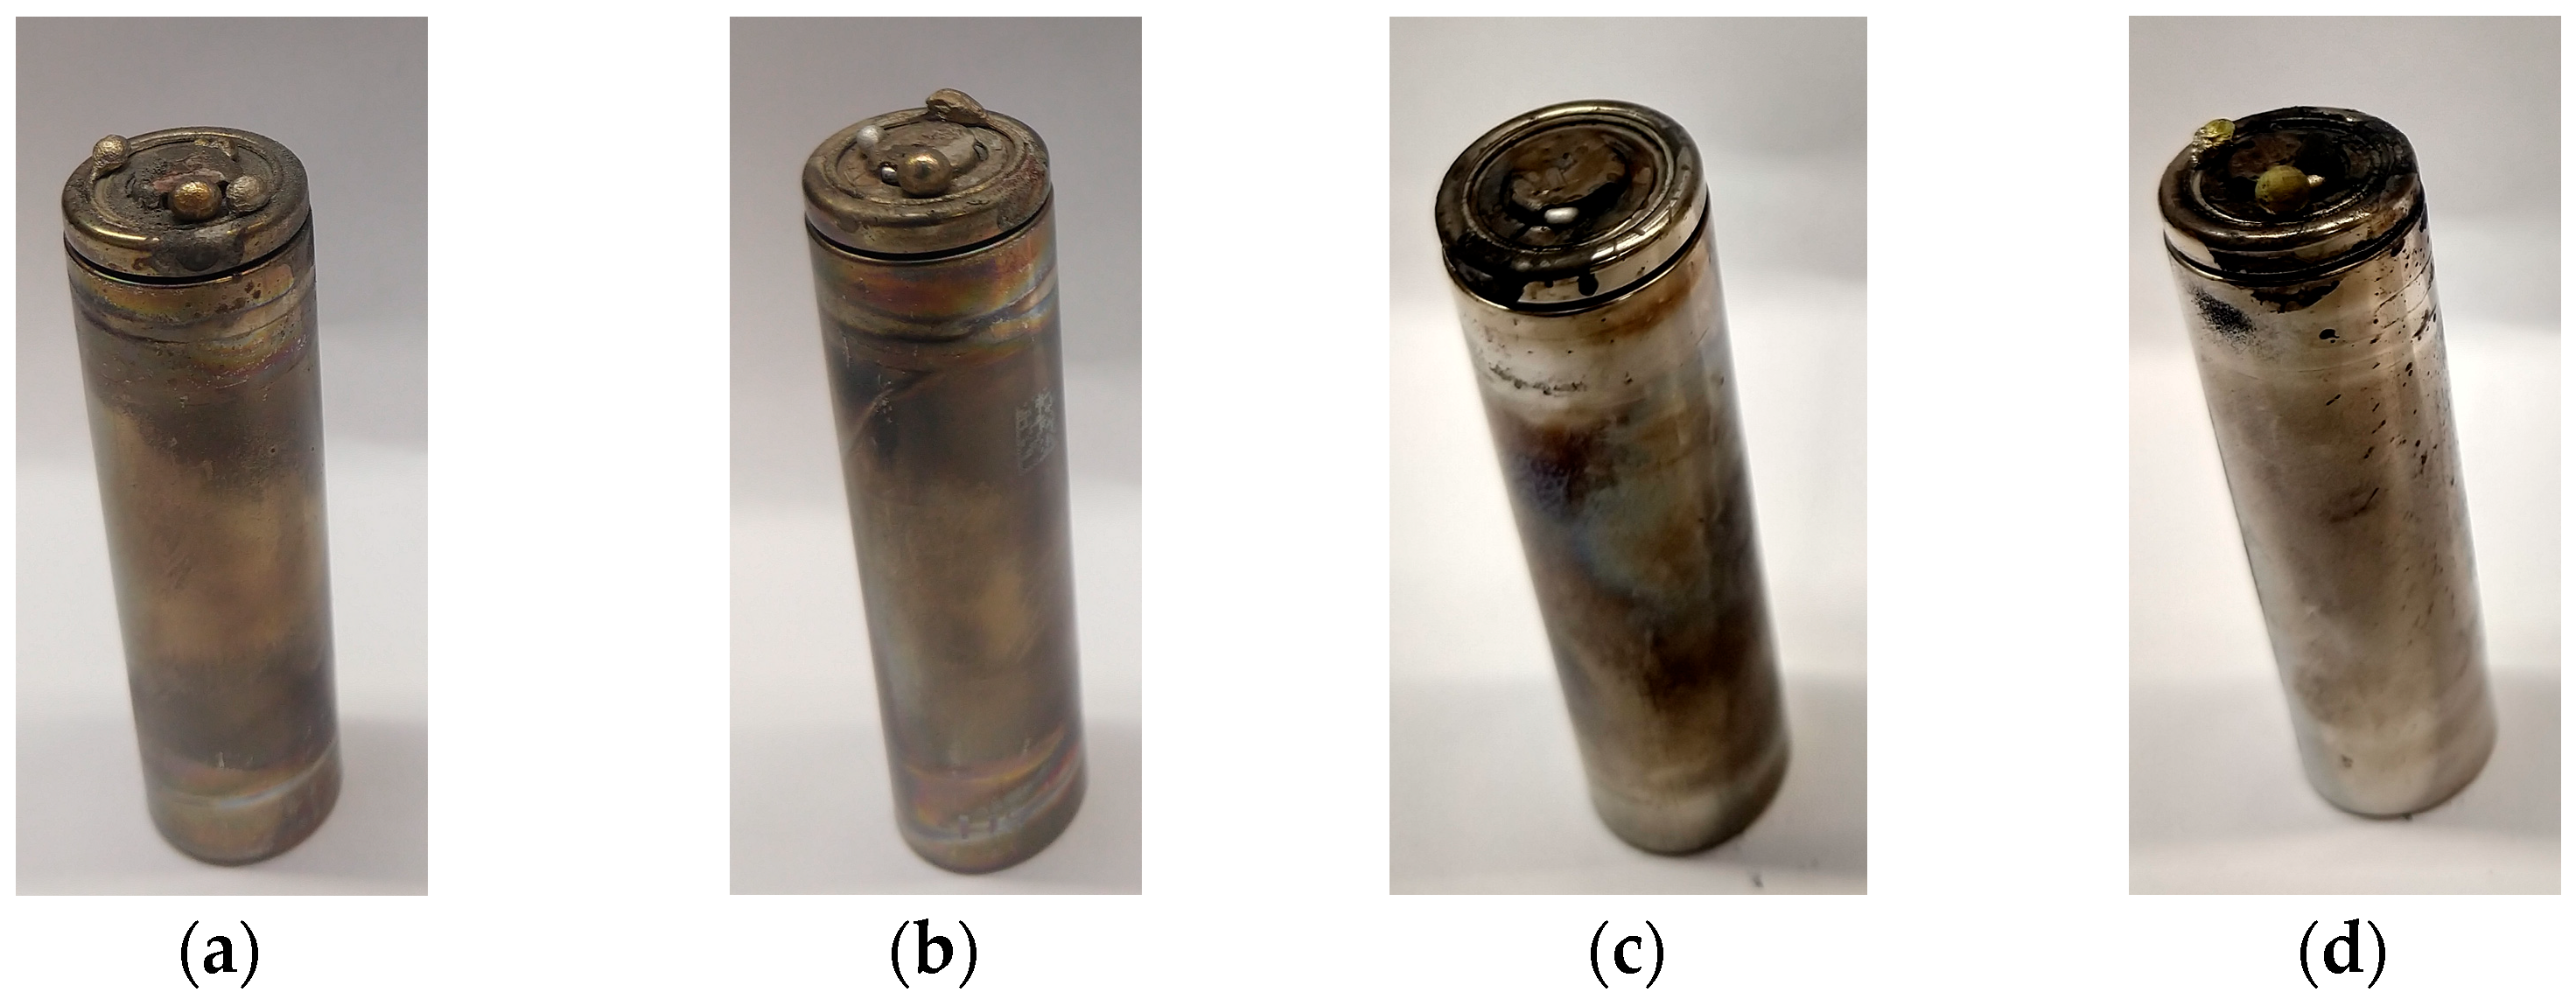
The condensed matter was collected at the outlet of the reactor on the primary filter (PTFE 5.0 µm). In Table 4 are reported the quantities gathered for each test, in the range 0.3–1% of the total mass loss of the cell, while Figure 7 and Figure 8 illustrate the filters and the correspondent cells after each test. The condensed phase collected on the primary filter was analyzed by the ATR-FT-IR spectrometer to determine the superficial composition, by SEM-EDS for the composition and the distribution of the metal particles and by ICP-OES and AAS for the quantification of the metals. From Figure 7, it is also evident that the metal case of the cell was not damaged during the abuse tests. Therefore, the material collected on the filter came from inside the cell through the vent valve and could be traced back to the electrolyte solution and electrode’s material.

3.3.1. Condensed-Phase Characterization: ATR-FT-IR Spectroscopy

Figure 9 illustrates the comparison between the spectra, in the percentage transmittance format (%T), of the condensed phase collected during the tests at 5 °C/min in air and N2, respectively.
Comparing the two spectra, it was possible to notice a difference in the transmittance (%T); in fact, the spectrum acquired on the sample obtained in air (red line) had lower transmittance values with more intense peaks (strong, s). By comparing the low wavenumbers range, between 1000 and 600 cm−1, it emerged that in air, there was a loss of information due to a huge number of unique peaks with a very low transmittance values, %T around 60%, instead of different peaks with small or medium intensity. The loss of information was attributable to the brown deposit on the filter, which caused a high absorbance of the IR wave in the range close to the visible spectrum.
Table 5 reports the wavenumbers (cm−1) of the transmittance peaks found in each sample with the relative force, very weak (vw), weak (w), medium (m), strong (s), and very strong (vs), and the attribution obtained by comparing the spectra with the library.
The analysis showed the presence of paraffin oil that could be related to the use of paraffin wax as a protective layer of the anode material or separator [25]. The paraffin oil was released during the increase in cell temperature: at about 55 °C, the wax melted and subsequently (>240 °C), it started to decompose [26]. In addition to paraffin oil, the main peaks due to polyethylene oxide (PEO) were identified [27]. PEO has attracted widespread attention as a solid base electrolyte because of its excellent salt-solvating ability and electrode interfacial compatibility [28]. PEO is also applied as a multifunctional binder to partially replace the commonly used PVDF binder. PEO has the advantages of a good adhesive quality, a high ionic conductivity, a high flexibility, a low cost, excellent processing properties, and environmental friendliness. The utilization of high-conductivity binders can significantly improve the battery cycling performance [29].

3.3.2. Condensed-Phase Characterization: SEM-EDS

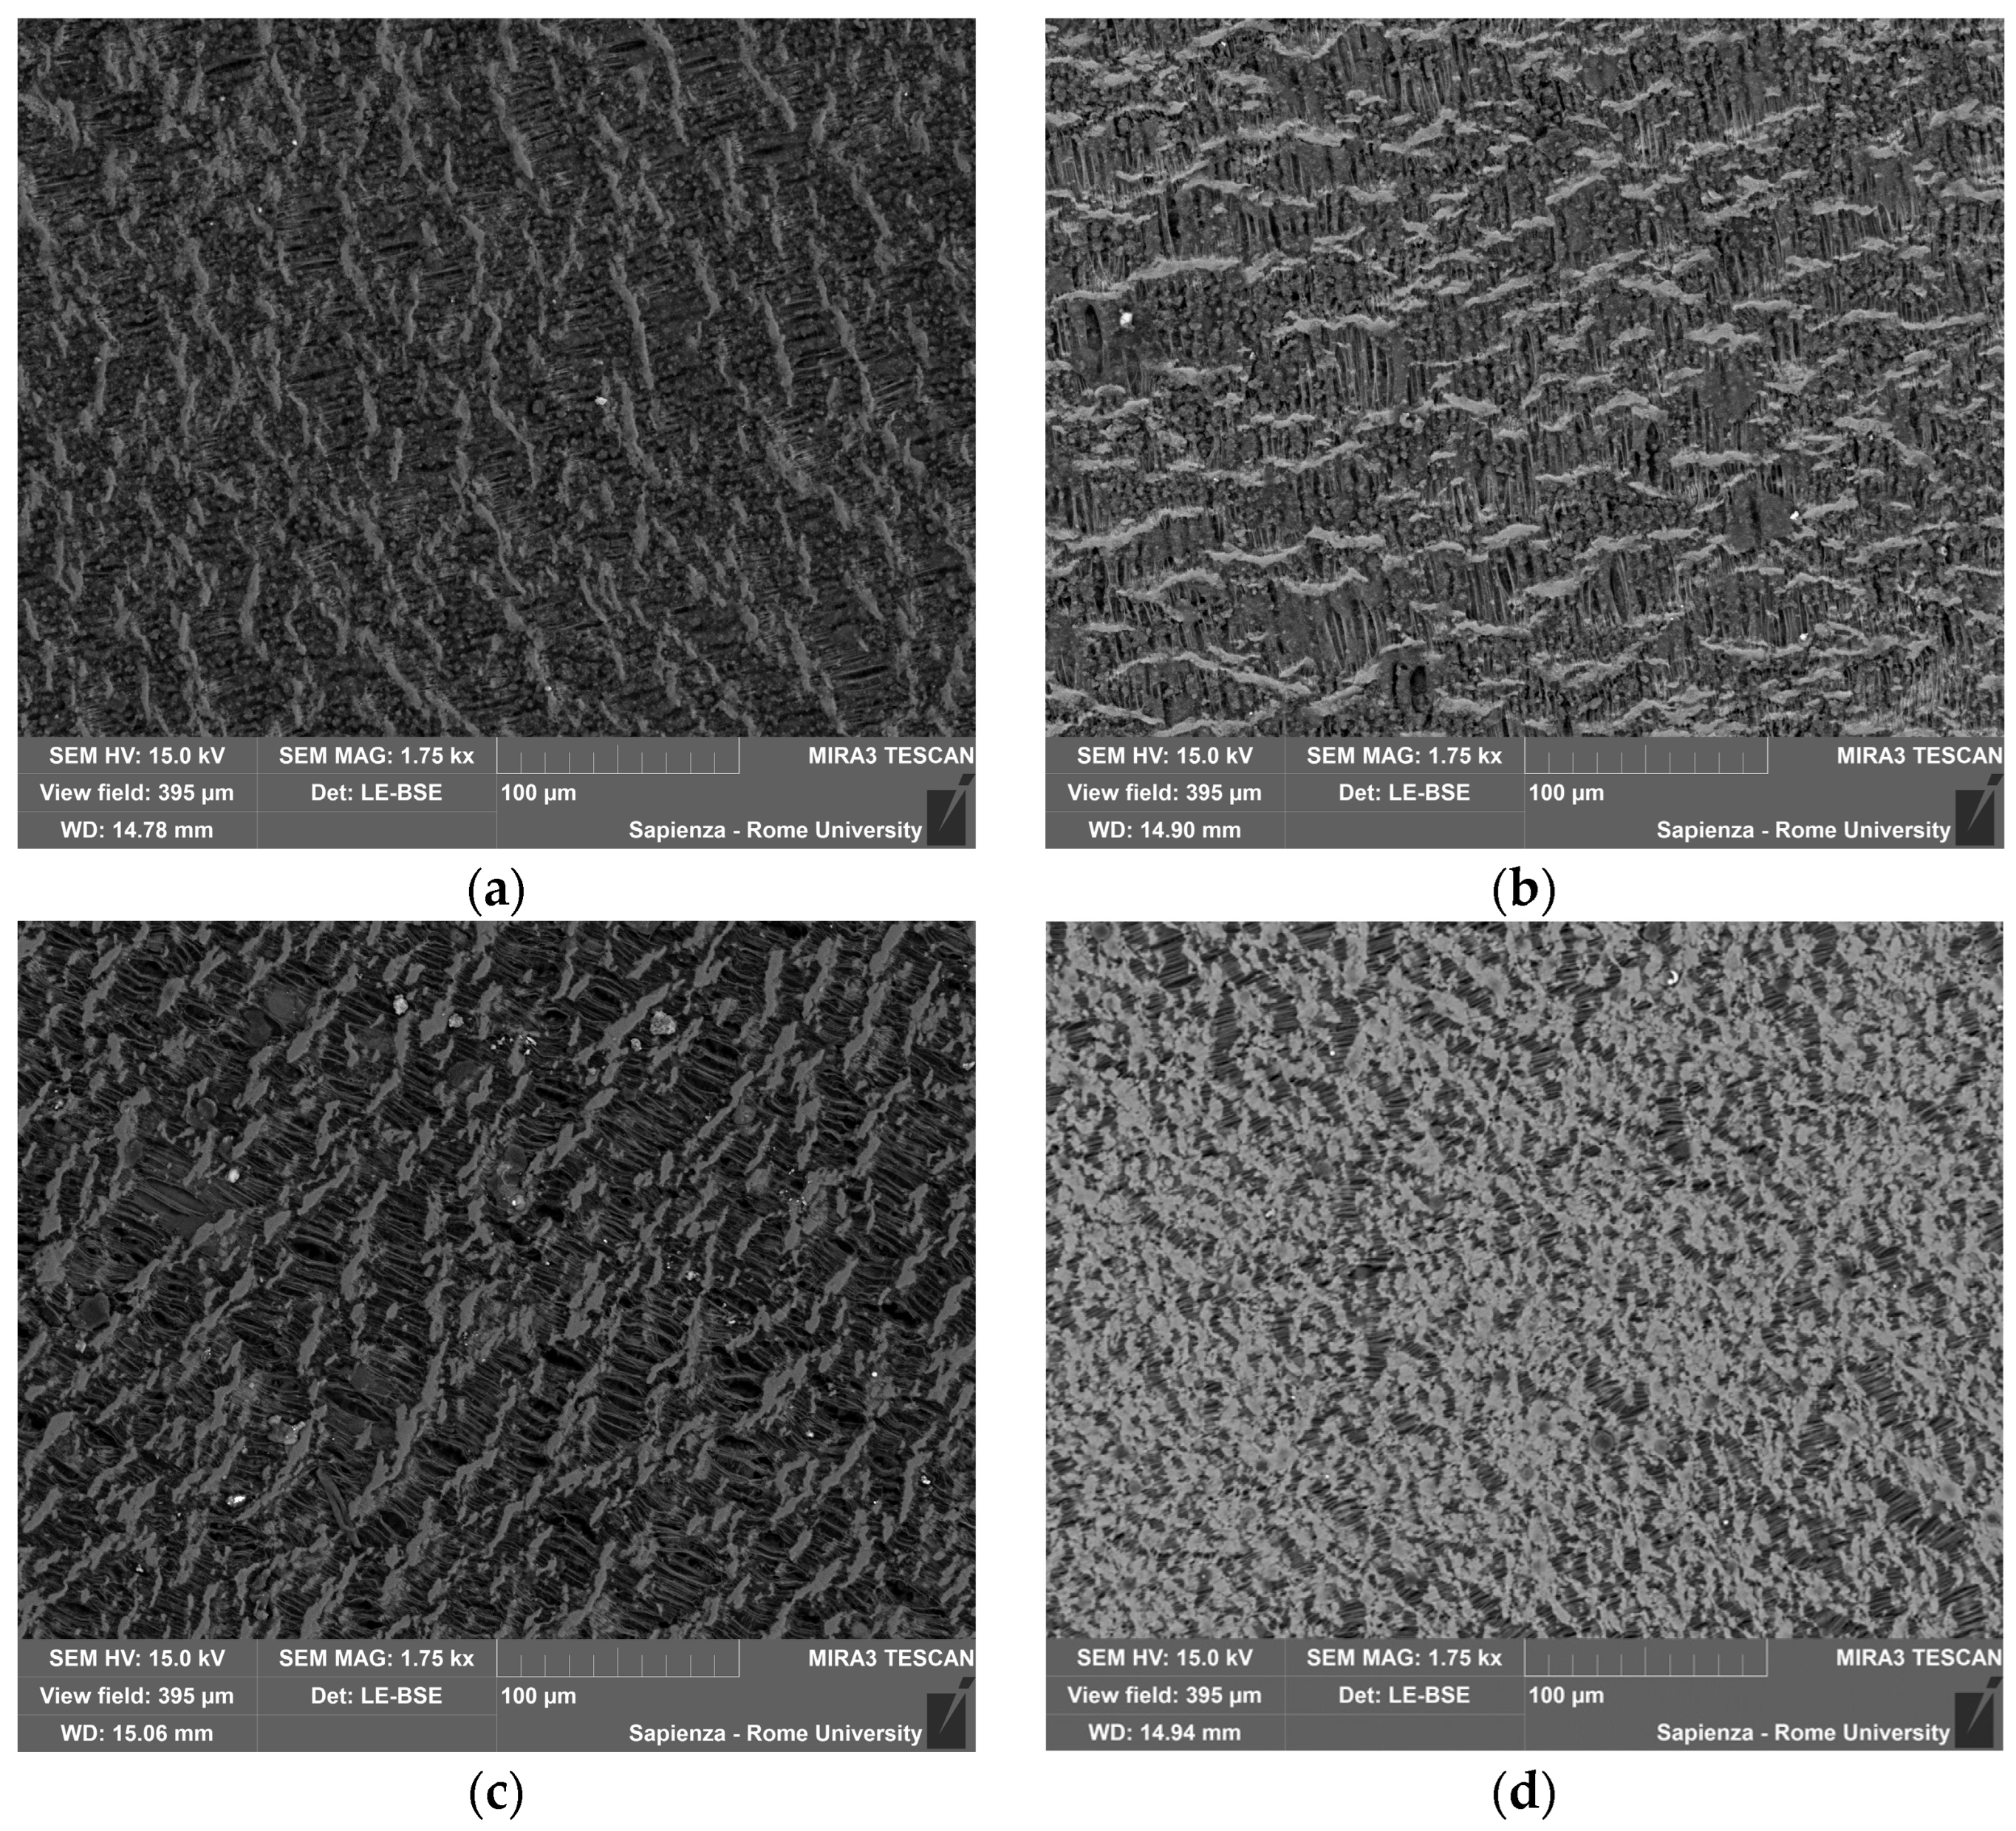
Figure 10 illustrates the SEM images of the surface of the filters collected for the tests in air at (a) 10 °C/min and (b) 5 °C/min and in N2 at (c) 10 °C/min and (d) 5 °C/min.
From the images obtained with the BSE detector, it was possible to highlight the compositional contrast at the expense of the structural morphology, which could be evaluated with the secondary electron detector (SE). From the images obtained on the test filters, shown in Figure 10, no compositional difference was observed between the various samples. In fact, in all the samples, there were small particles, lighter points with an almost spherical shape, dispersed on the filter surface. The composition of the filter was constant, even if acquired in the BSE detector; from the images, it was possible to observe the fibers and their texture, and the dimensions of the particles were significantly smaller than the filtering section.
By magnifying the different filter areas, it was possible to identify particles with different compositions and diameters. The EDS detector was used to identify the chemical composition of some metallic particles, while the diameter of these particles was calculated using software.
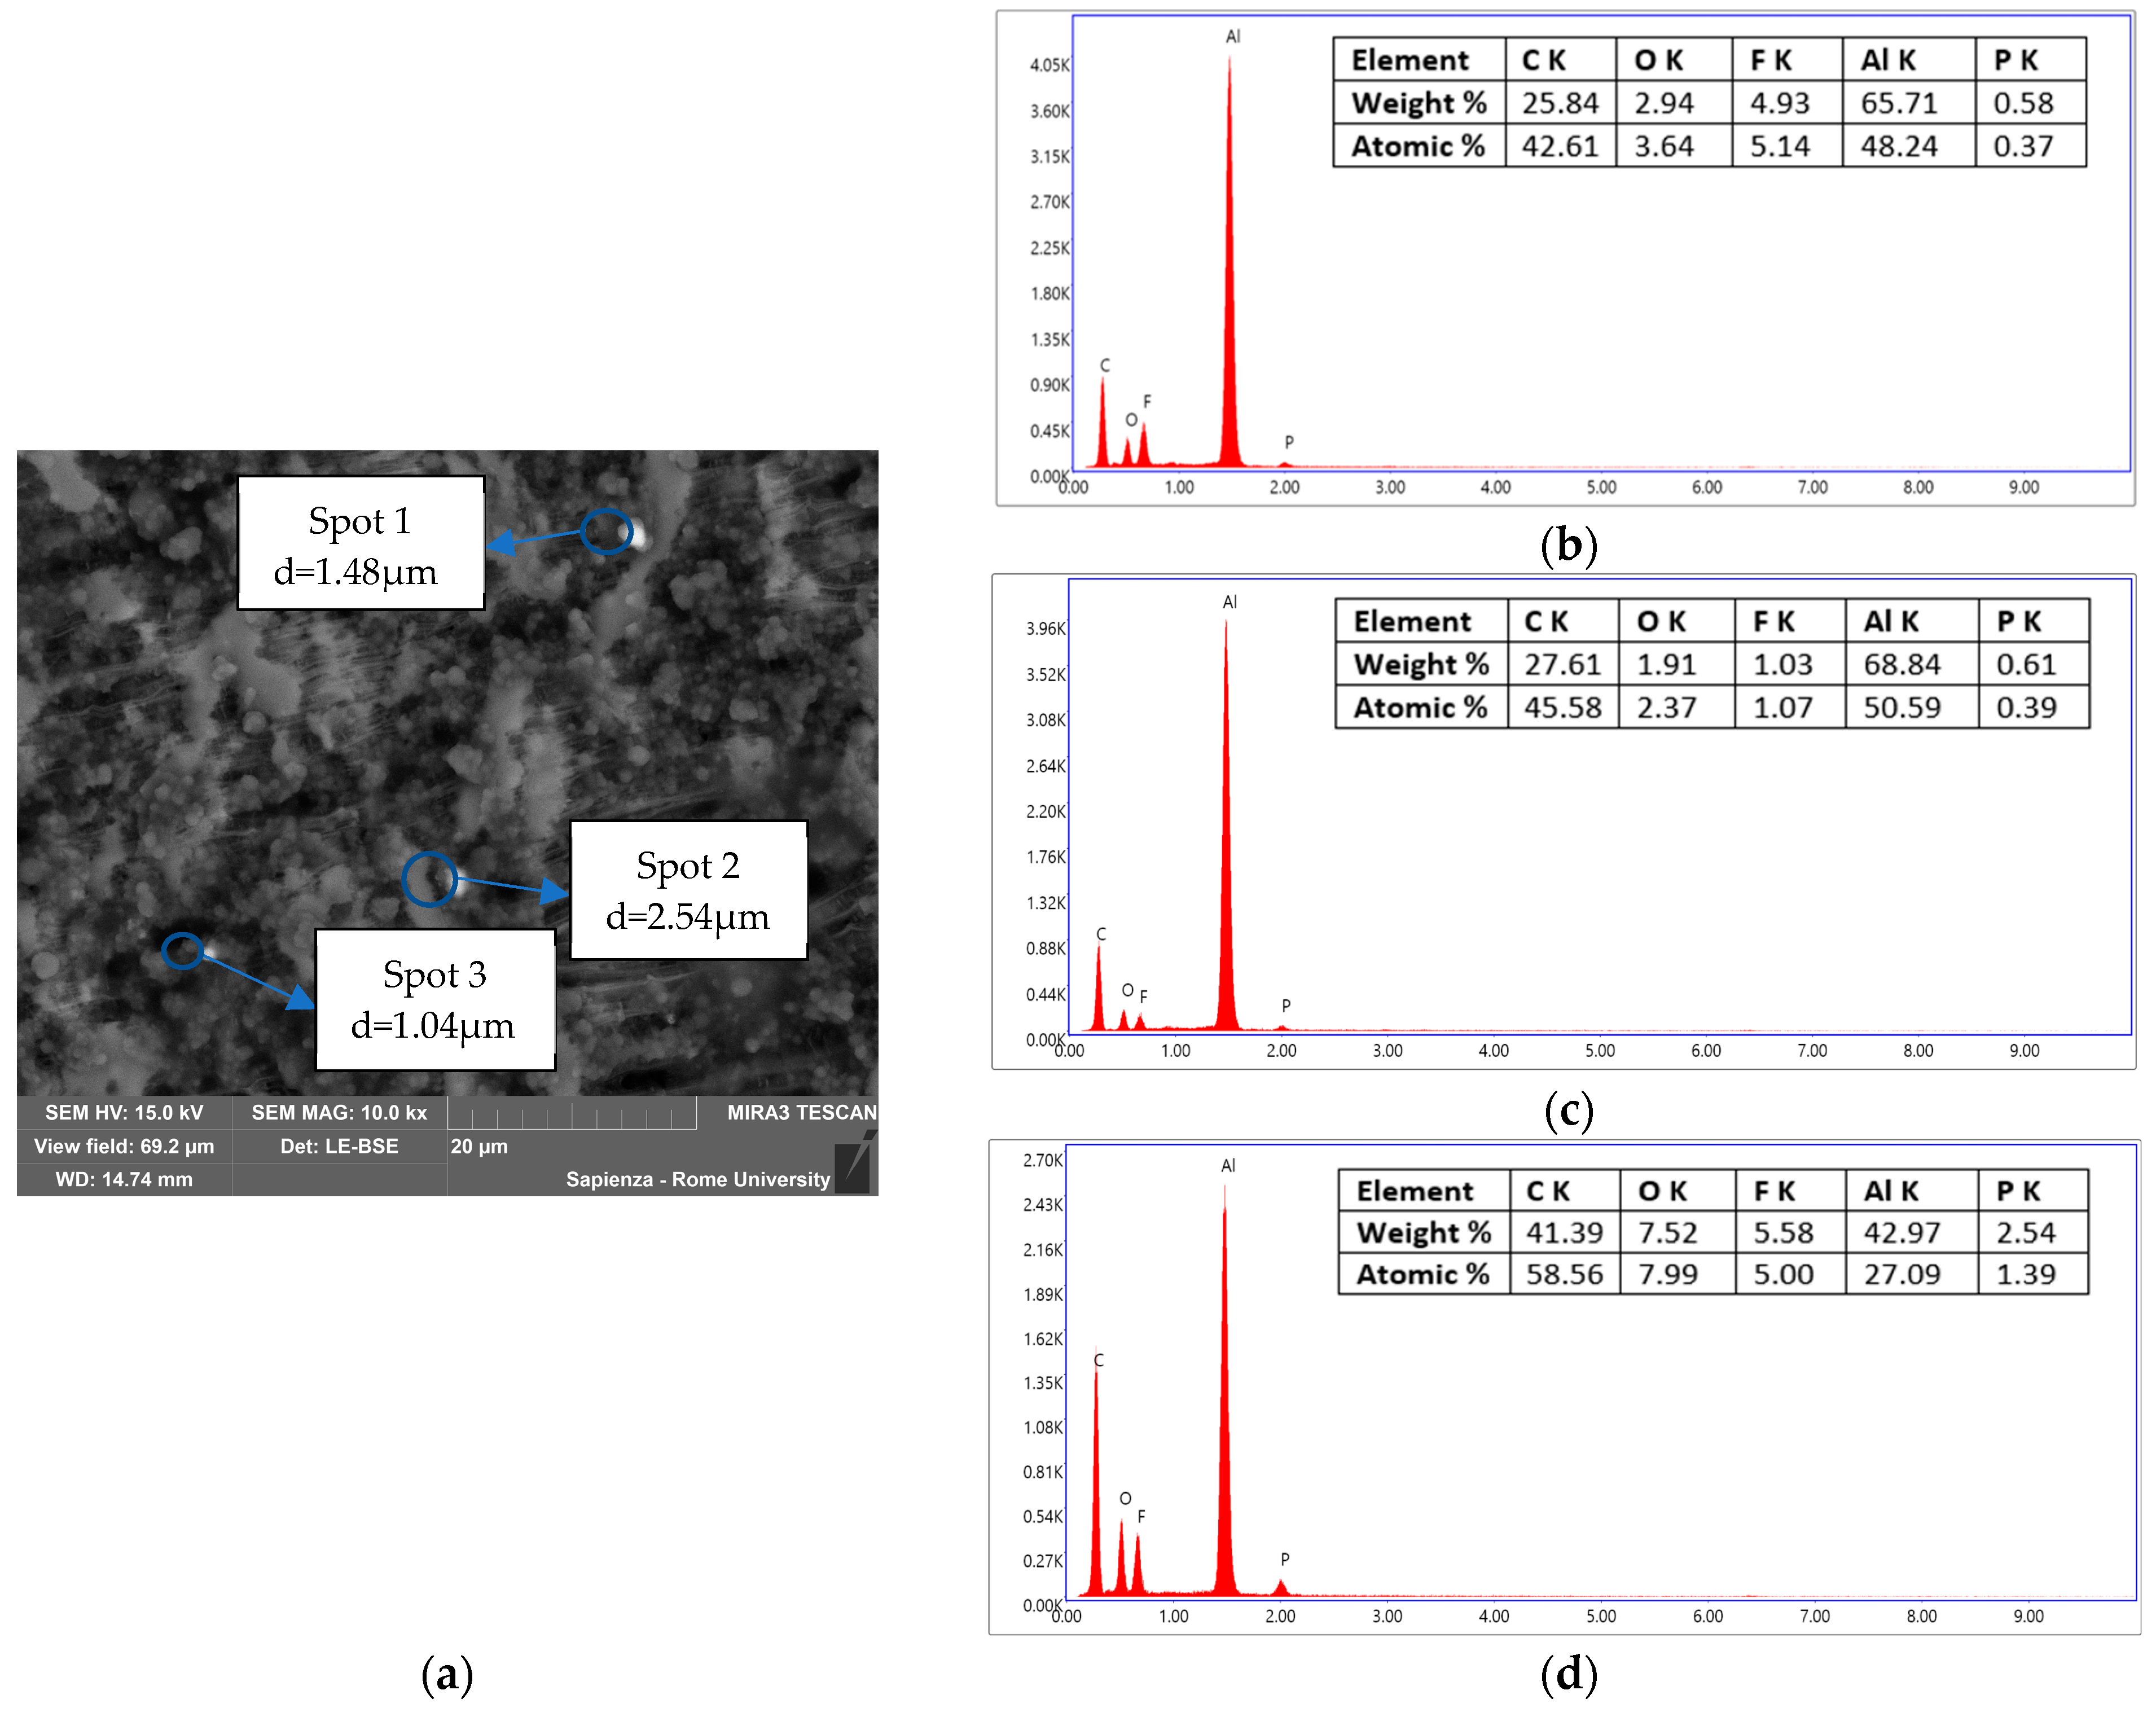
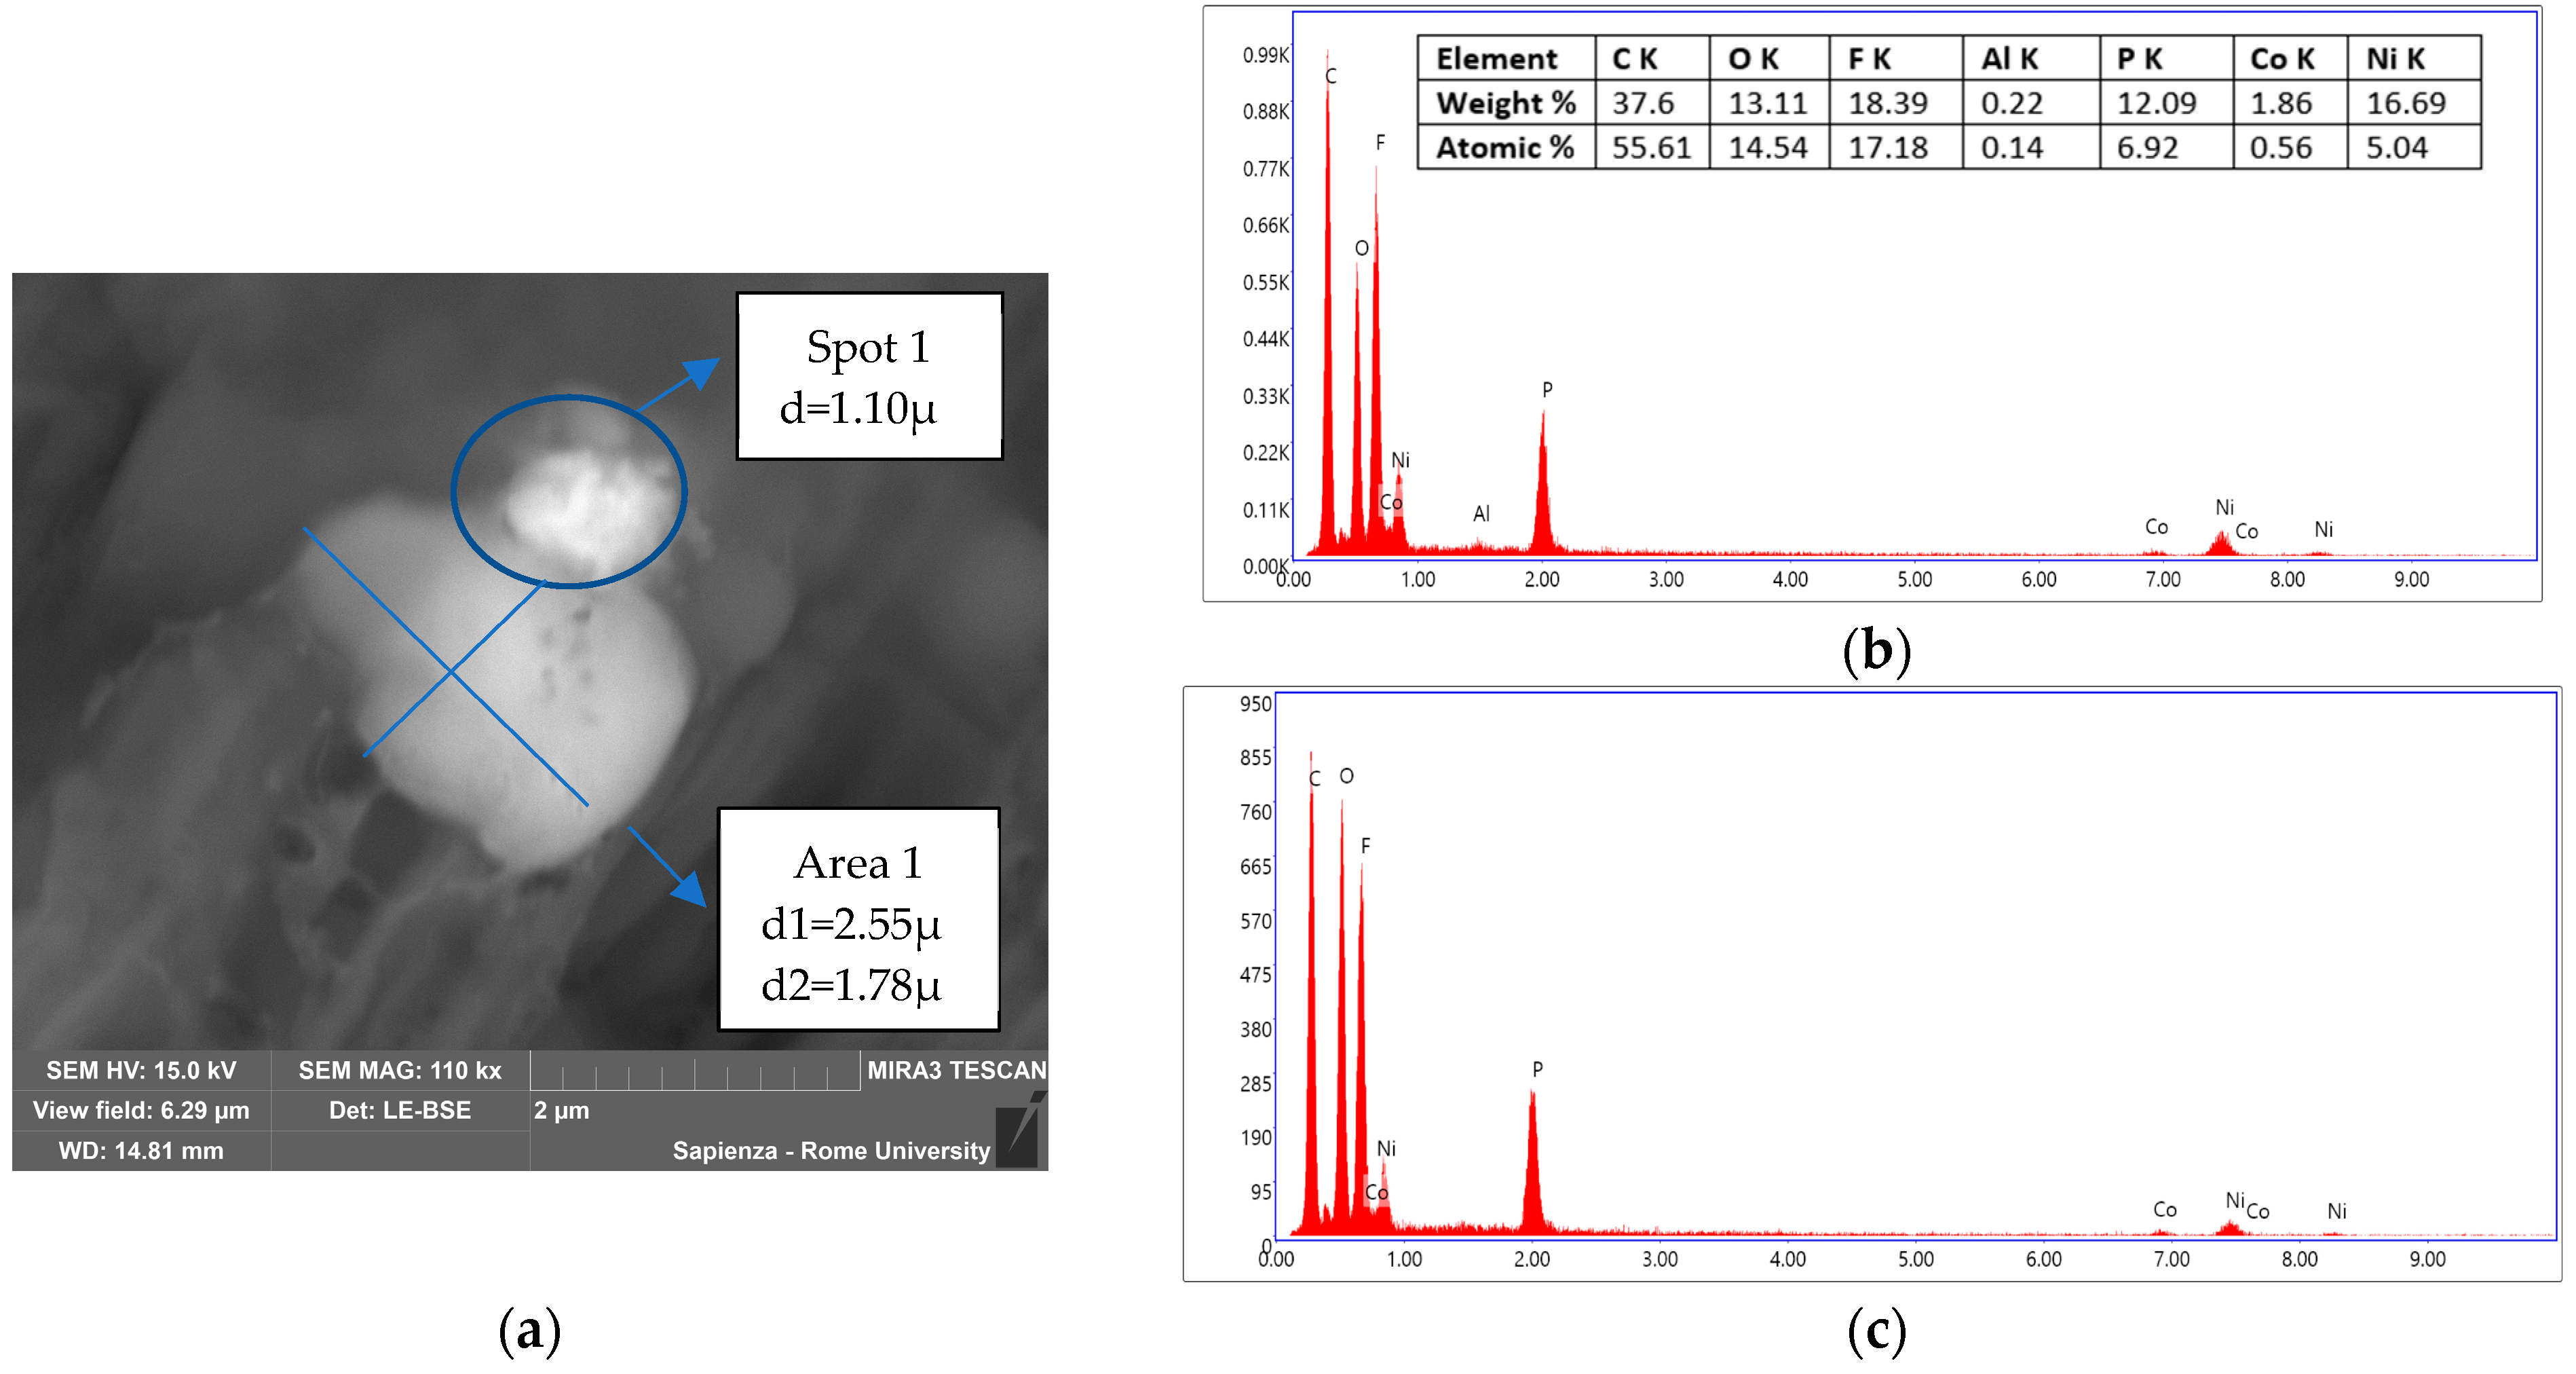
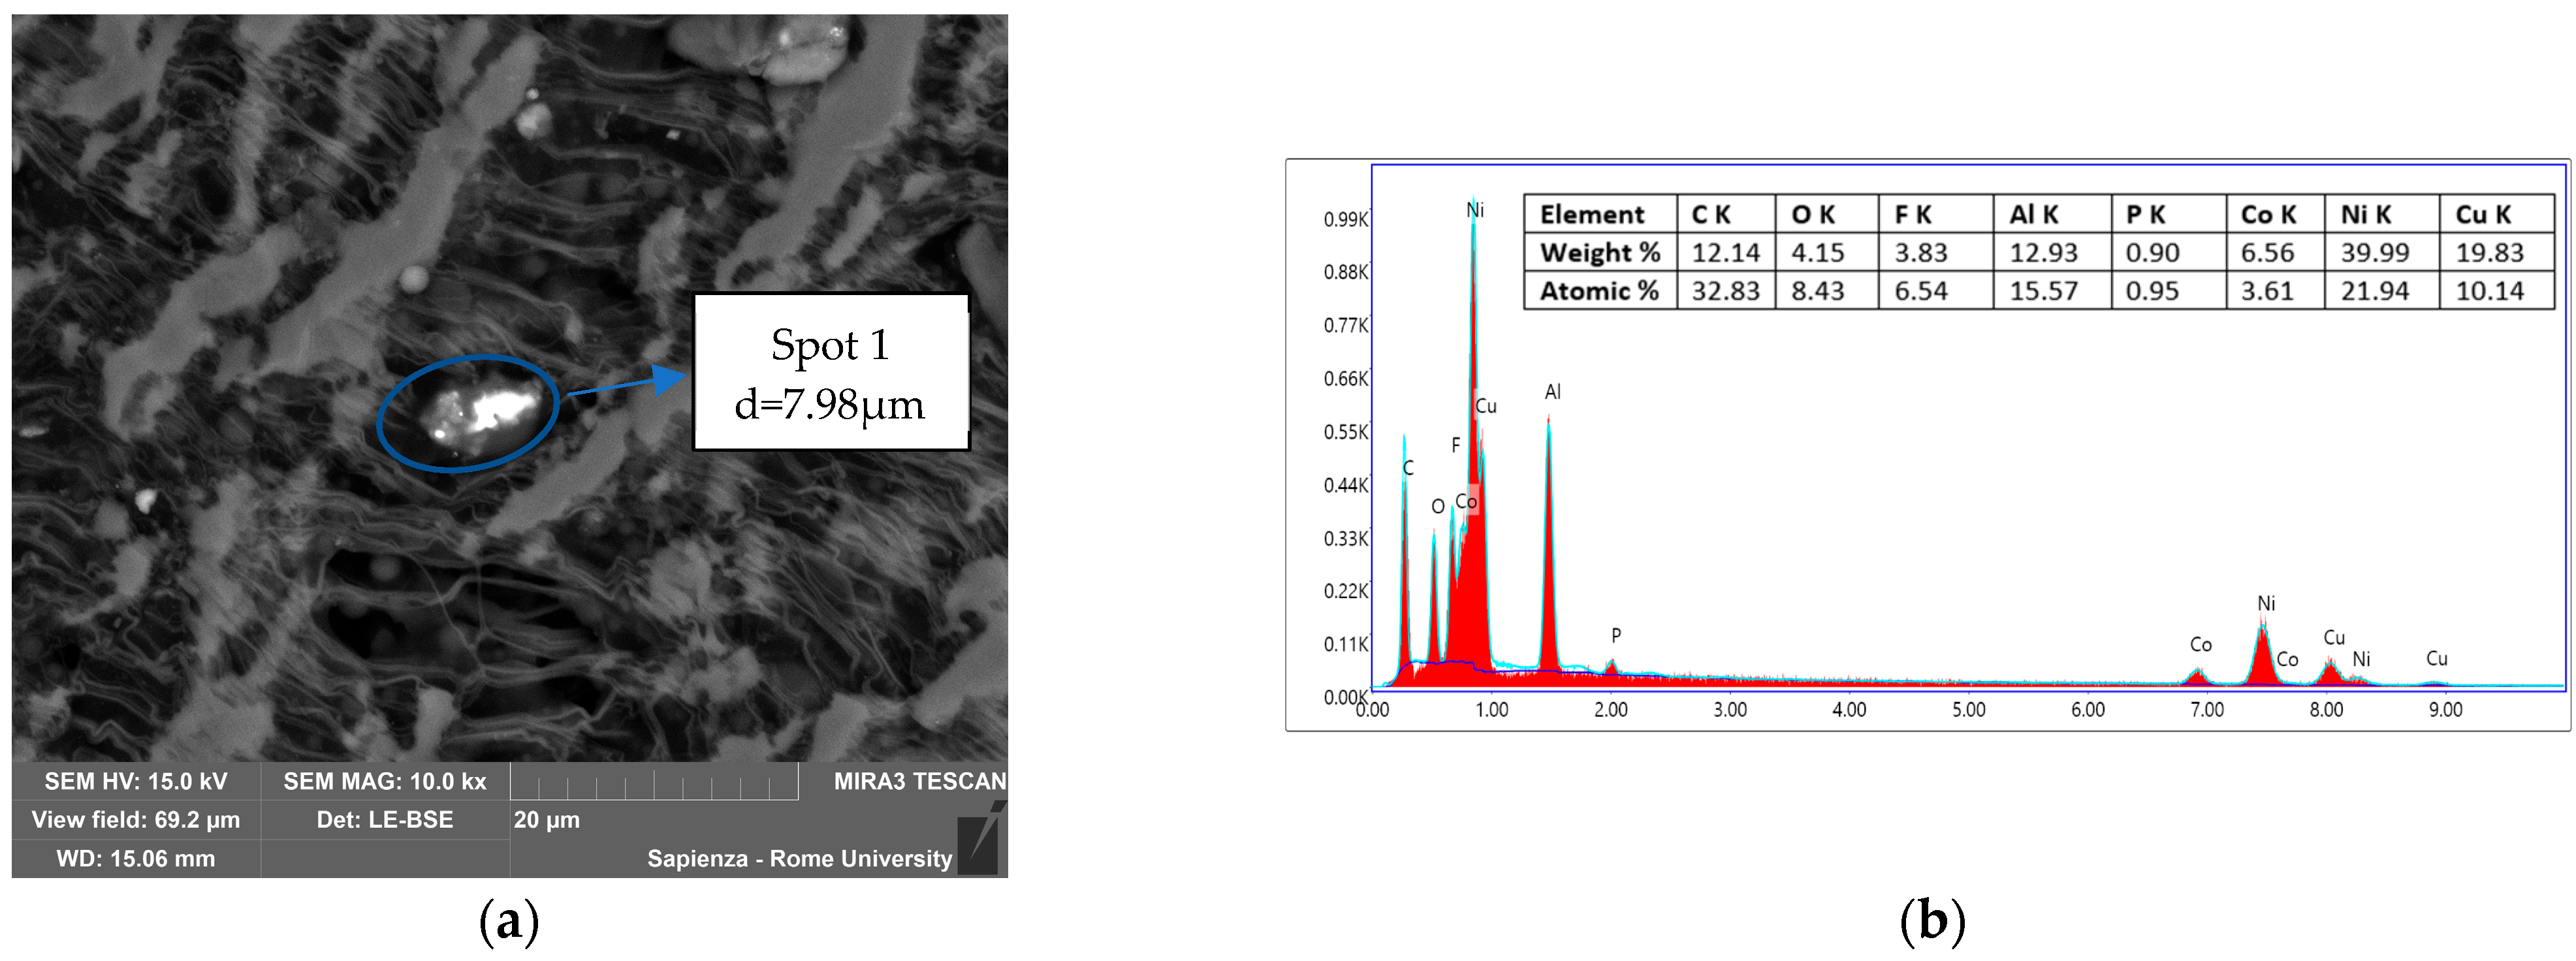
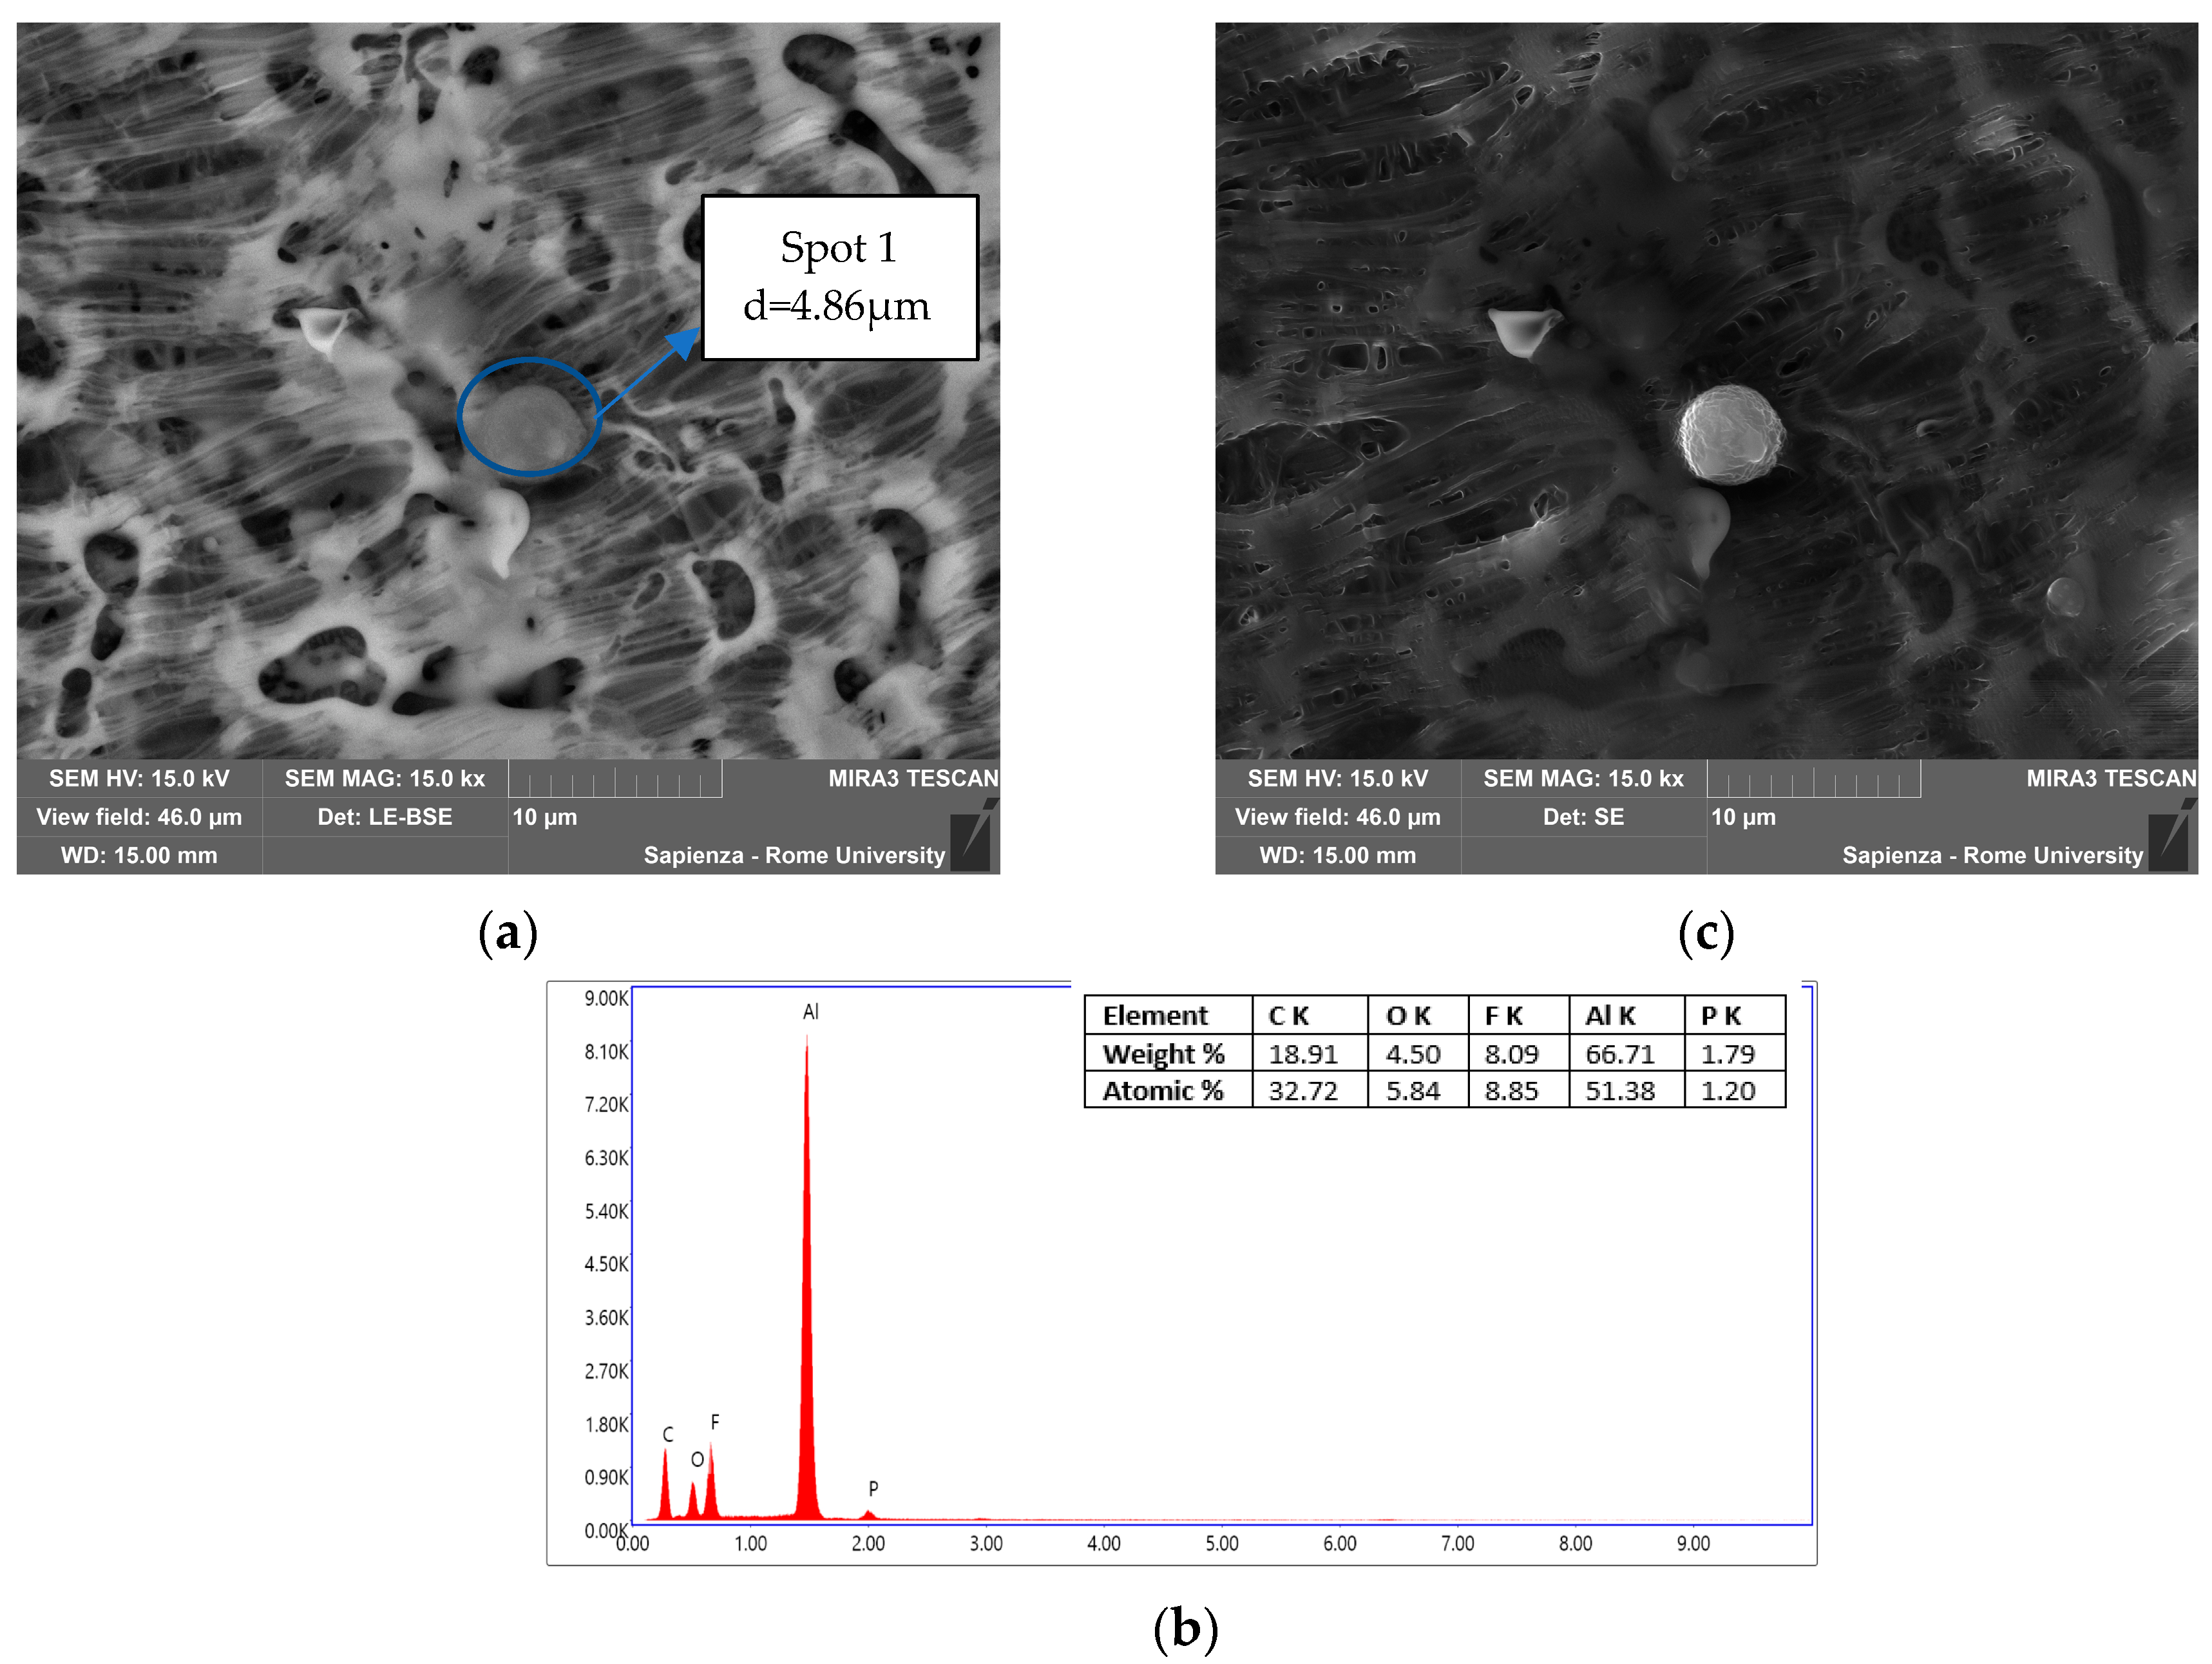
Figure 11, Figure 12, Figure 13 and Figure 14 illustrate the most significant images of each filter with the magnification and its spot and/or area analyzed, the diameter of the particles, and the respective EDS spectra from the compositional analysis. The results of the analyses are reported in the following order: in Figure 11, tests at 10 °C/min in air; in Figure 12, tests at 5 °C/min in air; in Figure 13, tests at 10 °C/min in N2; and in Figure 14, tests at 5 °C/min in N2.
The chemical composition and diameters of the particles observed in the sample of Figure 11 were homogeneous. In fact, they had the same chemical composition: Al, O, F, and P with a similar percentage relationship among the investigated spots and comparable diameters, d1 = 1.48 µm, d2 = 1.04 µm and d3 = 2.54 µm, between the different particles. The presence of F and P was common and was traceable to the electrolyte solution in which the Li-salt (LiFP6) was dissolved in organic carbonates (i.e., DEC and EC). The presence of lithium could not be verified by this analysis; in fact, SEM-EDX only detected Z > 3; Li was too light and could not be detected for the very low energy of the characteristic radiation. The presence of Li was demonstrated by the ICP and AAS analysis later reported. Al and O were instead attributable to the composition of the cathode made of lithium nickel cobalt aluminum oxides (NCA). The presence of C was due to the initial treatment of the sample, graphitization, so it was therefore not possible to distinguish it from the graphite of the anode material.
The agglomerate in Figure 12a could be divided into two distinct particles, the upper one with d = 1.10 µm and the inferior one with d1 = 2.55 µm and d2 = 1.78 µm. The main difference between the two in terms of composition was the presence of Al in the upper one and a greater amount of oxygen in the inferior one. Moreover, in that case, P and F were found and attributable to the electrolyte salt, while the material coming from the electrodes, specifically the cathode, was confirmed by the copresence, in Spot 1, of Ni, Co, and Al, presumably in oxidized form, and in Area 1 by the copresence of Ni and Co.
In the latter sample, in Figure 13, the particle had no perfectly spherical geometry, d = 7.98 µm, and compounds from both electrodes (Al, Ni, Co from the cathode and Cu from the anode), which can always be in the form of oxide due to the oxygen copresence, and electrolyte salts (P and F) were present. In this sample the contribution of the electrodes, specifically the active cathode material and the anode collector, is higher, in weight %, than the previous samples. The presence of Al, Co, and Ni, tendentially in oxidized form, was due to the degradation of the cathode’s active material, while the Cu was due to the degradation of the anode collector.
Also in this sample, Figure 14 shows a spherical particle, with d = 4.86 µm, composed mainly of Al, in the form of an oxide due to the copresence of O, and F and P attributable to the electrolyte solution.
Comparing the results of different feed-gas composition, it was observed that in air, the particles had a more spherical shape and smaller diameters, around an average value of 1.54 ± 0.69 µm. In nitrogen, instead, the particles had a less spherical shape, agglomeration, and much larger diameters, 6.42 ± 2.21 µm. In terms of composition, however, there was the constant presence of F, P, O, and Al while the presence of Ni, Co, and Cu varied depending on the sample.

3.3.3. Condensed-Phase Characterization: ICP-OES and AAS

The metals present in the condensed phase were quantified by an AAS analysis (Li, Co, Mn, Ni, and Cu) and ICP-OES (Al). Table 6 reports the quantification of the metal expressed in mg/m3: it was calculated by dividing the mass in mg of metals as obtained from the ICP-OES and AAS analysis by the volume of gas passed through the filter during the test. The concentration of metals is usually lower than the limit of detection, except for some metals. The presence of Li could be due to the electrolyte solution, made of organic carbonates, in which the Li-salt was dissolved; in particular, for the cell examined, it was LiFP6 dissolved in DMC and EC. As observed by the SEM-EDS analysis, aluminum was the metal with the highest concentration, and it was present in all the samples.

4. Discussion

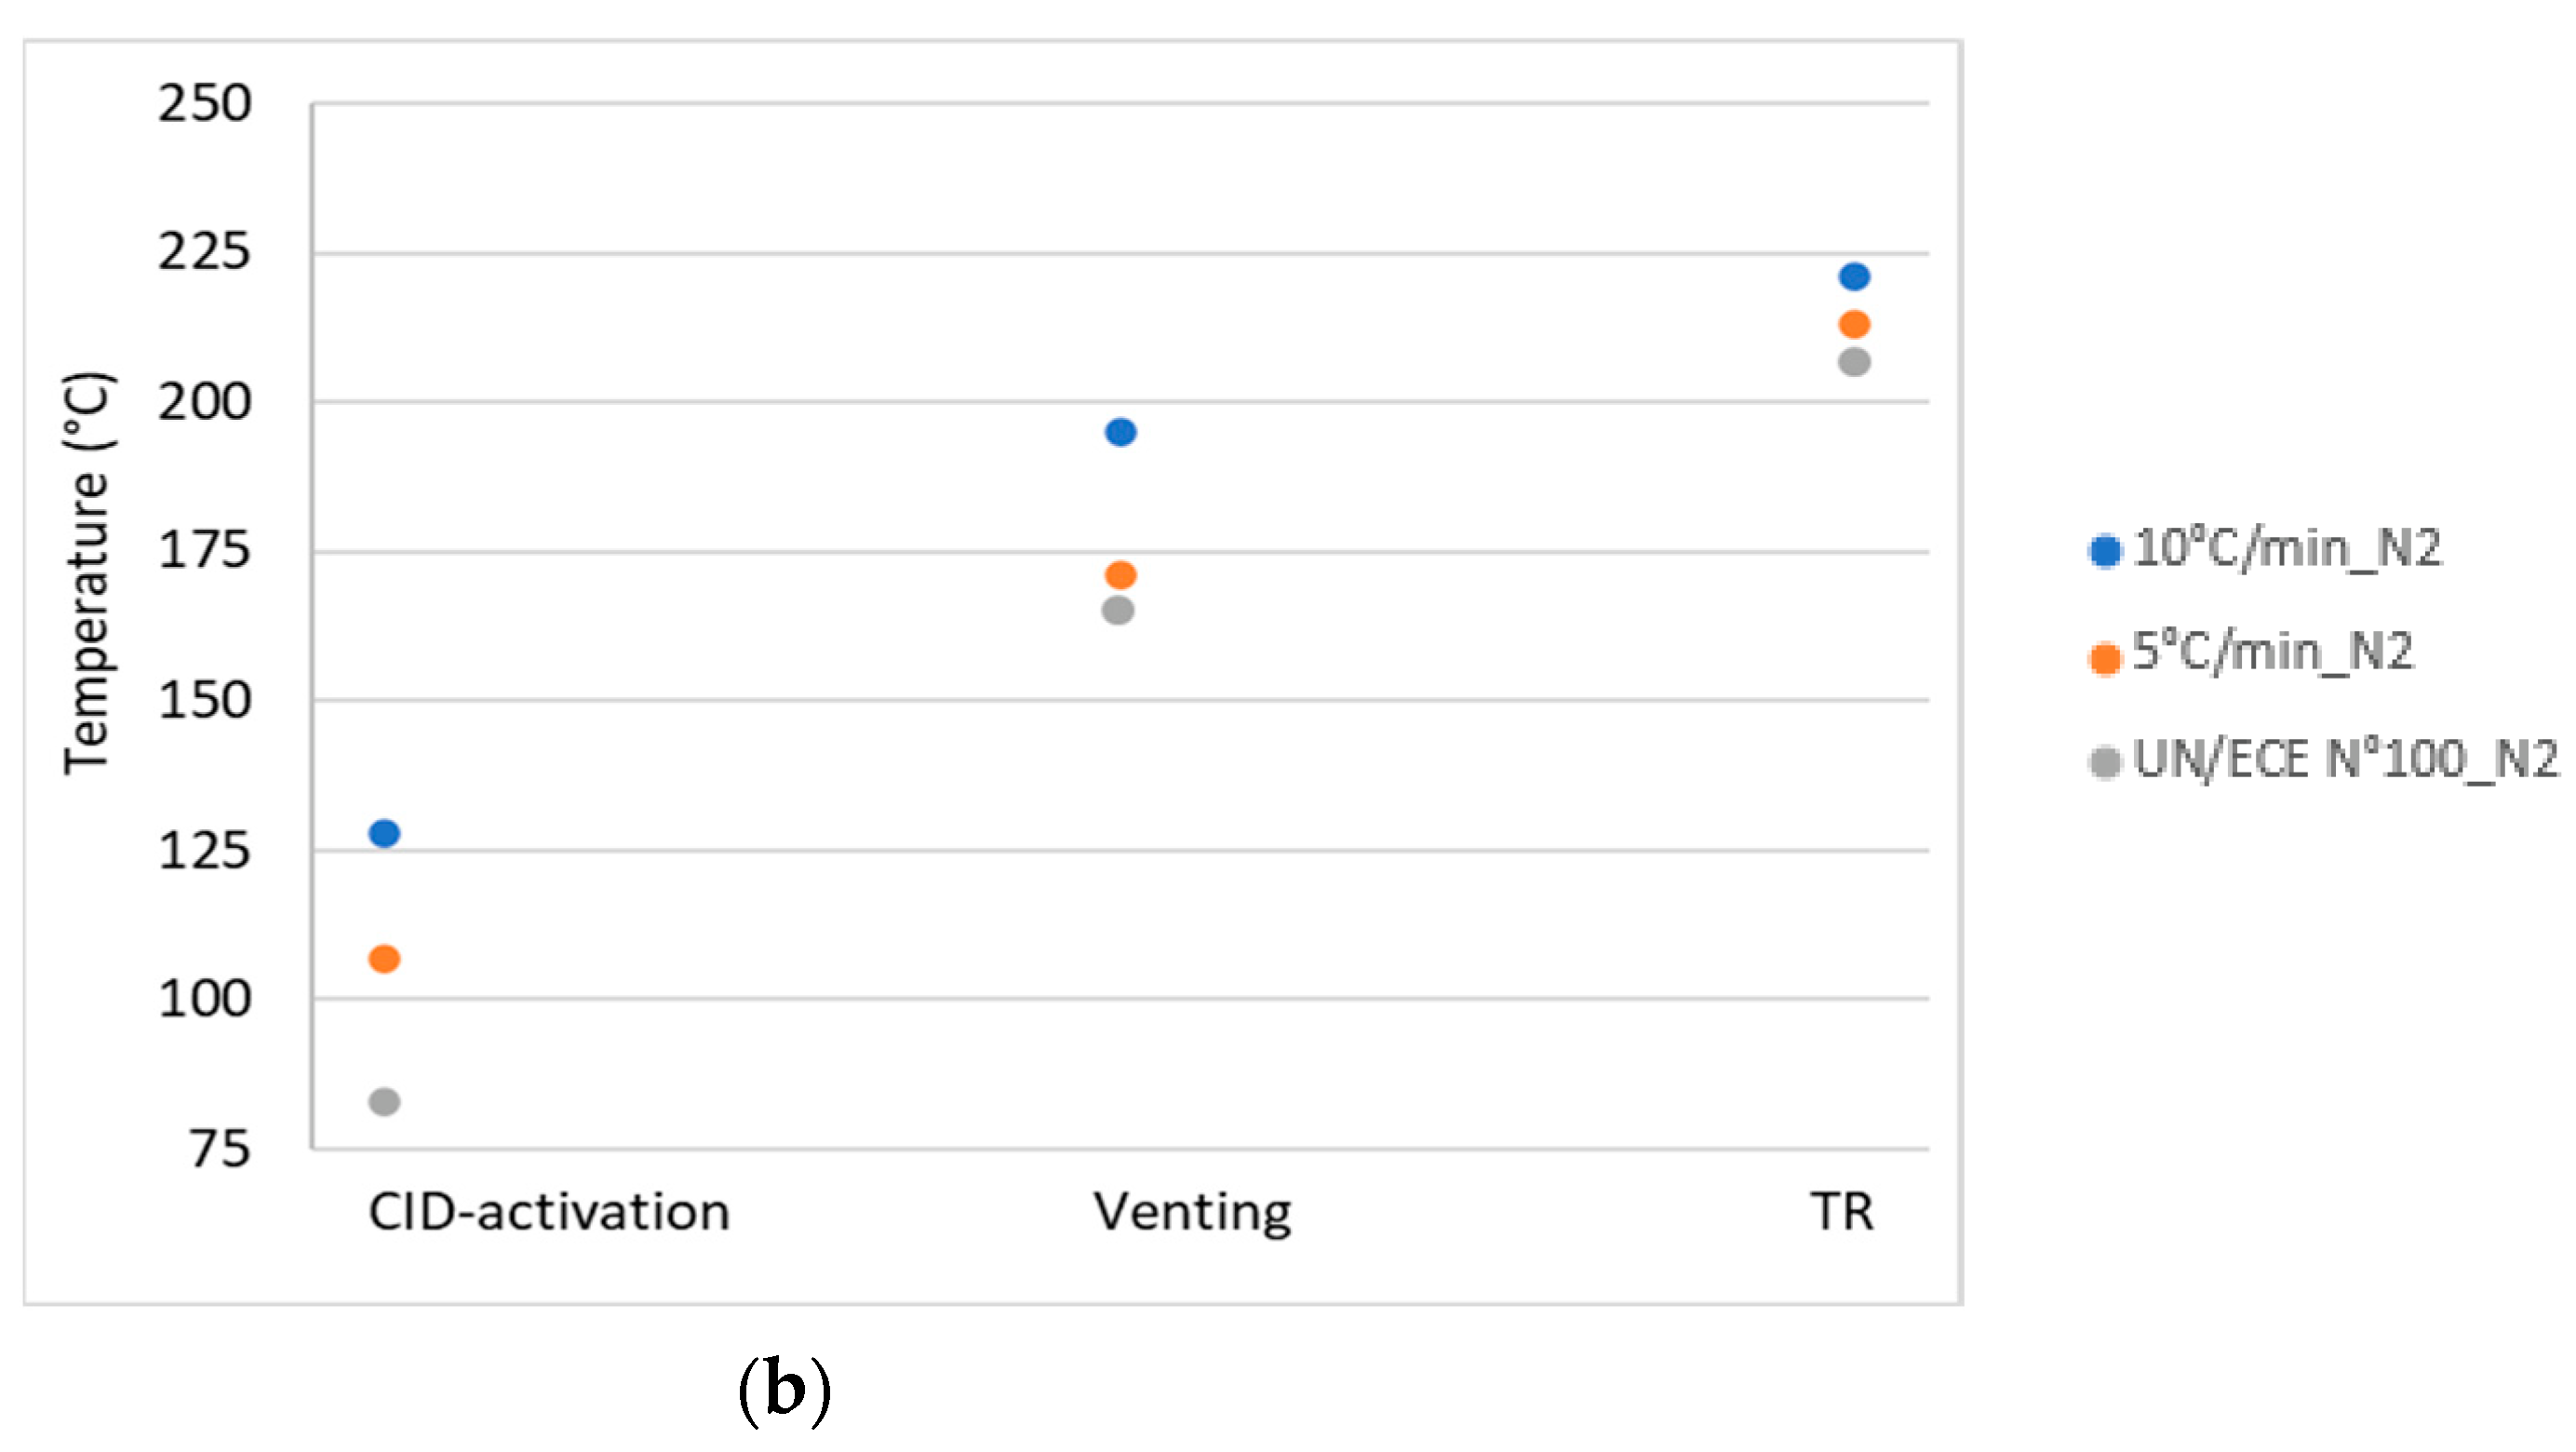
The temperature and pressure values of the key events for the different thermal abuse test conditions, reported in Table 3, were compared with the values obtained by the thermal stability test, the UN/ECE Regulation No. 100 [15]. Figure 15 illustrates the comparison of the results (a) in air and (b) in N2 for the temperature of the key events: CID activation, venting, and TR.
In terms of temperature the values recorded for the key events, in all test conditions, were higher than the limit values obtained by applying the thermal stability test reported in the UN/ECE Regulation No. 100. This result showed that the in the test conditions investigated, the key events occurred at higher temperatures than those predicted by the thermal stability test, confirming the ability of the latter to give a conservative estimation of the key temperatures. On the other hand, the activation of the protective systems (CID, venting) of the cell at higher temperatures increased the possibility of secondary reactions inside the cell, with a consequent increase in dangerous emissions. For the pressure, an increase in the reactor pressure was observed at each key event, regardless of the conditions of the abuse test. The increase in pressure was related to the release of the material (gases and condensed phase) from the cell because of the increase in the internal pressure of the cell due to heating.
Figure 5 and Figure 6 illustrate that the profiles of the emitted gases were similar in air and N2 for most of the gases, except for carbon dioxide, for which higher concentrations were measured in air than in nitrogen because of the combustion reactions of electrolyte solvents, and for carbon monoxide, which is the main product of the carbonates’ decomposition in nitrogen. As reported by the National Institute for Occupational Safety and Health (NIOSH) the immediately dangerous to life or health (IDLH) values for CO is 1200 ppm [30]. The CO concentrations obtained during the tests (maximum value in the range of 35,000–60,900 ppmv) were higher than the IDLH. However, the most hazardous substance detected was HF, produced by the reaction of the Li-salt (LiFP6) present in the electrolyte solution [7]. As reported by the NIOSH, the IDLH for HF is 30 ppm [31]. Figure 5 illustrates that the concentrations obtained in the different tests were significantly higher than that limit. In fact, a maximum value of 1300–1700 ppmv was measured in the tests.
A similar analysis could be made for metals, both in particle size and chemical composition. By cross-checking the data obtained from the ATR-FT-IR analyses, the SEM images with related EDS analyses and ICP-AAS analyses, it was possible to trace the condensed matter emitted by the electrolyte solution, i.e., Li, P, F, and PEO, to the degradation of the separator, i.e., the paraffinic wax and PEO, and the electrode material, i.e., Al, Ni, Co, and O.
The degradation of the separator and the protective layer was assessed by an ATR-FT-IR analysis on the filter as it stood. The wavenumbers obtained, reported in Table 5, identified both peaks due to polyethylene oxide and paraffin oil. The microparticles of the latter were used on the anode or on the separator to avoid, in case of abuse, the flow of lithium ions between the two electrodes. As it is possible to observe from the Figure 6, the filters where the condensed matter was deposited differed in the amount of collected material; in particular, the brown deposit, probably due to soot particles, was more homogeneously dispersed on the whole surface of the filter in the tests performed in air than in N2. This difference was due to combustion reactions that can occur in the oxidative environment generating soot particles.
From the EDS analysis, it was possible to obtain an identification and a distribution of the metals. In terms of composition, the presence of F, P, and O was observed in all the samples, while the amounts of Al, Ni, and Co varied depending on the sample, but their distribution was similar to that of O, allowing us to assume that the electrode metals, Ni, Co, and Al, were present as oxides. For the Ni emissions, the permissible exposure limits for airborne contaminants values have been reported by the Occupational Safety and Health Administration (OSHA) [32]. For Ni, the limit value (8 h time weighted average) was 1 mg/m3, higher that the value obtained by the filter analysis, but it referred to a longer exposure time than during the tests. Another important aspect that must be evaluated is the dimension of the particles or metal agglomerates. SEM images showed the presence of particles and/or metal agglomerates, with an average diameter of 1.54 ± 0.69 µm. These particles, if dispersed in the air during a fire of Li-ion batteries, contribute to the rise of PM 2.5, which can be inhaled, causing effects both in the short and long term depending on the toxicity of the compounds. For the analyzed NCA cell, the particles were composed of different metal (Li, Ni, and Co) oxides, carbonates, fluorinates and phosphates. From the quantification through ICP-OES and AAS, it was possible to evaluate the metal concentration in the emissions of 0.02–0.017 mg/m3 for Li and of 0.14–0.34 mg/m3 for Al.

5. Conclusions

Thermal abuse tests were conducted in a tubular reactor on NCA 18650 cells, while monitoring during the tests the cell surface temperature, the pressure, and the gases emitted by FT-IR spectroscopy and characterizing the condensed-phase emissions by ATR-FT-IR, SEM-EDS, ICP-OES, and AAS.
In terms of temperature, the values recorded for the key events, the CID activation, venting, and TR, were higher in the thermal abuse tests than the values obtained from the tests of the UN/ECE Regulation No. 100. This result demonstrated that the limit values obtained from the UN/ECE Regulation No. 100 were conservative with respect to the key fire risk events. On the other hand, in the tests at a constant heating rate, higher values of the peak temperature were reached (526–550 °C), which increased the risk of secondary reactions and possible domino effects. Another risk was correlated to the pressure generated by the release of the gases from the cell, once the safety systems were activated.
The risk of LIBs is not just correlated to the temperature and pressure reached during the key events but also to the toxicity of the products, in gas or condensed phase, that are released during and/or remain after the fire. Comparing the concentration values of CO and the HF with the IDLH, it emerged that the measured values were significantly higher.
For the metal particles (Li, Ni, Co, Al), diameters of 1.54 ± 0.69 µm were measured, indicating that they could be dangerous for human health, especially when particles are dispersed in the environment, contributing to the emission of PM 2.5.
Our overall results are fundamental for the risk management of Li-ion batteries, for example for the identification of appropriate personal protection systems for rescue teams. Furthermore, the results in terms of temperature and pressure can be used to develop new materials such as phase-change materials for battery thermal management systems (BTMSs) [33]. By using phase-change materials to absorb heat, the temperature of a battery pack could be kept within the normal operating range for a long time without using any external power, such as in a traditional air-cooling-based BTMS.

Author Contributions

Conceptualization, P.R.; methodology, P.R. and F.M.; investigation, S.U. and M.C.; data curation, S.U. and M.C.; writing—original draft preparation, S.U. and M.C.; writing—review and editing, S.U. and P.R.; visualization, S.U. and M.C.; supervision, P.R. and F.M.; project administration, P.R.; funding acquisition, P.R. All authors have read and agreed to the published version of the manuscript.

Funding

This study was carried out within the MOST—Sustainable Mobility Center and received funding from the European Union Next-GenerationEU (PIANO NAZIONALE DI RIPRESA E RESILIENZA (PNRR)—MISSIONE 4 COMPONENTE 2, INVESTIMENTO 1.4—D.D. 1033 17 June 2022, CN00000023). This manuscript reflects only the authors’ views and opinions; neither the European Union nor the European Commission can be considered responsible for them.

Data Availability Statement

The data presented in this study are available on request from the corresponding author. The data are not publicly available due to the project in which the study is inserted.

Conflicts of Interest

The authors declare no conflict of interest.

References

  1. Armand, M.; Axmann, P.; Bresser, D.; Copley, M.; Edström, K.; Ekberg, C.; Guyomard, D.; Lestriez, B.; Novák, P.; Petranikova, M.; et al. Lithium-ion batteries—Current state of the art and anticipated developments. J. Power Spurces 2020, 479, 228708. [Google Scholar] [CrossRef]
  2. Huang, W.; Feng, X.; Han, X.; Zhang, W.; Jiang, F. Questions and Answers Relating to Lithium-Ion Battery Safety Issues. Cell Rep. Phys. Sci. 2021, 2, 100285. [Google Scholar] [CrossRef]
  3. Qiu, Y.; Jiang, F. A Review on Passive and Active Strategies of Enhancing the Safety of Lithium-Ion Batteries. Int. J. Heat Mass Transf. 2022, 184, 122288. [Google Scholar] [CrossRef]
  4. Wang, Q.; Ping, P.; Zhao, X.; Chu, G.; Sun, J.; Chen, C. Thermal Runaway Caused Fire and Explosion of Lithium Ion Battery. J. Power Sources 2012, 208, 210–224. [Google Scholar] [CrossRef]
  5. Lopez, C.F.; Jeevarajan, J.A.; Mukherjee, P.P. Characterization of Lithium-Ion Battery Thermal Abuse Behavior Using Experimental and Computational Analysis. J. Electrochem. Soc. 2015, 162, A2163–A2173. [Google Scholar] [CrossRef]
  6. Xu, B.; Kong, L.; Wen, G.; Pecht, M.G. Protection Devices in Commercial 18650 Lithium-Ion Batteries. IEEE Access 2021, 9, 66687–66695. [Google Scholar] [CrossRef]
  7. Larsson, F.; Andersson, P.; Blomqvist, P.; Mellander, B.-E. Toxic Fluoride Gas Emissions from Lithium-Ion Battery Fires. Sci. Rep. 2017, 7, 10018. [Google Scholar] [CrossRef] [Green Version]
  8. Li, W.; Crompton, K.R.; Hacker, C.; Ostanek, J.K. Comparison of Current Interrupt Device and Vent Design for 18650 Format Lithium-Ion Battery Caps. J. Energy Storage 2020, 32, 101890. [Google Scholar] [CrossRef]
  9. Essl, C.; Golubkov, A.W.; Gasser, E.; Nachtnebel, M.; Zankel, A.; Ewert, E.; Fuchs, A. Comprehensive Hazard Analysis of Failing Automotive Lithium-Ion Batteries in Overtemperature Experiments. Batteries 2020, 6, 30. [Google Scholar] [CrossRef]
  10. Barkholtz, H.M.; Preger, Y.; Ivanov, S.; Langendorf, J.; Torres-Castro, L.; Lamb, J.; Chalamala, B.; Ferreira, S.R. Multi-Scale Thermal Stability Study of Commercial Lithium-Ion Batteries as a Function of Cathode Chemistry and State-of-Charge. J. Power Sources 2019, 435, 226777. [Google Scholar] [CrossRef]
  11. Doughty, D.; Roth, E.P. A General Discussion of Li Ion Battery Safety. Electrochem. Soc. Interface 2012, 21, 37. [Google Scholar] [CrossRef] [Green Version]
  12. Russo, P.; Mele, M.L. Li-Ion Batteries: Characterization of the Thermal Runaway Reactions Using a DSC. In Proceedings of the 13th International Symposium on Hazards, Prevention, and Mitigation of Industrial Explosions (ISHPMIE2020), Braunschweig, Germany, 27–31 July 2020. [Google Scholar]
  13. Fernandes, Y.; Bry, A.; de Persis, S. Identification and Quantification of Gases Emitted during Abuse Tests by Overcharge of a Commercial Li-Ion Battery. J. Power Sources 2018, 389, 106–119. [Google Scholar] [CrossRef]
  14. Ruiz, V.; Pfrang, A.; Kriston, A.; Omar, N.; Van den Bossche, P.; Boon-Brett, L. A Review of International Abuse Testing Standards and Regulations for Lithium Ion Batteries in Electric and Hybrid Electric Vehicles. Renew. Sustain. Energy Rev. 2018, 81, 1427–1452. [Google Scholar] [CrossRef]
  15. Doughty, D.; Crafts, C. FreedomCAR: Electrical Energy Storage System Abuse Test Manual for Electric and Hybrid Electric Vehicle Applications; SAND2005-3123, 889934; Sandia National Laboratories (SNL): Albuquerque, NM, USA; Livermore, CA, USA, 2006. [CrossRef] [Green Version]
  16. Mele, M.L.; Bracciale, M.P.; Ubaldi, S.; Santarelli, M.L.; Mazzaro, M.; Di Bari, C.; Russo, P. Thermal Abuse Tests on 18650 Li-Ion Cells Using a Cone Calorimeter and Cell Residues Analysis. Energies 2022, 15, 2628. [Google Scholar] [CrossRef]
  17. Russo, P.; Mele, M.L.; Longobardo, G.; Mazzaro, M.; Di Bari, C. Investigation on the Fire Hazards of Li-Ion Cells. Lect. Notes Electr. Eng. 2020, 604, 739–749. [Google Scholar] [CrossRef]
  18. Larsson, F.; Andersson, P.; Mellander, B.-E. Lithium-Ion Battery Aspects on Fires in Electrified Vehicles on the Basis of Experimental Abuse Tests. Batteries 2016, 2, 9. [Google Scholar] [CrossRef]
  19. Peng, Y.; Yang, L.; Ju, X.; Liao, B.; Ye, K.; Li, L.; Cao, B.; Ni, Y. A Comprehensive Investigation on the Thermal and Toxic Hazards of Large Format Lithium-Ion Batteries with LiFePO4 Cathode. J. Hazard. Mater. 2020, 381, 120916. [Google Scholar] [CrossRef]
  20. Kriston, A.; Adanouj, I.; Ruiz, V.; Pfrang, A. Quantification and Simulation of Thermal Decomposition Reactions of Li-Ion Battery Materials by Simultaneous Thermal Analysis Coupled with Gas Analysis. J. Power Sources 2019, 435, 226774. [Google Scholar] [CrossRef]
  21. Diaz, F.; Wang, Y.; Weyhe, R.; Friedrich, B. Gas Generation Measurement and Evaluation during Mechanical Processing and Thermal Treatment of Spent Li-Ion Batteries. Waste Manag. 2019, 84, 102–111. [Google Scholar] [CrossRef]
  22. Ribière, P.; Grugeon, S.; Morcrette, M.; Boyanov, S.; Laruelle, S.; Marlair, G. Investigation on the Fire-Induced Hazards of Li-Ion Battery Cells by Fire Calorimetry. Energy Environ. Sci. 2012, 5, 5271–5280. [Google Scholar] [CrossRef]
  23. Andersson, P.; Blomqvist, P.; Lorén, A.; Larsson, F. Using Fourier Transform Infrared Spectroscopy to Determine Toxic Gases in Fires with Lithium-Ion Batteries: FTIR to Determine Toxic Gases. Fire Mater. 2016, 40, 999–1015. [Google Scholar] [CrossRef]
  24. Chen, S.; Wang, Z.; Yan, W. Identification and Characteristic Analysis of Powder Ejected from a Lithium Ion Battery during Thermal Runaway at Elevated Temperatures. J. Hazard. Mater. 2020, 400, 123169. [Google Scholar] [CrossRef]
  25. Liu, K.; Liu, Y.; Lin, D.; Pei, A.; Cui, Y. Materials for lithium-ion battery safety. Sci. Adv. 2018, 4, eaas9820. [Google Scholar] [CrossRef] [Green Version]
  26. Almousa, N.H.; Alotaibi, M.R.; Alsohybani, M.; Radziszewski, D.; AlNoman, S.M.; Alotaibi, B.M.; Khayyat, M.M. Paraffin Wax [As a Phase Changing Material (PCM)] Based Composites Containing Multi-Walled Carbon Nanotubes for Thermal Energy Storage (TES) Development. Crystals 2021, 11, 951. [Google Scholar] [CrossRef]
  27. Bergeron, C.; Perrier, E.; Potier, A.; Delmas, G. A Study of the Deformation, Network, and Aging of Polyethylene Oxide Films by Infrared Spectroscopy and Calorimetric Measurements. Int. J. Spectrosc. 2012, 2012, 432046. [Google Scholar] [CrossRef] [Green Version]
  28. Xue, Z.; Heb, D.; Xie, X. Poly(ethylene oxide)-based electrolytes for lithium-ion batteries. J. Mater. Chem. A 2015, 3, 19218–19253. [Google Scholar] [CrossRef]
  29. Mo, J.; Zhang, D.; Sun, M.; Liu, L.; Hu, W.; Jiang, B.; Chu, L.; Li, M. Polyethylene Oxide as a Multifunctional Binder for High-Performance Ternary Layered Cathodes. Polymers 2021, 13, 3992. [Google Scholar] [CrossRef] [PubMed]
  30. Carbon Monoxide, Immediately Dangerous to Life or Heath Concentrations (IDLH). The National Institute for Occupational Safety and Health (NIOSH). Available online: https://www.cdc.gov/niosh/idlh/630080.html (accessed on 9 January 2023).
  31. Hydrogen Fluoride (as F), Immediately Dangerous to Life or Heath Concentrations (IDLH). The National Institute for Occupational Safety and Health (NIOSH). Available online: https://www.cdc.gov/niosh/idlh/7664393.html (accessed on 9 January 2023).
  32. Standard 1926.55Gases, Vapors, Fumes, Dusts, and Mists. Table 1—Permissible Exposure Limits for Airborne Contaminants; Occupational Safety and Health Administration, United States Department of Labor: Washington, DC, USA. Available online: https://www.osha.gov/laws-regs/regulations/standardnumber/1926/1926.55 (accessed on 15 March 2023).
  33. Liu, C.; Xu, D.; Weng, J.; Zhou, S.; Li, W.; Wan, Y.; Jiang, S.; Zhou, D.; Wang, J.; Huang, Q. Phase Change Materials Application in Battery Thermal Management System: A Review. Materials 2020, 13, 4622. [Google Scholar] [CrossRef] [PubMed]
Figure 1. NCA 18650: (a) cell and its dimension; (b) technical specifications.
Energies 16 03250 g001
Figure 2. Photograph of the laboratory plant for thermal abuse testing: reactor, transfer line, and FT-IR.
Energies 16 03250 g002
Figure 3. Scheme of (a) the cell holder; (b) thermocouples’ position.
Energies 16 03250 g003
Figure 4. Temperature and pressure profiles for test in air at 10 °C/min (a) and 5 °C/min (b); in N2 at 10 °C/min (c) and 5 °C/min (d).
Energies 16 03250 g004aEnergies 16 03250 g004b
Figure 5. Absorbance vs. wavenumber during the tests at 5 °C/min: (a) in air; (b) in N2.
Energies 16 03250 g005
Figure 6. Concentration (ppmv) profiles over time (s) for 5 °C/min test: (a) in air; (b) in N2.
Energies 16 03250 g006
Figure 7. PTFE filters sampled after testing: (a) 10 °C/min in air; (b) 5 °C/min in air; (c) 10 °C/min in N2; (d) 5 °C/min in N2.
Energies 16 03250 g007
Figure 8. NCR cells sampled after testing: (a) 10 °C/min in air; (b) 5 °C/min in air; (c) 10 °C/min in N2; (d) 5 °C/min in N2.
Energies 16 03250 g008
Figure 9. ATR-FT-IR spectra of condensed phase on filters at 5 °C/min in: (red) air; (black) N2.
Energies 16 03250 g009
Figure 10. SEM-BSE on the PTFE filters after testing: (a) 10 °C/min in air; (b) 5 °C/min in air; (c) 10 °C/min in N2; (d) 5 °C/min in N2.
Energies 16 03250 g010
Figure 11. Condensed matter collected during the test at 10 °C/min in air. (a) Areas analyzed by EDS and dimension of the particles; (b) EDS of Spot 1; (c) EDS of Spot 2; (d) EDS of Spot 3.
Energies 16 03250 g011
Figure 12. Condensed matter collected during the test at 5 °C/min in air. (a) Areas analyzed by EDS with dimension of the particles; (b) EDS of Spot 1; (c) EDS of Area 1.
Energies 16 03250 g012
Figure 13. Condensed matter collected during the test at 10 °C/min in N2. (a) Spot analyzed by EDS and dimension of the particle; (b) EDS of Spot 1.
Energies 16 03250 g013
Figure 14. Filter 5 °C/min in N2. (a) Spot analyzed by EDS and dimension of the particle; (b) EDS of Spot 1; (c) same spot analyzed by SE.
Energies 16 03250 g014
Figure 15. Comparison between the temperatures from the UN/ECE test and thermal abuse tests in: (a) air and (b) N2.
Energies 16 03250 g015aEnergies 16 03250 g015b
Table 1. Specification of the measurement system.
InstrumentationSpecification
Filter unitTemperature: 180 °C      Split: 30%
Primary filterPTFE (5 µm), diameter of 47 mm.
Secondary filterScreen holding a filter with a fine and coarse mesh.
Third filterCylindric filter in sintered stainless steel (50 µm), diameter of 15 × 25 mm.
Pump parametersSampling flow: 150 mL/min
Sampling tubingTemperature: 180 °C
Gas cellVolume: 98 mL         Path length: 2.0 m       Temperature: 180 °C
Spectrometer parameters
(FT-IR Spectrum 3, Perkin Elmer)
Resolution: 4 cm−1    Spectral range: 4500–400 cm−1   Scans/spectrum: 8
Detector: MCT
Software parameters
(TimeBase, Perkin Elmer)
Run time: 200 min    Delay: 10 min   Data collection mode: continuous
Table 2. Wavenumbers, expressed in cm−1, obtained by the standard gases analysis.
CompoundsWavenumber (cm−1)
EC1079, 1087, 1096, 1122, 1131, 1141, 1385, 1860, 1868, 1876, 3735
DMC917, 925, 985, 990, 996, 1295, 1455, 1463; 1768, 1780, 2199
DEC791; 862; 1021; 1093; 1258; 1302; 1374; 1409; 1448; 1746; 1742
HF4172–4175 (4110); 4202–4203
CO2115; 2173
CO22343; 2360; 3731
CH42989–2843; 3015; 3224–3029 (3175)
Table 3. Average temperature of TC1 and TC2 (°C) and pressure (barg) for key events of different thermal abuse tests.
Key EventAir—10 °C/minAir—5 °C/minN2—10 °C/minN2—5 °C/min
CID activation135 ± 7 °C106 ± 2 °C128 ± 23 °C107 ± 4 °C
0.04 barg0.175 barg0.25 barg0.11 barg
Venting212 ± 3 °C179 ± 16 °C195 ± 23 °C171 ± 5 °C
0.31 barg1.43 barg3.70 barg0.34 barg
Thermal runaway235 ± 1 °C230 ± 6 °C221 ± 11 °C213 ± 6 °C
0.12 barg1.50 barg4.10 barg0.83 barg
Peak565 ± 106 °C535 ± 17 °C497 ± 68 °C554 ± 11 °C
1.30 barg2.31 barg5.10 barg1.19 barg
Table 4. Quantities of collected material and weight loss of cell gathered for each test.
Air—10 °C/minAir—5 °C/minN2—10 °C/minN2—5 °C/min
Cell—total mass loss5.5754 g5.8223 g5.7801 g5.5794 g
Condensed matter0.0612 g0.0504 g0.0183 g0.0375 g
Table 5. The wavenumbers (cm−1) found in each filter with the relative force (vw, w, m, s, or vs) and the corresponding attribution.
IdentificationAir—10 °C/minAir—5 °C/minN2—10 °C/minN2—5 °C/min
Paraffin oil s 2951.76 m 2951.19 m 2951.70 m 2951.14 m
Paraffin oil—PEO vs 2917.87 vs 2918.01 vs 2917.35 vs 2918.16 vs
Paraffin oil—PEO vs 2849.63 s 2849.62 s 2849.15 s 2849.77 s
Paraffin oil vw 2724.01 vw 2737.23 vw --2722.61 vw
PEO w 1712.88 m 1714.37 m 1711.40 w 1713.75 w
PEO w 1644.21 vw 1642.61 vw 1642.32 vw 1642.91 vw
PEO w 1614.47 w ----1602.36 vw
Paraffin oil—PEO s 1461.48 s 1461.66 s 1462.57 m 1461.97 m
Paraffin oil—PEO m 1376.48 s 1376.06 s 1376.72 m 1375.86 m
Paraffin oil w 1273.84 w 1267.92 vw 1201.19 s 1212.49 s
PEO w 1167.09 vw 1163.74 m 1145.29 vs 1154.36 vs
Paraffin oil vw 1074.22 vw 1068.87 vw 1085.88 vw 1081.13 vw
PEO w 908.95 w 909.60 w 909.63 m 909.28 m
Paraffin oil w 887.25 w 886.26 w 885.48 m 887.05 m
Paraffin oil m 730.22 m 729.99 m 729.56 m 730.00 m
Paraffin oil—PEO s 719.48 m 719.27 m 719.48 m 719.47 m
PEO = polyethylene oxide; vw = very weak; w = weak; m = medium; s = strong; vs = very strong.
Table 6. Concentration of metals (mg/m3) for each thermal abuse test.
mg/m3Air—10 °C/minAir—5 °C/minN2—10 °C/minN2—5 °C/min
Li0.040.070.170.02
Ni<LOD0.01<LOD<LOD
Co<LOD<LOD<LOD<LOD
Mn<LOD<LOD<LOD0.01
Al0.140.340.200.14
Cu<LOD<LOD<LOD<LOD
<LOD: under the limit of detection.
Disclaimer/Publisher’s Note: The statements, opinions and data contained in all publications are solely those of the individual author(s) and contributor(s) and not of MDPI and/or the editor(s). MDPI and/or the editor(s) disclaim responsibility for any injury to people or property resulting from any ideas, methods, instructions or products referred to in the content.