Article

State of Health Estimation of Lithium-Ion Battery Based on Electrochemical Impedance Spectroscopy

China Electric Power Research Institute, Beijing 100192, China
*
Authors to whom correspondence should be addressed.
Energies 2023, 16(8), 3393; https://doi.org/10.3390/en16083393
Submission received: 30 December 2022 / Revised: 29 January 2023 / Accepted: 21 February 2023 / Published: 12 April 2023

Abstract

:
Energy storage is an important technical means to increase the consumption of renewable energy and reduce greenhouse gas emissions. Electrochemical energy storage, represented by lithium-ion batteries, has a promising developmental prospect. The performance of lithium-ion batteries continues to decline in the process of application, and the differences between batteries are increasing. Therefore, accurate estimation of the state of health (SOH) of batteries is the key to the safe and efficient operation of energy storage systems. In this paper, the electrochemical impedance spectroscopy (EIS) characteristics of Li-ion batteries under different states of charge and health were studied. Three groups of Li-ion battery impedance module values under different frequencies were selected as characteristic parameters, and the SOH estimation model of Li-ion batteries was built by using the support vector regression (SVR) algorithm. The results show that: the model with the second group of frequency-point combinations as characteristic parameters takes into account both accuracy and efficiency; the cumulative time of the characteristic frequency test and SOH evaluation of lithium-ion batteries is less than 10 s; and this technology has good engineering application value.

1. Introduction

In order to achieve the goal of reducing emissions of carbon dioxide and other greenhouse gases, and accelerate the active transformation of energy structures, vigorously developing new energy has become the consensus of all circles at home and abroad. As the focus of energy power development and construction, energy storage plays a very important role in improving the consumption capacity of renewable energy, promoting the optimization and complementarity of multi-energy sources, constructing a user-side distributed energy system, realizing energy interconnection and intelligent energy use, etc. Electrochemical energy storage, represented by lithium-ion batteries, has outstanding comparative application advantages due to its superior performance and rapid cost reduction. In recent years, it has developed rapidly around the world. By the end of 2021, the global cumulative installed capacity of lithium-ion battery energy storage had exceeded 22 GW, and it will maintain a rapid growth in the next few years. An electrochemical energy storage power station consists of an energy storage battery, battery management system (BMS), power control system (PCS), energy management system (EMS) and other main components. At present, lithium-ion batteries are mainly used as energy storage batteries, which are the core carrier of energy storage. Thousands of lithium-ion batteries in series and parallel form a battery system [1]. In the process of application, the performance of the lithium-ion batteries is declining continuously. The differences between batteries are increasing. Meanwhile, the operating condition, service environment, life stage and other factors of the lithium-ion battery have a significant impact on its current state [2]. In addition, the battery state of energy (SOE), state of health (SOH), state of power (SOP), internal stress and other parameters cannot be directly measured. As a result, the real state of the battery cannot be accurately known in real time, suggesting that some batteries or battery packs may be in a state of deep charge and discharge for a long time, and the service life of some batteries may be shortened. This will not only affect the life of the entire battery pack but will also greatly increase the security risks. Therefore, accurate evaluation of the SOH of lithium-ion batteries is very important.
At present, time-domain characteristic parameters are the main external characteristic parameters commonly used in SOH estimation research, including voltage and current time series, capacity increment series, charge and discharge capacity in a specific interval, etc. [3,4,5,6]. However, obtaining the above time-domain characteristic parameters usually requires charging and discharging the lithium-ion battery over a longer period of time [7]. A complete voltage-current time series takes several hours, and it usually takes more than ten to dozens of minutes to obtain the capacity incremental parameters and charge–discharge data of a specific voltage range. Meanwhile, these methods all require high-power charge–discharge equipment, for which the testing cost is relatively high, so it is difficult to realize in the field of electrochemical energy storage power stations. In addition, the charging and discharging data of lithium-ion batteries are jointly affected by various factors, such as external operating conditions and internal aging state. The acquisition of some time-domain characteristic parameters requires the limitation of external operating conditions, such as the specified charging and discharging ratio, charging and discharging depth, and initial charging and discharging state [8]. However, the battery SOH estimation model based on the data under specific working conditions has poor generality, and its migration ability under different scenarios needs to be further improved. In general, the research idea of lithium-ion battery SOH estimation based on time-domain characteristic parameters is faced with many challenges.
Compared with current- and voltage-response curve data in the time domain, EIS based on the frequency domain can reflect the state of health of the battery from multiple perspectives, because it contains abundant information about material properties, interface phenomena and electrochemical reactions inside the battery [9,10]. It is considered an effective means to achieve SOH estimation [11]. At present, there are two main ways to estimate SOH by using EIS. One is to establish a quantitative relationship model between characteristic parameters and SOH by constructing an equivalent circuit model in the frequency domain [12,13,14,15,16]. This method can directly simulate the dynamic behavior of the electrode reaction process, but cannot fully reflect the physical and chemical changes in the aging process of the battery [17], so the reliability is difficult to guarantee. Secondly, a quantitative relationship model between EIS and SOH is constructed by using a data-driven method [18,19]. This method can effectively avoid solving the complex nonlinear optimization problem of frequency-domain equivalent circuit model construction and has high feasibility for online application. However, due to the nonlinear correlation between impedance data of different frequencies, the SOH estimation model is directly constructed by the full frequency EIS, and the accuracy is usually limited. In addition, it takes a lot of time to test the EIS in the full frequency band, which is difficult to apply in practice [20,21]. Therefore, how to select the optimal impedance feature set which is closely related to the SOH from the full spectrum EIS is a key problem, which needs to be solved urgently.
The research process of this paper is mainly divided into three aspects: laboratory testing, feature parameter extraction and modeling (shown in Figure 1). Firstly, laboratory testing: through the extraction of the characteristics of different energy storage operating conditions, the simulation cycle experiment of a 60 Ah lithium iron phosphate battery was carried out in the laboratory. After each cycle within a predetermined period, the EIS of the battery under different SOC was tested, and finally the EIS of the battery under different SOC under different cycle periods was obtained. Secondly, feature parameter extraction: based on the laboratory test, different characteristic frequency points were selected as characteristic parameters by using the different characteristics of EIS in different frequency domains. Finally, modeling: the characteristic parameters of different characteristic frequency points were used as input parameters, and the SOH of the battery was used as the output parameter. Combined with SVR, the SOH evaluation model of the energy storage battery was established. By comparing the accuracy of several models, the SOH evaluation model of lithium-ion batteries with the highest accuracy was obtained. This method overcomes the problem of the long test time and low precision of full-spectrum EIS, and the method outlined in this paper can quickly and accurately estimate the SOH of a lithium-ion battery.

2. Battery Information and Related Data

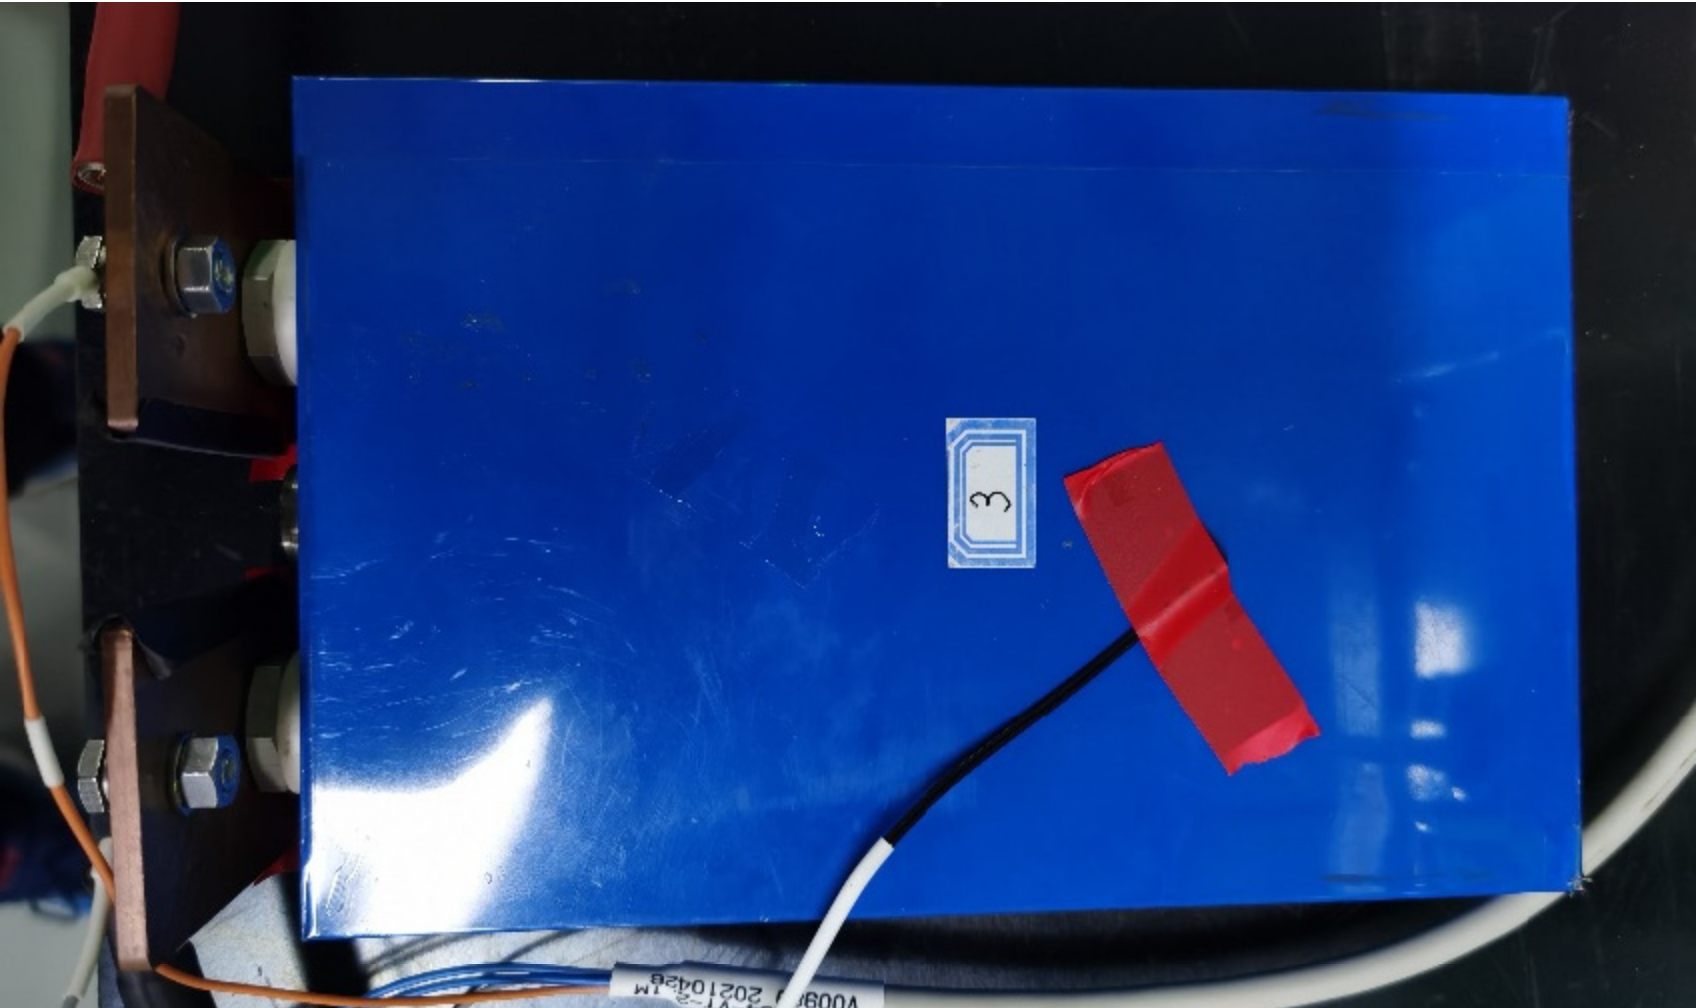
2.1. Battery Information

The lithium-ion battery sample used in this study is shown in Figure 2, and the main technical parameters are shown in Table 1. The battery is a square-shaped metal-shell lithium-ion battery with positive lithium iron phosphate and negative graphite. It has a rated capacity of 60 Ah, an AC internal resistance of about 0.6 mΩ at 1000 Hz, a charging cut-off voltage of 3.65 V and a discharge cut-off voltage of 2.5 V.

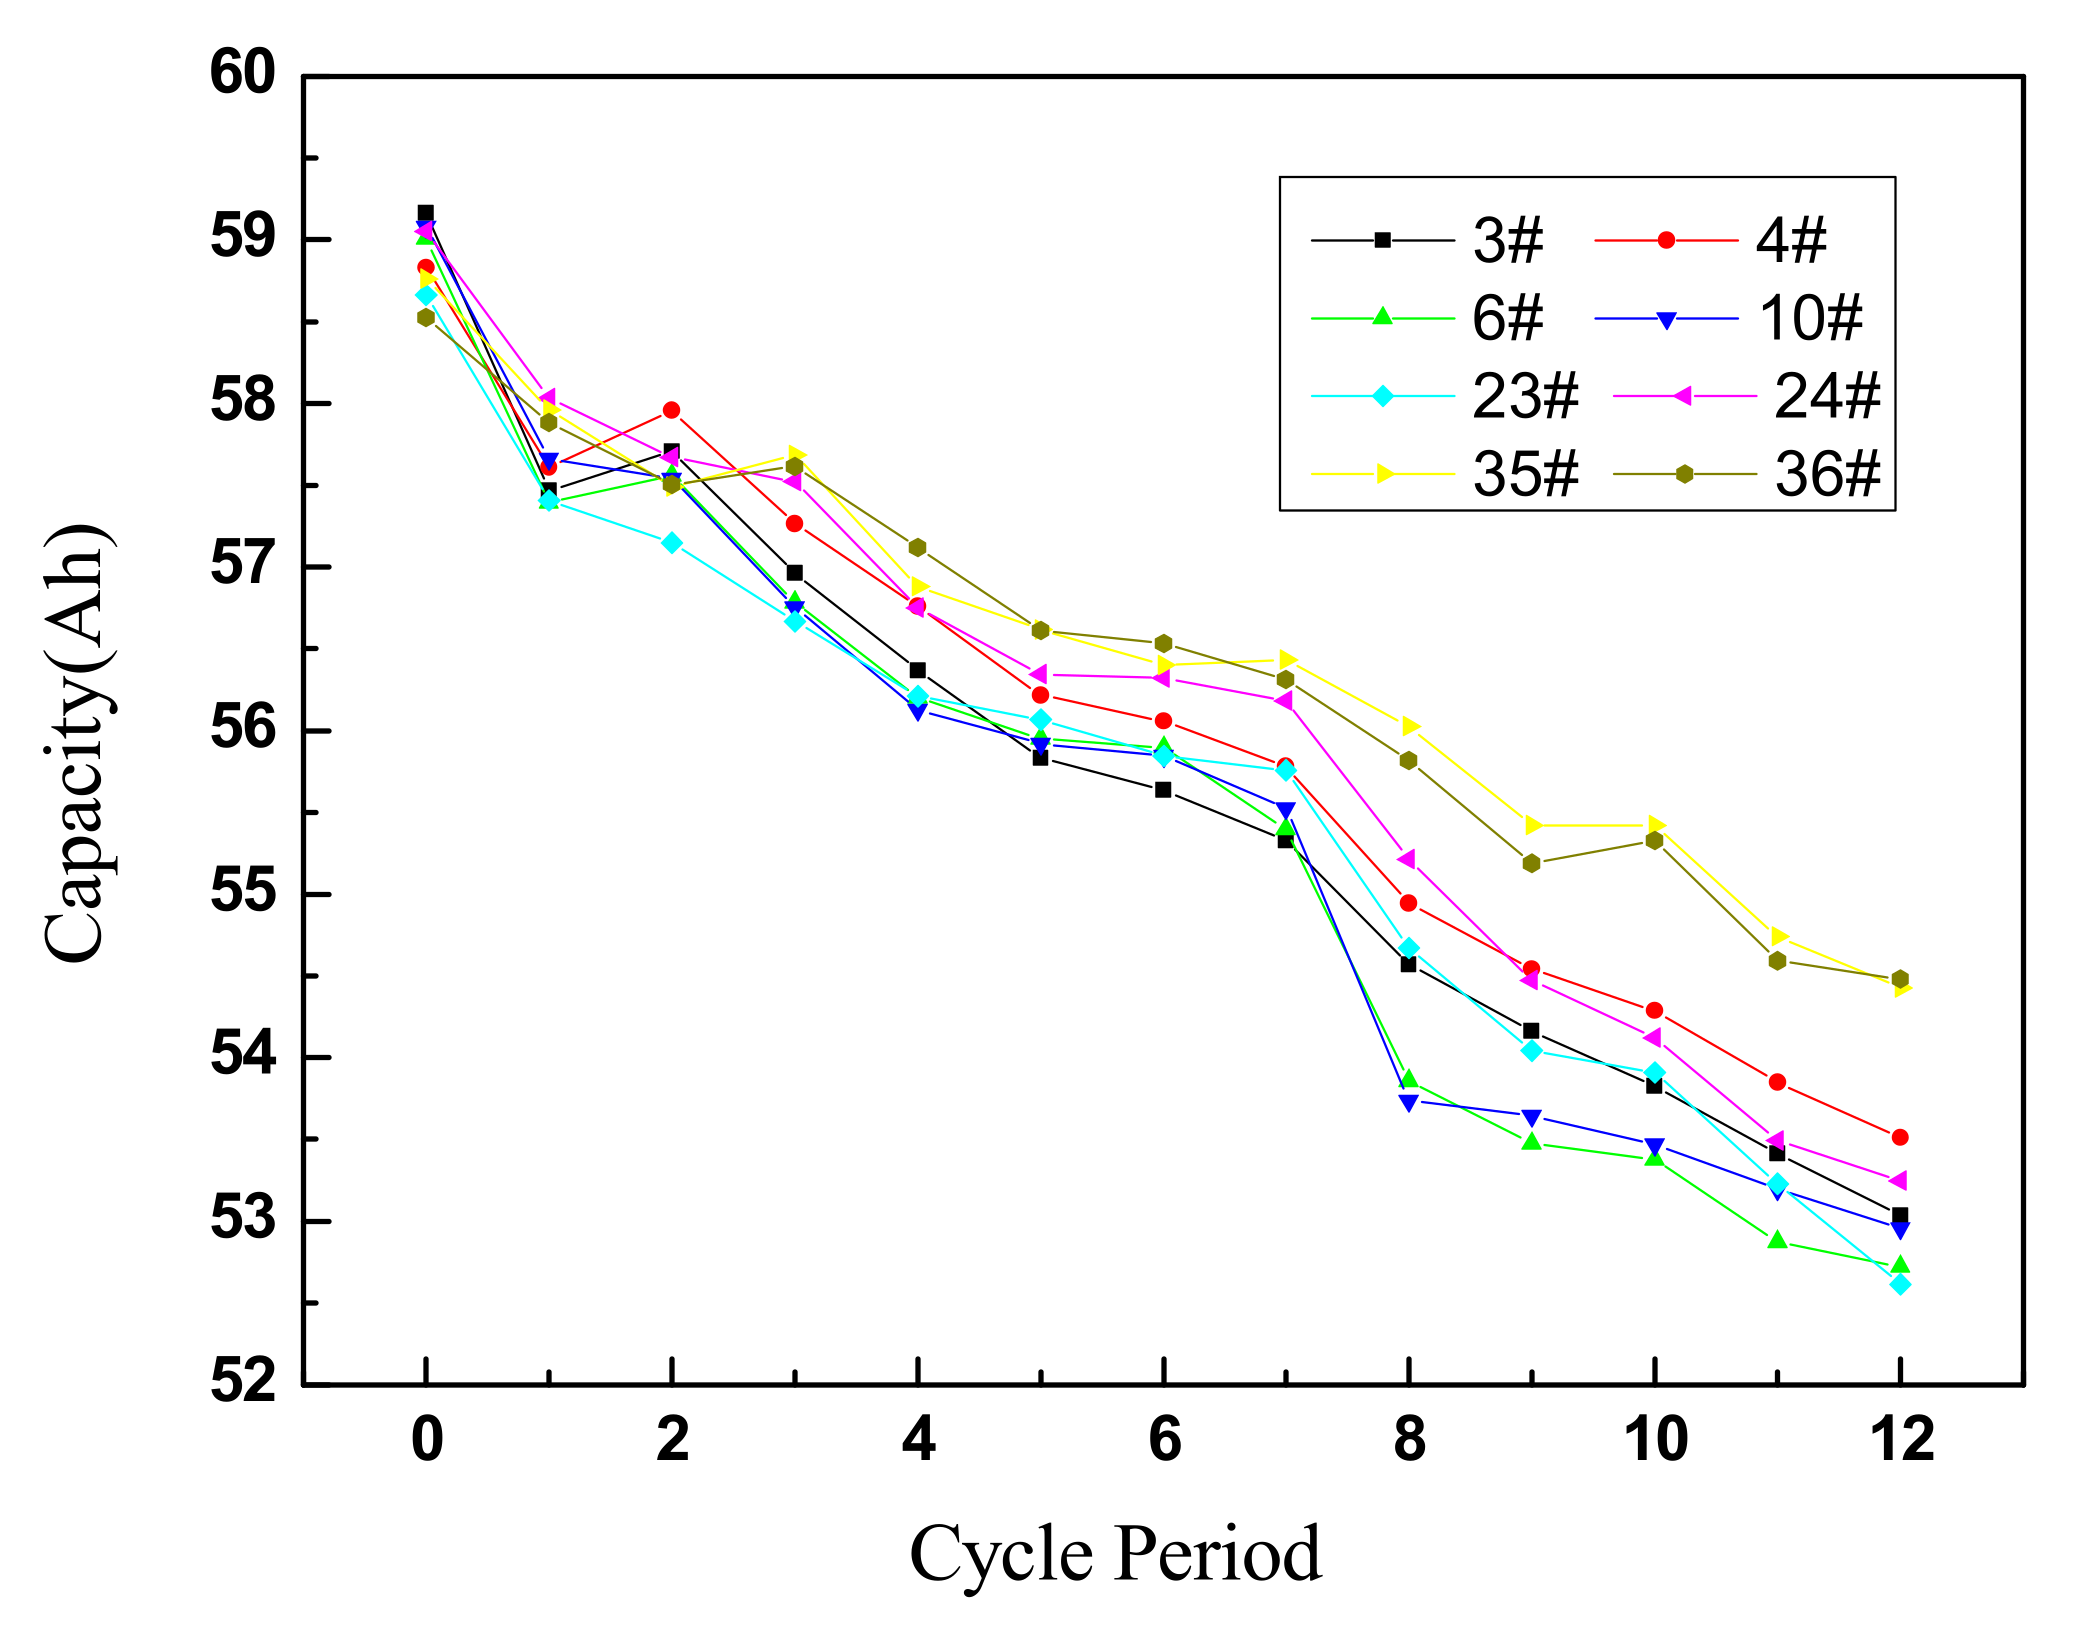
2.2. Battery Cycle Performance Test and Capacity Calibration

The on-site photos of the battery cycle performance test and capacity calibration are shown in Figure 3, all of which were performed using the CT-4008-5V100A-NTFA (Neware Technology Limited) high-precision charging–discharge tester. Eight batteries with similar initial capacity were selected and divided into four groups of two batteries. At room temperature (25 ± 2 °C), the charge and discharge cycles of 100%DOD (0–100%SOC), 80%DOD (10–90%SOC), 50%DOD (25–75%SOC) and 20%DOD (40–60%SOC) were carried out at the rate of 0.5C (30A), respectively; after each cycle period, the primary capacity was calibrated at 1/3C. The battery cycles for 200 times at 100%DOD charge–discharge condition were recorded as one cycle period. The battery cycles for 250 times at 80%DOD charge–discharge condition were recorded as one cycle period. The battery cycles 400 times at 50%DOD charge–discharge condition was recorded as one cycle period. The battery cycles for 1000 times at 20%DOD charge–discharge condition were recorded as one cycle period.
Lithium-ion battery capacity calibration was carried out in the following way: at room temperature (25 ± 2 °C), charge to 3.65 V at 20 A constant current; rest for 10 min; discharge to 2.5 V at 20 A constant current; rest for 10 min; this cycle was repeated three times, recording the last discharge capacity as the current capacity of lithium-ion battery.
Figure 4 shows the capacity attenuation curve of eight batteries, and Table 2 shows the capacity calibration data of eight batteries at the end of each cycle. With the increase in the cycle period, the capacity of the lithium-ion battery gradually decayed, showing a linear decay trend. Under the same cycle period, the capacity decay rate of six batteries (100%DOD, 80%DOD and 50%DOD) was close. After 12 cycle periods, the capacity of the batteries decayed by about 10%, and the capacity attenuation of the two lithium-ion batteries with the lowest discharge depth (20%DOD) was the slowest. After 12 cycle periods, the capacity attenuation of the battery was about 7%.

2.3. EIS of Batteries

At (25 ± 2) °C, the EIS of the battery was measured by the VMP3 electrochemical workstation of Bio-logic. The frequency range was 10 mHz~10 kHz, and the scanning was carried out from high frequency to low frequency. The voltage excitation mode was adopted, and the excitation voltage was 5 mV. The EIS of the lithium-ion battery was tested at different SOC (0%SOC, 25%SOC, 50%SOC, 75%SOC and 100%SOC) before the cycles and after the capacity calibration per cycle. The SOC of the lithium-ion battery was adjusted by 20 A in the constant-current mode, ensuring that the lithium-ion battery was in a stable state during the EIS test. EIS was performed after the battery had rested for 2 h after SOC adjustment.

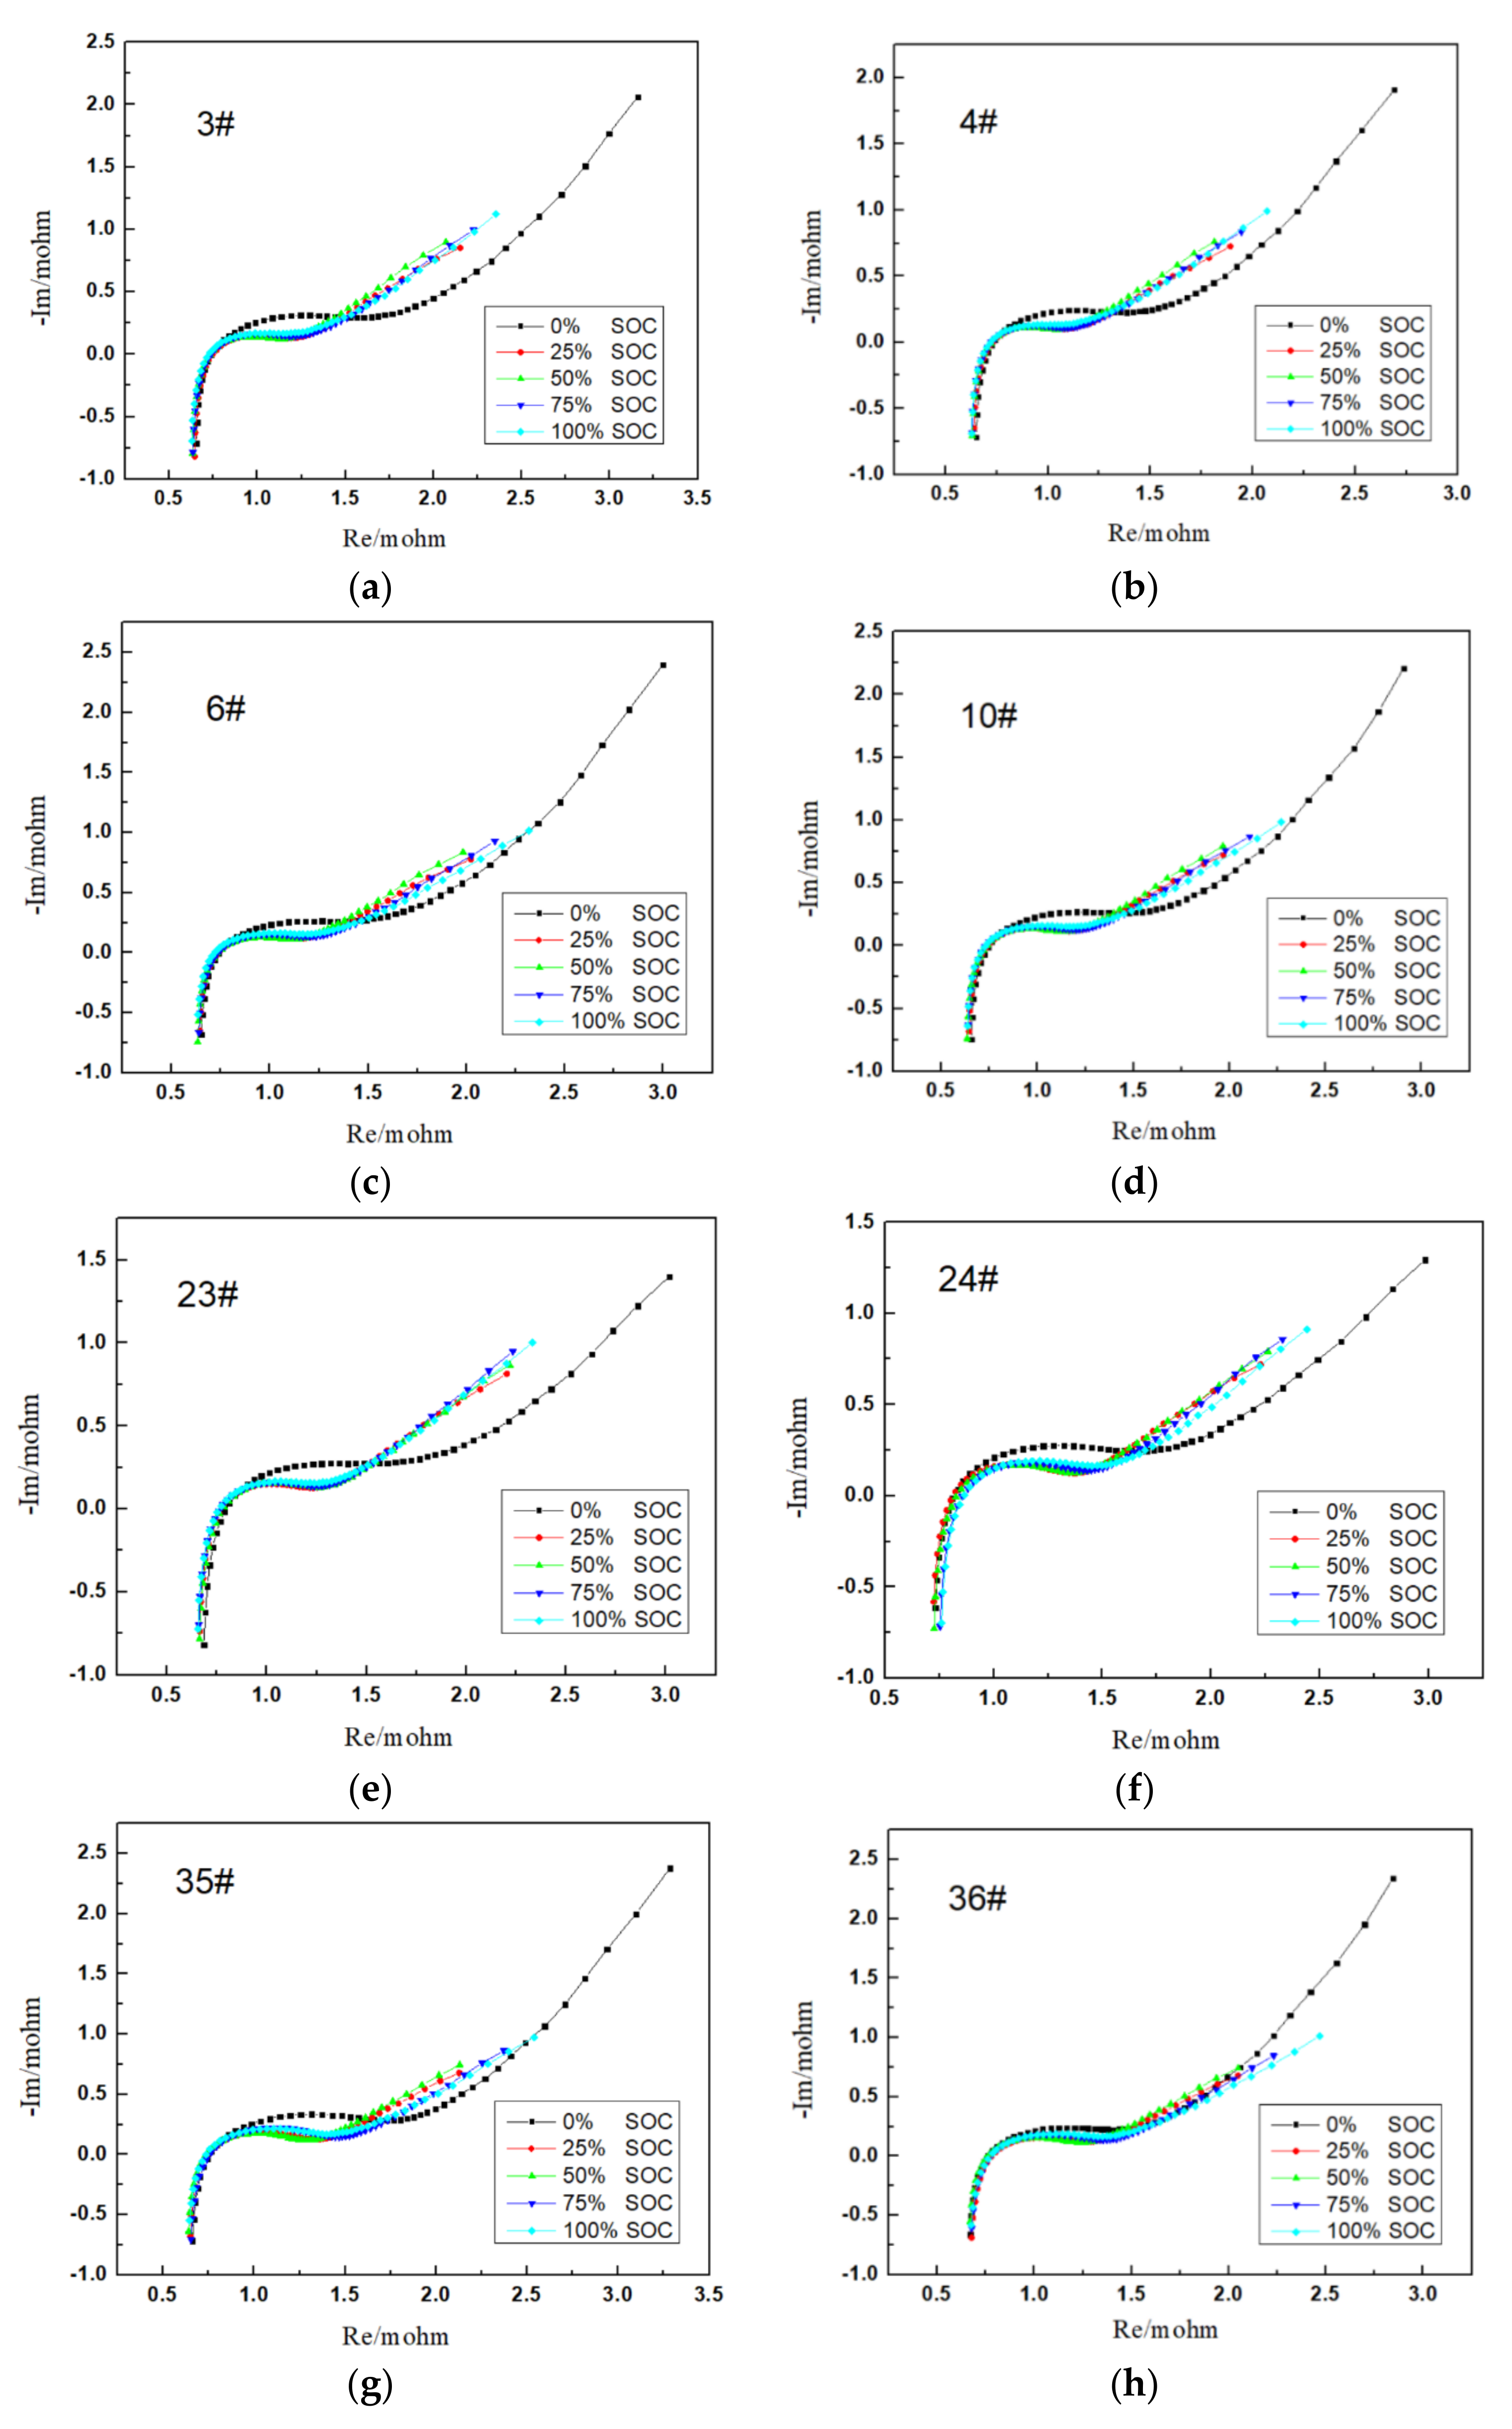
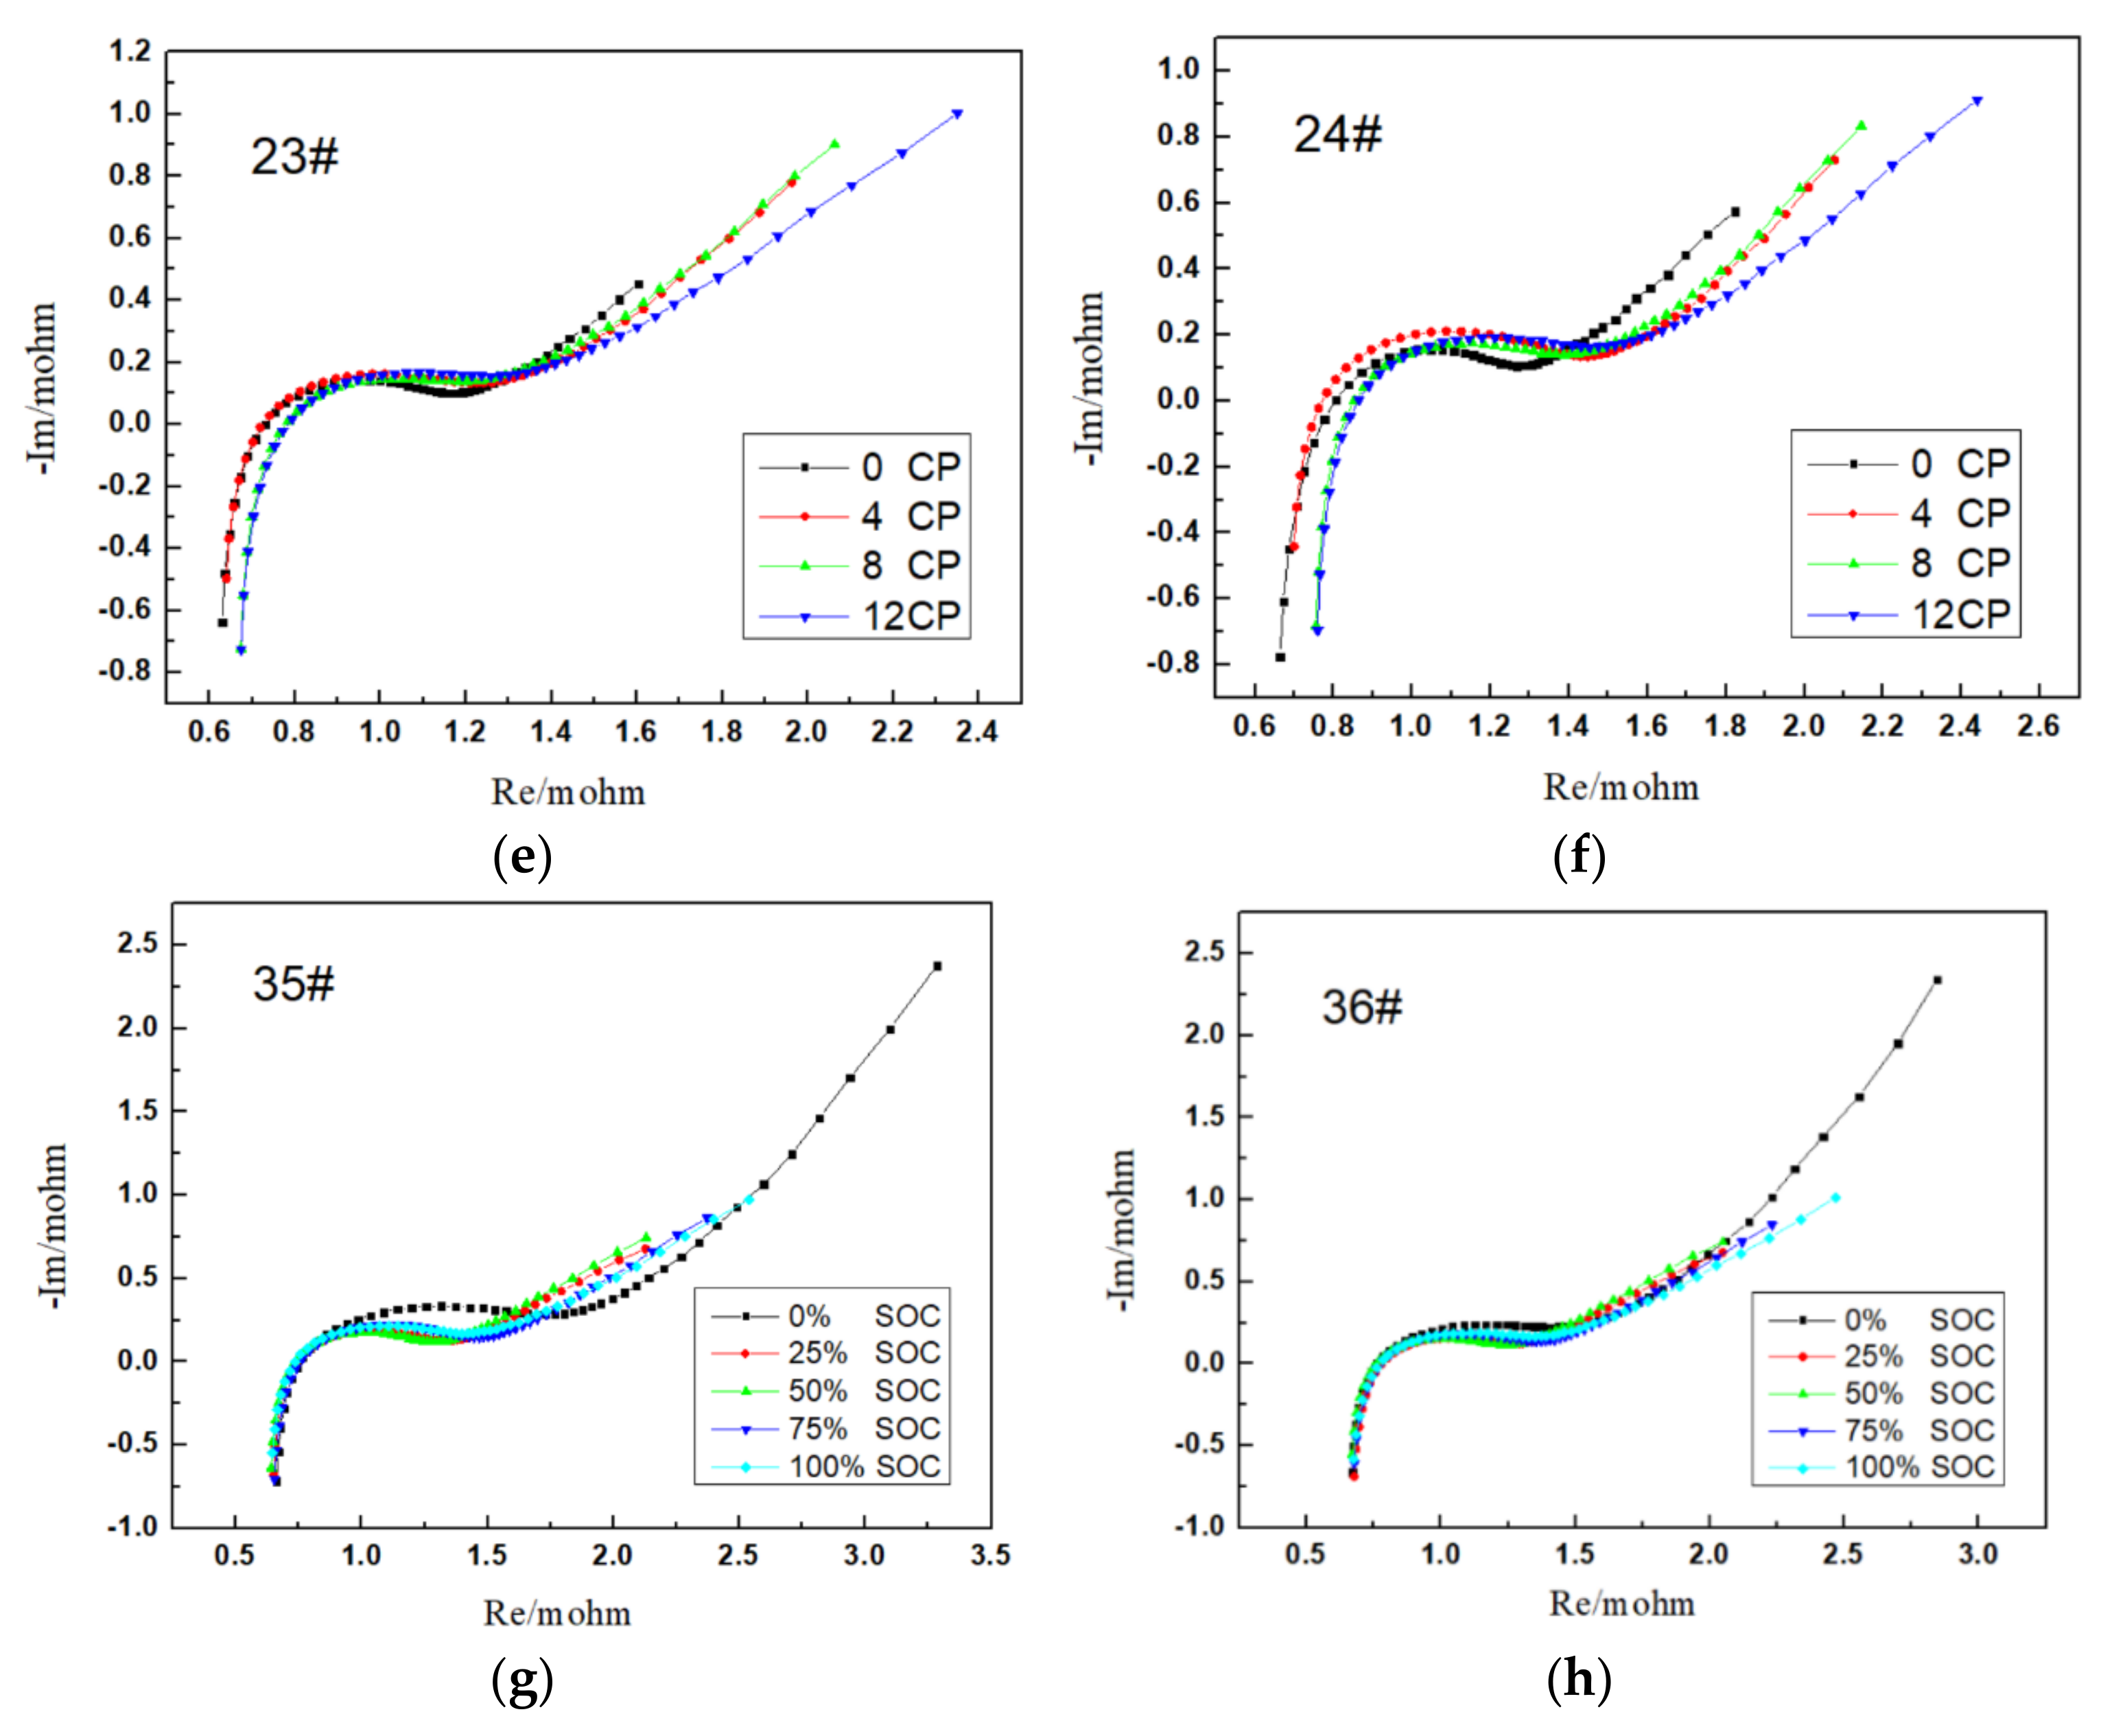
2.3.1. EIS of Battery at Different SOC

Figure 5 shows the EIS of the lithium-ion battery at different SOC. As can be seen from the figure, the EIS of eight batteries showed the same rule under different SOC. The ohm impedance of the battery at different SOC was not significantly different, and the charge transfer impedance and diffusion impedance at 0%SOC were higher than other SOC. The reason is that, at 0%SOC, lithium ions are all in the positive electrode, and the charge transfer impedance of the battery in the positive electrode increases significantly. Meanwhile, at 0%SOC, the diffusion resistance of lithium ions in the anode material is higher than that of other SOC, making the diffusion impedance of the SOC at 0% the maximum.

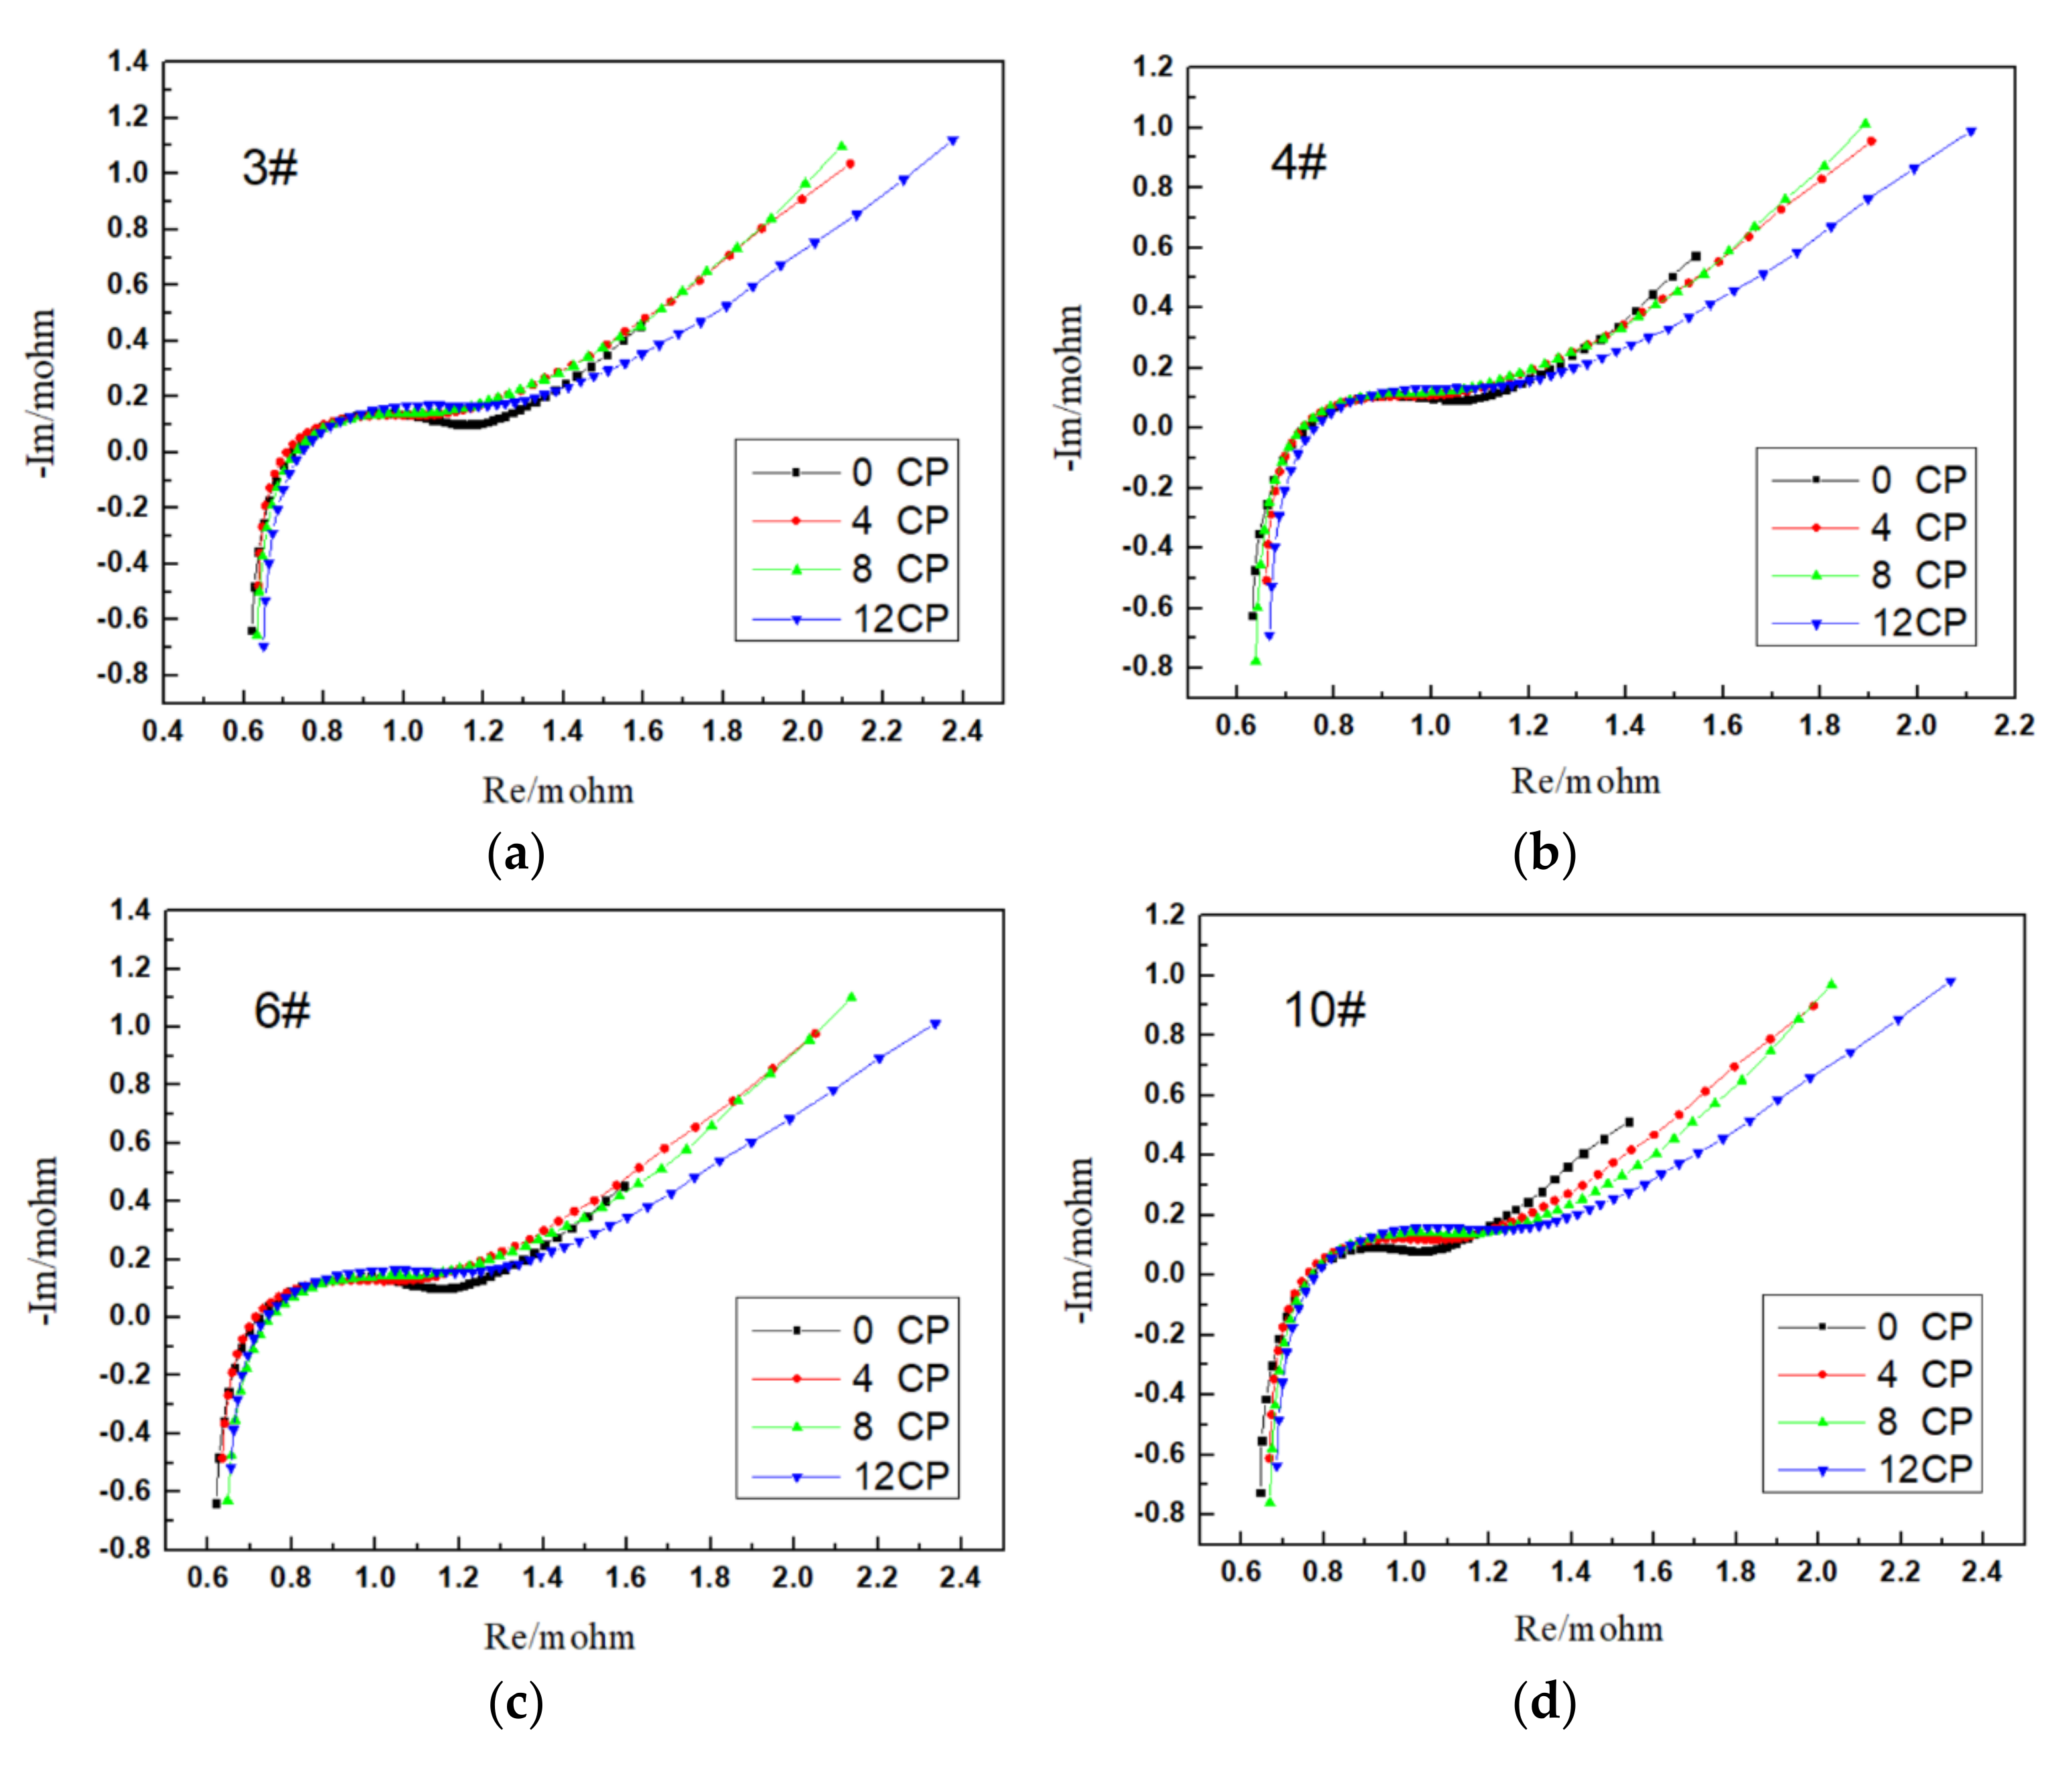
2.3.2. EIS at Different SOH

SOH usually refers to the percentage of a lithium-ion battery’s current capacity to its nominal capacity, as shown in Equation (1), where SOH is the state of health, expressed in percentage; Qcc is the current capacity, and the unit of measurement is Ah; Qnc is the nominal capacity, and the unit of measurement is Ah.
SOH = Q c c / Q n c × 100 %
In order to analyze the variation in the electrochemical impedance spectrum with the change in the SOH of the lithium-ion battery, the EIS of 8 batteries at 100%SOC before their cycle (0 Cycle Period, 0CP), 4th cycle period (4 Cycle Period, 4CP), 8th cycle period (8 Cycle Period, 8CP) and 12th cycle period (12 Cycle Period, 12CP) were compared. As shown in Figure 6, the EIS of eight cells showed the same change rule. With the increase in the cycle period, EIS gradually shifted to the right and the semicircle became larger. This indicates that the ohmic impedance, charge transfer impedance and diffusion impedance in the low-frequency region of the battery increased gradually during the cycle. This evidences that there is a correlation between the increase in battery impedance and capacity attenuation, and the state of health of the battery can be estimated through the EIS of the lithium-ion battery.

3. Characteristic Parameter Selection

Traditionally, the method of EIS is fitted with an equivalent circuit. Although the equivalent circuit fitting can obtain the values of each equivalent element, new errors are introduced in the fitting process. Therefore, this paper directly uses the original impedance data, namely the directly measured real part, imaginary part, phase angle, mode value, etc., to study the SOH estimation of lithium-ion batteries.
Generally, the EIS is divided into a high-frequency region, medium-frequency region and low-frequency region according to the different measured frequencies (as shown in Figure 6). The different frequency regions represent the different stages of reaction inside the lithium-ion battery. As shown in Figure 6, with the aging of Li-ion batteries, the EIS gradually shifted to the right, and the semicircle of the intermediate frequency region gradually increased. These two parts are mainly related to the ohm resistance Rs, charge transfer resistance Rct, and constant phase Angle element Q in the equivalent circuit. These three components are often focused on equivalent circuit fitting. The frequency point at which the impedance spectrum intersects the real axis (Z′) is 186.7 Hz. The semicircle vertex frequency in the intermediate frequency region is 17.9 Hz. The inflection frequency of the semicircle intersecting the 45° slash is 1.4 Hz. Therefore, these frequency points were selected as the first group of characteristic frequency points in this paper. At the same time, in order to ensure the efficiency and accuracy of the model, the middle frequency point 57.8 Hz between 186.7 Hz and 17.9 Hz, and the middle frequency point 5.6 Hz between 17.9 Hz and 1.4 Hz, were added as the second set of characteristic frequency points. On this basis, 1000 Hz and 0.1 Hz were added as the third group of characteristic frequency points (shown in Table 3). Therefore, the mode values at these frequencies were selected as characteristic parameters to characterize lithium-ion batteries in this paper. Only the characteristic frequency points of the battery were tested, and the test time was greatly reduced from more than ten minutes of the whole spectrum to seconds.

4. Evaluation Model Construction and Verification

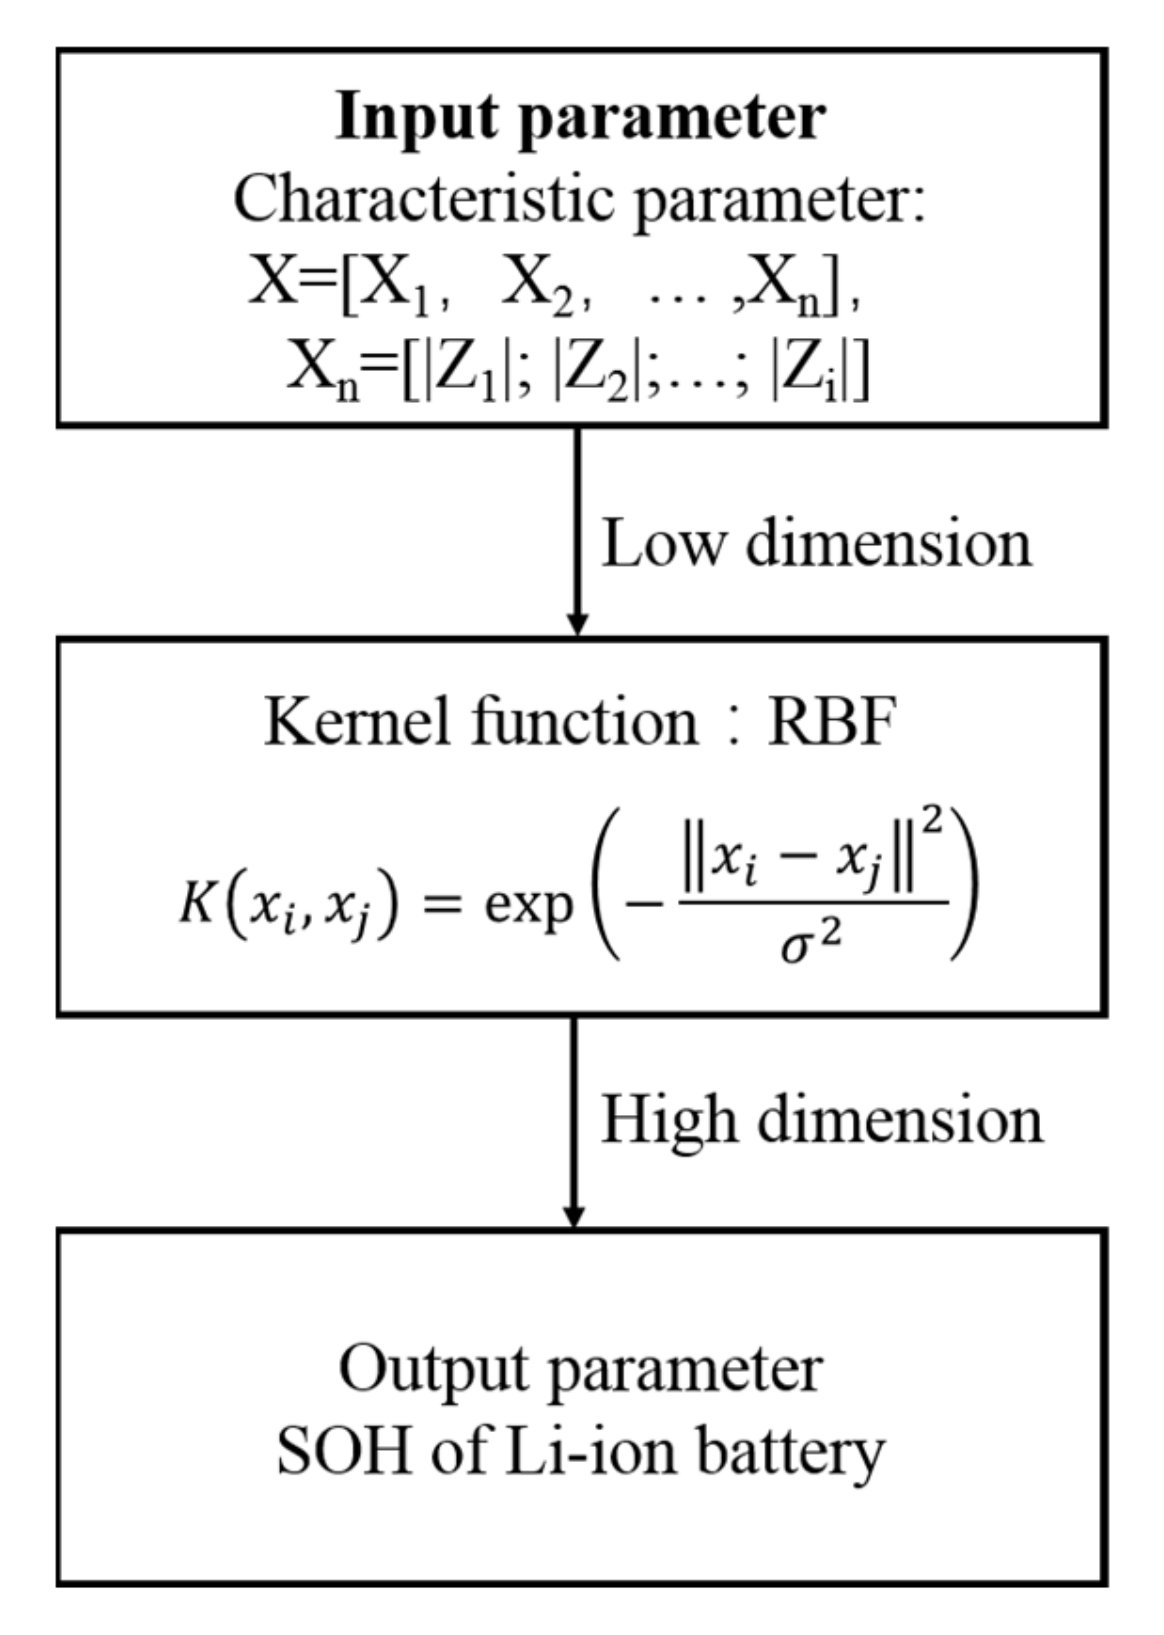
4.1. Principle of SVR Algorithm

Support vector machine regression (SVR) was developed from support vector machine classification (SVM). The kernel function was used to map the sample space to a high-dimensional feature space, so that the problem of nonlinear regression became an approximate linear regression problem, and then the nonlinear relationship between input parameters and output parameters was obtained. The training sample D = {(X1,Y1), (X2,Y2), ..., (Xn,Yn)} was selected. Through training, the team wanted to find a function f(x) that represented the relationship between Xn and Yn.
It is assumed that f(x) can be tolerated with a deviation of maximum ε from Yn (as shown in Figure 7), thereby solving Equation (2).
max w , b 2 w ,
s . t .   y i w x i + b ϵ ,   i = 1 , 2 ,   ,   n
The constraint is equivalent to Equation (3).
min w , b 1 2 w 2 ,
s . t .   y i w x i + b ϵ ,   i = 1 , 2 ,   ,   n
In practice, ε is difficult to determine directly, so the relaxation variable ζ is added, which allows some samples not to be within the ε interval. At this point, all samples meet Equation (4):
min w , b , ξ i , ξ i ^ 1 2 w 2 + C i n ξ i , ξ i ^ ,
s . t .   f x i Y i ϵ + ξ I ,
Y i f x i ϵ + ξ i ^ ,
ξ I 0 ,   ξ i ^ 0 , i = 1 , 2 , , n
where C is the regularization constant.
The process of establishing the model is the process of solving Equation (4). Equation (4) is transformed into its dual problem through Lagrange transformation. If the function is not linear in the plane, the sample is mapped to a higher-dimensional space through an appropriate kernel function, and the regression function is finally obtained as follows:
f x = i = 1 n α i ^ α i κ x i T x + b
where κ x i T x is the kernel function; α i and α i ^ are the Lagrange multiplier.

4.2. Data Preprocessing

In order to solve the nonlinear relationship between the electrochemical impedance data and health state of the lithium-ion battery, the SVR algorithm was adopted. The characteristic parameter X = [X1, X2, …, Xn] (n is the number of samples) was the input parameter (where Xn = [|Z1|; |Z2|; …; |Zi|]. |Zi| is module value at characteristic frequency), and the capacity of the lithium-ion battery Y = [Y1, Y2, …, Yn] was the output parameter to build the model.
Due to the particularity of the test cycle of the electrochemical impedance spectrum, 520 sets of EIS data were measured in the study, which were randomly allocated according to the ratio of the conventional artificial intelligence algorithm training set and test set of 8:2. In order to unify dimensions and speed up model calculation, input parameters and output parameters were normalized using Equation (6):
x i = x x m i n x m a x x m i n
where xi is the normalized data, xmin is the minimum value of the collected data, xmax is the maximum value of the collected data and x is the directly collected data.

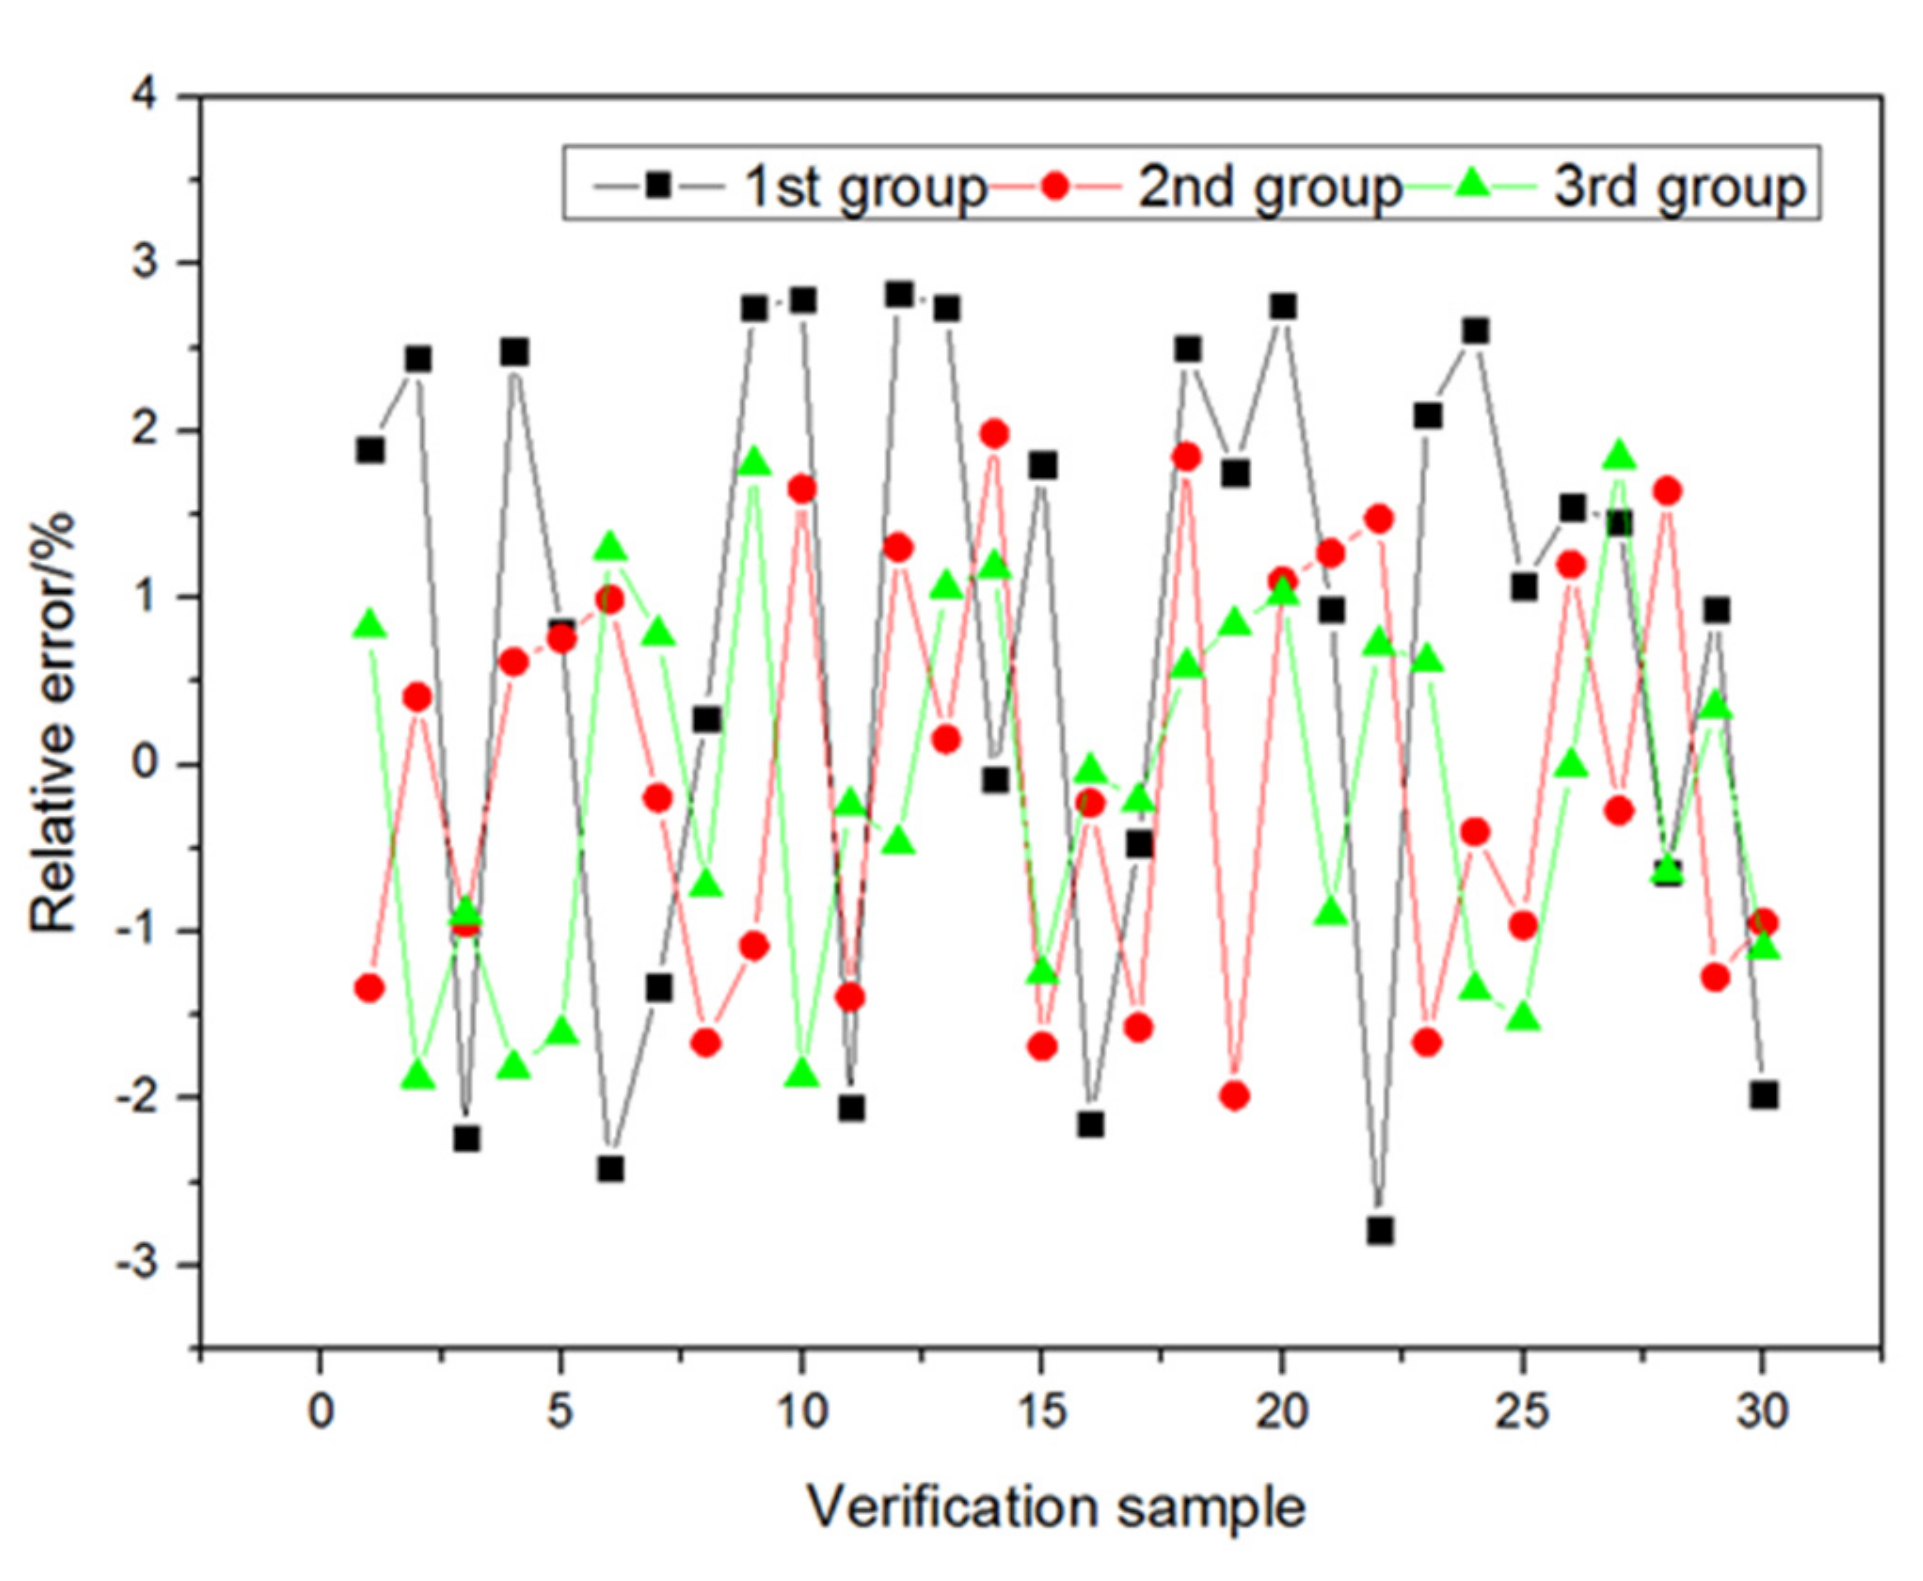
4.3. Evaluation Model Building and Validation

Taking the selected characteristic parameters as the input parameters of the model, the Radial Basis kernel Function (RBF) was used to map the low-dimensional sample space to the high-dimensional space, so that the nonlinear relationship between the characteristic parameters of impedance and the SOH of lithium-ion batteries was transformed into an approximately linear relationship. Finally, the SOH evaluation model of the lithium iron phosphate battery was obtained. Figure 8 shows the flow chart of the SOH evaluation model.
A total of 104 sets of data were used to test the trained SOH estimation model of lithium iron phosphate batteries. Mean absolute percentage error (MAPE) and relative error were used to evaluate the accuracy of the model:
MAPE = 1 N i = 1 N y p r e d i y i y i × 100 %
δ = y p r e d i y i y i × 100 %
where ypred(i) is the predicted SOH value, y(i) is the true SOH value, N is the predicted total sample number and δ is the relative error.
The relative errors of the test set for three groups of the SOH estimation model of the lithium iron phosphate battery are shown in Figure 9. The relative errors of the first group are within 3%, and the maximum relative error is 2.93%. The relative errors of the second group are within 2%, and the maximum relative error is 1.95%. The relative errors of the third group are within 2%, and the maximum relative error is 1.98%. The accuracy of the state estimation model of the lithium iron phosphate battery, with the second group of characteristic parameters (five frequency points) and the third group of characteristic parameters (seven frequency points) as input parameters, is similar. The relative error of the estimation model with the first group of characteristic parameters (three frequency points) is the largest.
Furthermore, in order to verify the accuracy of the state estimation model of lithium iron phosphate batteries, 30 batteries of the same type were selected. Seven impedance characteristic parameters (1000 Hz, 186.7 Hz, 57.8 Hz, 17.9 Hz, 5.6 Hz, 1.4 Hz and 0.1 Hz) of these 30 batteries were collected. The capacity of the 30 batteries was calibrated. The 30 groups of data were divided into three groups according to three frequency points, five frequency points and seven frequency points. The collected characteristic parameters of 30 batteries were put into the model, and the comparison between the estimated value and the measured value is shown in Figure 10. The estimated value fluctuated around the measured value, and the estimated value of the first group of characteristic parameters (three frequency points) was the furthest from the measured value.
In order to more clearly show the accuracy of the estimated capacity, the relative error (Equation (8)) of all the verification samples was calculated. As shown in Figure 11, the results were similar to the test set. The estimated relative errors of the model with the first group of characteristic parameters as input parameters were all within 3%, and the estimated relative errors of the model with the second and third group of characteristic parameters as input parameters were all within 2%. The MAPE of the three groups is shown in Table 4. The MAPE of the models with the first, second and third groups of characteristic parameters as input parameters were 1.86%, 0.96% and 0.98%, respectively. The accuracy of the model with the second and third group of characteristic parameters as input parameters was similar, but the test time of the third group was tens of seconds, while the test time of the second group was only a few seconds, which is extremely important for the engineering application of the model.

5. Conclusions

In this paper, a state of health estimation method, based on the characteristic parameters of electrochemical impedance spectrum and support vector regression algorithm for lithium-ion battery batteries, is proposed, which realizes the integration and complementarity of mechanism and data drive, avoids the error caused by equivalent circuit fitting, reduces the testing time of the full spectrum of electrochemical impedance, and solves the nonlinear relationship between the characteristic parameters and the health state of lithium iron phosphate batteries. According to the difference in the meaning of different regions of the electrochemical impedance spectrum, three combinations of characteristic frequency points were selected as the characteristic parameters of the SOH estimation model of lithium iron phosphate batteries. Considering the characteristics of a small sample of EIS characteristic parameters, SVR was selected as the core algorithm for the model. Based on the above, the SOH evaluation model was built. The time of the battery impedance test and SOH evaluation is less than 10 s, which realizes the fast SOH estimation of the LFP battery. Three groups of the model were verified by using the characteristic parameters and calibration capacity of 30 for the same type of battery. Considering the test time and accuracy, the impedance modulus at 86.7 Hz, 57.8 Hz, 17.9 Hz, 5.6 Hz and 1.4 Hz were finally selected as the characteristic parameters. The MAPE of the model was 0.96%, and the relative errors were all within 2%. The accuracy of the model estimation was high, and it could be extended to practical application.

Author Contributions

Data curation, M.F.; formal analysis, M.G. and M.F.; methodology, M.F., M.G. and K.Y.; supervision, K.Y.; validation, M.Z. and H.L.; writing of the original draft, M.F. and M.G. All authors have read and agreed to the published version of the manuscript.

Funding

This research was funded by the National Natural Science Foundation of China, grant number 52037006.

Data Availability Statement

Not applicable.

Conflicts of Interest

The authors declare no conflict of interest.

References

  1. Offer, G.J.; Yufit, V.; Howey, D.A.; Wu, B.; Brandon, N.P. Module design and fault diagnosis in electric vehicle batteries. J. Power Sources 2012, 206, 383–392. [Google Scholar] [CrossRef] [Green Version]
  2. Han, X.; Lu, L.; Zheng, Y.; Feng, X.; Li, Z.; Li, J.; Ouyang, M. A review on the key issues of the lithium ion battery degradation among the whole life cycle. eTransportation 2019, 1, 100005. [Google Scholar] [CrossRef]
  3. Fan, Y.; Xiao, F.; Li, C.; Yang, G.; Tang, X. A novel deep learning framework for state of health estimation of lithium-ion battery. J. Energy Storage 2020, 32, 101741. [Google Scholar] [CrossRef]
  4. Kashyap, D.; Dwivedi, P.K.; Pandey, J.K.; Kim, Y.H.; Kim, G.M.; Sharma, A.; Goel, S. Application of electrochemical impedance spectroscopy in bio-fuel cell characterization: A review. Int. J. Hydrogen Energy 2014, 39, 20159–20170. [Google Scholar] [CrossRef]
  5. Ouyang, M.; Chu, Z.; Lu, L.; Li, J.; Han, X.; Feng, X.; Liu, G. Low temperature aging mechanism identification and lithium deposition in a large format lithium iron phosphate battery for different charge profiles. J. Power Sources 2015, 286, 309–320. [Google Scholar] [CrossRef]
  6. Xu, J.; Mi, C.C.; Cao, B.; Cao, J. A new method to estimate the state of charge of lithium-ion batteries based on the battery impedance model. J. Power Sources 2013, 233, 277–284. [Google Scholar] [CrossRef]
  7. Eddahech, A.; Briat, O.; Vinassa, J.-M. Determination of lithium-ion battery state-of-health based on constant-voltage charge phase. J. Power Sources 2014, 258, 218–227. [Google Scholar] [CrossRef]
  8. Zenati, A.; Desprez, P.; Razik, H. Estimation of the SOC and the SOH of Li-ion Batteries, by Combining Impedance Measurements with the fuzzy Logic Inference. In Proceedings of the IECON 2010—36th Annual Conference on IEEE Industrial Electronics Society, IEEE, Glendale, AZ, USA, 7–10 November 2010. [Google Scholar]
  9. Li, X.; Zhang, L.; Liu, Y.; Pan, A.; Liao, Q.; Yang, X. A fast classification method of retired electric vehicle battery modules and their energy storage application in photovoltaic generation. Int. J. Energy Res. 2019, 44, 2337–2344. [Google Scholar] [CrossRef]
  10. Ungurean, L.; Cârstoiu, G.; Micea, M.V.; Groza, V. Battery state of health estimation: A structured review of models, methods and commercial devices. Int. J. Energy Res. 2017, 41, 151–181. [Google Scholar] [CrossRef]
  11. Huet, F. A review of impedance measurements for determination of the state-of-charge or state-of-health of secondary batteries. J. Power Sources 1998, 70, 59–69. [Google Scholar] [CrossRef]
  12. Stroe, D.I.; Swierczynski, M.; Stroe, A.I.; Knap, V.; Andreasen, S.J. Diagnosis of lithium-ion batteries state-of-health based on electrochemical impedance spectroscopy technique. In Proceedings of the 2014 IEEE Energy Conversion Congress and Exposition (ECCE), IEEE, Pittsburgh, PA, USA, 14–18 September 2014; pp. 4576–4582. [Google Scholar]
  13. Chin, C.S.; Gao, Z.; Zhang, C.Z. Comprehensive electro-thermal model of 26650 lithium battery for discharge cycle under parametric and temperature variations. J. Energy Storage 2020, 28, 101222. [Google Scholar] [CrossRef]
  14. Galeotti, M.; Cinà, L.; Giammanco, C.; Cordiner, S.; Di Carlo, A. Performance analysis and SOH (state of health) evaluation of lithium polymer batteries through electrochemical impedance spectroscopy. Energy 2015, 89, 678–686. [Google Scholar] [CrossRef]
  15. Tian, N.; Wang, Y.; Chen, J.; Fang, H. One-shot parameter identification of the Thevenin’s model for batteries: Methods and validation. J. Energy Storage 2020, 29, 101282. [Google Scholar] [CrossRef] [Green Version]
  16. Yang, Q.; Xu, J.; Li, X.; Xu, D.; Cao, B. State-of-health estimation of lithium-ion battery based on fractional impedance model and interval capacity. Int. J. Electr. Power Energy Syst. 2020, 119, 105883. [Google Scholar] [CrossRef]
  17. Zhu, S.; Sun, X.; Gao, X.; Wang, J.; Zhao, N.; Sha, J. Equivalent circuit model recognition of electrochemical impedance spectroscopy via machine learning. Electroanal. Chem. 2019, 855, 113627. [Google Scholar] [CrossRef] [Green Version]
  18. Xiong, R.; Tian, J.; Mu, H.; Wang, C. A systematic model-based degradation behavior recognition and health monitoring method for lithium-ion batteries. Appl. Energy 2017, 207, 372–383. [Google Scholar] [CrossRef]
  19. Zhang, Y.; Tang, Q.; Zhang, Y.; Wang, J.; Stimming, U.; Lee, A.A. Identifying degradation patterns of lithium ion batteries from impedance spectroscopy using machine learning. Nat. Commun. 2020, 11, 1706. [Google Scholar] [CrossRef] [PubMed] [Green Version]
  20. Ge, M.-F.; Liu, Y.; Jiang, X.; Liu, J. A review on state of health estimations and remaining useful life prognostics of lithium-ion batteries. Measurement 2021, 174, 109057. [Google Scholar] [CrossRef]
  21. Tian, H.; Qin, P.; Li, K.; Zhao, Z. A review of the state of health for lithium-ion batteries: Research status and suggestions. J. Clean. Prod. 2020, 261, 120813. [Google Scholar] [CrossRef]
Figure 1. Flow chart for lithium-ion battery SOH estimation.
Energies 16 03393 g001
Figure 2. Battery sample.
Energies 16 03393 g002
Figure 3. Battery cycle performance testing.
Energies 16 03393 g003
Figure 4. Battery capacity fading at different cycle periods.
Energies 16 03393 g004
Figure 5. EIS of batteries at different SOC: (a) 3#; (b) 4#; (c) 6#; (d) 10#; (e) 23#; (f) 24#; (g) 35#; (h) 36#.
Energies 16 03393 g005
Figure 6. EIS of batteries at different SOH: (a) 3#; (b) 4#; (c) 6#; (d) 10#; (e) 23#; (f) 24#; (g) 35#; (h) 36#.
Energies 16 03393 g006aEnergies 16 03393 g006b
Figure 7. Schematic diagram of SVR.
Energies 16 03393 g007
Figure 8. SOH assessment model flow chart.
Energies 16 03393 g008
Figure 9. Relative errors of test set.
Energies 16 03393 g009
Figure 10. Comparison of measured and estimated capacities of LFP batteries.
Energies 16 03393 g010
Figure 11. Validation relative errors of SOH model of LFP battery.
Energies 16 03393 g011
Table 1. Technical data sheet of Li-ion battery.
Cell Technical Data Sheet
ModelV0D5N0
TypeLFP/C
Rated Voltage3.2 V
Rated Capacity60 Ah
Weight1710 ± 30 g
Internal Resistance (1000 Hz)~0.6 mΩ
Charge Cut-off Voltage3.65 V
Discharge Cut-off Voltage2.5 V
Table 2. Discharge capacity at different cycle periods.
Cycle PeriodDischarge Capacity (Ah)
100%DOD80%DOD50%DOD20%DOD
3#4#6#10#23#24#35#36#
059.16258.83359.00859.07858.66359.05158.76258.527
157.46757.61257.39557.66357.40658.02957.96357.884
257.70957.95957.56257.54057.14957.67257.48957.505
356.96257.26356.78456.75756.66757.52457.68357.616
456.36656.75856.20156.12656.20856.75056.87957.120
555.83256.21455.95055.92156.06856.34656.61556.613
655.63756.05655.89755.84755.84756.32356.40256.535
755.32855.78155.39555.52655.75956.18456.43456.312
854.56854.94453.85753.73654.67355.21156.02555.819
954.16354.54053.47653.64554.04554.47355.42155.187
1053.82754.28953.37953.46953.90854.12255.41855.327
1153.41353.84952.87353.19953.23053.49354.74254.594
1253.03553.51052.72052.95752.61353.24854.42554.482
Table 3. Characteristic frequency-point combination.
First GroupSecond GroupThird Group
Characteristic frequency-point combination186.7 Hz, 17.9 Hz, 1.4 Hz186.7 Hz, 57.8 Hz, 17.9 Hz, 5.6 Hz, 1.4 Hz1000 Hz, 186.7 Hz, 57.8 Hz, 17.9 Hz, 5.6 Hz, 1.4 Hz, 0.1 Hz
Table 4. Three verification sets of MAPE.
First GroupSecond GroupThird Group
MAPE1.82%0.96%0.98%
Disclaimer/Publisher’s Note: The statements, opinions and data contained in all publications are solely those of the individual author(s) and contributor(s) and not of MDPI and/or the editor(s). MDPI and/or the editor(s) disclaim responsibility for any injury to people or property resulting from any ideas, methods, instructions or products referred to in the content.

