Article

Frequency Support Studies of a Diesel–Wind Generation System Using Snake Optimizer-Oriented PID with UC and RFB

1
Department of Electrical Engineering Technology, University of Johannesburg, Johannesburg 2006, South Africa
2
Department of Electrical and Electronics Engineering, Engineering Faculty, Düzce University, Düzce 81620, Turkey
*
Author to whom correspondence should be addressed.
Energies 2023, 16(8), 3417; https://doi.org/10.3390/en16083417
Submission received: 16 March 2023 / Revised: 5 April 2023 / Accepted: 10 April 2023 / Published: 13 April 2023

Abstract

:
The present paper discusses the modeling and analysis of a diesel–wind generating system capable enough to cater to the electrical power requirements of a small consumer group or society. Due to high variations of the load demand or due to changes in the wind speed, the frequency of the diesel–wind system will be highly disturbed, and hence to regulate the frequency and power deviations of the wind turbine system, an effective controller design is a necessary requirement, and therefore this paper proposes a novel controller design based on PID scheme. The parameters of this controller is effectively optimized through a new snake optimizer (SO) in an offline manner to minimize frequency and power deviations of an isolated diesel–wind system. The performance of SO-PID for the diesel–wind system is evaluated by considering the integral of time multiplied absolute error (ITAE), integral absolute error (IAE), and integral of time multiplied square error (ITSE). The results were calculated for a step change in load, step change in wind speed, load change at different instants of time with diverse magnitude, and for random load patterns, and they were compared with some of the recently published results under similar working conditions. In addition, the effect of an ultracapacitor (UC) and redox flow battery (RFB) on SO-PID was investigated for the considered system, and the application results demonstrated the advantages of our proposal over other studied designs.

1. Introduction

As a working citizen, every improvement in the public domain stems from enhancements made within the industrial sectors, and these changes require massive amounts of energy directly associated with electricity. The demand for electrical power has induced the need for electrical industries to bring out their competitive side. Although competition is encouraged among the industries, the fossil fuel (FF) units that produce the bulk of the electrical energy cannot meet the demand by utilizing only standard steam-based energy generation. This demand for electrical power can only be met by finding new energy-producing methods. One of the global development goals is for renewable energy sources (RESs) which, going into the future, would provide clean essential energy generation and would remove the reliance on fossil fuels [1]. Clean, renewable energy is produced and includes biomass, hydrogen, biofuels, hydro control, sun-powered radiation, wind pressure, geothermal assets, and ocean essentials which RESs have been utilizing. Technology towards sun-radiated, that is, photovoltaic (PV) and wind energy units, have been dominating and increasing due to the neighborhood-specific environments and advancements within the RESs. Additionally, it boosts positive finance and the development of communities [2]. Within these RES structures that promote growth, one has to adhere to the control and importance of the generated power and how it progresses if RESs are to be fully implemented within the energy system.
Concerns are increasing within the FF sector, including increasing costs and shortages, which enhances the positive move toward RESs to subsidize the control framework [3]. Sources within the renewable energy system cannot predict adequate control and efficiency, which in turn affects the planning of frequency control. This would insinuate that these significant issues could be resolved with the idea of a micro-grid in the grid-connected and isolated mode that could improve and control the frequency framework in immense commercial and provincial areas. Other methods of reliable power supply within the electrical control system can be substantiated through the use of diesel-generating and wind-based units, which have gathered momentum by way of green vitality in confined control systems. Wind-based units are susceptible to fluctuations in yield and the framework frequency due to variations in wind speed or load demand [4]. The change in frequency and power greatly influences the control technique and stability of locally linked networks which also influences the security of these networks, as discussed in [5]. Some studies such as [6] have examined the unconnected fusion models made up of a fuel cell, diesel engine generator (DEG), and wind turbine generator (WTG), while in [7], the basis of mixed PV–fuel cells for standalone applications was explored. Although it is safer to have large-capacity batteries at one location and not in motion, the control and interchange of PV–fuel cells and battery banks powering an electric vehicle (EV) were studied in [8]. The load demand of 3 kW within the EV was powered by a battery bank, a film fuel cell, and a PV-generating control system. In [9], an investigation of wind turbines, fuel cells, and solar PVs was combined with numerical modeling, and the battery bank control environment was a crucial part of the study. In [10], the control application of a hybrid model was explored by Aissou et al., which included wind generation apart from the primary battery and PV inverter scenario to cater to expanding loads. The outstanding part of the work by Tamalouzt et al. in [11] was the recreation of a micro-grid control system that utilized a battery bank, PV generator, fuel cell, doubly fed induction generator, and a wind turbine. In most cases, the RES depended on the climate circumstance at that instance in time. This, moderately said, would be the circumstance where the electricity demand has expanded over the supply ability. If the latter occurs, i.e., an excess of supply (an overflow), the RES systems would have to control its overflow with energy storage devices (ESDs). The ESD would be able to handle and control the overflow of supply for a duration as the load increases; the demand would use up the ESD as the system requires. Storage devices utilized for energy, consisting of a battery, capacitor, flywheel, and superconducting magnet energy storage (SMES), can accommodate an overflow of energy and convey it at the top of the load request [12,13,14]. ESDs utilized with a hydrogen generative aqua electrolyzer (HAE), which includes a fuel cell, are labelled as capable in comparison to other capacity ESDs due to their needed operation. RESs, which can accommodate diverse energy storage systems, could utilize the HAE structure to break down water or normal gas into oxygen and hydrogen; then, it is a matter of compression techniques to store the gas. This would entail transferring the gas to fuel the cells via pipelines. In an instance of higher load demand, the HAE has the ability and potential to stabilize the system state [14]. Another storage device that can supply a fast-acting capacity to the system in the event that the generator rotors need a headway due to control demand is the redox flow battery (RFB). The RFB has the ability to dampen electromechanical expansions of the control system by discharging through control systems that include inverter/rectifier networks [15]. This essentially allows the RFB to almost instantaneously adapt to load changes, thereby decreasing the demand. Furthermore, ultracapacitors (UC) are currently powerful and inexpensive storage devices and have been used by several researchers for various power system applications [16]. Be it a bigger or smaller controlling capacity such as an isolated diesel–wind system, frequency regularization is an essential feature of power delivery systems as required by clients that should be in the form of inexpensive, tenacious, and high-quality electrical energy. The strategy to be implemented for essential control in this paper will be based on the PID as suggested within the scope of [17].
Hybrid power system (HPS) applications have met with numerous evolutionary computational intelligence (CI) techniques which have to some extent, enhanced and developed the HPS system. In [18], genetic algorithms were applied to design a hybrid solar–wind generator with a battery bank as an ESD. In [19], the amalgamation of different energy resources and energy storage elements was utilized to minimize frequency deviations. This research explored a PID controller with optimization algorithms to improve the frequency deviation of the generating structures, which gathered valuable methodological information from [20], that utilized the particle swarm optimization (PSO) technique in the simulation studies of autonomous hybrid energy generation and energy storage structures. Although the PID controller has been optimized with different techniques, in [21], the design and optimization of the controller parameters were optimized using the JAYA algorithm to be specific to the self-adapting multi-population elitist optimization, which targeted the ITAE and IAE objective functions. In [22], the efficiency of the wind–solar generating structure utilizing hybrid energy storage was optimized by applying a combination of simulated annealing and PSO. The HPS model made up of solar–wind–fuel cell simulation in [23] used the artificial bee swarm algorithm technique that not only resulted in the optimization of the model but showed that the HPS design was also cost-effective. In [24], the studies of the simulated hybrid models utilized PV, fuel cells, DEGs, WTGs, battery energy storage, flywheel, aqua electrolyzer, and ultracapacitors, which were all optimized by a GA optimizer. A chaotic PSO and fractional order fuzzy control method was applied to an HPS with renewable energy generation, which was studied in [25]. A new and powerful quasi-opposition harmony search (QOHS) technique was used in [26] to solve the frequency regulation problem of various power system models. In the current field of optimization techniques, multi-area power systems (MAPs) of a two-area non-reheat thermal system were explored and optimized with an Artificial Rabbit Algorithm (ARA) [27]. The AR algorithm was employed in optimizing the PID controller parameters for the load frequency control. Another MAP exploration optimization technique is the Coyote optimization algorithm, utilized with cascading controllers [28]. This multi-area power system exploration also included PV panels as a RES. With the advancement in the field of metaheuristic techniques used for the optimization problem, there is still a possibility to explore new and powerful optimization techniques such as the snake optimizer (SO) [29] to solve power system problems in a much better and in an effective way and hence, this work set out to:
  • Study and present the modeling of a diesel–wind isolated system in an interconnected mode for frequency regularization studies capable enough to provide uninterrupted electrical energy during a change in the load demand.
  • Present the new control strategy for a diesel–wind isolated system to reduce or minimize the frequency and power deviations in the event of load change or in case of a change in wind speed. The proposed design is formulated by using PID and the gains of PID, which play an important role and are obtained via the new SO algorithm.
  • Study and present the modeling of UC and RFB for diesel–wind generating systems.
  • Investigate the performance of SO-PID for various working conditions and to compare the results with the Ziegler–Nichols method [1] and with the quasi-opposition harmony search (QOHS) technique [26].
  • The results are matched for a step change in load, step change in wind speed, load change at the different instances of time, and for continuous load patterns and via calculating gains of the controller and through error values, i.e., integral of time multiplied absolute error (ITAE), integral absolute error (IAE), and integral of time multiplied square error (ITSE).
  • The outcome of SO-PID was also compared via plotting frequency and power deviation response for the diesel–wind system.
  • In addition, the effect of UC and RFB impact on the output of the diesel–wind system was also investigated and compared to determine the best control design within the system for diverse working conditions.

2. The Detailed Modeling of the Isolated Diesel–Wind System

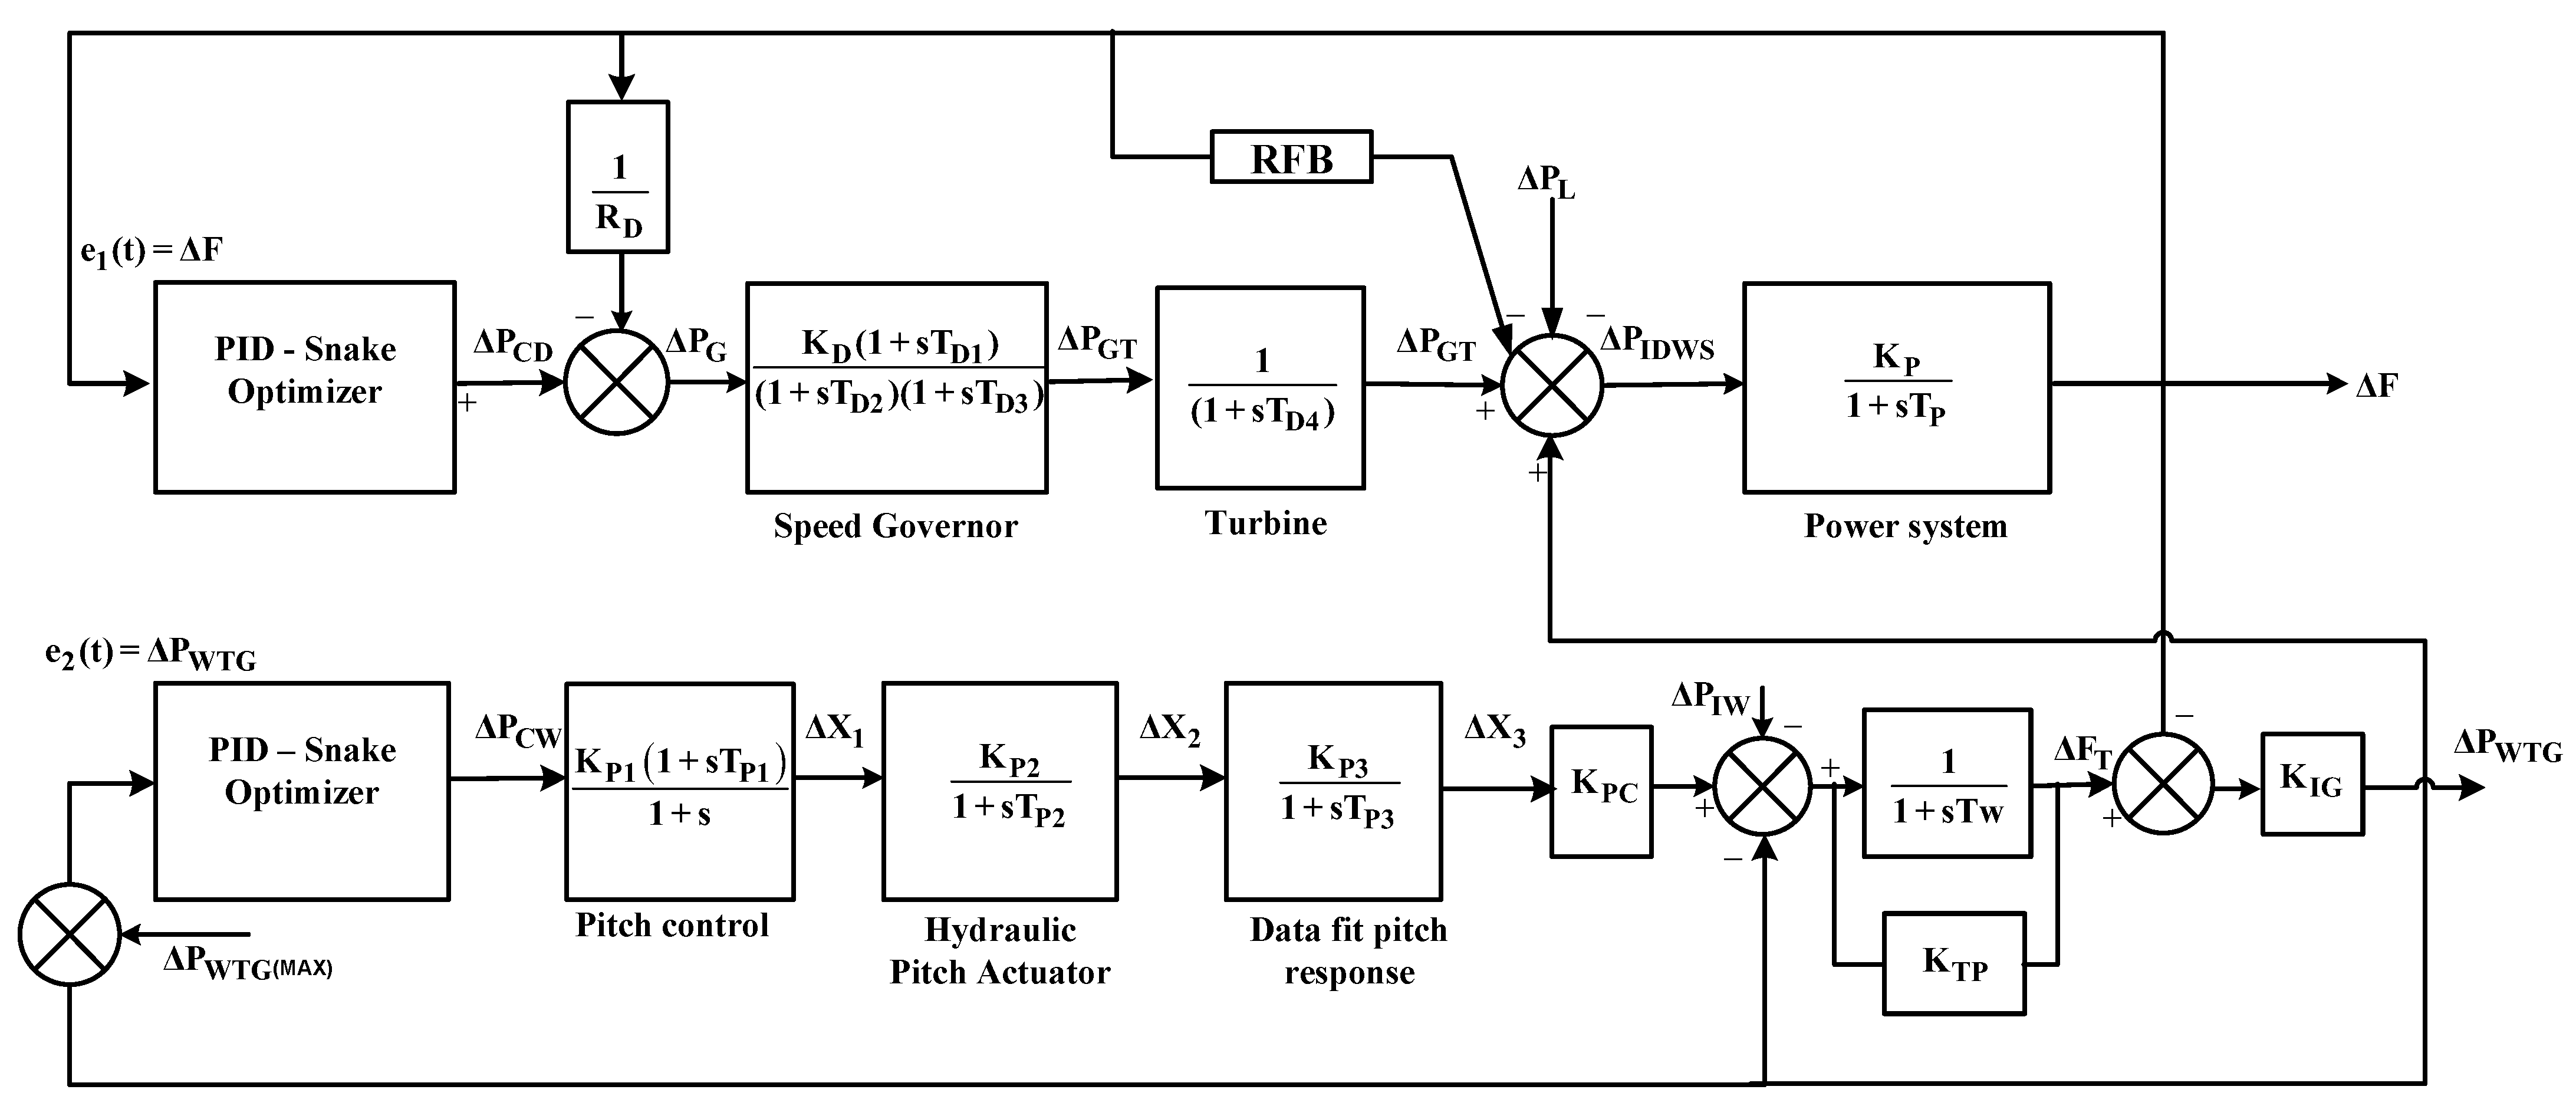
The wind turbine and diesel engine generators are some of the most reliable energy sources to accomplish a continued supply of power. The DEG and WTG individual generating systems can provide a capacity of 150 kW. Due to the WTG being reliant on weather conditions, more accurately, wind speed, the DEG has an advantage in supplying uninterrupted power (UP). Figure 1 below is a representation of the linear model of the DEG. The system parameters are given in Appendix A in Table A1. The model is powered by a diesel engine and also includes a turbine that is restricted by a speed governor contrivance. Within the generator, the transfer function is as follows [26]:
Δ P G D = 1 ( 1 + s T D 4 ) Δ P G T
Δ P G T = ( K D ( 1 + s T D 1 ) ( 1 + s T D 2 ) ( 1 + s T D 3 ) ) Δ P G
Δ P G = Δ P C D ( 1 R D ) Δ F
Due to the speed governor being the eye of the model, the above equation equates to Δ P G T providing an incremental change of the output of the speed governor (p.u.) while providing the control signal of the speed governor within the diesel system (p.u.). Δ P G provides the control signal of the speed governor (p.u.). Δ F provides the frequency alteration, while KD provides the gain of the speed governor, and TD1, TD2, and TD3 are the time constants in seconds. The turbine has a unity gain and a responding time TD4, and a speed regulator of the diesel system represented by RD.
The WTG system utilizes the dynamic energy of the wind through a process of mechanical excellence to finally produce electrical energy. This dynamic model of wind generation is featured in Figure 1. Within the WTG model, a transfer from the hydraulic connection to the actual speed must be a clear distinction between the turbine and generator frequency. The change in produced power is expressed in Equation (4) as described by [26].
Δ P W T G = K I G [ Δ F T Δ F ]
Δ F T signifies the wind generator’s speed change, and KIG represents the gain obtained from the hydraulic connection. Equation (5) displays the induction generator speed:
Δ F T = ( 1 1 + s T w ) [ K T P Δ F T Δ P W T G + K P C Δ X 3 + Δ P I W ]
In most wind generation techniques, blade characteristics have to be considered. KPC in Equation (5) is considered the blade gain contribution, while ΔPIW is considered the input wind control (in p.u.). The data fit pitch (DFP) yield is considered with ΔX3 within the system. With most systems, there is some lag that has to be compensated for, which has a function to match the gain characteristics of the micro-grid model. The DFP yield of the system is represented as:
Δ X 3 = Δ X 2 [ K P 3 1 + s T P 3 ]
In Equation (6), the yield of the hydraulic pitch is represented with ΔX2, and the system also considers the responding time of the DFP with TP3, also a gain indication with KP3. The regulation of the pitch angle of the blades within the wind turbine is the function of the hydraulic pitch system (HPS) that has an output of:
Δ X 2 = Δ X 1 [ K P 2 1 + s T P 2 ]
In Equation (7), ΔX1 is the yield of the pitch controller with the HPS gain indication with KP2 and the time constant of the HPS represented by TP2 (in seconds). The importance of the pitch angle has to be carefully considered due to the wind turbine achieving a maximum yield. Representation of the pitch angle systems is as follows:
Δ X 1 = Δ P C W [ K P 1 ( 1 + s T P 1 ) 1 + s ]
Equation (8) provides a control signal in (p.u.) of the pitch angle system by ΔPCW and KP1 showing the gain of the pitch angle output. TP1 allows the pitch angle mechanism to respond in seconds to provide control and gain to the system.
The quality of power delivered by the micro-grid calls for the restriction of the frequency in the system, which has to consider the load demand for the DEG and WTG system to generate total power generation. With that being said, any misinterpretation between the created control and load request may vary the micro-grid frequency, which has to be controlled as seamlessly as possible. As indicated in Equation (9), the micro-grid frequency response creates a first-order representation in the form of gain, transfer function, and time constant. KP is an indication of the gain, and TP is an indication of the micro-grids’ time constant as shown below:
Δ F = Δ P I D W S [ K P 1 + s T P ]

3. Redox Flow Battery (RFB) and Ultracapacitor (UC) Details

One crucial energy storage device with a quick control reaction concerning frequency deviations is the redox flow battery (RFB). As a reaction speed indication, the RFB can control its operating time within seconds. The RFB storage device has a higher efficiency due to its robust charge and discharge capacity. This discussion of the RFB is illustrated completely in [15]. An interesting feature of the redox flow battery is that the electrolyte within the battery is stored in two different tanks. This feature allows no self-discharge of the RFB and hence enhances its life span, which is much higher than other batteries. The electrolytes comprise sulfuric acid solutions containing vanadium ions confined in a positive and negative storage tank. Furthermore, the RFB is relatively safe when operated at normal temperatures, although it has been known for its rapid charging and discharging abilities. Another feature of the redox flow battery is the unit’s ability to efficiently reload after a load disturbance has occurred. This means that the RFB set value can be restored quickly enough so as to not to cause any delays within the next load disturbance. RFB set value and the power exchange to the system would depend on the deviated frequency signal, and its incorporation is shown in Figure 2. The system parameters are given in Appendix A in Table A1.
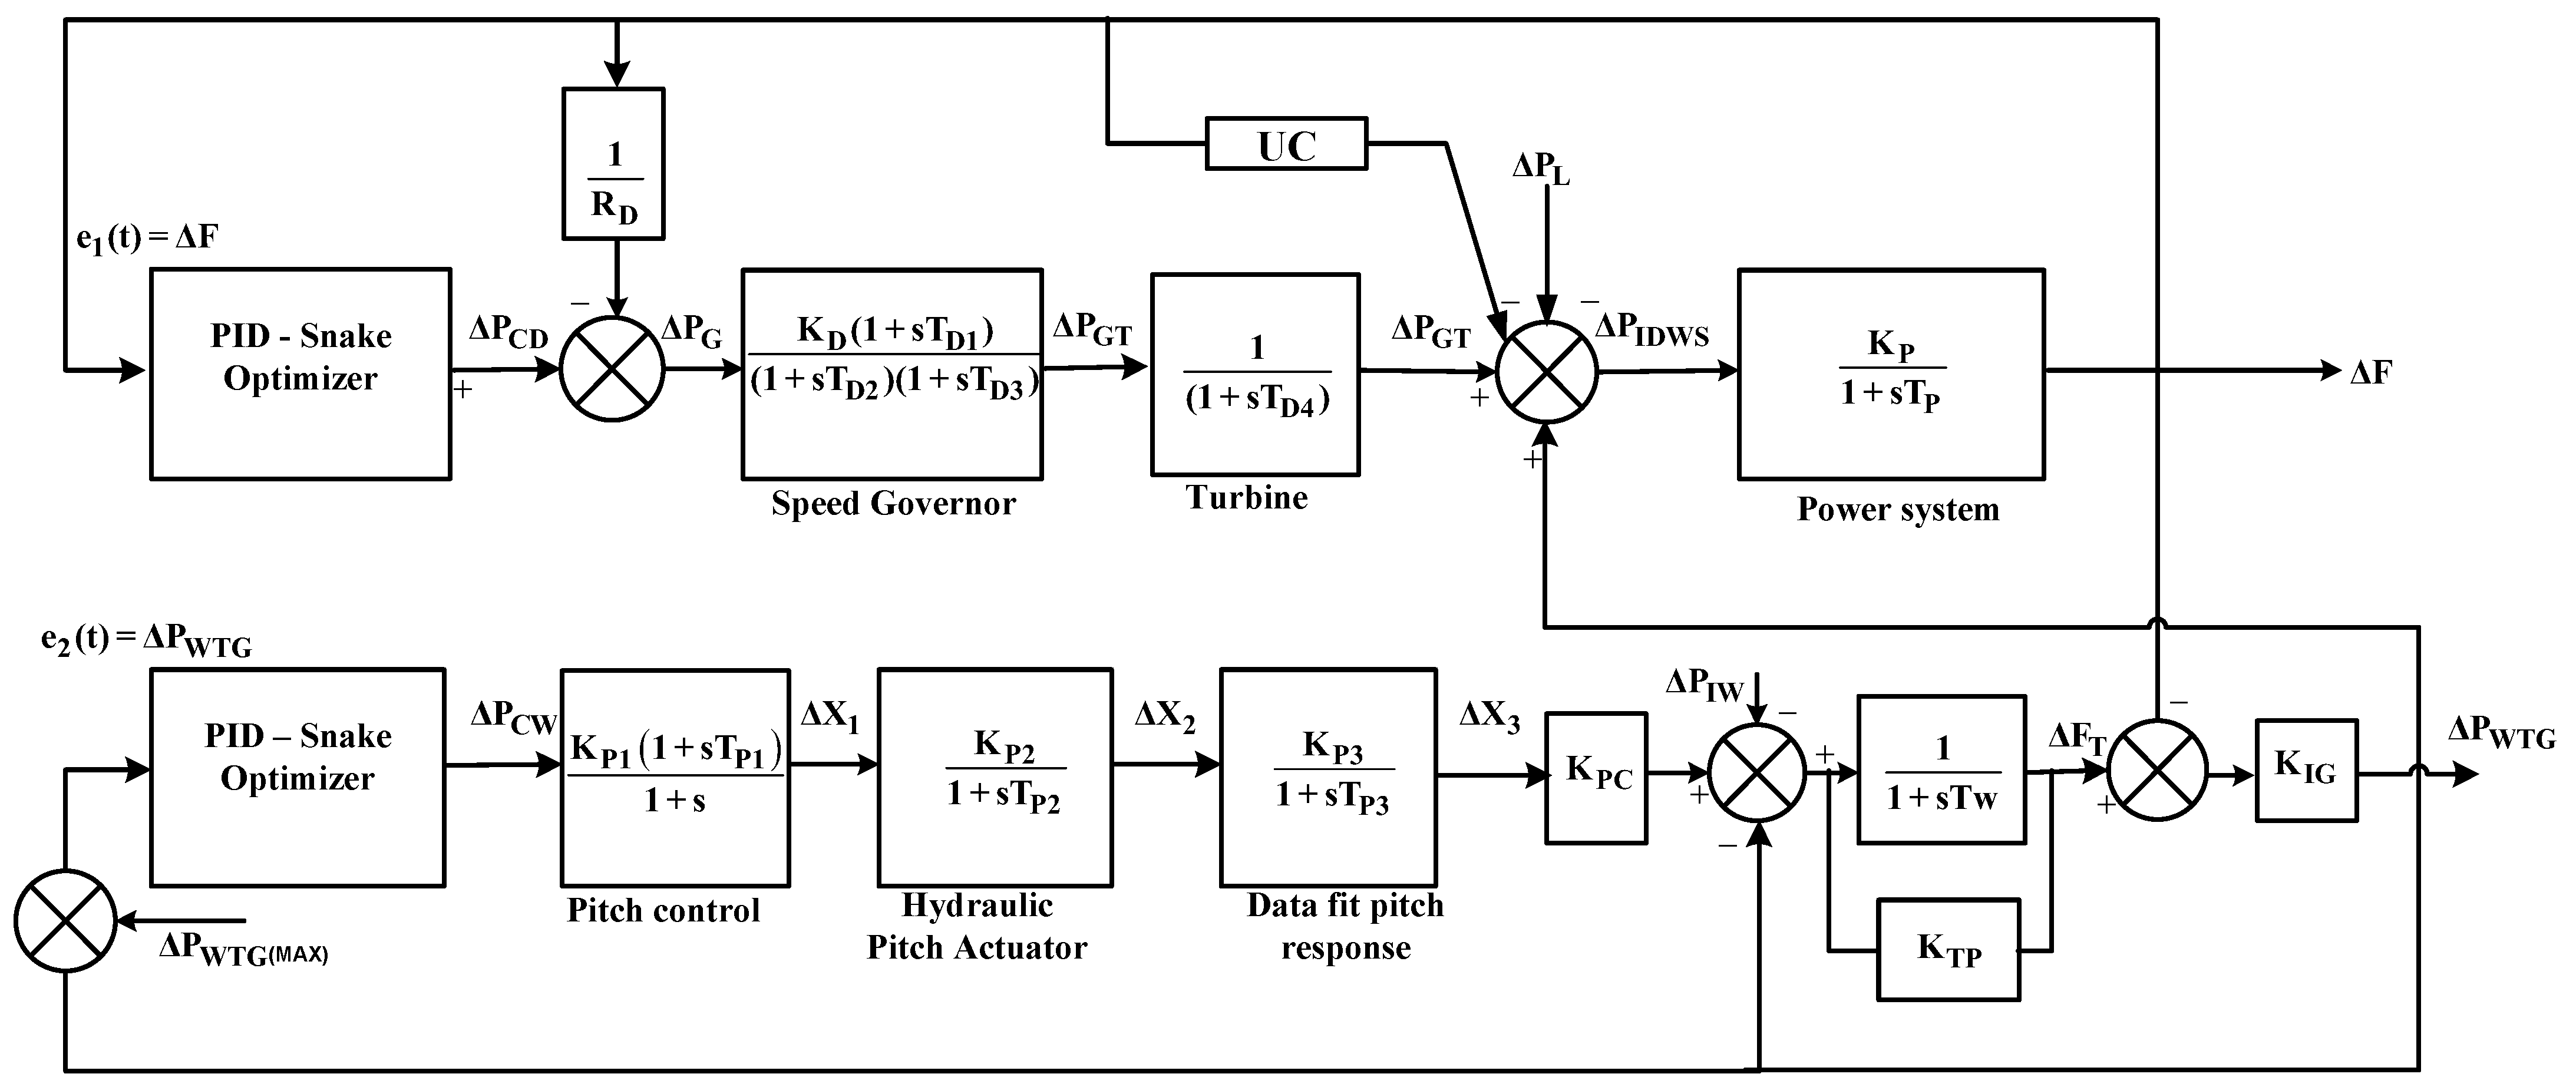
Advanced technology in energy devices has surfaced within the electrochemical device range, namely ultracapacitors (UCs), which are also known as electric double-layer capacitors or supercapacitors. The technical aspects of a UC include a composition of potassium hydroxide as an electrolyte and two permeable anodes which have an ion-exchange layer segregating them. The difference from a standard capacitor is the vast surface area of the capacitor’s permeable terminals and electrolytic fluid. UCs also stand out with an improvement in capacitance by the slightly thicker two-fold layer within the capacitor. These two factors increase the reliability of UCs from (100 to 1000 times) more than an ordinary electrolytic capacitor. UCs’ compact design and high energy density provide an edge over standard capacitors and allow for massive amounts of energy storage. While most UCs offer an increased power capacity compared to batteries, they have a rating of high specific energy of 1–10 Wh/kg and a specific power energy rating of 1000–5000 W/kg. They can be discharged and charged quicker than a battery or normal capacitor, which is also maintenance-free and offers a longer life cycle. However, the qualities of a UC make it suitable for a wide range of LFCs, nonlinearities coaxed by various assumptions, and the validation of a UC can be indicated through a first-order TF. A control zone frequency deviation can work as an input to the UC and its TF is shown in Equation (10) below [16]:
Δ P UC ( s ) = { K UC 1 + s T UC } Δ F ( s )
KUC is known as the gain pick time of a UC, with TUC being the time constant. The state of charge (SOC) is the state of charge that makes the gain KUC dependent on it. The gain of the UC is maintained steadily between 50% and 90% of the working SOC. The incorporation of a UC is shown in Figure 3.

4. Snake Optimizer Details and Execution Steps

The last ten years have seen the development of many algorithms that provide solutions to significant data difficulties and analyses. Many of the difficulties stem from real-world engineering applications. Therefore, continuously solving these problems with different optimization techniques and algorithms is needed. One approach that utilizes a relationship between snakes has produced positive results. The SO technique is currently used in this research and a sequence of events around snakes outlined below [29].

4.1. Mating Behavior of Snakes

Male and female snakes mate under the influence of a few factors. These factors involve the temperature of the area, the availability of food, as well as the male and female dominance. Questions also arise if there is more than one dominant male: a competition will naturally emerge, in the form of a fight, to attract the female. If the female is attracted and mating does occur, the female would lay eggs and leave once the offspring emerge.

4.2. Inspiration Source

The SO model is based on the mating behavior of snakes, which has to occur in low temperatures and with available food, or else the snakes would search only for food or consume existing food. This brings about two processes: exploitation and exploration. The exploration involves environmental factors, i.e., cold temperature and food. The exploitation factors involve different cases, which is a combination of the temperature and availability of food to obtain a more global efficiency towards the probability of mating. This probability also involves the fight mode before mating with a female, which may produce new snakes in the successful case.

4.3. Algorithm and Mathematical Model

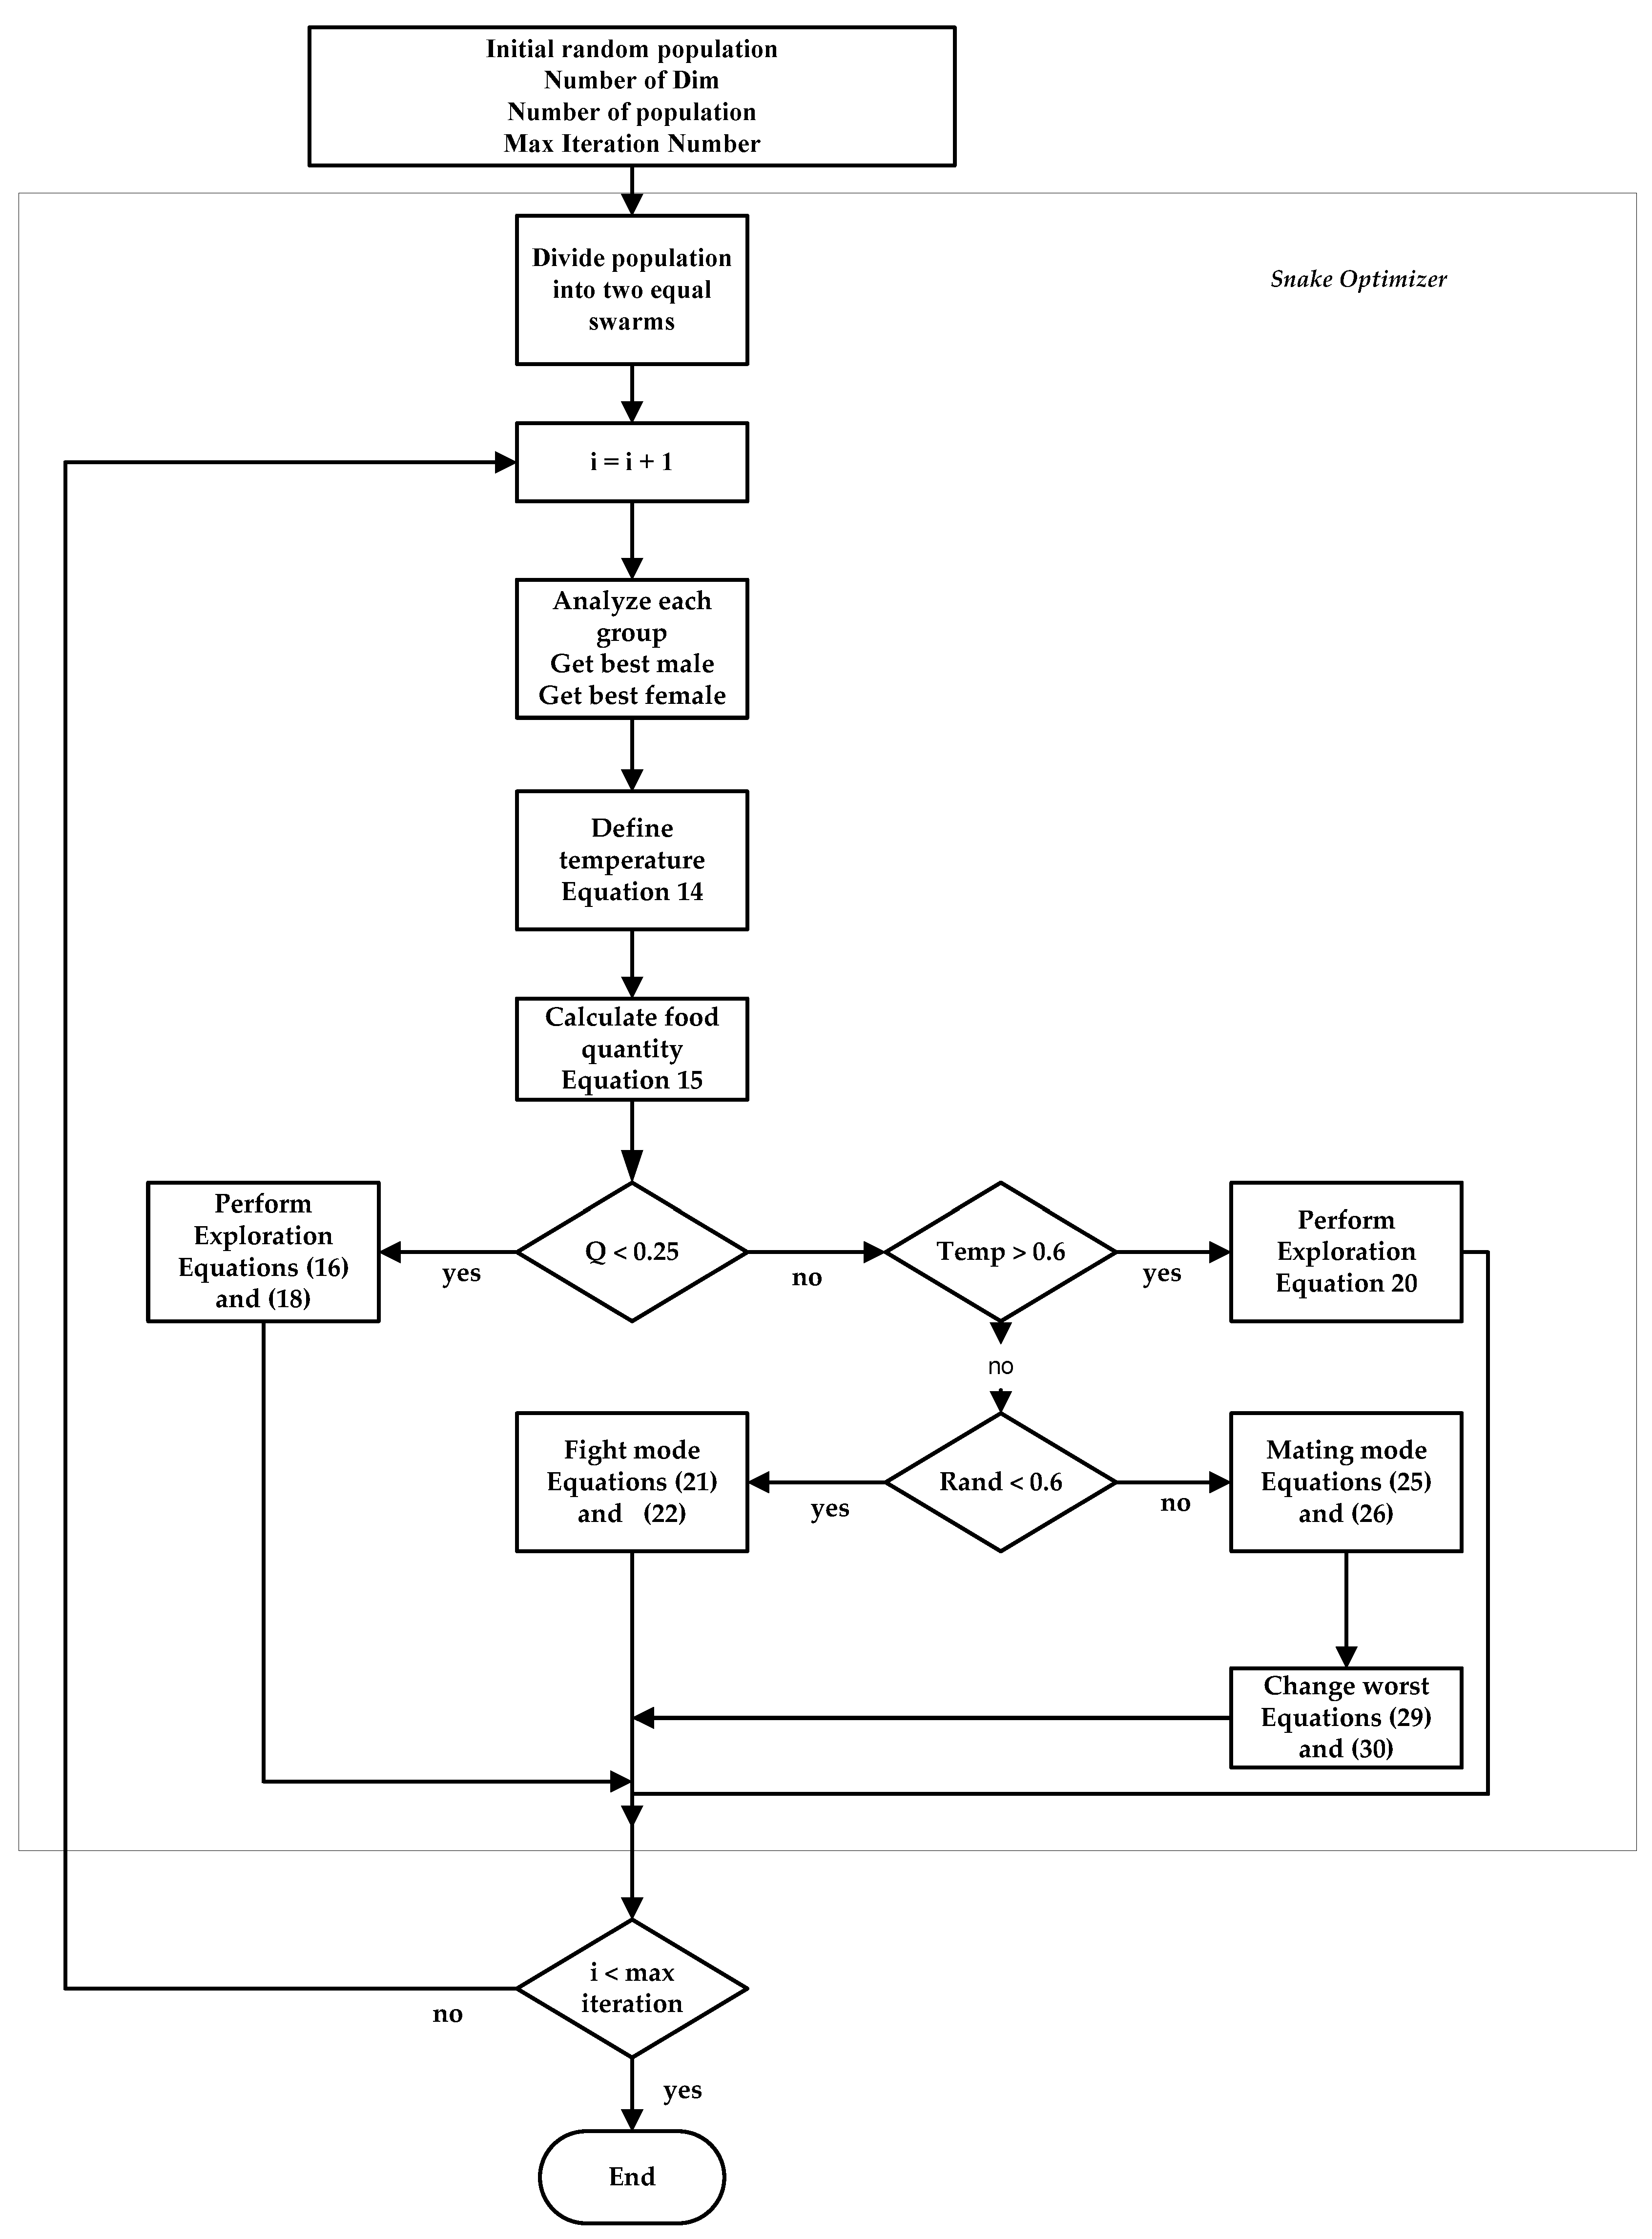
The SO model is illustrated in Figure 4 and explained in detail below [29].

4.3.1. Initialization

The SO optimization algorithm process begins by generating random populations with uniform distributions, similar to other metaheuristic models. This Initial population could be processed by utilizing the following equation:
X i   = X m i n + r × ( X m a x   X m i n )
In Equation (11), r is a random number between 0 and 1, and Xmin and Xmax reflect the lower and upper bounds of the problem.

4.3.2. Division of the Swarm into Two Groups: Females and Males

The female group and the male group make up 50% of the population each, and the division is obtained by applying Equations (12) and (13)
N m N 2
N f = N N m
In Equations (12) and (13), Nf represents the females while Nm represents the males, and N is the total number of females and males.

4.3.3. Food Quality and Temperature and Each Group Valuation

The best male (fbest,m) and best female (fbest,f) and also the food position (ffood) is evaluated within each group. Equation (14) defines temperature Temp:
T e m p = e x p [ t   T ]
where T represents the maximum number of iterations and t represents the current iteration of the algorithm. Food quantity is calculated by utilizing Equation (15), where c 1 is a constant equal to 0.5:
Q = c 1 × e x p   [ t T T ]

4.3.4. Exploration Phase (No Food)

There is a threshold at which the snake is required to search for food and any random position is selected, updating their position. This only occurs if Q < threshold (threshold = 0.25). The formulation of the exploration phase within the model is as follows:
X i , m   ( t + 1 ) = X r a n d , m ( t ) ± c 2 × A m × ( ( X max X min   ) × r a n d + X min   )
In the above equation, rand is a random number between 0 and 1, Xi,m is the ith male position, Xrand,m is the position of a random male, and Am is the capability of the male to source food and is calculated as:
A m = e x p [ f r a n d , m f i , m   ]
Just to note that in Equation (17), frand,m is the fitness of Xrand,f, and fi,f is the fitness of the ith individual within the male group.
X i f = X r a n d , f ( t + 1 ) ± c 2 × A f × ( ( X m a x X m i n ) × r a n d + X m i n )
Xi,f above represents the ith female place and Xrand,f is the random female’s location.
The capability of the female to source food, Af, is shown below:
A f = e x p [ f r a n d , f f i , f ]
Similar to the male individual, frandf refers to the fitness of Xrand,f and the fitness of the ith individual in the female group is fi,f.

4.3.5. Exploitation Phase (Existing Food)

If Q > threshold and the temperature > threshold (0.6) (hot).
The formulae above show when snakes would move to the food only.
X i , j ( t + 1 ) = X f o o d ± c 3 × T e m p × r a n d × ( X f o o d X i , j ( t ) )
In Equation (20), C3 is a constant with a value of 2, Xi,j is the individual male and female position, and Xfood is the position of the best male and female.
When the temperature is less than 0.6%, which is the threshold, the snake will be in mating or fight mode.
X i , m ( t + 1 ) = X i , m ( t ) + c 3 × F M × r a n d × [ Q × X b e s t , f X i , m ( t ) ]
FM refers to the male’s fighting ability within the fight mode in Equation (21), Xi,m represents the ith position for the male, and Xbest,f represents the best female in the group.
X i , f ( t + 1 ) = X i , f ( t + 1 ) + c 3 × F F × r a n d × [ Q × X b e s t , m X i , F ( t + 1 ) ]
FF refers to the fighting capability of the female, Xi,f represents the ith position of the female, and Xbest,m represents the best male individual in the male group.
FF and FM can be equated as shown below:
F M = e x p [ f b e s t , f   f i ]
F F = e x p [ f b e s t , m   f i ]
In Equations (23) and (24), fbest,f and fbest,m are the fitness of the best female individual in the female group and the best male individual in the male group, respectively, and fi is the fitness agent. If the fitness levels are reached, the expected next level would be the mating mode, which is given below:
X i , m ( t + 1 ) = X i , m ( t ) + c 3 × M m × r a n d × [ Q × X i , f ( t ) X i , m ( t ) ]
X i , f ( t + 1 ) = X i , f ( t ) + c 3 × M f × r a n d × [ Q × X i , m ( t ) X i , f ( t ) ]
Equations (25) and (26) contain the formulation of the ith female group and male group as Xi,f and Xi,m, respectively. Mm and Mf represents the mating capability of the male and female, respectively, as shown below:
M m = e x p [ f i , f   f i , m ]
M f = e x p [ f i , m   f i , f ]
This brings the algorithm to the decision that if the egg hatches, it will replace the worst male or female.
X w o r s t , m = X m i n + r a n d × ( X m a x X m i n )
X w o r s t , f = X m i n + r a n d × ( X m a x X m i n )
From Equations (29) and (30), the replacement of the Xworst,m and Xworst,f, i.e., the worst female probability and the worst male probability, is one of the unique ways that the SO optimizes performance. The operator ± known as the flag direction operator and also called the diversity factor provides the possibility to decrease or increase the solution of positions. This provides many opportunities to change the direction of agents which, in turn, can search the space in all probable directions. Within any metaheuristic algorithm, it is essential to achieve randomization, and using the SO to perform this search is most beneficial. This operator is implemented in many metaheuristic algorithms; one that stands out is from the hunger games search (HGS). The SO algorithm continues for several iterations until the criterion has been met.

5. Results and Analysis

The present work is dedicated to research, modeling, and designing a novel controller for a diesel–wind isolated system. This model is capable of meeting the electrical energy requirement of a small community or society. The present isolated system consists of a diesel engine generator with a capacity of 150 kW and a wind turbine system with a capacity of 150 kW. The diesel system has a speed governor mechanism capable of increasing or lowering the power generation to match the standard frequency requirement. Due to the wind system and due to high variability of load, there may be high-frequency power deviations; hence, to provide quality power to the customers, it is essential to minimize these deviations in the shortest amount of time, which could be possible by adding the controllers for diesel and wind separately, and minimize the error which is the difference between actual and desired output. The idea behind the present study is to explore a well-known and simpler control structure, i.e., PID, for research and investigations. However, the PID design is enhanced via a new SO algorithm. The full details of this algorithm are given in Section 4.
The aim of SO is to minimize the error definition and, for the present study, three different error definitions were used, which are the integral of time multiplied absolute error (ITAE), the integral of time multiplied square error (ITSE), and integral of absolute error (IAE) as shown in Equations (31)–(33). IAE is known to yield a slow response without knowledge of time. ITSE can provide a fast dynamic response, but it results in notable sustained oscillations owing to squaring the error and tolerating the error at the start of the response. By adding a time weight to IAE, ITAE is obtained, enabling a more desirable response with a shorter settling time and mild or no overshoot [30,31,32]. As such, ITAE was preferred in this research as an objective function during the optimization by SO.
I T A E = 0 t s t | Δ F |   d t
I A E = 0 t s | Δ F |   d t
I T S E = 0 t s | Δ F | 2   t   d t
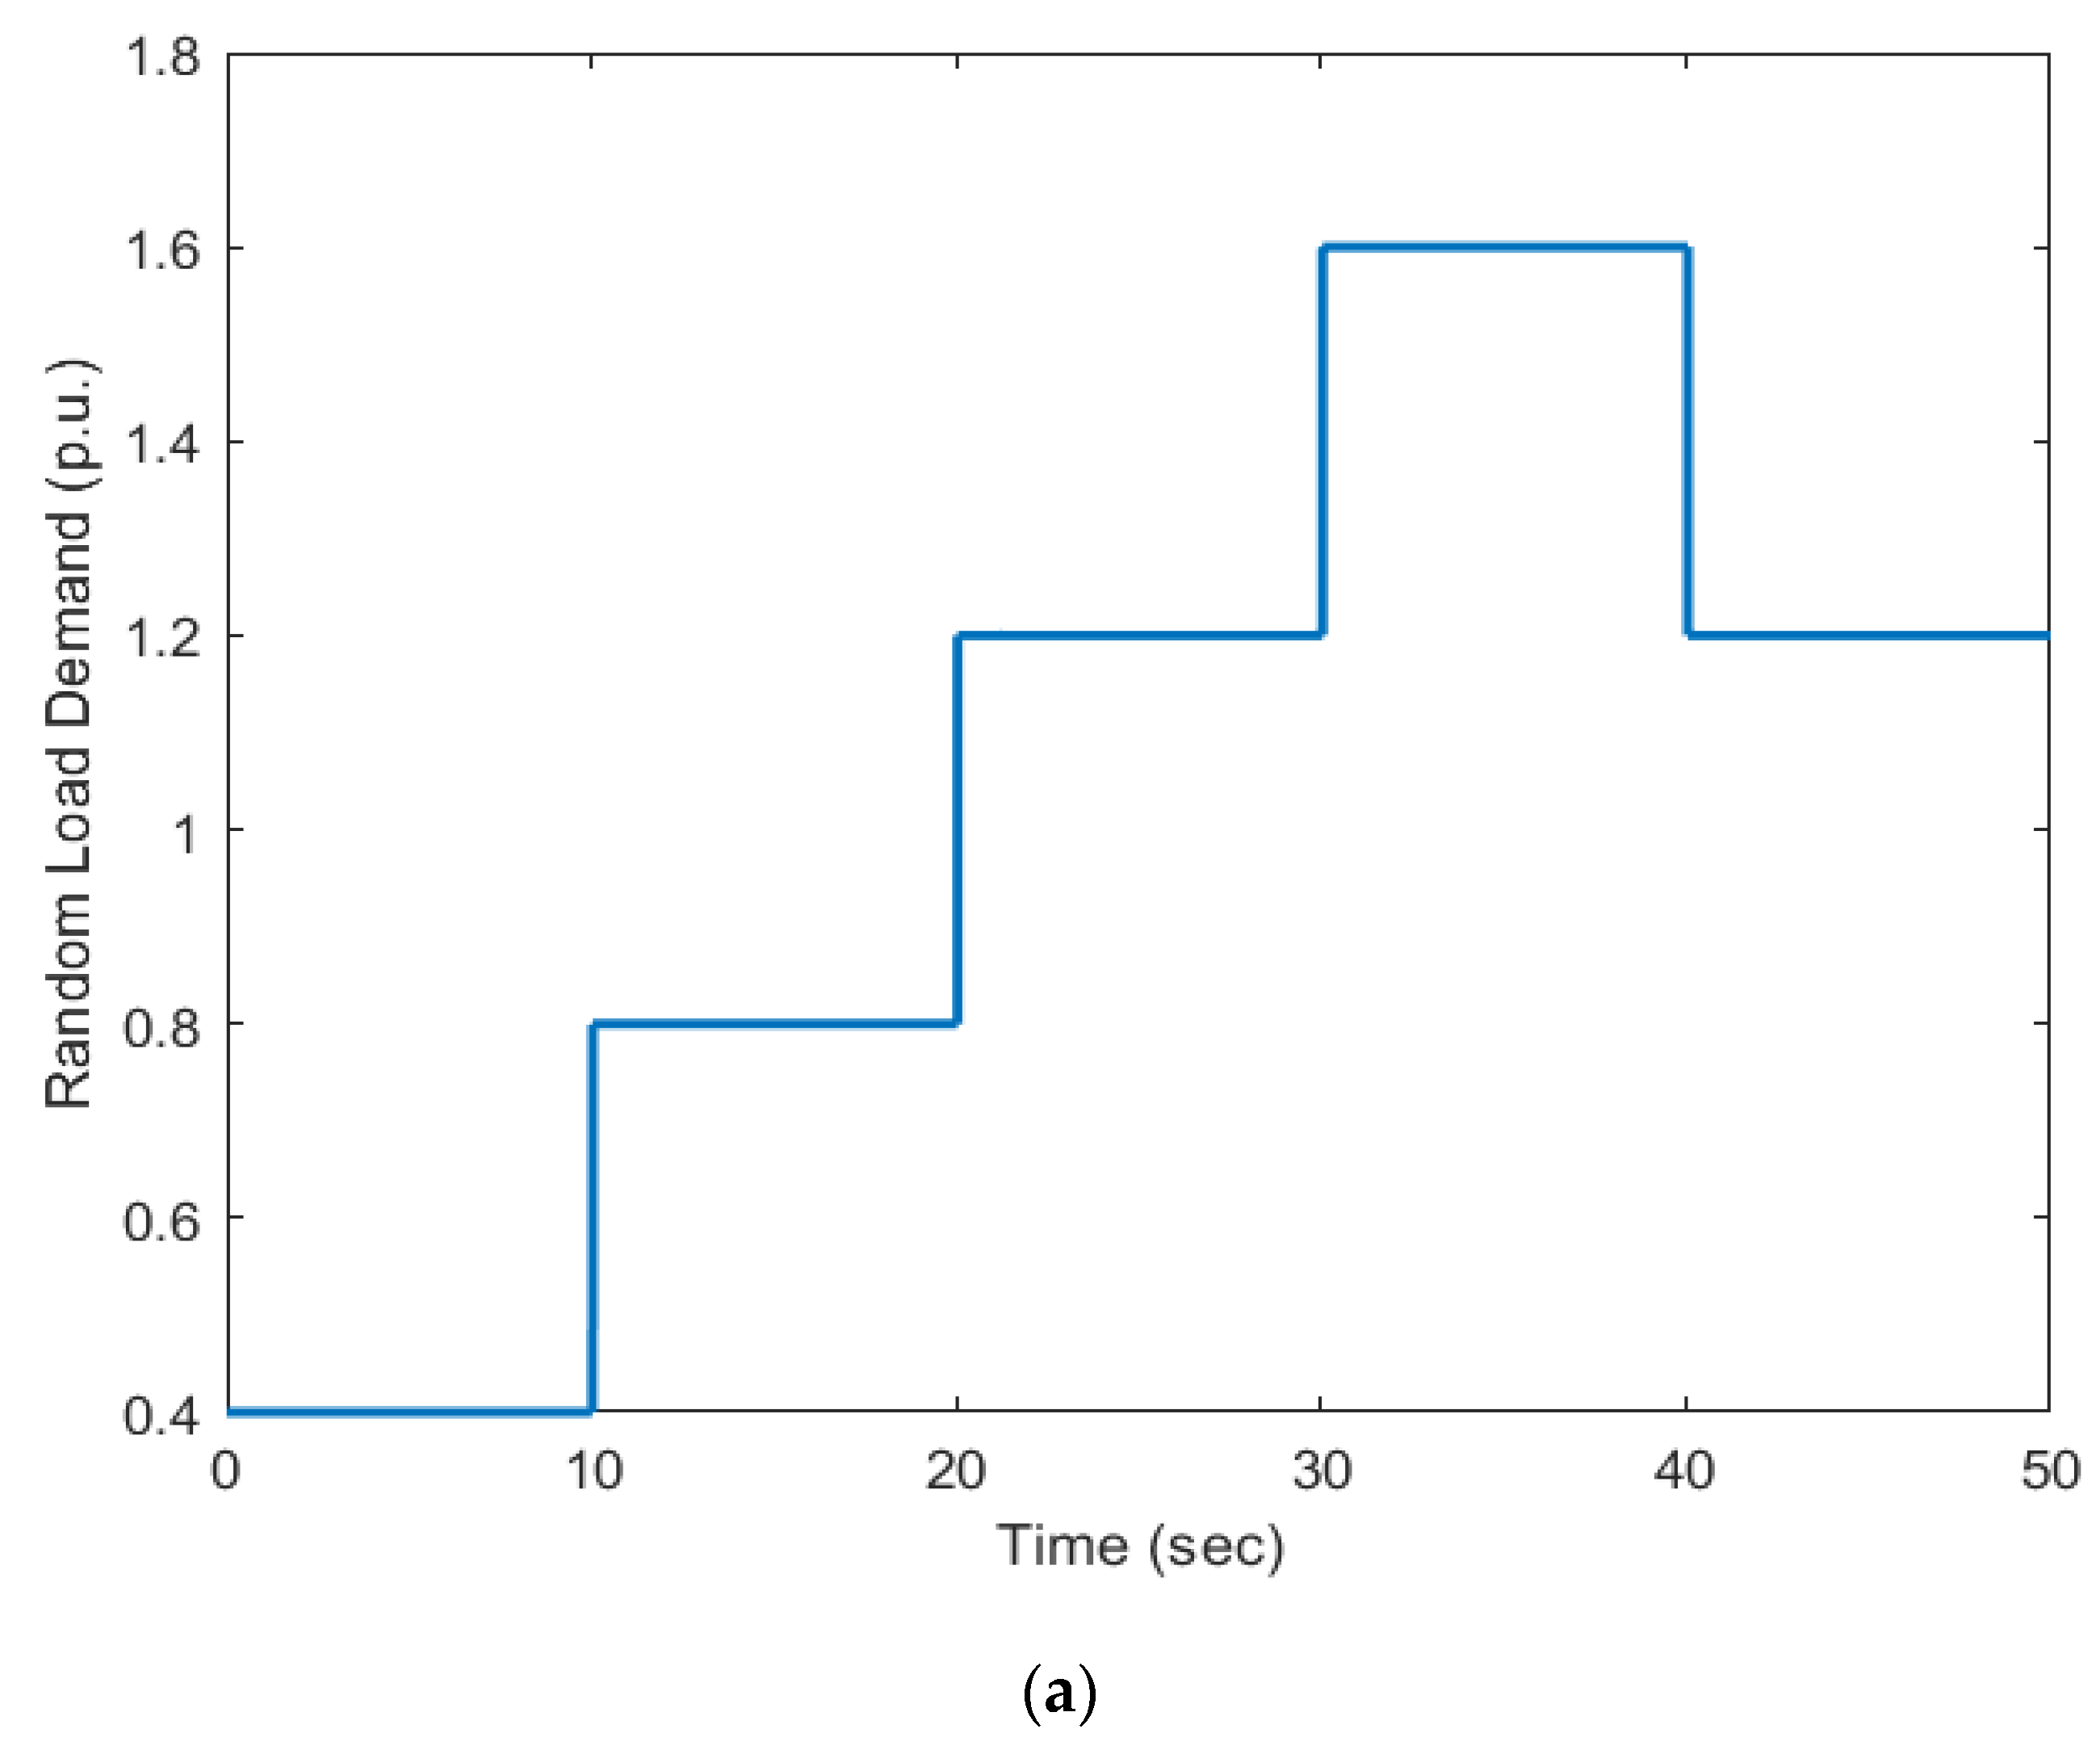
During the course of optimization, the PID controller gains were not optimized considering only one profile of load disturbance. Instead, they were procured under random changes in the load demand to accommodate the new condition. The random load input was limited to the range of −0.4 p.u. to 1.6 p.u., and it can be either in an increasing trend or decreasing trend, changing in steps with a specific duration of time.
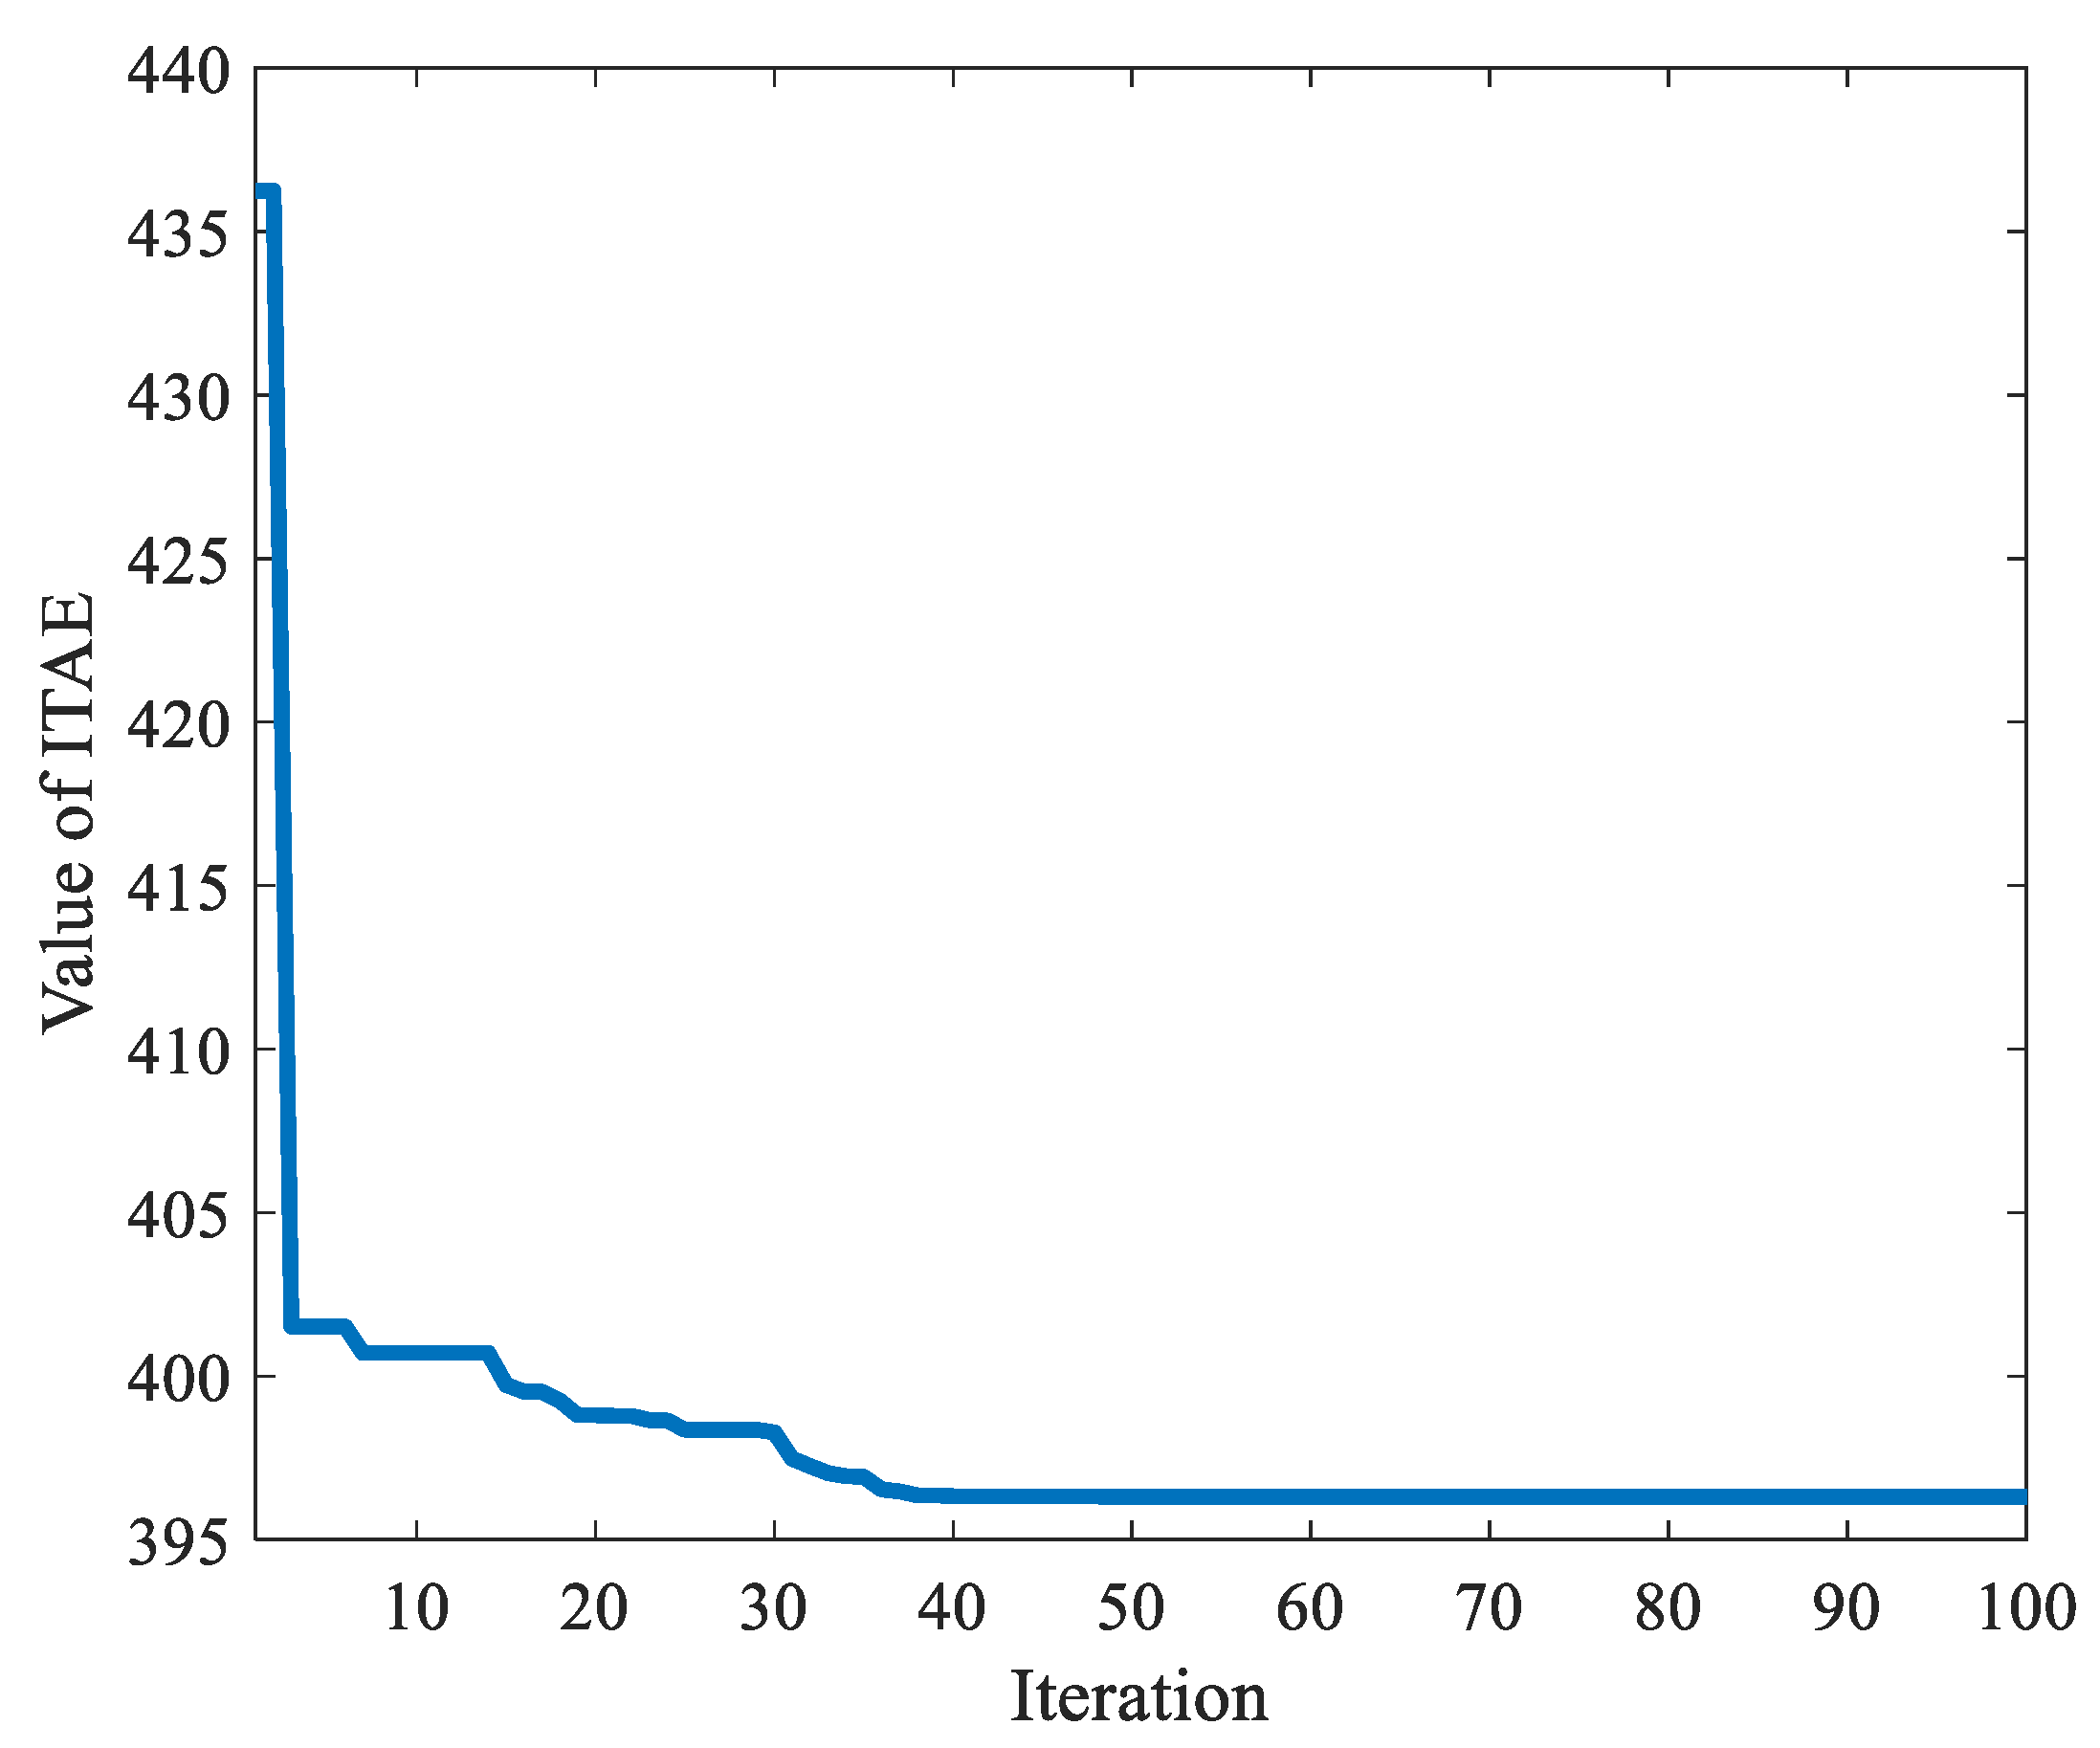
The convergence profile of SO during the minimization of the ITAE value is displayed in Figure 5, when the number of snakes and maximum iteration number was set to 50 and 100, respectively. As can be seen, after a sharp decrease in the early stages of the optimization, ITAE was reduced to 396.3 from 436.2 with no undesirable oscillation. Therefore, it can be inferred that SO can exhibit promising convergence characteristics. It may also be noted from Figure 5 that the algorithm stagnated and achieved the final solution after 50–60 iterations. No further improvement in the value of ITAE was gained afterward. This justifies our selection of the maximum iteration as 100 for the present study.
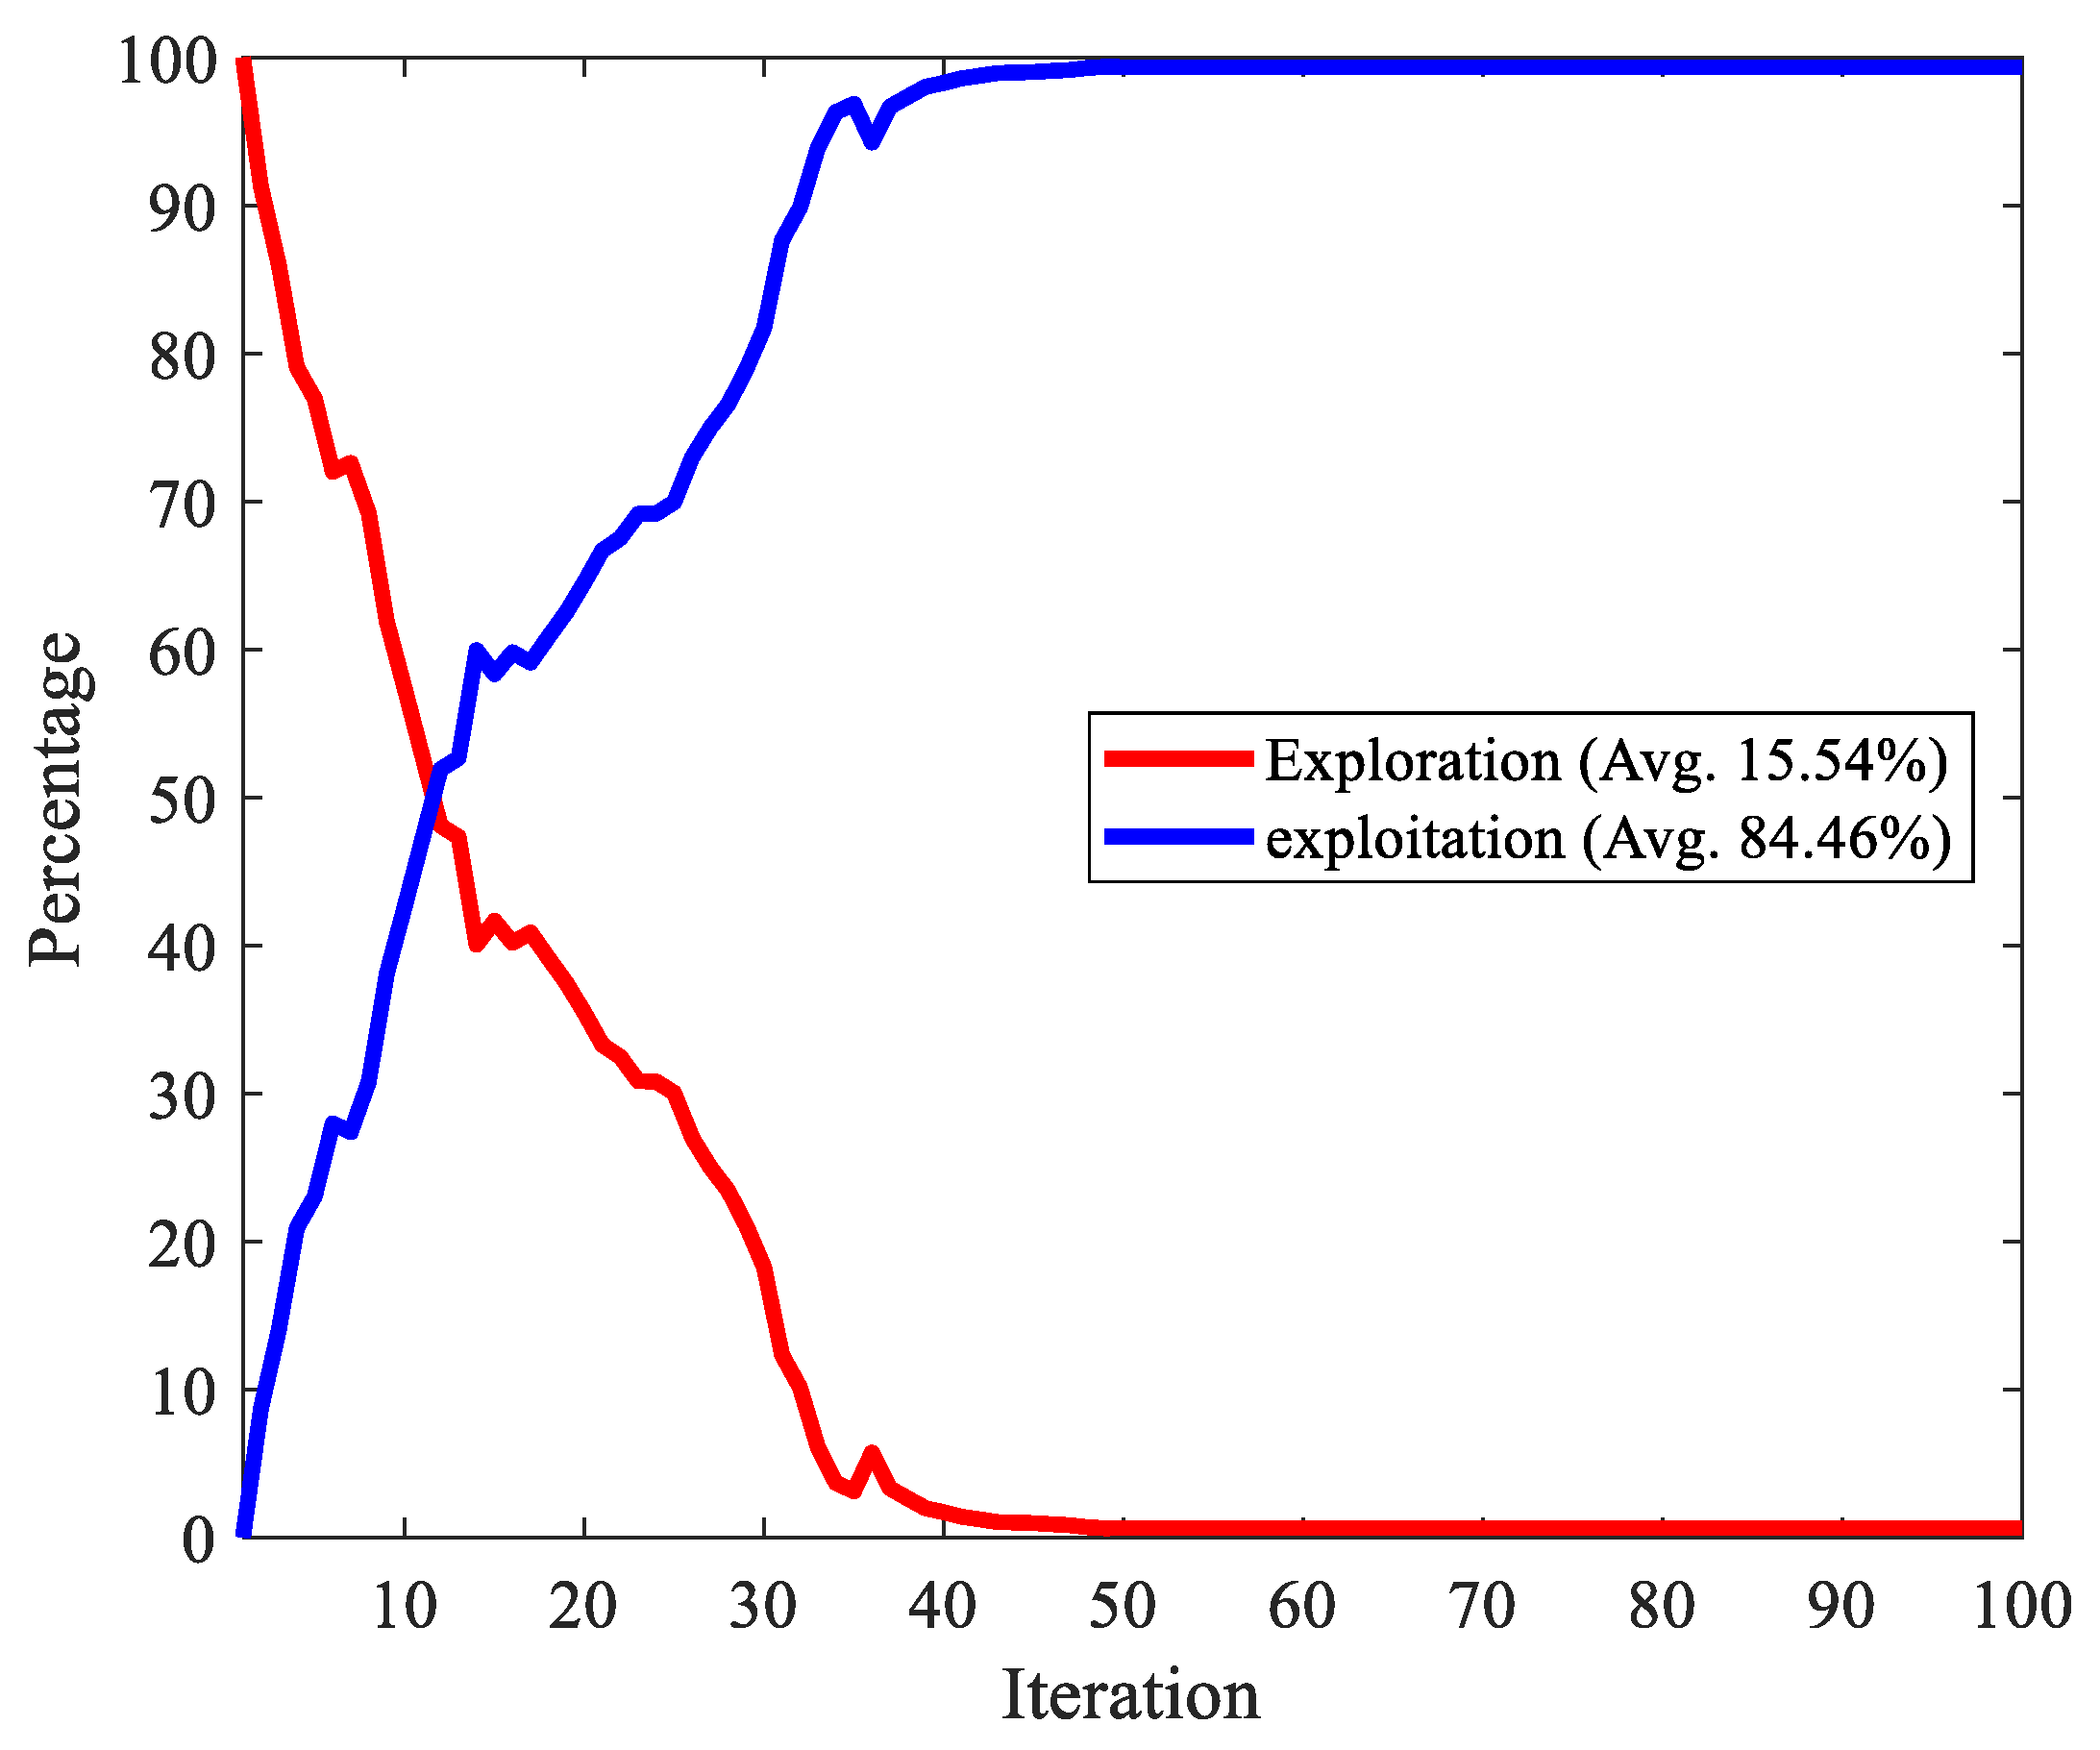
To provide better insight into the SO-based optimization procedure, the algorithm balance between exploration and exploitation properties is analyzed in Figure 6. The red line shows the global exploration capacity, while the blue curve stands for the local exploitation ability. It is apparent from Figure 6 that both exploration and exploitation existed in the algorithm, and a balanced transition between them can solve the global optimum solution effectively. After emphasizing a solid exploration in the early period of the optimization, SO started to promote exploitation as the algorithm iterates. On average, the portion of the local exploitation search of SO was larger than that of the global exploration search.
SO was run 50 times, and the best solution among the 50 runs was taken as the final solution. The time required by SO to complete one run was measured as 25 min on a Windows 10 computer with an AMD Ryzen 9 5900HX CPU and 32 GB of memory. It should be noted that an essential portion of this time consumption was allocated by objective function calculation that covers calling the Simulink model from the m-file script, simulating the whole power system to obtain the dynamic responses, and returning the calculated ITAE value back to the m-file script. The m-file script contains the source codes of the SO and it is linked to the Simulink model of the studied power system.
The statistical data showing the minimum, maximum, average, and standard deviation of the best solutions achieved over multiple independent runs with SO-PID is presented in Table 1 to testify to the robustness of the used algorithm.
As per the results in Table 1, it is clear that the difference between the minimum and maximum values of the ITAE objective function was very small, thus, the standard deviation was calculated as close to zero. This confirms that the SO performs stably and that its optimal performance for the considered problem is robust.
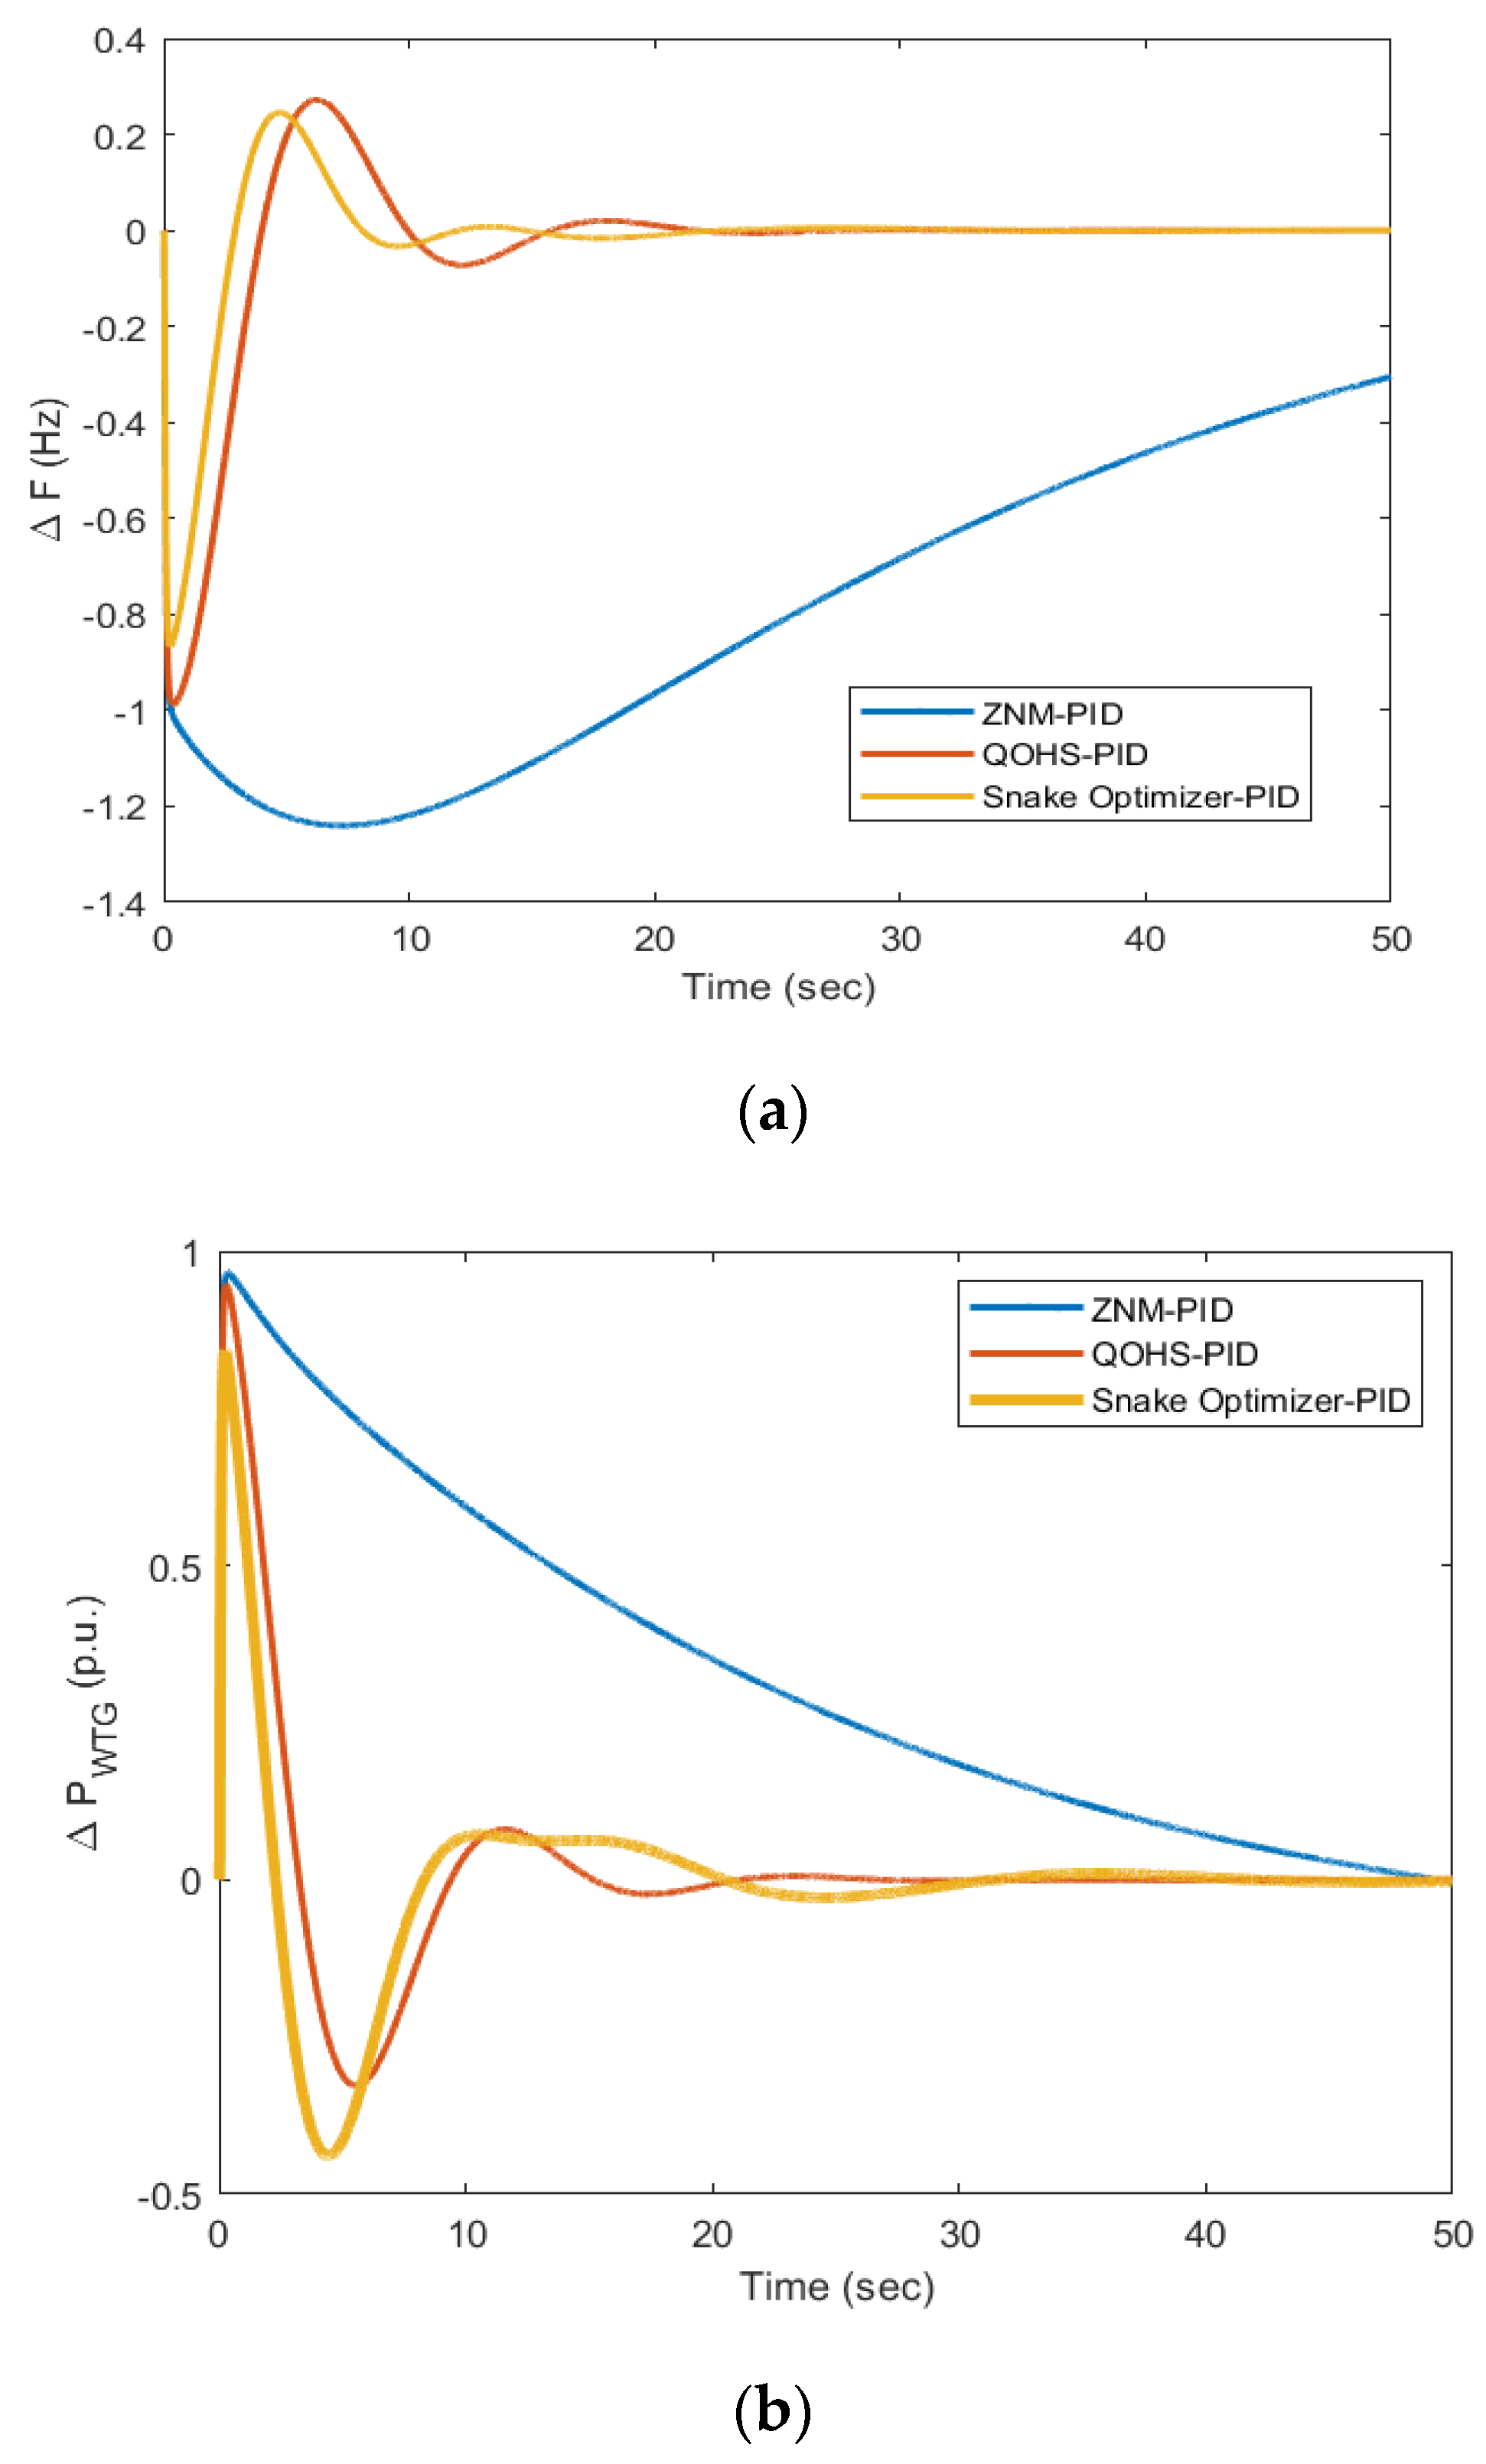
The PID controller gains procured through SO for the smallest value of ITAE are given in Table 2. The SO-optimized PID controllers are available for diesel and wind systems, and the output signal from SO-PID was applied to the diesel and the wind system simultaneously so that the frequency and power deviations can be suppressed within a few seconds only, and the operation of this isolated system can be stabilized for diverse working conditions. At first, the output and performance of the SO-PID were obtained by applying 1.0 p.u. step load alteration in a diesel–wind isolated system, and the simulation was run for 50 s. The SO-PID performance was compared with ZNM-PID [1] and with noticeable results obtained via Ganguly using QOHS-PID [26] for the same system. The calculated gains of PID via SO and through ZNM and QOHS are given in Table 2. Table 2 also shows the value of ITAE, IAE, and ITSE for all three techniques. It can be seen that the ITAE achieved through ZNM-PID was 4249, IAE was 89.91, and ITSE was 2590. The obtained values of ITAE, IAE, and ITSE were very high and cannot be appreciated for diesel–wind isolated systems. Furthermore, the ITAE obtained via QOHS-PID was 59.54, IAE was 7.257, and ITSE was 13.97; hence, there was a remarkable reduction in these values for the same model under the same disturbance. Furthermore, the SO-PID reduced the error value, i.e., ITAE to 37.1 from 59.54, IAE to 4.706 from 7.257, and ITSE to 5.762 from 13.97; hence, SO-PID outperformed all the other methods in terms of ITAE, IAE, and ITSE. It can also be seen that there was no need to calculate values of Kp and Kd as these gains are set to be zero in comparison to gains obtained via ZNM-PID and QOHS-PID, and still, the performance of the proposed technique was superior. From the results of Figure 7a,b, it can be seen that SO-PID offered reduced overshoot and better settling time. The system results returned to the reference value straight after the disturbance in 10 s compared to responses obtained via ZNM-PID and QOHS-PID.
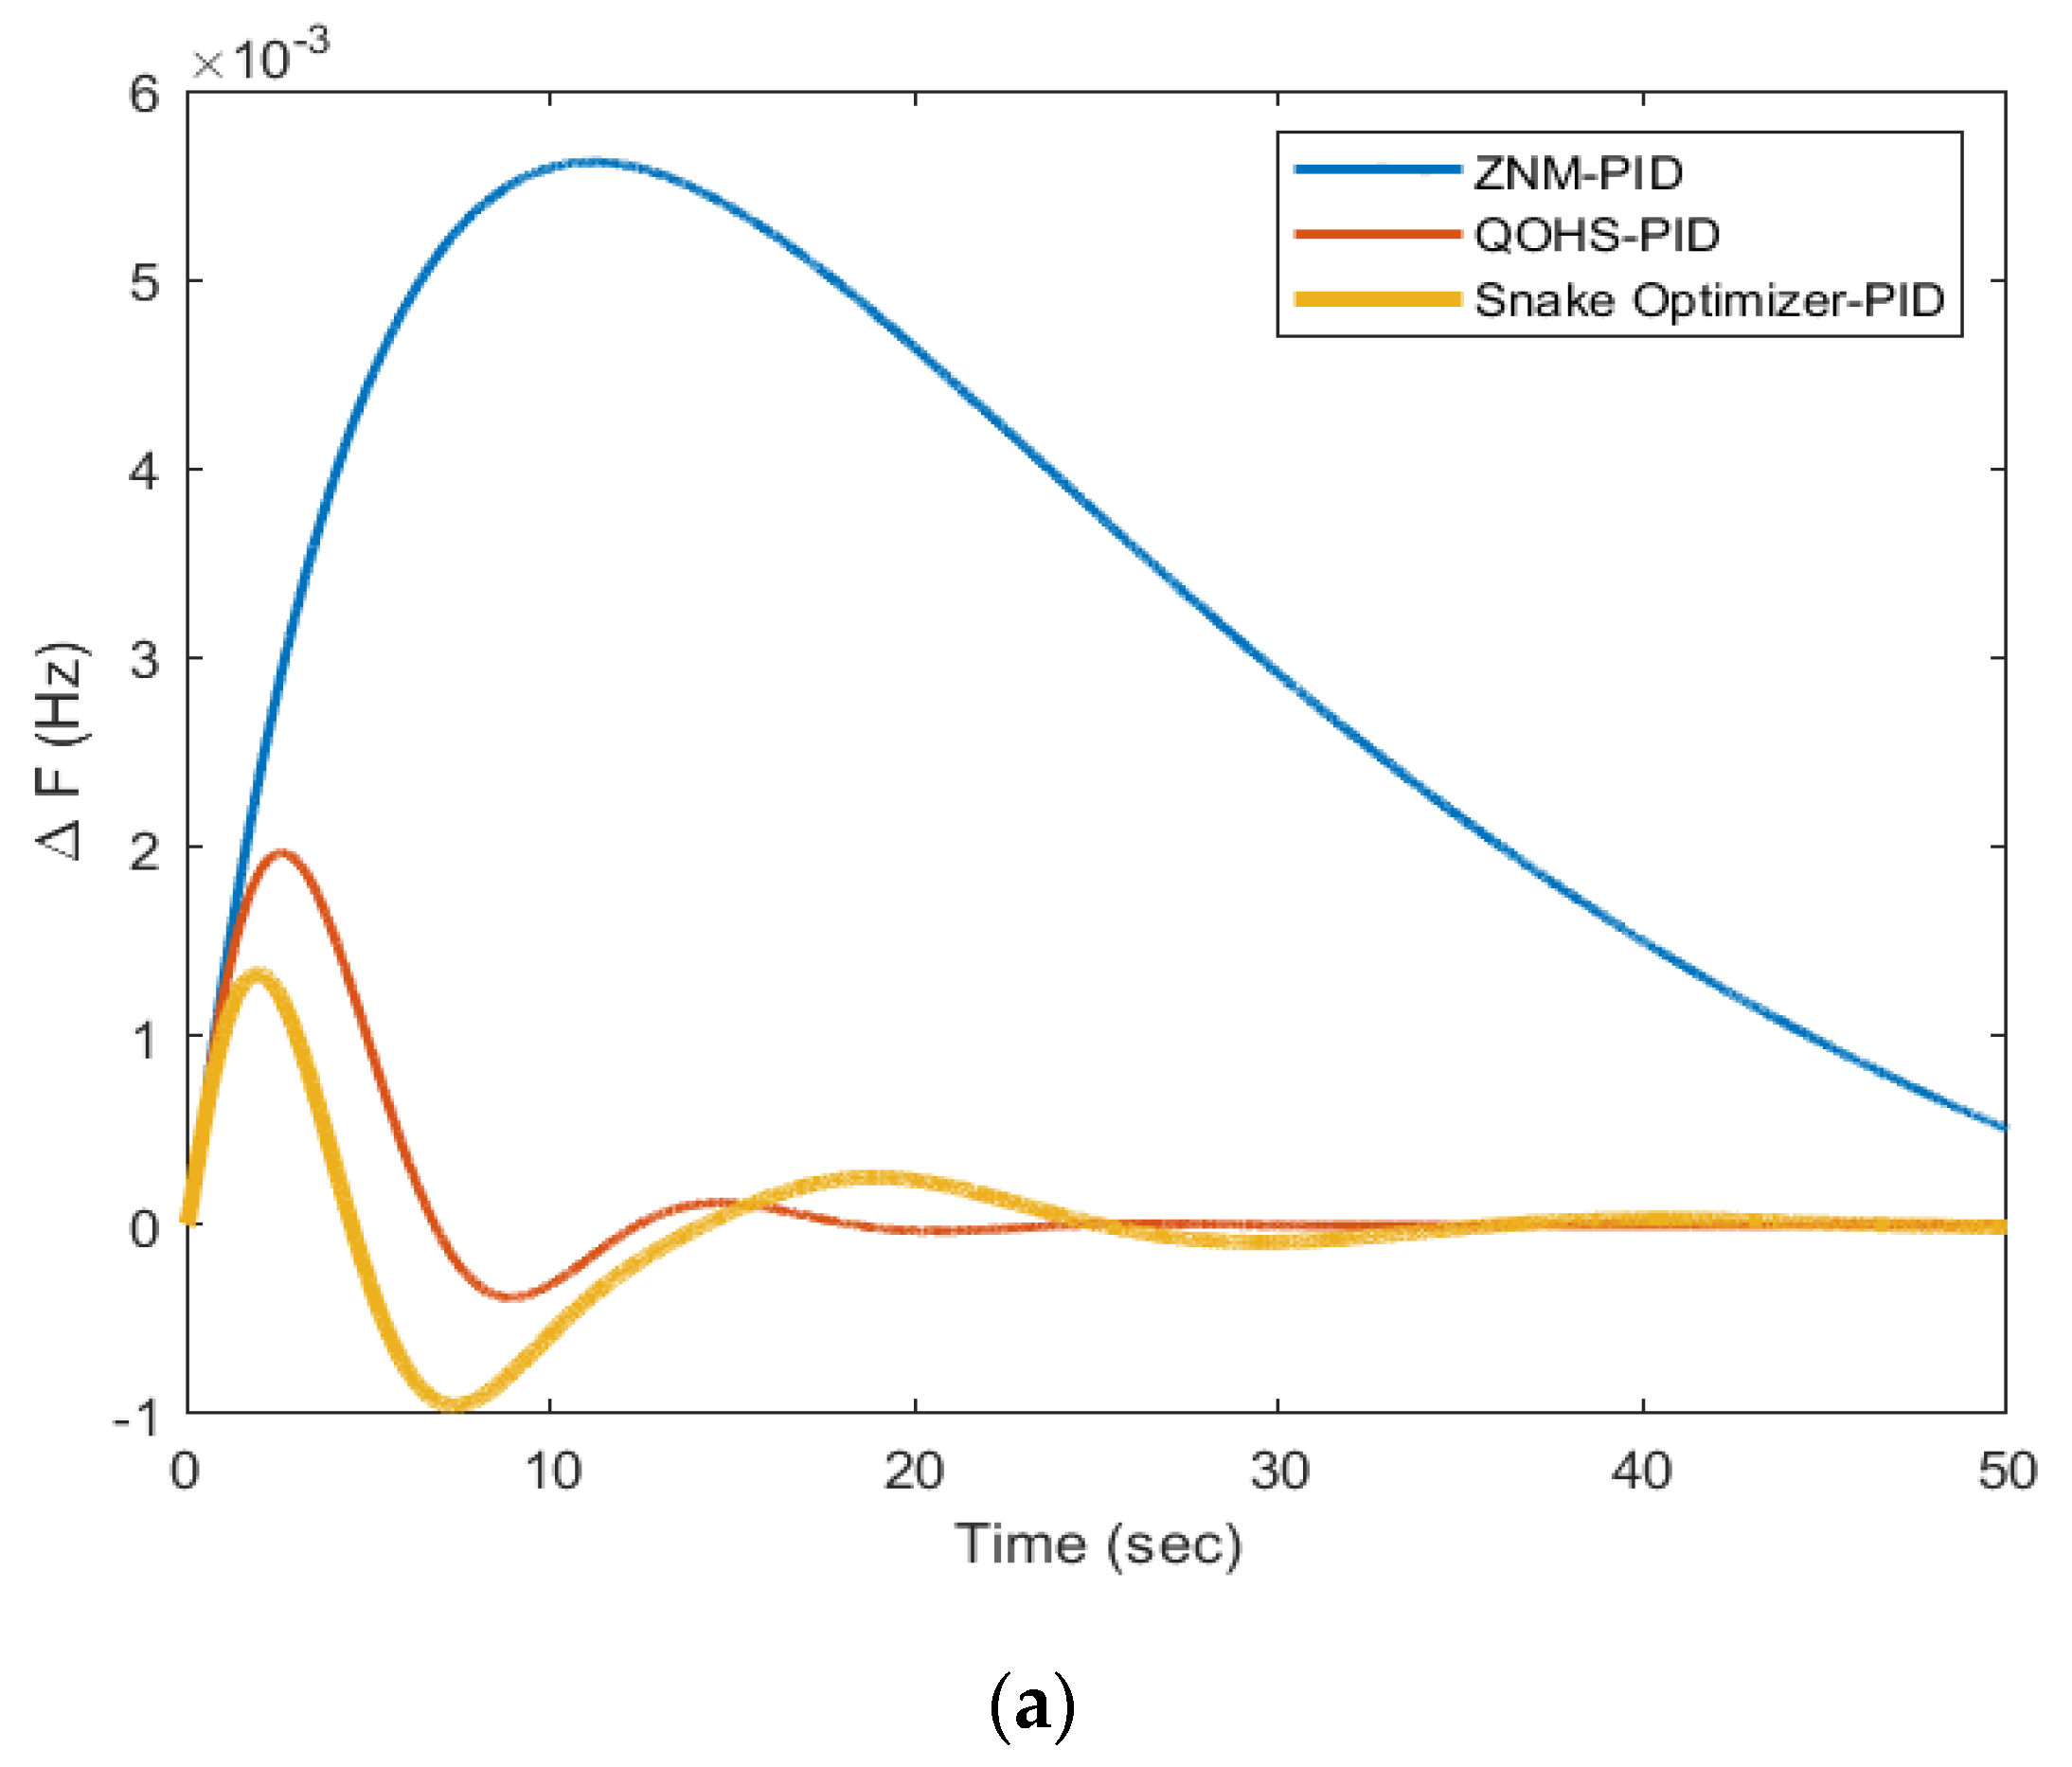
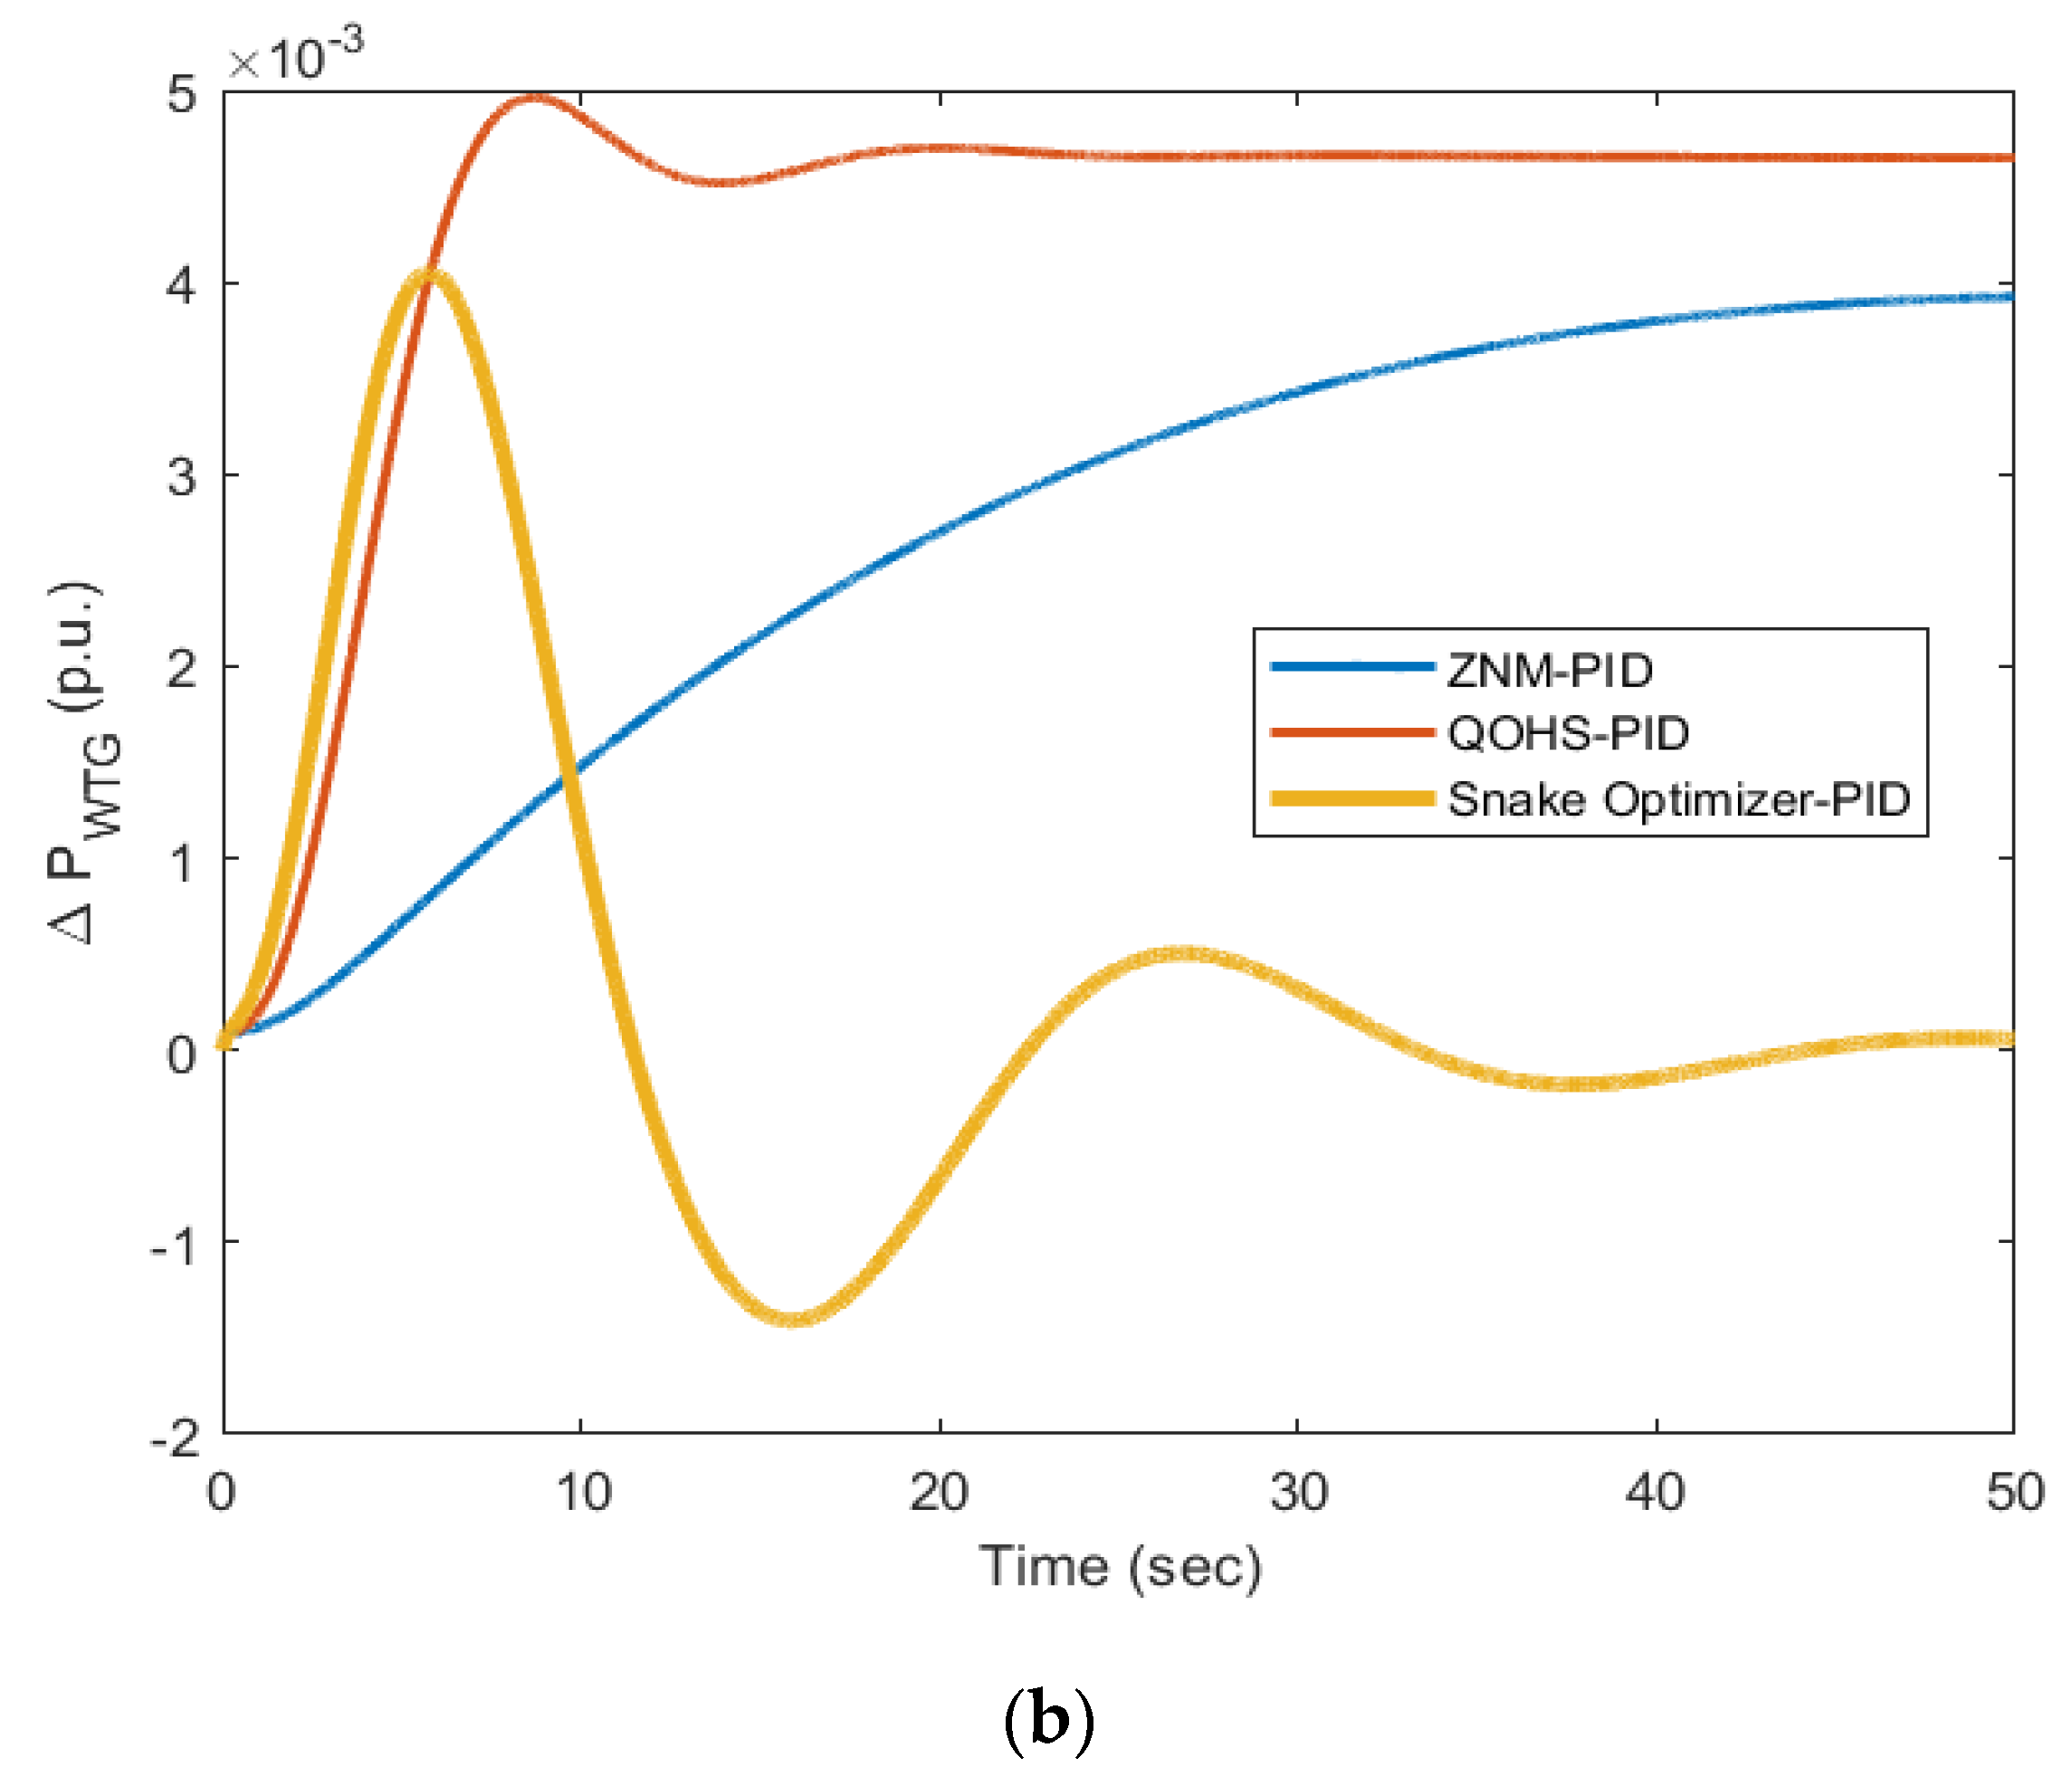
In the next step of the research and investigations, a 0.01 p.u. step change in the wind speed from the standard speed and the results of SO-PID were compared with those using ZNM-PID and QOHS-PID. The gains of the controllers were kept the same for the three techniques and the values of ITAE, IAE, and ITSE were obtained and are shown in Table 3. From results of Table 3, it was calculated that the ITAE obtained via ZNM-PID was 12.51 and was further reduced via QOHS-PID to 0.4405 and remarkably reduced to 0.1873 through SO-PID. The same trend was also seen for IAE and ITSE and the value of these errors were reduced to 0.01979 and 0.000156 in comparison to that obtained via QOHS-PID and ZNM-PID and hence SO performed better for this case as well. The graphical results are shown in Figure 8a,b for these techniques for a 0.01 p.u. step change in the wind speed. From the graphs in Figure 8a,b, it is critically seen that ΔPWTG (p.u.) responses showed higher oscillations and the system was not able to settle to a zero value within 50 s through ZNM-PID and QOHS-PID. There was a major steady-state error seen in the responses with a major overshoot. However, SO-PID was able to achieve minimum overshoot, fewer oscillations, and zero steady-state error in comparison to ZNM-PID and QOHS-PID. For ΔF, which is in Hz, the outcome of SO-PID was much better in comparison to ZNM-PID and QOHS-PID.
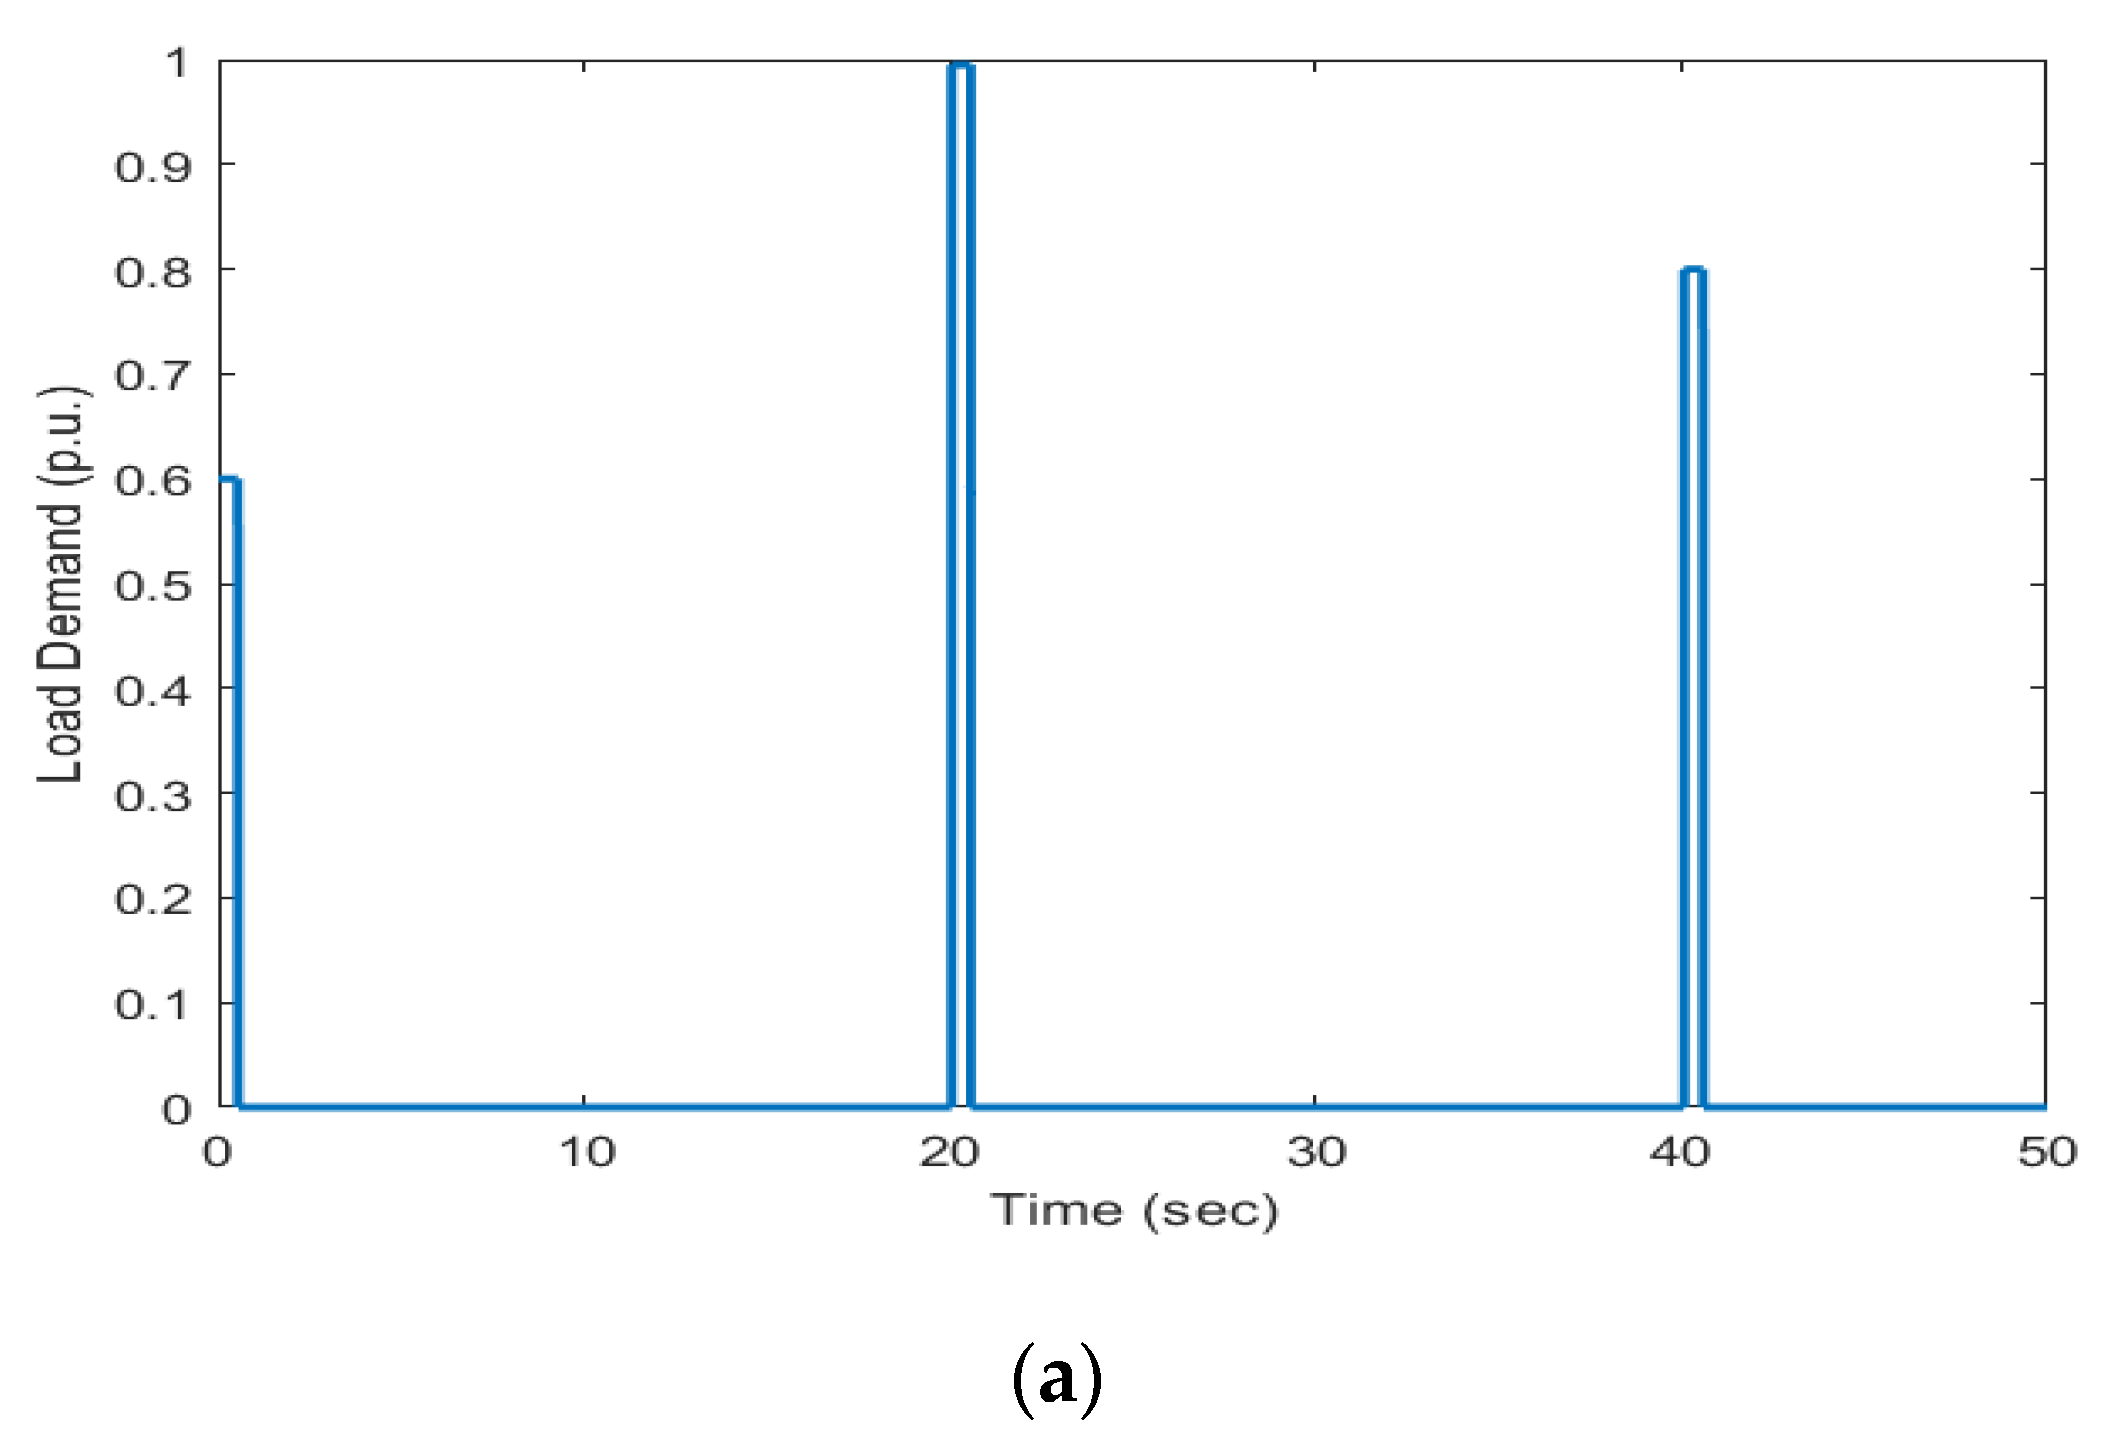
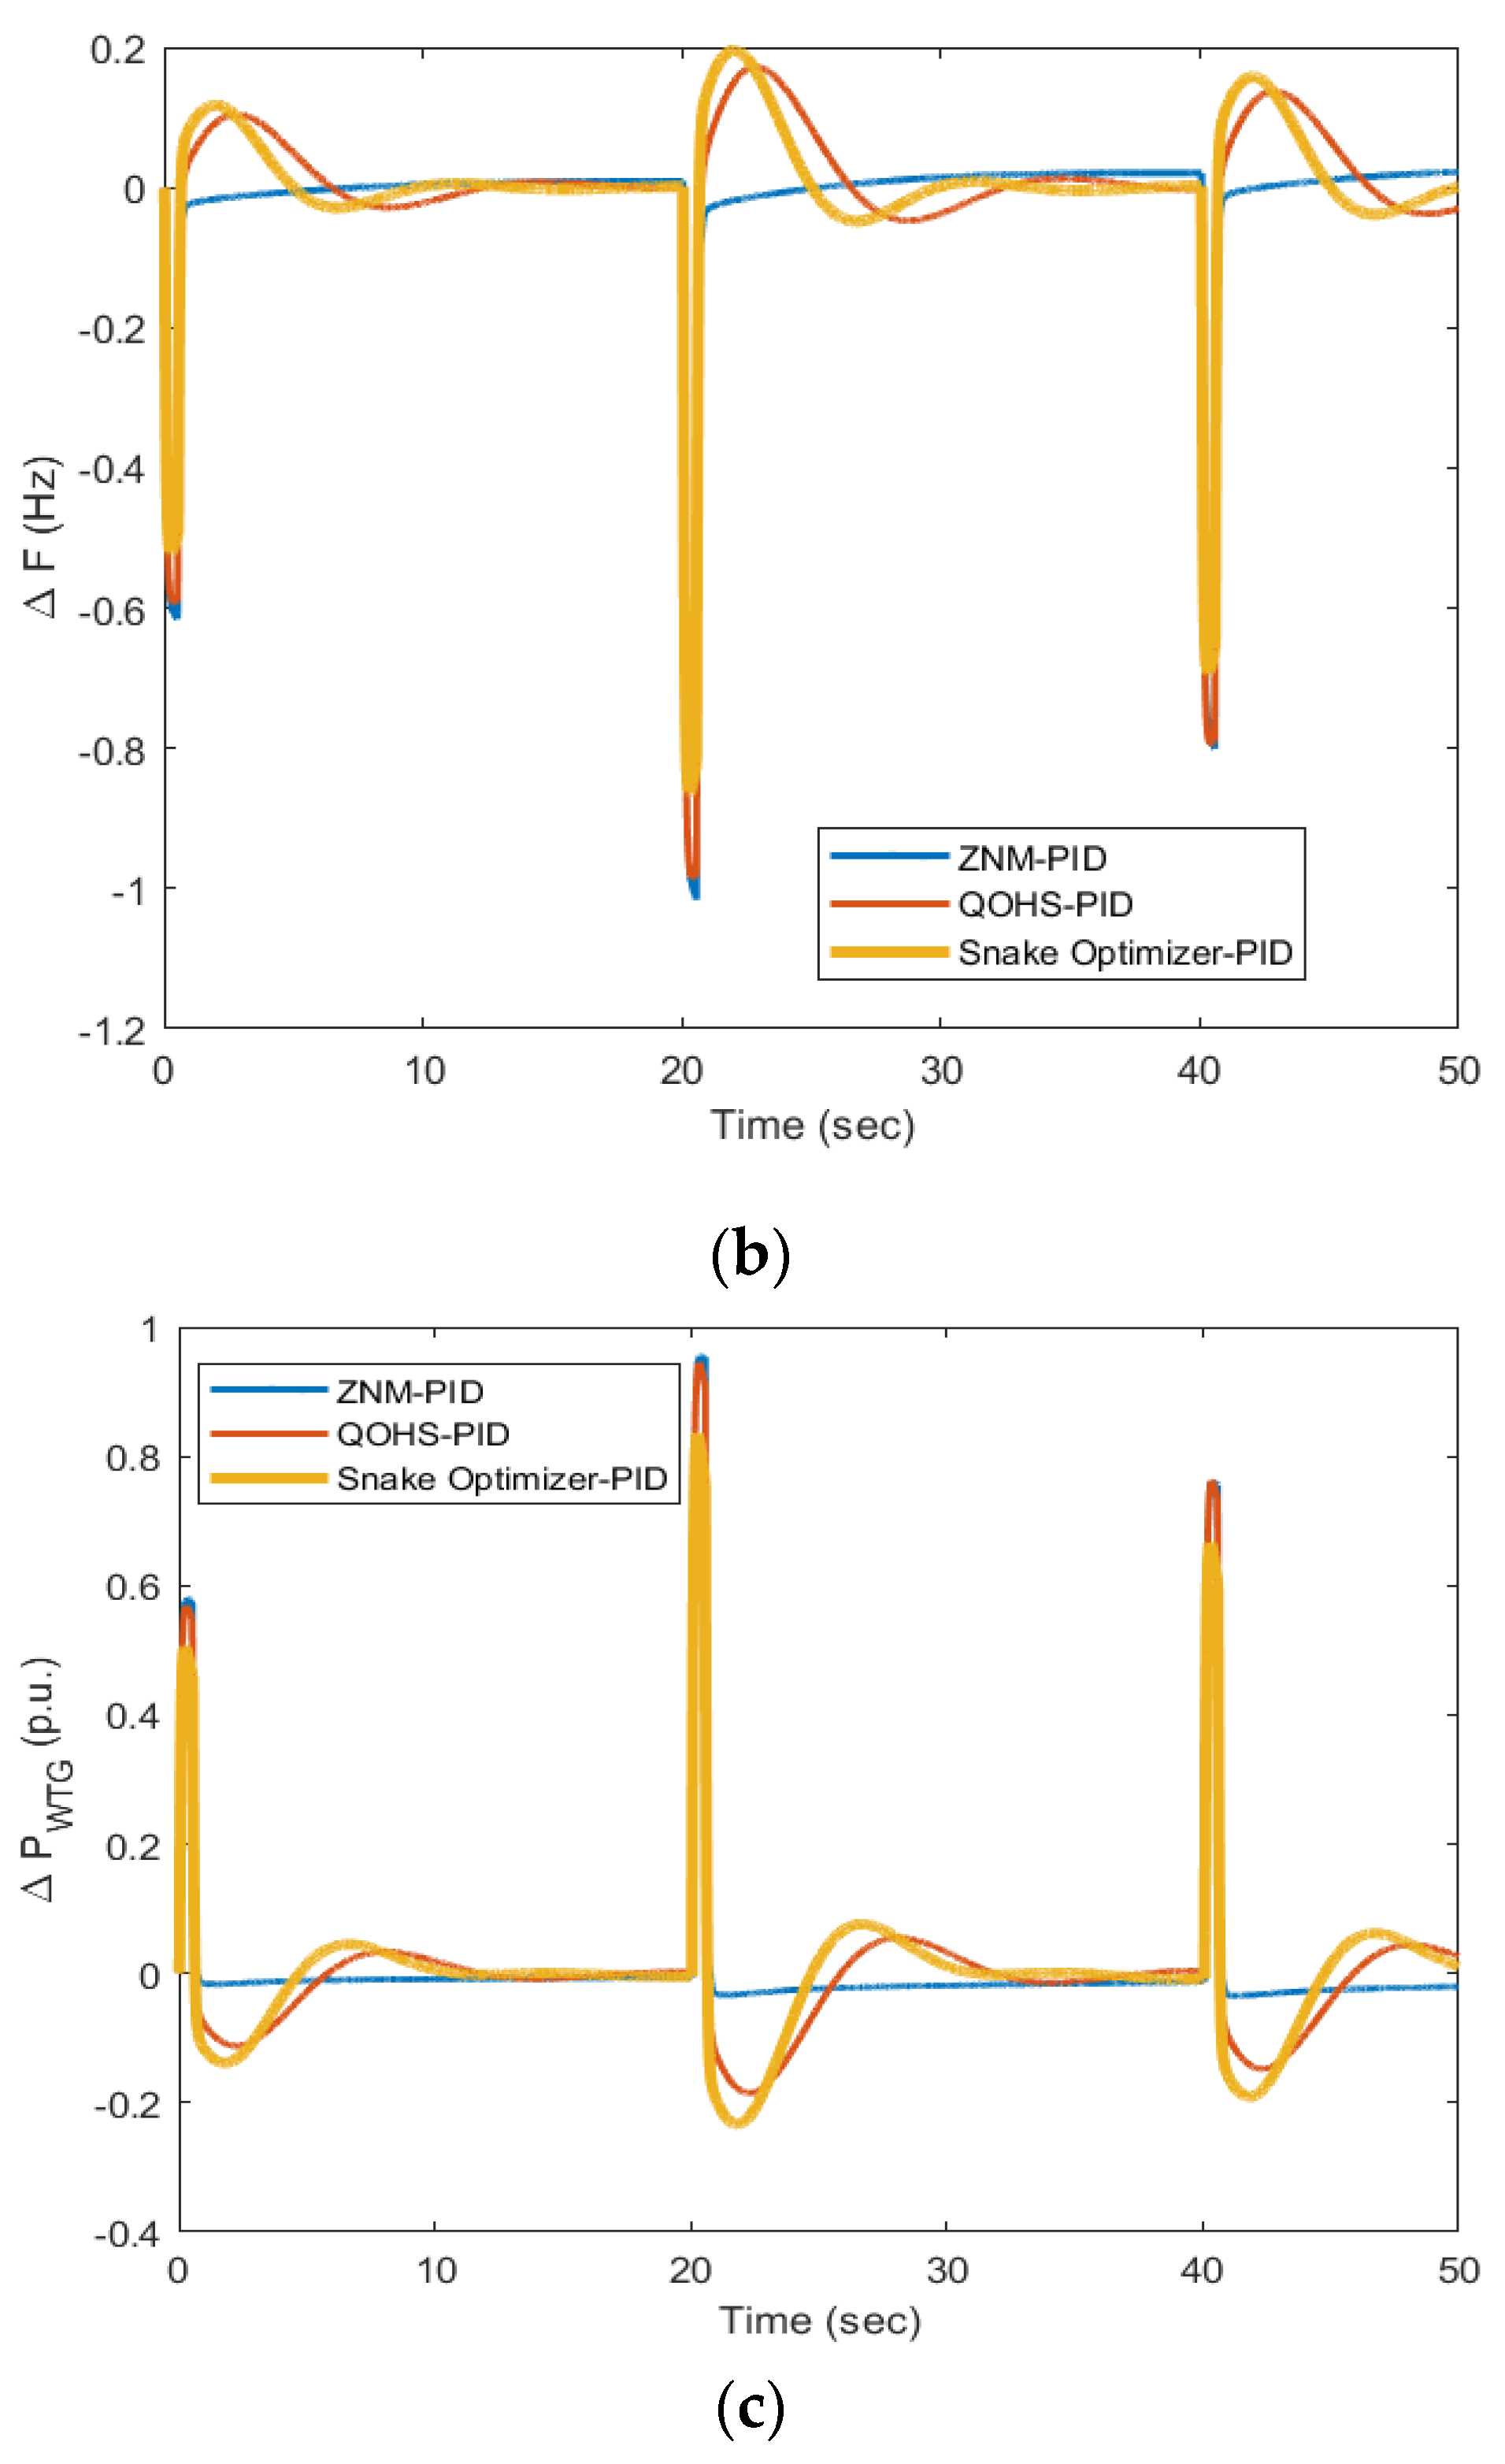
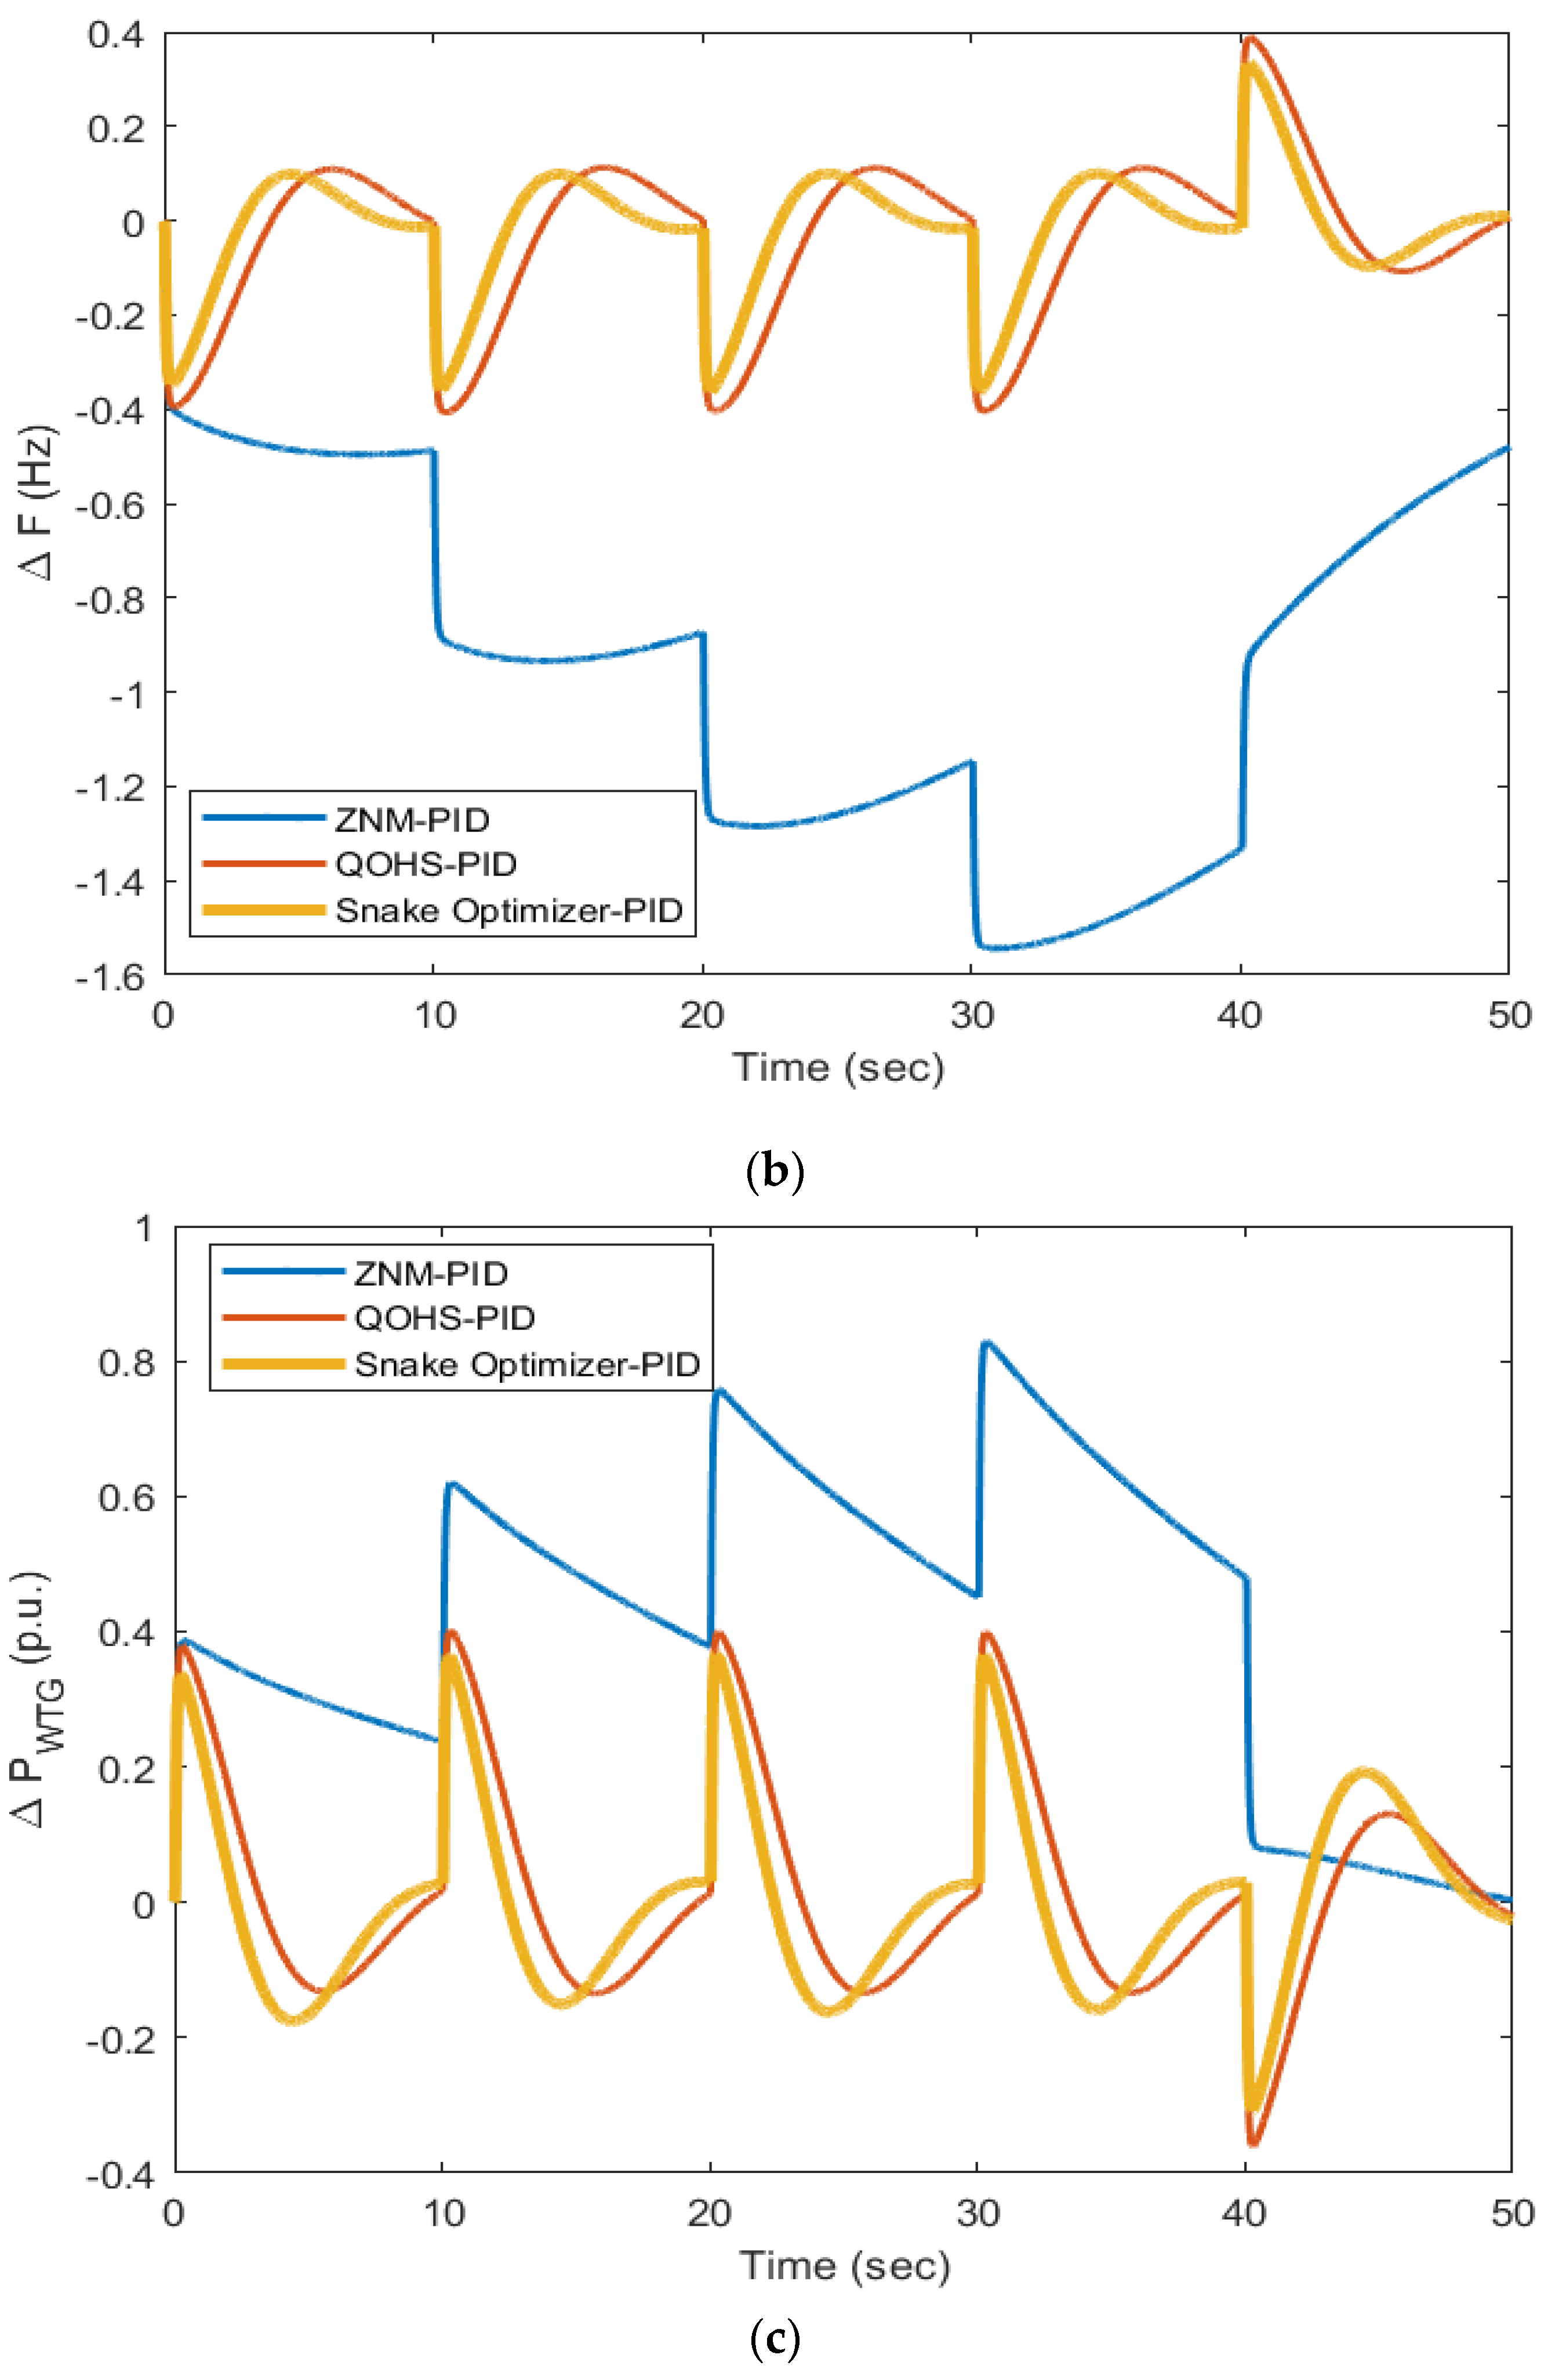
Further, the investigations were also performed for load changes at various instances over the period of simulation. Figure 9a shows the load changes at 0, 20, and 40 s of time in a diesel–wind isolated system with diverse magnitudes, and the results of the frequency and power deviations were obtained and compared for SO-PID, QOHS-PID, and ZNM-PID. The graphical outcomes for this load change are shown in Figure 9b,c, and it can be seen that SO-PID was able to efficiently suppress the frequency and power deviations compared to ZNM-PID and QOHS-PID. The investigations were further extended for random load change in the diesel–wind isolated system with diverse magnitudes. This random load change is shown in Figure 10a, and the diesel–wind responses are given in Figure 10b,c. It was observed that ZNM-PID was unsuccessful in tracking the continuous change in load demand for frequency and power deviations. Compared to ZNM-PID, QOHS-PID was better, and SO-PID was the best at minimizing frequency and power deviations with a smaller overshoot and with better settling time. Hence, the research was extended to see the impact of energy storage devices on a diesel–wind isolated system with SO-PID. From the literature, ESD has been shown to have the capability to improve the dynamic performance. UCs and RFBs recently came out as powerful ESDs, and therefore, the impact of UC and RFB with SO needs to be explored for the diesel–wind isolated system in order to obtain a better dynamic performance for various working conditions.
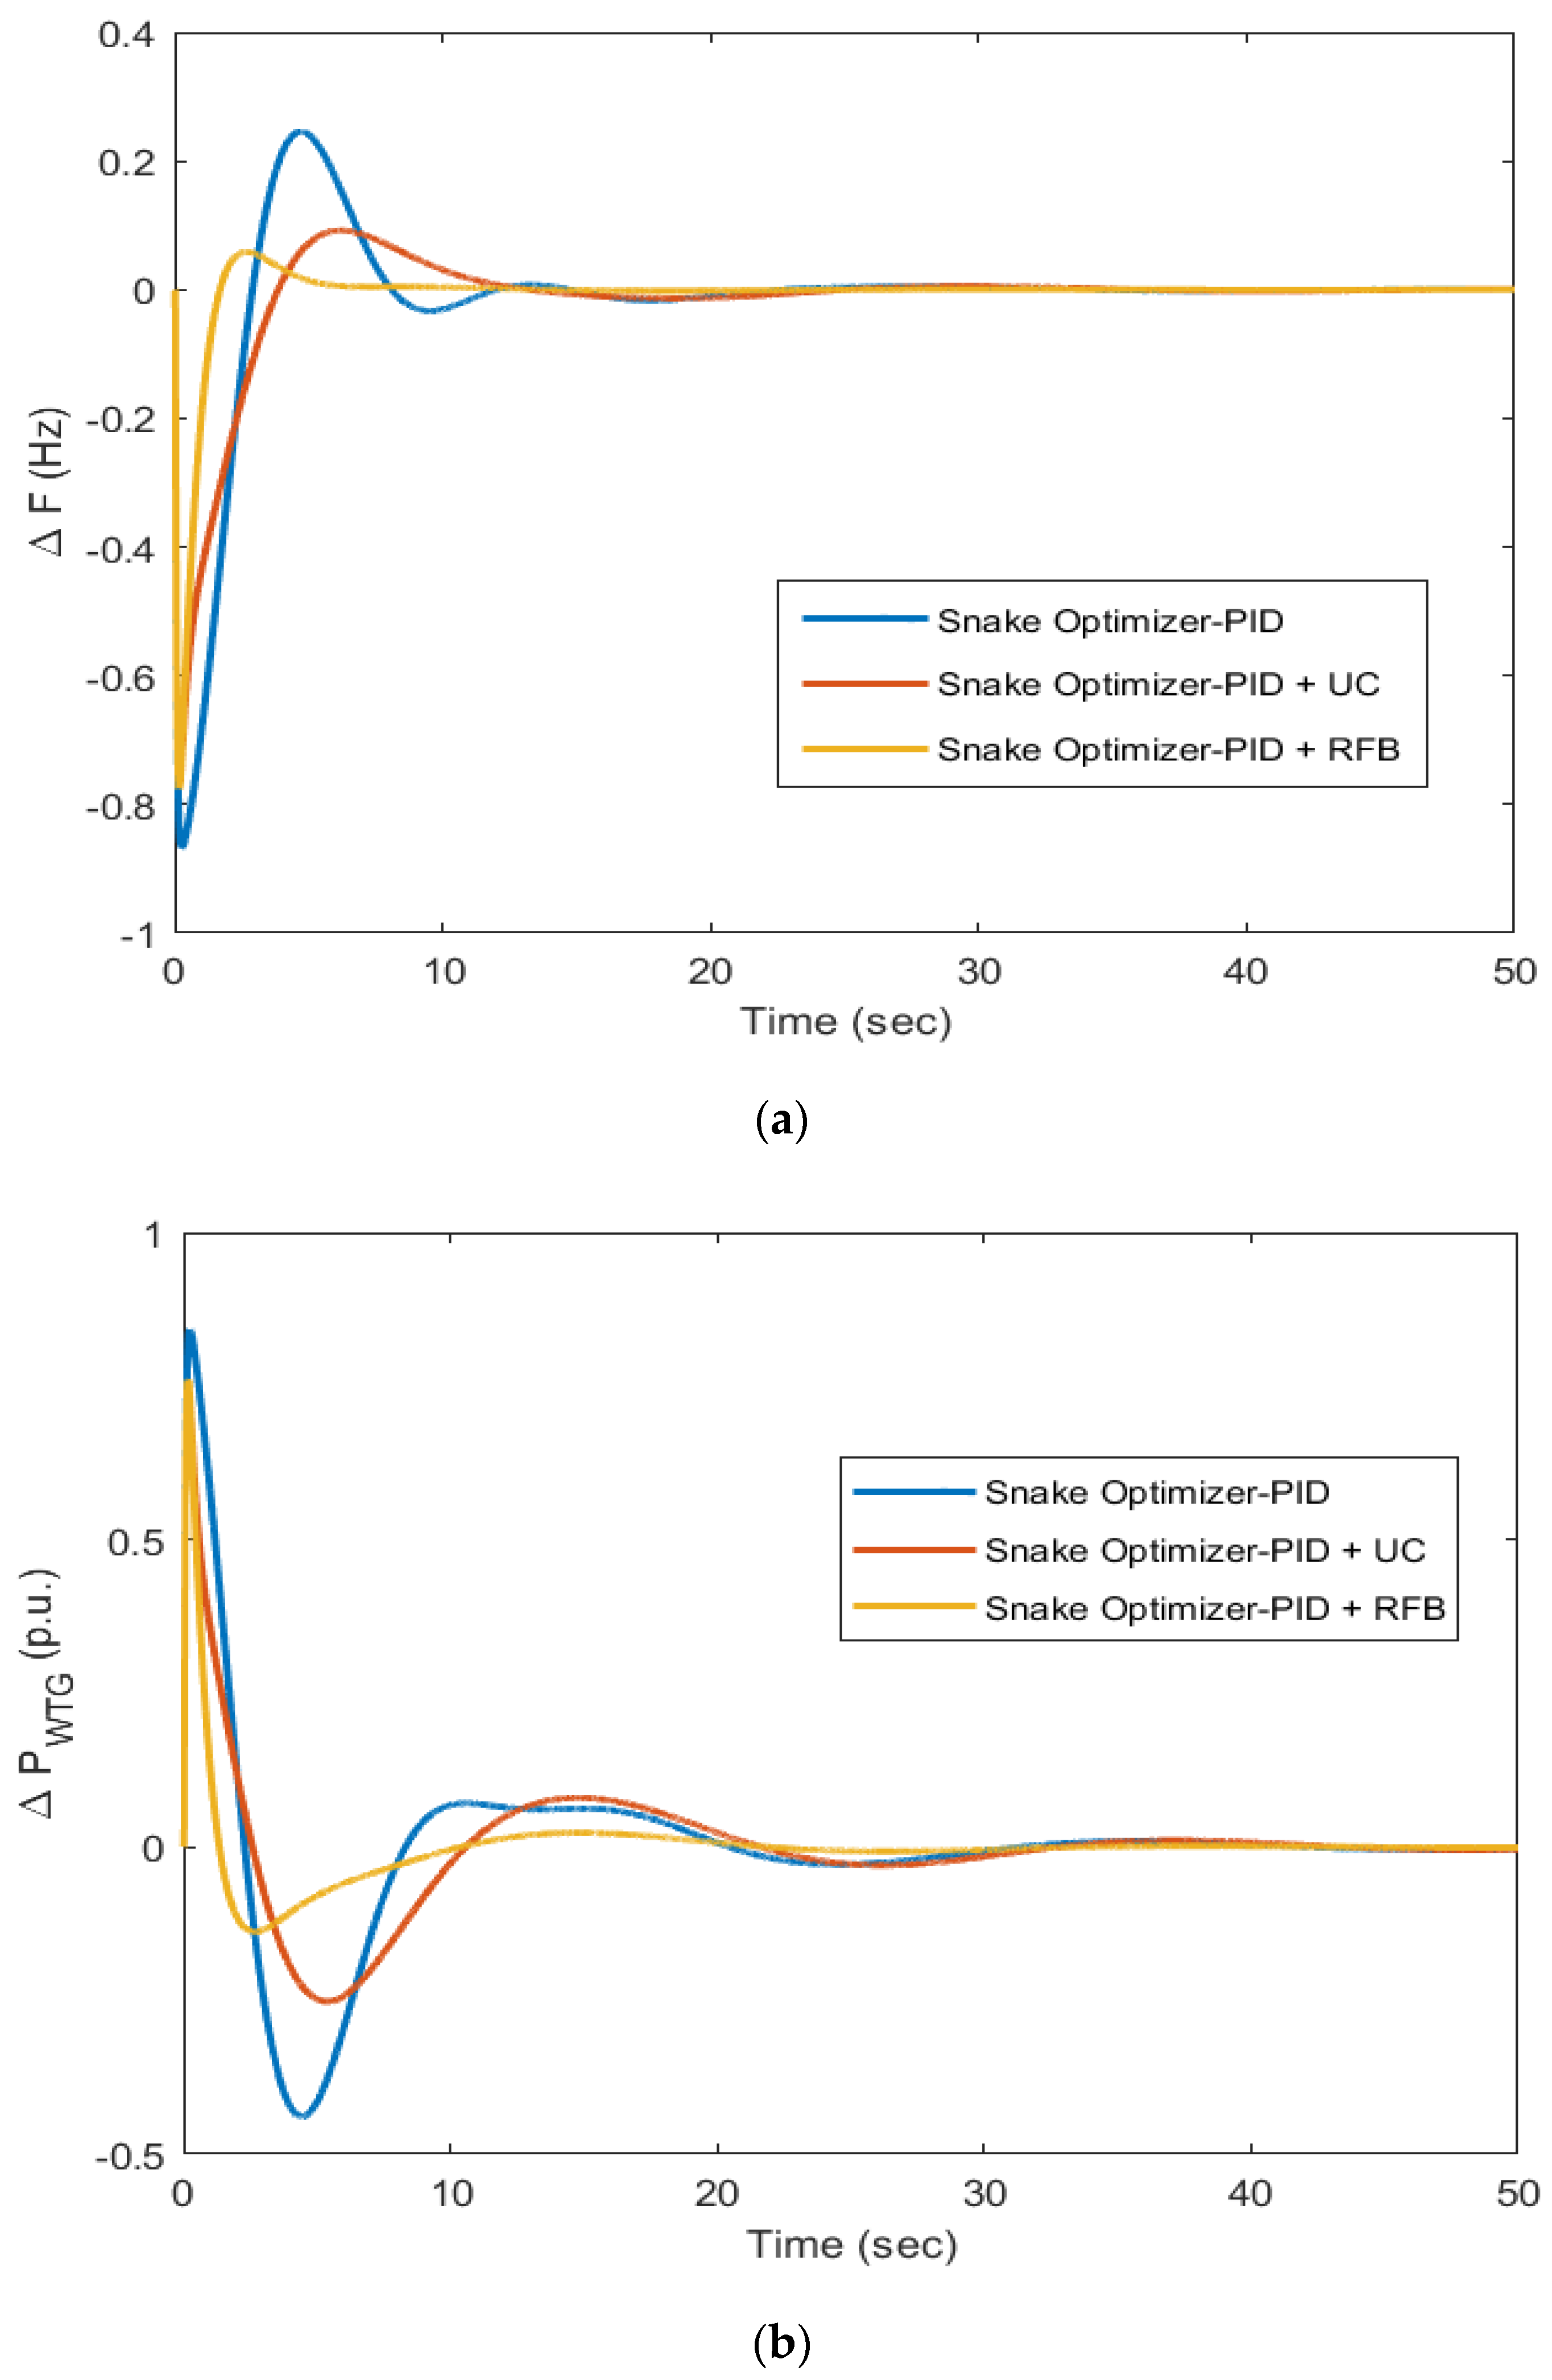
Due to load disturbance, the frequency and power output from wind will be highly disturbed, and the impact of these ESDs needs to be studied and investigated for various cases of load changes. The investigations started by applying a 1.0 p.u. step load alteration in a diesel–wind isolated system and compared with the results of SO-PID after integrating a UC or RFB into a diesel–wind isolated system. The values of ITAE, IAE, and ITSE are given in Table 4 and it was clearly visible that ITAE with SO-PID was 37.1 and was reduced to 32.46 with the integration of an ultracapacitor and further reduced to 5.336 after linking an RFB into the diesel–wind isolated system under similar disturbances. The trend was same for IAE and ITSE, and it can be seen that IAE became 1.411 and ITSE was reduced to 0.453 from 4.706 and 5.762; hence, it is evident that the UC and RFB with SO were able to improve the performance of the diesel–wind isolated system. Figure 11a,b shows the dynamic performance for this case and it was evident that the RFB outperformed the UC by managing to achieve a minimum first peak and enhanced settling of system responses. The trend of settling was very fast in comparison to the UC and with the results of SO-PID only.
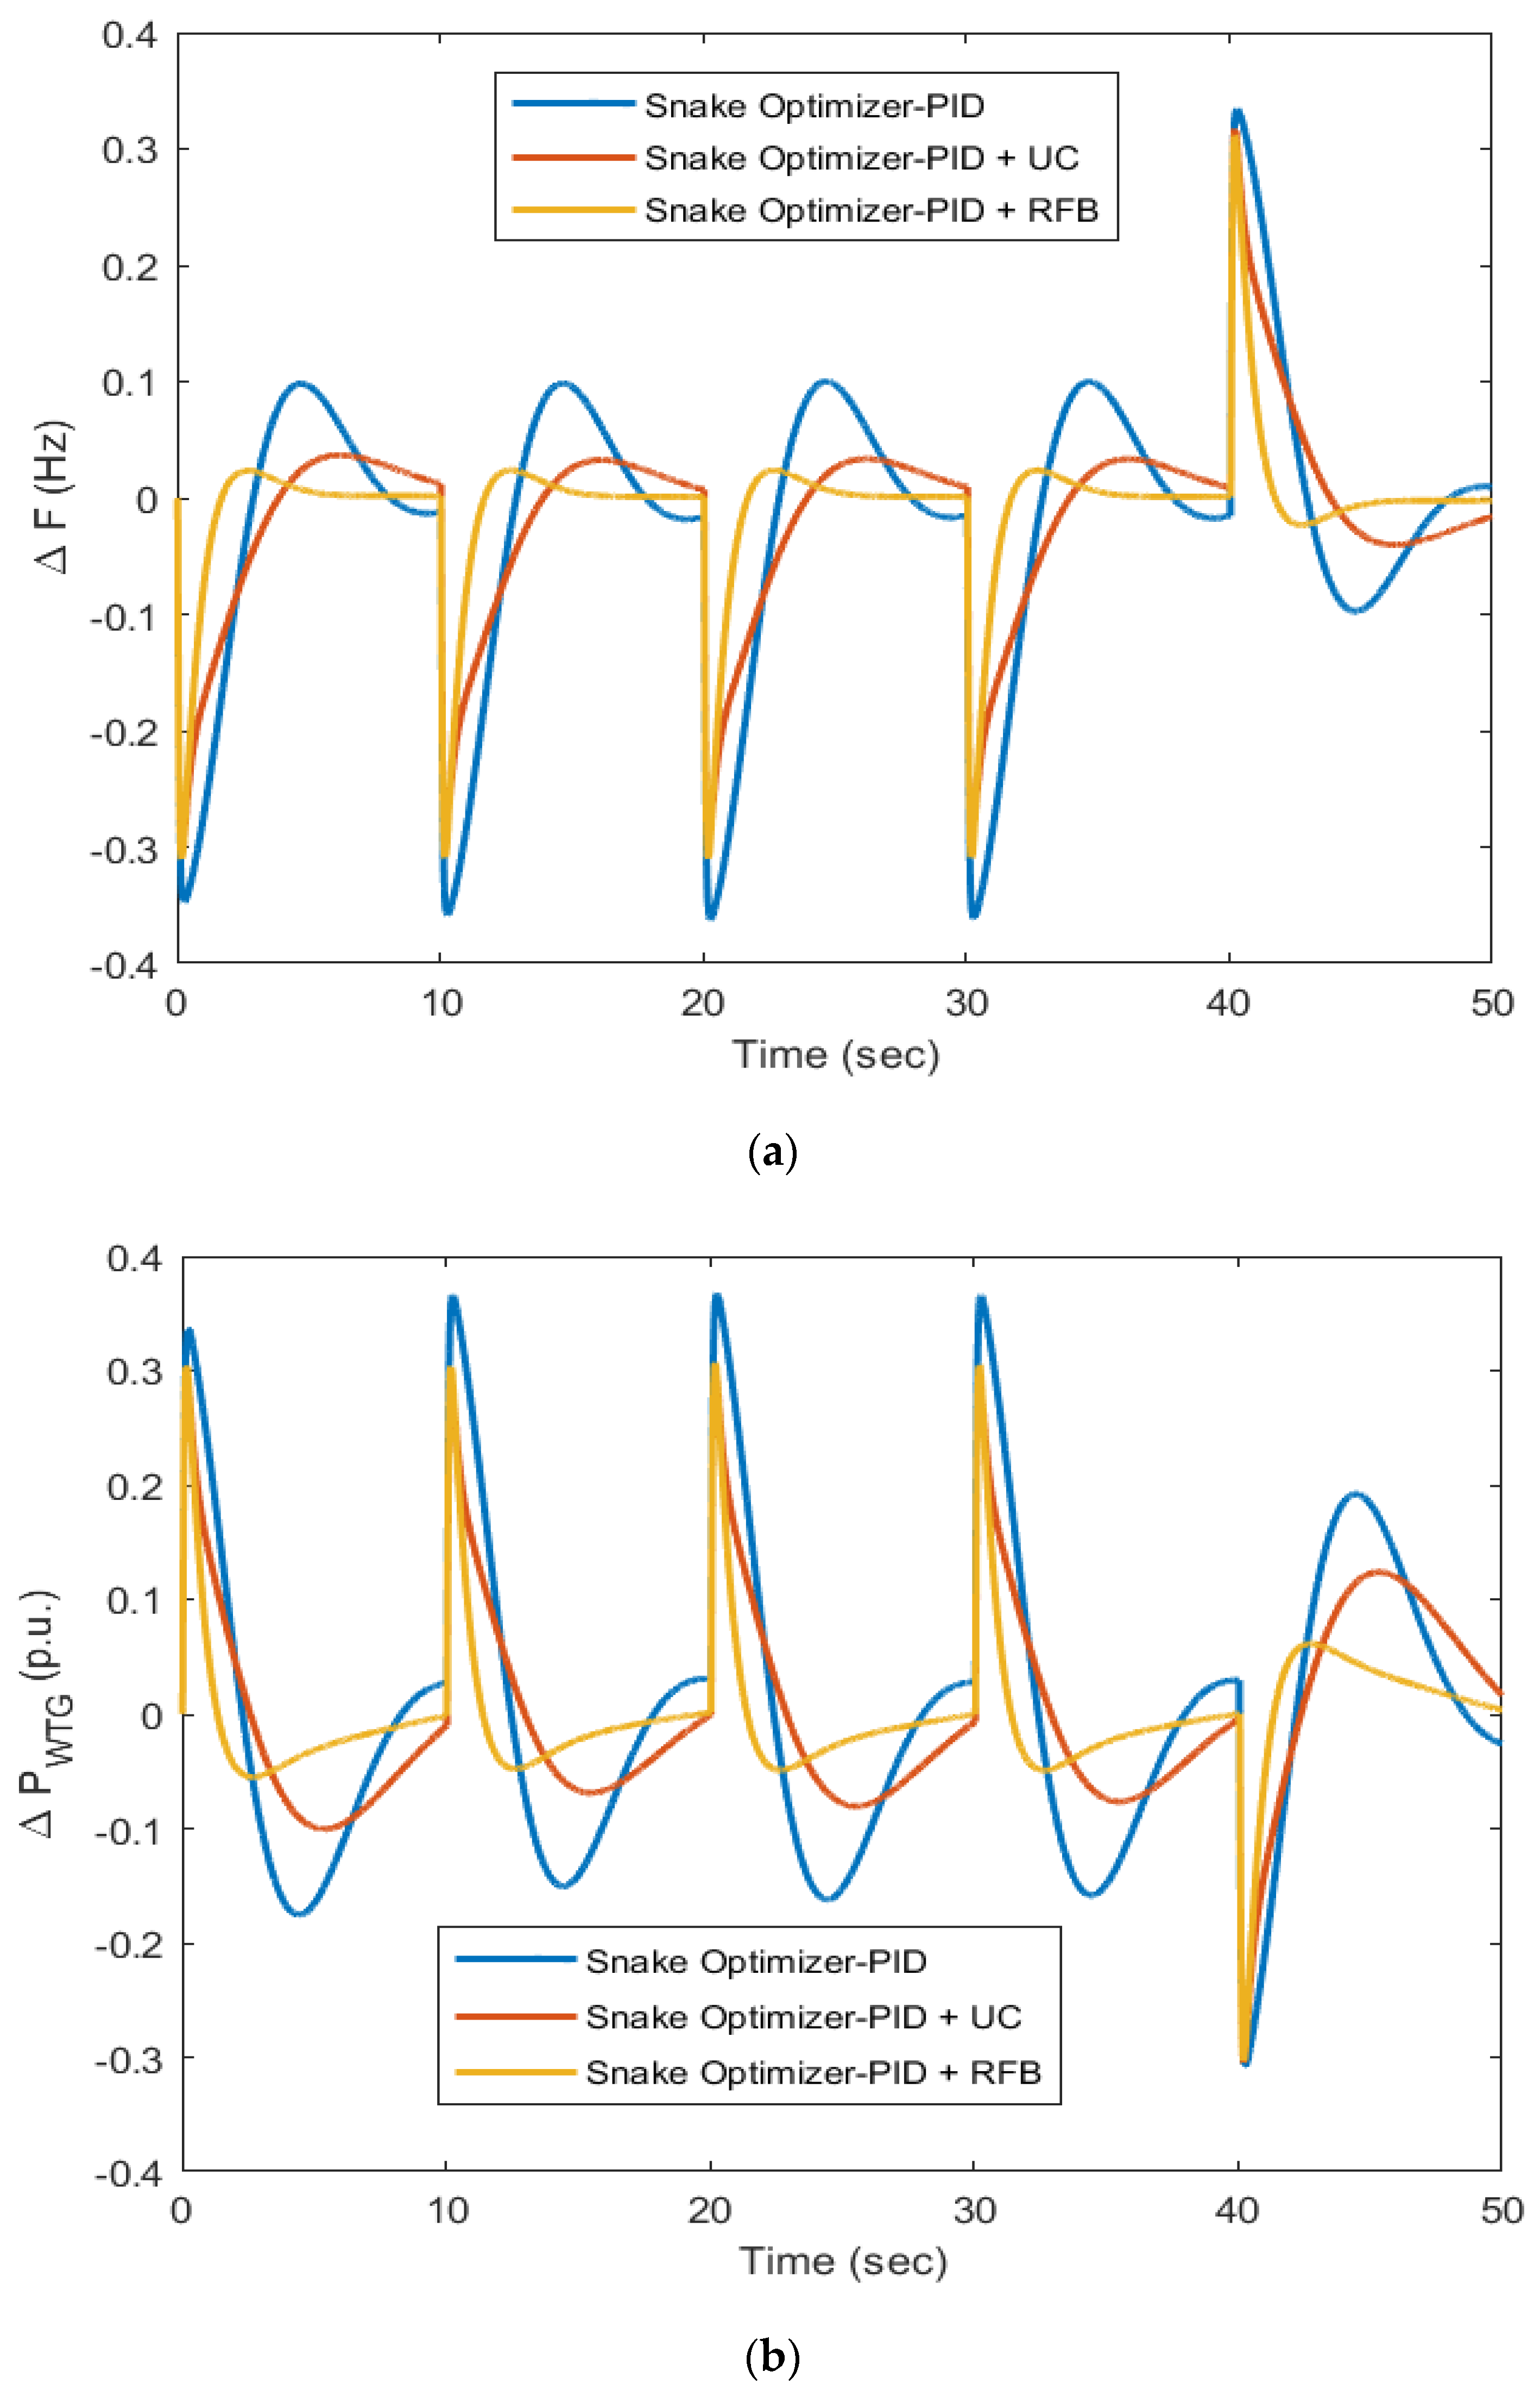
In the next step, the load was varied at 0, 20, and 40 s and the frequency and power deviation responses are shown in Figure 12a,b. These results showed the positive impact of the UC and RFB for diesel–wind isolated systems and that they were able to significantly improve the system responses. Here, SO-PID with RFB was also much better at reducing the frequency and power deviations in comparison to SO-PID with UC and with SO-PID only. The RFB and UC removed all oscillations from the system responses and improved the settling time for load changes at different times. Lastly, the impact of these ESDs were also checked for random load patterns applied to the diesel–wind isolated system and the results in Figure 13a,b clearly showed that if there is a continuous load change in the diesel–wind isolated system, the UC or RFB, with SO-PID can minimize unnecessary frequency and power excursions and maintained the system results at the reference value and can track the load demand more effectively. Still, the RFB and SO-PID combination was able to reduce the continuous oscillations and improve the dynamic output of the diesel–wind system for diverse cases.

6. Conclusions

The present work was focused on designing a novel control strategy to minimize frequency and power deviations for a diesel–wind isolated system generating diesel and wind power with enough capability to cater to the energy requirements of a small community or society. The SO-PID was proposed and investigated for various possible cases for a diesel–wind isolated system and the output of this strategy was compared with those of ZNM-PID and QOHS-PID. The following conclusions were drawn from the present research work:
  • The SO-PID gave the minimum frequency and wind power deviations for a step change in load, step change in wind speed, load changes at different instances, and for a random load pattern compared to ZNM-PID and QOHS-PID under similar working conditions.
  • The output of SO-PID was compared via calculating the gains of PID and through error values such as ITAE, IAE, and ITSE.
  • The ITAE achieved through ZNM-PID was 4249, IAE was 89.91, and ITSE was 2590. Further, the ITAE obtained via QOHS-PID was 59.54, IAE was 7.257, and ITSE was 13.97; hence, it can be clearly seen that a remarkable reduction in these values was obtained for the same model with the same disturbance.
  • The SO-PID reduced the error value, i.e., ITAE to 37.1 from 59.54, IAE to 4.706 from 7.257, and ITSE to 5.762 from 13.97 and hence, SO-PID outperformed all the other methods in terms of ITAE, IAE, and ITSE. The graphical results supported the numerical results for the various considered cases.
  • The research was extended to see the impact of a UC or RFB with SO-PID for a diesel–wind isolated system. The ITAE obtained with SO-PID was 37.1 and was reduced to 32.46 with the integration of a UC and further reduced to 5.336 after linking an RFB into the diesel–wind isolated system under similar disturbances.
  • The trend was the same for IAE and ITSE and IAE became 1.411 and ITSE was reduced to 0.453 from 4.706 and 5.762; hence, it was evident that a UC and RFB with SO were able to improve the dynamic performance of the diesel–wind isolated system.
  • The RFB and SO-PID combination effectively suppressed frequency and power deviations of the diesel–wind isolated system for a step change in load, load changes at different instances, and random load patterns when compared to SO-PID with UC and with SO-PID only.

Author Contributions

All authors planned the study and contributed to the idea; introduction, V.R.; software, P.N.B., G.S. and E.Ç.; analysis, V.R., G.S., P.N.B. and E.Ç.; conclusion, V.R. and G.S.; writing—original draft preparation, V.R.; writing—review and editing, V.R.; supervision, G.S. and P.N.B. All authors have read and agreed to the published version of the manuscript.

Funding

This research received no external funding.

Data Availability Statement

Not applicable.

Conflicts of Interest

The authors declare no conflict of interest.

Abbreviations

FFFossil Fuel
UCUltra Capacitor
RESRenewable Energy Storage
ESDEnergy Storage Device
RFBRedox Flow Battery
HAEHydrogen Generative Aqua Electrolyzer
FCFuel Cell
FLFuzzy Logic
SOSnake Optimization
DEGDiesel Engine Generator
WTGWind Turbine Generator
ZNMZiegler–Nichols Method
DPMD Partition Method
ITAEIntegral Time Absolute Error
IAEIntegral Absolute Error
ISEIntegral Squared Error
KpProportional Gain
KiIntegral Gain
KdDerivative Gain
PIDProportional Integral Derivative
QOHSQuasi-Opposition Harmony Search

Appendix A

Table A1. Nominal system parameters of the diesel–wind model [3,26].
ModelParameters
Diesel Unit KD = 0.3333RD = 3.0 Hz/puTD1 = 1.00 sTD2 = 2.00 sTD3 = 0.025 sKP = 120TP = 14.4 s
Wind UnitKP1 = 1.25KP2 = 1.00KP3 = 1.40KTP = 0.0033KIG = 0.9969TW = 13.25 sKPC = 0.080
TP1 = 0.60 sTP2 = 0.041 sTP3 = 1.0 s
RFBKO = 0.45 p.u. MW/HzTd = 0 sKrb = 1Trb = 6.7 sΔPrbmax = +0.004 p.u. MWΔPrbmin = −0.004 p.u. MW

References

  1. Mallesham, G.; Mishra, S.; Jha, A.N. Ziegler-Nichols based controller parameters tuning for load frequency control in a microgrid. In Proceedings of the 2011 International Conference on Energy, Automation and Signal (ICEAS), Bhubaneswar, India, 28–30 December 2011; pp. 1–8. [Google Scholar]
  2. Veronica, J.; Kumar, N.S.; Longatt, F.G. Design of Load Frequency Control for a Microgrid Using D-partition Method. Int. J. Emerg. Electr. Power Syst. 2020, 21, 1–11. [Google Scholar] [CrossRef]
  3. Dekaraja, B.; Chandra Saikia, L. Impact of RFB and PLL Dynamic on Combined ALFC-AVR Regulation of Multiarea Multisource System Under Deregulated Environment with AC/Accurate HVDC link. IETE J. Res. 2022, 1–25. [Google Scholar] [CrossRef]
  4. Bevrani, H.; Ghosh, A.; Ledwich, G. Renewable energy sources and frequency regulation: Survey and new perspectives. IET Renew. Power Gener. 2010, 4, 438. [Google Scholar] [CrossRef] [Green Version]
  5. Eduardo, M.G.; Manuel, A.M. Evaluating operational risk in a power system with a large amount of wind power. Electr. Power Syst. Res. 2009, 79, 734–739. [Google Scholar]
  6. Senjyu, T.; Nakaji, T.; Uezato, K.; Funabashi, T. A hybrid power system using alternative energy facilities in isolated island. IEEE Trans. Energy Conver. 2005, 20, 406–414. [Google Scholar] [CrossRef]
  7. Rekioua, D.; Bensmail, S.; Bettar, N. Development of hybrid photovoltaic-fuel cell system for stand-alone application. Int. J. Hydrogen Energy 2014, 39, 1604–1611. [Google Scholar] [CrossRef]
  8. Mokrani, Z.; Rekioua, D.; Rekioua, T. Modeling, control and power management of hybrid photovoltaic fuel cells with battery bank supplying electric vehicle. Int. J. Hydrogen Energy 2014, 39, 15178–15187. [Google Scholar] [CrossRef]
  9. Mezzai, N.; Rekioua, D.; Rekioua, T.; Mohammedi, A.; Idjdarane, K.; Bacha, S. Modeling of hybrid photovoltaic/wind/fuel cells power system. Int. J. Hydrogen Energy 2014, 39, 15158–15168. [Google Scholar] [CrossRef]
  10. Aissou, S.; Rekioua, D.; Mezzai, N.; Rekioua, T.; Bacha, S. Modeling and control of hybrid photovoltaic wind power system with battery storage. Energy Convers. Manag. 2015, 89, 615–625. [Google Scholar] [CrossRef]
  11. Tamalouzt, S.; Benyahia, N.; Rekioua, T.; Rekioua, D.; Abdessemed, R. Performances analysis of WT-DFIG with PV and fuel cell hybrid power sources system associated with hydrogen storage hybrid energy system. Int. J. Hydrogen Energy 2016, 41, 21006–21021. [Google Scholar] [CrossRef]
  12. Wang, L.; Lee, D.; Lee, W.; Chen, Z. Analysis of a novel autonomous marine hybrid power generation/energy storage system with a high-voltage direct current link. J. Power Sources 2008, 185, 1284–1292. [Google Scholar] [CrossRef]
  13. Ngamroo, I. Robust frequency control of wind-diesel hybrid power system using superconducting magnetic energy storage. Int. J. Emerg. Electr. Power Syst. 2009, 10–18. [Google Scholar] [CrossRef]
  14. Francis, R.; Chidambaram, I.A. Optimized PI+ load frequency controller using BWNN approach for an interconnected reheat power system with RFB and hydrogen electrolyser units. Int. J. Elect. Power Energy Syst. 2015, 67, 381–392. [Google Scholar] [CrossRef]
  15. Sahu, R.K.; Gorripotu, T.S.; Panda, S. A hybrid DE-PS algorithm for load frequency control under deregulated power system with UPFC and RFB. Ain Shams Eng. J. 2015, 6, 893–911. [Google Scholar] [CrossRef] [Green Version]
  16. Sharma, G.; Narayanan, K.; Adefarati, T.; Sharma, S. Frequency regularization of a linked wind–diesel system using dual structure fuzzy with ultra-capacitor. Prot. Control Mod. Power Syst. 2022, 7, 12. [Google Scholar] [CrossRef]
  17. Ibraheem Kumar, P.; Kothari, D.P. Recent philosophies of automatic generation control strategies in power systems. IEEE Trans. Power Syst. 2005, 20, 346–357. [Google Scholar] [CrossRef]
  18. Yang, H.; Wei, Z.; Chengzhi, L. Optimal design and techno-economic analysis of a hybrid solar-wind power generation system. Appl. Energy 2009, 86, 163–169. [Google Scholar] [CrossRef]
  19. Ray, P.; Mohanty, S.; Kishor, N. Proportional-integral controller based small signal analysis of hybrid distributed generation systems. Energy Convers. Manag. 2011, 52, 1943–1954. [Google Scholar] [CrossRef]
  20. Abou El Ela, A.A.; El-Sehiemy, R.; Shaheen, A.M.; Diab, A.E.G. Optimal Design of PID Controller Based Sampe-Jaya Algorithm for Load Frequency Control of Linear and Nonlinear Multi-Area Thermal Power Systems. Int. J. Eng. Res. Afr. 2020, 50, 79–93. [Google Scholar] [CrossRef]
  21. Das, D.C.; Roy, A.; Sinha, N. PSO based frequency controller for wind-solar-diesel hybrid energy generation/energy storage system. Proc. ICEAS 2011, 458–463. [Google Scholar] [CrossRef]
  22. Zhou, T.; Sun, W. Optimization of battery super-capacitor hybrid energy storage station in wind/solar generation system. IEEE Tran. Sustain. Energy 2014, 5, 408–415. [Google Scholar] [CrossRef]
  23. Maleki, A.; Askarzadeh, A. Artificial bee swarm optimization for optimum sizing of a stand-alone PV/WT/FC hybrid system considering LPSP concept. Sol. Energy 2014, 107, 227–235. [Google Scholar] [CrossRef]
  24. Das, D.C.; Roy, A.; Sinha, N. GA based frequency controller for solar thermal diesel–wind hybrid energy generation/energy storage system. Electr. Power Energy Syst. 2012, 43, 262–279. [Google Scholar] [CrossRef]
  25. Pan, I.; Das, S. Fractional order fuzzy control of hybrid power system with renewable generation using chaotic PSO. ISA Trans. 2016, 62, 19–29. [Google Scholar] [CrossRef] [PubMed] [Green Version]
  26. Gangulya, S.; Shivab, C.K.; Mukherjeec, V. Frequency stabilization of isolated and grid connected hybrid power system models. J. Energy Storage 2018, 19, 145–159. [Google Scholar] [CrossRef]
  27. El-Sehiemy, R.; Shaheen, A.; Ginidi, A.; Al-Gahtani, S.F. Proportional-Integral-Derivative Controller Based-Artificial Rabbits Algorithm for Load Frequency Control in Multi-Area Power Systems. Fractal Fract. 2023, 7, 97. [Google Scholar] [CrossRef]
  28. Abou El-Ela, A.A.; El-Sehiemy, R.A.; Shaheen, A.M.; Diab, A.E.G. Enhanced coyote optimizer-based cascaded load frequency controllers in multi-area power systems with renewable. Neural Comput. Appl. 2021, 33, 8459–8477. [Google Scholar] [CrossRef]
  29. Hashim, F.A.; Hussien, A.G. Snake Optimizer: A novel meta-heuristic optimization algorithm. Knowl.-Based Syst. 2022, 242, 108320. [Google Scholar] [CrossRef]
  30. Çelik, E.; Öztürk, N. Novel fuzzy 1PD-TI controller for AGC of interconnected electric power systems with renewable power generation and energy storage devices. Eng. Sci. Technol. 2022, 35, 101166. [Google Scholar] [CrossRef]
  31. Çelik, E.; Öztürk, N.; Houssein, E.H. Improved load frequency control of interconnected power systems using energy storage devices and a new cost function. Neural Comput. Appl. 2023, 35, 681–697. [Google Scholar] [CrossRef]
  32. Çelik, E.; Öztürk, N.; Houssein, E.H. Influence of energy storage device on load frequency control of an interconnected dual-area thermal and solar photovoltaic power system. Neural Comput. Appl. 2022, 34, 20083–20099. [Google Scholar] [CrossRef]
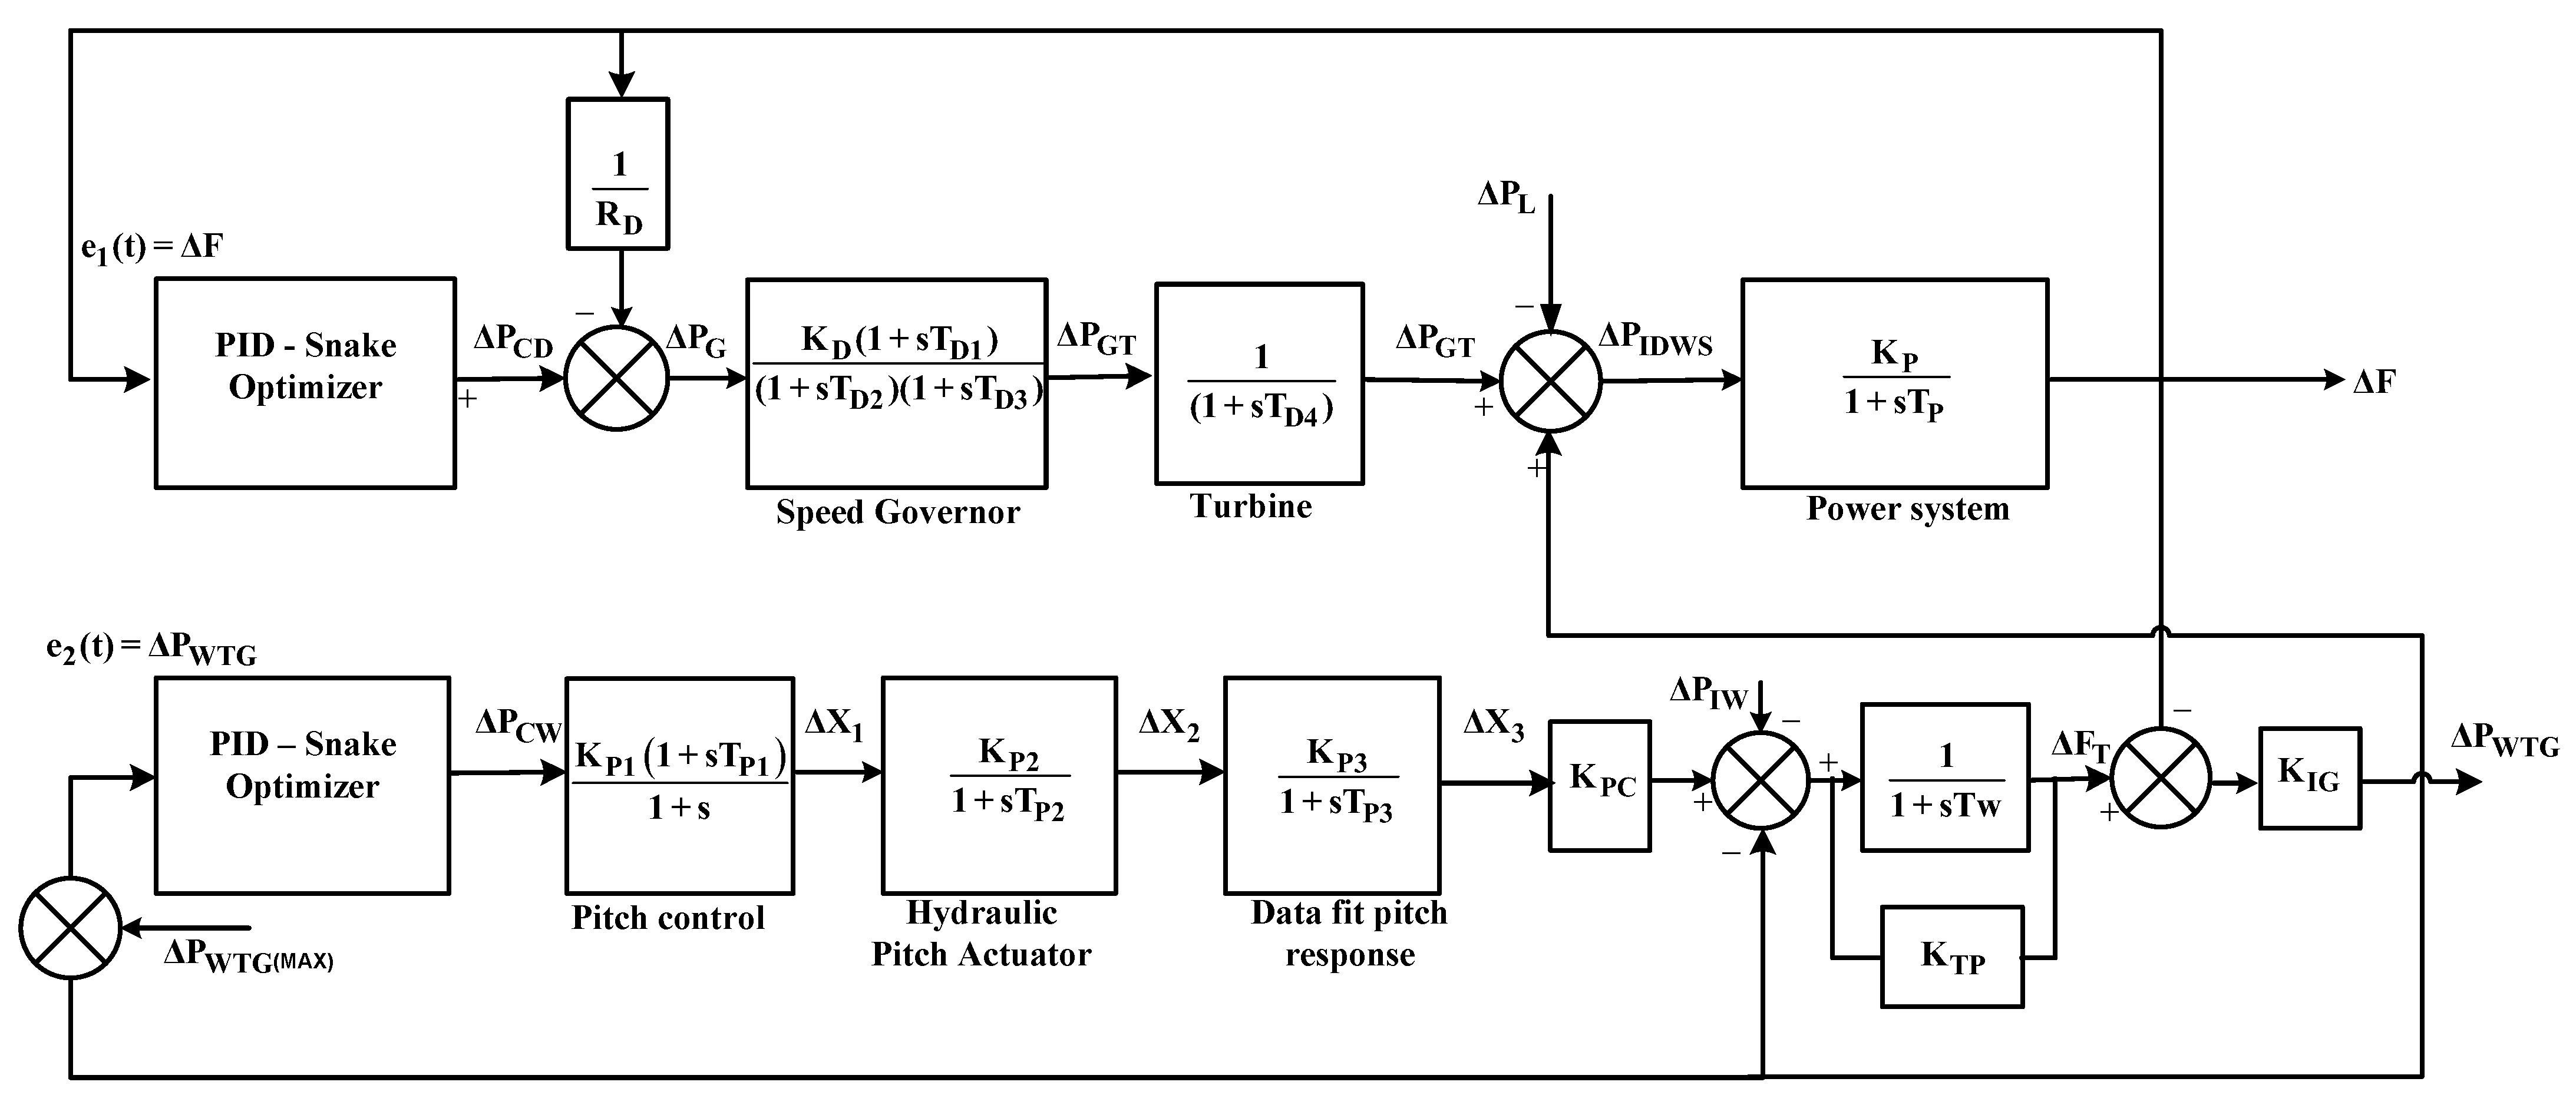
Figure 1. Diesel–wind isolated system.
Energies 16 03417 g001
Figure 2. Diesel–wind isolated system with RFB.
Energies 16 03417 g002
Figure 3. Diesel–wind isolated system with UC.
Energies 16 03417 g003
Figure 4. Snake optimization model flow.
Energies 16 03417 g004
Figure 5. SO-based convergence profile for ITAE minimization.
Energies 16 03417 g005
Figure 6. Balance analysis of SO.
Energies 16 03417 g006
Figure 7. (a,b) Output of diesel–wind isolated system for 1.0 p.u. step load alteration.
Energies 16 03417 g007
Figure 8. (a,b) Output of diesel–wind isolated system for 0.01 p.u. step change in wind speed.
Energies 16 03417 g008aEnergies 16 03417 g008b
Figure 9. (ac) Output of diesel–wind isolated system for load alterations at different instant of time.
Energies 16 03417 g009aEnergies 16 03417 g009b
Figure 10. (ac) Output of diesel–wind isolated system for random load alterations.
Energies 16 03417 g010aEnergies 16 03417 g010b
Figure 11. (a,b) Comparative output of PID with a UC or RFB for diesel–wind isolated system for a 1.0 p. u. step load alteration.
Energies 16 03417 g011
Figure 12. (a,b) The comparative output of PID with a UC or RFB for a diesel–wind isolated system for load alterations at different instant of time.
Energies 16 03417 g012
Figure 13. (a,b) The comparative output of PID with a UC or RFB for the diesel–wind isolated system for random load alterations.
Energies 16 03417 g013
Table 1. The statistical analysis of the numerical results for SO-PID controller.
Statistical MeasureMinimumMaximumAverage Standard Deviation
SO-PID396.3405396.7219396.51330.1435
Table 2. Comparison of optimized controller gains.
DesignKp (DEG)Ki
(DEG)
Kd
(DEG)
Kp
(WTG)
Ki
(WTG)
Kd
(WTG)
ITAEIAEITSE
ZNM-PID [1]0.0960.0360.0620.120.0570.062424989.912590
QOHS-PID [26]0.91240.99760.03490.99960.00110.651959.547.25713.97
SO-PID [Proposed]21.993871.9945302037.14.7065.762
Table 3. Proposed PID output matched for 0.01 p.u. step change in wind speed.
DesignITAEIAEITSE
ZNM-PID [1]12.510.32190.04365
QOHS-PID [26]0.44050.022590.000176
SO-PID [Proposed]0.18730.019790.000156
Table 4. SO-PID output matched by adding an RFB or UC. The results were obtained for a 1.0 p. u. step load alteration.
DesignITAEIAEITSE
SO-PID37.14.7065.762
SO-PID + Ultracapacitor32.463.4112.458
SO-PID + Redox Flow Battery5.3361.4110.453
Disclaimer/Publisher’s Note: The statements, opinions and data contained in all publications are solely those of the individual author(s) and contributor(s) and not of MDPI and/or the editor(s). MDPI and/or the editor(s) disclaim responsibility for any injury to people or property resulting from any ideas, methods, instructions or products referred to in the content.