Article

Optimal Sizing and Operation of Hybrid Renewable Power Plants Participating in Coupled Power Markets with Different Execution Times

by
Carlos García-Santacruz
*,
Andrés Alcántara
,
Juan M. Carrasco
* and
Eduardo Galván
Electronical Engineering Department, University of Seville, 41092 Seville, Spain
*
Authors to whom correspondence should be addressed.
Energies 2023, 16(8), 3432; https://doi.org/10.3390/en16083432
Submission received: 29 March 2023 / Revised: 10 April 2023 / Accepted: 12 April 2023 / Published: 13 April 2023
(This article belongs to the Special Issue Microgrids and the Integration of Energy Storage Systems)

Abstract

:
The increasing limitations in the use of fossil fuels due to their limited availability and pollution have increased the use of renewable energies and storage systems for electricity generation. To achieve the goals of the integration of renewable energy, sizing and management methods for hybrid plants are needed to make investments profitable and attractive in these resources. This work presents an optimization method for the sizing and operation of hybrid plants with storage, choosing the best combination of technologies based on resource availability, installation costs and market prices, maximizing an economic index such as the net present value. One of the main contributions of this work is to reduce the oversizing that occurs in traditional methods through a penalty term for lost energy, encouraging investment in batteries to store excess energy above the point of interconnection (POI). In addition, it is intended to cover gaps such as the operation in coupled markets with different execution periods to maximize the benefits of the investment made and to contemplate different generation alternatives together with storage. The presented method is tested through sizing and operation simulations to demonstrate its potential. The presented method is tested through sizing and operation simulations to demonstrate its potential. In scenario A, the best combination of solar energy, photovoltaic energy and storage, is chosen. In scenario B, it is shown how the curtailment of the oversizing is reduced in some months by more than 5%. In scenario C, for daily operation in coupled markets, it is possible to improve the benefits from 0.7% to 37.04% in the days of the year.

1. Introduction

Renewable energy resources are clean and increasingly competitive energy sources, so their growth seems to have no limit. According to the latest projections of the International Energy Agency (IEA), the contribution of renewable energies to the global electricity supply will increase from 26% in 2018 to 44% in 2040. These sources will provide enough energy to power two thirds of the increase in electricity demand, mainly through wind and photovoltaic energy technologies [1]. This, together with various directives such as [2,3] at the European level, which set targets for clean energy, makes it essential to consider investing in renewable energies.
The International Renewable Energy Agency (IRENA), in [4], has pointed out how investments in renewable energy have grown from USD 50 to USD 300 billion in the last two decades. Together with renewable energy generation, energy storage systems (ESS) should be considered [5], especially batteries, as cost-effective and beneficial investment options, since it is a critical element in the transition to a sustainable electricity system, able to provide a wide range of services. In addition, ref. [6] noted that clean hydrogen currently has unprecedented political and business momentum, encouraging hydrogen to be widely used.
There are works that analyze investments in renewable energies, such as [7], where the financing, risk and environmental and financial connection of these investments in renewable technologies were analyzed. Similarly, in [8], investments in renewable energy projects were analyzed, pointing out the importance of technological innovation and R&D investments, which also includes sizing and management methods. The development of projects with renewable technologies and the improvement of the efficiency of their use is key [9].
This highlights the need for research in the study and analysis of investments in renewable energies, trying to obtain the maximum economic return from the renewable energy and storage mix, considering all possible markets, in order to make these investments attractive and their development even faster. The use of storage is crucial, obtaining benefits by arbitraging or reducing the possible curtailment of the plants [10], for the subsequent sale of energy in markets.
For this, it is essential to consider the correct sizing and operation of the assets [11]. It is important to base the sizing methods on obtaining benefits for the investor, since, as indicated in [12], only taking into account the technology and installation cost criteria does not provide an optimal result from a cost-effectiveness perspective.
In [13], mixed integer non-linear programming (MINLP) optimization models are used to compare the economic performance of hybrid systems with PV generation as the only alternative of energy source together with batteries. In [14], a multi-objective optimization method is used to size a storage system to maximize revenue and minimize the daily cost, in order to adjust to realistic sizes, but without taking into account investment costs or measuring profit with an economic index. In [15], an MILP problem is proposed for the sizing of storage systems participating in the frequency reserve market, without considering the installation costs to be incurred by the investor. In the work developed in [16], an optimization method for the sizing and operation of photovoltaic energy generation and storage system based on price control is proposed, with the disadvantage of oversizing the hybrid plant in some cases to make it profitable. In [17], particle swarm optimization (PSO) is used to size hybrid energy sources with the objective of minimizing the levelized cost of energy (LCOE). Minimizing the LCOE is interesting from an investor’s point of view, but it is also essential to consider market prices to determine the benefit. In [18], different methods are presented for sizing batteries only in photovoltaic energy plants to maximize the total annual revenue and try to find cost-effective storage sizes. In [19], the maximization of economic indexes are evaluated to obtain a hybrid plant, but with PV generation and storage, which is the only asset to be sized. In [20], the problem of optimal storage operation together with wind generation to maximize profit is investigated. It can be observed that it is usual to consider a unique generation source together with storage. This is an important gap, since there are not several generation sources from which to choose the best option together with storage.
In [21], a sizing is proposed through a multi-objective optimization, reducing the cost of the system but also seeking to minimize the emissions of the generation, nor considering different generation sources. The stochastic formulations [22] are also applied to the problem of sizing and profit maximization for the owner participating in the daily and real-time markets, but without specifying different periods as in this paper and not contemplating investment costs.
The problem of sizing is also approached from a technical point of view. In [23], it is presented how to determine the optimal size of wind-solar photovoltaic hybrid energy plant (without storage and its management) using heuristic optimization, with an iterative algorithm to minimize fluctuating production. Studies such as [24] evaluate the sizing of storage systems to compensate for fluctuating wind and solar power generation through optimal economic dispatch. Another approach for sizing can be to determine the optimal generation mix, as in [25], where a flexible fuzzy programming approach is proposed for it.
In [26], a storage system sizing technique is proposed, taking into account the possible errors made in the temporal prediction. The impact of hybrid power plants, with photovoltaic energy and solar thermal energy, from a technical point of view, is analyzed in [27]. Following this point of view, in [28], a sizing of distributed generation and storage is proposed for the improvement of the system and maximizing benefits from a company’s point of view, but not measuring with any economic index the investment over the years. The work developed in [29] focuses on solving the problem of grid inertia, without considering investment costs, through frequency control as well as a focus on the use of storage systems. A method for optimal sizing of a BESS, not a full hybrid plant, to provide different services to the power system is included in the work developed in [30]. In [31], the focus is on reducing system losses and voltage unbalance, leaving the economic criterion as an added benefit, not as the focus of the solution. In addition, only one type of generation is considered, without considering if there are more beneficial options.
The sizing problem has also been studied for island systems. In [32], the optimization of the size of an existing plant is studied. There are also studies for isolated networks, as can be seen in [33]. With regards to other, less common technologies, we refer to a review covering all types of CHP optimization problems using meta-heuristic algorithms, including operation and sizing [34].
Most methods in the literature focus on sizing with a single source of generation and storage. For a correct evaluation and maximization of the investment, it is necessary to evaluate all options with predictions of generation and installation costs. Issues of interest to investors, such as economic performance and installation costs must be evaluated in the method, to obtain real and feasible sizing in its application. Another gap in the existing methods is to perform the operation of the plant considering only one market, or several in some works, but which are executed in the same time intervals.
Thus, this article presents an optimal sizing and operation method that attempts to integrate the various renewable resources together with storage. Thanks to the model presented, it is possible to participate in different markets at the same time, including the hydrogen market, in order to make investments attractive.
As the main contributions of this work, the following are highlighted:
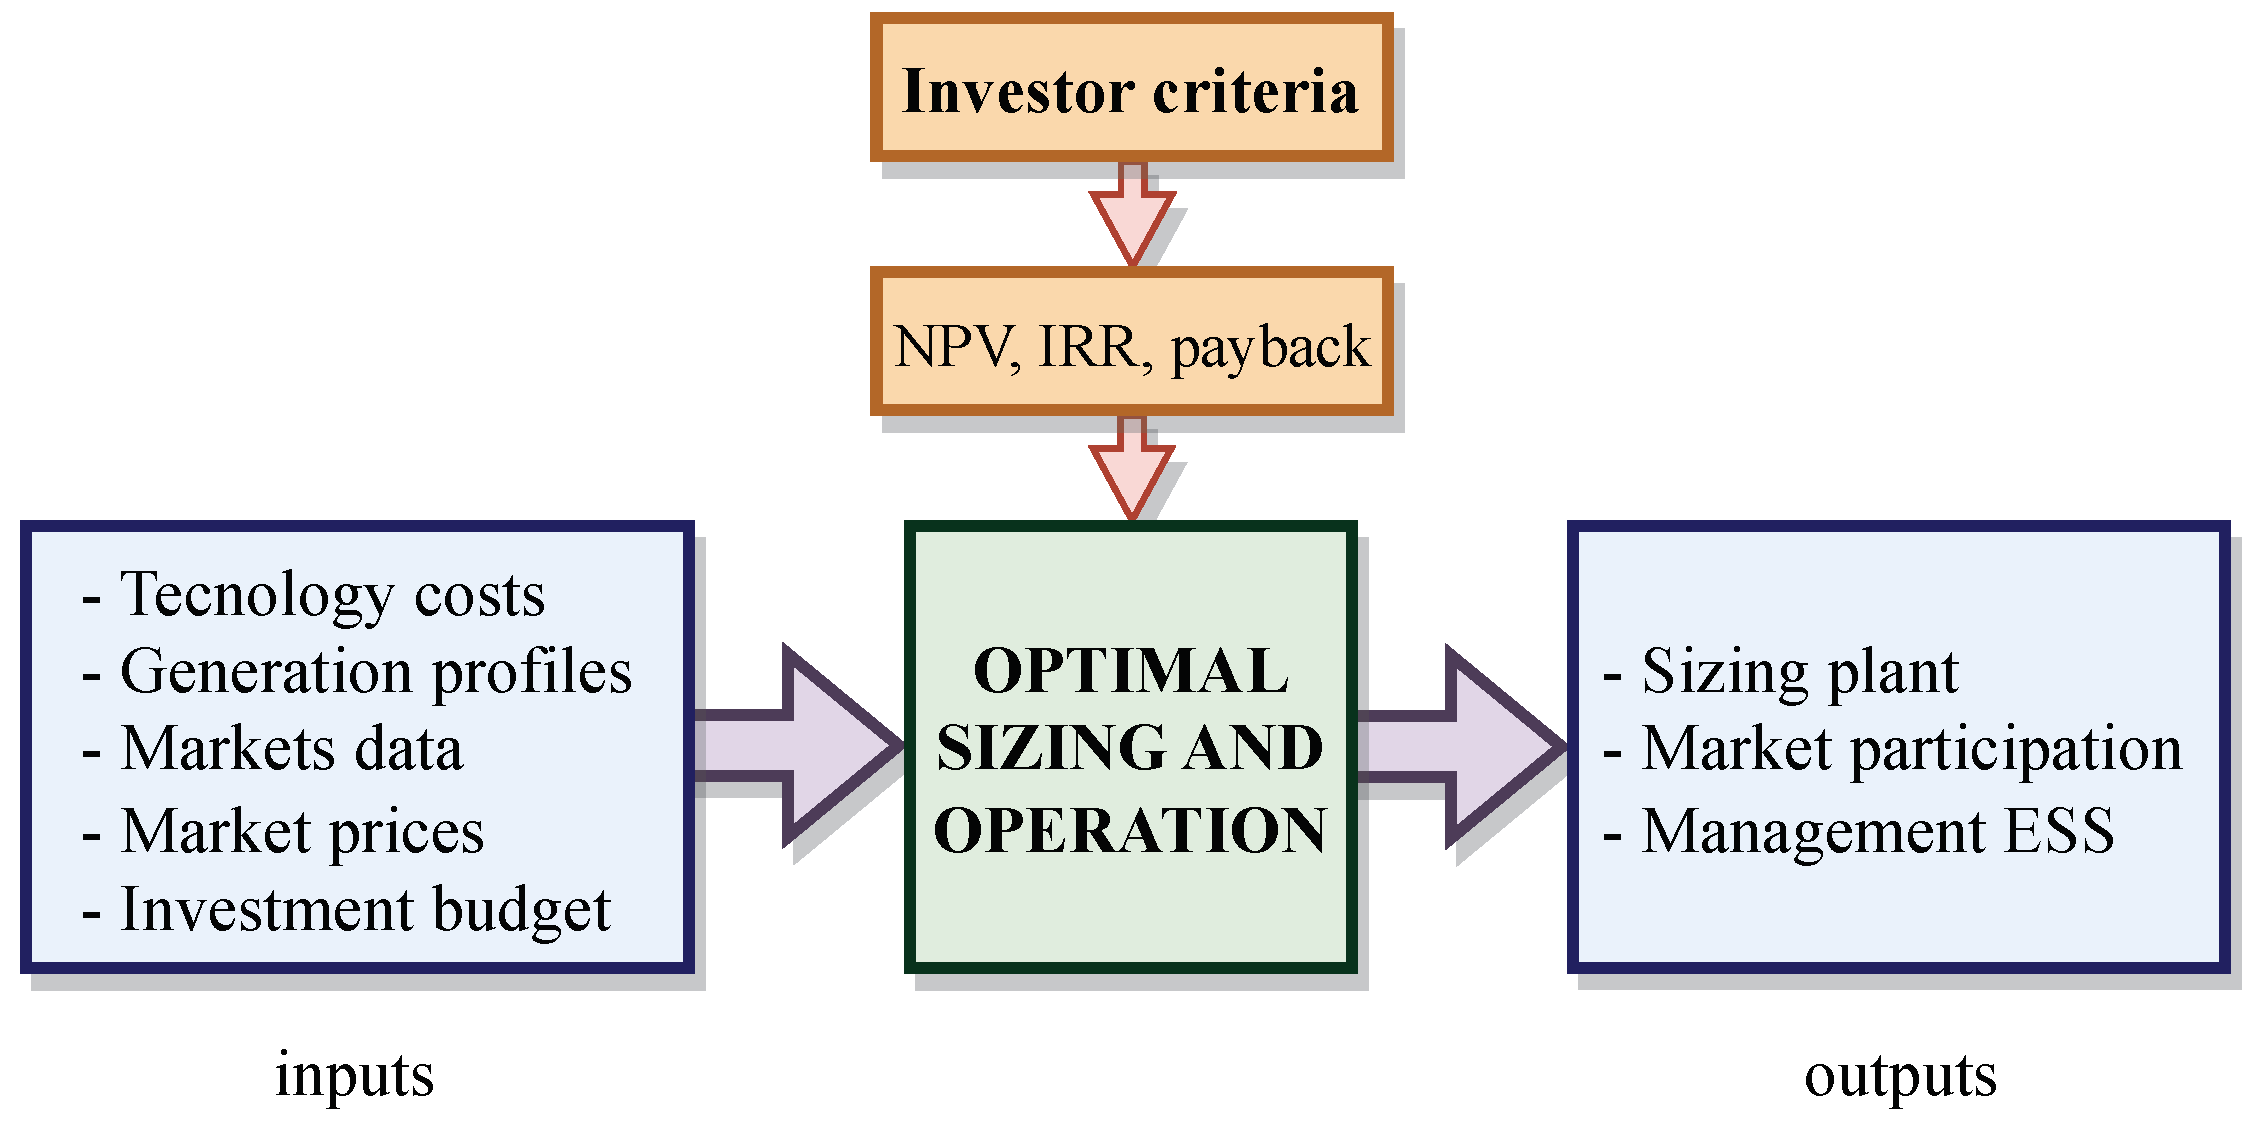
  • Optimization model to size resources, maximizing the net present value and adjusting to the maximum investment as a constraint (even not spending the entire budget in some cases), to find highly attractive and realistic investments;
  • Reduction of curtailment that occurs due to oversizing with a penalty term for lost energy, encouraging investment in storage;
  • Evaluate all resources at the same level to maximize the benefit, considering availability, market prices and installation costs, choosing the best option based on the input parameters;
  • Modeling and integration of participation in different time-coupled markets (hourly and fifteen minutes), with the possibility of incorporating ancillary services market;
  • Consideration of the number of daily charge and discharge cycles of storage in the optimization model, taking care of the valuable life for real results.

2. Method

This section presents the proposed method for sizing and optimal operation of hybrid plants in coupled markets. It is an MINLP optimization model, with three technologies (extendable to more) as alternatives: wind energy, photovoltaic energy and storage systems. The plant can operate in two coupled markets, M1, with hourly execution, and M2, every 15 min.
An overview of the proposed method is shown in Figure 1, indicating the inputs and outputs to the system. The aim is to evaluate which is the best investment to size a hybrid plant and manage it, participating in several markets coupled at the same time, with the objective of maximizing profits.
The inputs of the algorithm are the annual (or years of analysis) unit profile of wind and PV generation, installation costs of all technologies, characteristics of the assets and annual price profiles (or years of analysis) of the M1 and M2 markets. As outputs, we obtain the size of the generation and storage, the scheduling of charge and discharge and the participation in each moment on the markets.
As a result of the conceptualization and model presented, it is possible to extend it to more markets and generation sources. Table 1 shows the parameters and variables used to model the optimization problem for daily operation and the optimal sizing problem.
To simplify the nomenclature, the model is presented for a single year, which can be extrapolated to as many years as desired for the analysis of optimal sizing.

2.1. Objective Functions

The two objective functions proposed in this work are presented below. The first function is utilized for the daily operation of the hybrid plant, with the goal of maximizing profits through participation in different markets. In this case, the operation is performed for a specific size of the hybrid plant. The second objective function is used for sizing the resources of the hybrid plant, seeking the maximum benefit for the investor based on an economic index. In this case, the sizes of the generation and storage components are variables to be calculated in the optimization.

2.1.1. Operation

In the daily operation of the power plant, the maximum economic benefit is sought from the sale of energy to the market. To achieve this, it is necessary to consider the largest possible number of market types, whether they have a short execution interval (minutes) or an hourly one, in order to have more alternatives.
Thus, the objective function of the optimal operation, which takes into account all types of assets, as well as two markets with different execution times, is defined as follows:
max z 1 = h = 1 h = H E d , h , 1 M 1 · π d , h M 1 Market M 1 + h = 1 h = H t = 1 t = T E d , h , t M 2 · π d , h , t M 2 Market M 2 + h = 1 h = H t = 1 t = T E d , h , t c h + E d , h , t l o a d · π d , h M 1 Operation cost
where the profit is determined by participating simultaneously in the M1 and M2 markets, with different execution intervals. As the operation of the power plant is limited to a short horizon of hours or days, the value of D is set to 1 and the set of hours in the desired horizon, such as H = 24 , is defined. Additionally, the cost of providing power to internal loads and charging the battery from the grid is taken into consideration.
The MINLP optimization model for the operation is composed of the objective function (1) and the associated constraints (6)–(13), (15)–(20) defined in Section 2.2.

2.1.2. Sizing

To achieve optimal sizing of the hybrid plant, it is necessary to consider the objective of daily operation, which is to maximize daily profit through participation in various markets and to calculate cash flows accordingly. Since the sizing is done based on a given investment budget, it is important to use an economic index to evaluate the investment.
Typically, sizing algorithms based solely on investment costs and operating benefits tend to oversize the plants. This is because, numerically, it is often more profitable to install excess generation capacity and curtail the excess energy produced. To avoid this, a penalty term is proposed to be included in the objective function. This term penalizes the oversizing of the plant and seeks to produce realistic and practical results in a real-world environment.
This work proposes maximizing the net present value (NPV) to determine if asset selection and management, participation in various markets and discounting the investment result in benefits. The objective function for sizing is defined as follows:
max N P V max I 0 + y = 1 y = Y C F y ( 1 + k ) y Profit markets y = 1 y = Y N C F G y ( 1 + k ) y Penalty curtailments
where I 0 represents the total investment made in the generation and energy storage system (ESS), k is the discount rate, Y denotes the number of years of analysis or project and, finally, C F refers to the annual cash flow generated by participating in all markets. This annual cash flow is defined as:
C F d = d = 1 d = D h = 1 h = H E d , h , 1 M 1 · π d , h M 1 + d = 1 d = D h = 1 h = H t = 1 t = T E d , h , t M 2 · π d , h , t M 2 + d = 1 d = D h = 1 h = H t = 1 t = T E d , h , t c h + E d , h , t l o a d · π d , h M 1
The penalty term, referred to as non-cash flow generated (NCFG), is introduced to penalize excessive oversizing of the generation resources of the hybrid plant. Depending on the generation costs, resource availability and price forecasts, it is possible for the plant to be oversized beyond the point of connection (POI). The NCFG is defined as:
N C F G d = α · d = 1 d = D h = 1 h = H t = 1 t = T ( E d , h , t P V , m a x E d , h , t P V ) · π d , h M 1 + ( E d , h , t W i n d , m a x E d , h , t w i n d ) · π d , h M 1
The NCFG penalizes the excessive oversizing of the generation resources of the hybrid plant. It is calculated as the energy not served due to curtailment in each type of generation. This is determined as the difference between the maximum possible injection according to the sizing, E d , h , t P V , m a x and E d , h , t W i n d , m a x , and the actual energy injected, E d , h , t P V and E d , h , t w i n d , during each interval t. The unserved energy is then economically valued by multiplying it with the market price. It is further weighted by the coefficient α to determine the amount of penalty.
This penalty term is intended to promote the investment and use of storage together with the generation source. The α value can be tuned from 0 to a saturation value specific to each case (from which it does not penalize more). Depending on the value it takes, it will penalize to a different degree and affect the sizing. A small α will allow a lot of curtailment, while a big value will decrease curtailment and will further adjust the sizing of the resources.
Although initially a higher NPV or other index may be obtained, oversizing the plant excessively over the connection point, a large curtailment makes that energy unusable, not allowing it to be stored and used in other markets or ancillary services. This can even be very detrimental to the investment if the prices for which the plant was sized change a lot, not having the flexibility of storage to minimize the negative effects of this change.
The MINLP optimization model for the sizing of the investment in resources is composed of the objective function (2) and constraints (5)–(13), (15)–(20), presented below.

2.2. Problem Constraints

All constraints associated with the operation and size problems are defined in this section. First, the maximum investment that can be made in assets is limited in Equation (5), where the investment is divided between the installed power of the generation sources as well as the storage systems. This constraint allows optimal sizing according to the maximum investment that can be realized.
I n v C P V · P V s i z e + C W i n d · W i n d s i z e + C E S S · E S S s i z e
In Equation (6), the balance to be met at the POI of the hybrid plant to the grid is represented.
E d , h , t P V + E d , h , t w i n d + E d , h , t d i s + E d , h , t G r i d B u y = E d , h , t l o a d + E d , h , t c h + E d , h , t M 1 + E d , h , t M 2 , d D , h H , t T ,
where this balance is applied for each period t for the entire horizon of days (in operation case) or years (in sizing) analyzed. It must be fulfilled that the available photovoltaic energy ( E d , h , t P V ), wind ( E d , h , t w i n d ) or discharge of the storage systems ( E d , h , t d i s ) is equal to the load of the plant, sold energy in the different markets ( E d , h , t M 1 , E d , h , t M 2 ) or the charge of the storage ( E d , h , t c h ).
Equation (7) represents the maximum energy that can be injected into the grid at the connection point. This is determined by the net available energy of the hybrid plant.
E P O I E d , h , t M 1 + E d , h , t M 2 , d D , h H , t T .
In order to avoid simultaneous participation in the energy purchase and sale market, it is necessary to define the restrictions (8)–(10), also limiting the maximum amount of energy to be injected or consumed:
B d , h , t M s + B d , h , t G r i d B u y 1 , d D , h H , t T .
E d , h , t M 1 + E d , h , t M 2 B d , h , t M s · E P O I , d D , h H , t T .
E d , h , t l o a d + E d , h , t c h B d , h , t G r i d B u y · E P O I , d D , h H , t T .
Equations (11) and (12) limit the maximum PV and wind generation injections as a function of the total available energy:
E d , h , t P V M d , h , t P V · P V s i z e , d D , h H , t T .
E d , h , t w i n d M d , h , t w i n d · W i n d s i z e , d D , h H , t T .
Another contribution of this work is the possibility of participating in two coupled markets simultaneously, M 1 and M 2 , with different execution times. This could be extrapolated to more than two markets due to the modeling of the problem. The market with the shorter execution time ( M 2 ) will be the one that determines into how many intervals, t, an hour, h, should be split.
Instead of dividing the whole year directly into the total number of intervals, we work on the hours of the day, and these are divided into intervals determined by the market with the shortest execution time. This allows to establish a better relationship between markets and execution times. This is shown in Figure 2.
To relate the two markets, a set must be defined that relates the execution intervals of the smaller market to the other market. Thus, for example, if market M 2 is executed every 15 min and market M 1 is executed every hour, the values to be taken by t must be in the set {1, 2, 3, 4}. The value in hourly market M1 must be maintained during the four intervals that define an hour. That is, for each period t, the value in the first period must be maintained to complete the hour with the same energy value. The equation which models the coupled simultaneity of participation is defined as:
E d , h , 1 M 1 = E d , h , t M 1 d D , h H , t T .
This modeling of the problem allows adding additional markets at different times. For example, to add another market M 3 that closes every half hour, it is sufficient to define a set m { 1 , 3 } , and include the following constraint equation:
E d , h , 1 M 3 = E d , h , m + 1 M 3 , , y Y , d D , h H , m M ,
where with this set, it is possible to relate t 1 , the first fifteen minutes, with t 2 , which is the second fifteen minutes, making the half-hour constant. This would be the same in the second half hour.
These markets can represent the case of a main market and other markets for ancillary services or other markets. Considering participation in deviation or short-time markets is interesting, due to the variability of generation, with storage offering flexibility to the system. This can result in economic benefits, the greater possibility of renewable energy integration and greater system reliability.
Storage system is modeled by the following set of equations. Equation (15) represents the update of the stored energy in each period. In (16)–(18), simultaneous charging and discharging of the battery is constrained. Finally, the maximum and minimum energy stored in each interval is defined in (19):
E d , h , t B a t = E d , h , t 1 B a t + E d , h , t c h · η c h E d , h , t d i s · 1 η d i s , d D , h H , t T .
B d , h , t c h + B d , h , t d i s 1 , d D , h H , t T .
E d , h , t c h E d , h , t m a x , c h · B d , h , t c h , d D , h H , t T .
E d , h , t d i s E d , h , t m a x , d i s · B d , h , t d i s , d D , h H , t T .
B a t s i z e · S O C m i n E d , h , t b a t B a t s i z e · S O C m a x , d D , h H , t T .
Finally, the daily energy that can be charged or discharged by the battery is defined in (20). This is essential to protect the battery and maintain its lifetime throughout the project, and to provide realism to the solution of the problem.
h = 1 h = H t = 1 t = T E d , h , t d i s + E d , h , t c h N · B a t s i z e , d D .

3. Test Case

To test the presented method, two different generation scenarios will be used for the analysis. For simplicity and to observe the differences, the same energy prices will be used for both cases. In Figure 3, the prices used for the analysis are shown, with the main market data, M1, with a resolution of one hour, and the secondary market data, M2, with a resolution of 15 min.
Table 2 shows the investment data, with generation and storage costs used in the scenarios. The cost of land or areas to place the generation is not taken into account.

3.1. Scenario A

This scenario will use data collected in [35], specifically from Great Britain. Unit profiles of wind energy and PV energy generation, shown in Figure 4, will be used.
For this scenario, the plant has installation limitations of 60 MW of wind energy generation and 170 MW of photovoltaic energy, with no restrictions on the use of batteries, while the limit of the connection point is 100 MW. The limit for purchase at the connection point is 30 MW.
A 15-year period is analyzed, with a discount rate of 2% and a maximum investment of EUR 100 million. A 1-year simulation is performed, and its result is considered approximately constant for the entire 15-year period.

3.2. Scenario B

In this scenario, only PV energy generation is considered. An estimate of the energy generation in Seville, Spain, has been chosen using the PVGIS tool [36]. This profile is shown in Figure 5.
The plant has installation limitations of 170 MW of photovoltaic energy generation, with no restrictions on the use of batteries, while the connection point limit is 100 MW. A period of 30 years is analyzed, with a discount rate of 2% and a maximum investment of 100 million euros.

3.3. Scenario C

Scenario C is used to test participation in two coupled markets with different closing times. For this purpose, the prices from Figure 3 are shown together with the evolution of PV energy generation from Scenario B, for a specific size of hybrid plant. To be more restrictive and observe the influence of participation in the two markets, the limit for purchase at the connection point is lowered to 10 MW.

4. Simulations and Results

This section presents the results of the application of the proposed method for sizing and operation in different cases. In scenario A, the plant is sized, taking into account storage, PV energy generation and wind energy generation for the profiles shown above. In scenario B, the sizing is performed only with PV energy generation and battery to observe the influence of the NCFG and α term. For sizing, only the hourly market will be considered, due to the complexity of predicting markets at shorter execution times. Finally, in scenario C, one of the combinations of energy generation and battery size is chosen to operate the hybrid plant in one day, participating in two coupled markets simultaneously.

4.1. Scenario A

In this scenario, the most optimal investment option according to maximizing the NPV is the installation of 60 MW of wind generation. This translates into a total investment of 72 MEUR, which is 28 MEUR less than the maximum investment limit. Despite having more budget for investment, the best option is to invest only in wind generation, not investing in other resources, because it will not increase the net present value of the investment.
It is demonstrated how the method seeks the best option for the investor without the need to spend the entire budget, saving money for the investor, which is a key advantage. In addition, this result coincides with the values collected in LCOE analysis, where onshore wind energy presents a smaller value than photovoltaic energy or batteries, making it a better investment when there is an appropriate wind profile.
Table 3 shows a sizing comparison and economic performance data if the annual profile were the same for each month of the year, to see how the method performs according to the availability of the generation resource, which changes for each month of the year.
It is observed how in only four months of spring and summer, photovoltaic energy generation would be installed as the main source, but in the remaining eight months, the main source is wind energy generation alone or accompanied by photovoltaic energy generation. The month-by-month analysis is consistent with the results obtained for the sizing of the entire year.
Furthermore, in the month of August, it can be seen that due to the photovoltaic energy and wind energy generation profiles and prices, the sizing model presented chooses all technologies and storage, not excluding any of the alternatives, as all of them are considered profitable.

4.2. Scenario B

The objective in this scenario is to size a hybrid plant using photovoltaic energy generation and storage in a location where there is a large amount of solar radiation, reducing curtailment and promoting the installation of storage.
For this purpose, a comparison is also made between the model without penalty, very similar to other sizing methods present in the literature, and the method proposed contemplating the penalty, with a non-zero α . This will allow showing the influence of the proposed method.
Applying the proposed sizing method, the most optimal sizing solution is formed by 131.15 MW of photovoltaic energy generation and 92.88 MWh of storage. These values are those that obtain the maximum NPV: 291,430,088 EUR, investing the maximum possible budget of 100 MEUR.
Table 4 shows a detailed analysis of the sizing according to the profiles of the different seasons of the year. In this case, the optimal sizing is very similar in all cases, due to the uniformity of the generation profile. In months with lower radiation, it can be seen that less battery size would be installed, since there would not be as much surplus photovoltaic energy for storage and subsequent sale. All this has repercussions in lower economic indexes for the months with less generation.
To evaluate the influence that the term of non cash flow generated (NCFG), the sizing is carried out by defining α = 0 , obtaining results of 140.09 MW of photovoltaic energy generation and 76.49 MWh of storage with an NPV of 374,590,511 EUR. This implies that if α is not considered, allowing a great curtailment, about 8.94 MW more generation is installed, but more importantly, 16.39 MWh less of storage are installed. In Figure 6, the energy lost due to curtailment is shown, penalizing it with α = 1 , and not penalizing it ( α = 0 ). This is the total energy that cannot be injected, discounting that which is stored.
This oversizing results in a loss of energy over several months of 1000 MWh (an average of more than 32 MWh per day) that cannot be stored. To use this energy, a new investment in storage would have to be made, which is more expensive for the investor. By defining α = 1 , the curtailment is considerably reduced, and the storage sizing is adequate to store a large part of the energy produced.
Although with α = 0 , a slightly higher NPV is obtained in this sizing, it is interesting to size prioritizing that not too much energy is left over and stored. This makes the owner’s investment more flexible in terms of profitability and changes in new scenarios, electricity prices or new markets, making the investment more interesting and less rigid throughout the years of the project.
Finally, Figure 7 shows the influence of Equation (20), which limits the maximum number of daily charge and discharge cycles for the same case as the previous figure. It is observed that, if no limit is defined, the maximum limit is exceeded on some of the days shown for January and August. If this number is not limited, the battery could be used in an uncontrolled way, maximizing the benefits, but not being a real result because the battery would degrade more, not reaching the useful life of the project.

4.3. Scenario C

In this scenario, the participation in two coupled markets of the hybrid plant with battery is tested. The optimal plant size from the previous scenario of 131.15 MW of photovoltaic energy generation and 92.88 MWh of storage are chosen to demonstrate the operation defined in Section 2.1.1. For the analysis, an hourly execution market, M1, and another fifteen-minute market, M2, are considered. For greater clarity in the results, the day will be divided into 96 intervals of 15 min.
Figure 8 shows the evolution of prices and the results obtained in the operation of the hybrid plant for day 2 of the year with the sizing obtained. It is observed how the constraint (13) for the participation in the markets is satisfied, maintaining during four periods of 15 min the same value for the market that is executed hour by hour, while the one that is executed every 15 min remains free.
For this day, contemplating the two markets and with the price evolution shown, a daily profit of 18,853.13 EUR is achieved, while if only participating in the hourly market, M1, the profit is 18,359.97 EUR. This represents an increase of 2.61% profit for only one day in January, one of the worst photovoltaic energy generation seasons.
Table 5 shows some days on which the method of operation is applied to compare benefits.
It can be seen that since the price of the M2 market is more variable over time, the benefits oscillate, with reasonable increases on day 1, small increases on other days, such as day 181, or a significant increase on day 295, where it is more convenient to participate on the M2 market instead of the M1 market.
Therefore, it is shown that a method that considers two markets coupled in time is necessary and can improve the profitability of the hybrid plant, always choosing the best option at each instant of time.

5. Conclusions

In this work, a method of sizing and managing hybrid plants has been proposed to make them attractive to investors, with participation in several coupled markets. All types of generation technology are put on the same level to choose which is the best decision to invest in based on a budget, while maximizing the NPV, to see which is the most profitable sizing combination based on resource availability and storage.
It is proposed to reduce the curtailment that occurs when the plant is oversized, penalizing the energy that cannot be injected or stored, in order to better adjust the generation and storage sizes. In addition, the participation in coupled markets with different execution time is defined, in order to participate in different markets seeking to increase the profitability of the investment.
The results show that an optimal sizing is produced depending on the location and budget, choosing the most optimal combination. Thanks to the proposed definition, the curtailment of the plant is reduced, reducing the oversizing that occurs in many cases. The operation also shows how profitability is improved as a result of the participation in two coupled markets with different execution intervals.
Future work will focus on improving the storage management system to improve investor profitability, as well as integrating the method into multi-objective optimizations that meet investor criteria.

Author Contributions

Conceptualization, all authors; methodology, C.G.-S. and A.A.; software, C.G.-S. and A.A.; validation, all authors; formal analysis, all authors; investigation, C.G.-S. and A.A.; resources, J.M.C. and E.G.; data curation, C.G.-S.; writing—original draft preparation, C.G.-S. and A.A.; writing—review and editing, J.M.C. and E.G.; visualization, all authors; supervision, J.M.C. and E.G.; project administration, J.M.C. and E.G.; funding acquisition, J.M.C. and E.G. All authors have read and agreed to the published version of the manuscript.

Funding

This research was supported by the Spanish State Research Agency (AEI) through the Project PDC2021-121278-I00 funded by MCIN/AEI/10.13039/501100011033 and by the European Union Next GenerationEU/PRTR and by the Spanish State Research Agency (AEI) through the Project PYC20 RE 075 US funded by Junta de Andalucía (Ministry of Economy, Knowledge, Business and University).

Data Availability Statement

Not applicable.

Conflicts of Interest

The authors declare no conflict of interest. The funders had no role in the design of the study; in the collection, analyses, or interpretation of data; in the writing of the manuscript, or in the decision to publish the results.

References

  1. IEA. World Energy Outlook 2019. 2019. Available online: https://www.iea.org/reports/world-energy-outlook-2019 (accessed on 15 December 2022).
  2. Directive (EU) 2018/2001 of the European Parliament and of the Council of 11 December 2018 on the Promotion of the Use of Energy from reneWable Sources. Off. J. Eur. Union. Available online: https://eur-lex.europa.eu/legal-content/EN/TXT/PDF/?uri=CELEX:32018L2001&from=EN (accessed on 15 December 2022).
  3. Directive 2012/27/EU of the European Parliament and of the Council of 25 October 2012 on Energy Efficiency. Off. J. Eur. Union. Available online: https://eur-lex.europa.eu/LexUriServ/LexUriServ.do?uri=OJ:L:2012:315:0001:0056:en:PDF (accessed on 15 December 2022).
  4. IRENA. Renewable Energy Finance: Institutional Capital; Renewable Energy Finance Brief 02; IRENA: Abu Dhabi, United Arab Emirates, 2020; pp. 1–11. [Google Scholar]
  5. Ralon, P.; Taylor, M.; Ilas, A.; Diaz-Bone, H.; Kairies, K. Electricity Storage and Renewables: Costs and Markets to 2030. International Renewable Energy Agency (Issue October). 2017. Available online: http://irena.org/publications/2017/Oct/Electricity-storage-and-renewables-costs-and-markets (accessed on 15 December 2022).
  6. International Energy Agency. The Future of Hydrogen: Seizing Today’s Opportunities; IEA Publications: Paris, France, 2019. [Google Scholar]
  7. Abbas, J.; Wang, L.; Ben Belgacem, S.; Pawar, P.S.; Najam, H.; Abbas, J. Investment in renewable energy and electricity output: Role of green finance, environmental tax, and geopolitical risk: Empirical evidence from China. Energy 2023, 269, 126683. [Google Scholar] [CrossRef]
  8. Siddik, A.B.; Khan, S.; Khan, U.; Yong, L.; Murshed, M. The role of renewable energy finance in achieving low-carbon growth: Contextual evidence from leading renewable energy-investing countries. Energy 2023, 270, 126864. [Google Scholar] [CrossRef]
  9. He, X.; Khan, S.; Ozturk, I.; Murshed, M. The role of renewable energy investment in tackling climate change concerns: Environmental policies for achieving SDG-13. Sustain. Dev. 2023. [Google Scholar] [CrossRef]
  10. Root, C.; Presume, H.; Proudfoot, D.; Willis, L.; Masiello, R. Using battery energy storage to reduce renewable resource curtailment. In Proceedings of the 2017 IEEE Power and Energy Society Innovative Smart Grid Technologies Conference, ISGT 2017, Arlington, VA, USA, 23–26 April 2017; pp. 1–5. [Google Scholar] [CrossRef]
  11. Dimopoulou, S.; Oppermann, A.; Boggasch, E.; Rausch, A. A Markov Decision Process for managing a Hybrid Energy Storage System. J. Energy Storage 2018, 19, 160–169. [Google Scholar] [CrossRef]
  12. Dykes, K.; King, J.; Diorio, N.; King, R.; Gevorgian, V.; Corbus, D.; Blair, N.; Anderson, K.; Stark, G.; Turchi, C.; et al. Opportunities for Research and Development of Hybrid Power Plants. May 2020. Available online: https://www.nrel.gov/docs/fy20osti/75026.pdf (accessed on 15 December 2022).
  13. Terlouw, T.; AlSkaif, T.; Bauer, C. Techno-Economic Assessment of PV-Coupled Battery Energy Storage Systems with Different Sizing Methodologies. In Proceedings of the 2021 IEEE Madrid PowerTech, Madrid, Spain, 28 June–2 July 2021; pp. 1–6. [Google Scholar] [CrossRef]
  14. Kelly, J.J.; Leahy, P.G. Sizing Battery Energy Storage Systems: Using Multi-Objective Optimization to Overcome the Investment Scale Problem of Annual Worth. IEEE Trans. Sustain. Energy 2019, 11, 2305–2314. [Google Scholar] [CrossRef]
  15. Martinez-Rico, J.; de Argandona, I.R.; Zulueta, E.; Fernandez-Gamiz, U.; Armendia, M. Energy Storage Sizing Based on Automatic Frequency Restoration Reserve Market Participation of Hybrid Renewable Power Plants. In Proceedings of the 2021 International Conference on Smart Energy Systems and Technologies (SEST), Vaasa, Finland, 6–8 September 2021; pp. 1–6. [Google Scholar] [CrossRef]
  16. García-Santacruz, C.; Galván, L.; Carrasco, J.M.; Galván, E. Sizing and Management of Energy Storage Systems in Large-Scale Power Plants Using Price Control and Artificial Intelligence. Energies 2021, 14, 3296. [Google Scholar] [CrossRef]
  17. Nuvvula, R.S.S.; Elangovan, D.; Teegala, K.S.; Madurai Elavarasan, R.; Islam, M.R.; Inapakurthi, R. Optimal Sizing of Battery-Integrated Hybrid Renewable Energy Sources with Ramp Rate Limitations on a Grid Using ALA-QPSO. Energies 2021, 14, 5368. [Google Scholar] [CrossRef]
  18. Xia, Q.; Debnath, S.; Saeedifard, M.; Marthi, P.R.V.; Arifujjaman, M. Energy Storage Sizing and Operation of an Integrated Utility-Scale PV+ESS Power Plant. In Proceedings of the 2020 IEEE Power & Energy Society Innovative Smart Grid Technologies Conference (ISGT), Washington, DC, USA, 17–20 February 2020; pp. 1–5. [Google Scholar] [CrossRef]
  19. Yao, M.; Cai, X. Energy Storage Sizing Optimization for Large-Scale PV Power Plant. IEEE Access 2021, 9, 75599–75607. [Google Scholar] [CrossRef]
  20. Shu, Z.; Jirutitijaroen, P. Optimal Operation Strategy of Energy Storage System for Grid-Connected Wind Power Plants. IEEE Trans. Sustain. Energy 2013, 5, 190–199. [Google Scholar] [CrossRef]
  21. Parashar, S.; Swarnkar, A.; Niazi, K.R.; Gupta, N. Multiobjective optimal sizing of battery energy storage in grid-connected microgrid. J. Eng. 2019, 2019, 5280–5283. [Google Scholar] [CrossRef]
  22. Krishnamurthy, D.; Uckun, C.; Zhou, Z.; Thimmapuram, P.R.; Botterud, A. Energy Storage Arbitrage Under Day-Ahead and Real-Time Price Uncertainty. IEEE Trans. Power Syst. 2018, 33, 84–93. [Google Scholar] [CrossRef]
  23. Al-Shereiqi, A.; Al-Hinai, A.; Albadi, M.; Al-Abri, R. Optimal Sizing of Hybrid Wind-Solar Power Systems to Suppress Output Fluctuation. Energies 2021, 14, 5377. [Google Scholar] [CrossRef]
  24. Klansupar, C.; Chaitusaney, S. Optimal Sizing of Utility-scaled Battery with Consideration of Battery Installtion Cost and System Power Generation Cost. In Proceedings of the 2020 17th International Conference on Electrical Engineering/Electronics, Computer, Telecommunications and Information Technology (ECTI-CON), Phuket, Thailand, 24–27 June 2020; pp. 498–501. [Google Scholar] [CrossRef]
  25. Khan, M.F.; Pervez, A.; Modibbo, U.M.; Chauhan, J.; Ali, I. Flexible Fuzzy Goal Programming Approach in Optimal Mix of Power Generation for Socio-Economic Sustainability: A Case Study. Sustainability 2021, 13, 8256. [Google Scholar] [CrossRef]
  26. Zhao, L.; Zhang, T.; Peng, X.; Zhang, X. A novel long-term power forecasting based smart grid hybrid energy storage system optimal sizing method considering uncertainties. Inf. Sci. 2022, 610, 326–344. [Google Scholar] [CrossRef]
  27. Remon, D.; Cantarellas, A.M.; Martinez-Garcia, J.; Escano, J.M.; Rodriguez, P. Hybrid solar plant with synchronous power controllers contribution to power system stability. In Proceedings of the 2017 IEEE Energy Conversion Congress and Exposition (ECCE), Cincinnati, OH, USA, 1–5 October 2017; pp. 4069–4076. [Google Scholar] [CrossRef]
  28. Abdeltawab, H.; Mohamed, Y.A.-R.I. Energy Storage Planning for Profitability Maximization by Power Trading and Ancillary Services Participation. IEEE Syst. J. 2021, 16, 1909–1920. [Google Scholar] [CrossRef]
  29. Bera, A.; Chalamala, B.R.; Byrne, R.H.; Mitra, J. Sizing of Energy Storage for Grid Inertial Support in Presence of Renewable Energy. IEEE Trans. Power Syst. 2021, 37, 3769–3778. [Google Scholar] [CrossRef]
  30. Siface, D. Optimal Economical and Technical Sizing Tool for Battery Energy Storage Systems Supplying Simultaneous Services to the Power System. In Proceedings of the 2019 16th International Conference on the European Energy Market (EEM), Ljubljana, Slovenia, 18–20 September 2019; pp. 1–6. [Google Scholar] [CrossRef]
  31. Chiang, M.-Y.; Huang, S.-C.; Hsiao, T.-C.; Zhan, T.-S.; Hou, J.-C. Optimal Sizing and Location of Photovoltaic Generation and Energy Storage Systems in an Unbalanced Distribution System. Energies 2022, 15, 6682. [Google Scholar] [CrossRef]
  32. Chowdhury, T.; Hasan, S.; Chowdhury, H.; Hasnat, A.; Rashedi, A.; Asyraf, M.R.M.; Hassan, M.Z.; Sait, S.M. Sizing of an Island Standalone Hybrid System Considering Economic and Environmental Parameters: A Case Study. Energies 2022, 15, 5940. [Google Scholar] [CrossRef]
  33. Li, X.; Jones, G. Optimal Sizing, Location, and Assignment of Photovoltaic Distributed Generators with an Energy Storage System for Islanded Microgrids. Energies 2022, 15, 6630. [Google Scholar] [CrossRef]
  34. Alsagri, A.S.; Alrobaian, A.A. Optimization of Combined Heat and Power Systems by Meta-Heuristic Algorithms: An Overview. Energies 2022, 15, 5977. [Google Scholar] [CrossRef]
  35. Open Power System Data. A Free Open Data Platform for Power System Modeling. Available online: https://data.open-power-system-data.org/ (accessed on 20 January 2023).
  36. The European Commission’s Science and Knowledge Service. Photovoltaic Geographical Information System (PVGIS). Available online: ec.europa.eu/jrc/en/pvgis (accessed on 20 January 2023).
Figure 1. Flowchart of the proposed sizing and operation method.
Energies 16 03432 g001
Figure 2. Diagram of coupled markets.
Energies 16 03432 g002
Figure 3. Day-ahead market price (a) and 15-min market price (b).
Energies 16 03432 g003
Figure 4. Photovoltaic energy (a) and wind energy (b) generation in Great Britain.
Energies 16 03432 g004
Figure 5. Photovoltaic energy generation in Seville, Spain.
Energies 16 03432 g005
Figure 6. Energy not injected due to curtailment (a) and percentage of energy over total energy produced not injected (b).
Energies 16 03432 g006
Figure 7. Number of daily charge and discharge cycles for the first 20 days of January (a) and July (b).
Energies 16 03432 g007
Figure 8. Electricity prices of markets (a) and participation (energy sale) in markets (b).
Energies 16 03432 g008
Table 1. Nomenclature.
Sets π d , h M 1 Selling price on the market hourly market M1 (EUR/MWh).
DSet of D days of a year, d D . π d , h , t M 2 Selling price on the 15-min market M2 (EUR/MWh).
HSet of H hours of a day, h H . α Weight factor related to the to penalization of curtailment.
TSet of T intervals of an hour, t T . E P O I Limit of the point of connection (MWh).
Parameters Variables
C P V Installation cost for photovoltaic energy generation (EUR/MW). P V s i z e Maximum installed capacity for photovoltaic energy resource (MW).
C W i n d Installation cost for wind generation (EUR/MW). W i n d s i z e Maximum installed capacity for wind resource (MW).
C E S S Installation cost for ESS generation (EUR/MWh). E S S s i z e Maximum installed capacity for ESS (MWh).
E d , h , t l o a d Internal load in day d, hour h and period t (MW). E d , h , t P V Power injection by photovoltaic energy generation in interval t of hour h and day d (MWh).
M d , h , t P V Generation profile for photovoltaic energy in day d, hour h and period t (pu). E d , h , t W i n d Power injection by wind generation in interval t of hour h and day d (MWh).
M d , h , t W i n d Generation profile for wind in day d, hour h and period t (pu). E d , h , t M 1 Energy sold on market M1 in the interval t of hour h and day d (MWh).
NNumber of charge and discharge cycles. E d , h , t M 2 Energy sold on market M2 in the interval t of hour h and day d (MWh).
E d , h , t m a x , c h Maximum energy charged by battery in interval t of hour h and day d (MWh). E d , h , t c h Energy charged by battery in interval t of hour h and day d (MWh).
E d , h , t m a x , c h Maximum energy discharged by battery in interval t of hour h and day d (MWh). E d , h , t d i s Energy discharged by battery in interval t of hour h and day d (MWh).
S O C m i n , S O C m a x Minimum and maximum state of charge of storage. E d , h , t B a t Energy stored in the battery in interval t of hour h and day d (MWh).
η c h Battery charge efficiency.Binary
η d i s Battery discharge efficiency. B d , h , t M s Binary variable to indicate the sale of energy on markets M1 and M2.
I n v Total investment in assets in millions of euros (MEUR). B d , h , t G r i d B u y Binary variable to indicate the purchase of energy.
B d , h , t c h Binary variable to indicate the charge of battery.
B d , h , t d i s Binary variable to indicate the discharge of battery.
Table 2. Resource costs.
CostValue
PV energy generation costs550,000 EUR/MW
Wind energy generation costs1,200,000 EUR/MW
Battery cost300,000 EUR/MWh
Table 3. Sizing comparison for each month of the year participating in the day ahead market.
MonthPV (MW)Wind (MW)ESS (MWh)NPV (EUR)IRR (%)Investment
January060087,888,55015.272 MEUR
February060061,097,00111.672 MEUR
March50.91600128,773,25015.8100 MEUR
April50.9160061,048,5789.2100 MEUR
May141.41074.04118,245,44514.6100 MEUR
June167.50026.24121,558,10015.2100 MEUR
July151.59055.43160,512,93918.7100 MEUR
August166.436.083.91109,994,63014.1100 MEUR
September50.91600138,465,87216.7100 MEUR
October50.91600103,139,34013.4100 MEUR
November0600125,544,88719.972 MEUR
December0600129,307,84020.472 MEUR
Table 4. Sizing comparison for each season of the year participating in the day ahead market with α = 1 .
SeasonPV Size (MW)ESS Size (MWh)NPV (EUR)IRR (%)
Winter133.6088.39233,110,09614.6
Spring130.1794.70315,173,77618.4
Summer131.1592.88335,398,83919.3
Autumn133.0489.34166,560,78211.4
Table 5. Comparison of profits due to market participation on various days of the year.
DayWithout M2 (EUR)With M2 (EUR)Improve (%)
118,359.9718,853.132.61
18147,283.9447,622.340.71
29521,544.8234,219.5937.04
Disclaimer/Publisher’s Note: The statements, opinions and data contained in all publications are solely those of the individual author(s) and contributor(s) and not of MDPI and/or the editor(s). MDPI and/or the editor(s) disclaim responsibility for any injury to people or property resulting from any ideas, methods, instructions or products referred to in the content.

