Abstract
The hybridization of PSO for the Optimal Coordination of Directional Overcurrent Protection Relays (DOPR) of the IEEE bus system proposes a new method for coordinating directional overcurrent protection relays in power systems. The method combines the hybrid particle swarm optimization (HPSO) algorithm and a heuristic PSO algorithm to find the minimum total operating time of the directional overcurrent protection relays with speed and accuracy. The proposed method is tested on the IEEE 4-bus, 6-bus, and 8-bus systems, and the results are compared with those obtained using traditional coordination methods. The collected findings suggest that the proposed method may produce better coordination and faster operation of DOPRs than the previous methods, with an increase of up to 74.9% above the traditional technique. The hybridization of the PSO algorithm and heuristic PSO algorithm offers a promising approach to optimize power system protection.
1. Introduction
An electrical power system operates at numerous voltage stages; typically, a three-phase AC voltage source is generated at a few kV, which will be fed into a transmission line after being powered by a transformer. The transmission systems consist of multiple transformers that work on the step-up and step-down transmission. These transmission systems provide different types of voltage depending on the circumstances, such as 1100 kV, 400 kV, 220 kV, etc. The distance of the transmission power lines is thousands of miles, and this power is transferred through the AC grid and HVDC lines. In load centers, multistage step-down transformers lower voltage levels, and finally, power is supplied to the end user through a primarily radial distribution system (loop-less) in nature. The power supply system works on the principle of the synchronous mode of operation—this is its unique natural feature. This feature shows that the system’s electrical frequency remains unchanged regardless of weather conditions or environmental locations. Therefore, its protection is the core area of concern. The protection system’s primary function is to identify faults as soon as possible and isolate any damaged or failing sections to limit interference with the rest of the electrical system [1]. Therefore, the protection system must be reliable, which means it starts working when required, be secure (starts working with protection), be selective (a minimum number of devices should operate to avoid the cost called “selectivity”), and be as firm as needed. These are the basic requirements. Without these basic requirements, the protection system will be largely ineffective and may become liable. To promptly identify the malfunctioning section and restore service to all other areas, the DOPR system’s coordination for the power system’s protection is of utmost importance [2,3]. The overcurrent protection relay should be adequately coordinated because it can be in a ring or multiple networks, which needs to be figured out using metaheuristic optimization techniques [4,5,6,7].
Various approaches addressed the coordination issues with the overcurrent protection relay arrangement [8,9,10,11]. In specific methods, linear programming was utilized to find the optimal time multiplier setting (TMS), while the ideal plug setting (PS) and pickup current (ip) were preserved as known constants [12,13]. Moreover, mixed-integer non-linear programming was employed in some techniques, where the variables for the time multiplier setting (TMS) and plug setting (PS) are both present [14,15]. The genetic algorithm (GA), a metaheuristic evolutionary technique, has been employed extensively in power systems, including grounded grid simulation and optimal DOPR coordination problems [16,17,18,19]. Several qualities of the ideal DOPRs were given with the particle swarm optimization (PSO) algorithm [20,21,22]. In [23,24,25], when used with chaos theory, the firefly algorithm (FA) resolved the coordination problem and enhanced the quality of the solution. The differential evolution (DE) techniques were employed in [26,27] to identify the ideal TMS and optimize the relay arrangement. These optimization methods work best when the issue is straightforward. However, these optimization techniques require more computational time to explore and exploit the search space for the best solutions for a complex problem. Some computational problems are resolved by utilizing hybrid strategies, such as the one used in [28], to resolve the coordination problem, which combines a hybrid genetic algorithm with linear programming. The coordination problem of DOPRs is also solved using the hybrid PSO with the LP approach [29,30]. A hybrid teaching-learning-based optimization (TLBO) algorithm with the modified objective function is presented for the DOPR system [31]. The issue is presented as a mixed-integer non-linear programming (MINLP) problem in [32], where pickup currents that have already been established are used to decide the TMS of relays. Biogeography-based optimization (BBO) and the hybrid BBO with LP (BBO-LP) approach are suggested in [33] to solve the DOPR problem.
In summary, all of these optimization strategies work well for simple problems. Still, they require more computation time and reach convergence after more iterations for more complicated problems. A suitable analytical optimization technique can produce a high-quality solution suited for the adaptive protective coordination system of numerical DOPRs.
This paper uses a hybrid particle swarm optimization approach to present an adaptive protection coordination scheme for numerical DOPRs. The IEEE 4-bus, 6-bus, and 8-bus systems have all been examined to determine whether the proposed approach is better. Additionally, the optimized DOPR settings produced by HPSO are contrasted with the already implemented hybrid teaching–learning-based optimization (modified objective function) [31] and modified differential evolution (MDE) [26] for the IEEE 4-bus and IEEE 6-bus systems and biogeography-based optimization with linear programming [33] for the IEEE 4-bus and 8-bus system. The HPSO algorithm is also compared with the linear method, non-linear programming [34], seeker algorithm (SA) [32], firefly algorithm [23], mixed-integer linear programming method [MILP] [35], Modified Electromagnetic Field Optimization (MEFO) [36], hybrid genetic algorithm [28], and hybrid wolf optimization algorithm [3] for the IEEE 8-bus system. The motivation for using HPSO to coordinate the directional overcurrent protection relays is to optimize their settings and ensure they operate in a coordinated manner to minimize the impact of faults. The HPSO algorithm can find the optimal settings of the relays by searching for the minimum operating time for each relay while ensuring that the coordination requirements are met. Based on the findings mentioned above, the following benefits can be achieved using HPSO to coordinate the directional overcurrent protection relays: HPSO can find the optimal settings for the relays to ensure they operate in a coordinated manner, minimizing the impact of faults and reducing damage to equipment. HPSO can optimize the operating time of the relays, allowing faults to be detected and cleared more quickly, which can reduce the outage time for customers. By ensuring that the relays operate in a coordinated manner, the reliability of the electrical power system can be increased, which is essential for maintaining the supply of electricity to customers. Optimizing the relays’ settings can reduce the need for manual adjustments and maintenance, which can save time and reduce costs. Overall, the coordination of directional overcurrent protection relays using HPSO can improve the performance and reliability of electrical power systems, making it a valuable tool for protection engineers and system operators.
This paper uses particle swarm optimization and hybrid particle swarm optimization to test the DOPR problem on three benchmarks (IEEE 4, 6, and 8-bus systems). The remainder of the essay is structured as follows: The DOPR problem formulation is presented in Section 2. In Part 3, the HPSO algorithm is recalled. In Section 4, we explore parameter settings with statistical and graphical findings. Part 5 thoroughly compares the results, and Section 6 presents the conclusion.
2. Problem Formulating of DOPR
This study formulates the DOPR optimization coordination issue and calculates the total sum of the lowest operational times of the system relays for various points of failure [37,38].
2.1. Construction of Objective Function
The DOPRs must be coordinated to find the failure as quickly as possible. The plug setting (PS) and the time multiplier setting (TMS), in combination with the relay, are required to accomplish this objective. In this line of investigation, the PS of the relay is held constant, and a linear function represents the TMS of the relay; meanwhile, coordination can be formulated as linear programming. In linear programming, the TMS is the only parameter to change; the other parameters must remain constant. The purpose is to reduce the total execution time of all principal DOPRs as much as possible while adhering to several constraints outlined by an objective function (F).
where: is the weight of relays; for all the relays, the value is 1; is the number of relays and is the operating time of the primary relay [37]; the IEC (international electro-technical commission) standards of operating time are given in Equation (2).
where: is the relay operating time, is the time multiplier setting of relay; for the normal inverse type relay, α and are constant parameters that define the relay characteristic, and their values are α = 0.14 and k = 0.02, respectively [11]. The fault current flowing through the relays is denoted as . is the pickup current and the subscript denotes that the current corresponds to the relay. In general, the pickup current is a product of the plug setting (PS) and current transformer ratio (CTR), given in Equation (3).
2.2. Construction of Constraints
Due to coordination issues and relay operating time restrictions, restrictions should be implemented. While the PS is constant, the TMS can range from 0.1 to 1.2. Equation (4) lists the restrictions on the TMS relay arrangement.
Finding the fault in the shortest possible operational period is the main goal of the objective function of this study. Since the problem will be detected by both the primary and backup relays, coordination between these primary and backup relays must be performed by taking tripping action into account. The coordination time interval (CTI) plays a crucial part in this tripping process by deducting the time difference between a secondary and a primary relay. The interface between these two primary and secondary relays is the circuit breaker (CB), which offers a sufficient degree of safety. The primary relay should run first because the fault is in front of it, and the backup relay should operate for backup [39]. The equation for the CTI for the duration of operation of the primary and backup relays is displayed in Equation (5).
The value of the CTI could vary from 0.1 to 0.3 s depending on different circumstances and factors. The operating time of the primary and backup relays are given in Equations (6) and (7) [33].
The primary and backup relay of DOPR is denoted as p and q, respectively.
3. HPSO Algorithm for DOPR Estimation
This study is a hybridization of PSO that combines particle swarm optimization (PSO) with simulated annealing (SA) (PSO-SA). The PSO algorithm draws inspiration from navigation and flocks of birds or schools of fish. The PSO approach is utilized in this study to determine how quickly a DOPR coordination issue may be identified and fixed. The PSO uses the provided population to determine the best individual and global location. The personal best is abbreviated as “”, and the global best is abbreviated as “” [40]. Each group member moves at a beginning velocity to discover the optimal solution from the provided population. It moves into what is referred to as the starting posture. The new position and velocity are updated using the person’s former position as a starting point. The PSO processes are therefore repeated until the lowest value of the individual and collective best is realized. The steps to finding the minimum solution are as follows.
The initial position of the particle is given in Equation (8). Where, and Are the maximum and minimum bound of the variable with number of iterations, and Denotes the random number whose value varies from 0 to 1.
The fitness of a given position is computed by using Equation (9). Furthermore, the personal best of the given solution is .
The minimum value of the global best is achieved from the solution of the personal best given in Equation (11).
Equations (12) and (13) are for the updating of velocity and position.
where: ω is the inertia, whose value varies from 0.1 to 0.9; () are the acceleration factors, and their value varies around 2; and , are the random values from 0 to 1. For any specified objective function, Equations (10) and (11) for personal best and global best are achieved after updating the velocity and position of Equations (12) and (13). These equations keep updating until the desired value is gained and a stopping criterion is met.
For the hybridization of PSO, simulated annealing removes the local optimum. Simulated annealing (SA) was first proposed by Kirkpatrick [41] and depended on the annealing process in the metallurgy field. Annealing is a process that usually happens in metals that heat a metal, and after that, metals are slowly cooled to make them reach a state of low energy where they cannot break. This algorithm is based on good and bad moves; a good move is addressed after passing through the probability function in Equation (14). The bad move undergoes from Equation (15) until the local optima are removed from a specific objective function. Therefore, SA improves the global best and removes the local optima. In this research of HPSO, SA uses the global best of PSO as a previous solution, and the new solution is obtained after comparing with this.
Equation (14) defines the probability function that is an exponent of the difference between the previous and new solutions, denoted as D or Delta and the temperature T.
The minimum solution passes through the probability equation; if the solution was not desirable, it would undergo the inequality given in Equation (15).
The basic parameters of SA are initial temperature and cooling factor, where r is a random number between 0 and 1. As previously mentioned, Delta distinguishes between old and new solutions. The local optimum solution is thus reached after passing Equation (14) when the Delta is less than 0. However, if it is greater than 0, Equation (15) will be applied until the local optimum is reached and the best solution is provided globally.
After passing through Equations (14) and (15), the solution undergoes the temperature cooling given in Equation (16), where is the new temperature, α is the cooling factor, and the previous temperature is . The initial temperature () is 1, and the cooling factor (α) is 0.99. All the benchmarks of IEEE case studies in this research have been simulated using these parameters.
After processing the PSO-SA algorithm, the simulation results justify that obtained results are better than other state-of-the-art algorithms. The stepwise flow chart with complete parameters description is shown in Figure 1, and the pseudocode of the HPSO algorithm is given in the algorithm below.
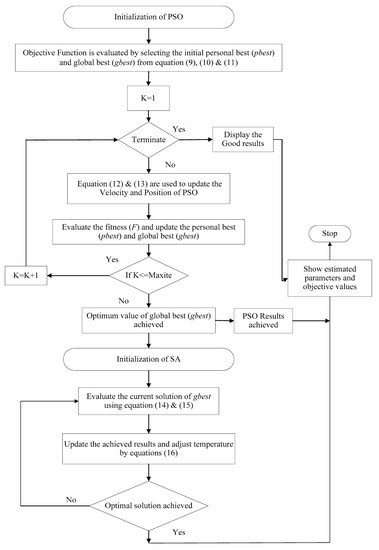
Figure 1.
Flow chart of the HPSO.
The pseudocode of the proposed HPSO algorithm is reported as follows:
Pseudocode of hybrid particle swarm optimization (HPSO)
- Step 1: Initialization of the basic parameters, (Random value), (Inertia), (Acceleration Factor), T0 (Initial temperature) and α (Cooling Factor).
- Step 1.1: Initialize the generating system inside the boundary conditions of the parameters.
- Step 1.2: The initial results are obtained by evaluating the objective function with Equation (9). is obtained from the function, while is its minimum value.
- Step 2: This step is included in the iteration cycle until the required results are obtained.
- Step 2.1: Equations (12) and (13) update particle position and velocity within predetermined boundary boundaries.
- Step 2.2: and results are obtained using Equations (10) and (11).
- Step 2.3: After obtaining the as the first solution, SA is initiated here.
- Step 2.4: Function for the new solution defined concerning the previous solution.
- Step 2.5: After analyzing the previous answer, a new one is developed.
- Step 2.6: The solution is deemed satisfactory if the difference between the old and new solutions is less than 0, given in Equation (14).
- Step 2.7: If Equation (15) is not satisfied by Step 2.6, use it until it is.
- Step 2.8: The new solution is obtained from the objective function.
- Step 2.9: Update the temperature following Equation (16).
- Step 2.10: Continue Step 2 until the stopping requirement is satisfied.
- Step 3: Display the best solution, objective values, and estimated parameters.
4. Simulation Results of IEEE Bus Systems
This section presents the findings from various IEEE bus system scenarios that used PSO and HPSO. In IEEE 4-bus, 6-bus, and 8-bus systems, a detailed result of TMS employing PSO and HPSO is discussed. The objective function is contrasted with the methodologies stated in the literature [3,23,26,28,31,32,33,34,35,36]. The findings demonstrated that HPSO is more effective in quickly locating the fault than other state-of-the-art techniques.
4.1. IEEE 4-Bus System
Figure 2 depicts a single-line power distribution system diagram with four buses, two generators, eight overcurrent protection relays, and four lines. Comprehensive information regarding the CTR and the relationship between primary and secondary can be found in [31,33]. The four directional overcurrent relays are labeled as R1 to R8. The TMS lower and upper boundaries are set to 0.1 and 1.1, respectively, with PS remaining constant at 1.5. The value of the coordination time interface is 0.3 s. (CTI). All these characteristics and information from [31,33] are used to simulate the suggested method code in MATLAB. The optimized TMS of the proposed PSO and HPSO is shown in Table 1. The operating time of the primary relays for the optimized values of TMS is given in Table 2, and the operating time of the backup relays for the optimized value of TMS is given in Table 3. Table 4 displays the comparison analysis with other techniques. The suggested HPSO has exceptional exploration capability and quickness compared to other metaheuristic techniques. This feature displays that finding optimal solutions using HPSO is more selective than other evolutionary algorithms. The proposed algorithm HPSO offers an optimal solution after controlling the local optimum and provides a lower total operating time.
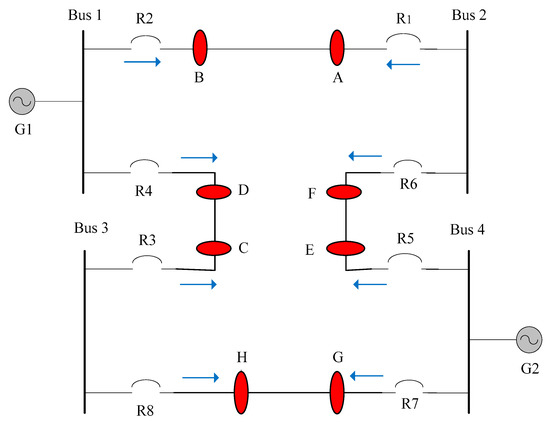
Figure 2.
IEEE 4-bus system.

Table 1.
Optimized PSO and HPSO TMS of IEEE 4-bus system.
Table 2.
Operating time for primary relays to achieve TMS optimization of IEEE 4-bus system.
Table 3.
Operating time for backup relays to achieve TMS optimization of IEEE 4-bus system.
Table 4.
PSO and HPSO in comparison to other methods (IEEE 4-Bus).
The coordination time interval (CTI) relation between relays is shown in Figure 3 and Figure 4, and the optimized net gain achieved against BBO, TLBO, and MDE is shown in Figure 5. The result shows that HPSO is better than the other methods described in the literature. The comparative results show the superiority and advantages of HPSO over the other algorithms [26,31,33]. The convergence graph in Figure 6 shows that the simulation results of the IEEE-4 bus converge in fewer iterations and less operating time.
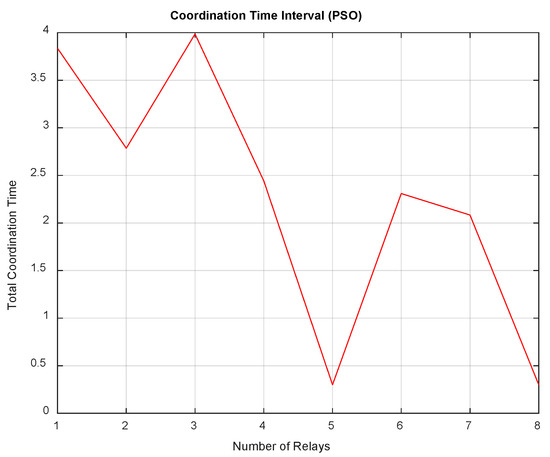
Figure 3.
CTI of PSO for the IEEE 4-bus system.

Figure 4.
CTI of HPSO for the IEEE 4-bus system.
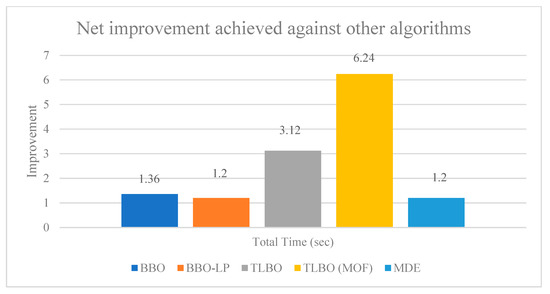
Figure 5.
Comparison of HPSO’s net improvement to other algorithms (IEEE 4-Bus system).
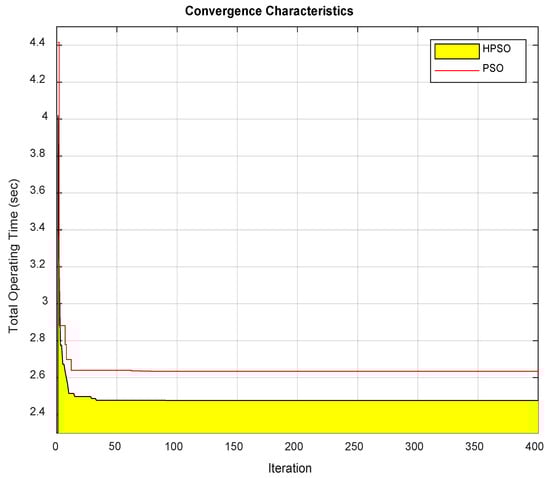
Figure 6.
Convergence characteristic graph of IEEE 4-Bus System.
4.2. IEEE 6-Bus System
A power distribution system with fourteen overcurrent protection relays with fourteen fault points, six buses, and four generators is shown in Figure 7. Fourteen directional overcurrent relays and fourteen fault points are denoted as R1 to R14 and A to N, respectively. Table 5 and Table 6 show the current transformer ratio (CTR) between the relays and the fault current seen between primary and backup relays, respectively. The value of PS is kept constant at 1.5, and the TMS lower and upper bounds are set to 0.1 and 1.1, respectively. The decision variables, in this case, are fourteen from TMS1 to TMS14. The coordination time interface (CTI) value is 0.2 s. After simulating all the parameters, the optimized TMS is obtained. Table 7 displays the results of the proposed PSO and HPSO techniques. Table 8 lists the operating times for the primary relays for the optimized TMS values, whereas Table 9 lists the operating times for the backup relays for the optimal TMS values. Figure 8 and Figure 9 illustrate the relay coordination time interval of the primary and backup relays.
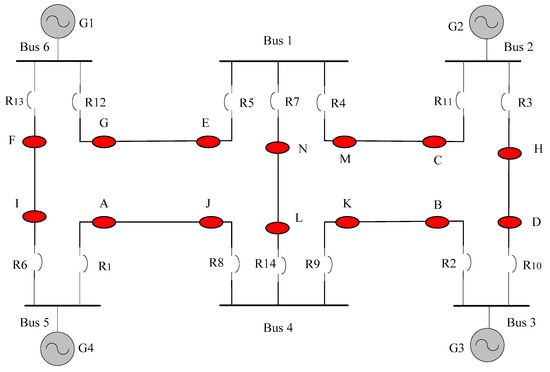
Figure 7.
IEEE 6-bus system.
Table 5.
CTR of the relay for the IEEE 6-bus system.
Table 6.
Fault currents are seen through the primary and backup relays of the IEEE 6-bus system.
Table 7.
Optimized PSO and HPSO TMS of IEEE 6-bus system.
Table 8.
Operating time for primary relays to achieve TMS optimization of IEEE 6-bus system.
Table 9.
Operating time for backup relays to achieve TMS optimization of IEEE 6-bus system.
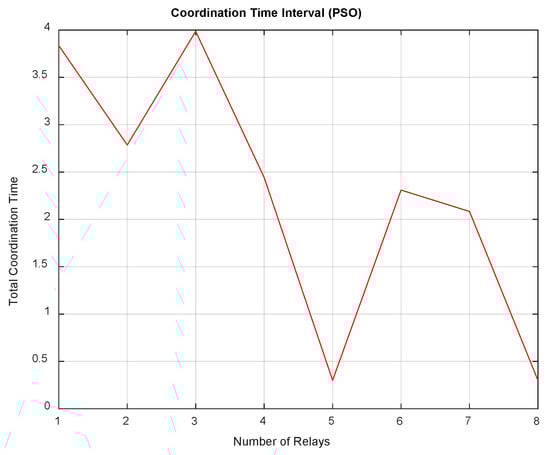
Figure 8.
CTI of PSO for the IEEE 6-bus system.
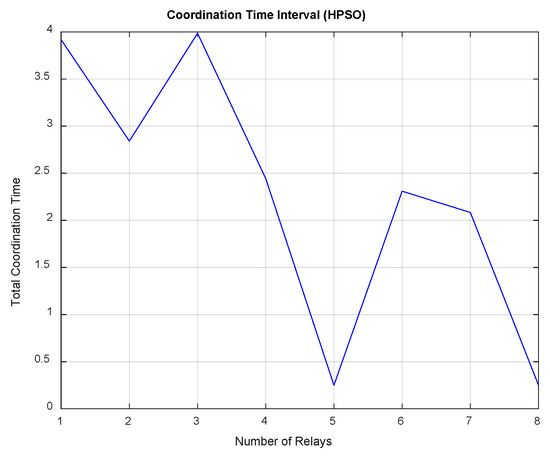
Figure 9.
CTI of HPSO for the IEEE 6-bus system.
The comparison of the suggested technique with other strategies is shown in Table 10. Performance-wise, the proposed HPSO method outperforms the TLBO, TLBO (MOF), and MDE methods. The suggested technique combines SA absorption and PSO exploration to identify the best global solution without becoming entangled in local optima. Comparing the recommended HPSO to other metaheuristic methods, it has superior exploration capability and speed. Compared to different metaheuristic algorithms, HPSO has the advantage of being more selective while looking for the best answers. The overcurrent relay problem converges more quickly and effectively, and the TMS results produced after convergence meet all the requirements. Figure 10 displays the graphical representation of the net gain against the TLBO and MDE algorithms. Comparing the proposed algorithm with a previously published algorithm shows that HPSO is superior to the other approach and has advantages over it [26,31]. Figure 11 displays the convergence characteristics graph.
Table 10.
PSO and HPSO in comparison to other methods (IEEE 6-Bus).
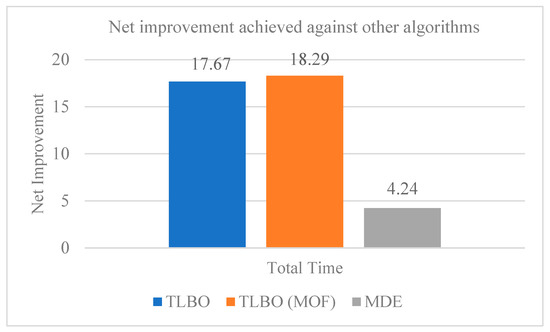
Figure 10.
Comparison of HPSO’s net improvement to other algorithms (IEEE 6-Bus system).
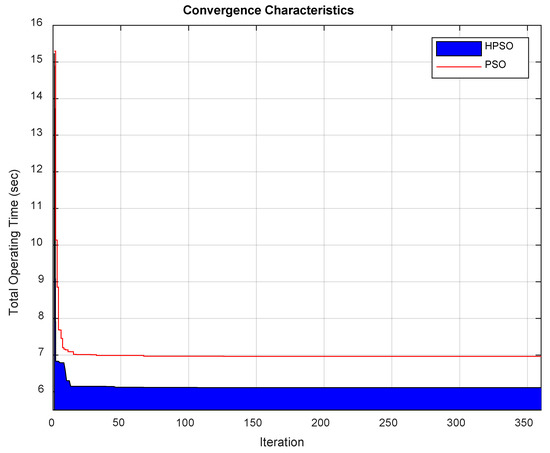
Figure 11.
Convergence characteristic graph (IEEE 6-Bus System).
4.3. IEEE 8-Bus System
Figure 12 depicts a single-line power distribution system diagram with six buses, two generators, two transformers, fourteen overcurrent protection relays, and fourteen failure sites. R1 to R14 and A to N represent the fourteen directional overcurrent relays and the fourteen fault sites. Table 11 provides the current transformer (CT) ratio between various relays. Table 12 shows the connection between primary and backup relays and their fault currents. The TMS lower and upper limits are set to 0.1 and 1.2, respectively, while the PS is maintained at 2.5. In this instance, there are fourteen decision variables, numbered TMS1 through to TMS14. The value of the coordination time interface (CTI) is 0.2 s. The optimum TMS of the proposed PSO and HPSO is achieved by exposing these parameters to MATLAB code, as shown in Table 13. Table 14 and Table 15 show the completed operating time of the primary and backup relays from the optimized value of TMS.
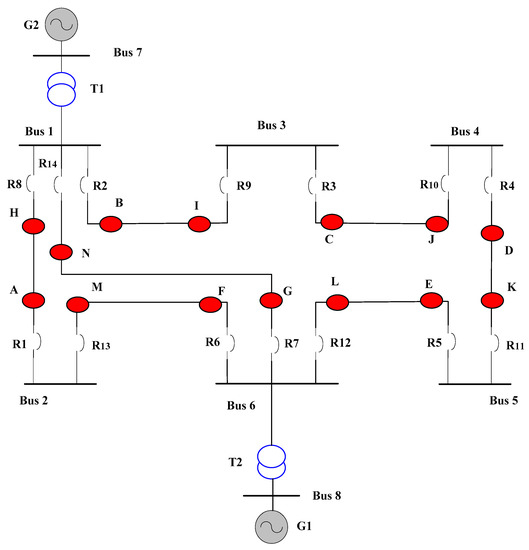
Figure 12.
IEEE 8-bus system.
Table 11.
CT ratios of the relay (IEEE 8-bus system).
Table 12.
Relationships between primary and backup relays and fault currents (IEEE 8-bus).
Table 13.
Optimized TMS of PSO and HPSO (IEEE 8-Bus).
Table 14.
Operating time of primary relays for the optimized value of TMS.
Table 15.
Operating time of backup relays for the optimized value of TMS.
According to Table 16, the proposed HPSO method outperforms existing state-of-the-art approaches. Using the SA method, the suggested technique addressed the drawbacks of the random initial solution, which assisted in determining the best solution for each subcarrier and decreased the overall operation time. The coordination time interval of the PSO and HPSO is shown in Figure 13 and Figure 14, which shows it satisfies the primary and backup relation and gives a positive result. Figure 15 illustrates the overall net gain against the LM, NLP, GA, HGA-LP, BBO-LP, MEFO, SA, FA, MILP, WOA, and HWOA algorithms graphically. The HPSO traces the defect in the shortest amount of time, as evidenced by the better net gain of convergence in time amongst all these stated methods. Figure 16 displays a MATLAB simulation of the objective function (F) with the estimated constraints.
Table 16.
PSO and HPSO in comparison to other methods (IEEE 8-Bus).
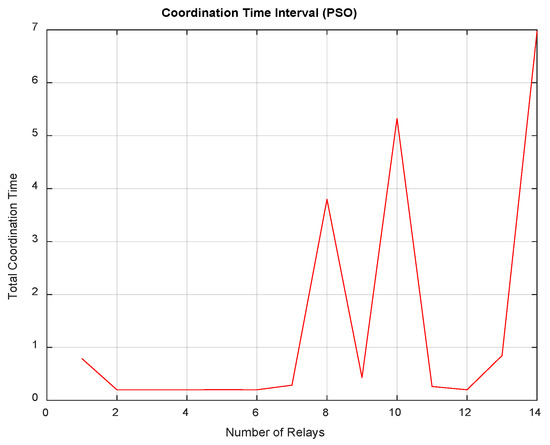
Figure 13.
CTI of PSO for the IEEE 8-bus system.
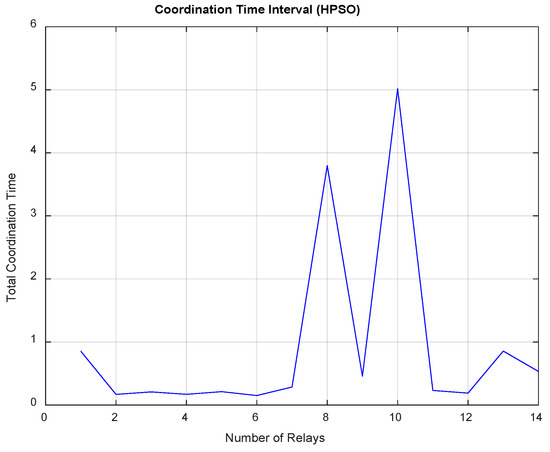
Figure 14.
CTI of HPSO for the IEEE 8-bus system.
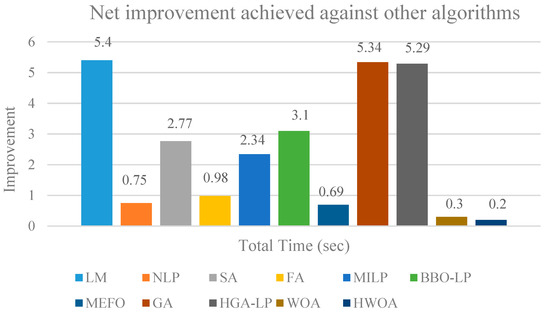
Figure 15.
Comparison of HPSO’s net improvement to other algorithms (IEEE 8-Bus system).
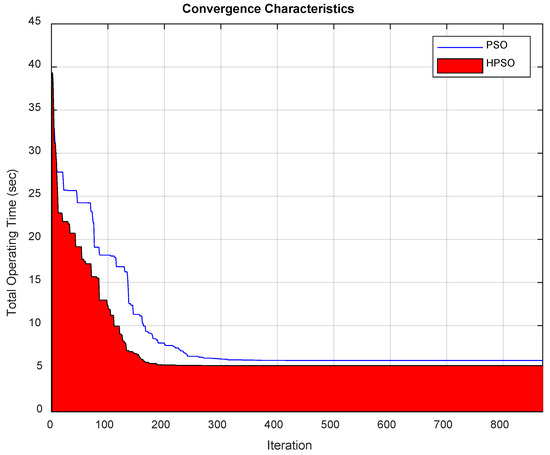
Figure 16.
Convergence characteristic graph (IEEE 8-Bus System).
5. Comparison Results Analysis
PSO and HPSO algorithms were simulated for the DOPR problem of the benchmark 4-bus, 6-bus, and 8-bus systems, and the results are compared with the literature [3,23,26,28,31,32,33,34,35,36]. The proposed algorithm was the best choice for eliminating the problem in the directional overcurrent relay in the minimum operating time. The results confirm that HPSO has a superior fault-finding ability and convergence rate compared to other optimization techniques. This study reviewed three IEEE case studies, and all the case studies were compared with evolutionary optimization algorithms such as LM, NLP, SA, GA, SM, WOA, HWOA, TLBO, TLBO (MOF), MDE, MINLP, GA, FA, MPSO, MEFO, MILP, BBO-LP, and HGA-LP. A comparison of the proposed HPSO with all the techniques discussed in the literature confirms that the proposed algorithm is the best among all these algorithms. The same boundary conditions and parameters are used to compare the other methods accurately. The net gain in terms of less computational time is shown in Figure 5, Figure 10 and Figure 15, which shows that the convergence time of HPSO is less than that of all other algorithms. For the IEEE 4-bus system, considering the net gain of 1.2 s, compared to MDE algorithms, 1.36 s and 1.2 s is obtained for the BBO and BBO-LP algorithm, and 3.12 s and 6.24 s for the TLBO and TLBO (MOF) algorithms, respectively. In terms of percentage, there was a 32.5% improvement observed in the MDE, 35.3% in the BBO, 32.52% in the BBO-LP, 54.49% in the TLBO, and 71.5% in the TLBO (MOF) algorithms. For the IEEE 6-bus system, a net gain of 4.24 s was achieved for MDE, and 17.67 s and 18.29 s was obtained for TLBO and TLBO (MOF), which means 40.2%, 74.28%, and 74.9% improvements were achieved in the results. In the IEEE 8-bus system, the HPSO yields a high net gain over LM, NLP, SA, FA, MILP, BBO-LP, MEFO, GA, HGA-LP, WOA, and HWOA: 5.4 s, 0.75 s, 2.77 s, 0.98 s, 2.34 s. 3.1 s, 0.69 s, 5.34 s, 5.29 s, 0.3 s, and 0.2 s, respectively. In this case, a good improvement in performance was 48.8% in the LM, 11.63% in the NLP, 32.77% in the SA, 14.75% in the FA, 29.23% in the MILP, 35.29% in the BBO-LP, 10.76% in the MEFO, 48.5% in the GA, 48.26% in the HGA-LP, 4.83% in the WOA, and 3.26% in the HWOA. Net gain shows how quickly HPSO detects problems in seconds and percentages. The IEEE convergence diagram for three cases shows that the convergence is fast, and a good solution is achieved at low repetitions. The optimal configurations of PSO and HPSO in MATLAB were determined by running the program 100 times and noting the results. It was discovered that the outcomes were similar and had no standard deviation. These results are evaluated on all three bus systems, including 4-buses, 6-buses, and 8-buses. A thorough analysis shows that the proposed method is superior to the recently published literature regarding solution quality, convergence, and reduction of the objective function to optimum value. In summary, the hybrid particle swarm optimization-simulated annealing (HPSO) algorithm combines the strengths of PSO and SA to provide an efficient and effective optimization approach. HPSO can converge faster and more accurately than other algorithms. The SA component of the hybrid algorithm allows for a more thorough exploration of the search space and helps to escape local optima, which can be a problem for PSO. HPSO can provide higher-quality solutions than other algorithms. The SA component of the algorithm can fine-tune the solution found by PSO and improve its accuracy. That is particularly important for complex optimization problems with a large search space, and the optimal solution is difficult. HPSO is more robust than other algorithms. The SA component of the algorithm can handle non-linear and non-continuous functions, which can be problematic for PSO. Because of this, HPSO can handle a wider variety of optimization issues, such as those in power systems engineering. PSO is limited to one objective, but HPSO can handle numerous objectives. The SA component of the algorithm can assist in determining the best solution for each objective, enabling a more thorough optimization strategy. HPSO is appropriate for challenging engineering issues since it is scalable and can handle large-scale optimization issues. Due to its dependency on the size of the swarm, PSO might have difficulty handling bigger issues.
The HPSO algorithm offers several advantages, including improved convergence, solution quality, robustness, handling multiple objectives, and scalability. These advantages make HPSO a promising optimization technique for various engineering problems.
6. Conclusions
In this article, metaheuristic algorithms such as PSO and the hybridization of PSO algorithms have been proposed. The hybridization of PSO is implemented with the help of simulated annealing (SA) to find the global solution. SA was used in the proposed algorithm as a local search operator around selected search agents to find the best solution in the neighborhood after each PSO iteration. The DOPR optimal coordination problem has been expressed as a mixed-integer non-linear programming problem. DOPR problems are solved using various test systems’ PSO and HPSO algorithms. The performance of the HPSO algorithm has been determined and tested in various IEEE single-line power distribution systems with analysis of its dominance over published methods, such as the GA, SM, WOA, HWOA, TLBO, CGA, FA, MEFO, MILP, BBO-LP, and HGA-LP methods. Three benchmark case studies of IEEE are proposed, which include a 4-bus, 6-bus, and 8-bus system. The results obtained against each case study show that the proposed technique is better than the other state-of-the-art techniques.
Author Contributions
Y.W., K.H., A.W. and S.K. contributed equally to the literature review of the directional overcurrent protection relay, then developed the first discussions about the different parameters of the proposed methodology and conducted the simulations and analysis of results together with K.H., A.W. and K.H. gives the investigation and supervised this work. S.K. gave suggestions and guidance for the research. All authors have read and agreed to the published version of the manuscript.
Funding
This research received no external funding.
Data Availability Statement
The data used to support the finding of this study are included within the article.
Conflicts of Interest
The authors declare no conflict of interest.
References
- Alam, M.; Chakrabarti, S.; Pradhan, A. Protection of Networked Microgrids Using Relays with Multiple Setting Groups. IEEE Trans. Ind. Inform. 2022, 18, 311–320. [Google Scholar]
- Shih, M.Y.; Enríquez, A.C.; Martín, L.; Trevi, T. Online coordination of directional overcurrent relays: Performance evaluation among optimization algorithms. Electr. Power Syst. Res. 2014, 110, 122–132. [Google Scholar]
- Irfan, M.; Wadood, A.; Khurshaid, T.; Khan, B.M.; Kim, K.; Rhee, S.B. An Optimised Adaptive Protection Scheme for Numerical and Directional Overcurrent Relay Coordination Using Harris Hawk Optimization. Energies 2021, 14, 5603. [Google Scholar]
- Albrecht, R.E.; Nisja, M.J.; Feero, W.E.; Rockefeller, G.D.; Wagner, C.L. Digital computer protective device coordination program I-general program description. IEEE Trans. Power App. Syst, Apr. 1964, 83, 402–410. [Google Scholar]
- Urdaneta, A.J.; Nadira, R.; Jimenez, L.G.P. Optimal coordination of directional overcurrent relays in interconnected power systems. IEEE Trans. Power Del. 1988, 3, 903–911. [Google Scholar] [CrossRef]
- Jenkins, L.; Khincha, H.P.; Shivakumar, S.; Dash, P.K. An application of functional dependencies to the topological analysis of protection schemes. IEEE Trans. Power Del. 1992, 7, 77–83. [Google Scholar]
- Sevkli, M.; Guner, A.R. A continuous particle swarm optimization algorithm for uncapacitated facility location problem. In Ant Colony Optimization and Swarm Intelligence; Springer: Berlin/Heidelberg, Germany, 2006. [Google Scholar]
- Singh, M.; Panigrahi, B.K.; Abhyankar, A.R.; Das, S. Optimal coordination of directional over-current relays using informative differential evolution algorithm. J. Comput. Sci. 2014, 5, 269–276. [Google Scholar]
- Bukhari, S.B.A.; Mehmood, K.K.; Wadood, A.; Park, H. Intelligent Islanding Detection of Microgrids Using Long Short-Term Memory Networks. Energies 2021, 14, 18–28. [Google Scholar]
- Haider, Z.M.; Mehmood, K.K.; Khan, S.U.; Khan, M.O.; Wadood, A.; Rhee, S.B. Optimal Management of a Distribution Feeder during Contingency and Overload Conditions by Harnessing the Flexibility of Smart Loads. IEEE Access 2021, 9, 40124–40139. [Google Scholar]
- Mosavi, S.M.A.; Kejani, T.A.; Javadi, H. Optimal setting of directional over-current relays in distribution networks considering transient stability. Int. Trans. Elect. Energy Syst. 2016, 26, 122–133. [Google Scholar]
- Chattopadhyay, B.; Sachdev, M.S.; Sidhu, T.S. An online relay coordination algorithm for adaptive protection using linear programming technique. IEEE Trans. Power Deliv. 1996, 11, 165–173. [Google Scholar] [CrossRef]
- Urdaneta, A.J.; Perez, L.G.; Restrepo, H. Optimal coordination of directional overcurrent relay considering dynamic changes in the network topology. IEEE Trans. Power Deliv. 1997, 12, 1458–1464. [Google Scholar] [CrossRef]
- Wadood, A.; Kim, C.-H.; Farkoush, S.G.; Rhee, S.B. An Adaptive Protective Coordination Scheme for Distribution System Using Digital Overcurrent Relays. In Proceedings of the Korean Institute of Illuminating and Electrical Installation Engineers, Gangwon, Korea, 30 August 2017; pp. 53–58. [Google Scholar]
- Abhyaneh, H.A.; Al-Dabbagh, M.; Karegar, H.K.; Sadeghi, S.H.H.; Khan, R.A.J. A new optimal approach for coordination of directional overcurrent relays in interconnected power system. IEEE Trans. Power Deliv. 2003, 18, 430–435. [Google Scholar]
- Farkoush, S.G.; Khurshaid, T.; Wadood, A.; Kim, C.-H.; Kharal, K.H.; Kim, K.-H.; Cho, N.; Rhee, S.-B. investigation and optimization of grounding grid based on the lightning response using ATP-EMTP and genetic algorithm. Complexity 2018, 2018, 8261413. [Google Scholar]
- Moravej, Z.; Adelnia, F.; Abbasi, F. Optimal coordination of directional overcurrent relays using NSGA-II. Electr. Power Syst. Res. 2015, 119, 228–236. [Google Scholar] [CrossRef]
- Bedekar, P.P.; Bhide, S.R. Optimum coordination of overcurrent relay timing using continuous genetic algorithm. Expert Syst. Appl. 2011, 38, 11286–11292. [Google Scholar]
- Razavi, F.; Abyaneh, H.A.; Al-Dabbagh, M.; Mohammadi, R.; Torkaman, H. A new comprehensive genetic algorithm method for optimal overcurrent relay coordination. Electr. Power Syst. Res. 2008, 78, 713–720. [Google Scholar]
- Wadood, A.; Kim, C.-H.; Khurshiad, T.; Farkoush, S.G.; Rhee, S.-B. Application of a tenuous particle swarm optimization (CPSO) for the optimal coordination of overcurrent relays considering a penalty method. Energies 2018, 11, 869. [Google Scholar] [CrossRef]
- Khurshaid, T.; Wadood, A.; Farkoush, S.G.; Kim, C.-H.; Cho, N.; Rhee, S.-B. Modified particle swarm optimizer to optimize time dial settings for directional overcurrent relay coordination. J. Elect. Eng. Technol. 2019, 14, 55–68. [Google Scholar]
- Park, J.B.; Lee, K.S.; Shin, J.R.; Lee, K.Y. A Particle swarm optimization for economic dispatch with non-smooth cost functions. IEEE Trans. Power Syst. 2005, 20, 34–42. [Google Scholar] [CrossRef]
- Sulaiman, M.; Waseem; Muhammad, S.; Khan, A. Improved solutions for the optimal coordination of DOCRs using firefly algorithm. Complexity 2018, 2018, 7039790. [Google Scholar]
- Gokhale, S.S.; Kale, V.S. An application of a tent map initiated Chaotic Firefly algorithm for optimal overcurrent relay coordination. Int. J. Electr. Power Energy Syst. 2016, 78, 336–342. [Google Scholar] [CrossRef]
- Khurshaid, T.; Wadood, A.; Farkoush, S.G.; Kim, C.H.; Yu, J.; Rhee, S.B. Improved firefly algorithm for the optimal coordination of directional overcurrent relays. IEEE Access 2019, 7, 78503–78514. [Google Scholar] [CrossRef]
- Thangaraj, R.; Pant, M.; Deep, K. Optimal coordination of overcurrent relays using modified differential evolution algorithms. Eng. Appl. Artif. Intell. 2010, 23, 9–20. [Google Scholar]
- Chelliah, T.R.; Thangaraj, R.; Allamsetty, S.; Pant, M. Coordination of directional overcurrent relays using opposition based chaotic differential evolution algorithm. Int. J. Electr. Power Energy Syst. 2014, 55, 341–350. [Google Scholar] [CrossRef]
- Noghabi, A.S.; Sadeh, J.; Mashhadi, H.R. Considering different network topologies in optimal overcurrent relay coordination using a hybrid GA. IEEE Trans. Power Del. 2009, 24, 1857–1863. [Google Scholar] [CrossRef]
- Yang, M.T.; Liu, A. Applying hybrid PSO to optimize directional overcurrent relay coordination in different network topologies. J. Appl. Math. 2013, 2013, 20131–20139. [Google Scholar] [CrossRef]
- Ghanbari, M.; Gandomkar, M.; Nikoukar, J. Protection Coordination of Bidirectional Overcurrent Relay Using Developed Particle Swarm Optimization Approach Considering Distribution Generation Penetration and Fault Current Limiter Placement. IEEE Can. J. Electr. Comput. Eng. 2021, 44. [Google Scholar]
- Singh, M.; Panigrahi, B.K.; Abhyankar, A.R.; Das, S. Optimal coordination of directional over-current relays using teaching. learning-based optimization (TLBO) algorithm. Int. J. Electr. Power Energy Syst. 2013, 50, 33–41. [Google Scholar] [CrossRef]
- Amraee, T. Coordination of directional overcurrent relays using seeker algorithm. IEEE Trans. Power Deliv. 2012, 27, 1415–1422. [Google Scholar]
- Albasri, F.A.; Alroomi, A.R.; Talaq, J.H. Optimal coordination of directional overcurrent relays using biogeography-based optimization algorithms. IEEE Trans. Power Deliv. 2015, 30, 1810–1820. [Google Scholar] [CrossRef]
- Ezzeddine, M.; Kaczmarek, R.; Iftikhar, M.U. Coordination of directional overcurrent relays using a novel method to select their settings, IET Gener. Transmiss. Distrib. 2007, 5, 743–750. [Google Scholar] [CrossRef]
- Damchi, Y.; Dolatabadi, M.; Mashhadi, H.R.; Sadeh, J. MILP approach for optimal coordination of directional overcurrent relays in interconnected power systems. Electr. Power Syst. Res. 2018, 158, 267–274. [Google Scholar] [CrossRef]
- Bouchekara, H.R.E.H.; Zellagui, M.; Abido, M.A. Optimal coordination of directional overcurrent relays using a modified electromagnetic field optimization algorithm. Appl. Soft Comput. 2017, 54, 267–283. [Google Scholar] [CrossRef]
- Habib, K.; Lai, X.; Wadood, A.; Khan, S.; Wang, Y.; Xu, S. Hybridization of PSO for the Optimal Coordination of Directional Overcurrent Protection Relays. Electronics 2022, 11, 180. [Google Scholar] [CrossRef]
- Habib, K.; Lai, X.; Wadood, A.; Khan, S.; Wang, Y.; Xu, S. An improved technique of Hybridization of PSO for the Optimal Coordination of Directional Overcurrent Protection Relays of IEEE bus system. Energies 2022, 15, 3076. [Google Scholar] [CrossRef]
- Bedekar, P.P.; Bhide, S.R.; Kale, V.S. Optimum coordination of overcurrent relays in distribution system using the dual simplex method. In Proceedings of the 2009 2nd International Conference on Emerging Trends in Engineering and Technology (ICETET), Nagpur, India, 16–18 December 2009. [Google Scholar]
- Kennedy, J.; Eberhart, R. Particle Swarm Optimization. In Proceedings of the IEEE International Conference on Neural Networks, Perth, WA, Australia, 27 November–1 December 1995; Volume IV, pp. 1942–1948. [Google Scholar]
- Kirkpatrick, S.; Gellat, C.D.; Vecchi, M.P. Optimization by Simulated Annealing. Science 1983, 220, 671–680. [Google Scholar] [CrossRef]


Disclaimer/Publisher’s Note: The statements, opinions and data contained in all publications are solely those of the individual author(s) and contributor(s) and not of MDPI and/or the editor(s). MDPI and/or the editor(s) disclaim responsibility for any injury to people or property resulting from any ideas, methods, instructions or products referred to in the content. |
© 2023 by the authors. Licensee MDPI, Basel, Switzerland. This article is an open access article distributed under the terms and conditions of the Creative Commons Attribution (CC BY) license (https://creativecommons.org/licenses/by/4.0/).