Article

Numerical Study on Compact Design in Marine Urea-SCR Systems for Small Ship Applications

1
Graduate Program, Department of Energy and Mechanical Engineering, Gyeongsang National University, Tongyeong-si 53064, Republic of Korea
2
Revo Co., Ltd., Changwon-si 51150, Republic of Korea
3
Department of Smart Energy and Mechanical Engineering, Gyeongsang National University, Tongyeong-si 53064, Republic of Korea
*
Author to whom correspondence should be addressed.
Energies 2024, 17(1), 187; https://doi.org/10.3390/en17010187
Submission received: 3 December 2023 / Revised: 19 December 2023 / Accepted: 27 December 2023 / Published: 29 December 2023

Abstract

:
With increasingly stringent emissions legislation, such as that stipulated by the International Maritime Organization, for nitrogen oxide emission reduction in marine diesel engines, the imperative of curtailing nitrogen oxide emissions from marine diesel engines is intensifying. Consequently, the significance of aftertreatment technologies, including diesel particulate filters (DPFs) and selective catalytic reduction (SCR), is poised to grow substantially. In particular, a redesign is required to reduce the size of DPF and SCR systems for application in small ships. In this study, we varied the shape of the filters in DPF and SCR systems, aiming to achieve a distinct flow pattern and enable overall miniaturization. The performance metrics, including the nitric oxide (NO) reduction rate, NH3 slip rate, and pressure drop, of the redesigned models were compared with those of the conventional model. Computational fluid dynamics simulations were used to compare the performance of the redesigned model with that of the conventional model in terms of NO reduction and pressure drop. The redesigned system achieved a NO reduction rate of 6.9% below that of the conventional system, offering additional noteworthy benefits such as a 50% reduction in both pressure and overall length.

1. Introduction

Marine vessels play key roles in global trade and the economy due to their substantial carrying capacity, high safety, and low operating costs compared with other modes of transportation [1]. Before the development of commercial ships using carbon-free fuel-based power sources, diesel engines were the main power sources for vessels in the shipping industry. However, diesel engines emit greenhouse gases such as carbon dioxide (CO2), nitrogen oxide (NOx), sulfur oxide (SOx), and particulate matter (PM) [2]. According to an EU investigation [3], the contributions of shipping emissions to populational exposure to PM2.5, NOx, and SOx were 8%, 16.5%, and 11%, respectively. Therefore, the International Maritime Organization (IMO) regulates the curtailment of NOx emissions. Tier III regulations, which have been in effect since 2016, require an 80% reduction in NOx emissions compared with Tier I regulations [4]. Additionally, the sulfur content of fuel should be limited, as it can significantly increase SOx and PM emissions. According to SOx emission regulations, the sulfur content for fuel within emission control areas was limited to 0.1% in 2015, and the global value was limited to 0.5% in 2020 [5]. Recently, discussions were held on the definition, measurement, and control methods for black carbon, and it is expected that these will be regulated in the future [6]. To meet increasingly stringent emission regulations, emission abatement technologies, such as pre-, in-, and post-combustion treatment methods, can be used in marine diesel engines [7]. In pre-combustion treatment technologies, various clean fuels (including natural gas, hydrogen, ammonia, methanol, and bioethanol) that inherently generate fewer engine exhaust gases are used, and, if necessary, additives are added to the fuel [1,8,9,10,11,12]. Combustion optimization, water addition, and exhaust gas recirculation (EGR) have been adopted as treatment technologies for combustion [13,14,15,16,17,18]. Three technologies are widely used in post-combustion treatment, specifically, selective catalytic reduction (SCR), which can effectively reduce NOx emissions; diesel particulate filters (DPF), which are used to remove PM emissions; and scrubbers, which reduce SOx emissions [19,20,21,22,23,24].
To achieve compliance with IMO Tier III regulations for NOx emissions, NOx emission reduction technology based on engines, such as EGR, and after-treatment technology, such as SCR, are recommended. SCR in particular can achieve a NOx reduction rate of 80–90% and has been recognized as a standard method for satisfying regulatory requirements [7,24]. According to Kamil et al. [25], NOx emissions from cars in 27 European countries have been dramatically reduced. By contrast, NOx emissions from marine ships have been increasing slowly. The increasing NOx emissions in marine environments can be attributed to the increase in small ships and detailed IMO regulations (i.e., IMO Tier I, II, and III controls are not required for small ships with engines of less than 130 kW). Currently, there is no accurate information on NOx emissions produced by leisure boats. According to a recent study [26] on the modeling of leisure-boating activity and emissions in the Baltic Sea, however, the fuel consumption, NOx, and PM2.5 proportions of leisure boats compared with those of commercial vessels are 1.2%, 0.4%, and 2.7% greater, respectively. Considering that the number of leisure boat users has been increasing continuously since 2000 and is expected to continue increasing, this impact will become more severe [27]. Additionally, the impact of emissions from small ships differs by region and season. For example, in fish-producing areas, this impact is expected to be even more severe, because most small vessels are used to transport fish produced on land. The detailed regulations of the IMO MARPOR Annex VI limit NOx emissions from marine diesel engines with a power output of more than 130 kW. The exclusion of smaller ships from Tier III regulations contributes to the increase in NOx emissions. Recently, the US Environmental Protection Agency (EPA) implemented more stringent regulations than those stipulated by the IMO, extending the scope by dropping the lower bound of the range of regulated engine power from 130 kW to below 37 kW. This change essentially extends IMO tier III to small ships, further tightening NOx regulations. Moreover, DPFs are being used to remove PM from the exhaust gases of small ships [28].
In general, marine SCR systems are confined to a vessel’s engine room because the SCR reactor is located behind the engine turbocharger; a DPF should also be installed [29]. Therefore, SCR systems operate at high temperatures and pressures, increasing NOx removal efficiency. However, as the engine’s power and exhaust gas volume increase, the substantial size of conventional SCR systems poses challenges regarding installation in the engine room. In smaller ships, the space available to install after-treatment systems is narrow and significantly smaller. Even if these systems are installed, issues arise, such as a reduction in engine power due to the increase in back pressure. Therefore, there is a critical need to reduce back pressure and develop compact after-treatment systems for application in small ships.
Some studies [29,30,31,32,33,34] have involved developing methods for the miniaturization of an SCR system, including installing a mixer and a chamber, adjusting the chamber’s size, changing the direction of flow, and reducing the distance between the DPF and SCR by adding mixers and sleeves. Adding a mixer and a chamber can improve the uniformity of ammonia (NH3) on the catalyst and increase the residence time [30]. This increases the rate of NO reduction, and if a mixer and a chamber are installed, the size of the system can be reduced [31]. Adjusting the chamber size enables increasing the conversion rate of NH3 and reducing system pressure [32]. Changing the flow direction reduces system size and improves the NOx conversion rate by 60–70% [33]. The addition of a mixer and a sleeve between the DPF and SCR can further reduce system size and improve performance by promoting the urea decomposition reaction [34]. However, these studies did not compare the performance and sizes of conventional SCR systems.
In this study, we aimed to miniaturize an SCR system by varying the shape of the catalyst component and to compare the performance and size of the redesigned system with those of the original SCR system. The analysis conditions included redesigning the DPF and SCR systems, increasing the urea passage, varying the catalyst thickness in the SCR, and changing the shape of the urea passage component. To evaluate the performance of the system, the NO reduction rate, inlet/exit pressure drop, NH3 slip rate, and outlet isocyanic acid (HNCO) concentration were calculated. The NO reduction rate and pressure drop, in particular, are important parameters for evaluating SCR systems. NO reduction is the primary purpose of post-treatment systems, and the pressure drop affects combustion and engine performance [35,36]. However, few design studies have compared conventional and redesigned systems to reduce the overall length of DPF and SCR systems for application in small ships. Many researchers have considered the one-way flow of exhaust gases in the filters used by DPF and SCR systems. In the proposed redesigned systems, a technique was employed to reduce pressure drop and overall length by reconfiguring the flows of the DPF and SCR filters, enabling multidirectional rather than unidirectional flow. In this study, we build on these findings to propose a redesigned aftertreatment system that reduces the length of the conventional system while improving pressure drop performance. The effects of changes in system configuration on performance, including the NO reduction rate and pressure drop, were numerically investigated for four different redesigned models using a 3D computational fluid dynamics (CFD) program.

2. Numerical Conditions and Methods

2.1. Model Description

Figure 1 shows the shape of the physical model that was the subject of the numerical analysis in this study. A modified shape was used to achieve the non-conventional flow required to miniaturize the SCR system for marine diesel engines. The conventional model shown in Figure 1a was numerically modeled in a previous study by Sung et al. [31]. It consists of a urea–water solution (UWS) injector, a mixer, a mixing chamber, and an SCR system. A swirl mixer was installed after the UWS injector, and the mixing chamber was installed immediately before the mixer. Engine exhaust gases flow in the x-axis direction, pass through the catalyst, and exit through the outlet. The calculated results for the conventional model were experimentally verified under engine load conditions of 25%, 50%, 75%, and 100% for a 920 kW marine diesel engine that reaches maximum performance at 900 rpm [31]. At 75% engine load, the flow rate, temperature, and NO concentration of the exhaust gases were 5412 kg/h, 592 K, and 600 ppm, respectively. A comparison of the NO reduction rate results between the experiment and simulation according to the UWS injection ratio is shown in Figure 2. At an engine load of 75%, the UWS injection ratio was 1.154 (15.4% excess UWS). The NO concentrations at the outlet were 130 and 141 ppm in the experiment and simulation, respectively. As such, the NO reduction efficiencies of 87.2% and 91.7% estimated in the experiment and simulation, respectively, were slightly too high; the experimental error was 5.2%.
To compare the calculated results, the same SCR volume was considered for the analysis of the conventional model and all the cases in this study. Specifically, the performance of the proposed redesigned model was compared with that of the conventional model at an engine load of 75% [31]. As shown in Figure 1b, the SCR has a honeycomb structure with dimensions of 100 cpsi and 0.276 m3 (960 mm × 960 mm × 300 mm). The overall shape of the system differs between the conventional and redesigned models, but the equations, model constants, and boundary conditions applied to the turbulent flow, urea conversion reaction model, and DeNOx model are the same as those in the basic model. As shown in Figure 1b, the difference in system configuration compared to the conventional model is that the redesigned model is more compact so as to enable the consideration of both a DPF and SCR. The filter specifications of the DPF are identical to those of the SCR. As shown in Figure 1c, the DPF is installed behind the intake pipe. The exhaust gas flows through the intake pipe, passes through the DPF, and then flows up, down, left, and right. The exhaust gas exiting the DPF is mixed with the UWS sprayed at four locations and flowing onto the surface of the SCR along with the ammonia generated through a decomposition reaction. The DPF and SCR are installed inside the engine exhaust stream and mixing chamber. Unlike the x-axis flow in the existing model, the exhaust gas flows to the DPF inlet in four directions in the y–z plane: up, down, left, and right. The wall is located at the end of the DPF along the x-axis. Therefore, the exhaust gas does not pass through the x-axis but passes through the y–z plane. The mixing chamber can be either square or circular to suit the honeycomb DPF and SCR shapes. For UWS spraying, one specimen was applied to each corner of the square DPF.
Figure 3 shows a vertical cross-sectional view of the analytical conditions used in this study. The shape information for the four analysis models (Cases 1–4) is listed in Table 1. The conventional model shown in Figure 1a is Case 0. Case 1, presented in Figure 3a, uses a square mixing chamber with a square DPF. There are four UWS injectors at the corner of the DPF, located 0.28 m away from the front of the mixing chamber. The distance between the injector position and end surface of the SCR is 1.57 m, and the height is 1 m, whereas in a conventional SCR system, the distance from the injection point to the catalyst is 6.33 m. The distance between the injection and catalyst in Case 1 is 1.57 m, approximately 75% shorter than that of the conventional system. The grey wall between the DPF and SCR prevents the exhaust gas that enters through the inlet from escaping to the outlet without passing through the DPF and SCR, as shown in Figure 3. To improve flow uniformity, the DPF and SCR have a six-step design with a thickness of 190 mm. Case 2 is shown in Figure 3b. The parameters for Case 2 are the same as those for Case 1, except for the length and height, which are 3.38 and 1.25 m, respectively. The distance from the injector to the catalyst is 3.1 m, constituting a 50% reduction compared with the conventional system. As the size increases, the central wall expands. Case 3 is the same as Case 2 except that the thickness of the SCR is different from that in Case 2, as shown in Figure 3c. Compared to Case 2, the catalysts in stages 1, 2, 3, and 4 are thinner, and those in stages 5 and 6 are thicker. In Case 4, the mixing area shape was changed from square to circular, and the height was increased by 1.5 m compared to that of Case 3, as shown in Figure 3d. The conditions for all cases are listed in Table 1.
Because mesh independence is important in numerical studies, a mesh independence test for test cases for the three different grid configurations was performed for the velocity and NH3 concentration in Case 1, and the results are shown in Figure 4. The numbers of the grids in the three configurations were 700,000, 1,000,000, and 1,300,000. Figure 4a shows the locations where the line data for velocity and NH3 concentration were obtained. Figure 4b,c show the grid independence for the velocity and NH3 concentration, respectively. In the test case with 700,000 grids, the velocity distribution was lower than that of the test cases with 1,000,000 and 1,300,000 grids; conversely, the NH3 concentration was higher. For the test cases with 1,000,000 and 1,300,000 grids, similar values were observed for the velocity distribution and NH3 concentration. On this basis, a configuration of 1,000,000 grids was selected for Case 1 in this study. Figure 4d–f show mesh generation for the test cases of 700,000, 1,000,000, and 1,300,000 grids, respectively. Therefore, the 1,000,000 grids configuration was used in all four of the numerical models (Cases 1–4) examined in this study. The meshes for Cases 2–4 were generated similarly to the mesh applied to Case 1 and used 1,620,000, 1,800,000, and 1,810,000 grid configurations, respectively.

2.2. Numerical Models and Numerical Methods

2.2.1. Governing Equation

The CFD simulation models and boundary conditions were based on those of a conventional SCR system [31]. CFD simulations were performed using a commercial CFD software tool (ANSYS Fluent 2022 R2), to predict the performance of the DPF and SCR systems. The Naiver–Stokes equation was used to calculate the three-dimensional flow. The standard k-ε turbulent model was used in the CFD analysis because of its high convergence and low computational load [37]. The general governing equations are as follows.
Conservation of mass equation:
ρ u = 0
Momentum equation:
· ρ u u = ρ + · τ ̿ + F
Energy equation:
ρ u T = k c P 2 T + μ Φ + q
The standard k ε model equations:
( ρ k ) t + x i ρ k u i = x j μ + μ t σ k k x j + G k ρ ε
( ρ ε ) t + x i ρ ε u i = x i μ + μ t σ k k x j + C 1 ε C 2 ε ρ ε 2 k
The turbulent viscosity equation, computed using k and ε :
μ = C μ ρ k 2 ε
The model constants have the following default values:
C 1 ε = 1.44 ,   C 2 ε = 1.92 ,   C μ = 0.09 ,   σ k = 1.0 ,   σ ε = 1.3

2.2.2. Porous Media Model

The DPF and SCR catalysts both consisted of a honeycomb-type filter, a porous medium; therefore, the porous media model was selected. Darcy’s law describes the flow through a porous medium, and the pressure drop is defined by a combination of Darcy’s law and additional loss.
p = μ α v + C 2 1 2 ρ v 2 m
p = 2.73 v 2 199.72 v
Here, ∆p is the pressure drop, μ is the dynamic viscosity, α is the permeability of the media, C2 is the inertial resistance factor, v is the velocity with respect to the porous face, and ∆m is the thickness of the porous media. The DPF and SCR filters have the same viscous resistance factors. The values of 1/α and C2 were 1.1237 × 10⁷ 1/m2 and 3.718 1/m, respectively, as selected by Park et al. [38].

2.2.3. Urea Spray Model and Reaction Model

In this simulation, the UWS was modeled using a discrete phase model (DPM). The injector type was a solid cone 0.45 mm in diameter, the UWS was a mixture of urea (40%) and water (60%), the injection angle was 140°, the velocity was 10.6 m/s, and the Rosin–Rammler distribution was applied for diameter distribution. The mean diameter was 22 μm, and the spread parameter was 3.27. The breakup model of the droplet, the Taylor analogy breakup (TAB) model (used in numerical analysis), was applied to model the droplet decomposition process. The urea–water solution droplets were tracked using the Eulerian framework’s Lagrangian particle approach, and droplet and gas phase two-way coupling was considered [39].
Urea–water decomposition occurred in two steps. First, urea pyrolysis occurred, resulting in the decomposition of urea into HNCO and ammonia. The final step was hydrolysis, which produced ammonia and carbon dioxide. The equilibrium chemical reactions are expressed in the following equations [40]:
N H 2 2 C O + H 2 O 2 N H 3 + C O 2
N H 2 2 C O N H 3 + H N C O
H N C O + H 2 O N H 3 + C O 2
The global urea decomposition reaction is given by Equation (10), which is the sum of reactions (11) and (12). The reaction kinetic coefficients for the thermolysis of urea and the hydrolysis of HNCO on the catalyst and the kinetic model for thermal and catalytic decomposition are in Table 2 [31].

2.2.4. NOx Reduction Reaction Model

In an SCR system, ammonia from decomposition reacts with NO and NO2 from the exhaust gases. The three primary reactions are expressed in the following equations [25,41]:
4 N H 3 + 4 N O + O 2 4 N 2 + 6 H 2 O
2 N H 3 + N O + N O 2 2 N 2 + 3 H 2 O
8 N H 3 + 6 N O 2 7 N 2 + 12 H 2 O
NH3 primarily reacts with NO because the NOx emitted from diesel engines is mostly composed of NO, which typically accounts for more than 90% of the emissions [42]. Therefore, the three major reactions, represented by Equations (13)–(15), for the deNOx models in all cases (Cases 0–5) in this study were considered with the corresponding reaction kinetics [31,43], as shown in Table 3.

2.3. Boundary Conditions

Because marine diesel engines operate in a series of cycles, the engine exhaust gases are pulsating flows. However, in most numerical studies related to engine exhaust gas post-treatment devices, analyses are performed by assuming a steady or abnormal state, as in this study. It was difficult to find research in which CFD simulations were performed in consideration of the pulsating flow of the engine exhaust gases. Therefore, in this study, a steady-state analysis without consideration of pulsating flow was conducted by applying an engine exhaust gas flow rate (5412 kg/s) corresponding to 75% of the load of the previous study [31] to all cases. In all cases, the boundary conditions were set at the same initial values. The inlet velocity and temperature were 29.4 m/s and 592 K, respectively. The composition based on the mole fraction of the exhaust gases was H2O 0.152, O2 0.103, CO2 0.037, NO2 0.00006, NO 0.00054, and N2 0.7074. The outlet boundary condition was considered to be the pressure outlet under atmospheric conditions. For the wall, the same adiabatic and no-slip boundary conditions present in Case 0 [31] were considered for comparison between the conventional model and the redesigned model proposed in this study. The mean velocity gradient was steep and normal to the wall. To resolve the gradients, inflation-layer meshing was considered for the wall, because the cells of the computational grids needed to be smaller and normal to the wall rather than running along it [44].

3. Results and Discussion

3.1. The Velocity Distribution

The velocity contours are presented in Figure 5. There are rapid-velocity points in the DPF because of the six-stage configuration. In all cases, high velocities were observed at each stage because the staged configuration increased the uniformity of the flow. However, there were high velocities at the rear of the SCR, indicating that the flow was concentrated there. This flow concentration may increase NH3 slip and filter damage [38]. The outlet velocity was faster than the inlet velocity in the contour; however, only the velocity of the center of the outlet was fast, and the velocity of the rest of the center section was slow. Thus, the flow rates at the inlet and outlet were identical. In Case 2, we expected that the residence time in the system would be significantly increased in the mixing chamber because the length is doubled and the height is longer than that of Case 1 by 0.25 m. As the residence time increases, the number of chemical reactions during urea evaporation and decomposition increases [45]. The residence time in Case 3 increased because the wall was smaller than that of Case 2. Moreover, the height of the mixing chamber in Case 4 was greater than that of Case 3 by 0.25 m, so the residence time increased. In Cases 3 and 4, the rear of the catalyst was thicker than that of Case 2 and thus decreased NH3 slip because of the concentration of the flow. Therefore, the velocity at the back of the catalyst in Cases 3 and 4 was lower than that of Cases 1 and 2. The average temperatures of the entire numerical domain in Cases 1–4 were 589, 588, 587, and 587 K, respectively. Conditions wherein the exhaust gas contains water and the temperature is over 520 K make it is easy for urea to decompose [30]. These temperature differences (1–2 K) did not significantly affect the thermal decomposition of urea and NO reduction reactions. However, the urea decomposition and NO reduction reactions change significantly when the inlet temperature is changed [46]. In this study, the inlet temperature of gases and adiabatic conditions in the wall were kept constant for Cases 1–4. Therefore, changing the numerical domains of urea decomposition and NO reduction reactions could be more effective than temperature at improving flow.

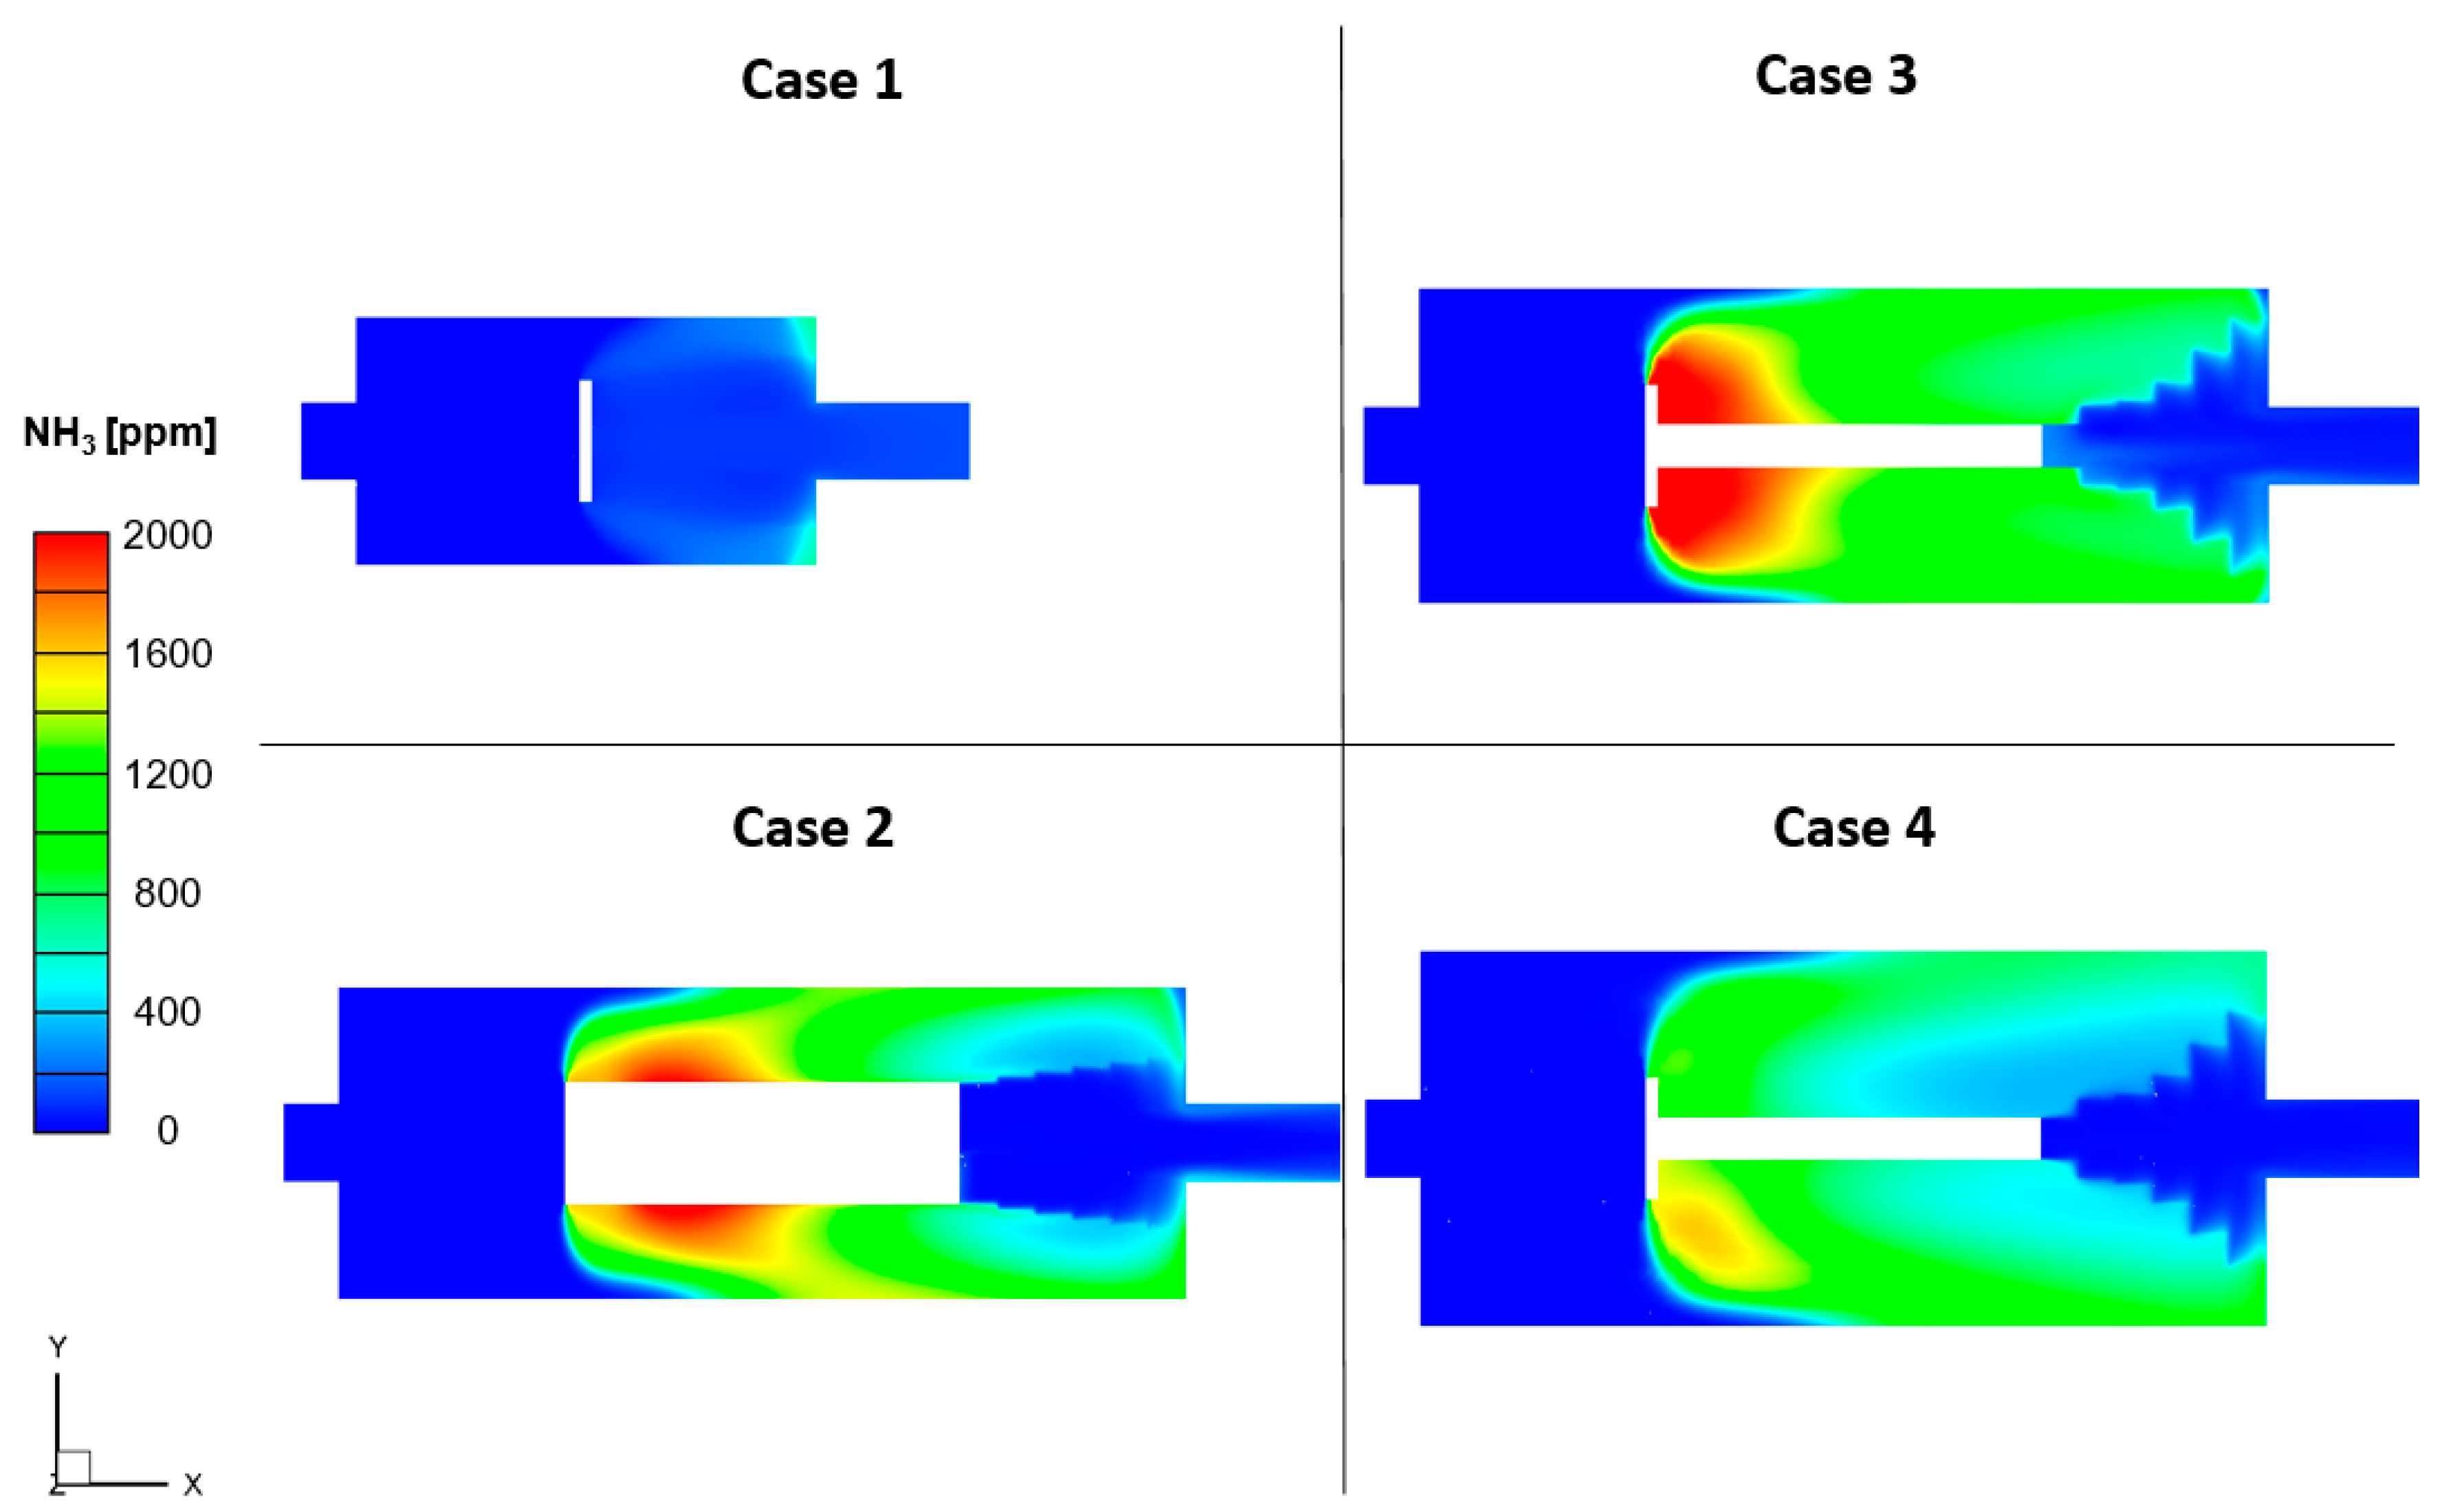
3.2. The NH3 Distribution

The NH3 contours are shown in Figure 6. In the NH3 contour of Case 1, the NH3 ppm value is the lowest because the chamber is shorter, resulting in a residence time that is insufficient to decompose urea [32]. In Case 2, the residence time increases because the size of the chamber increases and therefore the urea decomposition rate increases. In Case 3, urea decomposition increases because of the reduced wall size between the DPF and SCR. Therefore, the NH3 ppm value increased more than that of Case 2. In Case 4, the NH3 concentration was lower than that of Case 3 owing to the circular shape, which promoted flow uniformity. As the uniformity of the flow increased, the uniformity of the NH3 also increased. The volume of the chamber decreased when it had the same diameter as that of Case 3. Because Case 4 increased the height of the chamber by 0.25 m, the volume of Case 4 was greater than that of Case 3. This indicates that the urea decomposition rate increased in Case 4.

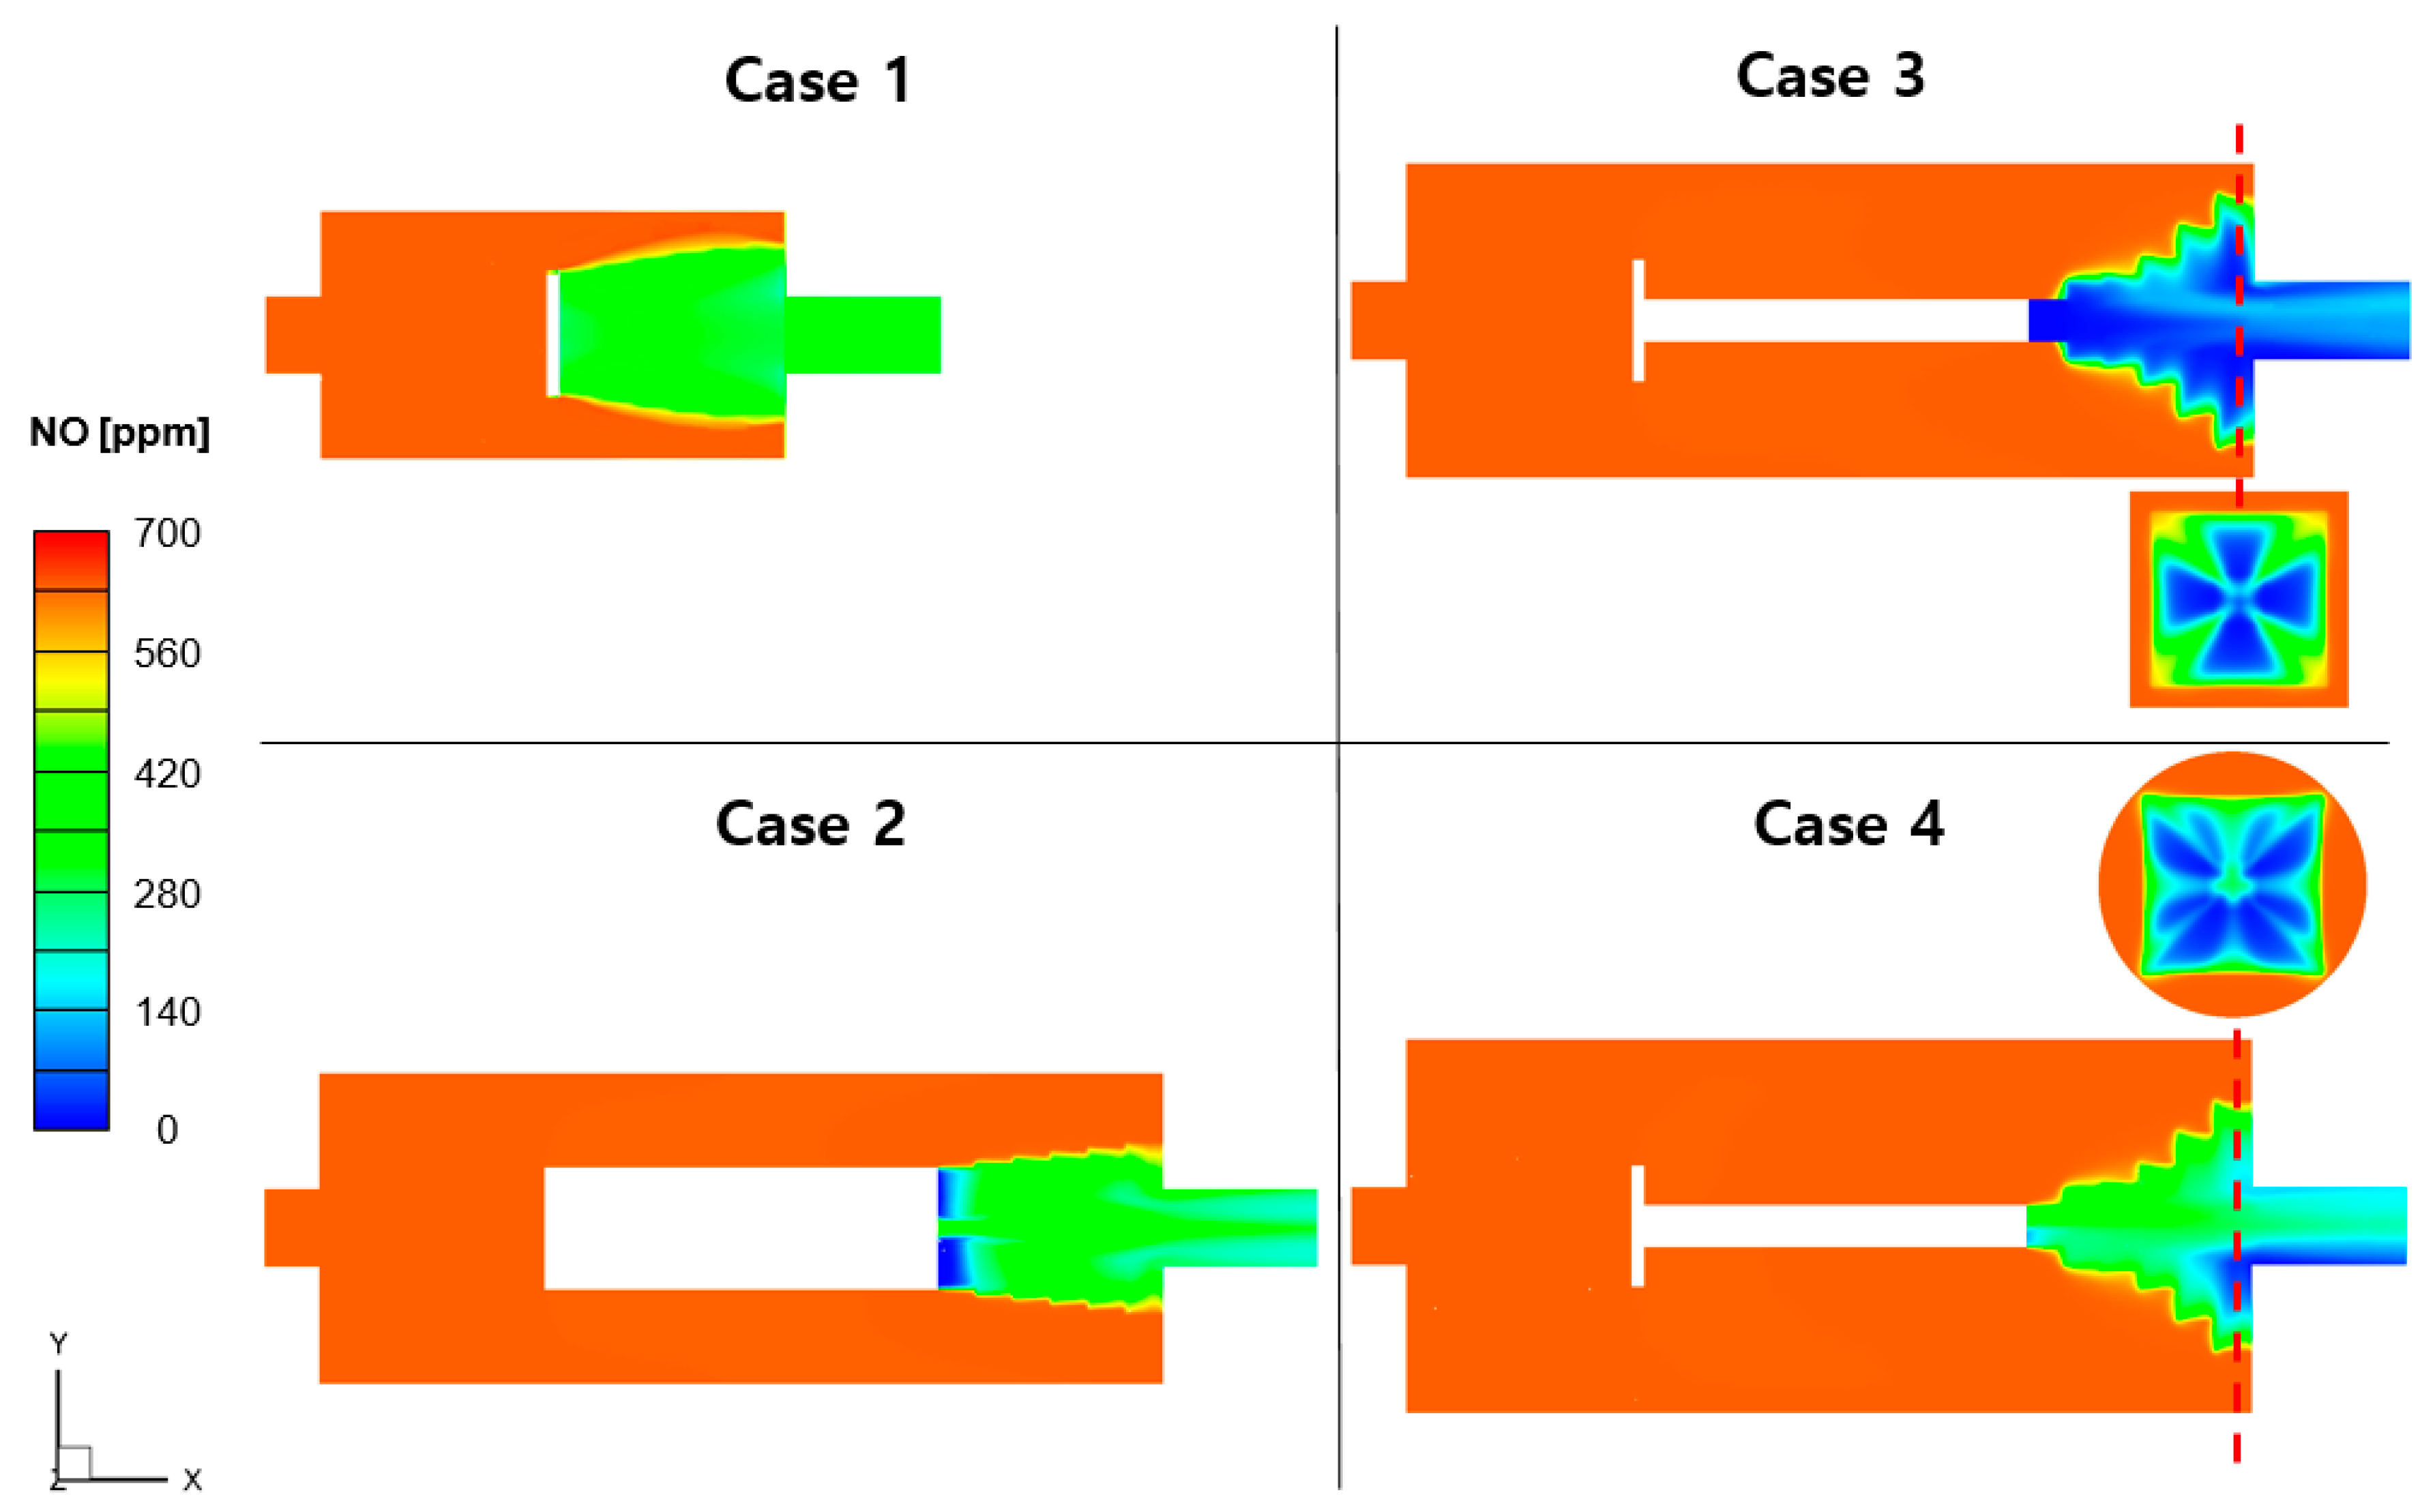
3.3. The NO Distribution

Figure 7 shows the NO distribution in the vertical section. Case 1 experiences a high NO concentration at the outlet owing to the low conversion rate of NH3 in the catalyst. In Case 2, the NH3 concentration increases and the NO concentration decreases at the outlet. As mentioned in relation to the velocity contour shown in Figure 5, the flow is concentrated at the rear of the SCR. Therefore, the NO reduction reaction in the SCR was enhanced by increasing the thickness of the catalyst in Case 3. Choi et al. [47] showed that the NO reduction rate increases with increasing flow uniformity. In Case 3, as shown in Figure 7, the NO reduction reactions in the SCR at the corner are reduced because the generated NH3 flows to the center of the mixing chamber. Therefore, the NO concentration at the corner is higher than that at the center. Because Case 4’s circular chamber design improves flow uniformity, the YZ plane contour has a lower concentration than that of Case 3 at the rear contour in the SCR.

3.4. Performance Comparison

To compare the performance of the four simulation cases with that of the conventional system, the NO reduction rate, NH3 slip rate, outlet HNCO concentration, and pressure drop were expressed. The NO reduction and NH3 slip rates were calculated using the following equations:
N O   r e d u c t i o n   r a t e % = 1 N O o u t N O i n × 100
N H 3   s l i p   r a t e % = N H 3 , o u t N H 3 , i n × 100
Figure 8 shows the calculated results for the NO reduction rate, ammonia slip rate, HNCO concentration, and pressure drop for Cases 0–4. (1). The NO reduction rates of Cases 0–5 were 91.7, 52.1, 59.1, 77.5, and 84.8%, respectively. When changing from Case 0 (the conventional SCR system) to Case 1 (Figure 3), the chamber length is shortened by 75%; the NO reduction rate in Case 1 is 52.1%, which is 39.6% lower than that of Case 0 (91.7% NO reduction rate), as shown in Figure 8a. In addition, as shown in Figure 8b,c, the HNCO concentration in Case 1 increased by approximately 300 ppm compared with that of Case 0, and the NH3 slip rate decreased owing to the reduced urea decomposition reaction rate. To increase the NH3 conversion rate, the chamber length must be increased, which means that the residence time for the conversion of urea to ammonia must also be increased, as reported in a previous study [47]. Therefore, in Case 2, wherein the length and size of the chamber are increased compared to those of Case 1, the HNCO concentration at the system outlet is half that of Case 1. However, the NH3 slip rate increases because the catalyst is too thin to react with NH3. This means that the generated exhaust gas containing NH3 does not flow onto the entire inlet surface of the SCR but only into the rear; thus, the NO reduction rate remains at approximately 60%. To solve this problem, in Case 3, the area of the rear section of the SCR where the flow was concentrated was increased to improve NO reduction performance by approximately 78%.
Because the NO reduction performance of Case 3 was still more than 14.2% lower than that of Case 0, Case 4 enabled an additional improvement. In Case 4, the chamber shape was changed from square to circular so as to improve the conversion of urea to ammonia. This can increase the uniformity of the flow by reducing the stagnation point (dead zone) of the flow that can occur in square or octagonal chambers [48]. Case 4 had a slightly higher NO reduction rate (84.8%) than Case 3 (77.5%); however, the corresponding result was 6.9% lower than that of Case 0 (91.7%). Nonetheless, Case 4 exhibited a slightly lower value (746 Pa) than Case 0 (794 Pa). As Case 0 was equipped with only an SCR system, Case 4, in which a DPF with a filter of the same specifications as the SCR is added, implies that the pressure drop performance is reduced by 50% in comparison with Case 0. Consequently, Case 4, as proposed in this study, offers the advantage of simultaneously reducing both pressure drop and system length by 50%. Choi et al. [47] investigated the effect of the length of the mixing chamber and the connecting pipe between the mixing chamber and SCR without a DPF on NOx reduction efficiency to propose design guidelines. They found that reducing the chamber and pipe by 30 and 80%, respectively, enabled a reduction in the overall length amounting to 55% compared to the reference case without the mixer and mixing chamber, thus maintaining deNOx efficiency. When applying Case 4 in this study, the length of the SCR system with the DPF could be reduced by 50% while achieving a NO reduction rate of 84.8%, with the additional advantage of decreasing the pressure drop by 50%.
However, Case 4 still exhibited 6.9% lower NO reduction performance than Case 0. This can be improved by incorporating a mixer between the DPF and SCR in Case 4. The outlet HNCO concentration in Case 4 was 78 ppm higher than that of Case 0 because of the insufficient space (and thus insufficient residence time) for the complete conversion of urea to ammonia. This increased the outlet HNCO concentration and affected the NO reduction rate. In addition, a previous study [35] reported that increasing the HNCO concentration led to less conversion to NH3 products, which directly affected NO emission reduction performance. Other studies have found ways to reduce the NH3 slip rate, such as installing mixers or perforated pipes/plates and increasing chamber height [49,50,51,52]. Applying methods from previous studies to this system reduced the HNCO concentration and increased the NO reduction rate; further related studies are required to fully investigate this.

4. Conclusions

Currently, small ships under 130 kW are excluded from IMO regulations; however, as regulations are tightened, it is expected that they will be extended to also apply to small ships. Such ships have only a narrow space for the installation of emissions aftertreatment systems. If an aftertreatment system is successfully installed, it may negatively affect engine output (i.e., reducing it) owing to increased pressure drop. Therefore, in this study, we proposed a method for reducing the pressure drop and overall length of DPF and SCR systems slated for application on small ships, compared the obtained performance with the existing conventional SCR system, and redesigned the compact system by applying multi-directional rather than unidirectional flow. The following conclusions were drawn:
(1)
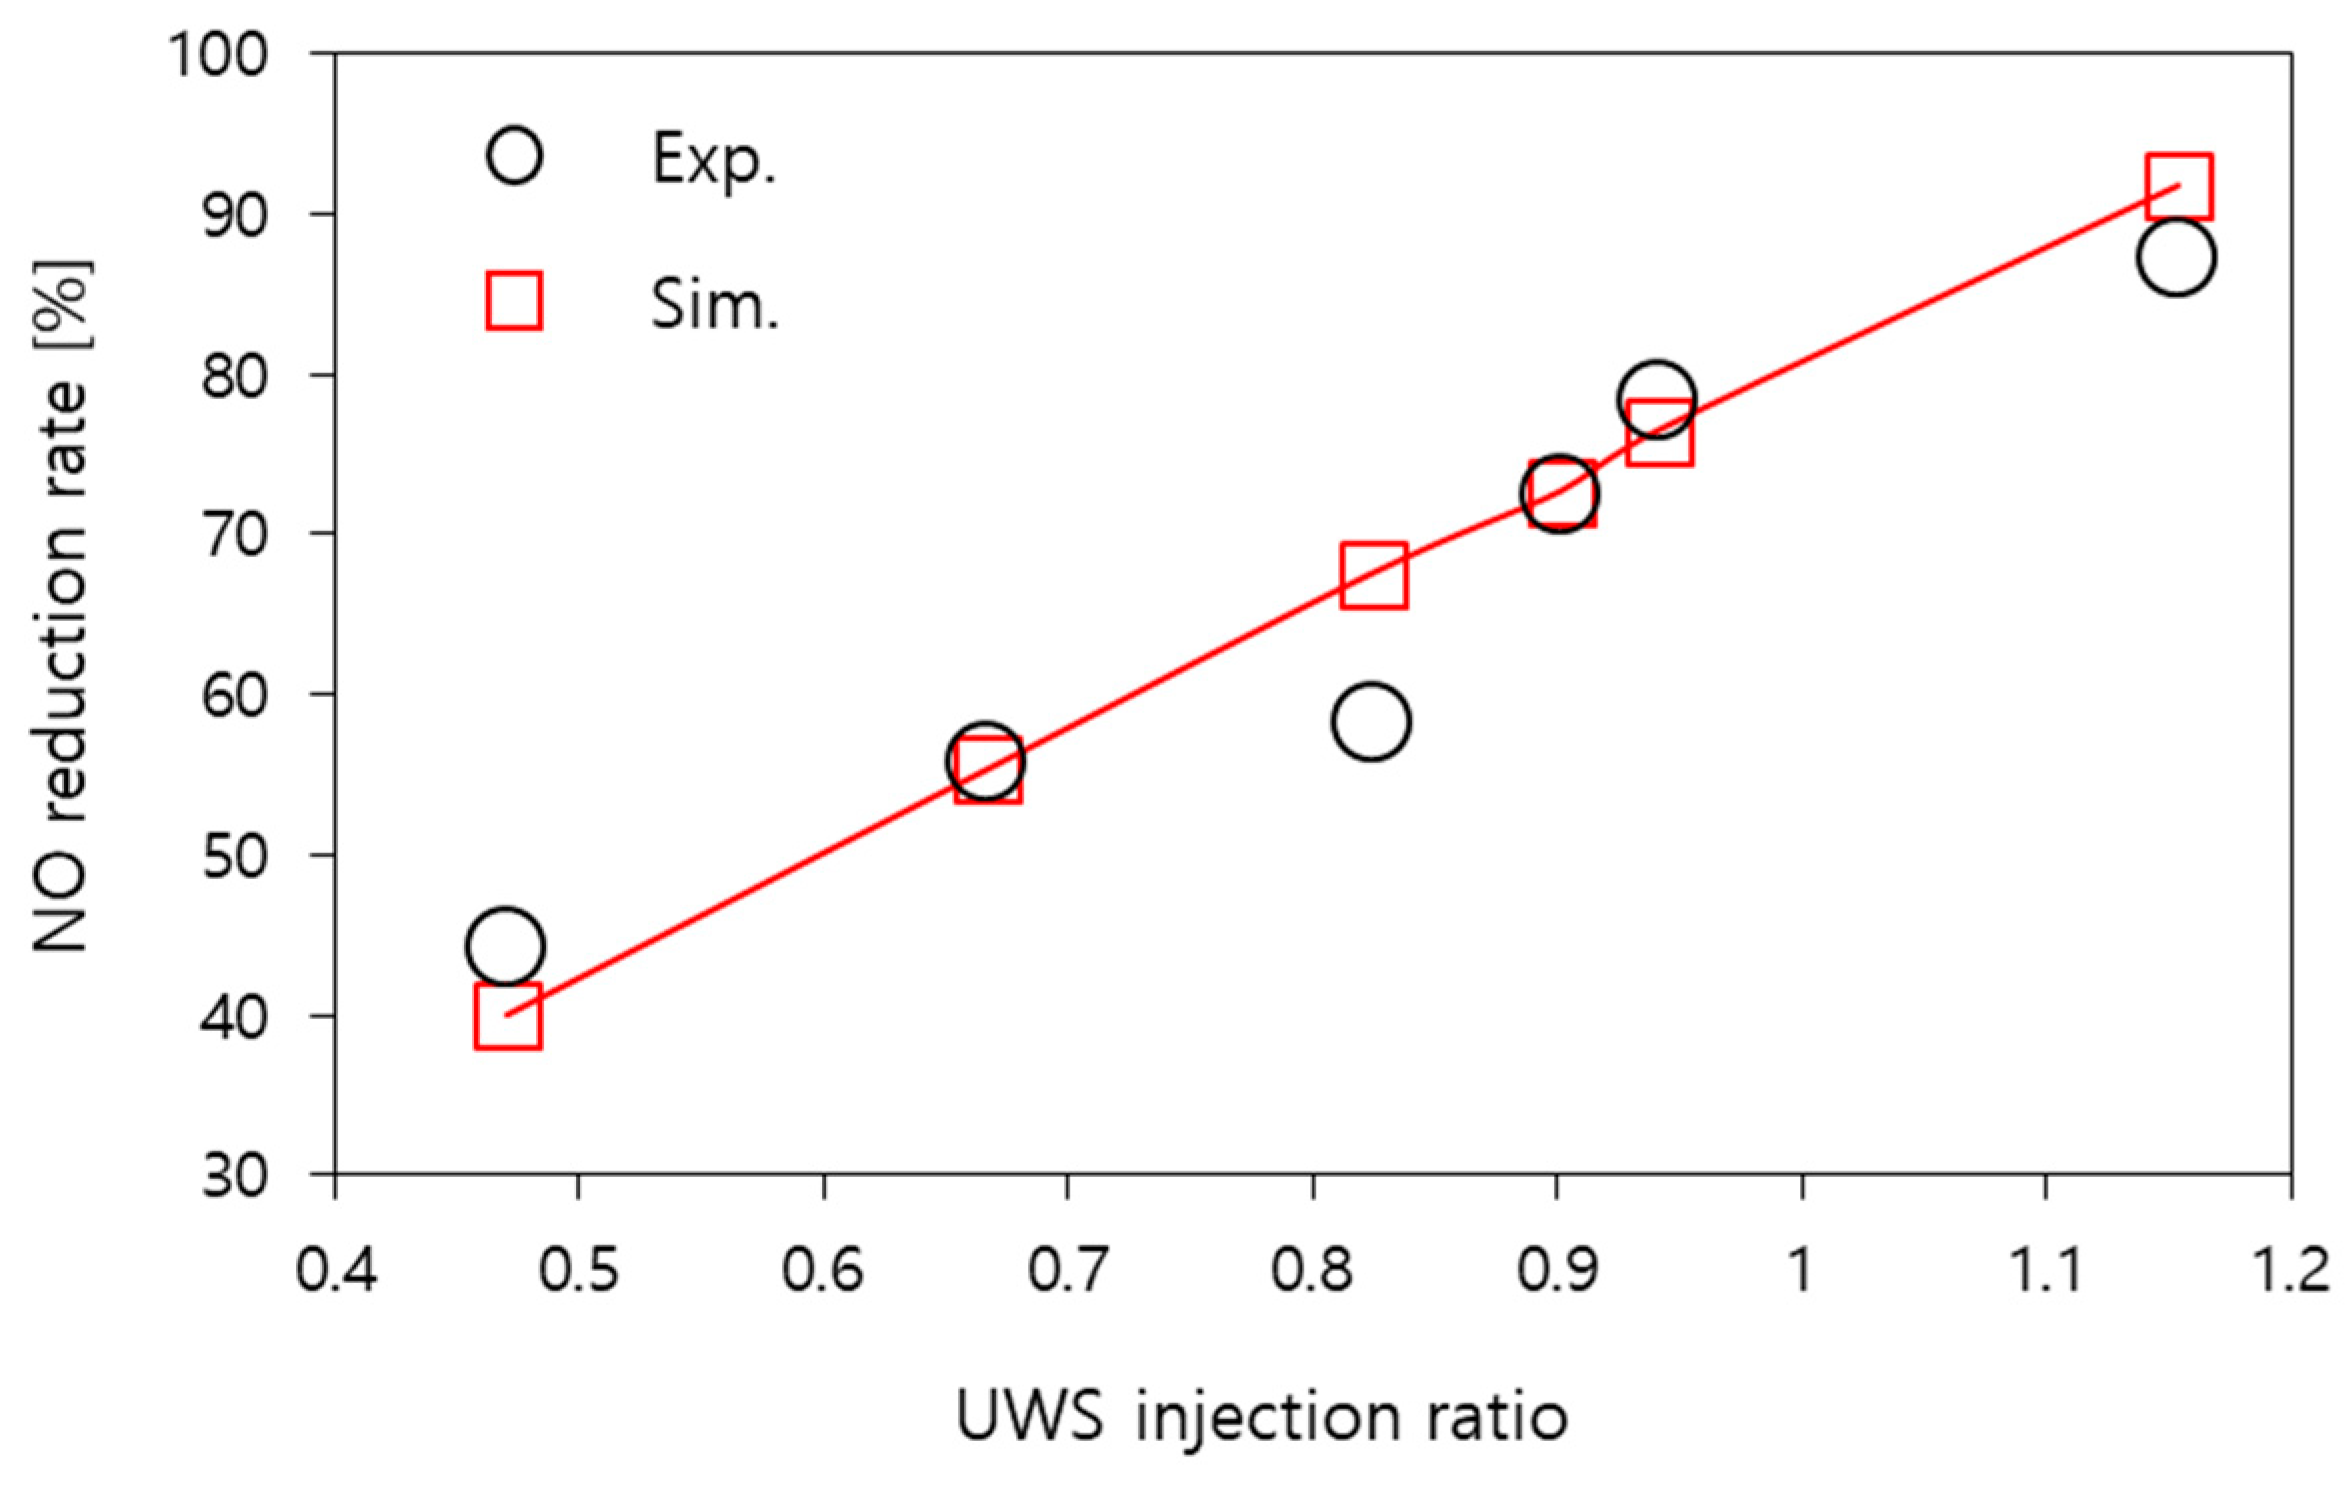
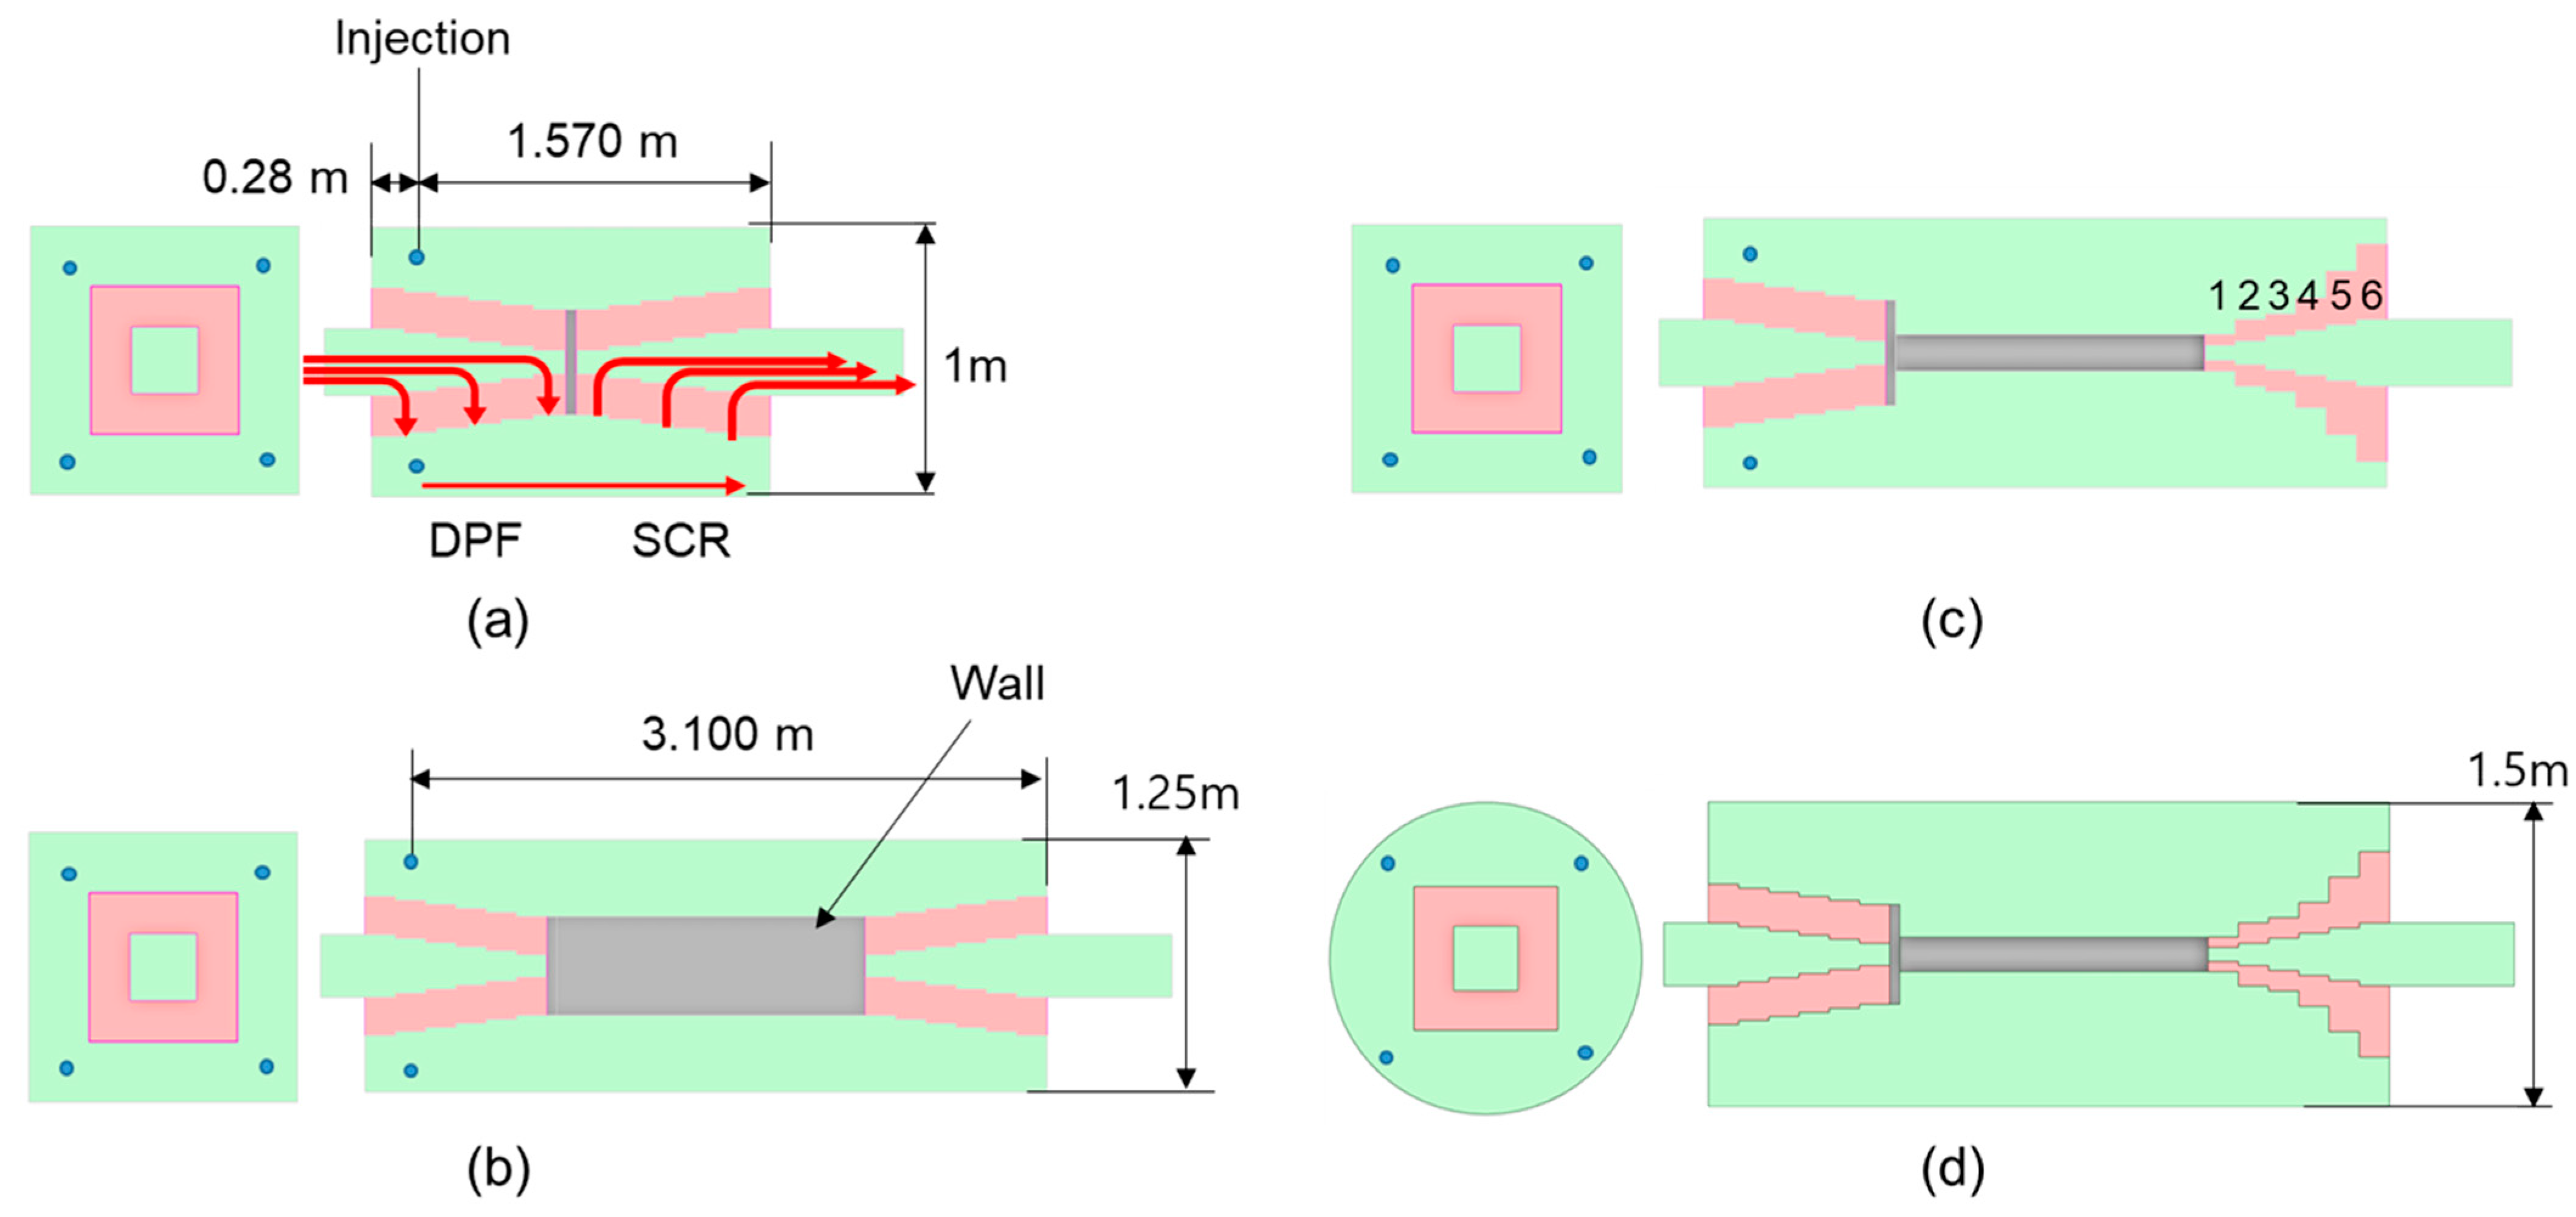
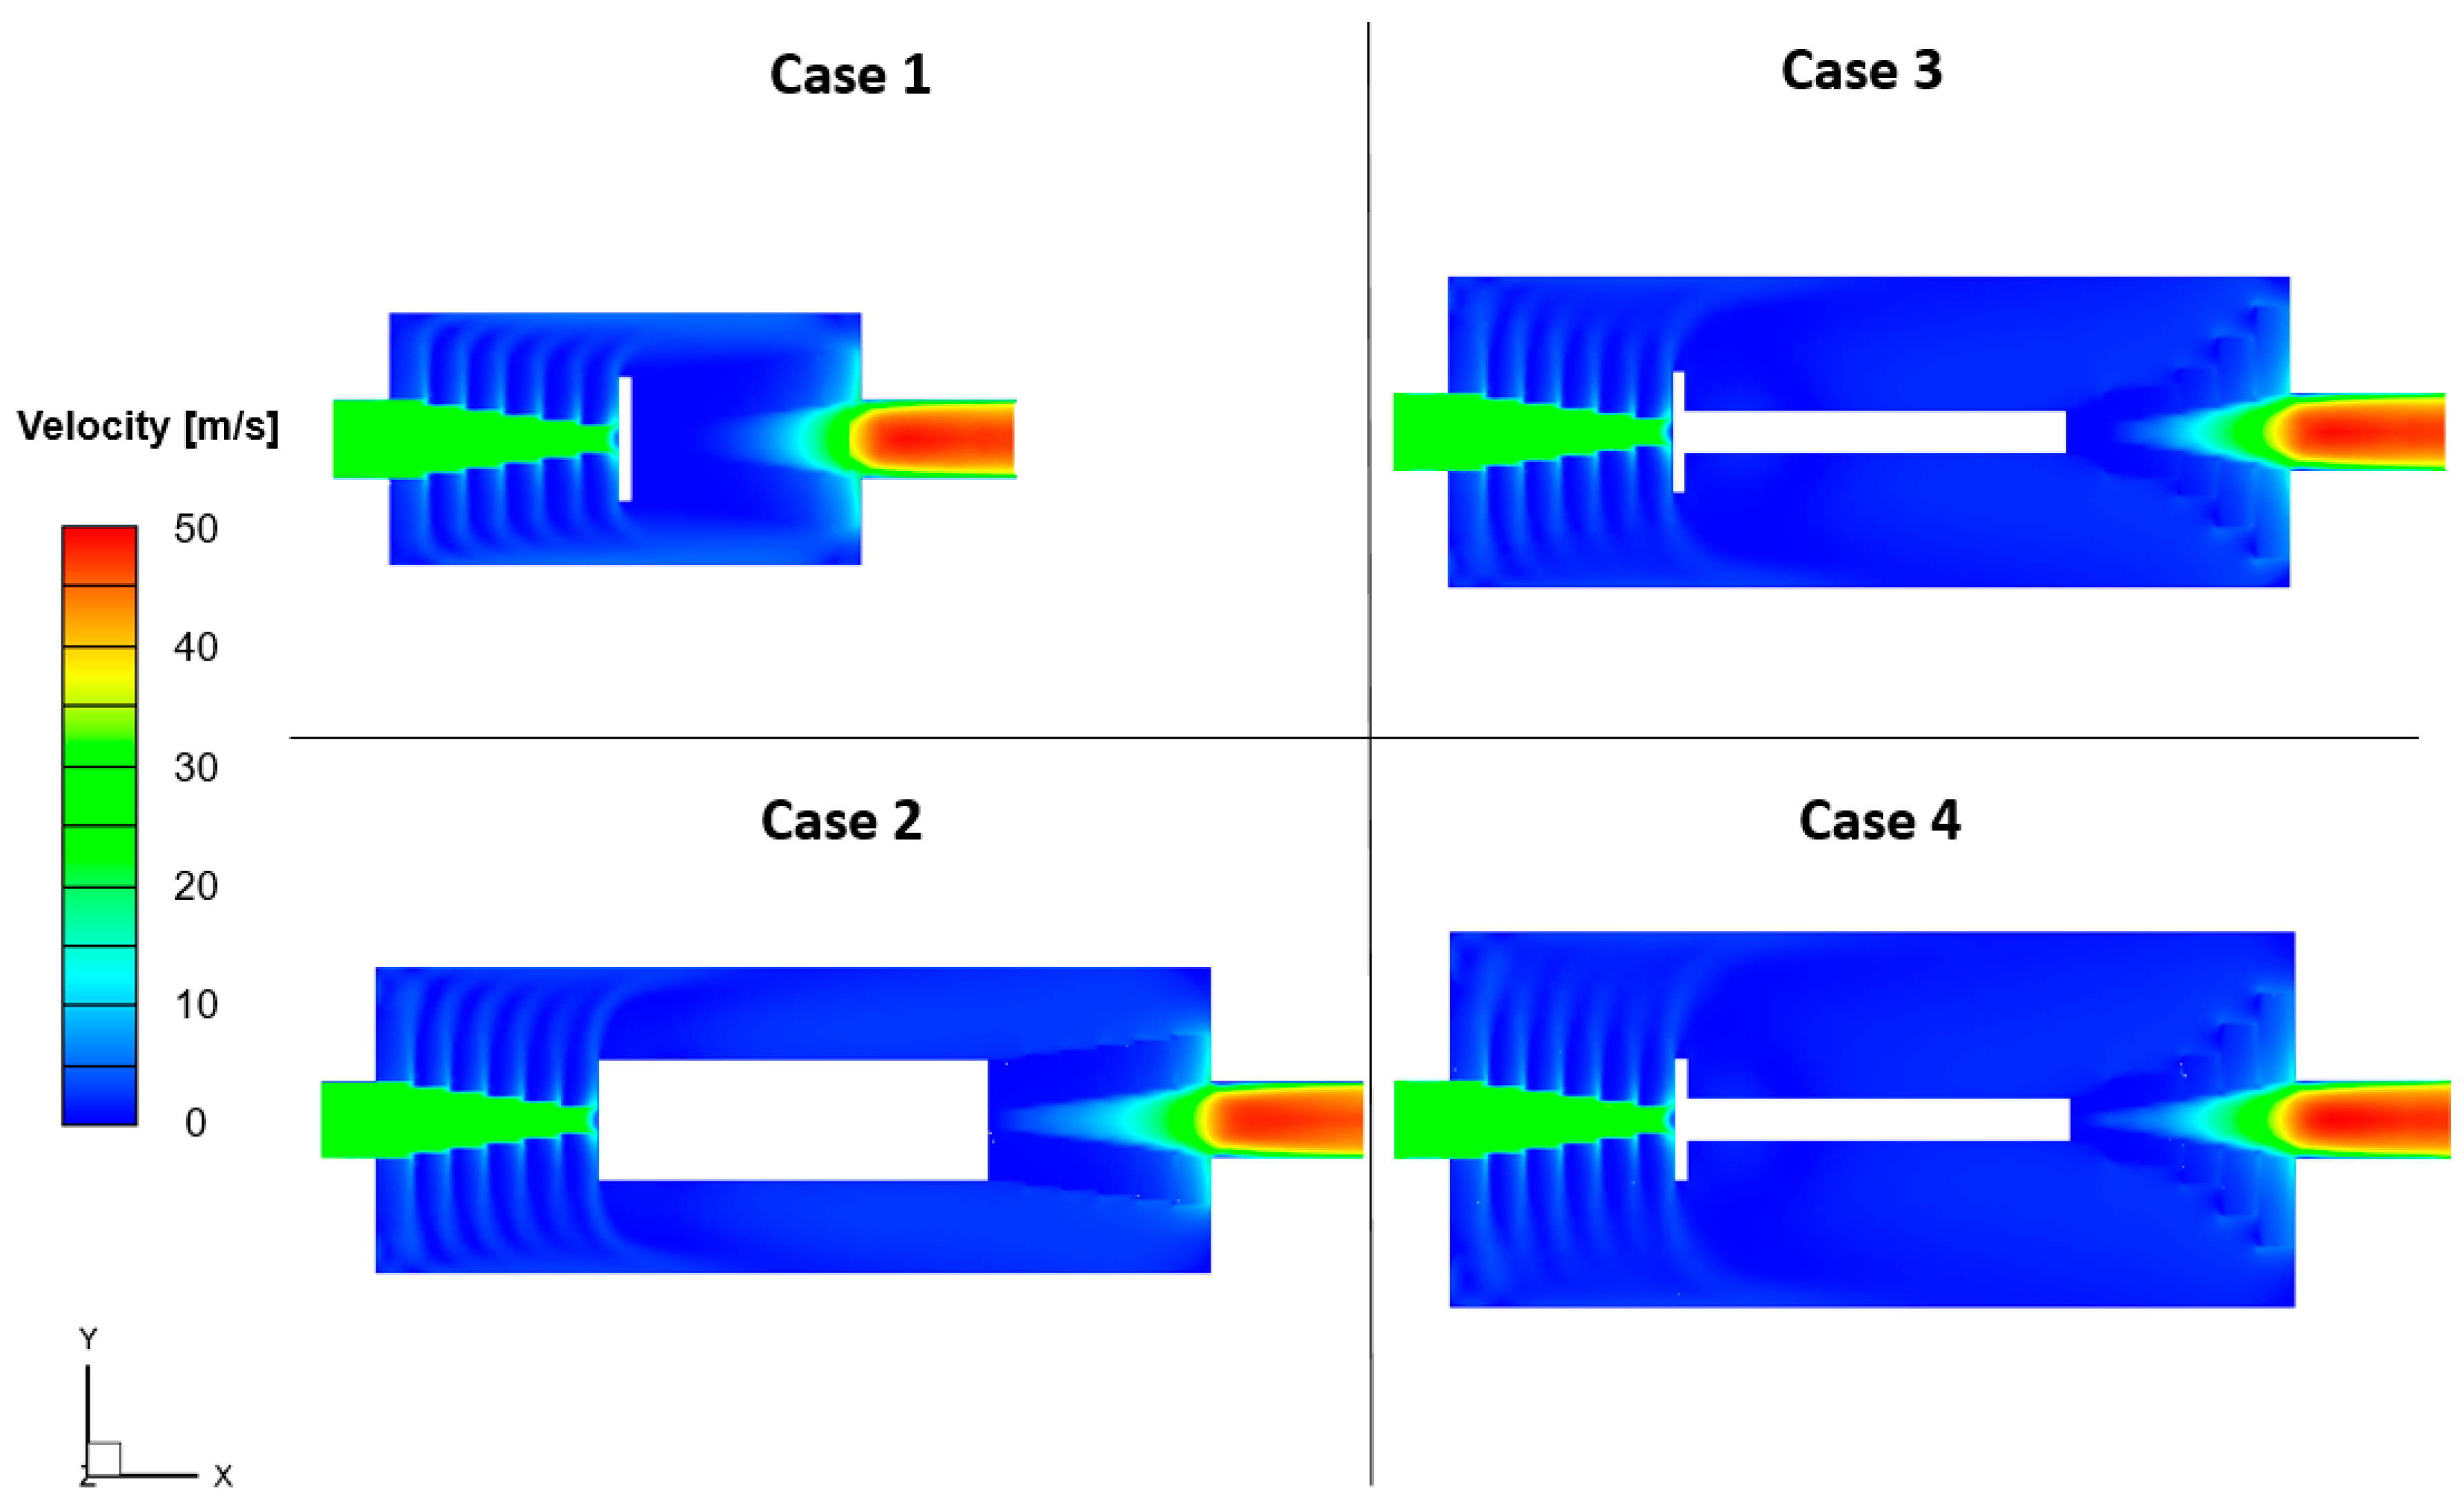
The NO reduction rates of Cases 0–5 were 91.7, 52.1, 59.1, 77.5, and 84.8%, respectively. Compared to the conventional SCR system (Case 0), when the flow of the SCR system with an added DPF was changed from unidirectional to multidirectional and the overall length of the system was reduced by 1/3 (Case 1), the NO reduction rate was 39.6% lower than that of the conventional system. This is because the length of the mixing chamber through which the exhaust gas flows from the DPF to the SCR is too short to enable the sufficient completion of the NH3 conversion reaction.
(2)
To increase the NH3 conversion rate, the length of the mixing chamber was increased (Case 2). If the length of the system is reduced by half compared with that of the conventional model, the NO reduction rate increases to approximately 60%, which is still lower than that of the conventional system owing to the larger residence time in the conventional system. In Cases 1 and 2, the SCR filter comprised six stages of equal thickness but encountered a problem wherein most of the flow of exhaust gas leaving the DPF was concentrated in the last stage of the SCR filter.
(3)
To solve the problem of flow concentration in the last stage of the SCR, the thickness of the SCR filters was sequentially increased from the first stage (1) to the last stage (6) to increase the area at the rear of the SCR (Case 3). Consequently, the NO reduction performance was improved compared to that of the level of the conventional system. This represented an increase of approximately 80%.
(4)
When the shape of the mixing chamber was changed from square to circular to further increase the NO reduction rate (Case 4), the NO reduction performance increased by approximately 84.5%, while a pressure drop performance similar to that of the conventional model was achieved. Case 0 was equipped with only the SCR system, whereas Case 4 included a DPF with the same specifications as the SCR. Therefore, the pressure drop performance was reduced by 50% compared with that of the conventional system. As a result, the final redesigned model (Case 4) proposed in this study is expected to reduce the pressure drop by 50% compared with the conventional model while also reducing the length of the overall system by 50%, resulting in a suitably compact solution for application on small ships.

Author Contributions

Conceptualization, S.N.; methodology, H.J.; software, W.C.; validation, D.S.; formal analysis, S.C.; investigation, S.N.; resources, H.J.; data curation, S.C.; writing—original draft preparation, W.C.; writing—review and editing, Y.S.; visualization, D.S.; supervision, Y.S.; project administration, Y.S.; funding acquisition, Y.S. All authors have read and agreed to the published version of the manuscript.

Funding

The following are the results of a study on the “Leaders in Industry-university cooperation 3.0” Project supported by the Ministry of Education and National Research Foundation of Korea.

Data Availability Statement

No new data were created or analyzed in this study. Data sharing is not applicable to this article.

Conflicts of Interest

The authors declare no conflicts of interest.

References

  1. Ni, P.; Wang, X.; Li, H. A review of regulations, current status, effects and reduction strategies of emissions for marine diesel engines. Fuel 2020, 279, 118477. [Google Scholar] [CrossRef]
  2. Jung, Y.; Pyo, Y.; Jang, J.; Woo, Y.; Ko, A.; Kim, G.; Shin, Y.; Cho, C. Nitrous oxide in diesel aftertreatment systems including DOC, DPF and urea-SCR. Fuel 2022, 310, 122453. [Google Scholar] [CrossRef]
  3. Viana, M.; Hammingh, P.; Colette, A.; Querol, X.; Degraeuwe, B.; de Vlieger, I.; van Aardenne, J. Impact of maritime transport emissions on coastal air quality in Europe. Atmos. Environ. 2014, 90, 96–105. [Google Scholar] [CrossRef]
  4. Deng, J.; Wang, X.; Wei, Z.; Wang, L.; Wang, C.; Chen, Z. A review of NOx and SOx emission reduction technologies for marine diesel engines and the potential evaluation of liquefied natural gas fuelled vessels. Sci. Total Environ. 2021, 766, 144319. [Google Scholar] [CrossRef]
  5. Kim, A.R.; Seo, Y.J. The reduction in SOx emissions in the shipping industry: The case of Korean companies. Mar. Pol. 2019, 100, 98–106. [Google Scholar] [CrossRef]
  6. Zhang, Q.; Wan, Z.; Hemmings, B.; Abbasov, F. Reducing black carbon emissions from Arctic shipping: Solutions and policy implications. J. Clean. Prod. 2019, 241, 118261. [Google Scholar] [CrossRef]
  7. Jeevahan, J.; Mageshwaran, G.; Joseph, G.B.; Raj, R.B.D.; Kannan, R.T. Various strategies for reducing NOx emissions of biodiesel fuel used in conventional diesel engines: A review. Chem. Eng. Commun. 2017, 204, 1202–1223. [Google Scholar] [CrossRef]
  8. Wang, X.; Gao, J.; Chen, H.; Chen, Z.; Zhang, P.; Chen, Z. Diesel/methanol dual-fuel combustion: An assessment of soot nanostructure and oxidation reactivity. Fuel Process. Technol. 2022, 237, 107464. [Google Scholar] [CrossRef]
  9. Chen, Z.; Li, K.; Liu, J.; Wang, X.; Jiang, S.; Zhang, C. Optimal design of glucose solution emulsified diesel and its effects on the performance and emissions of a diesel engine. Fuel 2015, 157, 9–15. [Google Scholar] [CrossRef]
  10. Chen, Z.; Wang, L.; Wei, Z.; Wang, Y.; Deng, J. Effect of components on the emulsification characteristics of glucose solution emulsified heavy fuel oil. Energy 2022, 244, 123147. [Google Scholar] [CrossRef]
  11. Wang, X.; Gao, J.; Chen, Z.; Chen, H.; Zhao, Y.; Huang, Y.; Chen, Z. Evaluation of hydrous ethanol as a fuel for internal combustion engines: A review. Renew. Energy 2022, 194, 504–525. [Google Scholar] [CrossRef]
  12. Jiaqiang, E.; Zhang, Z.; Chen, J.; Pham, M.; Zhao, X.; Peng, Q.; Yin, Z. Performance and emission evaluation of a marine diesel engine fueled by water biodiesel-diesel emulsion blends with a fuel additive of a cerium oxide nanoparticle. Energy Convers. Manag. 2018, 169, 194–205. [Google Scholar]
  13. Chybowski, L.; Laskowski, R.; Gawdzińska, K. An overview of systems supplying water into the combustion chamber of diesel engines to decrease the amount of nitrogen oxides in exhaust gas. J. Mar. Sci. Technol. 2015, 20, 393–405. [Google Scholar] [CrossRef]
  14. Larbi, N.; Bessrour, J. Measurement and simulation of pollutant emissions from marine diesel combustion engine and their reduction by water injection. Adv. Mech. Eng. 2010, 41, 898–906. [Google Scholar] [CrossRef]
  15. Sarvi, A.; Kilpinen, P.; Zevenhoven, R. Emissions from large-scale medium-speed diesel engines: 3. Influence of direct water injection and common rail. Fuel Process. Technol. 2009, 90, 222–231. [Google Scholar] [CrossRef]
  16. Larbi, N.; Bessrour, J. Measurement and simulation of pollutant emissions from marine diesel combustion engine and their reduction by exhaust gas recirculation. J. Mech. Sci. Technol. 2008, 22, 2263–2273. [Google Scholar] [CrossRef]
  17. Wang, Z.; Zhou, S.; Feng, Y.; Zhu, Y. Research of NOx Reduction on a Low-Speed Two-Stroke Marine Diesel Engine by Using EGR (Exhaust Gas Recirculation)–CB (Cylinder Bypass) and EGB (Exhaust Gas Bypass). Int. J. Hydrogen Energy 2017, 42, 19337–19345. [Google Scholar] [CrossRef]
  18. Thangaraja, J.; Kannan, C. Effect of exhaust gas recirculation on advanced diesel combustion and alternate fuels—A review. Appl. Energy 2016, 180, 169–184. [Google Scholar] [CrossRef]
  19. Choi, C.; Sung, Y.; Choi, G.M.; Kim, D.J. Numerical analysis of urea decomposition with static mixers in marine SCR system. J. Clean Energy Technol. 2015, 3, 39–42. [Google Scholar] [CrossRef]
  20. Gao, C.; Wang, Y.; Li, X.; Wang, S.; Ma, C.; Wang, X. Catalytic effect of diesel PM derived ash on PM oxidation activity. Chemosphere 2022, 299, 134445. [Google Scholar] [CrossRef]
  21. Gao, J.; Wang, Y.; Wang, S.; Li, X.; Chang, X.; Wang, X.; Yang, C.; Xuan, R. Effect of catalytic reactions on soot feature evolutions in oxidation process. Chem. Eng. J. 2022, 443, 136392. [Google Scholar] [CrossRef]
  22. Caiazzo, G.; Langella, G.; Miccio, F.; Scala, F. An experimental investigation on seawater SO2 scrubbing for marine application. Environ. Progress Sustain. Energy 2013, 32, 1179–1186. [Google Scholar] [CrossRef]
  23. Kuang, M.; Hu, X.; Yang, G.; Wang, J.; Yuan, G.; Tao, C.; Wu, S.; Ding, J.; Meng, X. Seawater/alkaline liquid cascade-scrubbing desulfurization performance for the exhaust gas of a 162-kW marine diesel engine. Asia-Pac. J. Chem. Eng. 2019, 14, e2370. [Google Scholar] [CrossRef]
  24. Zhu, Y.; Xia, C.; Shreka, M.; Wang, Z.; Yuan, L.; Zhou, S.; Feng, Y.; Hou, Q.; Ahmed, S.A. Combustion and Emission Characteristics for a Marine Low-speed Diesel Engine with High-pressure SCR System. Environ. Sci. Pollut. Res. 2020, 27, 12851–12865. [Google Scholar] [CrossRef]
  25. Kamil, M.S.; Muslim, M.; Saat, A.M. Effective control of SOx and NOx release to the atmosphere from emissions of ship propulsion engines. In Advancement in Emerging Technologies and Engineering Applications; Springer: Berlin/Heidelberg, Germany, 2020; pp. 91–100. [Google Scholar]
  26. Johansson, L.; Ytreberg, E.; Jalkanen, J.-P.; Fridell, E.; Eriksson, K.M.; Lagerström, M.; Maljutenko, I.; Raudsepp, U.; Fischer, V.; Roth, E. Model for leisure boat activities and emissions—Implementation for the Baltic Sea. Ocean. Sci. 2020, 16, 1143–1163. [Google Scholar] [CrossRef]
  27. Carreño, A.; Lloret, J. Environmental impacts of increasing leisure boating activity in Mediterranean coastal waters. Ocean Coast. Manag. 2021, 209, 105693. [Google Scholar] [CrossRef]
  28. Feng, S.; Li, Z.; Shen, B.; Yuan, P.; Ma, J.; Wang, Z.; Kong, W. An overview of the deactivation mechanism and modification methods of the SCR catalysts for denitration from marine engine exhaust. J. Environ. Manag. 2022, 317, 115457. [Google Scholar] [CrossRef]
  29. Lu, D.; Theotokatos, G.; Zhang, J.; Tang, Y.; Gan, H.; Liu, Q.; Ren, T. Numerical investigation of the high pressure selective catalytic reduction system impact on marine two-stroke diesel engines. Int. J. Nav. Arch. Ocean 2021, 13, 659–673. [Google Scholar] [CrossRef]
  30. Zhu, Y.; Li, T.; Xia, C.; Feng, Y.; Zhou, S. Simulation analysis on vaporizer/mixer performance of the high-pressure SCR system in a marine diesel. Chem. Eng. Process.-Process Intensif. 2020, 148, 107819. [Google Scholar] [CrossRef]
  31. Sung, Y.; Choi, M.; Park, T.; Choi, C.; Park, Y.; Choi, G. Synergistic effect of mixer and mixing chamber on flow mixing and NOx reduction in a marine urea-SCR system. Chem. Eng. Process.-Process Intensif. 2020, 150, 107888. [Google Scholar] [CrossRef]
  32. Um, H.S.; Kim, D.; Kim, K.H. Numerical study on the design of urea decomposition chamber in LP SCR system. Int. J. Nav. Archit. Ocean Eng. 2019, 11, 307–313. [Google Scholar] [CrossRef]
  33. Wardana, M.K.A.; Lim, O. Investigation of ammonia homogenization and NOx reduction quantity by remodeling urea injector shapes in heavy-duty diesel engines. Appl. Energy 2022, 323, 119586. [Google Scholar] [CrossRef]
  34. Liu, X.; Yan, F.; Zheng, S.; Liao, J.; Cai, Z.; Hu, J. Spray strategy and mixer optimization in Urea-SCR system based on frozen flow modeling. Chem. Eng. Process. Process Intensif. 2022, 172, 108810. [Google Scholar] [CrossRef]
  35. Bayramoğlu, K.; Özmen, G. Design and performance evaluation of low-speed marine diesel engine selective catalytic reduction system. Process Saf. Environ. Prot. 2021, 155, 184–196. [Google Scholar] [CrossRef]
  36. Guan, B.; Zhan, R.; Lin, H.; Huang, Z. Review of state of the art technologies of selective catalytic reduction of NOx from diesel engine exhaust. Appl. Therm. Eng. 2014, 66, 395–414. [Google Scholar] [CrossRef]
  37. Lamas, M.; Rodriguez, C. Numerical model to analyze NOx reduction by ammonia injection in diesel-hydrogen engines. Int. J. Hydrogen Energy 2017, 42, 26132–26141. [Google Scholar] [CrossRef]
  38. Park, T.; Sung, Y.; Kim, T.; Lee, I.; Choi, G.; Kim, D. Effect of static mixer geometry on flow mixing and pressure drop in marine SCR applications. Int. J. Nav. Archit. Ocean Eng. 2014, 6, 27–38. [Google Scholar] [CrossRef]
  39. Ye, J.; Tan, G.; He, Z.; Alex, F.J.; Peng, D.; Zhang, Z. Optimization of the Urea SCR injector based on entropy generation minimization and entransy dissipation extremum. Int. J. Heat Mass Transf. 2023, 205, 123935. [Google Scholar] [CrossRef]
  40. Mehdi, G.; Zhou, S.; Zhu, Y.; Shah, A.H.; Chand, K. Numerical investigation of SCR mixer design optimization for improved performance. Processes 2019, 7, 168. [Google Scholar] [CrossRef]
  41. Zhang, Q.; Fan, Y.; Li, W. Numerical simulation and experimental verification of chemical reactions for SCR DeNOx. Front. Chem. Eng. China 2010, 4, 523–528. [Google Scholar] [CrossRef]
  42. Chin, T.; Tam, I.; Yin, C.-Y. Wet scrubbing process with oxidation and reduction in series for removal of SO2 and NO from marine diesel engine exhaust. Chem. Eng. J. 2023, 464, 142299. [Google Scholar] [CrossRef]
  43. Olsson, L.; Sjovall, H.; Blint, R.J. A kinetic model for ammonia selective catalytic reduction over Cu-ZSM-5. Appl. Catal. B Environ. 2008, 81, 203–217. [Google Scholar] [CrossRef]
  44. Berni, F.; Fontanesi, S. A 3D-CFD methodology to investigate boundary layers and assess the applicability of wall functions in actual industrial problems: A focus on in-cylinder simulations. Appl. Thermal. Eng. 2020, 174, 115320. [Google Scholar] [CrossRef]
  45. Raju, R.; Chandran, J.; Salih, A.; Joseph, K. Numerical analysis of mixing chamber non-uniformities and feed conditions for optimal performance of urea SCR. React. Chem. Eng. 2020, 5, 2236–2249. [Google Scholar] [CrossRef]
  46. Zhong, C.; Tan, J.; Zuo, H.; Wu, X.; Wang, S.; Liu, J. Synergy effects analysis on CDPF regeneration performance enhancement and NOx concentration reduction of NH3–SCR over Cu–ZSM–5. Energy 2021, 230, 120814. [Google Scholar] [CrossRef]
  47. Choi, C.; Sung, Y.; Choi, G.M.; Kim, D.J. Numerical analysis of NOx reduction for compact design in marine urea-SCR system. Int. J. Nav. Archit. Ocean Eng. 2015, 7, 1020–1034. [Google Scholar] [CrossRef]
  48. Choi, W.; Lee, S.; Beak, S.; Lee, S.; Seo, J.; Shin, D.; Jeong, H.; Sung, Y. Numerical analysis of thermal and hydrodynamic characteristics in aquaculture tanks with different tank structures. Ocean Eng. 2023, 287, 115880. [Google Scholar] [CrossRef]
  49. Oh, J.; Lee, K. Spray characteristics of a urea solution injector and optimal mixer location to improve droplet uniformity and NOx conversion efficiency for selective catalytic reduction. Fuel 2014, 119, 90–97. [Google Scholar] [CrossRef]
  50. Fu, H.; Huang, Z.; Tang, C.; Zhang, P. Effect of mixer structure on liquid film formation and NOx conversion efficiency in selective catalytic reduction system. Fuel 2022, 330, 125405. [Google Scholar] [CrossRef]
  51. Chen, Y.; Lv, L. Design and evaluation of an Integrated SCR and exhaust Muffler from marine diesels. J. Mar. Sci. Technol. 2015, 20, 505–519. [Google Scholar] [CrossRef]
  52. Pang, Z.; Chen, R.; Cao, Y. Performance analysis and optimization for static mixer of SCR denitration system under different arrangements. Energies 2022, 15, 8977. [Google Scholar] [CrossRef]
Figure 1. Schematic diagrams of the conventional model (a), the redesigned model (b), and the filter configurations of DPF with flow directions for the redesigned model (c).
Energies 17 00187 g001
Figure 2. Comparison of the NO reduction rates between experiments and CFD simulations for the conventional model with different UWS injection ratios.
Energies 17 00187 g002
Figure 3. Vertical cross-sections for all cases: (a) Case 1, (b) Case 2, (c) Case 3, and (d) Case 4.
Energies 17 00187 g003
Figure 4. Mesh independence tests and generations for Case 1: (a) position of obtained line data, (b) velocity distributions, (c) NH3 distributions (d) 700,000 grids, (e) 1,000,000 grids, and (f) 1,300,000 grids.
Energies 17 00187 g004
Figure 5. Velocity contours on the vertical section.
Energies 17 00187 g005
Figure 6. NH3 contours on the vertical section.
Energies 17 00187 g006
Figure 7. NO contour on the vertical section.
Energies 17 00187 g007
Figure 8. Comparison of the performance of the simulation cases (Cases 1–4) with that of the conventional system (Case 0): (a) NO reduction rate, (b) NH3 slip rate, (c) outlet HNCO ppm, and (d) pressure drop.
Energies 17 00187 g008
Table 1. Computational domain dimensions for all cases with chamber size and shape and catalyst thickness.
Case No.Length (m)Height (m)Catalyst Thickness (mm)Mixing Chamber
Case 11.851190Square
Case 23.3801.25190Square
Case 33.3801.2550, 100, 100,
150, 250, 350
Square
Case 43.3801.550, 100, 100,
150, 250, 350
Circular
Table 2. Reaction kinetic coefficients of decomposition reaction.
ReactionThermal DecompositionCatalytic Decomposition
Pre-Exponential FactorActivation Energy
(J/kg·mol)
Pre-Exponential FactorActivation Energy
(J/kg·mol)
Thermolysis4.9 × 1032.3 × 1074.5 × 1032.26 × 107
Hydrolysis2.5 × 1056.22 × 1073.1 × 1041.58 × 107
Table 3. Reaction kinetic coefficients of SCR reaction.
ReactionPre-Exponential FactorActivation Energy
(J/kg·mol)
4 N H 3 + 4 N O + O 2 4 N 2 + 6 H 2 O 2.3 × 10884.9
2 N H 3 + N O + N O 2 2 N 2 + 3 H 2 O 1.9 × 101285.1
8 N H 3 + 6 N O 2 7 N 2 + 12 H 2 O 1.1 × 10772.3
Disclaimer/Publisher’s Note: The statements, opinions and data contained in all publications are solely those of the individual author(s) and contributor(s) and not of MDPI and/or the editor(s). MDPI and/or the editor(s) disclaim responsibility for any injury to people or property resulting from any ideas, methods, instructions or products referred to in the content.

